Article

Fabrication by Spin-Coating and Optical Characterization of Poly(styrene-co-acrylonitrile) Thin Films

1
Division of Materials Physics, Ruđer Bošković Institute, Bijenička 54, 10000 Zagreb, Croatia
2
Division of Organic Chemistry and Biochemistry, Ruđer Bošković Institute, Bijenička 54, 10000 Zagreb, Croatia
3
Surfaces, Interfaces and 2D Materials Research Group, Institute of Physics, Bijenička 46, 10000 Zagreb, Croatia
4
SOLVIS d.o.o, Vesne Parun 15, 42000 Varaždin, Croatia
*
Author to whom correspondence should be addressed.
Coatings 2021, 11(9), 1015; https://doi.org/10.3390/coatings11091015
Submission received: 22 July 2021 / Revised: 13 August 2021 / Accepted: 17 August 2021 / Published: 24 August 2021

Abstract

:
The optical characteristics of poly(styrene-co-acrylonitrile) thin films obtained by spin-coating of polymer blend in tetrahydrofuran were investigated by spectroscopic ellipsometry, spectrophotometry, and atomic force microscopy. Film thickness can be broadly varied by changing the polymer concentration.The film thickness dependence on PSAN concentration shows a non-linear behavior that can be explained by a concentration-dependent viscosity. According to previously proposed models, prepared solutions are close to the concentrated solution regime. Films show a broad transparency range and refractive index independent of film thickness. The refractive index values range from 1.55 to 1.6 in the visible range. Thermal treatment revealed good stability of the films up to 220 °C and a progressive deterioration for larger temperatures, with evident damage at 300 °C. UV-induced photodegradation was observed and results showed a progressive decrease of transmittance in the range between 200 and 300 nm but PSAN thin films show no changes when exposed to light from a solar illuminator. These investigations indicate that PSAN is an excellent candidate for thin film polymer-based optical uses like interference coatings or encapsulation of solar cells.

1. Introduction

The optical properties of polymers have attracted considerable interest for many years. Their good optical characteristics, such as inherent transparency, are decisive factors for upcoming material uses. For instance, the most common silicon solar cell modules consist of glass on the front side and a polymeric encapsulant surrounding the cell with its electrical connections [1]. The encapsulant has to provide low light absorption and an adapted refractive index to minimize interface reflectance. Thermal and irradiation stability also play an important role in choosing an encapsulant polymer material [2]. Other optical characteristics of polymers have also drawn considerable attention, owing to their potential application in multiple optical devices, sensors and light-emitting diodes [3,4,5].
Poly(styrene-co-acrylonitrile) (PSAN) is a polymer used in many blends (acrylonitrile- butadiene- styrene, acrylonitrile ethylene- propylenediene styrene, acrylate-styrene- acrylonitrile, etc.) [6,7] and is known to be non-biodegradable [8]. It has superior mechanical properties and good chemical, weather, wear, and heat resistance [9,10]. The high chemical resistance and heat stability of PSAN comes from acrylonitrile and its strong rigidity from styrene [11]. PSAN also exhibits some other desirable properties, such as optical transparency in a broad spectral range and ease of processing. Therefore, it is widely used in many applications in household and sanitary sectors, for packaging cosmetic products as well as for electronic and office items [12] and high energy density storage [13]. It does not lose its color and appearance even if being used outdoors for prolonged periods. PSAN also presents a high softening point, improved impact strength, and high resistance to hydrocarbons and oils because of the polar nature of the acrylonitrile (very polar C≡N group in contrast to non-polar benzene group) [14,15]. PSAN thin films fabricated by dip-coating have been used to fabricate waveguides on glass substrates [16]. Recently, it has been shown that PSAN can passivate defects in perovskite solar cells and increase their efficiency [17]. Most of these characteristics and applications are based on PSAN particles or thick films while few studies have addressed the properties of very thin PSAN films (thickness below 1 micron) [18,19], that could be suitable for optical interferential coatings. The temperature stability of very thin polymer films is a critical issue for coating applications because film dewetting takes place more easily for small thickness values [20].
In this paper we present the fabrication and optical characterization of PSAN thin films by spin-coating method. Spin-coating of PSAN-based composites containing manganite [21] or chromophores [22] has been previously conducted for different applications. In this work we set the focus on thin pure PSAN films that could be part of multilayer systems, i.e., with film thickness up to few hundreds of nanometers. In this context, optical properties variation with thickness and thermal and radiation stability of films are critical aspects that have to be addressed as a prior step to the practical implementation of PSAN films in interferential coatings. A blend of PSAN and tetrahydrofuran was selected for spin coating due to their favorable interactions [23]: both PSAN and tetrahydrofuran are polar [14] and the second quickly evaporates after spinning. We analyze the relation between film thickness and PSAN concentration, which can be well described by the models proposed by Chen [24] and Weill et al. [25]. It is shown that the optical properties (refractive index and absorption) are not affected by PSAN concentration in the solution. Furthermore, the films are stable for heat treatments up to 220 °C and upon exposure to solar radiation, while they show certain degradation under UV light. These insights confirm that PSAN thin films obtained by spin-coating are highly stable and present reproducible optical properties. Therefore, they might be used as building elements in optical coatings technology.

2. Materials and Methods

2.1. Materials

Poly(styrene-co-acrylonitrile) (PSAN) with an acrylonitrile content of 25 wt% was purchased from commercial sources (Sigma-Aldrich). Tetrahydrofuran (THF), from VWR Chemicals, was used as solvent to dissolve PSAN. UV-grade quartz glass slides with thickness equal to 1 mm were purchased from Prazisions Glas & Optik and used as substrates. Acetone, purchased from Fisher chemical and ethanol, from Sigma-Aldrich were used in the cleaning procedure of substrate.

2.2. Fabrication and Processing

Substrates were cleaned with acetone, ethanol, wiped with cotton, and puffed with nitrogen, respectively. PSAN was dissolved at 0.5 wt%, 1 wt%, 3 wt%, 4 wt%, 6 wt%, and 10 wt% of total polymer in THF by mixing it with the help of a vortex shaker. 200 microliters of the solution was applied on the quartz substrate using the spin-coating method in dynamic mode (6800 Spin coater Series, Speciality coating system). Substrates were spun at 1000 r.p.m. for 30 s. Spin coating spreads the solution over the substrate surface under the centrifugal force [26,27], leaving a thin film that flows from the center to the edges. The film thins and the solvent evaporates [28]. After spin coating, samples were annealed under normal atmosphere in a Lindberg/Blue M furnace at 80 °C for 15 min in order to evaporate solvent residues.
Thermal annealing of the films was done in the temperature range from 150 °C to 400 °C for 20 min under normal atmosphere in the same Lindberg/Blue M furnace.
In order to investigate possible degradation of the samples under UV exposure, sample surface area of approximately 5 mm2 was illuminated with a deuterium lamp (power 585 μW) of a DH-2000 light source (Ocean Optics, Dunedin, FL, USA). Samples were also illuminated with an SF150B Solar simulator (Sciencetech, London, UK; Ontario, ON, Canada) in order to check film stability for outdoor applications.

2.3. Characterization

Spectroscopic ellipsometry is a widely used technique to characterize the optical properties of organic thin films [29]. Here we investigate the optical properties of samples using a V-VASE ellipsometer (J.A. Woollam, Lincoln, NE, USA). Measurements were done in the spectral range 0.57–4.5 eV and at angles of incidence of 45°, 55° and 65°. Fitting of ellipsometric data gives insight into PSAN film thickness and refractive index, which was modeled with the Cauchy dispersion model.
Absorption measurements at normal incidence were done in the spectral range 190–1100 nm using a Lambda 25 Perkin-Elmer spectrophotometer. Since only a small region of the samples was exposed to UV radiation from the deuterium lamp, photodegradation was monitored by transmittance measurements at normal incidence in the spectral range 200 to 1000 nm using an Ocean Optics HR4000 (Ocean Optics, Dunedin, FL, USA) fiber spectrometer.
Microscopic pictures were taken by Cerna® Microscope (Thorlabs Inc., Newton, NJ, USA) equipped with single-cube epi-illuminator and trans-illumination modules using N20X-PF 20X Nikon Plan Fluorite 92 Imaging Objective, 0.5 NA, 2.1 mm WD.
Atomic force microscopy (AFM) topography images were acquired using NanoWizard 4 AFM Ultra speed manufactured by JPK (Berlin, Germany) in AC mode. AFM probes were obtained from Budget Sensors (Tap300 Al-G with a radius of curvature of <10 nm, nominal spring constant of 40 N/m, and a nominal resonant frequency of 300 kHz). Images were subsequently processed using the WSxM software [30].
2D measurements of step heights and roughness were taken with an Alpha-Step D-600 stylus profilometer (KLA, Milpitas, CA, USA).

3. Results and Discussion

3.1. As Fabricated Samples

Modeling of ellipsometric data showed that, regardless PSAN concentration, the refractive index was homogeneous through the film and that the film thickness was constant over the measured region, except for the samples with the largest PSAN concentration that show some depolarization signature, as discussed below. The film thickness dependence on PSAN concentration (Figure 1) shows a non-linear behavior. In order to explain this trend, we use the relation proposed by Chen [24]:
D = K 0 μ 0.36 ω 0.50 E λ C μ 0.60
where D is the film thickness, μ is the viscosity of the coating solution, ω is the rotation speed, E is the solvent-evaporation rate, λ is the latent heat of evaporation, C μ is the heat capacity of the solvent, and K 0 is a constant for volatile organic solvents. For a given solvent, D is approximately proportional to μ 0.36 . However, it should be taken into account that the viscosity may depend on the polymer concentration (wt) in a complex manner [31]. According to Weill [25], three different regimes can be distinguished: (i) for very dilute solutions, the solution is a pure viscous fluid whose viscosity is a linear function of the concentration ( μ = μ 0 w t ), (ii) in dilute solutions, the solution can be treated as a viscoelastic fluid ( μ = μ 0 ( w t ) + μ 1 ( w t ) 2 ) and (iii) for highly concentrated solutions, the mechanical behavior of the solution is that of a viscous fluid ( μ = μ 0 ( w t ) 5 ). Thus, in general terms, the relation between viscosity and concentration can be described by a power law. We, therefore, fit our experimental data to:
log D = a + 0.36 α ( w t )
where α corresponds to the coefficient describing the phenomenological power law connecting concentration and viscosity. The fit leads to a value of α = 4.6, indicating the prepared solutions are close to the concentrated solution regime.
Next, we analyze how the absorption depends on the concentration (Figure 2). All samples are fully transparent for wavelengths above 280 nm. A weak absorption peak is observed at 260 nm, with intensity increasing with PSAN concentration. It can be associated with isolated phenyl groups, as previously reported for polymers of styrene derivates [32]. At shorter wavelengths (below 230 nm), absorption rapidly increases with decreasing wavelength, revealing the interband transitions in the polymer [33]. The estimated absorption edge (band gap) is around 5.4 eV, with no significant variation with PSAN concentration.
The wavelength dependence of the refractive index as a function of PSAN concentration is depicted in Figure 3. The refractive index presents slightly larger values than glass in the visible range with a moderate dispersion (1.55 to 1.6). It should be noted that it does not present significant variations with PSAN concentration. Namely, the optical properties of PSAN thin films appear to be independent of the film thickness over a wide thickness range.
PSAN film surfaces (Figure 4) present small roughness values (RMS values ranging from 0.2 to 1.3 nm depending on the measurement location). Essentially, the surfaces are very flat with the presence of holes, typically around 2–3 nm deep and approximately 40 nm wide, as is shown on the left panel of Figure 4. The presence of these nanoholes on the sample surface can be explained by the high-volatility of the solution [34,35]. In any case, the small dimensions of the holes and the uniformity of the sample surface should result in negligible losses by light scattering. After analyzing AFM images, it is concluded that morphology of PSAN surfaces does not show significant changes with polymer concentration. The similarity of morphology (on scale up to few microns) is visible in Figure 4 where there are no significant changes between different concentrations. Furthermore, roughness values slightly change with concentration of polymer, for example, measured roughness for wt = 1% is 0.51 nm and for wt = 4% is 0.64 nm. However, it was observed that the AFM tip left an indentation on the measured areas for samples obtained with large PSAN concentration, suggesting a decrease of film hardness.
The surface of the films investigated by profilometry reveals waviness (Figure 5) with a typical period of few tens of micrometers. These striations are associated with the Gibbs-Marangoni effect and result from capillary forces that develop during solvent evaporation causing compositional changes throughout the film. These modifications lead to an unstable surface tension that results in lateral motions of the drying fluid and finally to film thickness variations [36]. At low concentrations, these striations are very small (ca. 3 nm for the sample with wt = 1%) with no remarkable effects on the optical response of the films, but for high PSAN concentrations the thickness variation is up to 300 nm, resulting in significant light depolarization (about 2%) that is detected in the ellipsometric measurements [37].

3.2. Effect of Thermal Annealing

Here we investigate the modification of the fabricated PSAN thin films upon heat treatments. We focus on films with the lowest PSAN concentration (wt = 0.5%) because their thickness is representative for quarterwave layer in the visible range, i.e., they are potentially basic building blocks for inferential optical coatings. Ellipsometric characterization shows that the film thickness (Table 1) remains stable for annealing temperatures up to 220 °C. At larger annealing temperatures the film thickness decreases. Likewise, the optical absorption of the films (Figure 6) starts to decrease only at annealing temperatures of 300 °C. The refractive index (Table 1) weakly increases at 300 °C, which points to slight densification of the material. At higher temperatures refractive index significantly decreases, which indicates a reduction of overall film density. This is confirmed by AFM measurements that reveal the presence of the bare substrate in several areas of the sample surface (Figure 7) which indicates that the film progressively decomposes and explains the decrease of absorption and effective film thickness.
The surface sample evolution is best illustrated by the microscopic pictures (Figure 8) that reveal the presence of striations in the as-fabricated and weakly annealed films. These striations are not present anymore after annealing at 300 °C, indicating the beginning of significant morphological changes in the film. Annealing at larger temperatures leads to the presence of crater-like structures. The height of these structures, as measured by profilometry, is approximately equal to the initial film thickness suggesting that these regions correspond to the remains of the original PSAN film.

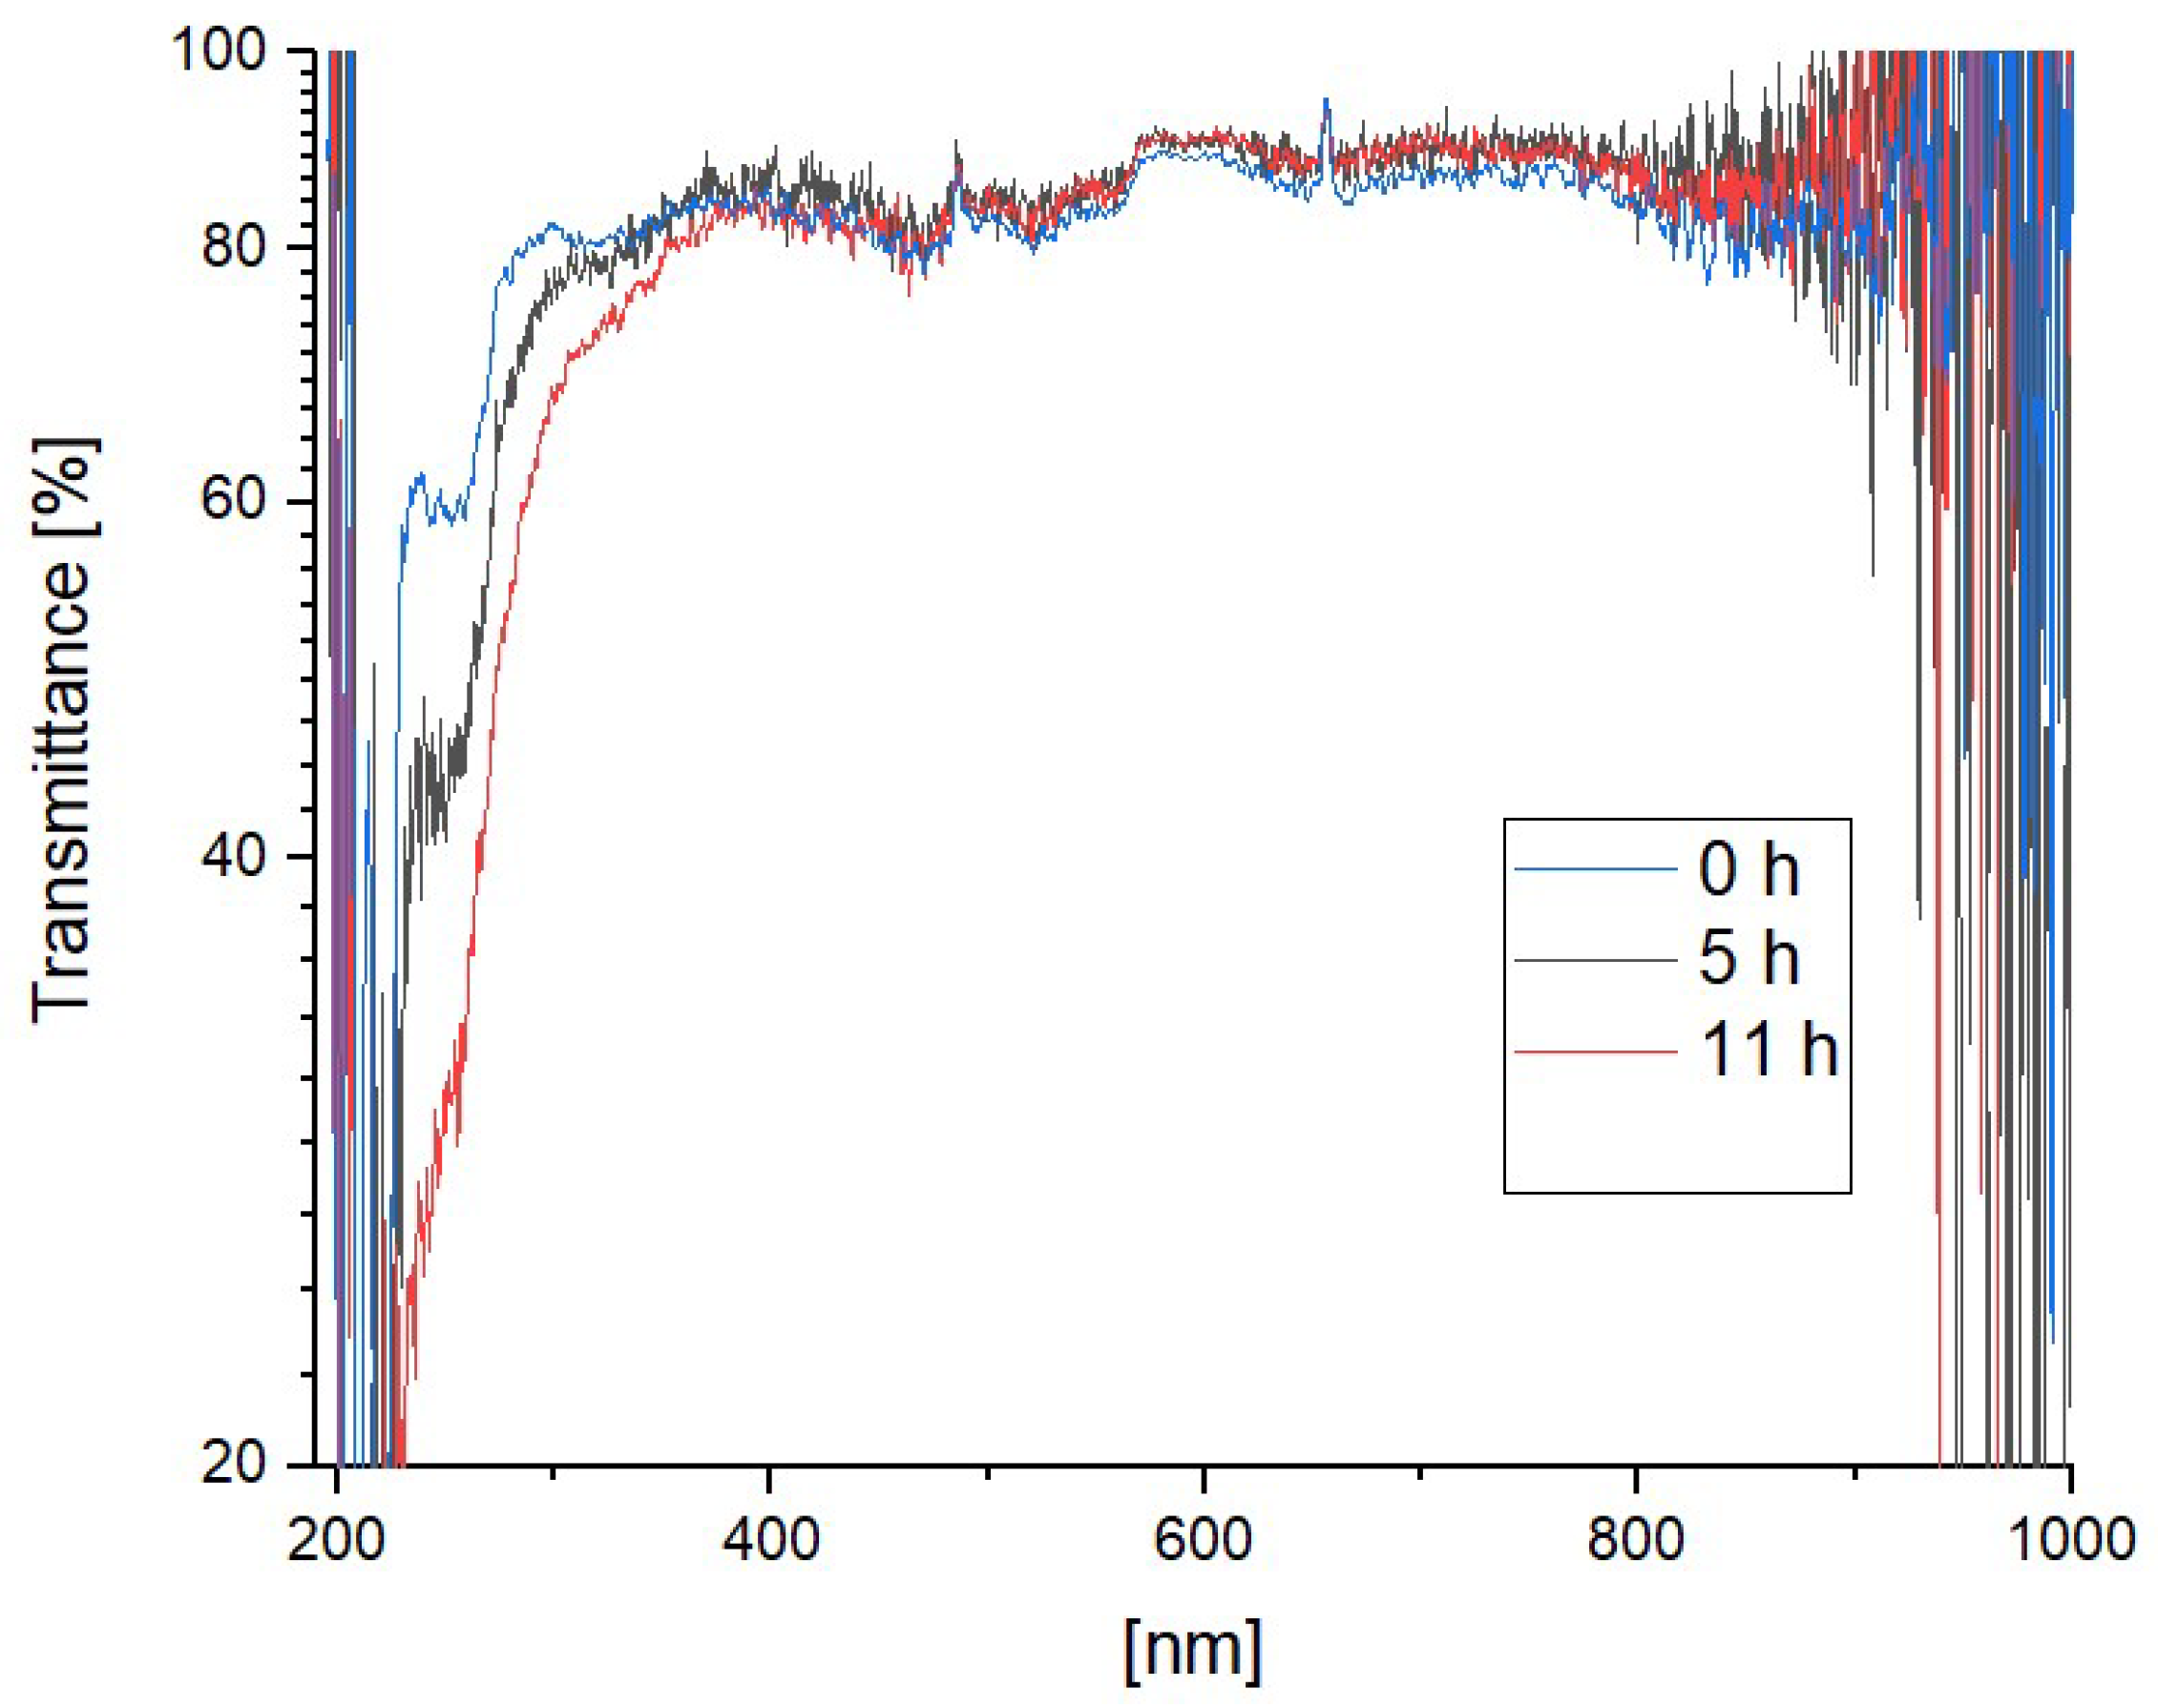
3.3. Photodegradation

PSAN thin films (wt = 0.5%) show no changes when exposed to light from a solar illuminator even at large exposure times, confirming their stability for outdoors applications. Finally, we analyze possible photodegradation caused by UV radiation, that results in a progressive decrease of transmittance in the range between 200 and 300 nm, as shown in Figure 9. The increased absorption can be explained by the presence of aromatic group on the polymer chain that has poor photostability in the UV region, as reported by Nishio et al. in connection with the structural changes on nitrile group, such as elimination and cyclization [38]. Furthermore, due to the high absorption coefficient of the styrene monomer around 260 nm, the styrene units in the copolymer backbone produce a synergistic effect enhancing absorption and generating heat, allowing in this manner the decomposition of acrylonitrile units [39].

4. Conclusions

PSAN thin films on quartz substrates have been fabricated by spin-coating of PSAN-THF solutions. The thickness of the films can be easily controlled by PSAN concentration in the spun solution. Film thickness and concentration are related by a power-law in agreement with previously proposed theoretical models. The films show a broad transparency range covering visible and UV spectra down to 280 nm, where absorption of styrene becomes noticeable. Yet, the styrene absorption band is relatively weak and films might be used down to 230 nm where interband transitions start to dominate the optical properties. The refractive index does not show remarkable changes with concentration. From a practical point of view it means that the refractive index appears to be independent of film thickness, which is an advantageous characteristic for thin films to be used in optical coatings. Indeed, depending on the fabrication technique, film thickness can influence refractive index, complicating the design and characterization of multilayer coatings [40]. The films are highly stable when subjected to thermal treatments up to 220 °C or when exposed to solar illumination and present certain degradation upon UV radiation. Overall, the simplicity of the fabrication approach combined with optimal optical properties and stability makes PSAN thin films attractive candidates for polymer-based optical coatings.

Author Contributions

Conceptualization, E.H. and J.S.-P.; methodology, E.H., I.F., I.Š.R. and J.S.-P.; software, E.H. and J.S.-P.; validation, E.H., I.V. and J.S.-P.; formal analysis, E.H., I.F., I.Š.R. and J.S.-P.; investigation, E.H., I.F., I.Š.R. and J.S.-P.; resources, E.H., I.F., I.Š.R., I.V. and J.S.-P.; data curation, E.H., I.Š.R. and J.S.-P.; writing—original draft preparation, E.H. and J.S.-P.; writing—review and editing, E.H., I.F., I.Š.R., I.V. and J.S.-P.; visualization, E.H.; supervision, J.S.-P.; project administration, J.S.-P.; funding acquisition, I.V. and J.S.-P. All authors have read and agreed to the published version of the manuscript.

Funding

This research was supported by European Regional Development Fund (ERDF) under the (IRI) project “Improvement of solar cells and modules through research and development” (grant number KK.01.2.1.01.0115). I.Š.R. acknowledge financial support by the Center of Excellence for Advanced Materials and Sensing Devices (ERDF Grant No. KK.01.1.1.01.0001).

Institutional Review Board Statement

Not applicable.

Informed Consent Statement

Not applicable.

Data Availability Statement

The data presented in this study are available on request from the corresponding author.

Conflicts of Interest

The authors declare no conflict of interest.

References

  1. Knausz, M.; Oreski, G.; Schmidt, M.; Guttmann, P.; Berger, K.; Voronko, Y.; Eder, G.; Koch, T.; Pinter, G. Thermal expansion behavior of solar cell encapsulation materials. Polym. Test. 2015, 44, 160–167. [Google Scholar] [CrossRef]
  2. Peike, C.; Hädrich, I.; Weiß, K.A.; Dürr, I.; Ise, F. Overview of PV module encapsulation materials. Photovoltaics Int. 2013, 19, 85–92. [Google Scholar]
  3. Hussein, A.M.; Dannoun, E.; Aziz, S.B.; Brza, M.A.; Abdulwahid, R.T.; Hussen, S.A.; Rostam, S.; Mustafa, D.M.; Muhammad, D.S. Steps toward the band gap identification in polystyrene based solid polymer nanocomposites integrated with tin titanate nanoparticles. Polymers 2020, 12, 2320. [Google Scholar] [CrossRef] [PubMed]
  4. Rochat, S.; Swager, T.M. Conjugated amplifying polymers for optical sensing applications. ACS Appl. Mater. Interfaces 2013, 5, 4488–4502. [Google Scholar] [CrossRef]
  5. Moliton, A.; Hiorns, R.C. Review of electronic and optical properties of semiconducting π-conjugated polymers: Applications in optoelectronics. Polym. Int. 2004, 53, 1397–1412. [Google Scholar] [CrossRef]
  6. El-Aassar, M.R.; Masoud, M.S.; Elkady, M.F.; Elzain, A.A. Synthesis, optimization, and characterization of poly (Styrene-co-Acrylonitrile) copolymer prepared via precipitation polymerization. Adv. Polym. Technol. 2018, 37, 2021–2029. [Google Scholar] [CrossRef]
  7. Mailhot, B.; Gardette, J.L. Mechanism of poly (styrene-co-acrylonitrile) photooxidation. Polym. Degrad. Stab. 1994, 44, 237–247. [Google Scholar] [CrossRef]
  8. Cho, K.; Lee, J.; Xing, P. Enzymatic degradation of blends of poly (ε-caprolactone) and poly (styrene-co-acrylonitrile) by Pseudomonas lipase. J. Appl. Polym. Sci. 2002, 83, 868–879. [Google Scholar] [CrossRef]
  9. Bedjaoui, K.; Krache, R.; Marcos-Fernández, A.; Guessoum, M. The effect of compatibilizer SEBS on the mechanical, morphological and thermal properties of the polystyrene/poly (styrene-co-acrylonitrile) copolymer blends. Mater. Res. Express 2019, 6, 105334. [Google Scholar] [CrossRef]
  10. Cárdenas, T.G.; Acuña, E.J.; Carbacho, H.H.; Rodríguez, B.M.; Tagle, D.L.H. Thermal Studies of Metal Poly (Styrene-Co-Acrylonitrile). Part 14. Int. J. Polym. Mater. 1994, 26, 199–206. [Google Scholar] [CrossRef]
  11. Mu, S.Y.; Guo, J.; Gong, Y.M.; Zhang, S.; Yu, Y. Synthesis and thermal properties of poly (styrene-co-acrylonitrile)-graft-polyethylene glycol copolymers as novel solid–solid phase change materials for thermal energy storage. Chin. Chem. Lett. 2015, 26, 1364–1366. [Google Scholar] [CrossRef]
  12. Benali, S.; Olivier, A.; Brocorens, P.; Bonnaud, L.; Alexandre, M.; Bourbigot, S.; Espuche, E.; Gouanve, F.; Lazzaroni, R.; Dubois, P. Fire and gas barrier properties of poly (styrene-co-acrylonitrile) nanocomposites using polycaprolactone/clay nanohybrid based-masterbatch. Adv. Mater. Sci. Eng. 2008, 2008, 394235. [Google Scholar] [CrossRef] [Green Version]
  13. Wen, F.; Xu, Z.; Xia, W.; Ye, H.; Wei, X.; Zhang, Z. High-energy-density poly (styrene-co-acrylonitrile) thin films. J. Electron. Mater. 2013, 42, 3489–3493. [Google Scholar] [CrossRef]
  14. Khan, Z.; Baloch, M.K. Investigating the miscibility of polystyrene/poly (styrene-co-acrylonitrile) blend in tetrahydrofuran by simple physical techniques at various temperatures. Polym. Bull. 2013, 70, 2015–2033. [Google Scholar] [CrossRef]
  15. Svoboda, P.; Svobodova, D.; Chiba, T.; Inoue, T. Competition of phase dissolution and crystallization in poly (ε-caprolactone)/poly (styrene-co-acrylonitrile) blend. Eur. Polym. J. 2008, 44, 329–341. [Google Scholar] [CrossRef]
  16. Ghawana, K.; Singh, S.; Tripathi, K. Determination of waveguide parameters of acrylonitrile-based polymer optical waveguides. J. Opt. 1998, 29, 265. [Google Scholar] [CrossRef]
  17. Yang, J.; Cao, Q.; He, Z.; Pu, X.; Li, T.; Gao, B.; Li, X. The poly (styrene-co-acrylonitrile) polymer assisted preparation of high-performance inverted perovskite solar cells with efficiency exceeding 22%. Nano Energy 2021, 82, 105731. [Google Scholar] [CrossRef]
  18. Wen, G.; Li, X.; Liao, Y.; An, L. Surface phase separations of PMMA/SAN blends investigated by atomic force microscopy. Polymer 2003, 44, 4035–4045. [Google Scholar] [CrossRef]
  19. Yukioka, S.; Inoue, T. Ellipsometric studies on immiscible polymer-polymer interfaces. Polymer 1993, 34, 1256–1259. [Google Scholar] [CrossRef]
  20. Reiter, G. Dewetting of thin polymer films. Phys. Rev. Lett. 1992, 68, 75. [Google Scholar] [CrossRef]
  21. Ammar, M.; Napierala, C.; Laffez, P. Infrared thermochromic behaviour of a composite Sm0. 65Ca0. 35MnO3–poly (styrene-co-acrylonitrile) film. Smart Mater. Struct. 2009, 18, 055002. [Google Scholar] [CrossRef]
  22. El Wafa, A.M.A.; Okada, S.; Nakanishi, H. Poling and its relaxation studies of polycarbonate and poly (styrene-co-acrylonitrile) doped by a nonlinear optical chromophore. Dyes Pigment. 2006, 69, 239–244. [Google Scholar] [CrossRef]
  23. Hsu, W.P. Effect of tacticity of poly (methyl methacrylate) on the miscibility with poly (styrene-co-acrylonitrile). J. Appl. Polym. Sci. 1999, 74, 2894–2899. [Google Scholar]
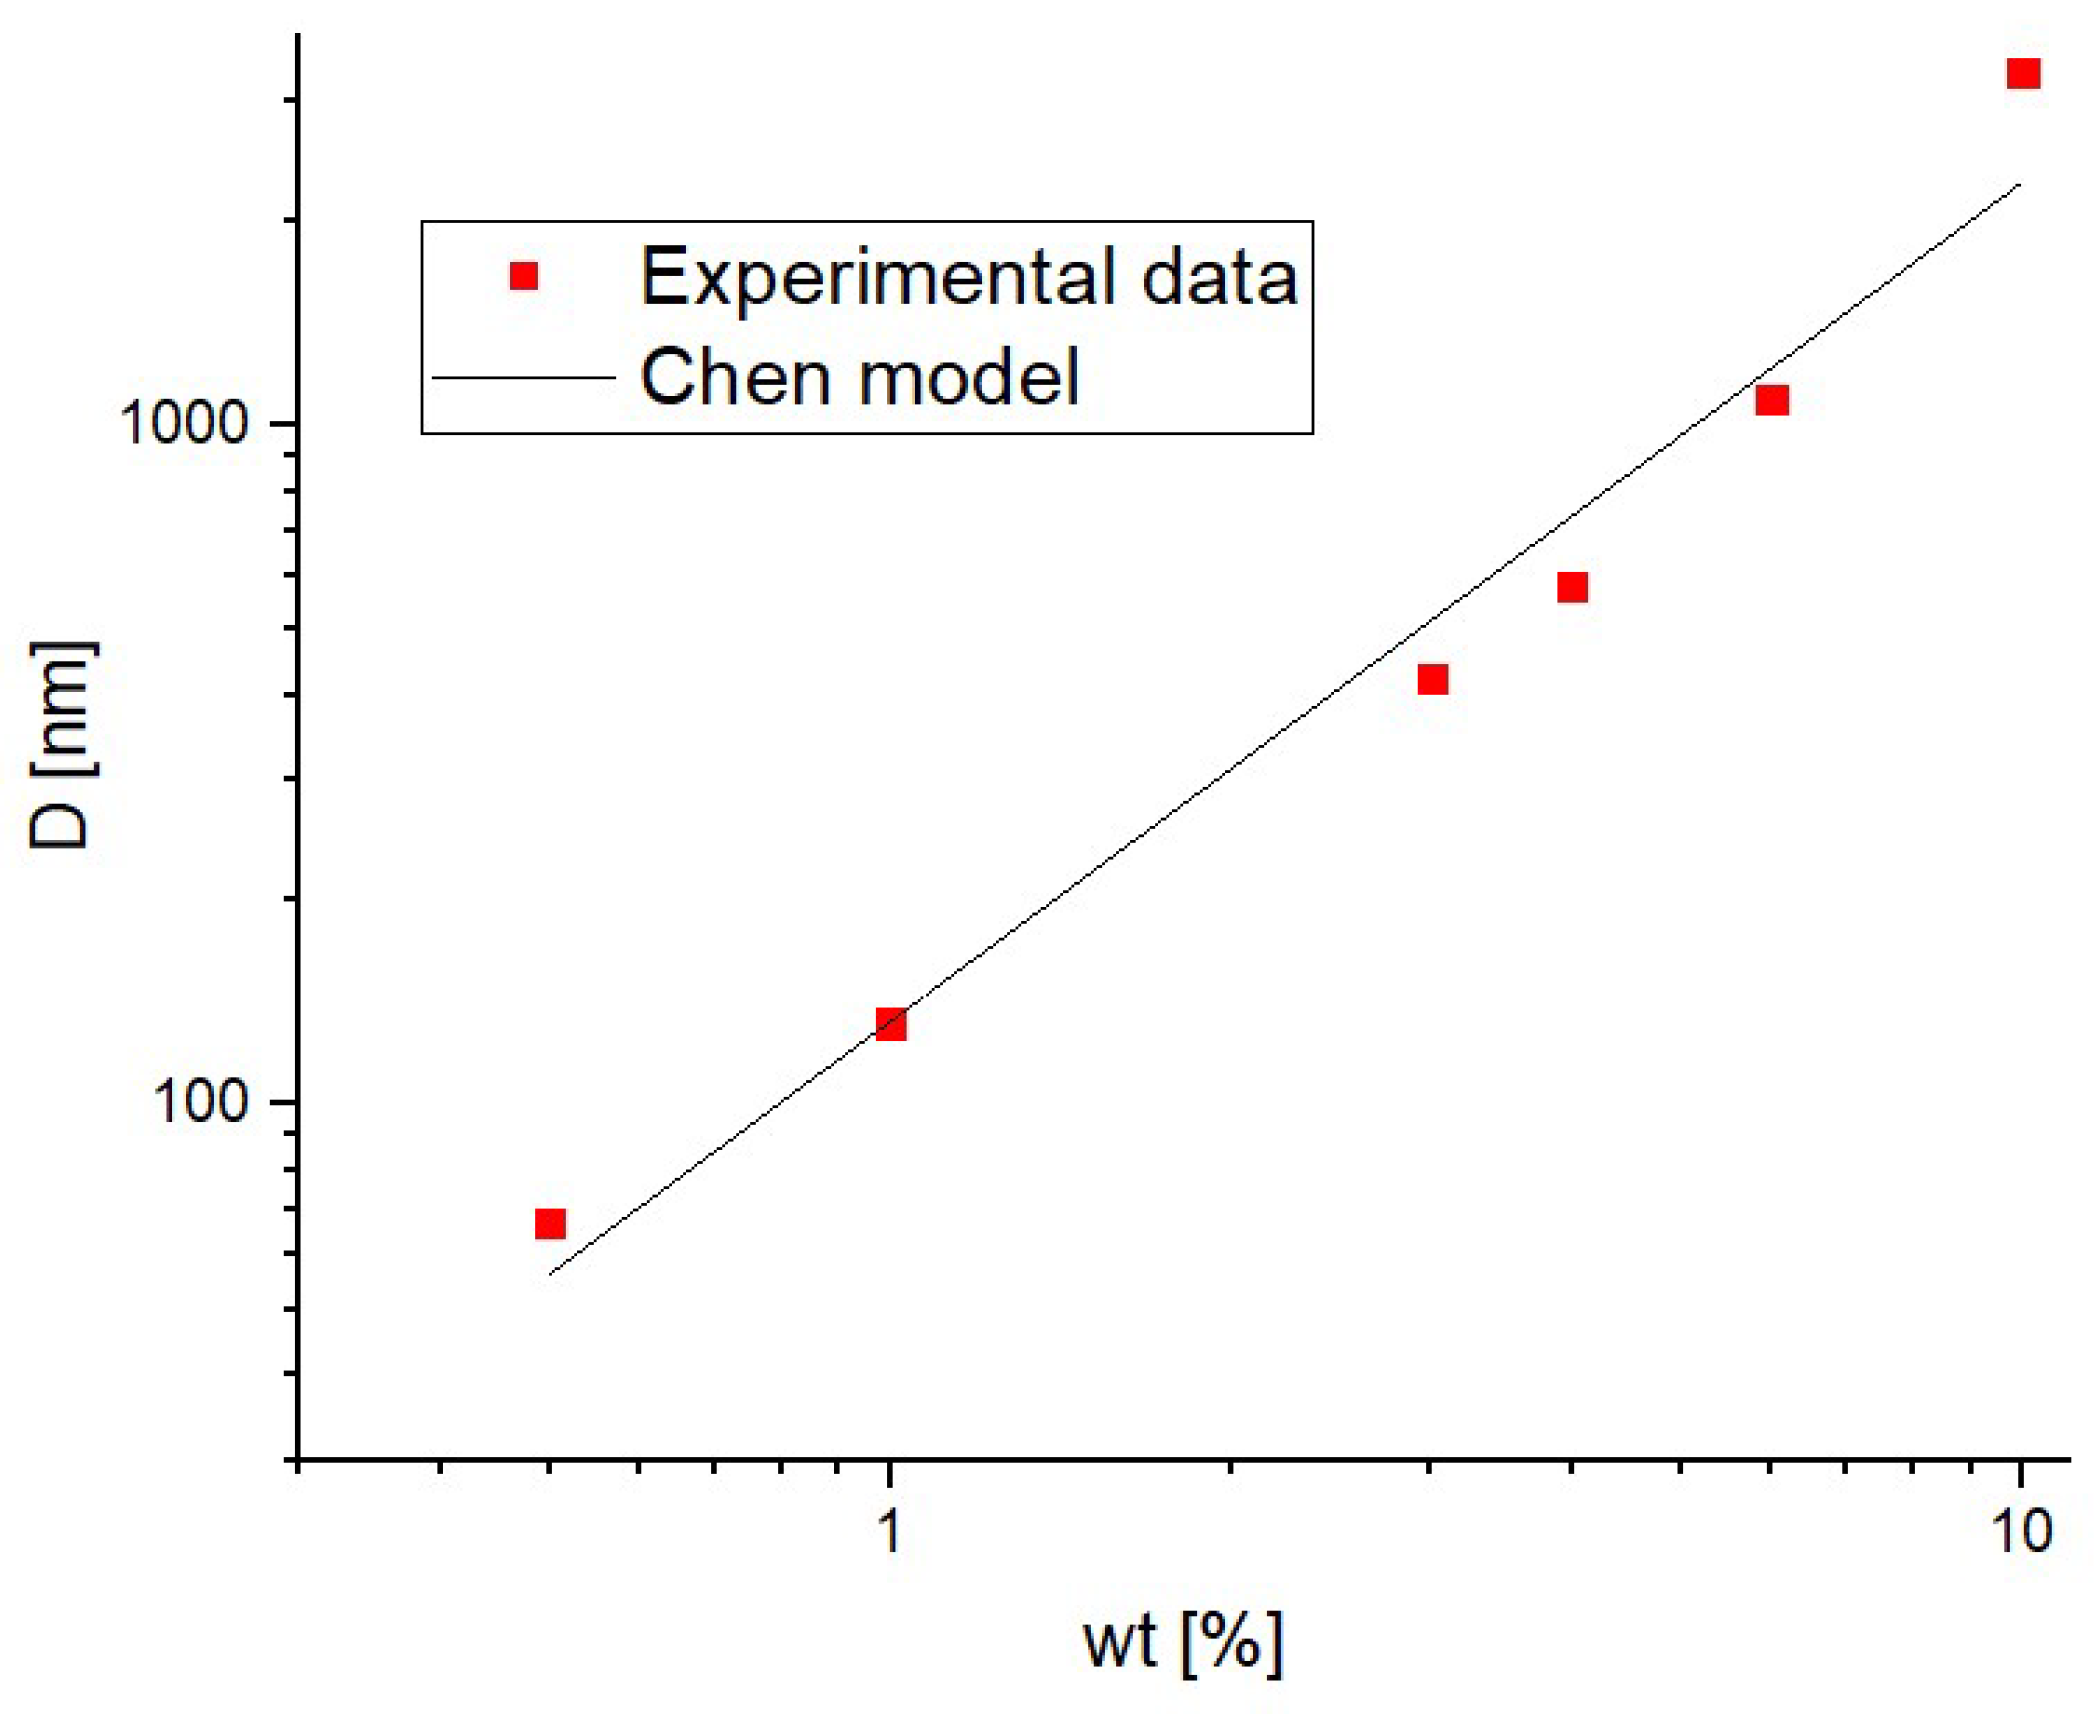
  24. Chen, B. Investigation of the solvent-evaporation effect on spin coating of thin films. Polym. Eng. Sci. 1983, 23, 399–403. [Google Scholar] [CrossRef]
  25. Weill, A.; Dechenaux, E. The spin-coating process mechanism related to polymer solution properties. Polym. Eng. Sci. 1988, 28, 945–948. [Google Scholar] [CrossRef]
  26. Lawrence, C. The mechanics of spin coating of polymer films. Phys. Fluids 1988, 31, 2786–2795. [Google Scholar] [CrossRef]
  27. Tyona, M. A theoritical study on spin coating technique. Adv. Mater. Res. 2013, 2, 195. [Google Scholar] [CrossRef] [Green Version]
  28. Hall, D.B.; Underhill, P.; Torkelson, J.M. Spin coating of thin and ultrathin polymer films. Polym. Eng. Sci. 1998, 38, 2039–2045. [Google Scholar] [CrossRef]
  29. Nosidlak, N.; Dulian, P.; Mierzwiński, D.; Jaglarz, J. The Determination of the Electronic Parameters of Thin Amorphous Organic Films by Ellipsometric and Spectrophotometric Study. Coatings 2020, 10, 980. [Google Scholar] [CrossRef]
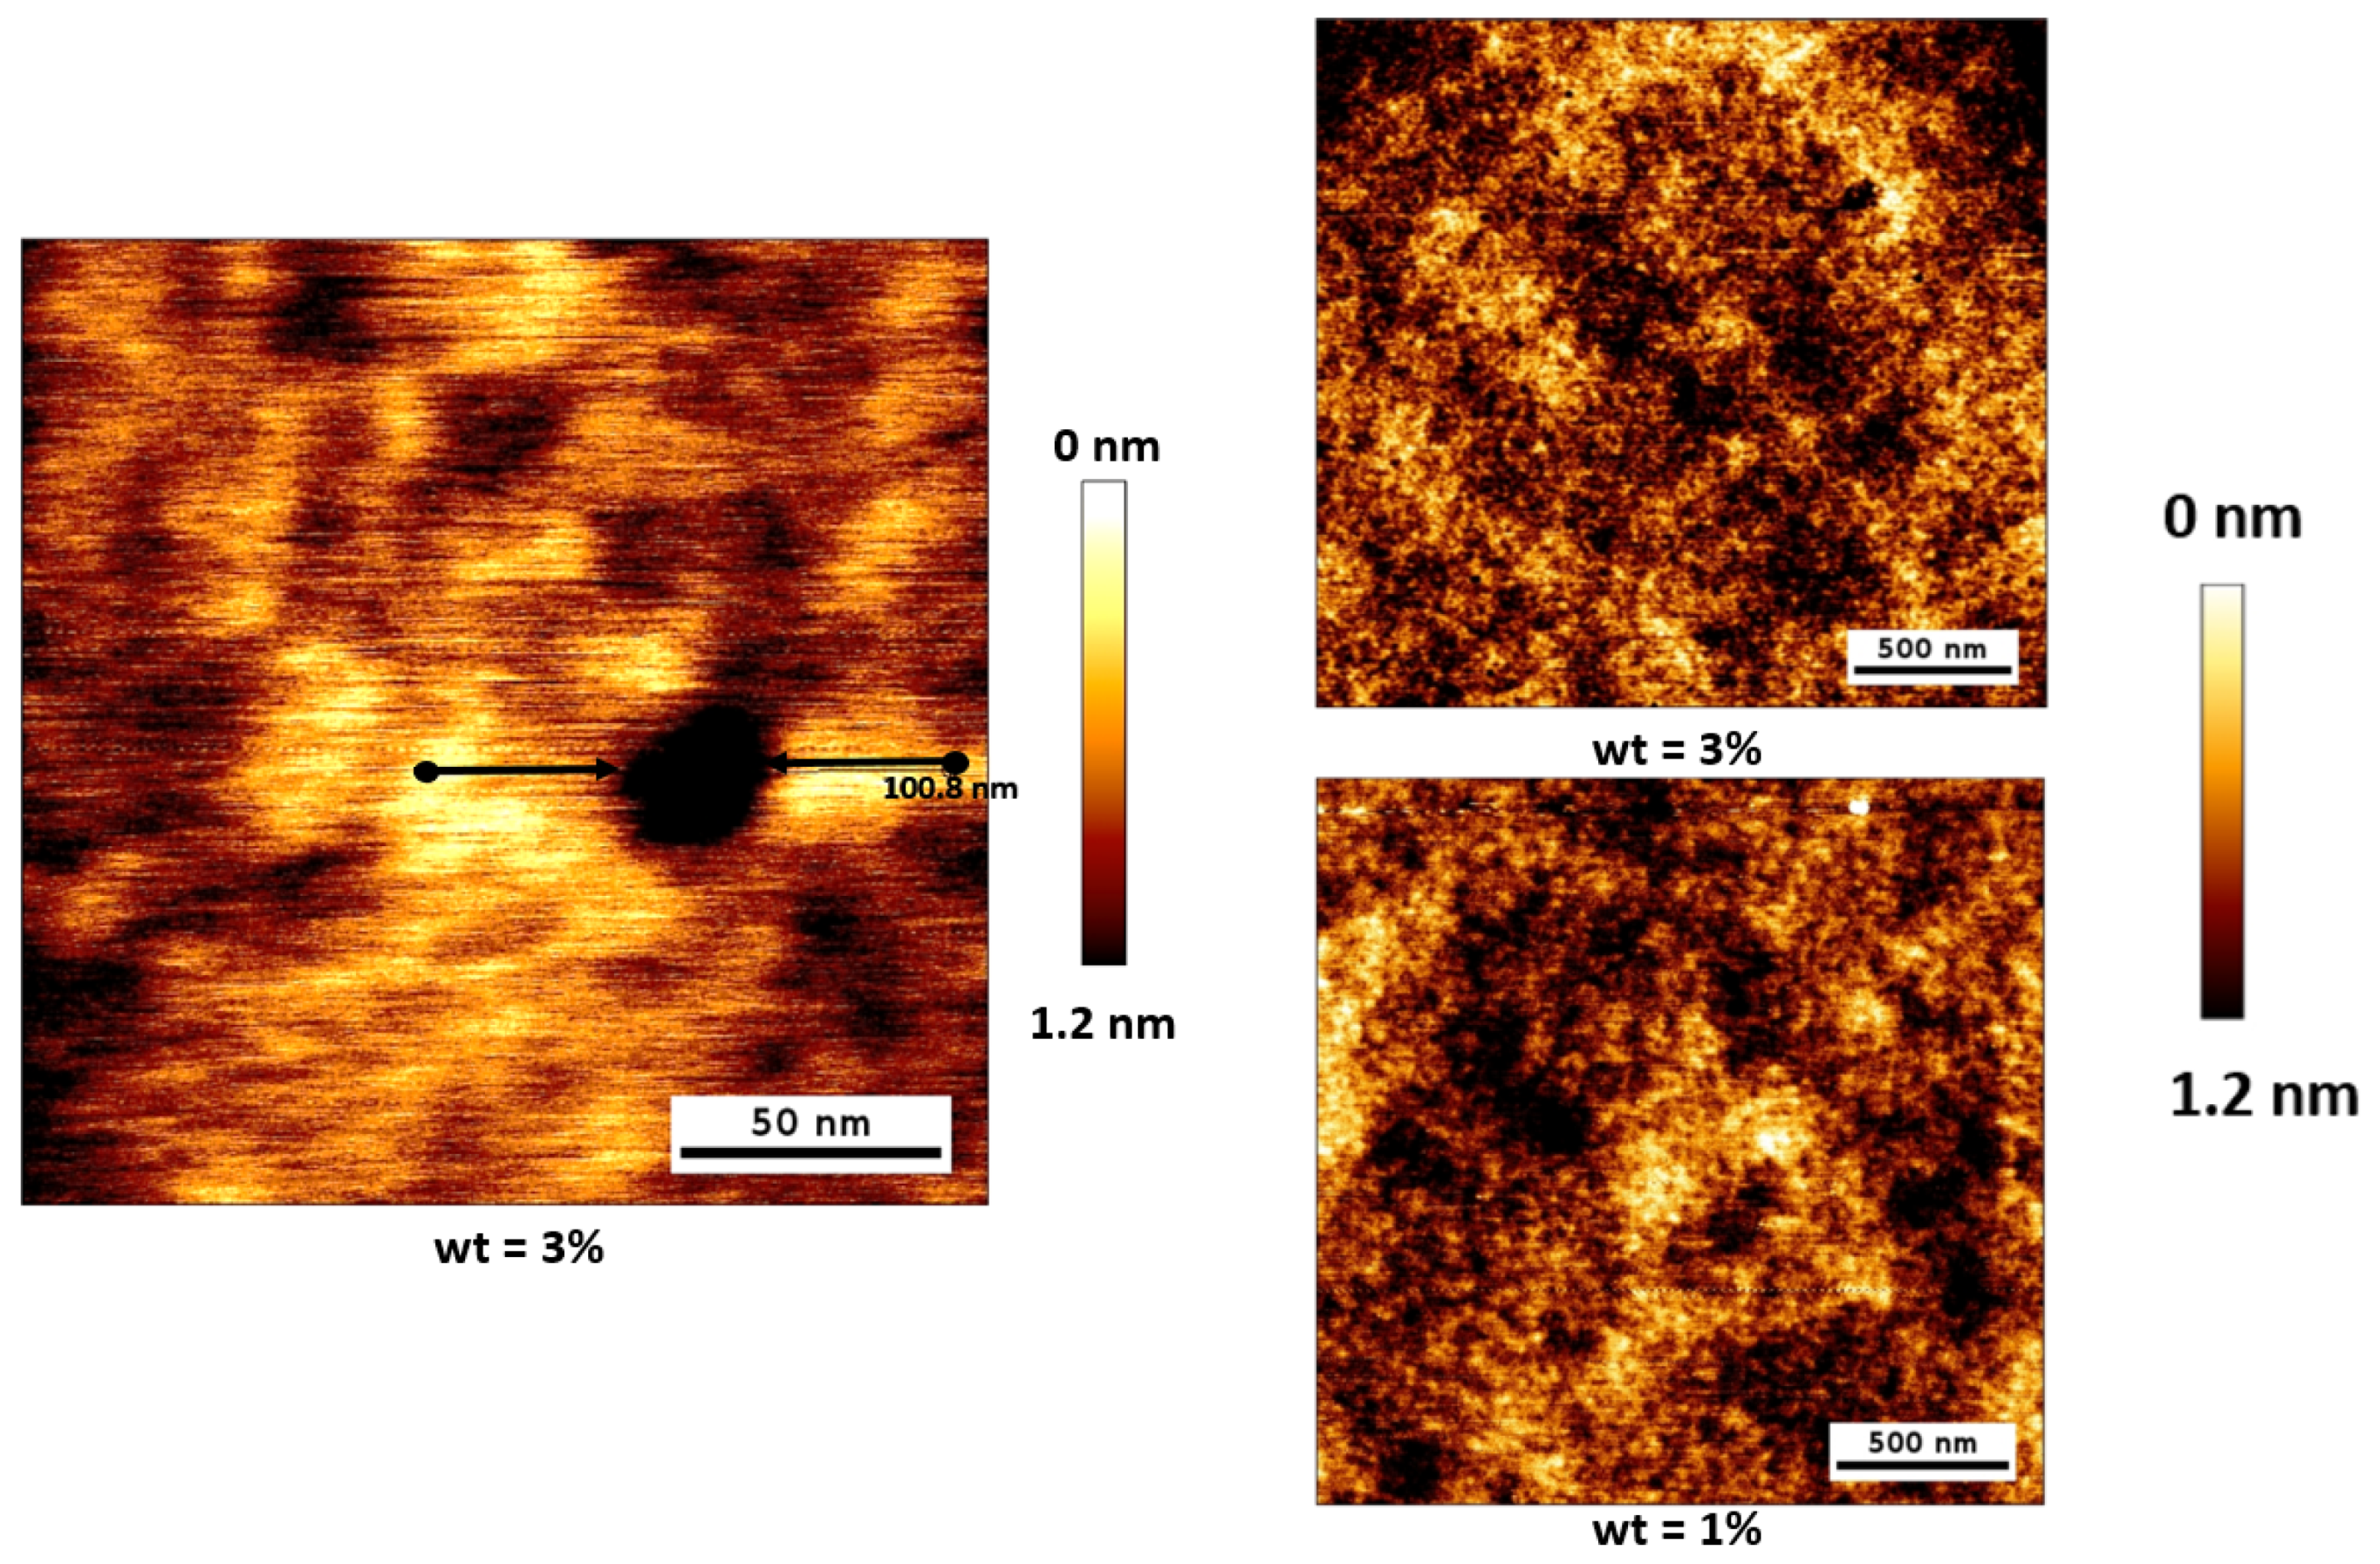
  30. Horcas, I.; Fernández, R.; Gomez-Rodriguez, J.; Colchero, J.; Gómez-Herrero, J.; Baro, A. WSXM: A software for scanning probe microscopy and a tool for nanotechnology. Rev. Sci. Instrum. 2007, 78, 013705. [Google Scholar] [CrossRef] [PubMed]
  31. Chapman, N.; Chapman, M.; Euler, W.B. Modeling of Poly (methylmethacrylate) Viscous Thin Films by Spin-Coating. Coatings 2021, 11, 198. [Google Scholar] [CrossRef]
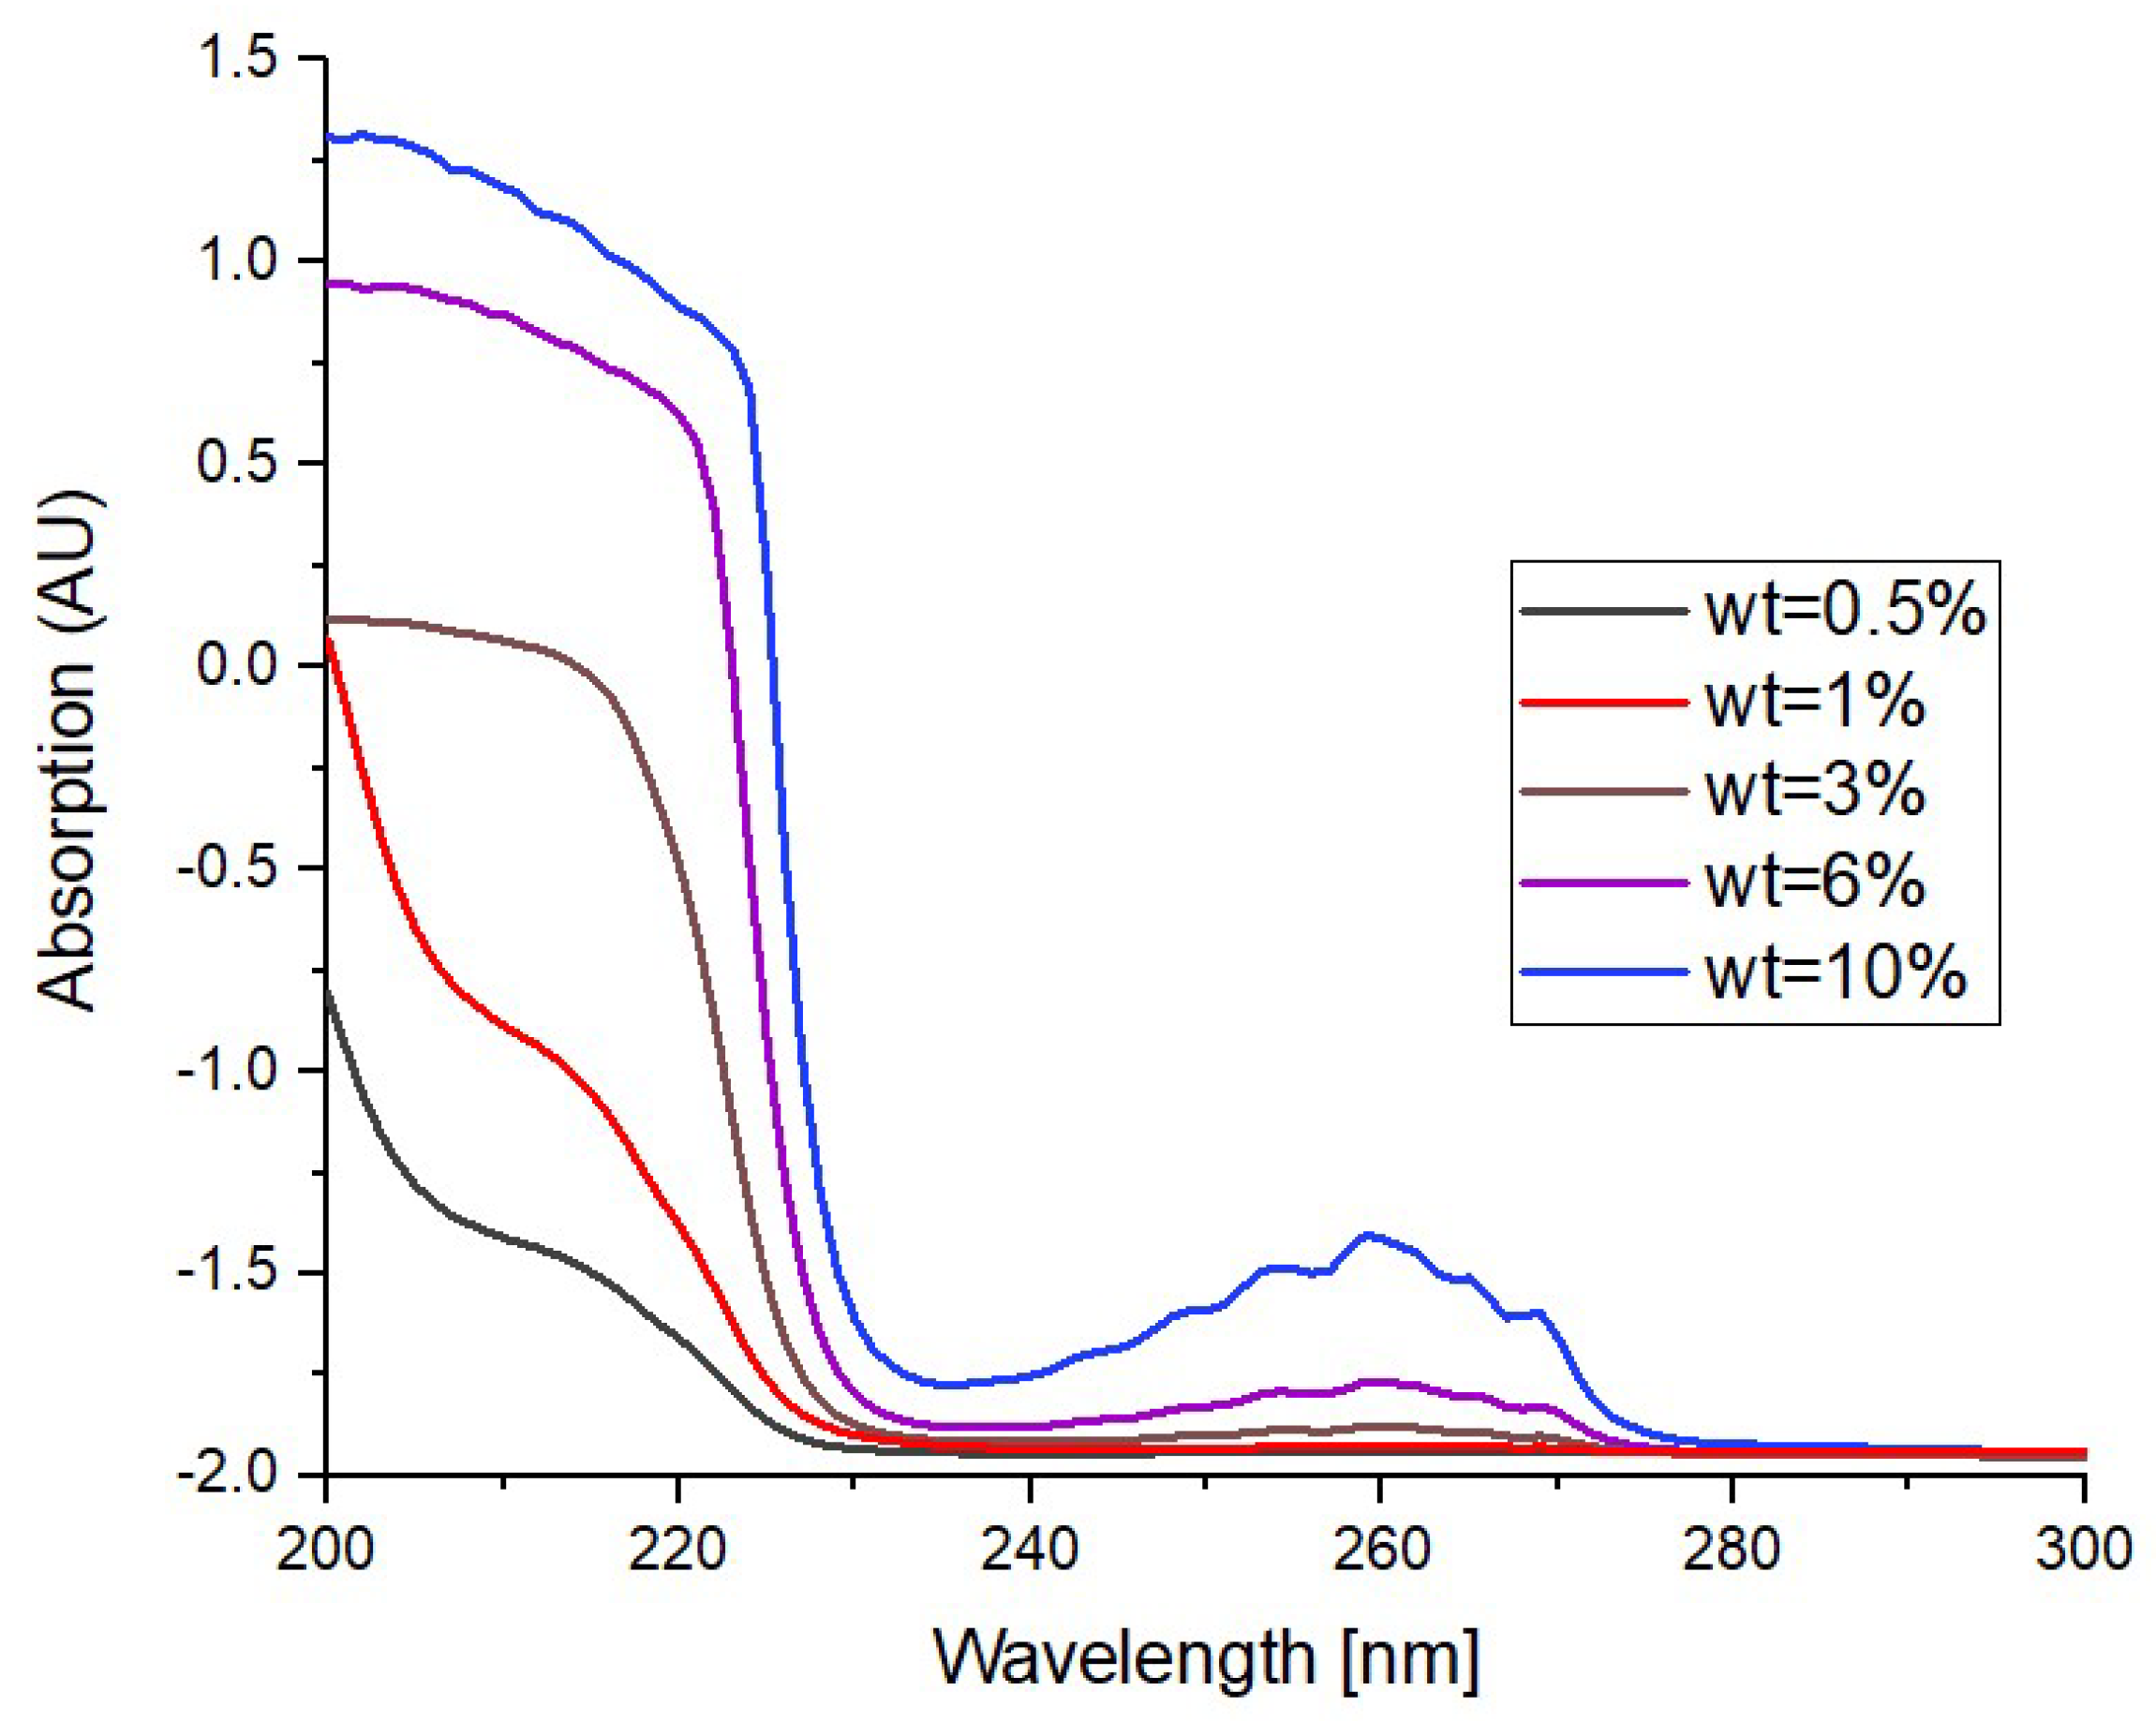
  32. Li, T.; Zhou, C.; Jiang, M. UV absorption spectra of polystyrene. Polym. Bull. 1991, 25, 211–216. [Google Scholar] [CrossRef]
  33. Rasmussen, S. Low-bandgap polymers. In Encyclopedia of Polymeric Nanomaterials; Springer: Berlin/Heidelberg, Germany, 2015; pp. 1155–1166. [Google Scholar]
  34. Hansen, C. The Three Dimensional Solubility Parameter and Solvent Diffusion Coefficient; Danish Technical Press: Copenhagen, Denmark, 1967. [Google Scholar]
  35. Anandhan, S.; De, P.; De, S.; Bandyopadhyay, S.; Bhowmick, A. Mapping of thermoplastic elastomeric nitrile rubber/poly (styrene-co-acrylonitrile) blends using tapping mode atomic force microscopy and transmission electron microscopy. J. Mater. Sci. 2003, 38, 2793–2801. [Google Scholar] [CrossRef]
  36. Birnie, D.P., III. A model for drying control cosolvent selection for spin-coating uniformity: The thin film limit. Langmuir 2013, 29, 9072–9078. [Google Scholar] [CrossRef] [PubMed]
  37. Ohlídal, I.; Vohánka, J.; Čermák, M. Optics of Inhomogeneous Thin Films with Defects: Application to Optical Characterization. Coatings 2021, 11, 22. [Google Scholar] [CrossRef]
  38. Singh, R.; Verma, K.; Singh, T.; Barman, P.; Sharma, D. UV shielding with visible transparency based properties of poly (styrene-co-acrylonitrile)/Ag doped ZnO nanocomposite. Mater. Res. Express 2018, 5, 025035. [Google Scholar] [CrossRef]
  39. Broglia, M.F.; Acevedo, D.F.; Langheinrich, D.; Perez-Hernandez, H.R.; Barbero, C.A.; Lasagni, A.F. Rapid fabrication of periodic patterns on poly (styrene-co-acrylonitrile) surfaces using direct laser interference patterning. Int. J. Polym. Sci. 2015, 2015, 721035. [Google Scholar] [CrossRef]
  40. Tikhonravov, A.V.; Amotchkina, T.V.; Trubetskov, M.K.; Francis, R.J.; Janicki, V.; Sancho-Parramon, J.; Zorc, H.; Pervak, V. Optical characterization and reverse engineering based on multiangle spectroscopy. Appl. Opt. 2012, 51, 245–254. [Google Scholar] [CrossRef] [Green Version]
Figure 1. Film thickness dependence on PSAN concentration: experimental (squares) and model fit (solid line).
Coatings 11 01015 g001
Figure 2. Absorbance of fabricated PSAN thin films as a function of wavelength and PSAN concentration.
Coatings 11 01015 g002
Figure 3. Refractive index (n) dependence on PSAN concentration as a function of wavelength.
Coatings 11 01015 g003
Figure 4. AFM picture of PSAN thin film surface with wt = 3% and wt = 1%.
Coatings 11 01015 g004
Figure 5. Surface profiles scan of PSAN thin films with wt = 1% (left) and wt = 10% (right).
Coatings 11 01015 g005
Figure 6. Temperature dependence of absorption of 0.5% (wt) PSAN thin films.
Coatings 11 01015 g006
Figure 7. AFM pictures of PSAN film surface with wt = 0.5% annealed at different temperatures. Note that for high annealing temperatures the pictures show straight lines that are present in the bare substrate.
Coatings 11 01015 g007
Figure 8. Microscopic pictures of PSAN film surface with wt = 0.5% annealed at different temperatures.
Coatings 11 01015 g008
Figure 9. Transmittance of 0.5% (wt) PSAN thin films exposed for different times to UV radiation.
Coatings 11 01015 g009
Table 1. Thickness and refractive index evolution of PSAN thin film with wt = 0.5% annealed at different temperatures.
Temperature (°C)Thickness (nm)Refractive Index at 500 nm
8067.1 ± 0.21.571 ± 0.001
15064.6 ± 0.21.574 ± 0.001
22067.4 ± 0.21.573 ± 0.001
30051.7 ± 0.31.584 ± 0.002
35036.8 ± 0.81.516 ± 0.002
40036.3 ± 1.91.491 ± 0.003
Publisher’s Note: MDPI stays neutral with regard to jurisdictional claims in published maps and institutional affiliations.

