Article

Development of a Mechanistic Method to Obtain Load Position Strain in Instrumented Pavement

1
School of Transportation Engineering, Shandong Jianzhu University, Jinan 250101, China
2
Shandong Transportation Institute, Jinan 250101, China
3
Shandong Huitong Construction Group Co., Ltd., Jinan 250032, China
*
Author to whom correspondence should be addressed.
Coatings 2022, 12(1), 14; https://doi.org/10.3390/coatings12010014
Submission received: 1 December 2021 / Revised: 19 December 2021 / Accepted: 20 December 2021 / Published: 23 December 2021
(This article belongs to the Special Issue Asphalt Pavement Materials and Surface)

Abstract

:
To study the in-situ response and performance of asphalt pavement, instrumenting pavement with a variety of sensors has become one of the most important tools in the field or accelerated load facilities. In the dynamic response collection process, engineers are more concerned with the load position strain of the pavement structure due to wheel wander. This paper proposes a method to obtain the load position and the strain at the load position when there is no lateral-axis positioning system based on multilayer elastic theory. The test section was paved in the field with installed strain sensors to verify and apply the proposed method. The verification results showed that both the calculated load position and load position strain matched the measured values with an absolute difference range of 5–60 mm, 0.5–2.5 με, respectively. The application results showed that the strain at the load position calculated by the proposed method had a good correlation with the temperature, as expected.

1. Introduction

In the past two decades, measuring the dynamic strains of asphalt pavement structures has gradually become one of the most important means to evaluate the performance of a pavement and validate pavement distress models from a mechanistic viewpoint [1,2]. The instrumentation used at the Virginia Smart Road was to measure flexible pavement response to loading [3]. Twelve asphalt strain gauges were installed to measure longitudinal and transverse strains at the bottom of the Hot Mixture Asphalt (HMA) layer in an instrumented Test Section located in McClain County, Oklahoma [4]. Asefzadeh, A. and Hashemian, L. developed empirical statistical pavement temperature prediction models based on two years of field strains collected from an instrumented test road located in Edmonton, Alberta, Canada [5]. Hossain, N. and Singh, D. conducted a study to better understand the cause of pavement failure under actual traffic loading and environmental conditions in an instrumented test section on I-35 in McClain County [6].
It can be seen from the above, to measure dynamic strains in the field, it is necessary to install sensors in the pavement. However, when using these strains from the sensors to evaluate the pavement performance, one factor that must be taken into account is whether the wheel of the vehicle passes directly above the sensor. Engineers are most concerned with the strain at the load position, i.e., the maximum strain that could primarily cause pavement deterioration.
Timm and Priest carried out an investigation at the National Center for Asphalt Technology (NCAT) test track. The results showed that the offset has a strong relationship with the strain response, and the strain response was consistent with predictions from multilayer elastic theory [7]. Shafiee and Nassiri studied the effect of lateral wheel wander on the tensile and vertical strains at the bottom of a hot mix asphalt layer [8]. Chen and Song estimated the effect of an autonomous truck’s lateral distribution on the rutting depth and fatigue damage of flexible pavement by finite element analysis [9]. Noorvand and Karnati found that with the optimal wheel wander distribution in autonomous vehicles (AVs), the pavement service life can be potentially extended [10]. These studies highlighted that wheel wander has a significant influence on the pavement structure strain response and that obtaining the strain at the load position is important.
In practice, it is difficult to determine whether the wheels only pass above the position where the sensors are installed in instrumented pavement because of wheel wander, especially if a lateral-axis positioning system is not installed. This means that the strain measurements from the strain gauges are not always the desired values. Little research has been done on obtaining the strain at the load position. Current studies on this were mainly from the NCAT and the Minnesota Department of Transportation, both of which have test tracks. Initially, Willis and Timm defined the strain at the load location as the response that yielded the highest strain reading [11]. The 95th percentile of 450 readings was used to represent the “best-hit” response for the longitudinal strain in a subsequent study [12]. The Minnesota Department of Transportation (MN/DOT) developed a computer program for selecting peak dynamic sensor responses from pavement testing, but the load position strain was not mentioned in this report [13].
To address the issue described above, the objective of this study was to develop a mechanistic method for obtaining the strain at the load position without a lateral positioning system in instrumented pavement. One test section in the field with instrumentation was paved to carry out this research.

2. Proposal of the Mechanistic Method to Obtain Load Position Strain

2.1. Preliminaries

To measure the dynamic strain at the bottom of an asphalt layer, pavement is usually instrumented with strain gauges, as shown in Figure 1. At least two longitudinal gauges and two transverse strain gauges were installed at the bottom of asphalt layer in this study. The strain gauges were arranged in pairs on the wheel path to authenticate the data. To obtain more effective strain data, the lateral distance between the strain gauges should cover the wheel wander as much as possible. Many studies have reported that about 90% of the wheels pass within a lateral distance of 80 cm and that wheel wander obeys normal distribution [7,14,15]. Therefore, the recommended lateral distance between the strain gauges installed in pairs is at least 80 cm, so that as many wheels as possible pass between the two strain gauges.

2.2. Mechanistic Method to Obtain Load Position Strain

As pointed out earlier, the main factor of interest when designing a pavement structure and evaluating its fatigue performance is the load position strain at the bottom of the asphalt layer. Due to wheel wander, it is difficult to determine if the measured strains were exactly the strains at the load position. A mechanistic method was proposed to obtain the strain at load position by using the measured strains and the strain gauge arrangement shown in Figure 1. This mechanistic method correlated the theoretical strain with the measured strain. For flexible pavements, elastic multilayer theory is the most commonly used model to describe mechanical performances of pavement layers [16], so the theoretical strain was calculated based on the elastic multilayer theory in this paper.
The strain at the load position, εmlp, was obtained as follows.
Step 1. Gathering measured data.
When a vehicle wheel passed by, voltage signals from strain gauge were collected by a high-speed data acquisition system. Once the raw data was collected, it went through the processing stage where it was recognized by wheel axle type and was filtered to reduce noise by using data processing software, such as origin 2021 (OriginLab, Northampton, MA, USA) or the proposed method in previous study [17]. Then, the biggest amplitude of the waveform was chosen as the strain caused by the passing wheel load. Theoretically, the data points should all be strains in pairs based on the gauge array, but due to the variability of the field test conditions, there may be data points with only a single strain measurement or no data. Therefore, a data trimming process was performed to eliminate these data points for the calculations described below.
Step 2. Development of relationship between offset and ratio of paired strain gauges.
When the wheel load was at position i (i = 1,2,3 … n) between the paired gauges, as shown in Figure 2, the theoretical paired strains of the two gauges, ε 1 i and ε 2 i , were obtained using the BISAR3.0 software (a software developed by SHELL Company, Hague, The Netherlands based on elastic multilayer theory). The input parameters for BISAR3.0 mainly included each layer’s modulus, Poisson’s ratio, and thickness. Meanwhile, the offset, Di (from strain gauge 1 to the load position), was recorded.
The results of the strains and offsets were fit to a second-order polynomial:
D i = a 1 R i 2 + b 1 R i + c 1
R i = ε 1 i ε 2 i
where i is the load position, Di is the wheel offset in the theoretical calculation, i.e., the distance from strain gauge 1 to the load position i,  a 1 , b 1 , and c 1 are fitting coefficients, R i is the ratio of the theoretical paired strains, and ε 1 i and ε 2 i are the theoretical paired strains of strain gauges 1 and 2 when the load is at position i, respectively.
Step 3. Field offset calculation.
The field offset was obtained by substituting the ratio of the paired strains measured in Step 1 into the regression equation in Step 2:
R m = ε m 1 ε m 2
where R m is the ratio of the measured paired strains, and ε m 1 and ε m 2 are the measured paired strains of strain gauges 1 and 2 in Step 1.
Step 4. Development of relationship between offset and ratio of strain at strain gauge 1 to load position strain.
The ratio of strain gauge 1 to the load position strain, R i l p , can be obtained using the theoretical strain ε m 1 obtained in Step 2 and ε l p :
R i l p = ε 1 i ε l p
where R i l p is the ratio of strain gauge 1 to the load position strain when the load is at position i, ε 1 i is the theoretical strain of gauge 1 when the load is at position i, and ε l p is the theoretical load position strain, calculated by BISAR3.0.
The results of R i l p and the offsets were also fitted with a second-order polynomial:
R i l p = a 2 D i 2 + b 2 D i + c 2
where a 2 , b 2 , and c 2 are fitting coefficients.
Step 5. Load position strain calculation.
The ratio of the strain measured at gauge 1 to the load position strain, R m l p , can be calculated by inserting the field offset from Step 3 into the regression function from Step 4. The load position strain can then be calculated as follows:
ε m l p = ε m 1 R m l p
where R m l p is the measured ratio of the strain at gauge 1 to the load position strain, and ε m l p is the load position strain in the field.

3. Verification of Proposed Method in the Field
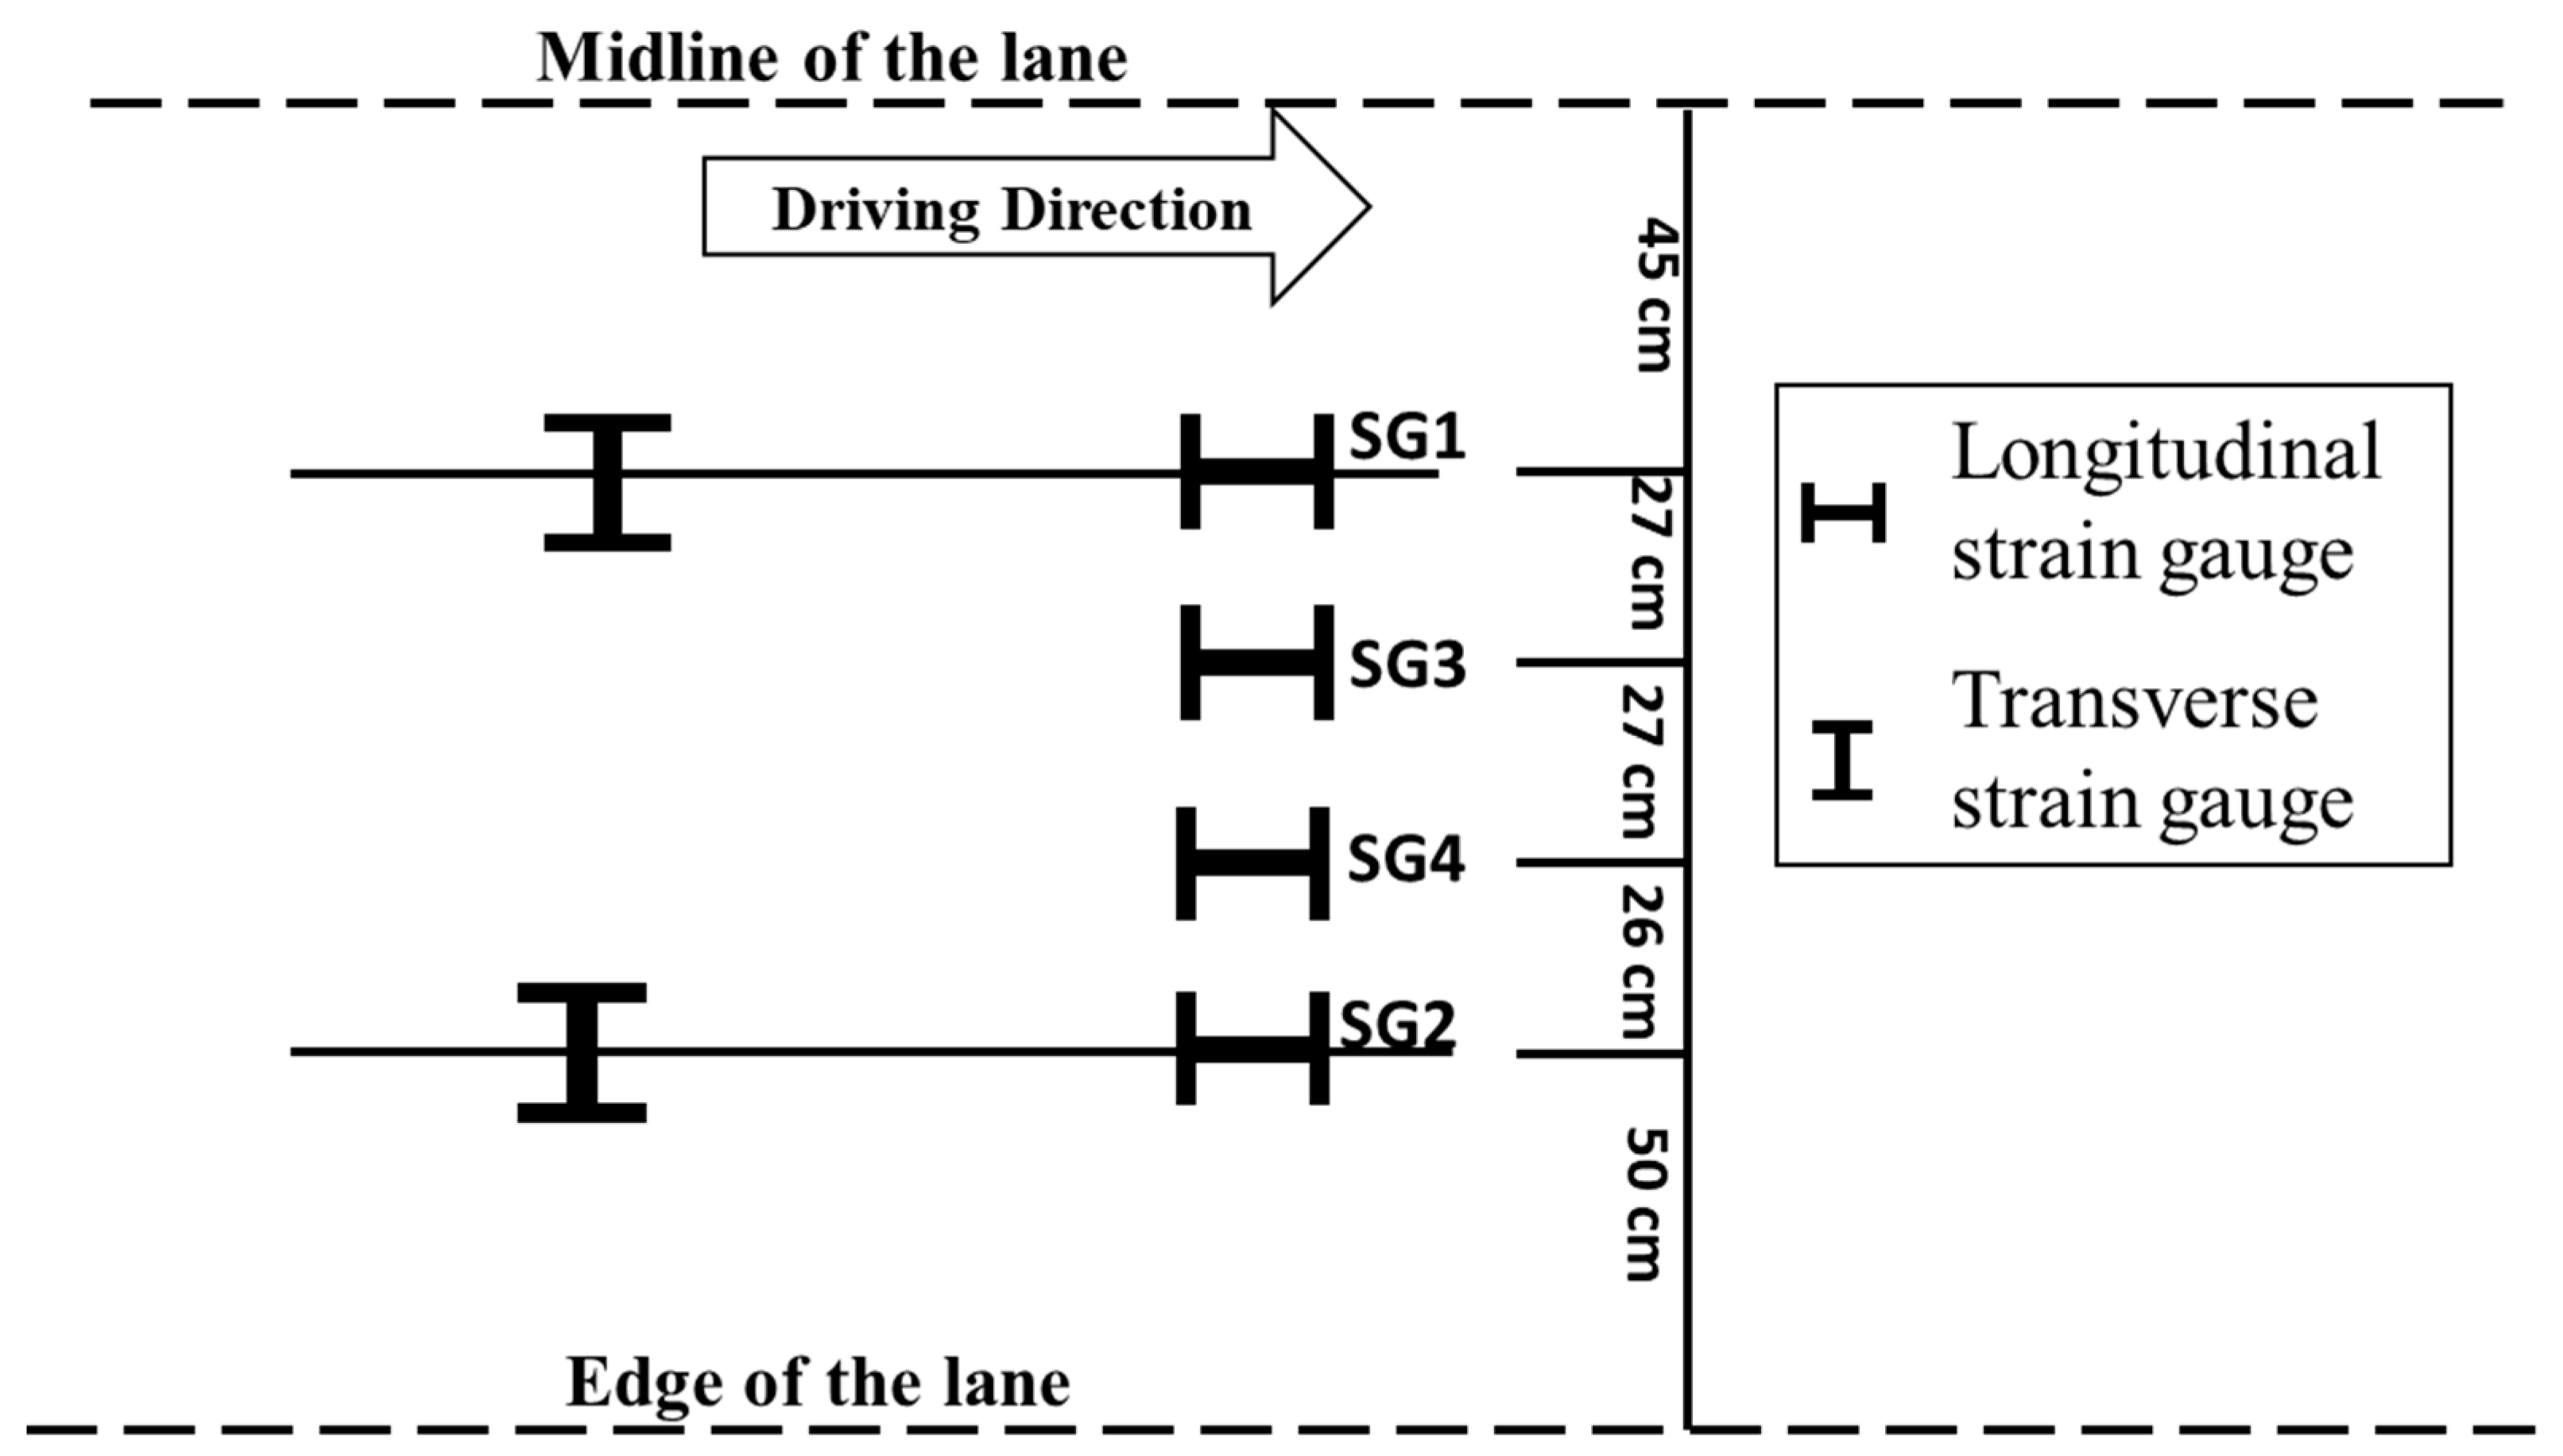
3.1. Test Plan

A test section located in Qinglin Road, Shandong Province, China was established for evaluating the performance of the full-depth asphalt pavement structure. Verification of the proposed method was part of the objective. As shown in Figure 3, the whole thickness of the section was 68 cm, with a 48 cm thick asphalt layer. Four longitudinal asphalt gauges were installed at the bottom of the asphalt layer, as shown in Figure 4. Compared with Figure 1, two more gauges were added to increase the amount of data and verify the method.
During the test, a vehicle with a standard axle weight was driven on a fine sand-covered road surface to record the offset. The vehicle was driven six times for each offset position. Given that 90% of the wheels passed within the paired strain gauges (as mentioned in Section 2.1), the horizontal position of SG1 was defined as the initial position, i.e., the position at which the wheel offset was 0. The speed of the vehicle was 80 km/h. Meanwhile, the dynamic strains of the strain gauges were collected for each offset. Table 1 and Table 2 present the results of the manually recorded offsets and the dynamic strains.

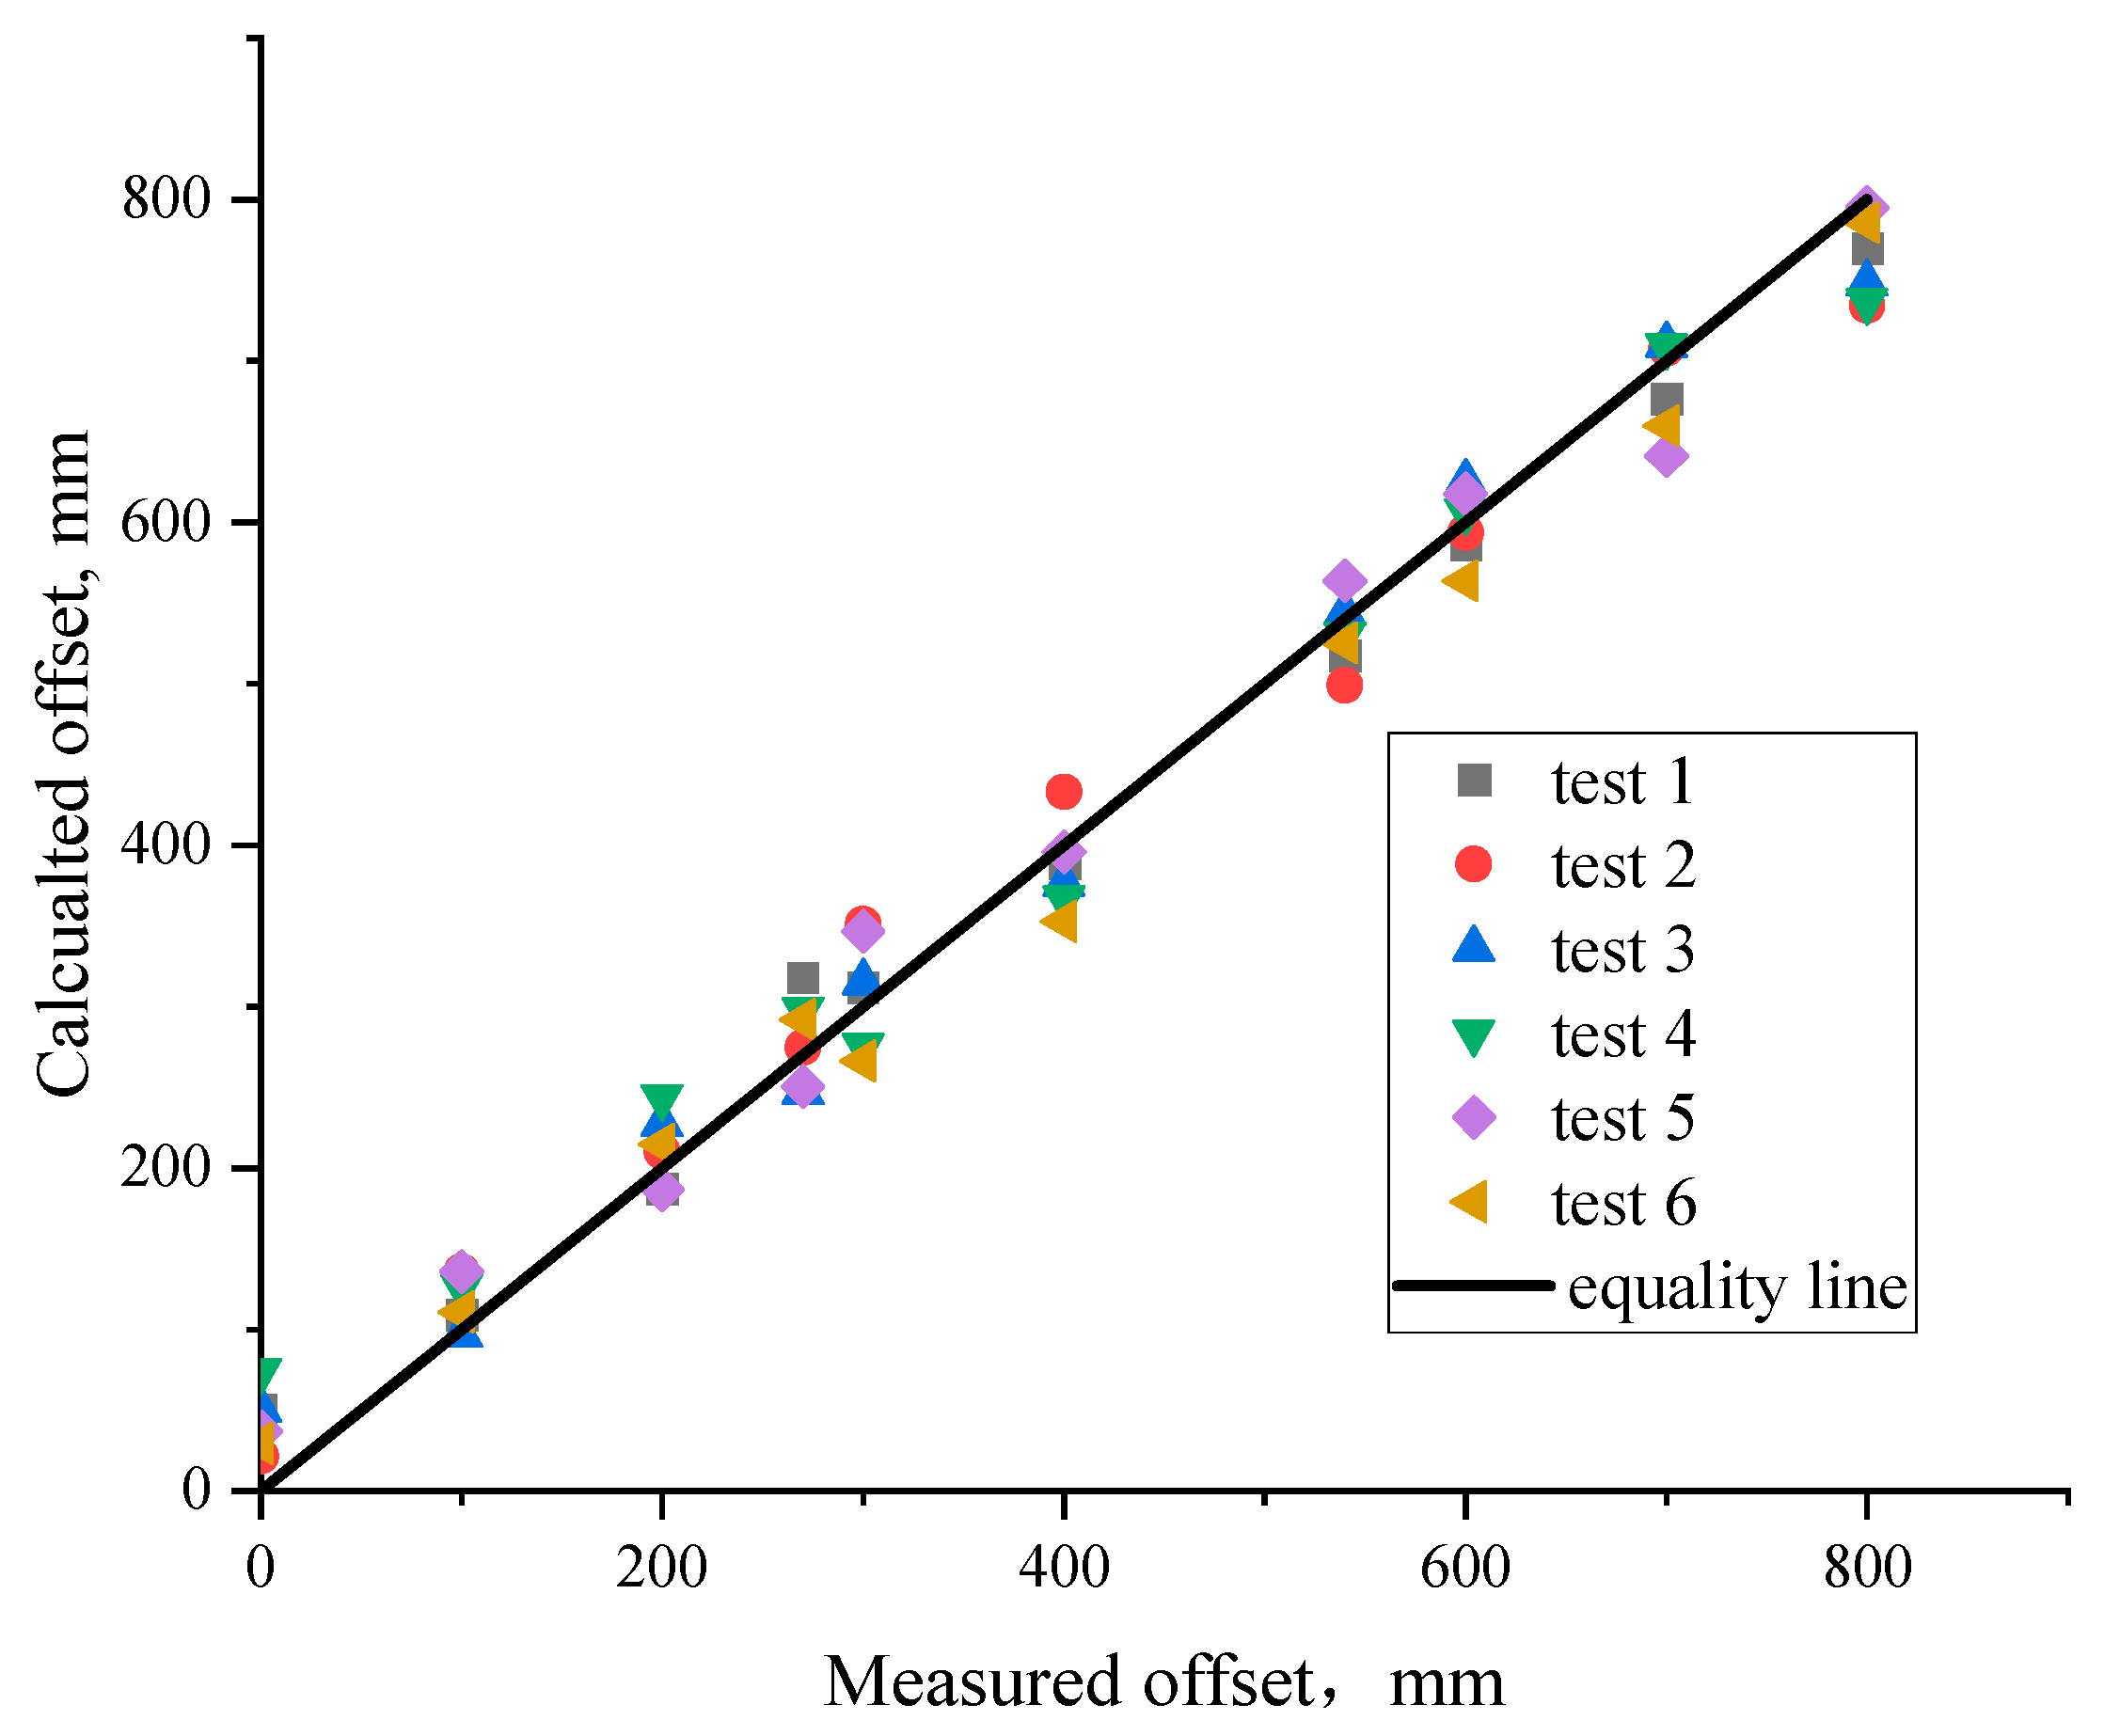
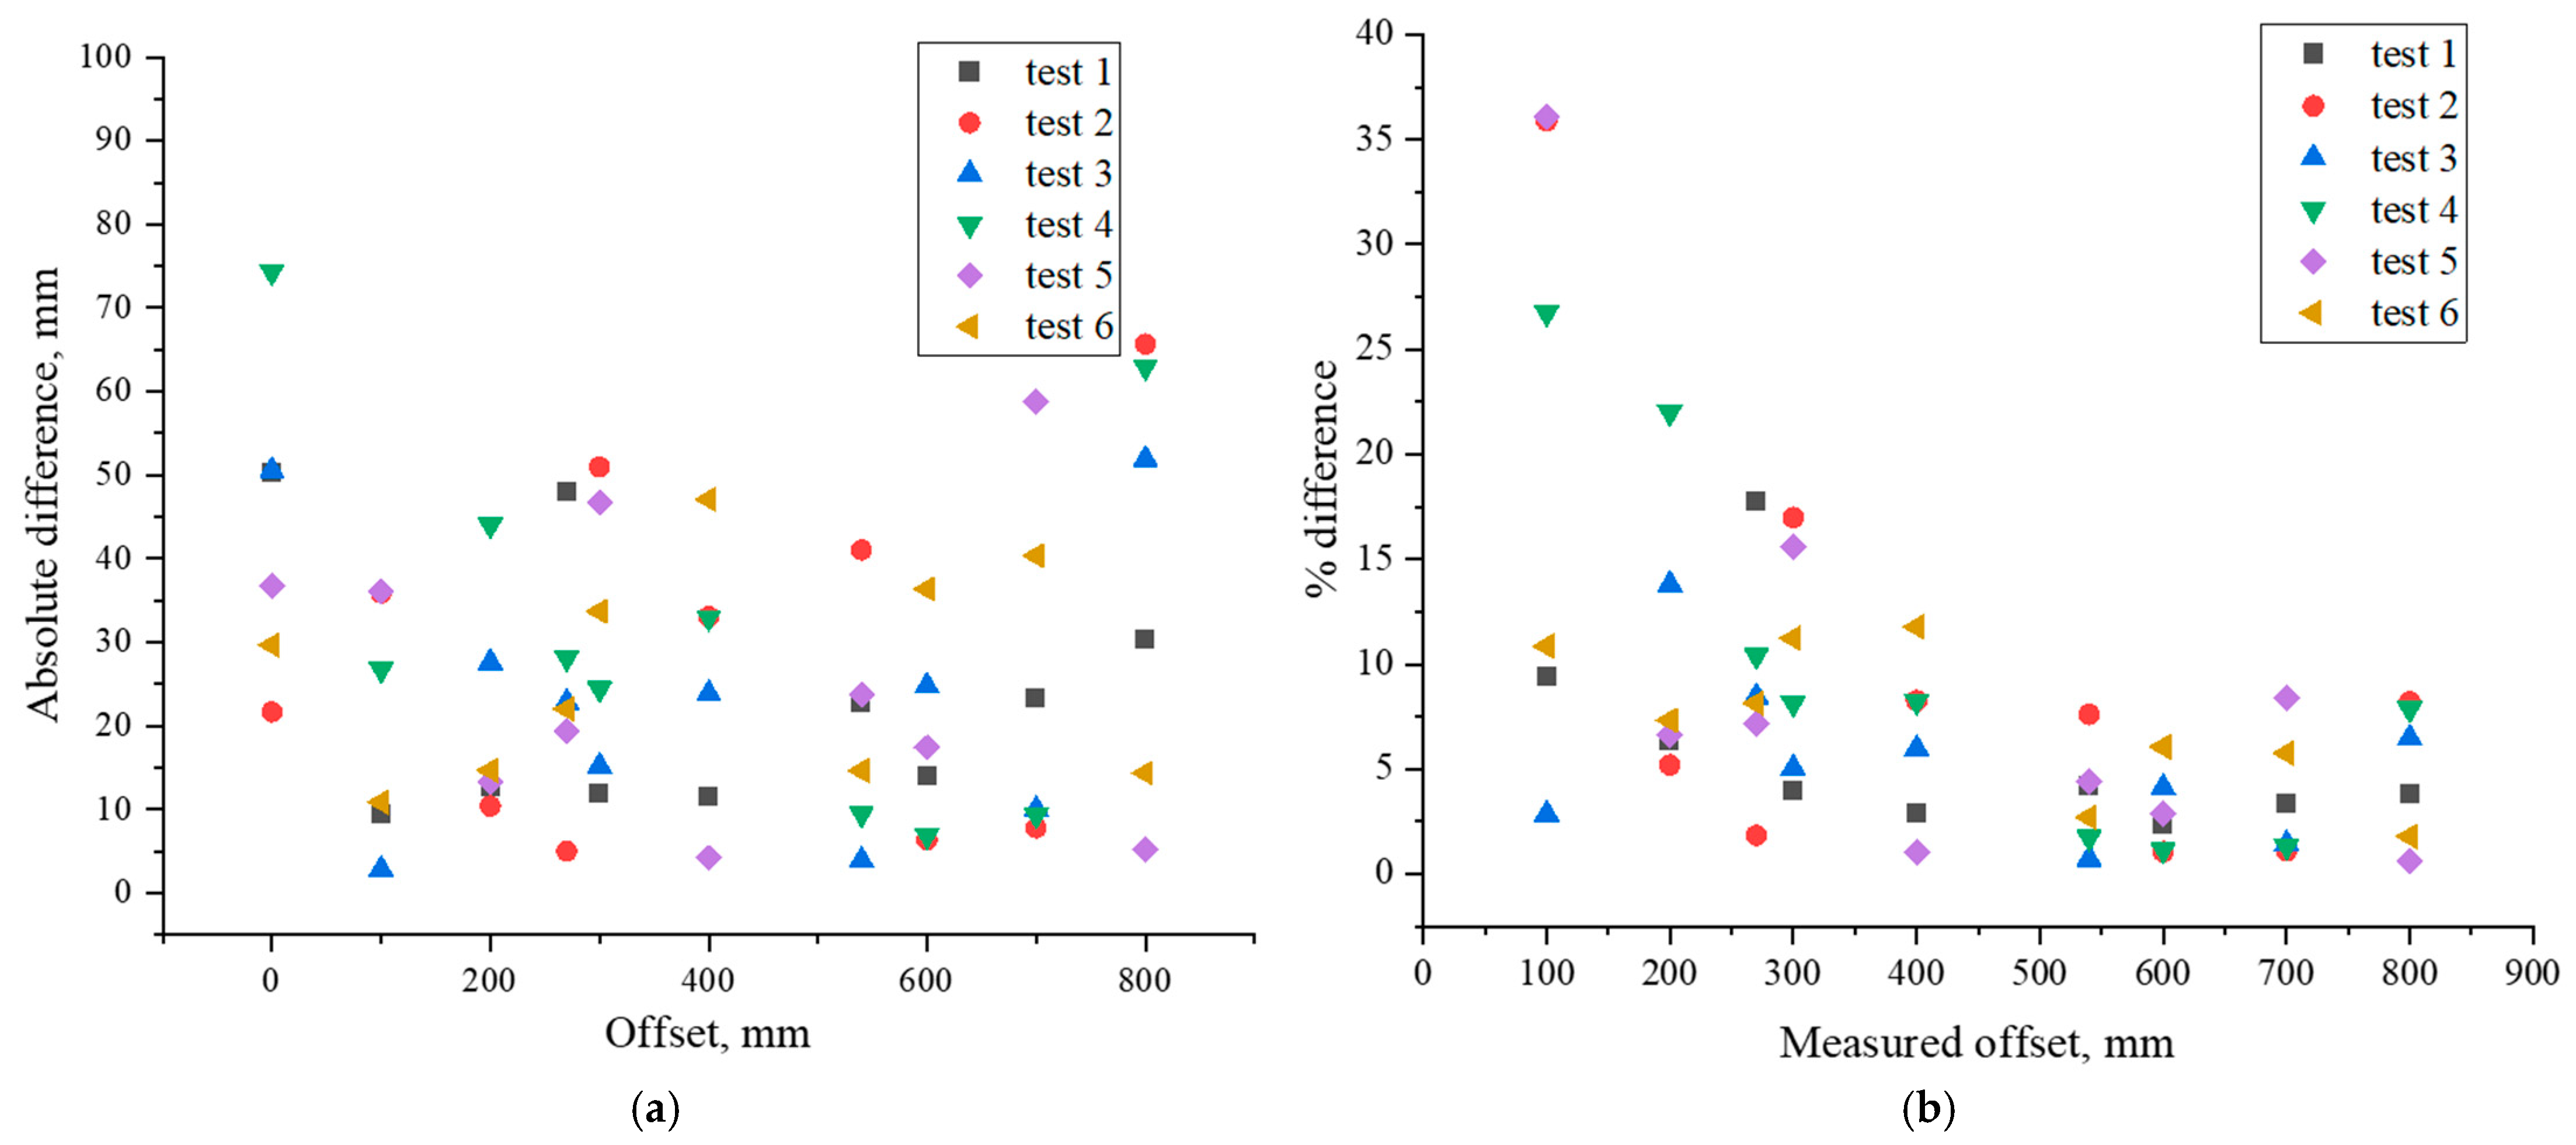
3.2. Offset Verification

By following Steps 1 and 3 of the proposed method, the relationship between the offset and ratio of the paired strain gauges was established. First, the theoretical paired strains (SG1 and SG2) with different offsets were calculated by BISAR 3.0. The structural input parameters of the test section are shown in Table 3. The results of the strains and offsets were fit to a second-order polynomial, and the resulting regression equation is as follows:
D i = 279.22 R i 2 1348.1 R i + 1479.4
The measured paired strains in the field then were inserted into Equation (7) to obtain the field offset.
Figure 5 shows that the values calculated using the proposed method compared favorably to the measured values. The data points were evenly distributed on both sides of the parity line and were close to it. To further qualify the accuracy of the proposed method, the absolute difference and percent difference (%difference) between the measured and calculated offsets were investigated. The percent difference was calculated as follows:
% difference = ( offset measured offset calculated offset measured ) × 100
As shown in Figure 6 and Figure 7, the range of the absolute difference was 5–60 mm, which should be viewed as fairly small. Most of the %difference values were in the range of 2–17%. The %difference decreased as the offset increased, because the offset is in the denominator in Equation (8). A one-way analysis of variance was performed on the measured and calculated offsets, and results showed that there was no significant difference between the two in Table 4.

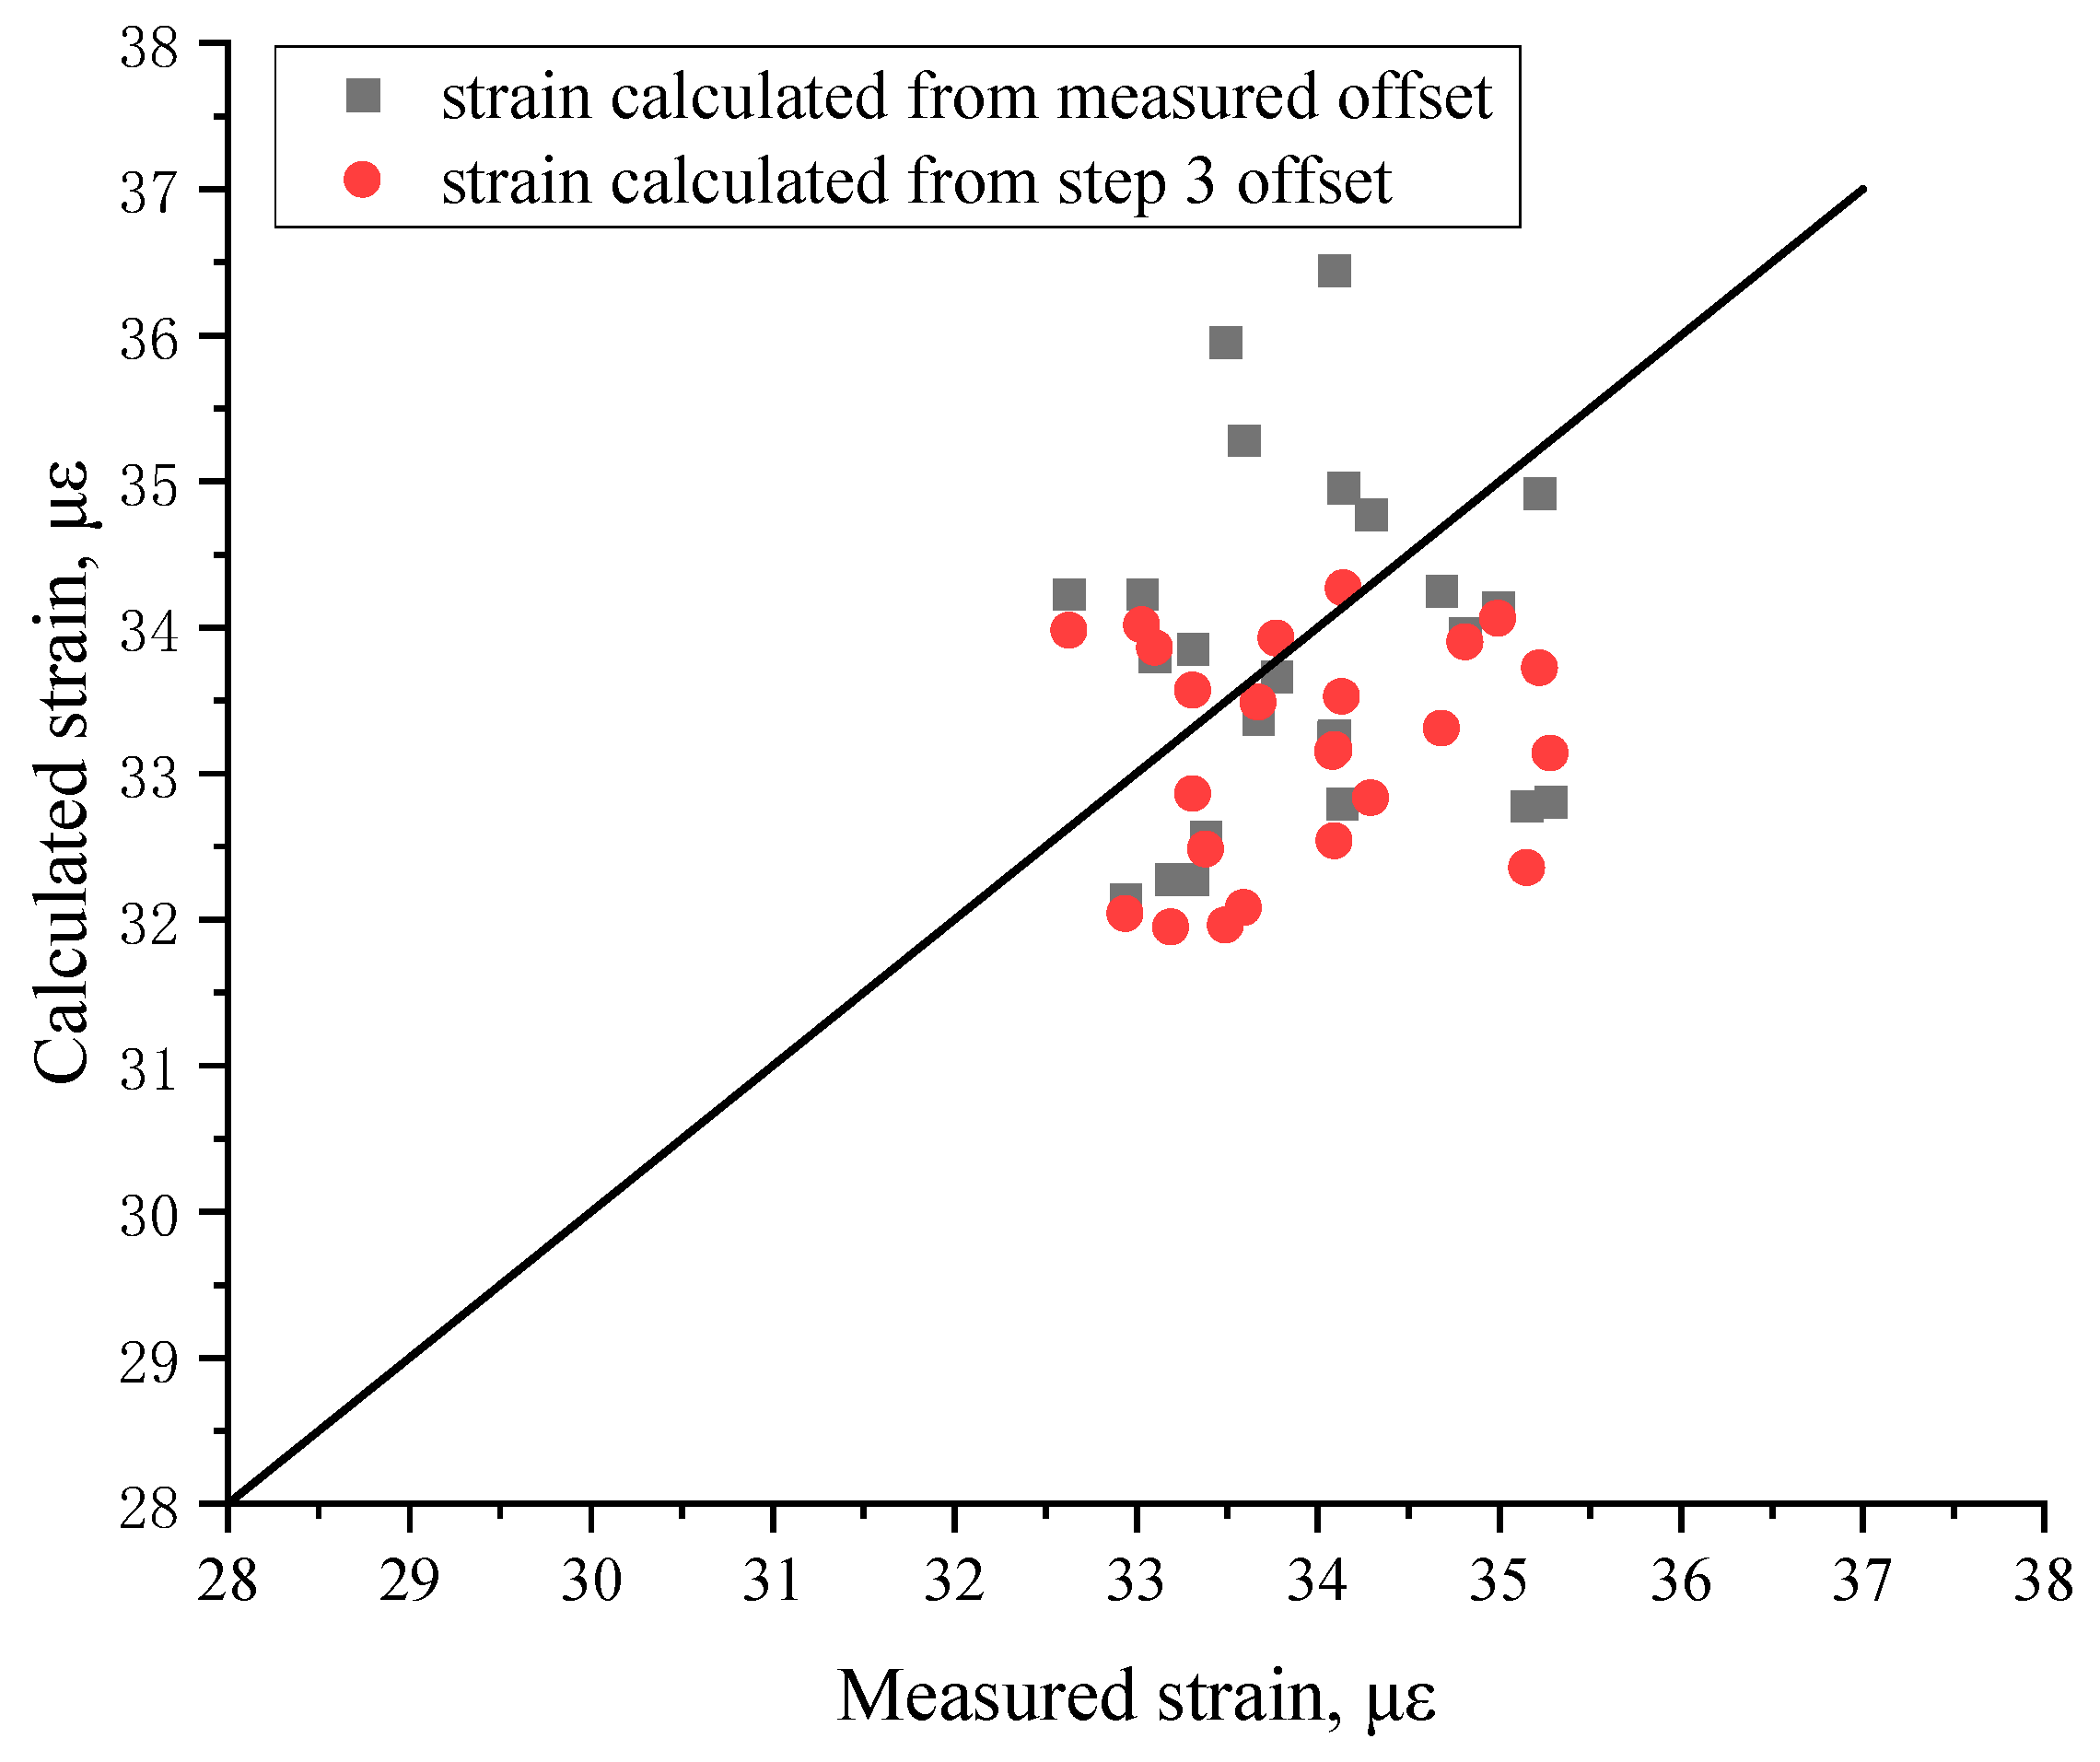
3.3. Load Position Strain Verification

Following Steps 4 and 5, the offset and ratio of the theoretical strain at gauge 1 to the load position strain were fit to a second-order polynomial, and the regression formula is as follows:
R i l p = 8 × 10 7 D i 2 + 10 4 D i + 1.025
The measured and calculated offsets from Step 3 when the vehicle passed directly above strain gauges SG1, SG2, SG3, and SG4 were inserted into the above equation to obtain the ratio of the strain at gauge 1 to the load position strain. In the last step, the load position strain was obtained by Equation (6).
Figure 7 shows that the calculated strains from the Step 3 offsets and the measured offsets were close to the parity line. The absolute and %differences between the measured and calculated strains were also calculated, and the results are shown in Figure 8. The ranges of the differences between the measured strains and those calculated from the offset were 0.5–2.5 με for the absolute difference and 0.5–16% for the %difference. From the perspective of the absolute difference and %difference, the strains calculated from the measured offset were slightly more accurate than those from the Step 3 offset, but a one-way analysis of variance showed there was no significant difference between the three strain acquisition methods (Table 5). It should be noted that the strain at the load position cannot be calculated by the measured offset in practice, because the pavement surface is not covered by fine sand.

4. Application of the Proposed Method

After the test section was opened to traffic, the strain at the bottom of the asphalt layers under the standard load was collected at 2 pm each day from April to July. As mentioned earlier, these strains were not always the load position strains due to wheel wander. The proposed method was used to obtain the load position strain.
Figure 9 illustrates the strains directly measured from the strain gauges and the strains at the load position obtained from the proposed method. The stains from the strain gauges did not show a tendency to gradually increase with temperature. Most of the strains captured by SG1 were greater than those captured by SG2, which means most of the wheels were closer to SG1 as they passed between the two gauges. As expected, the load position strains calculated from the proposed method showed a good correlation with temperature, which showed that this method maintained a good consistency in the verification test.

5. Discussion

The primary objective of this research was to propose a method to obtain load position strain. Using the sensors array, the relationship between the two theoretical strains from sensors and wheel offset was established. The theoretical strains were calculated from BISAR 3.0 based on the elastic multilayer theory. In fact, other mechanical response calculation software like WESLEA also can be used to calculate the response [18,19]. Then the theoretical strain was replaced by the measured strain in the field to obtain the offset and load position strain in field.
The proposed method was verified by a test section with the installation of sensors. The results of verification show that there is no significant difference between calculated and measured strains, and this can be viewed the proposed method is feasible. Then the method was applied to the load position strain acquisition for four months in practical and the result shows that strain has a good correlation with temperature. This is consistent with the most previous studies [3,7,20,21].
At last, the applicability of the proposed method in other pavement structures needs to be further explored, because only one test structure was used for the verification. One of the possible reasons is that the second-order polynomial model may be not suitable for the establishment of the relationship between strain ratio and offset in other pavement structure.

6. Conclusions

This paper proposed a mechanistic method that can help obtain load position strain at the bottom of asphalt layer in instrumented pavement when the lateral axis position system is not installed. Based on the proposed method and the verification process, the following conclusions were drawn:
  • The proposed method was based on the elastic multilayer theory and correlated the theoretical strain with the measured strain by a second-order polynomial model. It allows the calculation of the load position stain without installation of lateral position system in instrumented pavement.
  • In the proposed method, it was recommended that at least two gauges should be installed into the pavement with the lateral space 80 cm at least to cover the wheel wander range.
  • The result of the verification shows that the ranges of the differences between the measured strains and those calculated from the offset were 0.5–2.5 με for the absolute difference and 0.5–16% for the %difference. The one-way analysis of variance showed there is no significant difference between the measured and calculated from the proposed method.
  • The result of the application shows that load position strain calculated from proposed method has a good correlation with temperature which means this method maintains a good consistency with the results of verification.
  • Due to the limited validation and application data, the applicability of this method in other pavement structures needs to be further verified.

Author Contributions

G.H., J.W. and W.H. (Wenyang Han) proposed the method. G.H. and J.W. designed the experiments. W.H. (Wenyang Han) D.W. and W.C. performed the experiments. G.H., X.Z. and D.W. analyzed the data. W.H. (Wenjun Hu), G.H. and W.H. contributed model establishment. G.H. and W.H. (Wenyang Han) wrote the paper. G.H. and J.W. revised the paper. All authors have read and agreed to the published version of the manuscript.

Funding

This research was funded by the Shandong Provincial Natural Science and Foundation, grant number ZR2020QE272, the Shandong Province Higher Educational Science and Technology Program, grant number J18KA216, the Shandong Jianzhu University Doctoral research foundation, grant number X18073Z and the Science and technology innovation project of Shandong Provincial Department of industry and information technology, grant number 202160101777.

Institutional Review Board Statement

Not applicable.

Informed Consent Statement

Not applicable.

Data Availability Statement

Not applicable.

Conflicts of Interest

The authors declare no conflict of interest.

References

  1. Timm, D.H.; Priest, A.L.; McEwen, T.V. Design and Instrumentation of the Structural Pavement Experiment at the NCAT Test Track. Report No. 04-01; National Center for Asphalt Technology, Auburn University: Auburn, AL, USA, 2004. [Google Scholar]
  2. Selvaraj, S.I. Review on the Use of Instrumented Pavement Test Data in Validating Flexible Pavement Mechanistic Load Response Models. In Proceedings of the 8th International Conference on Traffic and Transportation Studies, Changsha, China, 1–3 August 2012. [Google Scholar]
  3. Al-Qadi, I.L.; Loulizi, A.; Elseifi, M.; Lahouar, S. The Virginia Smart Road: The impact of pavement instrumentation on understanding pavement performance. J. Assoc. Asph. Paving Technol. 2004, 73, 427–465. [Google Scholar]
  4. Nur, H.E.I.; Singh, D.; Musharraf, Z.P.E. Dynamic Modulus-based Field Rut Prediction Model from an Instrumented Pavement Section. Procedia-Soc. Behav. Sci. 2013, 104, 129–138. [Google Scholar]
  5. Asefzadeh, A.; Hashemian, L.; Bayat, A. Fatigue Life Evaluation of Pavement Embankments made with Tire Derived Aggregates. Can. J. Civ. Eng. 2018, 45, 795–802. [Google Scholar] [CrossRef]
  6. Solanki, P.; Zaman, M.; Muraleetharan, K.K. Field Performance Monitoring and Modeling of Instrumented Pavement on I-35 in McClain County—Construction and Instrumentation Report; School of Civil Engineering and Environmental Science, University of Oklahoma: Norman, OK, USA, 2008. [Google Scholar]
  7. Timm, D.H.; Priest, A.L. Wheel Wander at the NCAT Test Track (No. 05–02); National Center for Asphalt Technology: Auburn, AL, USA, 2005. [Google Scholar]
  8. Shafiee, M.H.; Nassiri, S.; Eng, P.; Bayat, A. Field investigation of the effect of operational speed and lateral wheel wander on flexible pavement mechanistic responses. In Proceedings of the Transportation 2014: Past, Present, Future—2014 Conference and Exhibition of the Transportation Association of Canada, Montreal, QC, Canada, 28 September–October 2014. [Google Scholar]
  9. Chen, F.; Song, M.; Ma, X.; Zhu, X. Assess the impacts of different auftonomous trucks’ lateral control modes on asphalt pavement performance. Transp. Res. Part C. Emerg. Technol. 2019, 103, 17–29. [Google Scholar] [CrossRef]
  10. Noorvand, H.; Karnati, G.; Underwood, B.S. Autonomous vehicles: Assessment of the implications of truck positioning on flexible pavement performance and design. Transp. Res. Rec. 2017, 2640, 21–28. [Google Scholar] [CrossRef]
  11. Willis, J.R.; Timm, D.H. Repeatability of Asphalt Strain Measurements Under Full-Scale Dynamic Loading. J. Transp. Res. Board 2008, 2087, 40–48. [Google Scholar] [CrossRef]
  12. Timm, D.H.; Robbins, M.M.; Willis, J.R.; Tran, N.; Taylor, A.J. Field and Laboratory Study of High-Polymer Mixtures at the NCAT Test Track Interim Report; National Center for Asphalt Technology: Auburn, AL, USA, 2012. [Google Scholar]
  13. Burnham, T.R.; Tewfik, A.; Srirangarajan, S. Development of a Computer Program for Selecting Peak Dynamic Sensor Responses from Pavement Testing; Minnesota Department of Transportation: Saint Paul, MN, USA, 2007.
  14. Benekohal, R.F.; Hall, K.T.; Miller, H.W. Effect of lane widening on lateral distribution of truck wheels. Transp. Res. Rec. 1990, 1286, 57–66. [Google Scholar]
  15. Buiter, R.; Cortenraad, W.M.; Van Eck, A.C.; Van Rij, H. Effects of Transverse Distribution of Heavy Vehicles on Thickness Design of Full-Depth Asphalt Pavements. Transp. Res. Rec. 1989, 1227, 66–74. [Google Scholar]
  16. Bruno, S.; Del Serrone, G.; Di Mascio, P.; Loprencipe, G.; Ricci, E.; Moretti, L. Technical Proposal for Monitoring Thermal and Mechanical Stresses of a Runway Pavement. Sensors 2021, 21, 6797. [Google Scholar] [CrossRef] [PubMed]
  17. Han, H.; Han, W.; Ma, S.; Hu, G. Enhanced Processing of Low Signal-to-Noise-Ratio Dynamic Signals from Pavement Testing. Measurement 2021, 182, 109697. [Google Scholar] [CrossRef]
  18. Mazumder, M.; Kim, H.; Lee, S.J. Perpetual Pavement: Future Pavement Network. J. Adv. Constr. Mater. 2015, 19, 1. [Google Scholar]
  19. Van Cauwelaert, F.J.; Lequeux, D. Computer Programs for the Determination of stresses and Displacements in four Layered Structures; Water Experiment Station, U.S. Army Corps of Engineers: Vicksburg, MS, USA, 1986.
  20. Yang, Y.; Wei, J.; Lin, W.; Timm, D.; Huber, G. Binzhou Perpetual Pavement Test Road Dynamic Response of Pavement Under Very Heavy Loads. Int. J. Road Mater. Pavement Des. 2009, 10, 151–166. [Google Scholar] [CrossRef]
  21. Yang, Y.S.; Wang, L.; Wei, J.C.; Ma, S.J. Typical Pavement Structure Dynamic Response Data Collection and Analysis under Heavy Vehicle Loading. J. Highw. Transp. Res. Dev. 2010, 27, 10–16. [Google Scholar]
Figure 1. Strain gauge array.
Coatings 12 00014 g001
Figure 2. Different offsets of the wheel load.
Coatings 12 00014 g002
Figure 3. Structure of test section.
Coatings 12 00014 g003
Figure 4. Strain gauge array of the test section.
Coatings 12 00014 g004
Figure 5. Calculated offset vs. measured offset.
Coatings 12 00014 g005
Figure 6. Difference between calculated and measured offsets: (a) absolute difference and (b) percent difference (%difference).
Coatings 12 00014 g006
Figure 7. Calculated strain vs. measured strain.
Coatings 12 00014 g007
Figure 8. Difference between calculated and measured strains: (a) absolute difference and (b) %difference.
Coatings 12 00014 g008
Figure 9. Load position strain calculated from proposed method with different temperatures from April to July.
Coatings 12 00014 g009
Table 1. Dynamic strains with manually recorded offsets for offset verification.
Dynamic Strain, με
Test
Number
123456
Strain GaugeSG1SG2SG1SG2SG1SG2SG1SG2SG1SG2SG1SG2
Offset, mm034.0921.6934.8121.2934.0821.6932.9421.6433.3820.8534.9921.64
10034.2023.5233.9124.1234.3623.2632.7423.0234.5224.5635.2124.26
20034.0625.8333.9226.4733.6626.8332.5226.4533.9525.7332.4825.48
27032.0728.5733.5928.3834.0127.7732.6028.3434.0127.8933.4528.86
30033.2729.4232.8630.5032.7529.0833.1128.0032.4529.9634.0428.46
40032.1931.3131.6432.5631.4130.0832.5430.8130.4129.8532.2730.02
54029.5633.9529.5333.1028.2233.5928.6333.4727.7333.9127.7232.18
60026.4333.3327.0134.4325.8634.4526.5934.5326.3734.7626.6732.61
70023.7734.1622.9734.6122.5834.1423.2435.1025.0634.1823.4532.86
80020.6234.2921.3233.4920.9233.5921.6134.0919.1433.1920.3134.68
Table 2. Dynamic strains with manually recorded offsets for load position strain verification.
Offset, mmStrain GaugeTest Number
123456
Load Position Strain, με
0SG134.0934.8134.0832.9433.3834.99
27SG333.3133.1032.6335.2833.0333.77
54SG434.1435.2233.6733.3134.1335.15
80SG234.2933.4933.5934.0933.1934.68
Table 3. Input parameters of the test section for BISAR 3.0.
Pavement StructureMaterialsThickness, cmModulus, MPaPoisson’s Ratio
Surface courseSMA-13487000.25
Upper binder courseAC-20890000.25
Lower binder courseAC-253698000.25
Base courseCement stabilized crush stones2012,0000.25
SubgradeCompacted subgrade-600.4
Table 4. Results of one-way analysis of variance between calculated and measured offsets.
Degrees of FreedomSum of SquaresMean SquareF ValueProb > F
Model179.2978579.297850.001340.97084
Error1186,970,853.42559,075.03--
Sum1196,970,932.723---
Table 5. Results of one-way analysis of variance between calculated and measured offsets.
Degrees of FreedomSum of SquaresMean SquareF ValueProb > F
Model24.228622.114312.535450.08659
Error6957.539060.8339--
Sum7161.76768---
Publisher’s Note: MDPI stays neutral with regard to jurisdictional claims in published maps and institutional affiliations.

