Article

Novel Structures of Functionalized Graphene Oxide with Hydrazide: Characterization and Bioevaluation of Antimicrobial and Cytocompatibility Features

by
Irina Zarafu
1,*,
Carmen Limban
2,
Cristiana Radulescu
3,4,*,
Ioana Daniela Dulama
4,*,
Diana Camelia Nuta
2,
Cornel Chirita
5,
Mariana Carmen Chifiriuc
6,7,8,
Carmellina Daniela Badiceanu
2,
Marcela Popa
6,7,
Coralia Bleotu
6,7,9,
Laura Denisa Dragu
7,9,
Raluca Maria Stirbescu
4,
Ioan Alin Bucurica
4,*,
Sorina Geanina Stanescu
4 and
Petre Ionita
1
1
Department of Organic Chemistry, Biochemistry and Catalysis, Faculty of Chemistry, University of Bucharest, 050663 Bucharest, Romania
2
Department of Pharmaceutical Chemistry, University of Medicine and Pharmacy “Carol Davila”, 020956 Bucharest, Romania
3
Faculty of Sciences and Arts, Valahia University of Targoviste, 130004 Targoviste, Romania
4
Institute of Multidisciplinary Research for Science and Technology, Valahia University of Targoviste, 130004 Targoviste, Romania
5
Department of Pharmacology and Clinical Pharmacy, University of Medicine and Pharmacy “Carol Davila”, 020956 Bucharest, Romania
6
Faculty of Biology, University of Bucharest, 060101 Bucharest, Romania
7
Life, Environmental and Earth Sciences Division, Research Institute of the University of Bucharest (ICUB), University of Bucharest, 060023 Bucharest, Romania
8
Academy of Romanian Scientists, 050044 Bucharest, Romania
9
“Stefan S. Nicolau” Institute of Virology, Romanian Academy, 030304 Bucharest, Romania
*
Authors to whom correspondence should be addressed.
Coatings 2022, 12(1), 45; https://doi.org/10.3390/coatings12010045
Submission received: 28 October 2021 / Revised: 23 December 2021 / Accepted: 28 December 2021 / Published: 31 December 2021
(This article belongs to the Special Issue Surface Modification of Nanostructured Materials)

Abstract

:
Graphite was oxidized to graphene oxide and activated by thionyl chloride, for further covalently linking three hydrazides with potential biological activity. The obtained materials were characterized by scanning electron microscopy with energy dispersive spectroscopy, Fourier-transform infrared and Raman spectroscopies. The presence of various functional groups specific to graphene oxide (GO) functionalized with different hydrazides was confirmed by spectral data. The ratio between D- and G-bands, observed in Raman spectra, allowed for an evaluation of the disorder degree and the mean crystallite size of the samples. The micrographs highlighted that the samples lead to the occurrence of disorders, probably caused by the sp3 carbons, the formation of oxygen-containing functional groups in the basal planes, and by various structural defects. The new graphene oxide–hydrazide derivatives were tested for their antimicrobial and cytotoxicity activity. Their antimicrobial activity against planktonic and biofilm-embedded cells was inferior to that of free hydrazides, except for GO-3 against planktonic Escherichia coli and GO-2 against Pseudomonas aeruginosa biofilm, demonstrating that further optimization is needed to be able to exploit the huge potential of GO for developing potent antimicrobials.

1. Introduction

The rising prevalence of multi-drug resistant microbial infections has become a serious health care problem. For this reason, the search for new antimicrobial drugs will remain a challenging task for medicinal chemistry. In the search for materials with improved biological activity, one of the major options is the association, through different physicochemical processes, of well-known antibacterial agents with various inert materials, like silica [1], cellulose [2], nanoparticles (including graphene) [3], gold nanoparticles, [4] and so on. In this paper, we report the synthesis, characterization, and antimicrobial activity of obtaining novel graphene oxide–hydrazide derivatives, combining the same multiple-molecule pharmacologically active compounds with previously demonstrated antimicrobial potential. Graphene oxide is a 2D material that can be easily obtained in large amounts, has a low toxicity, and, according to previous studies, might exhibit an inherent antibacterial effect. Graphene oxide (under the name of graphitic oxide) has been known since 1958 [5], but only later was graphene (the reduced form of graphene oxide) fully characterized and its astonishing properties were discovered [6]. Graphene oxide is an insoluble material of nanometric size harboring a large number of hydrophilic, oxygen- containing groups, like carboxyl, keto, hydroxyl, and epoxy, allowing for easy functionalization by different means, including covalent binding. Recent studies show that graphene oxide-based materials, due to their high porosity and surface area, may facilitate the microbial adherence and further development of microbial biofilms [7,8]. This could have positive consequences in both the biotechnological and bioremediation fields [9,10,11,12], or a negative impact for the biomedical field, taking into account that the biofilm cells can be up to 1000–4000 times more resistant than their planktonic counterparts.
Hydrazides are a well-known class of biologically active organic compounds, in which at least one hydrogen atom of hydrazine is replaced by an acyl group, the most well known being the tuberculostatic agent isoniazid (isonicotinic acid hydrazide, INH; pyridine-4-carbohydrazide) [13,14,15,16,17,18,19]. The hydrazide chain seems to be an attractive pharmacophore in medicinal chemistry, especially for the development of novel antimicrobials [20]. It has been shown that the presence of certain structural fragments in hydrazide molecules as substituents influences the biological and pharmacokinetic properties of these compounds. For example, the hydrazides bearing benzimidazole and thiophene nuclei in their structure exhibited large-spectrum antimicrobial activities against methicillin-resistant Staphylococcus aureus, Bacillus subtilis, Micrococcus luteus, Escherichia coli, Shigella dysenteriae, Pseudomonas aeruginosa, and Eberthella typhosa [21]. The presence of a long-chain alkyl group in the case of N′2,N′5-bis((1-decyl-1H-benzoimidazol-2-yl)methyl)-3,4-dimethylthiophene-2,5-dicarbohydrazid increased anti-Staphylococcus aureus activity, probably by increasing the lipophilicity, which makes it easier to penetrate the bacterial cell membrane.
The sulfonamide group is present in the structure of compounds with antimicrobial, as well as other biological properties, such as diuretics [22,23], anticonvulsants [24], or carbonic anhydrase inhibitors [25]. The 4-(benzensulfonamido)benzoic acid hydrazide was used as an intermediate compound in the synthesis of pharmacologically active N-[4-[(phenylcarbamoyl)amino]phenyl]benzenesulfonamide derivatives [26]. The 2-furancarboxylic acid hydrazide was the key intermediate for the synthesis of a new Pd complex with antibacterial activity [27].
Quinazolin-4-ones are the building blocks of many natural and synthetic products that have a wide range of biological activities. The stability of the quinazolin-4-one nucleus allows the introduction of several bioactive moieties in different positions to synthesize new potential therapeutic agents [28]. The 2-(2-methyl-4-oxoquinazolin-3(4H)-yl)-acetohydrazide exhibited bioactivity and low genotoxicity in the Triticum assay [29].
This study reports the synthesis of new architectures of graphene oxide–hydrazide derivatives and the evaluation of their influence on the growth of free planktonic microorganisms and biofilm-embedded cells. Although these new compounds are derivatives of known graphene oxide structures, the evaluation of their antimicrobial features against E. coli, P. aeruginosa, S. aureus, and Enterococcus faecalis planktonic cells and biofilms has not been reported before.

2. Materials and Methods

All chemicals and reagents for synthesis and analyses were purchased from commercial suppliers (MilliporeSigma, Burlington, MA, USA and Chimopar, Bucharest, Romania, respectively) and were of the highest available purity.

2.1. Synthesis of Graphene Oxide

Graphene oxide was synthesized by the well-known Hummers method, with slight modification [5,30,31,32,33]. This method was chosen because it is the fastest and most scalable, and provides good quality products. The preparation technique involves oxidation of graphite powder with strong oxidant potassium permanganate (KMnO4) in concentrated sulfuric acid (H2SO4), producing a dark-yellow-to-brown powder with high yields. The degree of oxidation is quite high, providing a lot of carboxyl groups required in the next step. Thus, under external ice-cooling, 5 g of graphite and 2.5 g of sodium nitrate (NaNO3) were carefully added to 125 mL of cold sulfuric acid, and the mixture was vigorously stirred. After few minutes, a total of 15 g of potassium permanganate was added in small portions, in about 30 min. The mixture was stirred continuously for another hour without cooling, and then 250 mL of cold water was added slowly.
During water addition, the temperature increased to about 90 °C and the mixture was kept at this temperature for another 15 min. Another 500 mL of water was added and the mixture was left to cool to room temperature, then hydrogen peroxide (H2O2) was added until the disappearance of excess potassium permanganate. The next day, the supernatant was removed, and the slurry was washed several times with diluted hydrochloric acid, followed by methanol (CH3OH). Finally, the solid was dried under vacuum at 60 °C.

2.2. Functionalization of Graphene Oxide with Hydrazides

Knowing the importance of hydrazide in therapeutics, as well as other pharmacophores (e.g., sulfonamide group, furan moiety, or quinazoline-4-one nucleus) [34], in this study new compounds, such as 2-furancarboxylic acid hydrazide (H1), 4-(benzensulfonamido)benzoic acid hydrazide (H2), and 2-(2-methyl-4-oxoquinazolin-3(4H)-yl)-acetohydrazide (H3) (Figure 1) were synthesized. These compounds were previously used as intermediates for the synthesis of new compounds with antimicrobial potential. In addition, these compounds chains were grafted on graphene oxide (GO) to obtain various functionalized graphene oxide-based hydrazides (Figure 2), intended for biomedical applications with promising performance as anti-biofilm agents.
On the other hand, it has been used in the two-step synthesis method to covalently link the organic compounds to graphene oxide, as previously reported [31]. In the first step, the activation of carboxyl groups is made by thionyl chloride, and the material reacts further with the hydrazides (Figure 2).
An amount of 0.5 g of dried graphene oxide was suspended into 30 mL dichloroethane (DCM), to which a few drops (about 0.1 mL) of dimethyl-formamide (DMF) and 3 mL of thionyl chloride were added. The mixture was refluxed for 1–2 h, filtered off on a G3-sized sintered glass filter, the solid mass was washed with a large amount of solvent (i.e., DCM). The obtained solid was further suspended into 30 mL DCM, to which 0.25 g of hydrazone and 2.5 mL of triethylamine were added. The mixture was left overnight, and then the collected solid was washed with DCM and methanol, centrifuged, and further dried in an open atmosphere, yielding about 0.5 g of black solid in all cases. For agitation, a classical magnetic stirrer was employed using dry solvents in the reaction with thionyl chloride; no inert atmosphere is required (compulsory) in such reactions.

2.3. Characterization of Functional Materials

2.3.1. FE-SEM-EDS

Scanning electron microscopy with energy dispersive spectroscopy (SEM-EDS) results were obtained using a SU-70 microscope (Hitachi, Ibaraki, Japan) coupled with an UltraDry detector (Thermo Fisher Scientific, Waltham, MA, USA). The SU-70 microscope operates under high-vacuum conditions, and due to the field-emission (FE) it reveals the uniform dispersion of electrons on sample surfaces, allowing it to obtain high-resolution images. The SEM images were obtained under a 5–10 kV accelerating voltage and a 16–21 mm working distance range, meanwhile the EDS data (EDS spectra and elemental composition) were obtained under a 15 kV accelerating voltage using the Phi-Rho-Z correction method available in NSS software (Version 3.0, Thermo Fisher Scientific, Waltham, MA, USA).

2.3.2. ATR-FTIR Spectroscopy

Fourier-transform infrared spectroscopy (FTIR) was performed using a Vertex80 spectrometer (Bruker Optik GmbH, Billerica, MA, USA) equipped with a diamond attenuated total reflection (ATR) crystal accessory. All spectra were recorded in transmittance mode (32 scans/sample) in the range of 4000–400 cm−1, with 0.2 cm−1 spectral resolution and 0.1% T accuracy. The samples were analyzed without any preparation and the data were collected and processed by Opus software (Version 7.0, Bruker Optik GmbH, Billerica, MA, USA).

2.3.3. Raman Spectroscopy

Raman spectra were recorded with a Xantus-2TM Raman analyzer (Rigaku, Boston, MA, USA) equipped with two laser sources (785 and 1064 nm) and two detectors (i.e., TE-cooled CCD and InGaAs). For this study, the following parameters were used: 1064 nm excitation source, 50 mW laser power, 500 ms integration time, and 5 scans/spectra. The spectral range was 200–2000 cm−1, with 15–18 cm−1 spectral resolution. Xantus-2TM reduces intrinsic fluorescence issues and offers an extensive range of analysis capabilities.

2.4. Antimicrobial Activity Assay

The antimicrobial activity of the new compounds was assessed on Gram-positive (S. aureus ATCC 25923, E. faecalis ATCC 29212) and Gram-negative (E. coli ATCC 25922, P. aeruginosa ATCC 27853) bacterial reference strains from the American Type Culture Collection (ATCC), using stock solutions of 10 mg/mL prepared in dimethyl sulfoxide (DMSO). All antimicrobial activity assessments were performed in a Mueller–Hinton broth medium, a rich culture medium recommended by international guidelines (CLSI, EUCAST, etc.) to be used for antimicrobial susceptibility testing assays.
The efficiency of the tested compounds was assessed against the free floating planktonic cells by using the broth microdilution method, allowing the establishment of the minimum inhibitory concentration (MIC), as well as against biofilm-embedded cells through the violet crystal microtiter method, allowing for the establishment of the minimal biofilm eradication concentration (MBEC) [35]. For this purpose, serial two-fold dilutions varying from 5 to 0.009 mg/mL were performed in 96-well microplates to which the bacterial suspension in a final density of 105 CFU/mL (colony forming units) was added, and then, the plates were incubated at 37 °C for 24 h. The positive growth control was represented by the bacterial culture developed in the absence of the tested substance, while the negative growth control was represented by the sterile broth. After incubation, a volume of 5 µL of each well was spread on agar plates and incubated at 37 °C for 24 h to determine the MIC and MBC (minimal bactericidal concentration) values. After sampling the wells for determining the MIC/MBC values, the microplates were emptied and gently washed to remove the non-adherent bacteria, and then the biofilm formed on the plastic well was fixed by methanol, stained by violet crystal, and then resuspended by acetic acid 33%. The optic density of the colored suspension was read at 490 nm, the MBEC corresponding to the lowest concentration inhibiting the biofilm development in comparison with the positive growth control [36].

2.5. Biocompatiblity Assays

2.5.1. Human Cellular Viability Assay

In order to determine the number of viable cells that actively proliferate, the CellTiter 96® AQueous One Solution Cell Proliferation Assay was used. The epithelial cells HaCaT and HeLa (ATCC®CRM-CCL-2) were seeded at a concentration of 1 × 10⁴ cells/well, in a 96-wells plate in 1:1 Dulbecco’s modified essential medium (DMEM) and Ham’s F-12 Medium (DMEM:F12, Life Technologies, Scotland, United Kingdom) supplemented with 10% fetal bovine serum (ThermoFisher Scientific, Waltham, MA, USA). The treatments were performed using binary dilutions of GO-1,2,3, between 1 mg/mL and 31 µg/mL. After 24 h, the GO-1,2,3 effects were evaluated by adding 20 µL of CellTiter Reagent for 2 h at 37 °C, and thereafter reading absorbance at 490 nm with TriStar2 S LB942 Multimode Reader (Berthold Technologies GmbH & Co. KG, Bad Wildbad, Germany). The IC50 was calculated with a Quest Graph™ IC50 Calculator [37].

2.5.2. Fluorescein Diacetate (FDA)-Propidium Iodide (PI) Cell Staining for Microscopic Examination of Treated Cells

One hundred thousand cells were added to each well of a 24-wells plate and treated with GO-1,2,3 at concentrations ranging between 1 mg/mL and 31 µg/mL. After 24 h, the culture medium was removed, and the cells were stained for 5 min in the dark by addition of staining solution containing 10 µg/mL of FDA plus 5 µg of PI. FDA-PI-stained cells were examined with an Observer D1 Zeiss microscope (Carl Zeiss Microscopy GmbH, Jena, Germany) using a band pass 488 nm exciter filter.

2.5.3. Assessment of the Compounds’ Influence on the Cell Cycle Analysis

For cell cycle analysis, the cells were also treated with GO-1,2,3 at concentrations between 1 mg/mL and 31 µg/mL, for 24, 48, or 72 h. At specified times, treated and untreated cells were harvested with trypsin, fixed in cold ethanol (70%), and stained with 100 µg/mL propidium iodide [38]. For events acquisition, a Beckman Coulter flow cytometer (Beckman Coulter, Nyon, Switzerland) was used, and analyses were performed using the FlowJo software 7.2.5. (Ashland, CA, USA).

3. Results and Discussion

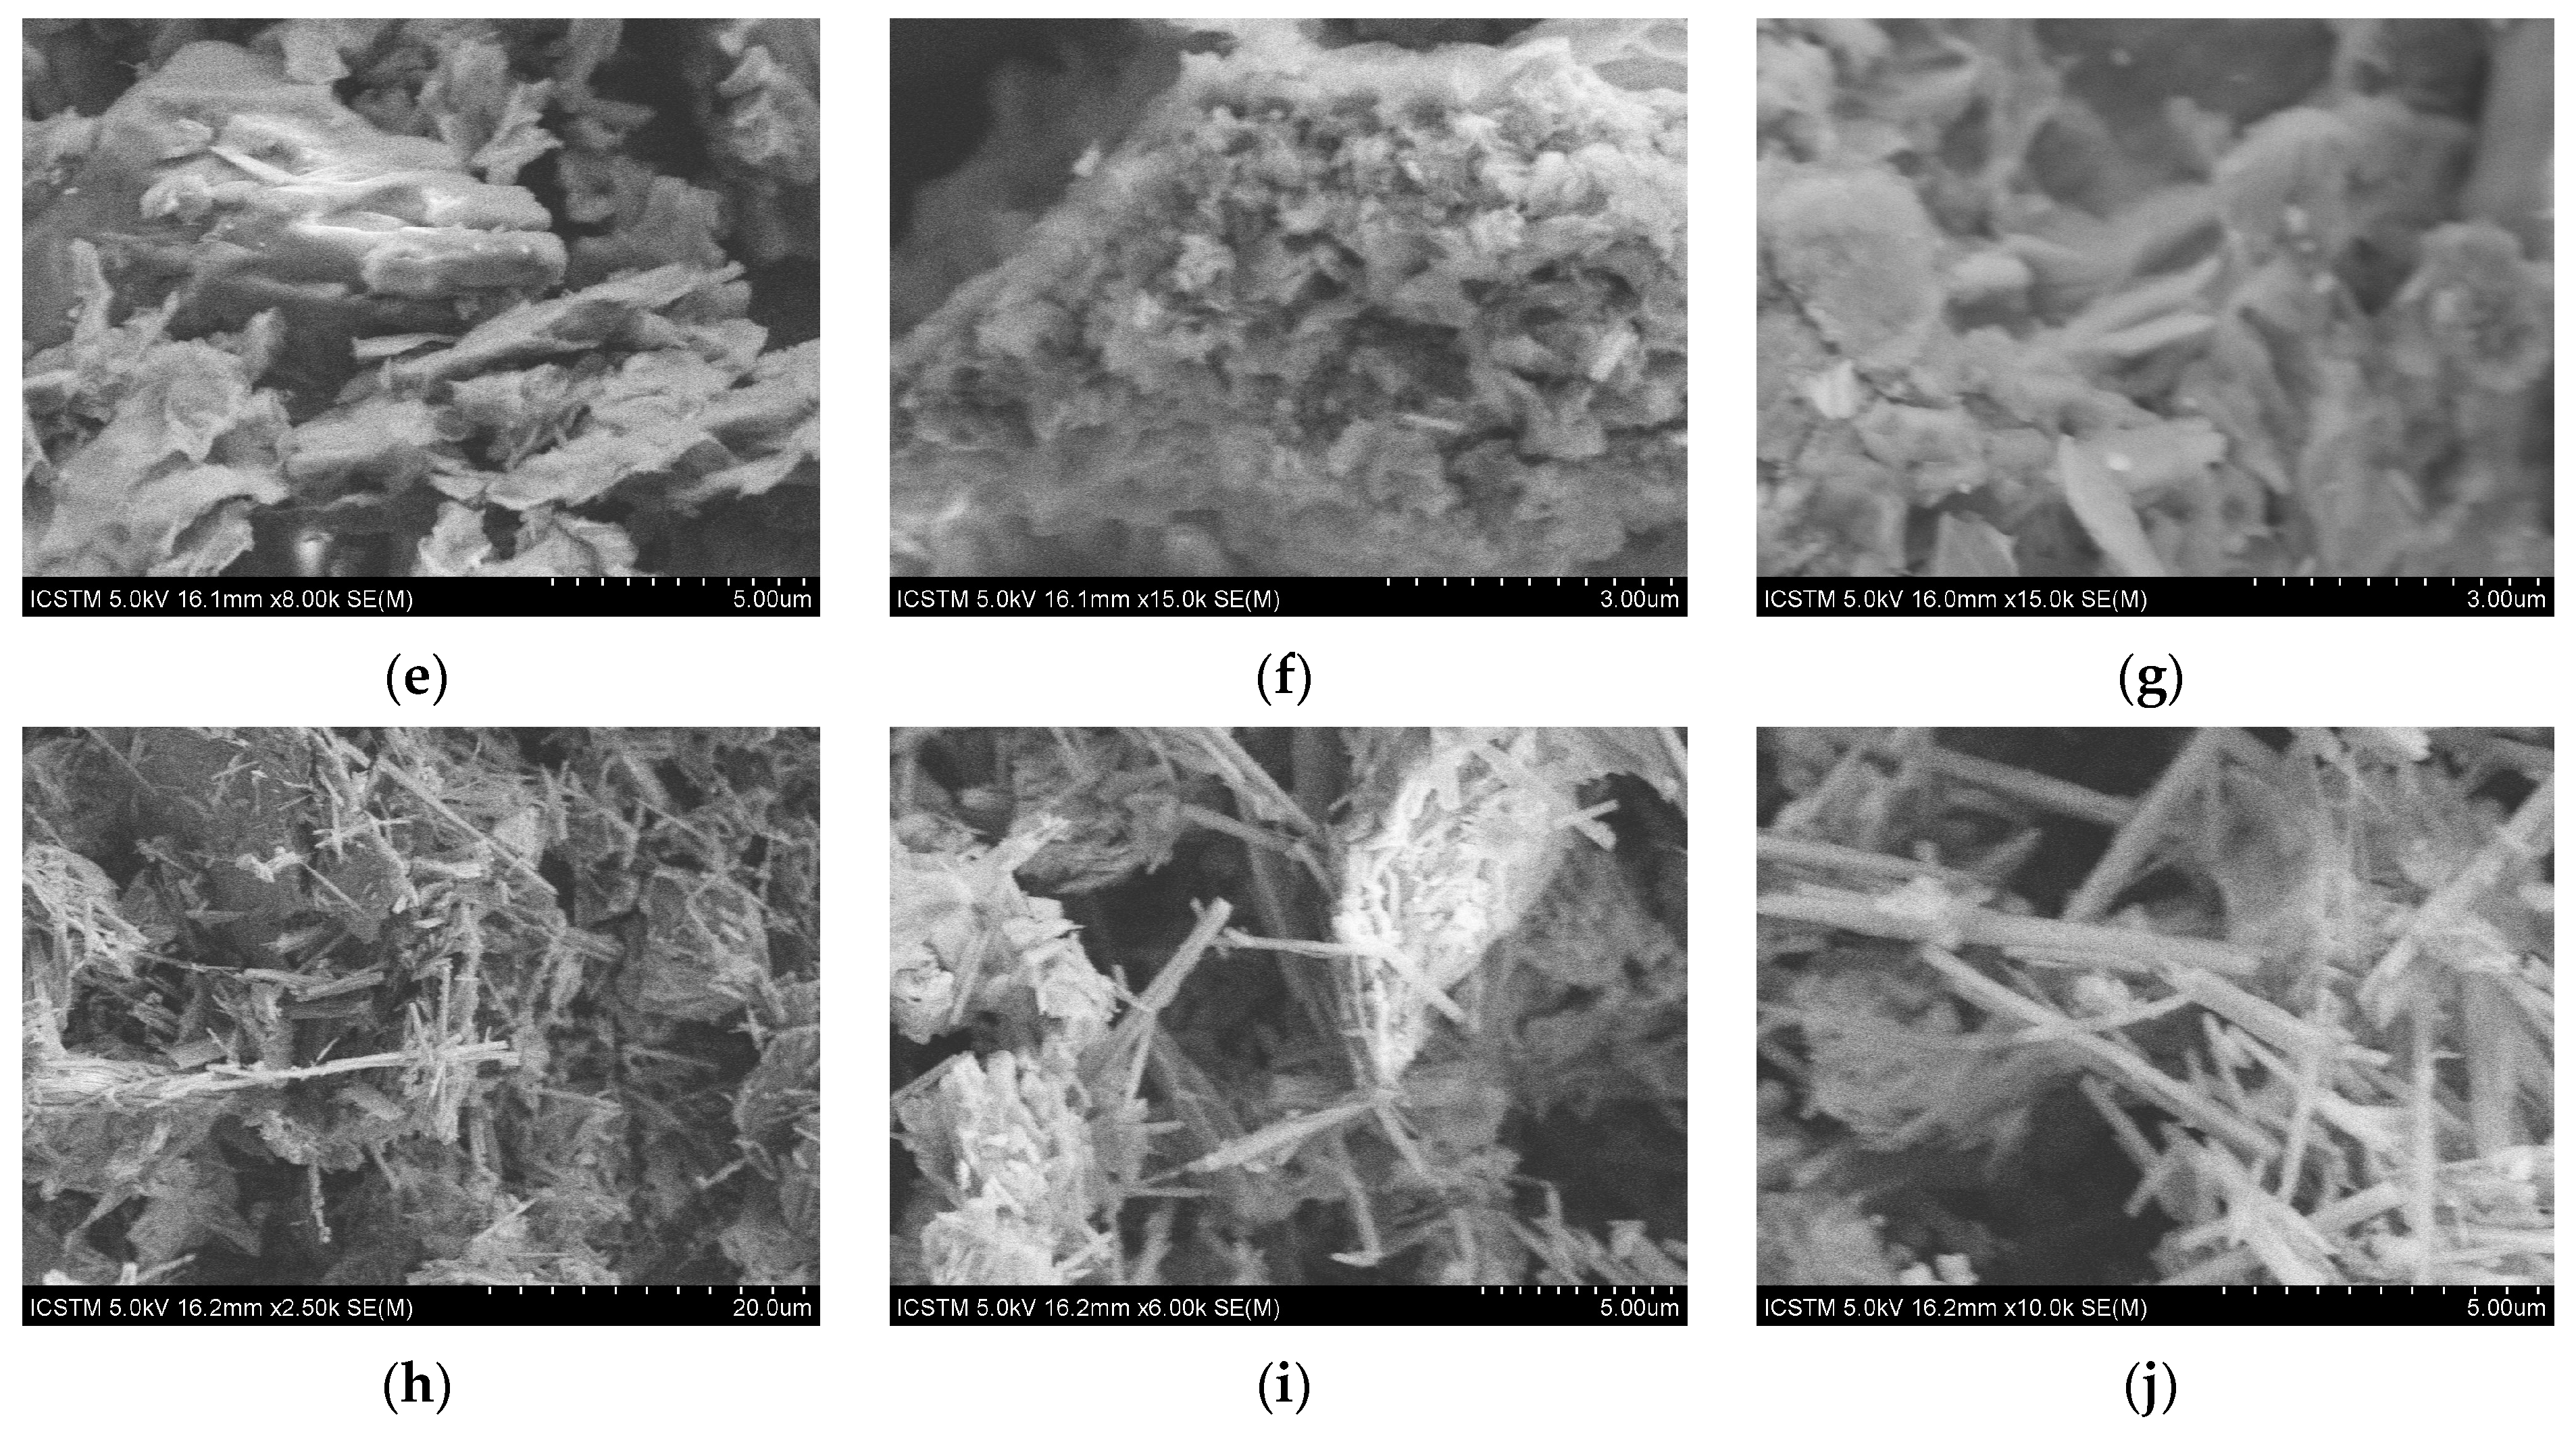
The SEM investigation of the morphology of the graphene oxide (GO) functionalized with hydrazides reveals that all synthesized samples have different structures according to the types of hydrazides grafted onto the GO (Figure 3).
As shown in Figure 3, discrepancies in morphology are probably related to the sample preparation technique, as well as to the hydrazide used in the functionalization of graphene oxides. Figure 3b–d show the SEM images of the GO-1 samples with lamellar structure characteristic to graphene [39]. The lamellar structure is the result of the alignment and self-assembly of molecules (due to intermolecular forces) in an organized way to form various nanostructures. It can be observed that the lamellar structure of GO-1 (Figure 3b–d) presents thinner layers than the initial graphene oxide, as well as the expected smooth surfaces with wrinkles and folded regions. These observations could be accounted for by the sp3 carbons, the formation of oxygen-containing functional groups in the basal planes, and to various GO structural defects [40]. The reduction of oxygen-containing functional groups located in the basal plane of the sp2 carbon hybridization allowed the lamellas of the GO to be held together via weak van der Waals forces [22]. Figure 3e–g show SEM images of the GO-2 characterized by flake structures with graphite particles are in the platelet-like crystalline form of carbon [41]. As shown in Figure 3h–j, GO-3 is characterized by straight rods (~5 μm length) with a square cross-section [42]. The SEM micrographs highlight that the GO functionalized with hydrazides leads to the formation of disordered nanostructures [43,44].
The elemental composition of the studied samples was determined by energy dispersive spectroscopy (EDS) and data are presented in Table 1. These results revealed a high content of carbon (76.05 wt.%–76.69 wt.%), oxygen (11.82 wt.%–14.97 wt.%), and nitrogen (5.99 wt.%–8.00 wt.%) in all studied samples. For GO-1 and GO-2 samples, an important content of sulfur (1.59 wt.%–2.25 wt.%) was determined. Other minor constituents of all analyzed samples were identified, i.e., aluminum (0.04 wt.%–0.13 wt.%), silicon (0.05 wt.%–0.21 wt.%), chlorine (0.28 wt.%–1.10 wt.%), and potassium (0.17 wt.%–1.82 wt.%). Just the GO-2 sample has a small content of sodium (0.06 wt.%), magnesium (0.04 wt.%), and calcium (0.31 wt.%).
The SEM images highlighted the modification of graphene oxide structures: the initial layers (Figure 3a) were transformed into thin sheets (Figure 3b–d), flakes (Figure 3e–g), or needles (Figure 3h–j), depending on the used hydrazide. Additionally, nitrogen incorporation in the GO structures is demonstrated by the reduction of oxygen (Table 1).
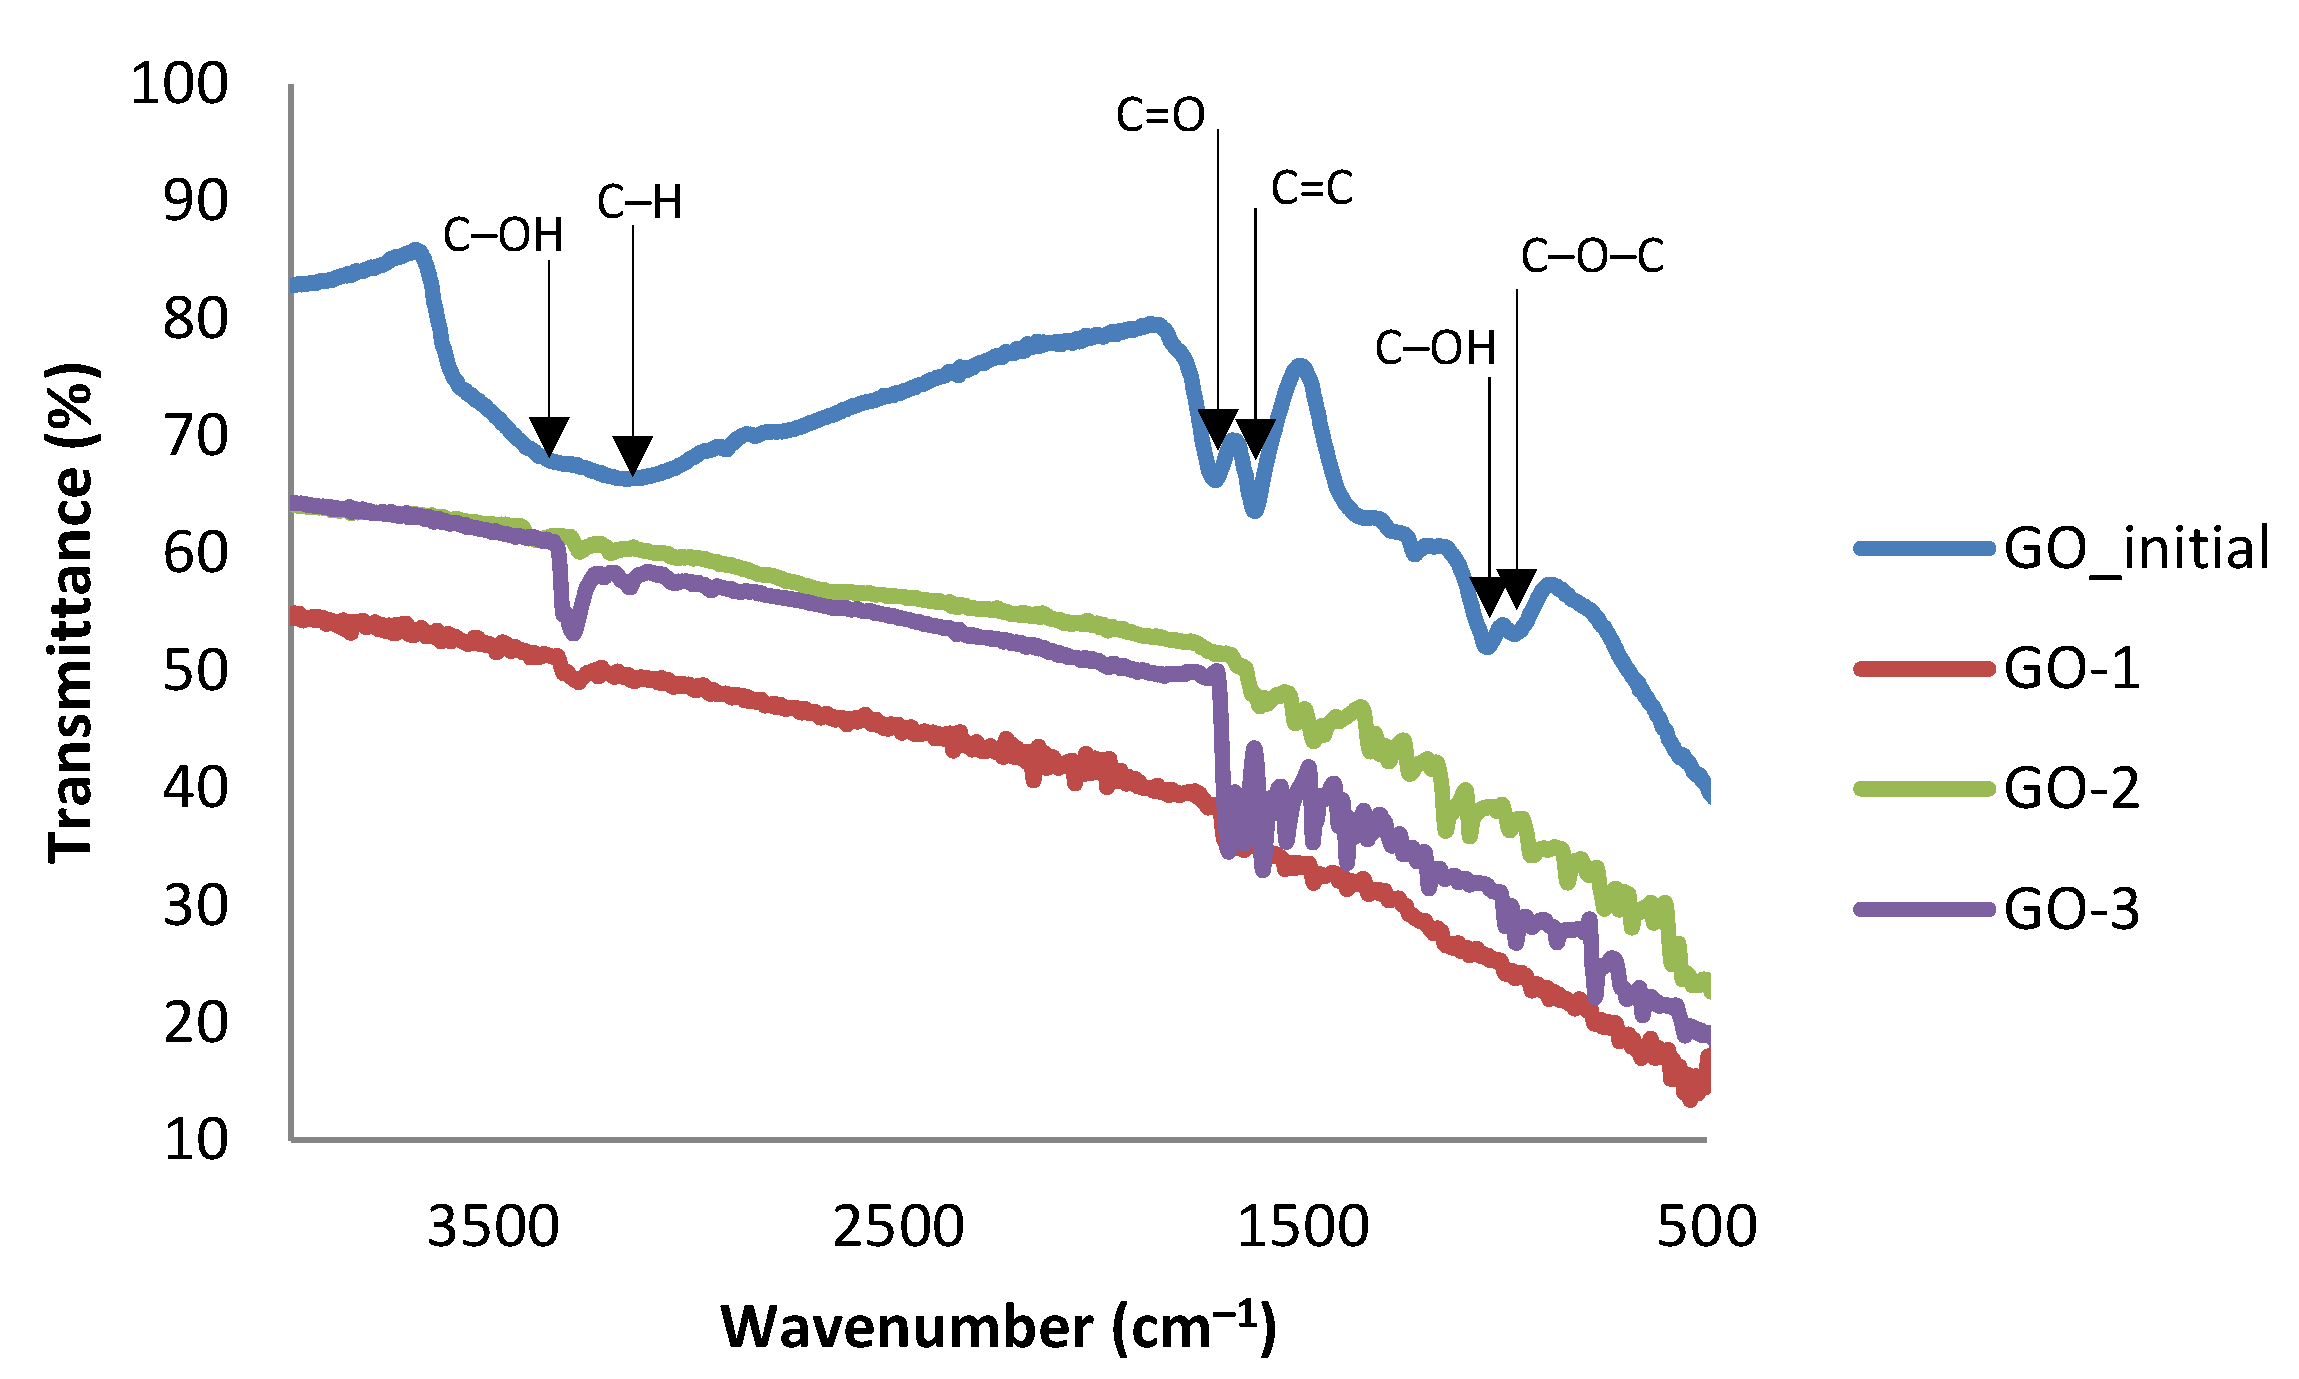
To confirm the insertion of hydrazide derivatives into graphene oxide and the absence of interactions between both hydrazides and GO, Raman scattering with an excitation wavelength of 1064 nm and FTIR spectroscopies were investigated. Both analytical techniques represent versatile nondestructive and high-resolution tools to identify and characterize the chemical structure and properties of current graphene-based materials with a high scientific interest for different applications. FTIR data of new graphene oxidehydrazides derivatives (Figure 1 and Figure 2) are shown in Figure 4 and Table 2.
It is well known that infrared is the most common vibrational spectroscopy for assessing the molecular motion and fingerprinting of investigated structures, based on the inelastic scattering of a monochromatic excitation source using an energy range from 400 to 4000 cm−1 [45,46,47]. The presence of different functional groups in graphene oxide, as well as GO–hydrazide derivatives, is revealed in medium intensity peaks at 3404 (GO), 3412 (GO-1), 3413 (GO-2), and 3410 (GO-3) cm−1 for O−H, and strong peaks at 1630 (GO), 1633 (GO-1), 1632 (GO-2), and 1635 (GO-3) for C=C stretching/bending vibrations modes, and for C=O with the molecular bond δ (scissoring vibration) from amide (Table 2). The peak around the value of 3404 cm−1 is attributed to the O−H stretching vibration mode of −COOH and C−OH functional groups. In addition, GO, GO-1, GO-2, and GO-3 show medium intensity peaks at 1720, 1724, 1727, and 1731 cm−1, which are assigned to the C=O stretching vibration mode [48].
Regarding FTIR spectra, the medium/weak signals are observed for the synthesized compounds in the range from 1600 to 1800 cm−1, excepting strong peaks around 1630–1635 cm−1 which can be assigned to a C=C aromatic stretch (GO), as well as what can be attributed to C=O with the molecular bond δ (scissoring vibration) from amide. On the other hand, the strong signals (peaks) for GO-1, GO2, and GO-3 around 3316–3327 cm−1 can be assigned to amide groups, mainly from the H-N stretch vibration. It is well known that vibrational spectroscopy is a tool widely used in the study of molecular structures and surfaces, but usually it is used in terms of qualitative analysis.
The medium intensity peaks around 1404 and 1238 cm−1 (Table 2) are attributed to functional groups such as C−O−H and C−O−C, respectively [30,49]. Furthermore, the normalized FTIR data of GO, GO-1, GO-2, and GO-3 revealed peaks with medium intensities around 1616, 1390, 1221, and 1085 cm−1 for the C=C aromatic stretch, C−O−C ether, the C−OH stretch in acids, and C−O−C epoxy groups, respectively [48,50]. The intensities of peaks for oxygen-containing hydrazide functional groups were observed in the range of 1444–1539 cm−1 (Table 2); for C-N and the N-H stretching vibration of the hydrazide group (more than one band varied from medium to weak intensities in FTIR data, but there were prominent peaks in the Raman spectra, as shown by Table 3 and Figure 4).
The same assignment of hydrazide functional groups can be made for strong intensity peaks in the range of 3289–3327 cm−1 for N-H proton stretching, and a medium signal around 1320 cm−1 for the C-N stretching vibration mode, respectively (Table 2). A new peak with a medium intensity was observed at 1682 cm−1 for both GO-2 and GO-3, and was attributed to C=C stretching on the aromatic ring and the N-C=O stretching vibration mode from quinazolin-4-ones’ nucleus, respectively. On the other hand, the weak intensity peaks observed in FTIR data (Table 2) for all compounds (i.e., GO, GO-1, GO-2, and GO-3) around 1560 cm−1, with complementary very-strong peaks in Raman spectra (Figure 5 and Table 3), are attributed to the C=C stretching vibration mode of sp2 hybridized carbon atoms from graphene oxide structures. The medium intensity peaks, observed in FTIR spectra of GO, GO-1, GO-2, and GO-3 compounds, at 3169, 3161, 3170, and 3162 cm−1, respectively, were assigned to the C–H bonds of aromatic hydrocarbons.. The sp2 hybridization of the carbon from C-H group affects the position of the absorption, which means the stiffer bonds vibrate at higher frequencies such as 3000–3200 cm−1. The furan cycle in GO-1 is revealed by the medium intensity peaks at 3107 and 1187 cm−1 for the C=O–C stretching vibration mode correlated with the weak intensity peaks in the range of 667–802 cm−1, but with prominent peaks (more than one band with medium intensity) in the Raman spectrum (Table 3). However, in the FTIR spectrum of GO-2, we observed medium intensity peaks at 3229 cm−1 and a strong signal at 1180 cm−1 attributed to the S=O stretching vibration mode of the –SO2-NH– group (sulfonamide). On the other hand, for the GO-2 compound, two new peaks at 903 and 694 cm−1 were observed, with weak intensities in the FTIR spectrum (Table 2), but with medium intensities in Raman (Table 3). By the introduction the quinazolin-4-one hydrazide derivatives on GO, it can be concluded that the FTIR data of GO-3 are more completed by various peaks with different intensities (i.e., strong to weak) at 3162 and 3051 cm−1 from the C–H stretch of hydrocarbon, 1682 and 1145 cm−1 from the C=N stretching vibration mode of the 4-substituted quinazolin ring, and 1326 cm−1 from the C-N stretching of the quinazolin cycle [51]. The minimum intensities of peaks from the FTIR data of all synthetized compounds, including GO, in the range of 3620 to 3690 cm−1 (Table 2), are attributed to the O–H stretching vibration mode from graphene oxide.
The Raman spectra of new functionalized graphene oxides (GO-1, GO-2, and GO-3) show few prominent features regardless of the final structure. In this respect, in Figure 5, the positions, the line shapes, and intensities of peaks recorded in the Raman spectra reveal important information regarding the structures and properties of synthesized compounds [52].
In Figure 3, the overlap of the Raman spectra of the new structures’ graphene oxide–hydrazides derivatives (i.e., GO-1, GO-2, and GO-3), reveal the spectral regions D and G specific to GO. In addition, the D peak is important to characterize, firstly, the graphene oxide, and then, the functionalized graphene oxides. The G-band is characteristic of sp2 hybridized carbon–carbon bonds in graphene oxide and in Raman spectra (Figure 5 and Table 3), which is observed as strong intensity peaks at 1573, 1579, 1558, and 1571 cm−1 for GO, GO-1, GO-2, and GO-3, respectively [53,54].
The ratio between the D-band and G-band, observed in Raman spectra, in terms of peak area (i.e., ID/IG), allowed for the measurement of the defects which occurred in GO nanostructures after functionalization [55]. For the analyzed samples, the ID/IG ratios have recorded the following values: 4.93 (GO-1), 4.50 (GO-2), and 3.17 (GO-3). Taking into account these values, it can be assumed that the number of the defects in the GO functionalized with hydrazine is very low, but according to the data reported in the scientific literature, the G-band peak is influenced by the D-band (~1600 cm−1) [56].
The Raman spectroscopy can be also used to determine the mean crystallite size of the synthesized GO samples (LGO) using the following equation [48]:
L G O ( nm ) = 2.4 × 10 10 λ 4 I D I G
where λ represents the wavelength of the LASER source. The obtained results for the functionalized GO samples were: 62.392 nm (GO-1), 68.354 nm (GO-2), and 97.033 nm (GO-3), respectively.
In addition, the strong intensity peaks for GO, GO-1, GO-2, and GO-3 compounds at 1348, 1355, 1346, and 1351 cm−1, revealed the presence of sp3 hybridized carbon atoms in GO and functionalized GO, known as D-band [57]. Obviously, the weak intensity peaks observed in FTIR data (Table 2) in the range from 1080 to 584 cm−1 are more remarkable in Raman spectra as one or more bands for the various values of identified peaks (Table 3).
The antimicrobial activity was assessed on susceptible, reference ATCC strains which are used for antibiogram quality control and have known antibiotic susceptibility profiles. All antibiotics recommended by CLSI (Clinical Laboratory Standard Institute) to be tested on the four strains have MIC values in the range of 0.0016 and 0.152 µg/mL, much lower than the MIC recorded for the tested graphenes and hydrazides. Regarding the antimicrobial activity against the planktonic bacterial cells, from the four tested strains, a better antimicrobial activity was recorded against the Gram-negative strains, E. coli and P. aeruginosa (Figure 6).
The graphenes functionalized with the three hydrazides, 2-furancarboxylic acid hydrazide (H1) in case of GO-1, 4-(benzensulfonamido)benzoic acid hydrazide (H2) for GO-2, and 2-(2-methyl-4-oxoquinazolin-3(4H)-yl)-acetohydrazide (H3) for GO-3, respectively, exhibited a low inhibitory effect, inferior to that of free hydrazides (H1, H2, and H3) and in the majority of the cases, even to that of the unfunctionalized GO, as revealed by the higher MIC values, ranging from 1.04 to 2.5 mg/mL. The only case in which a slightly improved antimicrobial activity was observed for the graphene oxide–hydrazide complex (as compared to the free hydrazide (H3)) was GO-3 against the E. coli strain. However, the MIC values for both free hydrazide H3 and the corresponding functionalized graphene GO-3 were higher than those recorded for the unfunctionalized graphene GO.
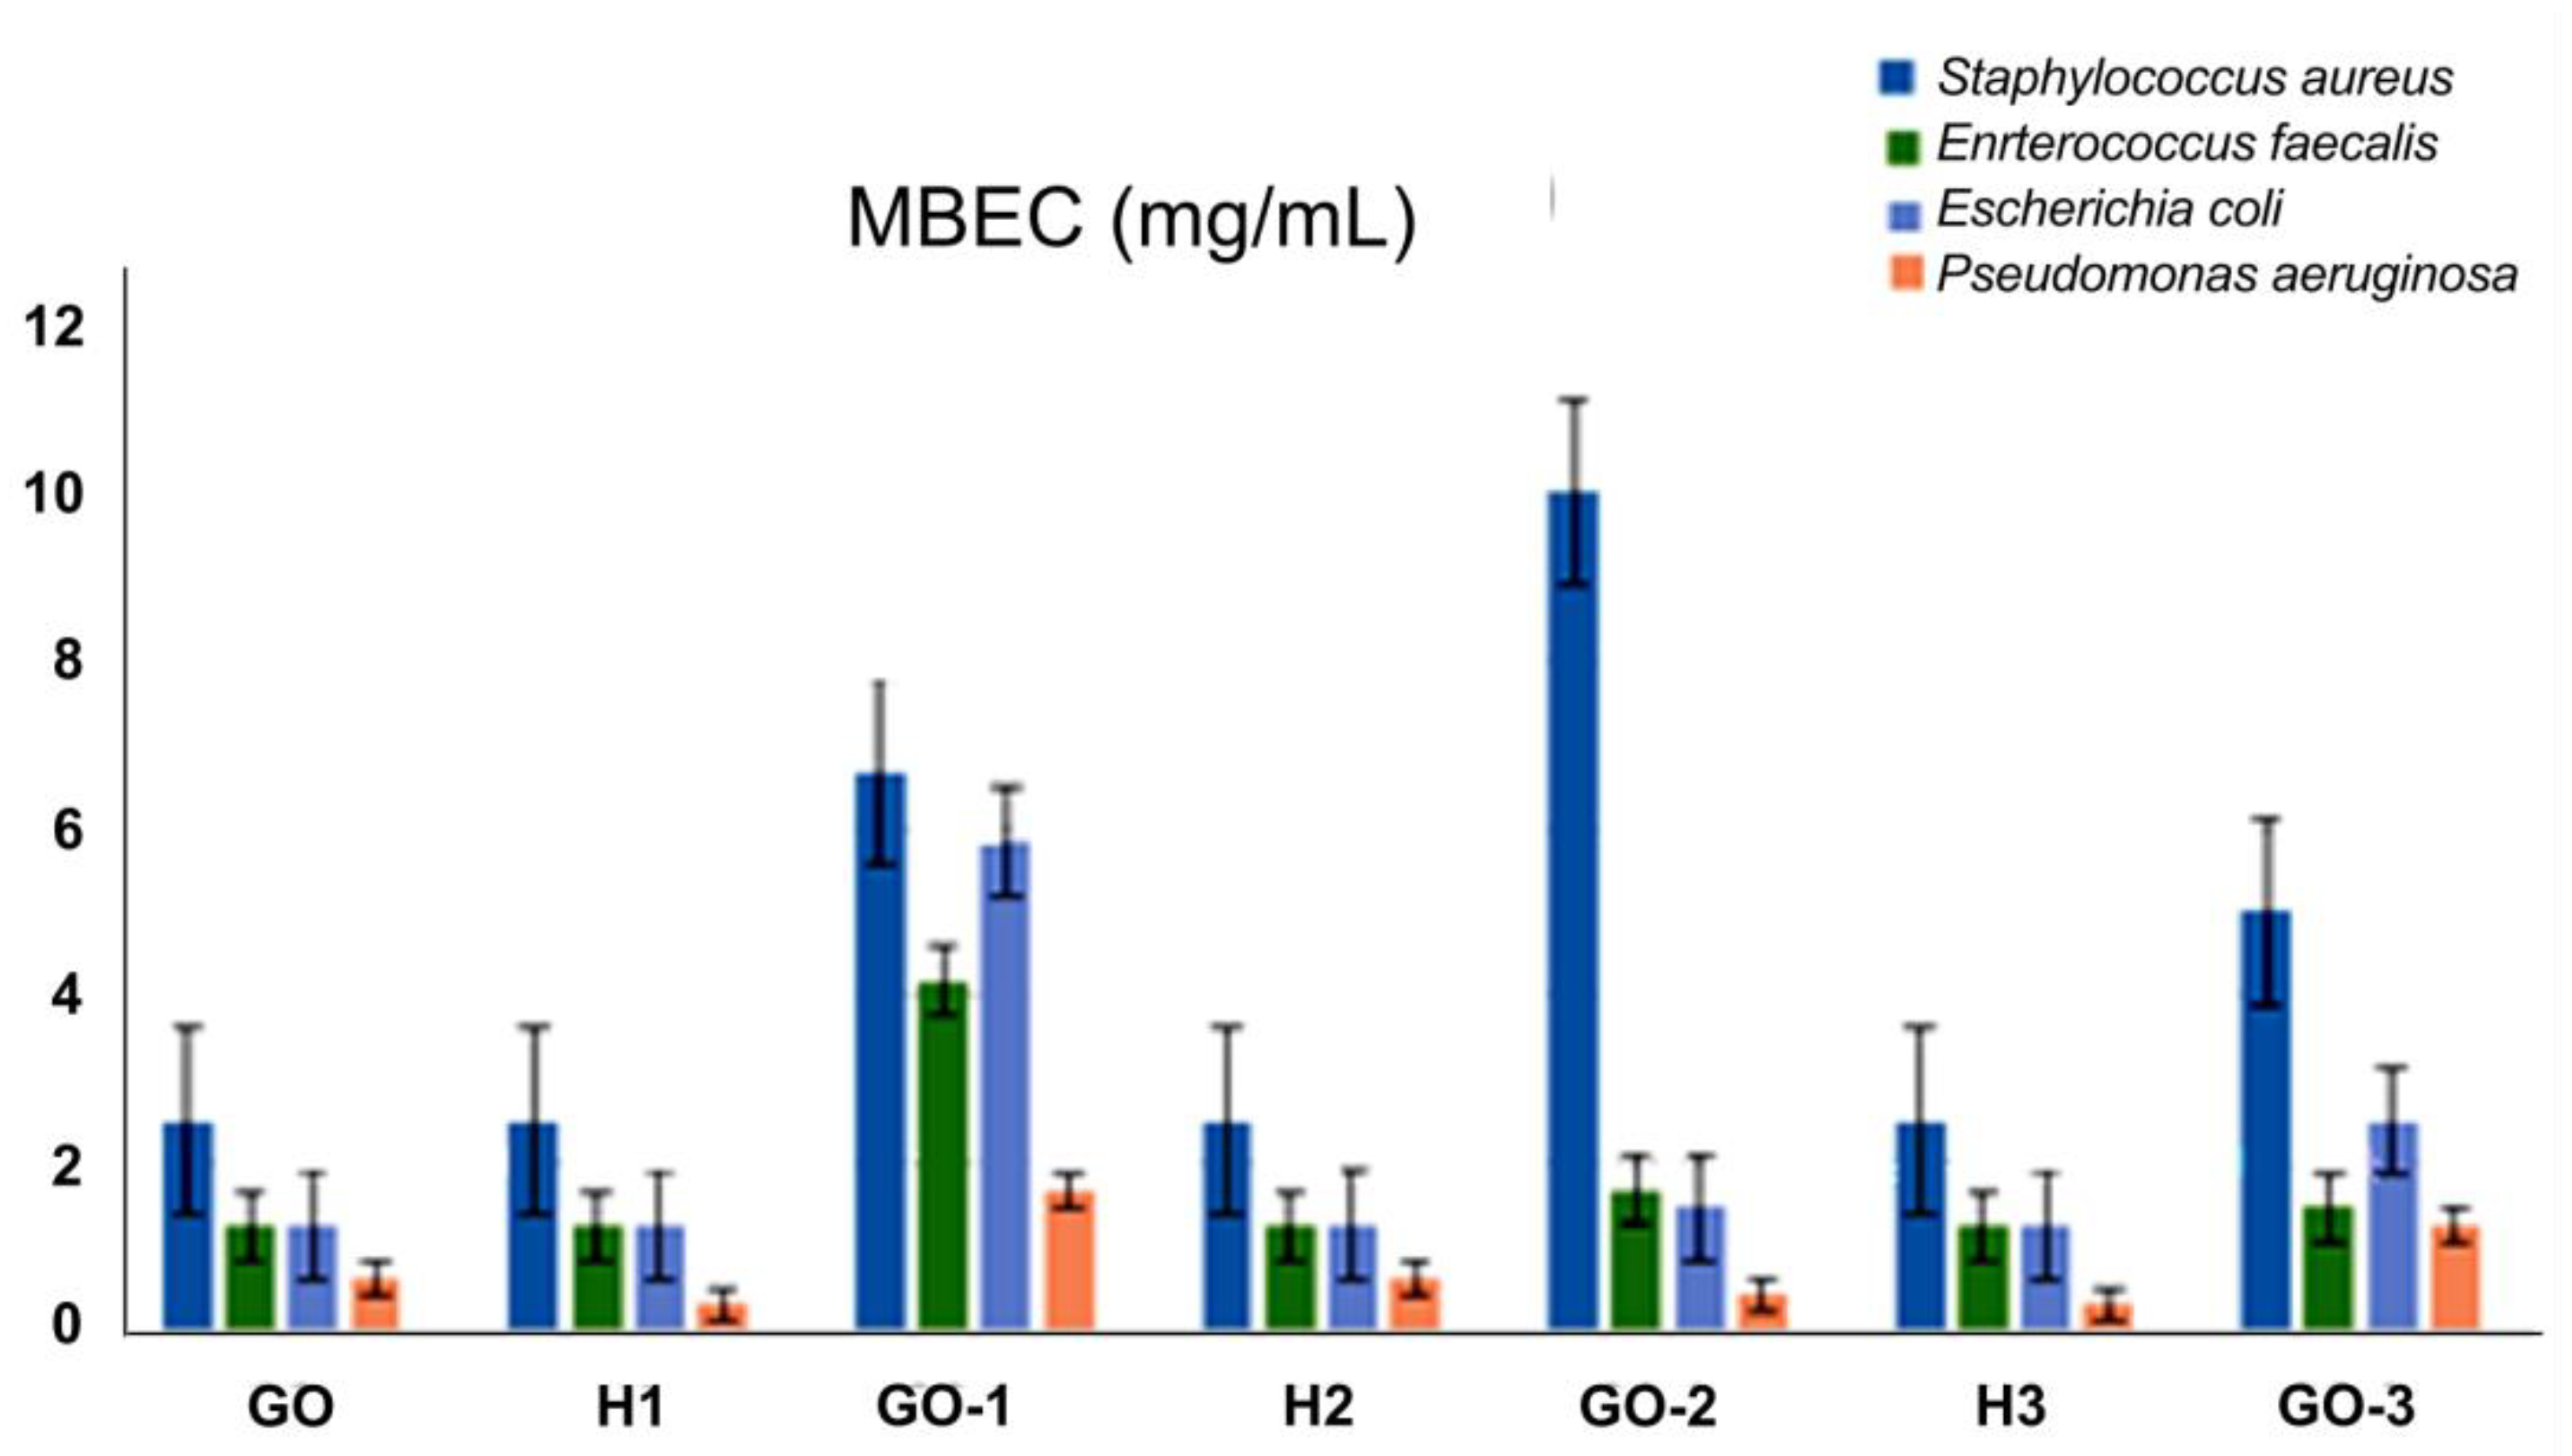
Regarding the antibiofilm activity, the free hydrazides (H1, H2, and H3) exhibited a similar antibiofilm activity with the unfunctionalized GO against all four tested strains. However, the graphene functionalized with hydrazides (GO-1,2,3) exhibited lower inhibitory activity than that of the free hydrazides with one exception, i.e., the GO-2 that exhibited a slightly improved antibiofilm activity against P. aeruginosa, a fearful, opportunistic, and nosocomial pathogen, included in the list of ESKAPE bacteria, as compared to the corresponding free hydrazide H2 and the unfunctionalized GO (Figure 7). It is well accepted that biofilm cells can be up to 1000–4000 times more resistant than their planktonic counterparts. Despite this, currently, in the medical field, there is no standardized method to assess the biofilm cell’s susceptibility, with the selection of antibiotics based on the MIC results evidently leading in many cases to antibiotic treatment failures [58].
Although the fact that GO did not improve the antimicrobial activity of hydrazides could be represented as a weakness of this study, by taking into account that both GO and hydrazide derivatives are intensively studied to synthesize potent antimicrobials, we strongly believe that the results of this type of research should be published to avoid unproductive leads and the waste of resources.
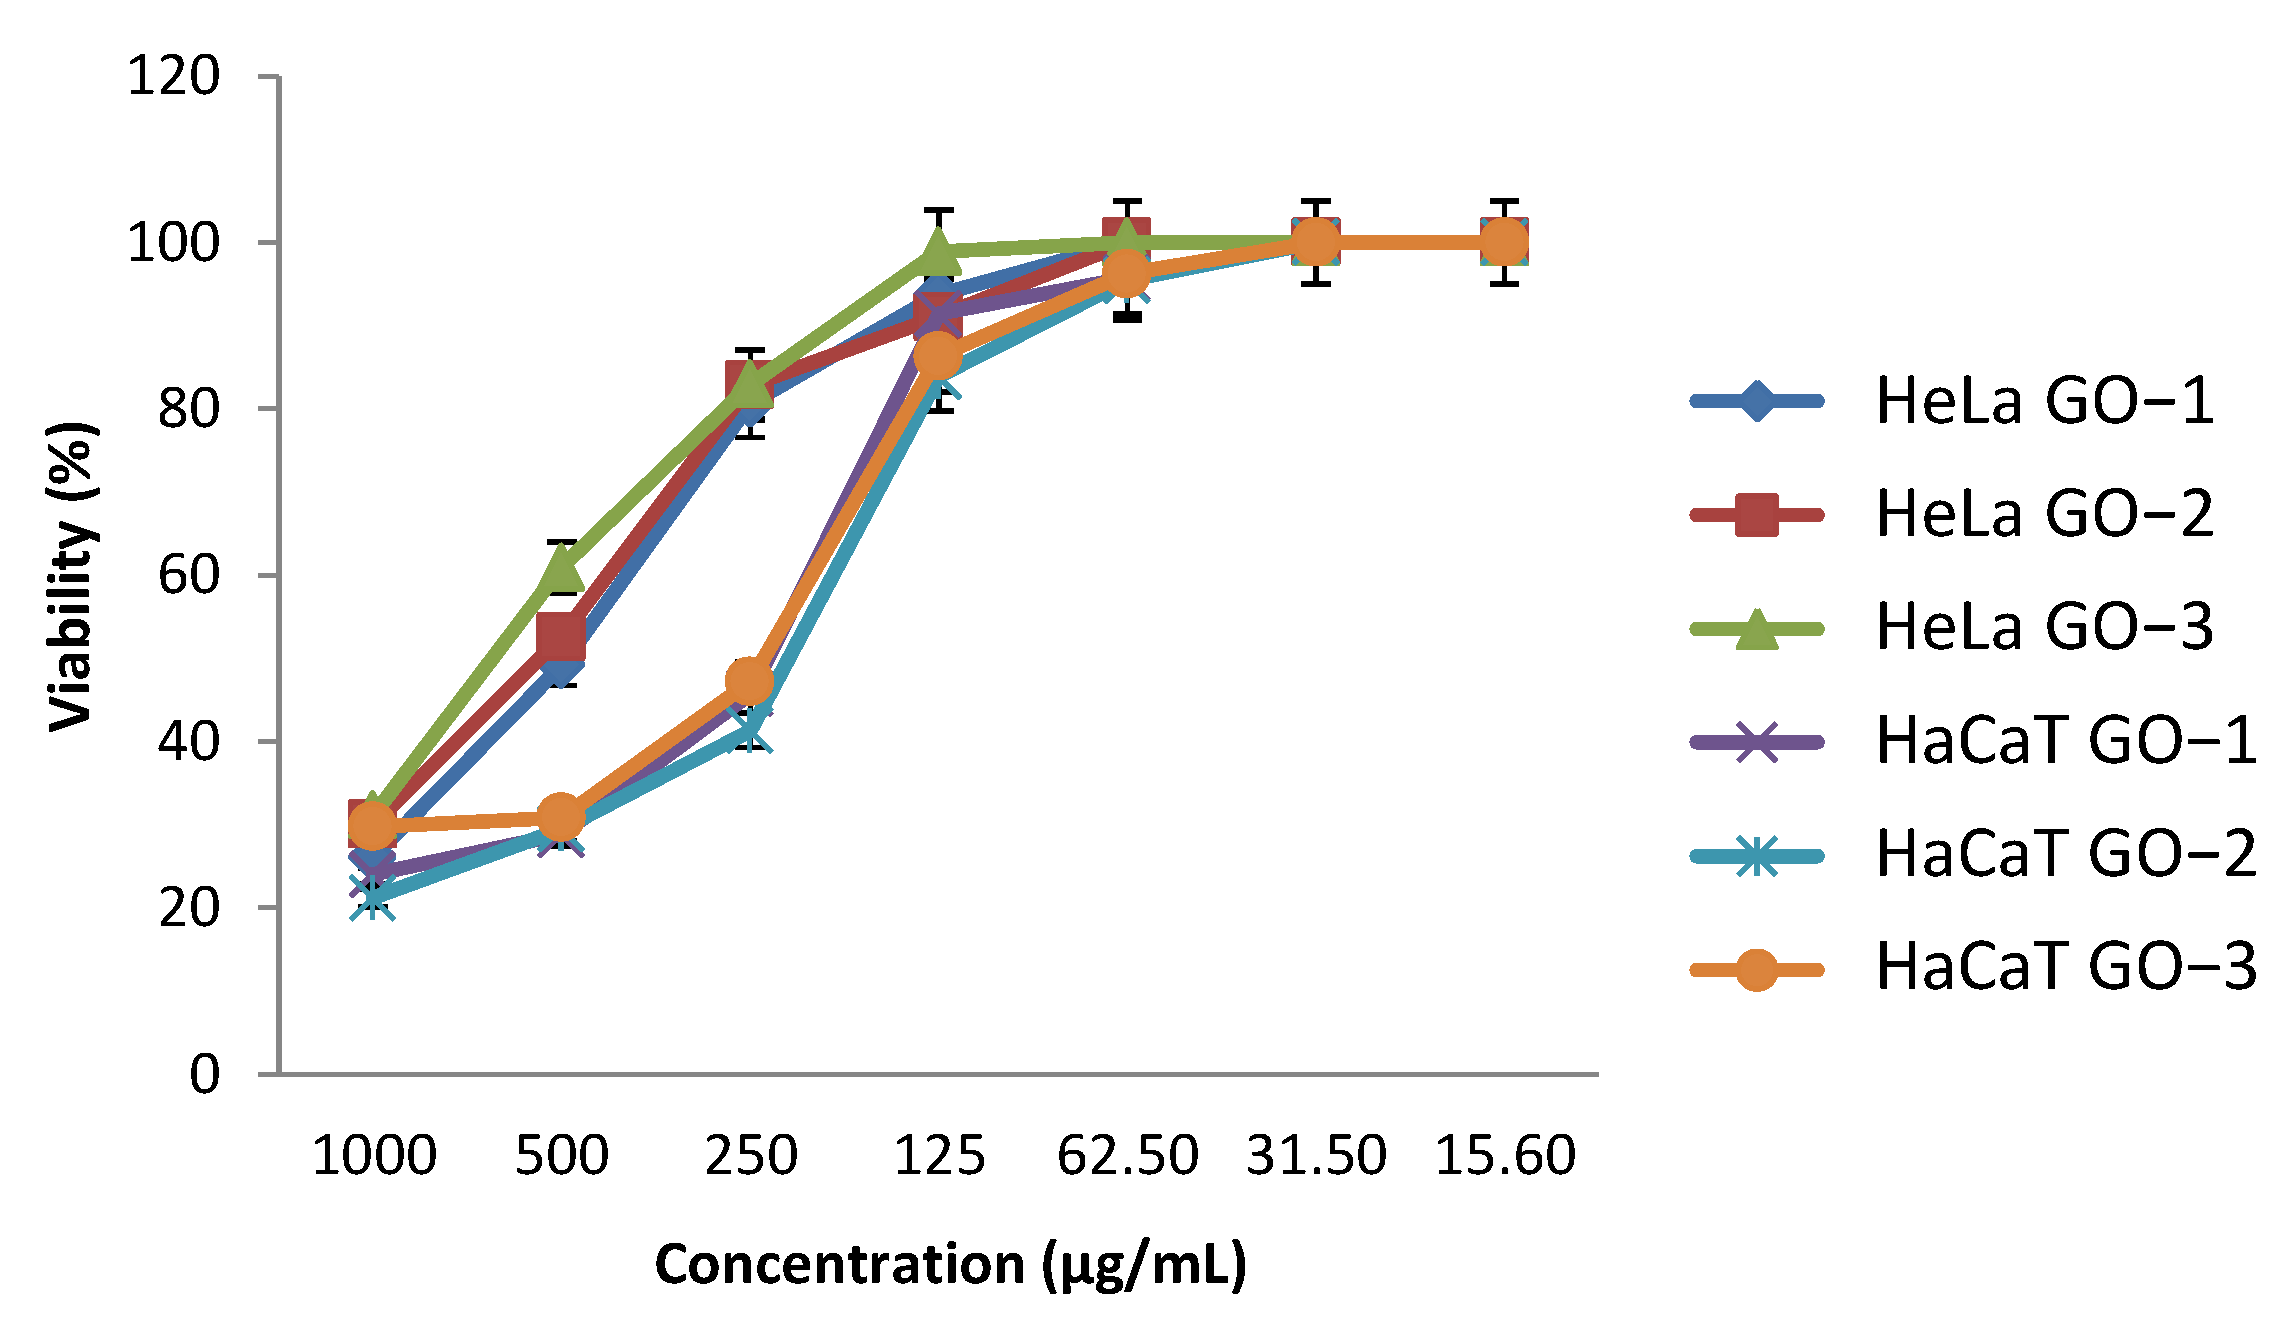
The cytotoxicity of the obtained functionalized graphenes was evaluated in vitro, using the CellTiter 96® AQueous One Solution Cell Proliferation Assay that quantifies the production of formazan proportionally with the number of living cells. Unfortunately, the range of the tested concentration could not overlap on the range used in the antimicrobial assays, due to the cytotoxic effects recorded at the active antimicrobial concentrations. Therefore, the highest tested concentration was 1 mg/mL. The results are presented as percent of viable cells reported to untreated cells. Using the colorimetric method, it was observed that after 24 h, the concentrations over 250 µg/mL for HeLa cells and over 125 µg/mL for HaCaT cells had a concentration-dependent toxic effect (Figure 8).
Taking into account the general criteria and the conditions regarding a cytotoxic activity [59], the newly synthesized GOs are fit into the weakly-cytotoxic group (IC50 between 201 and 500 µg/mL) (Table 4).
The comparative analysis of the two cell lines reveals a higher cytotoxic effect on HaCaT cells (Figure 8), as also revealed by the lower IC50 for this cell line in comparison with HeLa cells.
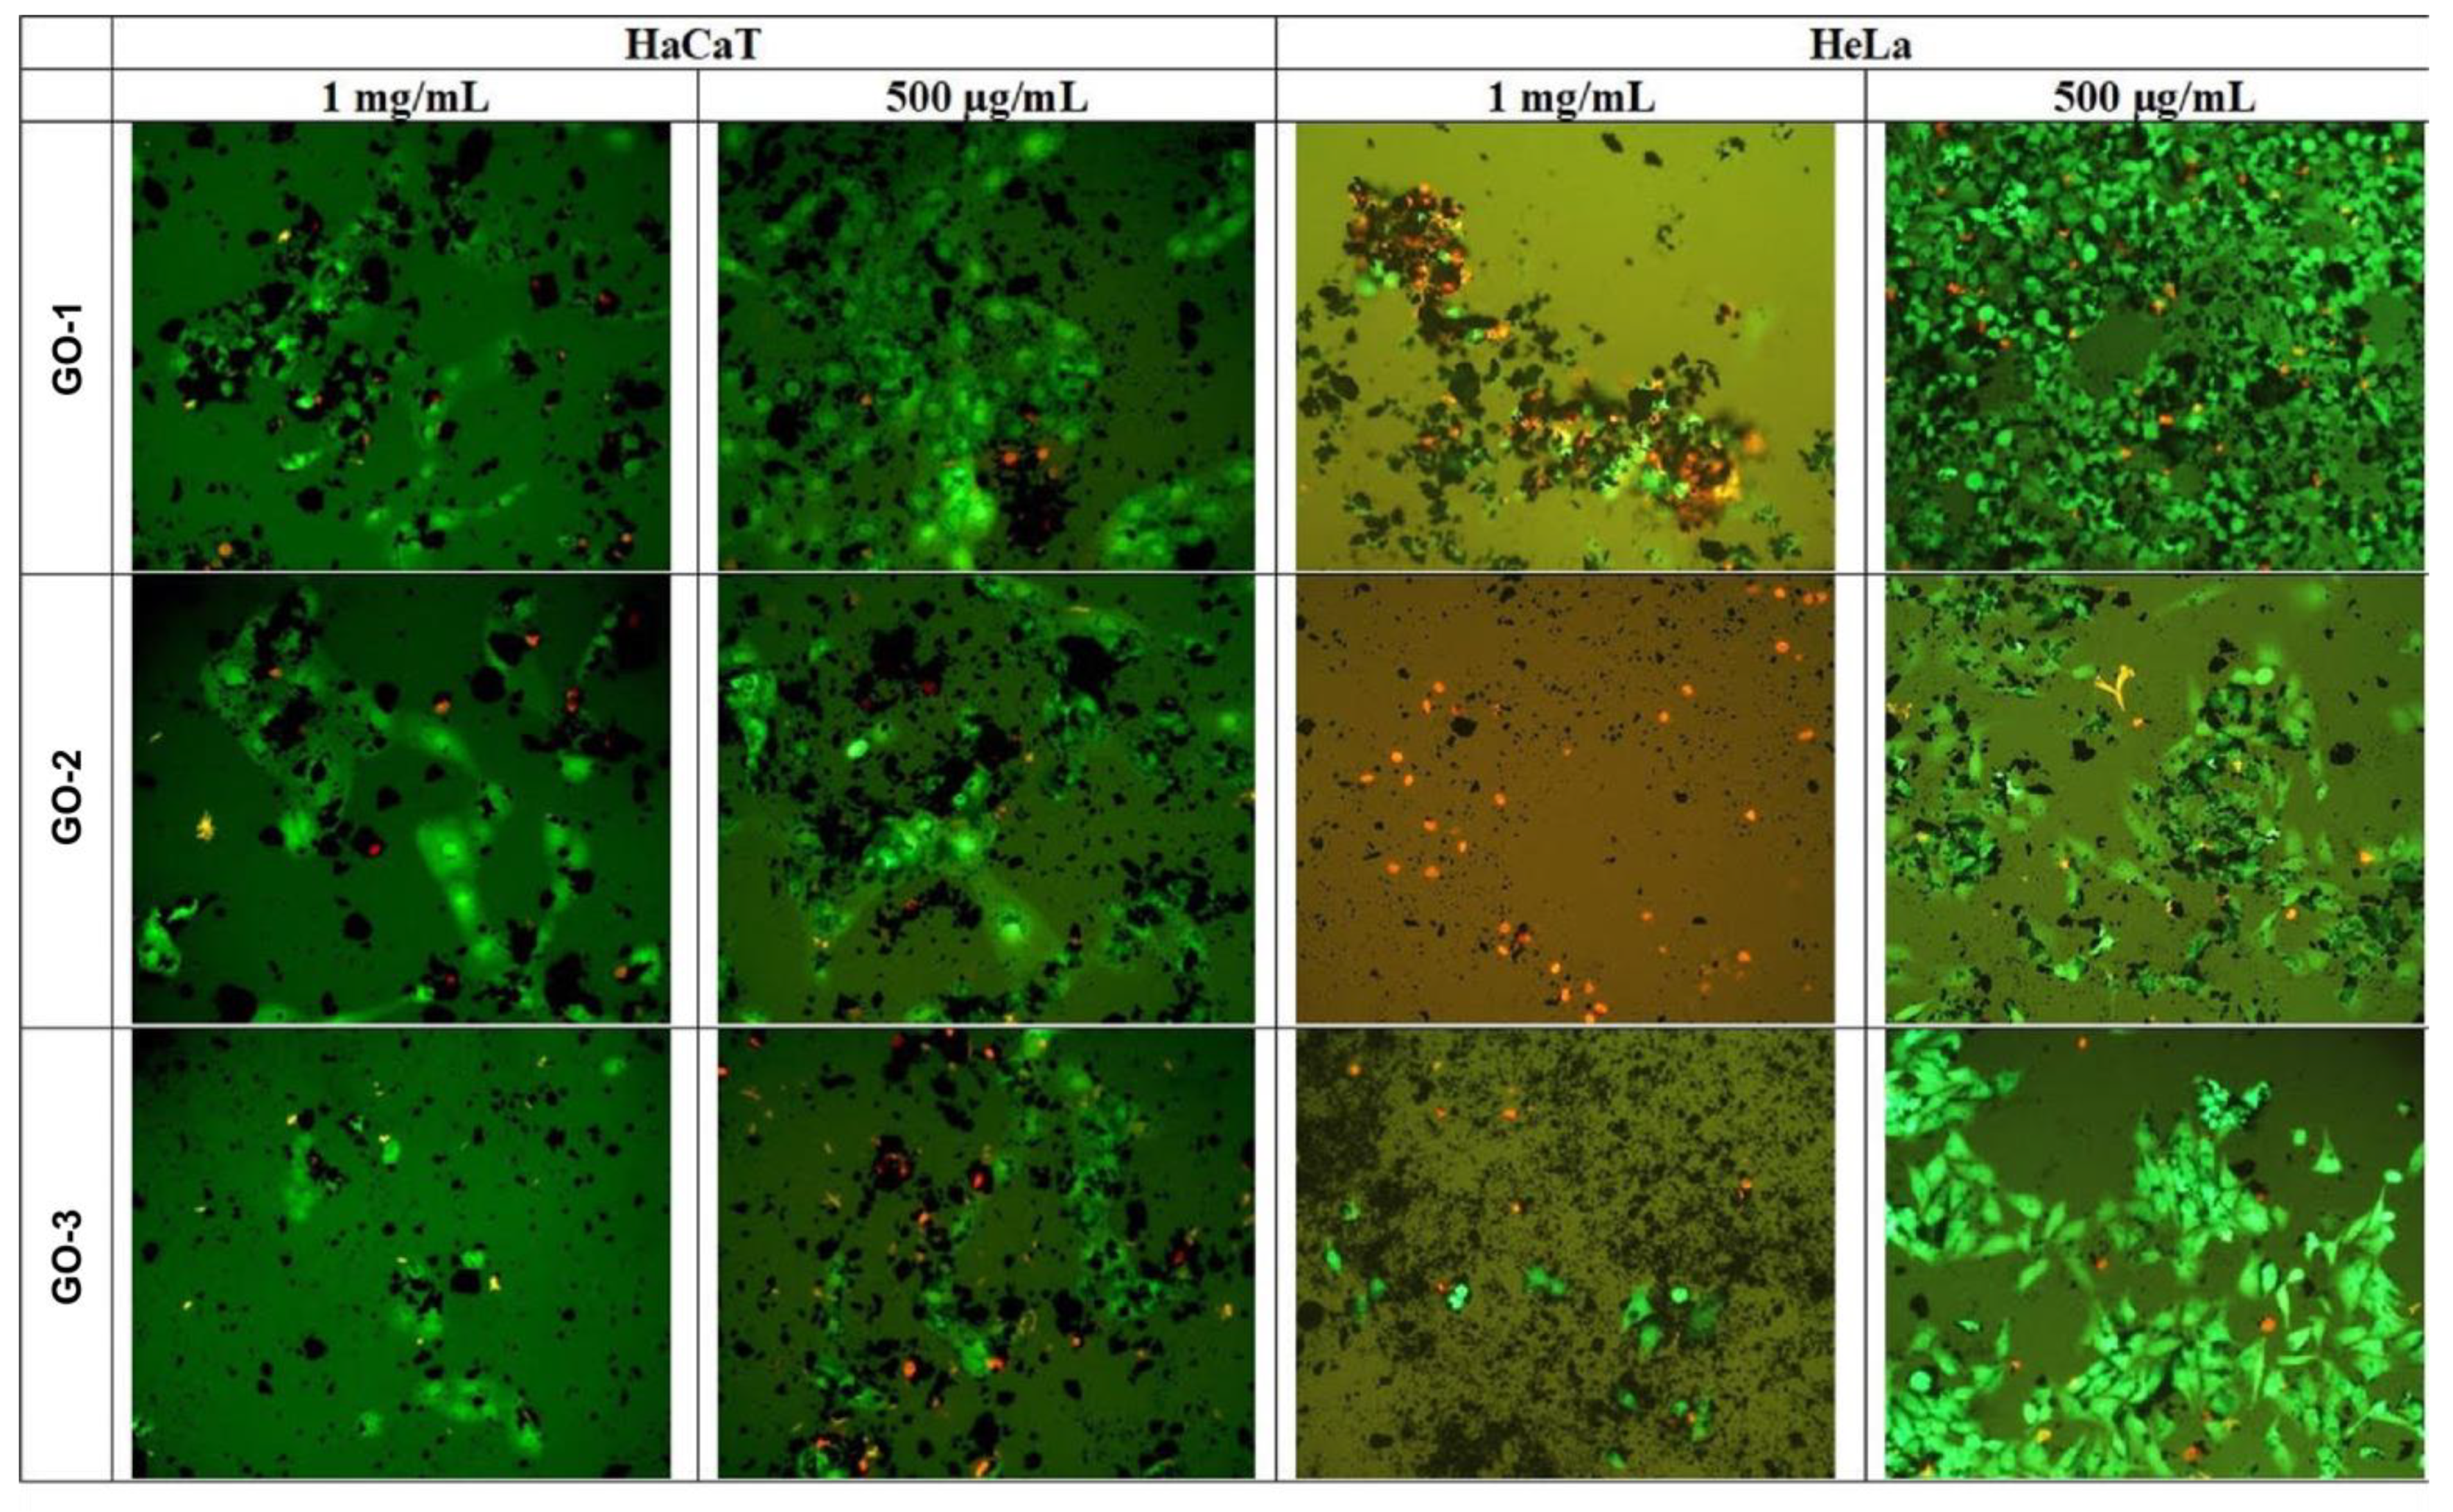
These results were confirmed through FDA-PI cell staining. FDA measures cell-membrane integrity and the enzymatic activity of the cells. FDA is an esterase substrate that is hydrolyzed to the AM ester that yields fluorescein. If FDA is a membrane-permeant dye, PI is a membrane-impermeant one, entering into the cells only when the membranes are affected. In this fluorescence assay, FDA stains viable cells in green while PI stains dead cells in red. At high concentrations, cell mortality has been increased and only a few cells from those that adhered to the surface of the flask were alive and stained green by the FDA (Figure 9).
Cell cycle analysis has shown that these substances are not affecting the cellular cycle of HeLa cells, as shown in Figure 10.
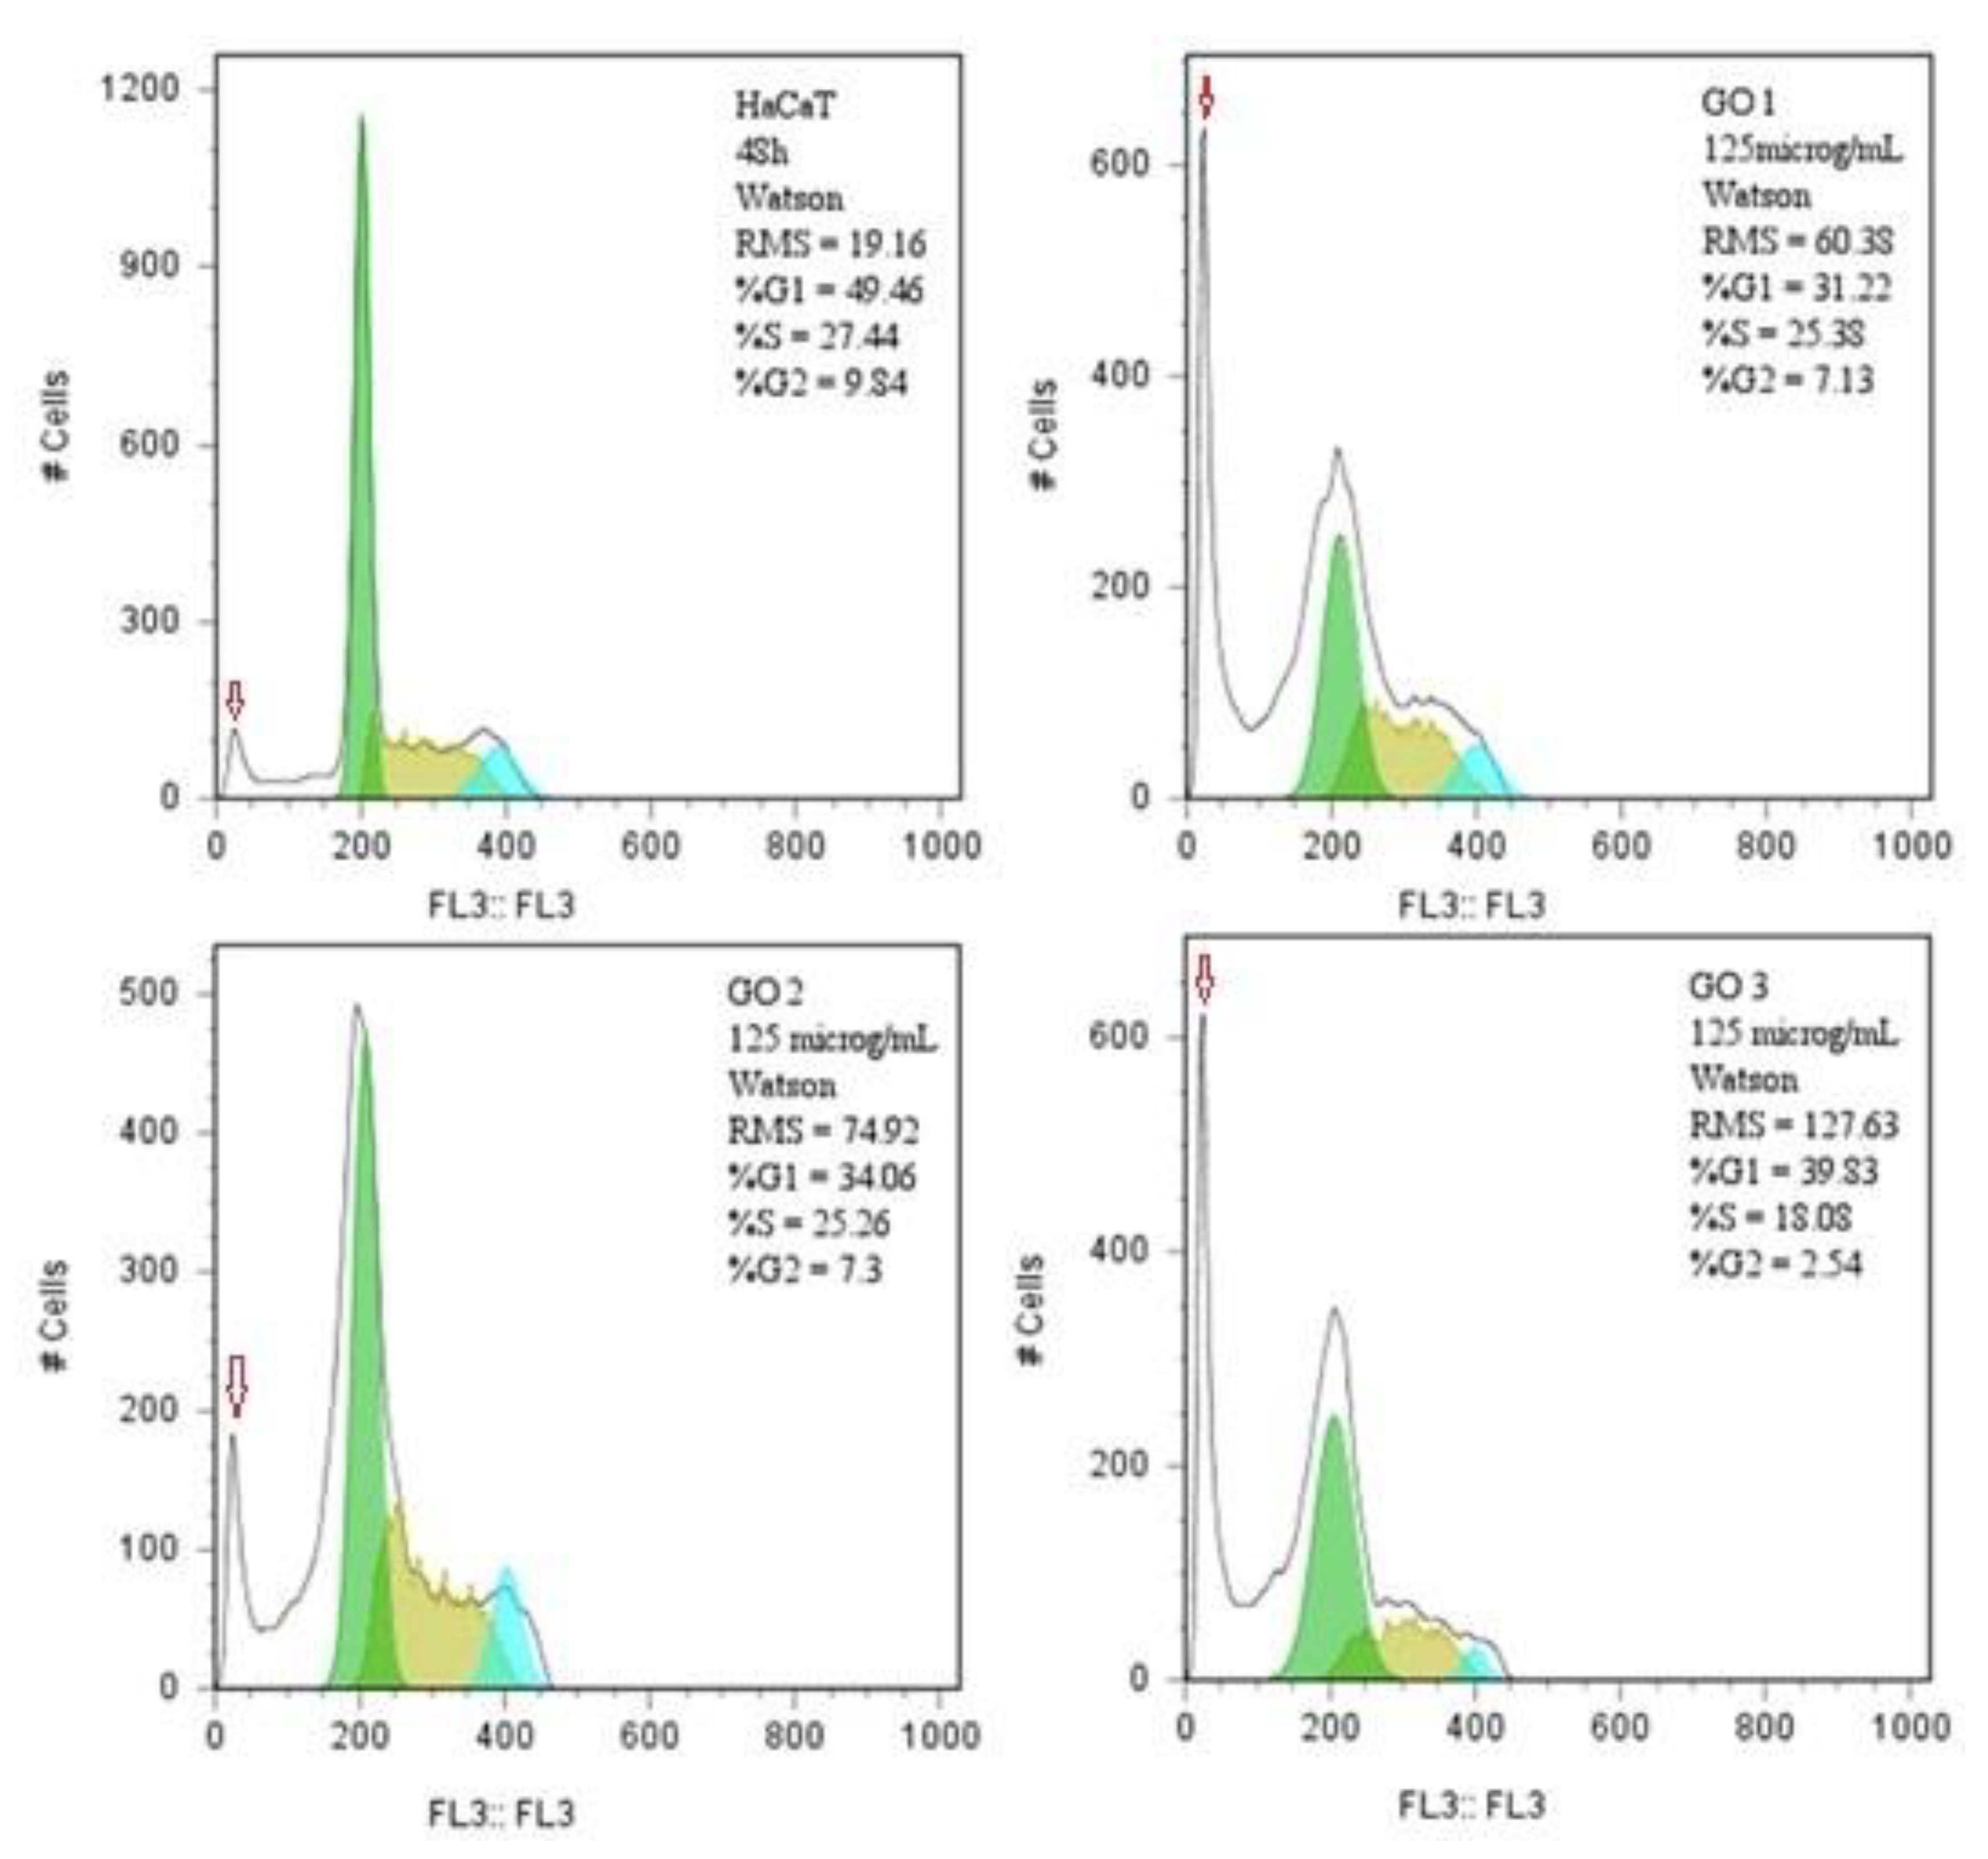
In contrast, HaCaT cell cycle is affected by the GO treatment, as revealed by the occurrence of a sub-GO peak (marked by a red arrow in Figure 11, generally associated with cellular death).
Overall, taken together, the results of the cytotoxicity and antimicrobial assays show that the active antimicrobial concentrations are generally higher than the cytotoxic ones, suggesting that more optimization studies are required in order to tailor these compounds for potential clinical applications. Additionally, they could be potentially used for developing novel disinfectants or antiseptics that could be applied on inert surfaces at higher concentrations.

4. Conclusions

In this research, graphene oxide–hydrazide derivatives were successfully synthesized through a slightly modified Hummer’s method and characterized using different spectroscopy (FTIR and Raman) and microscopy (SEM-EDS) techniques. The various functional groups specific of GO, as well as of functionalized GO-1, GO-2, and GO-3, were proved by FTIR and Raman spectra analyses. Taking into account the obtained values for the ratio between the D-band and G-band (i.e., 4.93 for GO-1, 4.50 for GO-2, and 3.17 for GO-3), it can be assumed that the number of defects in the GO functionalized with hydrazine is very low, but according to the data reported in the scientific literature, the G-band peak is influenced by the D-band (~1600 cm−1). From the Raman spectroscopy data, it can be concluded that the crystallite size calculated for the functionalized GO depends on the excitation wavelength. In addition, the SEM micrographs highlight that the GO functionalized with hydrazides leads to the formation of disordered nanostructures. This phenomenon could be accounted for by the existence of sp3 carbons and the formation of oxygen-containing functional groups in the basal planes and by various GO structural defects. The in vitro antimicrobial activity evaluation suggests that the functionalization of the graphene oxide with the three hydrazides does generally not improve their antimicrobial features against planktonic and biofilm cells, in comparison with the unfunctionalized graphene oxide and free hydrazides The cytotoxic concentrations are below the antimicrobial active ones; therefore, they cannot be used for in vivo applications, unless structure optimization is made. However, further bioevaluation studies could reveal other potential applications of the functionalized graphene oxides.

Author Contributions

Conceptualization, I.Z., C.R. and P.I.; methodology, I.Z., C.R., I.D.D., P.I., C.L., M.C.C., D.C.N., M.P. and C.B.; software, I.A.B. and S.G.S.; validation, I.Z. and C.R.; investigation, I.D.D., I.A.B., R.M.S., C.R., S.G.S., P.I., C.L., D.C.N., M.C.C., C.D.B., M.P., C.C., C.B., L.D.D. and I.Z.; resources, C.R. and C.L.; data curation, C.R., C.L. and I.Z.; writing—original draft preparation, I.Z., P.I., C.R., C.B, C.L., M.C.C. and I.D.D.; writing—review and editing, I.Z., C.R. and I.D.D.; visualization, I.Z., P.I. and C.R.; supervision, I.Z.; project administration, C.R.; funding acquisition, C.R. All authors have read and agreed to the published version of the manuscript.

Funding

This research was funded by the Competitiveness Operational Programme (COP) A1.1.4. ID: P_37_798 MyeloAL-EDiaProT, MyeloAL Project [SMIS 106774, 149/26 October 2016] and by the project CNFIS-FDI-2021-0075-ProResearch: Quality, Performance, Excellence—concepts for a stimulating and competitive environment in research (2021).

Institutional Review Board Statement

Not applicable.

Informed Consent Statement

Not applicable.

Data Availability Statement

Data sharing is not applicable to this article.

Conflicts of Interest

The authors declare no conflict of interest.

References

  1. Videira-Quintela, D.; Guillén, F.; Montalvo, G.; Martin, O. Silver, copper, and copper hydroxy salt decorated fumed silica hybrid composites as antibacterial agents. Colloids Surf. B Biointerfaces 2020, 195, 111216. [Google Scholar] [CrossRef]
  2. Tavakolian, M.; Jafari, S.M.; van de Ven, T.G.M. A review on surface-functionalized cellulosic nanostructures as biocompatible antibacterial materials. Nano-Micro Lett. 2020, 12, 1–23. [Google Scholar] [CrossRef] [Green Version]
  3. Menazea, A.; Ahmed, M. Synthesis and antibacterial activity of graphene oxide decorated by silver and copper oxide nanoparticles. J. Mol. Struct. 2020, 1218, 128536. [Google Scholar] [CrossRef]
  4. Turcu, I.; Zarafu, I.; Popa, M.; Chifiriuc, M.C.; Bleotu, C.; Culita, D.; Ghica, C.; Ionita, P. Lipoic acid gold nanoparticles functionalized with organic compounds as bioactive materials. Nanomaterials 2017, 7, 43. [Google Scholar] [CrossRef] [Green Version]
  5. Hummers, W.S., Jr.; Offeman, R.E. Preparation of graphitic oxide. J. Am. Chem. Soc. 1958, 80, 1339. [Google Scholar] [CrossRef]
  6. Novoselov, K.S.; Geim, A.K.; Morozov, S.V.; Jiang, D.; Zhang, Y.; Dubonos, S.V.; Grigorieva, I.V.; Firsov, A.A. Electric field effect in atomically thin carbon films. Science 2004, 306, 666–669. [Google Scholar] [CrossRef] [Green Version]
  7. Song, Q.; Jiang, Z.; Li, N.; Liu, P.; Liu, L.; Tang, M.; Cheng, G. Anti-inflammatory effects of three-dimensional graphene foams cultured with microglial cells. Biomaterials 2014, 35, 6930–6940. [Google Scholar] [CrossRef]
  8. Luo, J.; Lai, J.; Zhang, N.; Liu, Y.; Liu, R.; Liu, X. Tannic acid induced self-assembly of three-dimensional graphene with good adsorption and antibacterial properties. ACS Sustain. Chem. Eng. 2016, 4, 1404–1413. [Google Scholar] [CrossRef]
  9. Jakus, A.E.; Secor, E.B.; Rutz, A.L.; Jordan, S.W.; Hersam, M.C.; Shah, R.N. Three-dimensional printing of high-content graphene scaffolds for electronic and biomedical applications. ACS Nano 2015, 9, 4636–4648. [Google Scholar] [CrossRef]
  10. Si, C.; Sun, Z.; Liu, F. Strain engineering of graphene: A review. Nanoscale 2016, 8, 3207–3217. [Google Scholar] [CrossRef]
  11. Ullah, S.; Hasan, M.; Ta, H.Q.; Zhao, L.; Shi, Q.; Fu, L.; Choi, J.-H.; Yang, R.; Liu, Z.; Rümmeli, M.H. synthesis of doped porous 3d graphene structures by chemical vapor deposition and its applications. Adv. Funct. Mater. 2019, 29, 1904457. [Google Scholar] [CrossRef]
  12. Maab, R.; Zhouab, Y.; Bia, H.; Yangbc, M.; Wangab, J.; Liua, Q.; Huanga, F. Multidimensional graphene structures and beyond: Unique properties, syntheses and applications. Prog. Mater. Sci. 2020, 113, 100665. [Google Scholar] [CrossRef]
  13. Pavan, F.R.; Maia, P.I.D.S.; Leite, S.R.; Deflon, V.M.; Batista, A.A.; Sato, D.N.; Franzblau, S.G.; Leite, C.Q. Thiosemicarbazones, semicarbazones, dithiocarbazates and hydrazide/hydrazones: Anti-Mycobacterium tuberculosis activity and cytotoxicity. Eur. J. Med. Chem. 2010, 45, 1898–1905. [Google Scholar] [CrossRef]
  14. Vicini, P.; Zani, F.; Cozzini, P.; Doytchinova, I. Hydrazones of 1,2-benzisothiazole hydrazides: Synthesis, antimicrobial activity and QSAR investigations. Eur. J. Med. Chem. 2002, 37, 553–564. [Google Scholar] [CrossRef]
  15. Visbal, G.; Marchán, E.; Maldonado, A.; Simoni, Z.; Navarro, M. Synthesis and characterization of platinum–sterol hydrazone complexes with biological activity against Leishmania (L.) mexicana. J. Inorg. Biochem. 2008, 102, 547–554. [Google Scholar] [CrossRef]
  16. Gemma, S.; Kukreja, G.; Fattorusso, C.; Persico, M.; Romano, M.P.; Altarelli, M.; Savini, L.; Campiani, G.; Fattorusso, E.; Basilico, N.; et al. Synthesis of N1-arylidene-N2-quinolyl- and N2-acrydinylhydrazones as potent antimalarial agents active against CQ-resistant P. falciparum strains. Bioorg. Med. Chem. Lett. 2006, 16, 5384–5388. [Google Scholar] [CrossRef]
  17. Vicini, P.; Incerti, M.; Doytchinova, I.; La Colla, P.; Busonera, B.; Loddo, R. Synthesis and antiproliferative activity of benzo[d]isothiazole hydrazones. Eur. J. Med. Chem. 2006, 41, 624–632. [Google Scholar] [CrossRef]
  18. Silva, G.A.; Costa, L.M.; Brito, F.C.; Miranda, A.L.; Barreiro, E.J.; Fraga, C.A. New class of potent antinociceptive and antiplatelet 10H-phenothiazine-1-acylhydrazone derivatives. Bioorg. Med. Chem. 2004, 12, 3149–3158. [Google Scholar] [CrossRef]
  19. Kulandasamy, R.; Adhikari, A.V.; Stables, J.P. A new class of anticonvulsants possessing 6Hz activity: 3,4-Dialkyloxy thiophene bishydrazones. Eur. J. Med. Chem. 2009, 44, 4376–4384. [Google Scholar] [CrossRef]
  20. Sztanke, M.; Sztanke, K. Biologically important hydrazide-containing fused azaisocytosines as antioxidant agents. Redox Rep. 2017, 22, 572–581. [Google Scholar] [CrossRef] [Green Version]
  21. Zhang, S.-L.; Damu, G.L.; Zhang, L.; Geng, R.-X.; Zhou, C.-H. Synthesis and biological evaluation of novel benzimidazole derivatives and their binding behavior with bovine serum albumin. Eur. J. Med. Chem. 2012, 55, 164–175. [Google Scholar] [CrossRef]
  22. Supuran, C.T. How many carbonic anhydrase inhibition mechanisms exist? J. Enzym. Inhib. Med. Chem. 2015, 31, 345–360. [Google Scholar] [CrossRef]
  23. E Boyd, A. Sulfonylurea receptors, ion channels, and fruit flies. Diabetes 1988, 37, 847–850. [Google Scholar] [CrossRef]
  24. Al-Otaibi, F. An overview of structurally diversified anticonvulsant agents. Acta Pharm. 2019, 69, 321–344. [Google Scholar] [CrossRef] [Green Version]
  25. Carta, F.; Supuran, C.T.; Scozzafava, A. Sulfonamides and their isosters as carbonic anhydrase inhibitors. Future Med. Chem. 2014, 6, 1149–1165. [Google Scholar] [CrossRef]
  26. Rotaru, I.D.; Nuta, D.C.; Chirita, I.C.; Caproiu, M.T.; Limban, C.; Missir, A.V.; Chirita, C. New synthesis in the N-[4[(phenylcarbamoyl)amino]-phenyl]benzenesulfonamide derivatives series. Farmacia 2016, 64, 828–833. [Google Scholar]
  27. De Souza, G.D.; Rodrigues, M.A.; Silva-Caldeira, P.; Maia, E.C.P.; Botelho, F.; De Campos, T.A.; Franca, E.; De Almeida, K.J.; Guerra, W. A new complex of palladium(II) with 2-furoic hydrazide: Synthesis, characterization, theoretical calculations and biological studies. Croat. Chem. Acta 2013, 86, 201–206. [Google Scholar] [CrossRef]
  28. Haseena Banu, B.; Prasad, K.V.S.R.G.; Bharathi, K. Biological importance of quinazolin-4-one scaffold and its derivatives—A brief update. Int. J. Pharm. Pharm. Sci. 2015, 7, 1–7. [Google Scholar]
  29. Bratu, M.; Olaru, O.T.; Chirita, I.C.; Dinu, M.; Anghel, A.I. Phytobiological testing of some compounds with 4(3H)-quinazolone structure. Farmacia 2014, 62, 929–941. [Google Scholar]
  30. Marcano, D.C.; Kosynkin, D.V.; Berlin, J.M.; Sinitskii, A.; Sun, Z.; Slesarev, A.; Alemany, L.B.; Lu, W.; Tour, J.M. Improved synthesis of graphene oxide. ACS Nano 2010, 4, 4806–4814. [Google Scholar] [CrossRef]
  31. Tudose, M.; Anghel, E.M.; Culita, D.; Somacescu, S.; Calderon-Moreno, J.; Tecuceanu, V.; Dumitrascu, F.D.; Dracea, O.; Popa, M.; Marutescu, L.; et al. Covalent coupling of tuberculostatic agents and graphene oxide: A promising approach for enhancing and extending their antimicrobial applications. Appl. Surf. Sci. 2019, 471, 553–565. [Google Scholar] [CrossRef]
  32. Zarafu, I.; Turcu, I.; Culiță, D.C.; Petrescu, S.; Popa, M.; Chifiriuc, M.C.; Limban, C.; Telehoiu, A.; Ioniță, P. Antimicrobial features of organic functionalized graphene-oxide with selected amines. Materials 2018, 11, 1704. [Google Scholar] [CrossRef] [Green Version]
  33. Avramescu, S.; Petrescu, S.; Culita, D.C.; Tudose, M.; Hanganu, A.; Zarafu, I.; Ionita, P. A mixed organic functionalized silica-graphene oxide as advanced material for pollutant removal. J. Nanopart. Res. 2020, 22, 1–9. [Google Scholar] [CrossRef]
  34. Capasso, C.; Supuran, C.T. Sulfa and trimethoprim-like drugs—Antimetabolites acting as carbonic anhydrase, dihydropteroate synthase and dihydrofolate reductase inhibitors. J. Enzym. Inhib. Med. Chem. 2013, 29, 379–387. [Google Scholar] [CrossRef]
  35. Stecoza, C.E.; Caproiu, M.T.; Draghici, C.; Chifiriuc, M.C.; Dracea, N.O. Synthesis, characterization and antimicrobial activity evaluation of some new derivatives of 6,11-dihydrodibenzo[b,e]thiepin 5,5-dioxide. Rev. Chim. 2009, 60, 137–141. [Google Scholar]
  36. Patrinoiu, G.; Calderón-Moreno, J.M.; Chifiriuc, M.C.; Saviuc, C.; Birjega, R.; Carp, O. Tunable ZnO spheres with high anti-biofilm and antibacterial activity via a simple green hydrothermal route. J. Colloid Interface Sci. 2016, 462, 64–74. [Google Scholar] [CrossRef]
  37. AAT Bioquest Inc. Quest Graph™ IC50 Calculator. 2020. Available online: https://www.aatbio.com/tools/ic50-calculator (accessed on 20 August 2020).
  38. Nitulescu, G.M.; Matei, L.; Aldea, I.M.; Draghici, C.; Olaru, O.T.; Bleotu, C. Ultrasound-assisted synthesis and anticancer evaluation of new pyrazole derivatives as cell cycle inhibitors. Arab. J. Chem. 2019, 12, 816–824. [Google Scholar] [CrossRef] [Green Version]
  39. Zanni, E.; Chandraiahgari, C.R.; De Bellis, G.; Montereali, M.R.; Armiento, G.; Ballirano, P.; Polimeni, A.; Sarto, M.S.; Uccelletti, D. Zinc Oxide Nanorods-Decorated Graphene Nanoplatelets: A Promising Antimicrobial Agent against the Cariogenic Bacterium Streptococcus mutans. Nanomaterials 2016, 6, 179. [Google Scholar] [CrossRef]
  40. Jiao, T.; Hu, J.; Zhang, Q.; Xiao, Y. Preparation and Self-assembly of Functionalized Nanocomposites and Nanomaterials—Relationship Between Structures and Properties. In Nanomaterials—Toxicity and Risk Assessment; IntechOpen: London, UK, 2015; pp. 177–210. [Google Scholar]
  41. Dobrota, A.S.; Pašti, I.A.; Mentus, S.V.; Skorodumova, N.V. A general view on the reactivity of the oxygen-functionalized graphene basal plane. Phys. Chem. Chem. Phys. 2016, 18, 6580–6586. [Google Scholar] [CrossRef] [Green Version]
  42. Loryuenyong, V.; Totepvimarn, K.; Eimburanapravat, P.; Boonchompoo, W.; Buasri, A. preparation and characterization of reduced graphene oxide sheets via water-based exfoliation and reduction methods. Adv. Mater. Sci. Eng. 2013, 2013, 1–5. [Google Scholar] [CrossRef] [Green Version]
  43. Andrei, V.A.; Radulescu, C.; Malinovschi, V.; Marin, A.; Coaca, E.; Mihalache, M.; Mihailescu, C.N.; Dulama, I.D.; Teodorescu, S.; Bucurica, I.A. Aluminum oxide ceramic coatings on 316l austenitic steel obtained by plasma electrolysis oxidation using a pulsed unipolar power supply. Coatings 2020, 10, 318. [Google Scholar] [CrossRef] [Green Version]
  44. Malinovschi, V.; Marin, A.H.; Andrei, V.; Coaca, E.; Mihailescu, C.; Lungu, C.P.; Radulescu, C.; Dulama, I.D. Obtaining and characterization of PEO layers prepared on CP-Ti in sodium dihydrogen phosphate dihydrate acidic electrolyte solution. Surf. Coat. Technol. 2019, 375, 621–636. [Google Scholar] [CrossRef]
  45. David, M.; Serban, A.; Radulescu, C.; Danet, A.F.; Florescu, M. Bioelectro chemical evaluation of plant extracts and gold nanozyme-based sensors for total antioxidant capacity determination. Bioelectrochemistry 2019, 129, 124–134. [Google Scholar] [CrossRef]
  46. Radulescu, C.; Olteanu, R.L.; Stihi, C.; Florescu, M.; Lazurca, D.; Dulama, I.D.; Stirbescu, R.M.; Teodorescu, S. Chemometric Assessment of Spectroscopic Techniques and Antioxidant Activity for Hippophae rhamnoides L. Extracts Obtained by Different Isolation Methods. Anal. Lett. 2019, 52, 2393–2415. [Google Scholar] [CrossRef]
  47. Zarafu, I.; Matei, L.; Bleotu, C.; Ionita, P.; Tatibouët, A.; Păun, A.; Nicolau, I.; Hanganu, A.; Limban, C.; Nuta, D.; et al. Synthesis, characterization, and biologic activity of new acyl hydrazides and 1,3,4-oxadiazole derivatives. Molecules 2020, 25, 3308. [Google Scholar] [CrossRef] [PubMed]
  48. Kumar, N.; Srivastava, V.C. Simple synthesis of large graphene oxide sheets via electrochemical method coupled with oxidation process. ACS Omega 2018, 3, 10233–10242. [Google Scholar] [CrossRef]
  49. Shahriary, L.; Athawale, A.A. Graphene oxide synthesized by using modified hummers approach. Int. J. Renew Energy Env. Eng. 2014, 2, 58–63. [Google Scholar]
  50. Guerrero-Contreras, J.; Caballero-Briones, F. Graphene oxide powders with different oxidation degree, prepared by synthesis variations of the Hummers method. Mater. Chem. Phys. 2015, 153, 209–220. [Google Scholar] [CrossRef]
  51. Rădulescu, C.; Ioniţă, I.; Hossu, A. Synthesis of linear bis-thiazolo[2,3-d][8,9-d]trans-quinacridone. Dye. Pigment. 2005, 65, 175–177. [Google Scholar] [CrossRef]
  52. Innocenti, F.; Milani, A.; Castiglioni, C. Can Raman spectroscopy detect cumulenic structures of linear carbon chains? J. Raman Spectrosc. 2009, 41, 226–236. [Google Scholar] [CrossRef]
  53. Ferrari, A.C. Raman spectroscopy of graphene and graphite: Disorder, electron–phonon coupling, doping and nonadiabatic effects. Solid State Commun. 2007, 143, 47–57. [Google Scholar] [CrossRef]
  54. Ferrari, A.C.; Basko, D.M. Raman spectroscopy as a versatile tool for studying the properties of graphene. Nat. Nanotechnol. 2013, 8, 235–246. [Google Scholar] [CrossRef] [Green Version]
  55. Negrea, A.; Bacinschi, Z.; Bucurica, I.A.; Teodorescu, S.; Stirbescu, R. A new material for bipolar plates used in fuel cells. Rom. J. Phys. 2016, 61, 527–535. [Google Scholar]
  56. King, A.; Davies, B.R.; Noorbehesht, N.; Newman, P.; Church, T.L.; Harris, A.T.; Razal, J.; Minett, A.I. A new raman metric for the characterisation of graphene oxide and its derivatives. Sci. Rep. 2016, 6, 19491. [Google Scholar] [CrossRef] [Green Version]
  57. Verma, S.; Dutta, R.K. Development of cysteine amide reduced graphene oxide (CARGO) nano-adsorbents for enhanced uranyl ions removal from aqueous medium. J. Environ. Chem. Eng. 2017, 5, 4547–4558. [Google Scholar] [CrossRef]
  58. Smith, S.; Waters, V.; Jahnke, N.; Ratjen, F. Standard versus biofilm antimicrobial susceptibility testing to guide antibiotic therapy in cystic fibrosis. Cochrane Database Syst. Rev. 2020, 2021, CD009528. [Google Scholar] [CrossRef]
  59. Rashdan, H.; Nasr, S.; El-Refai, H.A.; Abelaziz, M. A novel approach of potent antioxidant and antimicrobial agents containing coumarin moiety accompanied with cytotoxicity studies on the newly synthesized derivatives. J. Appl. Pharm. Sci. 2017, 7, 186–196. [Google Scholar] [CrossRef] [Green Version]
Figure 1. Hydrazides used for the synthesis of new functionalized graphene oxide: GO-1 graphene oxide functionalized with H1 (i.e., 2-furancarboxylic acid hydrazide); GO-2 graphene oxide functionalized with H2 (i.e., 4-(benzensulfonamido)benzoic acid hydrazide); GO-3 graphene oxide functionalized with H3 (i.e., 2-(2-methyl-4-oxoquinazolin-3(4H)-yl)-acetohydrazide).
Coatings 12 00045 g001
Figure 2. Synthesis of functionalized graphene oxide (* is marks the linkage position) with hydrazides.
Coatings 12 00045 g002
Figure 3. SEM photomicrographs of: (a) initial graphene oxide with compact thick layers (×3 k); (b) GO-1 lamellar structure (×10 k); (c) GO-1 lamellar structure (×35 k); (d) GO-1 lamellar structure (×130 k); (e) GO-2 flakes structure (×8 k); (f) GO-2 flakes structure (×15 k); (g) GO-2 flakes structure (×15 k); (h) GO-3 acicular structure (×2.5 k); (i) GO-3 acicular structure (×6 k); (j) GO-3 acicular structure (×10 k).
Coatings 12 00045 g003aCoatings 12 00045 g003b
Figure 4. Overlap of FTIR spectra for graphene oxide functionalized with hydrazides: GO-1, graphene oxide-2-furanecarboxylic acid hydrazide; GO-2, graphene oxide-4-(benzensulfonamido)benzoic acid hydrazide; GO-3, graphene oxide-2-(2-methyl-4-oxoquinazolin-3(4H)-yl)-acetohydrazide.
Coatings 12 00045 g004
Figure 5. Overlap of Raman spectra for graphene oxide functionalized with hydrazides: GO-1, graphene oxide-2-furanecarboxylic acid hydrazide; GO-2, graphene oxide-4-(benzensulfonamido)benzoic acid hydrazide; GO-3, graphene oxide-2-(2-methyl-4-oxoquinazolin-3(4H)-yl)-acetohydrazide.
Coatings 12 00045 g005
Figure 6. The MIC values of the tested compounds (presented values were calculated as the average of three replicates). The results for antibiotics are not represented, as the MIC values were much lower, i.e., in the range of 0.016 and 2.5 µg/mL.
Coatings 12 00045 g006
Figure 7. The MBEC values of the tested compounds (presented values were calculated as the average of three replicates). The results for antibiotics are not represented as the MIC values were much lower, i.e., in the range of 0.064 and 5 µg/mL.
Coatings 12 00045 g007
Figure 8. Effect of GO treatment on viability of HeLa cells and HaCaT cells. The results are presented as percent of treated/affected cells reported to untreated cells.
Coatings 12 00045 g008
Figure 9. Fluorescence microscopy images of HaCaT and HeLa cells exposed to different concentrations of GO-1, 2, and 3 and stained by FDA and PI (200×).
Coatings 12 00045 g009
Figure 10. Overlaid histograms of GO treatment in HeLa cells.
Coatings 12 00045 g010
Figure 11. The effects induced by the treatment with functionalized graphenes on the HaCaT cell cycle progression (analysis at 48 h).
Coatings 12 00045 g011
Table 1. The elemental composition determined by FE-SEM-EDS in the studied samples, expressed in wt. % ± S.D.%, normalized to 100 wt. %.
SampleGOGO-1GO-2GO-3
Element
C62.84 ± 0.2976.69 ± 0.3376.05 ± 0.2976.36 ± 0.38
Nnd *7.87 ± 0.085.99 ± 0.088.00 ± 0.18
O33.42 ± 0.2211.82 ± 0.1813.08 ± 0.2214.97 ± 0.35
Nand *nd *0.06 ± 0.01nd *
Mgnd *nd *0.04 ± 0.01nd *
Al0.14 ± 0.010.05 ± 0.010.13 ± 0.010.04 ± 0.01
Sind *0.05 ± 0.010.21 ± 0.010.15 ± 0.01
S2.15 ± 0.042.25 ± 0.011.59 ± 0.01nd *
Cl0.82 ± 0.051.10 ± 0.010.72 ± 0.010.28 ± 0.01
K0.63 ± 0.030.17 ± 0.011.82 ± 0.020.20 ± 0.02
Cand *nd *0.31 ± 0.02nd *
nd *—undetermined element or with concentration < LOD (0.01 wt.%).
Table 2. The tentative assignment of significant FTIR spectra peaks.
Wavenumber (cm−1) & Relative Intensity *Vibrational Assignment
GOGO-1GO-2GO-3
3680 w3687 w3690 w3689 wO–H stretching
3641 w3646 w3639 w3641 wO–H stretching
3620 w3627 w3622 w3629 wO–H stretching
3408 m3412 m3413 m3410 m–OH stretch in carboxylic; C–OH group (GO)
3316 s3318 s3327 sN–H proton stretching vibration from amide
3293 s3289 m3302 sN–H proton stretching vibration
3229 mN–H stretching vibration of sulfonamide
3169 m3161 m3170 m3162 mC–H stretching of hydrocarbon
3107 m3051 wC–H stretching from furan cycle; C–H stretching of hydrocarbon
2976 m2978 w2980 m2971 wC–H stretching vibration
2350 w2355 m2354 w2354 wC=O stretching vibration
2206 wC–N, N-H stretching hydrazide
2108 wC=C stretching vibration from furan cycle
1989 wC=C stretching vibration from furan cycle
1962 wC=C stretching vibration from furan cycle
1720 m1724 m1727 m1731 mC=O stretching vibrations in carboxylic (GO)
1682 m1682 mC=C aromatic ring; N-C=O stretching on quinazolin-4-one
1630 s1633 s1632 s1635 sC=C aromatic stretch (GO); C=O with molecular bond δ from amide
1616 m1614 m1616 m1615 mC=C stretching vibration from aromatic ring (GO)
1562 w1545 w1554 w1570 wC=C stretching vibration (GO)
1538 w1533 w1539 wC–N, N–H stretching vibration from hydrazide group
1516 w1517 m1523 wC–N, N–H stretching vibration from hydrazide group
1470 w1471 m1473 mC–N of stretching vibration from hydrazide group
1455 w1446 m1444 mC–N stretching vibration from hydrazide group
1404 m1405 m1408 m1409 mC–O–H stretching vibration (GO)
1388 m1390 m1389 m1389 mC-OH stretching vibration (GO)
1347 w1334 w1331 w1347 wC–OH stretching vibration from GO; S=O stretching of –SO2–NH– group (sulfonamide)
1319 m1322 m1326 mC–N stretching vibration from hydrazide group
1238 m1240 m1239 m1236 mC–O–C stretching vibration (GO)
1221 m1227 m1224 m1229 mC–OH stretching vibration (GO)
1180 sS=O stretch from –SO2–NH– group (sulfonamide)
1187 m1145 mC=O–C stretch of furan cycle; N–C=O on cycle
1085 m1082 m1085 m1086 mC–O–C stretching vibration (GO)
-903 wS–N stretching vibration from –SO2–N
802 wC–H stretching vibration from furan cycle
787 wC–H stretching vibration from furan cycle
752 wC–H stretching vibration from furan cycle
698 w706 w716 w697 wC–H stretching vibration (GO)
* w = weak, m = medium, s = strong.
Table 3. The tentative assignment of significant Raman spectra peaks.
Wavenumber (cm−1) & Relative Intensity *Vibrational Assignment
GOGO-1GO-2GO-3
1680 w1680 wC=C aromatic stretch; N-C=O stretching vibration from quinazolin-4-one
1622 w1623 w1628 w1631 wC=C aromatic stretch (GO)
1573 s1579 s1558 s1571 sC=C stretching vibration mode of sp2 hybridized carbon atoms (GO)
1533 m1538 m1542 mC–N, N–H stretching vibration from hydrazide group
1516 m1517 m1523 mC–N, N–H stretching vibration from hydrazide group
1471 m1473 m1479 mC–N of stretching vibration from hydrazide group
1452 w1457 m1459 mC–N stretching vibration from hydrazide group
1424 w1417 w1428 w1419 wC–O–H stretching vibration (GO)
1348 s1355 s1346 s1351 sC–OH stretching vibration from GO
1230 w1223 w1227 w1216 wC–O–C stretching vibration (GO)
1220 w1217 w1223 w1229 mC–OH stretching vibration (GO)
1165 mS=O stretch from –SO2-NH– group (sulfonamide)
1181 m1128 wC=O–C stretching from furan cycle; N–C=O on cycle
1080 m1089 m1091 m1090 mC–O–C stretching vibration (GO)
910 mS–N stretching vibrations from –SO2–N
801 mC–H stretching vibration from furan cycle
780 mC–H stretching vibration from furan cycle
751 mC–H stretching vibration from furan cycle
690 m704 m721 m695 mC–H stretching vibration (GO)
691 mS=O stretching from –SO2 group
659 mC–H stretching vibration from furan cycle
635 mS=O stretching vibration from –SO2 group
584 m584 m585 mC=O stretching vibration from amide group
* w = weak, m = medium, s = strong.
Table 4. The IC50 values (µg/mL) of the GO-1,2,3.
Cell LineHeLaHaCaT
Functionalized graphene oxideGO-1GO-2GO-3GO-1GO-2GO-3
IC50 (µg/mL)417.69448.47569.62201.43181.13186.45
Publisher’s Note: MDPI stays neutral with regard to jurisdictional claims in published maps and institutional affiliations.