Article

Controllable Preparation of Fe3O4@RF and Its Evolution to Yolk–Shell-Structured Fe@C Composite Microspheres with High Microwave Absorbing Performance

China Research Institute of Radiowave Propagation, Qingdao 266107, China
*
Author to whom correspondence should be addressed.
Coatings 2022, 12(1), 62; https://doi.org/10.3390/coatings12010062
Submission received: 30 November 2021 / Revised: 26 December 2021 / Accepted: 29 December 2021 / Published: 6 January 2022

Abstract

:
Fe3O4@RF microspheres with different phenolic (RF) layer thicknesses are prepared by adjusting the polymerization time. With the prepared Fe3O4@RF as the precursor, Fe@C composite microspheres with rattle-like morphology are obtained through one-step controlled carbonization. This method simplifies the preparation of rattle-shaped microspheres from sandwich microspheres. Fe@C microspheres exhibit excellent microwave absorbing properties. The morphology and composition of the product are investigated depending on the effects of carbonization temperature, time and thickness of the RF layer. When the carbonization temperature is 700 °C, the carbonization time is 12 h and the polymer shell thickness is 62 nm, the inner hollow Fe3O4 is completely reduced to Fe. The absorption properties of the materials are compared before and after the reduction of Fe3O4. Both Fe@C-12 and Fe3O4@C-700 show excellent absorbing properties. When the filler content is 50%, the maximum reflection loss (RLmax) of the rattle-shaped Fe@C microspheres is −50.15 dB, and the corresponding matching thickness is 3.5 mm. At a thickness of 1.7 mm, the RLmax of Fe3O4@C-700 is −44.42 dB, which is slightly worse than that of Fe@C-12. Both dielectric loss and magnetic loss play a vital role in electromagnetic wave absorption. This work prepares rattle-shaped absorbing materials in a simple way, which has significance for guiding the construction of rattle-shaped materials.

1. Introduction

As an effective means to prevent electromagnetic radiation and realize electromagnetic stealth, microwave absorbers have attracted more and more attention in civil and military fields [1,2]. With the diversification of radiation sources and radiation forms, and the upgrading of monitoring devices in electromagnetic countermeasures, new and high requirements for the performance of microwave absorbers are constantly being put forward. The wave absorber is required to have a high absorption capacity and a wide absorption band, as well as lightness, thin thickness, high thermal stability, oxidation resistance and corrosion resistance. In terms of improving the performance of the wave absorber, the choice of suitable raw materials and a reasonable microstructure are crucial [3,4,5].
Studies have shown that porous or hollow nanostructures exhibit strong interface polarization and multiple reflection capabilities, which can help improve the electromagnetic wave (EMW) absorption capability of materials [6]. Carbon material is an ideal choice for practical application because of its inherent hydrophobicity, good thermal stability and electrical conductivity, low original density and excellent chemical corrosion resistance [7]. Meanwhile, the low density caused by the above structure will give the wave-absorbing coating lightweight performance. The precursors of hollow carbon materials are prepared using the template method and then by etching and carbonization. Xu et al. [8] prepared SiO2 nanoparticles by Stöber hydrolysis and used them as seeds to react with resorcinol and formaldehyde to prepare SiO2@RF microspheres; they were then carbonized in an argon atmosphere and etched with hydrofluoric acid to obtain mesoporous carbon hollow microspheres (PCHMs). When the filler content was 20 wt% and the thickness was 3.9 mm, the maximum reflection loss (RLmax) of PCHMs at 8.2 GHz reached −84 dB, and the effective absorption bandwidth (EAB) was 4.8 GHz. Wang et al. [9] used super-crosslinked tubular polymer nanofibers as a precursor to carbonization to obtain tubular carbon nanofibers (TCNFs) with secondary pores. When the filler content was 10%, the RLmax was −61.5 dB, and the EAB was 4.25 GHz.
Magnetic materials are considered to be one of the most promising materials for broadband microwave absorption, but, generally, the RLmax of pure magnetic nanoparticles are relatively small, mainly due to their poor electrical conductivity. Therefore, the preparation of magnetic composite materials by compounding magnetic nanoparticles with carbon with good conductivity has become a research hotspot. Researchers have carried out a lot of work in this field, designing and preparing magnetic composite microspheres with core–shell [10], hollow [11], sandwich [12], flower-like [13,14,15] and bell-shaped [16] structures, as well as one-dimensional (1D), two-dimensional (2D) and three-dimensional (3D) composites with similar structures to wave absorbers [17]. On the basis of TCNFs, Zhang et al. prepared magnetic wave absorbers with multi-shell heterostructures, including Fe@C [18], Fe/Fe3O4@TCNFs@TiO2 [19] and TCF@Fe3O4@NCLs [20], and all of them showed excellent reflection loss and absorption bandwidth. Li et al. [21] prepared hollow Fe@C (HFC) microspheres through emulsion polymerization, electrostatic assembly, polydopamine (PDA) coating and carbonization. HFC had both magnetic loss and dielectric loss, and RLmax was as high as −54.4 dB at 3.0 mm thickness and 8.8 GHz.
The rattle-shaped structure is a kind of special multi-layer core–shell structure, which is characterized by a unique core–void–shell configuration, low density, large surface area and many gaps. This structure is beneficial to reduce the density of the absorbent, adjust the absorption rate and effective dielectric constant and improve impedance matching [22]. Dai et al. [23] prepared CIP@void@NC (carbonyl iron powder@void@nitrogen doped carbon) microspheres with a bell structure by using carbonyl iron powder (CIP) as raw material through multi-layer coating and etching. Compared with CIP alone, the microspheres showed enhanced characteristics in EAB and absorption strength. The magnetic particles are encapsulated inside the carbon shell with movable space, which maintains the electrical conductivity of the material, increases the magnetic loss and multiple reflection at the interface and also protects the magnetic particles from external corrosion. Therefore, the construction of magnetic metal-based particles@air@carbon with a rattle-shaped structure provides a new strategy for the synthesis of a high-efficiency absorber. However, the construction of rattle-shaped microspheres is usually based on sandwich microspheres, and the intermediate layer of the sandwich microspheres is etched away by a chemical or physical means to achieve its preparation. The process requires two steps of cladding and one step of etching, and the process is relatively cumbersome.
In this work, we simply prepare a rattle-shaped magnetic composite microsphere Fe@C through a one-step coating and carbonization process. Hollow Fe3O4 particles are prepared using the hydrothermal method, and a series of Fe3O4@RF microspheres with different phenolic (RF) layer thicknesses are obtained by adjusting the coating time. The carbonization time and temperature are controlled, and the reductive effect of the phenolic aldehyde conversion carbon layer is used to reduce the hollow Fe3O4 to Fe nanoparticles. The coating and etching steps of the interlayer are omitted, and the preparation method is simplified. The microwave absorption properties of the rattle-shaped Fe@C microspheres are studied, and the absorption mechanism of the material is revealed.

2. Experimental Section

2.1. Materials

Urea, FeCl3·6H2O, formaldehyde, trisodium citrate dihydrate and ethanol absolute were obtained from Guangzhou Chemical Reagent Factory (Guangzhou, China). Hydroquinone and sodium polyacrylate were bought from Adamas Reagent Co., Ltd. (Shanghai, China). The chemicals were used as received without any purification. The water used in the work was deionized water.

2.2. Preparation of Fe3O4@RF Microspheres

The Fe3O4 particles with a hollow structure were synthesized using the hydrothermal method [24]. A total of 1.35 g of FeCl3·6H2O, 0.60 g of sodium polyacrylate, 1.00 g of urea and 3.20 g of trisodium citrate dihydrate were dissolved in 75 mL of deionized water. Then, the mixture was transferred to a 100 mL high-pressure hydrothermal reactor and reacted at 200 °C for 12 h. After the reaction, it was cooled to room temperature, washed with deionized water several times and magnetically separated to obtain hollow Fe3O4 particles.
We weighed 0.30 g of Fe3O4 particles and 0.60 g of hydroquinone in 120 mL of ethanol absolute, dissolved and dispersed them by ultrasound and transferred them to a 250 mL three-necked flask. Then, 550 μL of formaldehyde was added and, after mechanical stirring for 5 mins, 8 mL of ammonia water was added to it dropwise and reacted for a certain time at room temperature. The product was magnetically separated and washed with ethanol to obtain Fe3O4@RF composite microspheres. In order to control the thickness of the phenolic layer, the reaction time was controlled to 4 h, 6 h, 10 h and 12 h, and the products obtained were named Fe3O4@RF-4, Fe3O4@RF-6, Fe3O4@RF-10 and Fe3O4@RF-12.

2.3. Fabrication of Fe@C Composite Microspheres

We weighed 0.2 g of Fe3O4@RF composite microspheres and placed them in a quartz boat. We carried out high-temperature carbonization in a vacuum tube furnace at a heating rate of 5 °C/min. After the carbonization was completed, it was cooled to room temperature in the furnace to obtain magnetic carbon microspheres. The carbonization temperature was 550 °C, 650 °C and 700 °C, and the carbonization time was 5 h. The products obtained were Fe3O4@C-550, Fe3O4@C-650 and Fe3O4@C-700. Fe3O4@RF-6, Fe3O4@RF-10 and Fe3O4@RF-12 were carbonized for 12 h, and the products with a carbonization temperature of 700 °C were Fe3O4@C-6, Fe@C-10 and Fe@C-12, respectively.

2.4. Analysis and Characterization

The morphology of the material was observed using AMERy-1000B scanning electron microscope (SEM) (FEI, Hillsboro, FL, USA) and JEM-2100F transmission electron microscope (TEM) (FEI, Hillsboro, FL, USA). The magnetic properties were measured by LakeShore7307 vibrating sample magnetometer (VSM) (CFMS-14T Cryogenic, GEKO, Dusseldorf, Germany). The crystal structure of the material was confirmed by XRD-7000 X-ray diffractometer (D8 DISCOVER A25, Bruker, Karlsruhe, Germany), with Cu target Kα radiation, tube pressure 40 KV and tube flow 40 mA. The thermal stability of the material and the proportion of each component were measured by the Q50 thermogravimetric analyzer (TGA) (Mettler tolido Instrument Company, Zurich, Switzerland). The temperature range was 35–650 °C, the heating rate was 10 °C/min, and the oxygen flow rate was 50 mL/min. Functional groups were determined by Tensor 27 Fourier transform infrared spectrometer (Bruck GMBH, Herne, Germany) manufactured by Bruck GMBH in Germany, and KBr powder tablets were pressed. The sample was mixed with solid paraffin in a certain proportion and pressed into ring samples. The electromagnetic parameters were measured by N5227 vector network analyzer manufactured by Agilent Technology Co., Ltd. (Agilent Technology Co., Ltd., Beijing, China). The pore properties of the microspheres were measured by tristAR-3020 N2 adsorption–desorption apparatus manufactured by Micromeritics Co., Ltd. (Micromeritics Co., Ltd., Beijing, China).

3. Results and Discussion

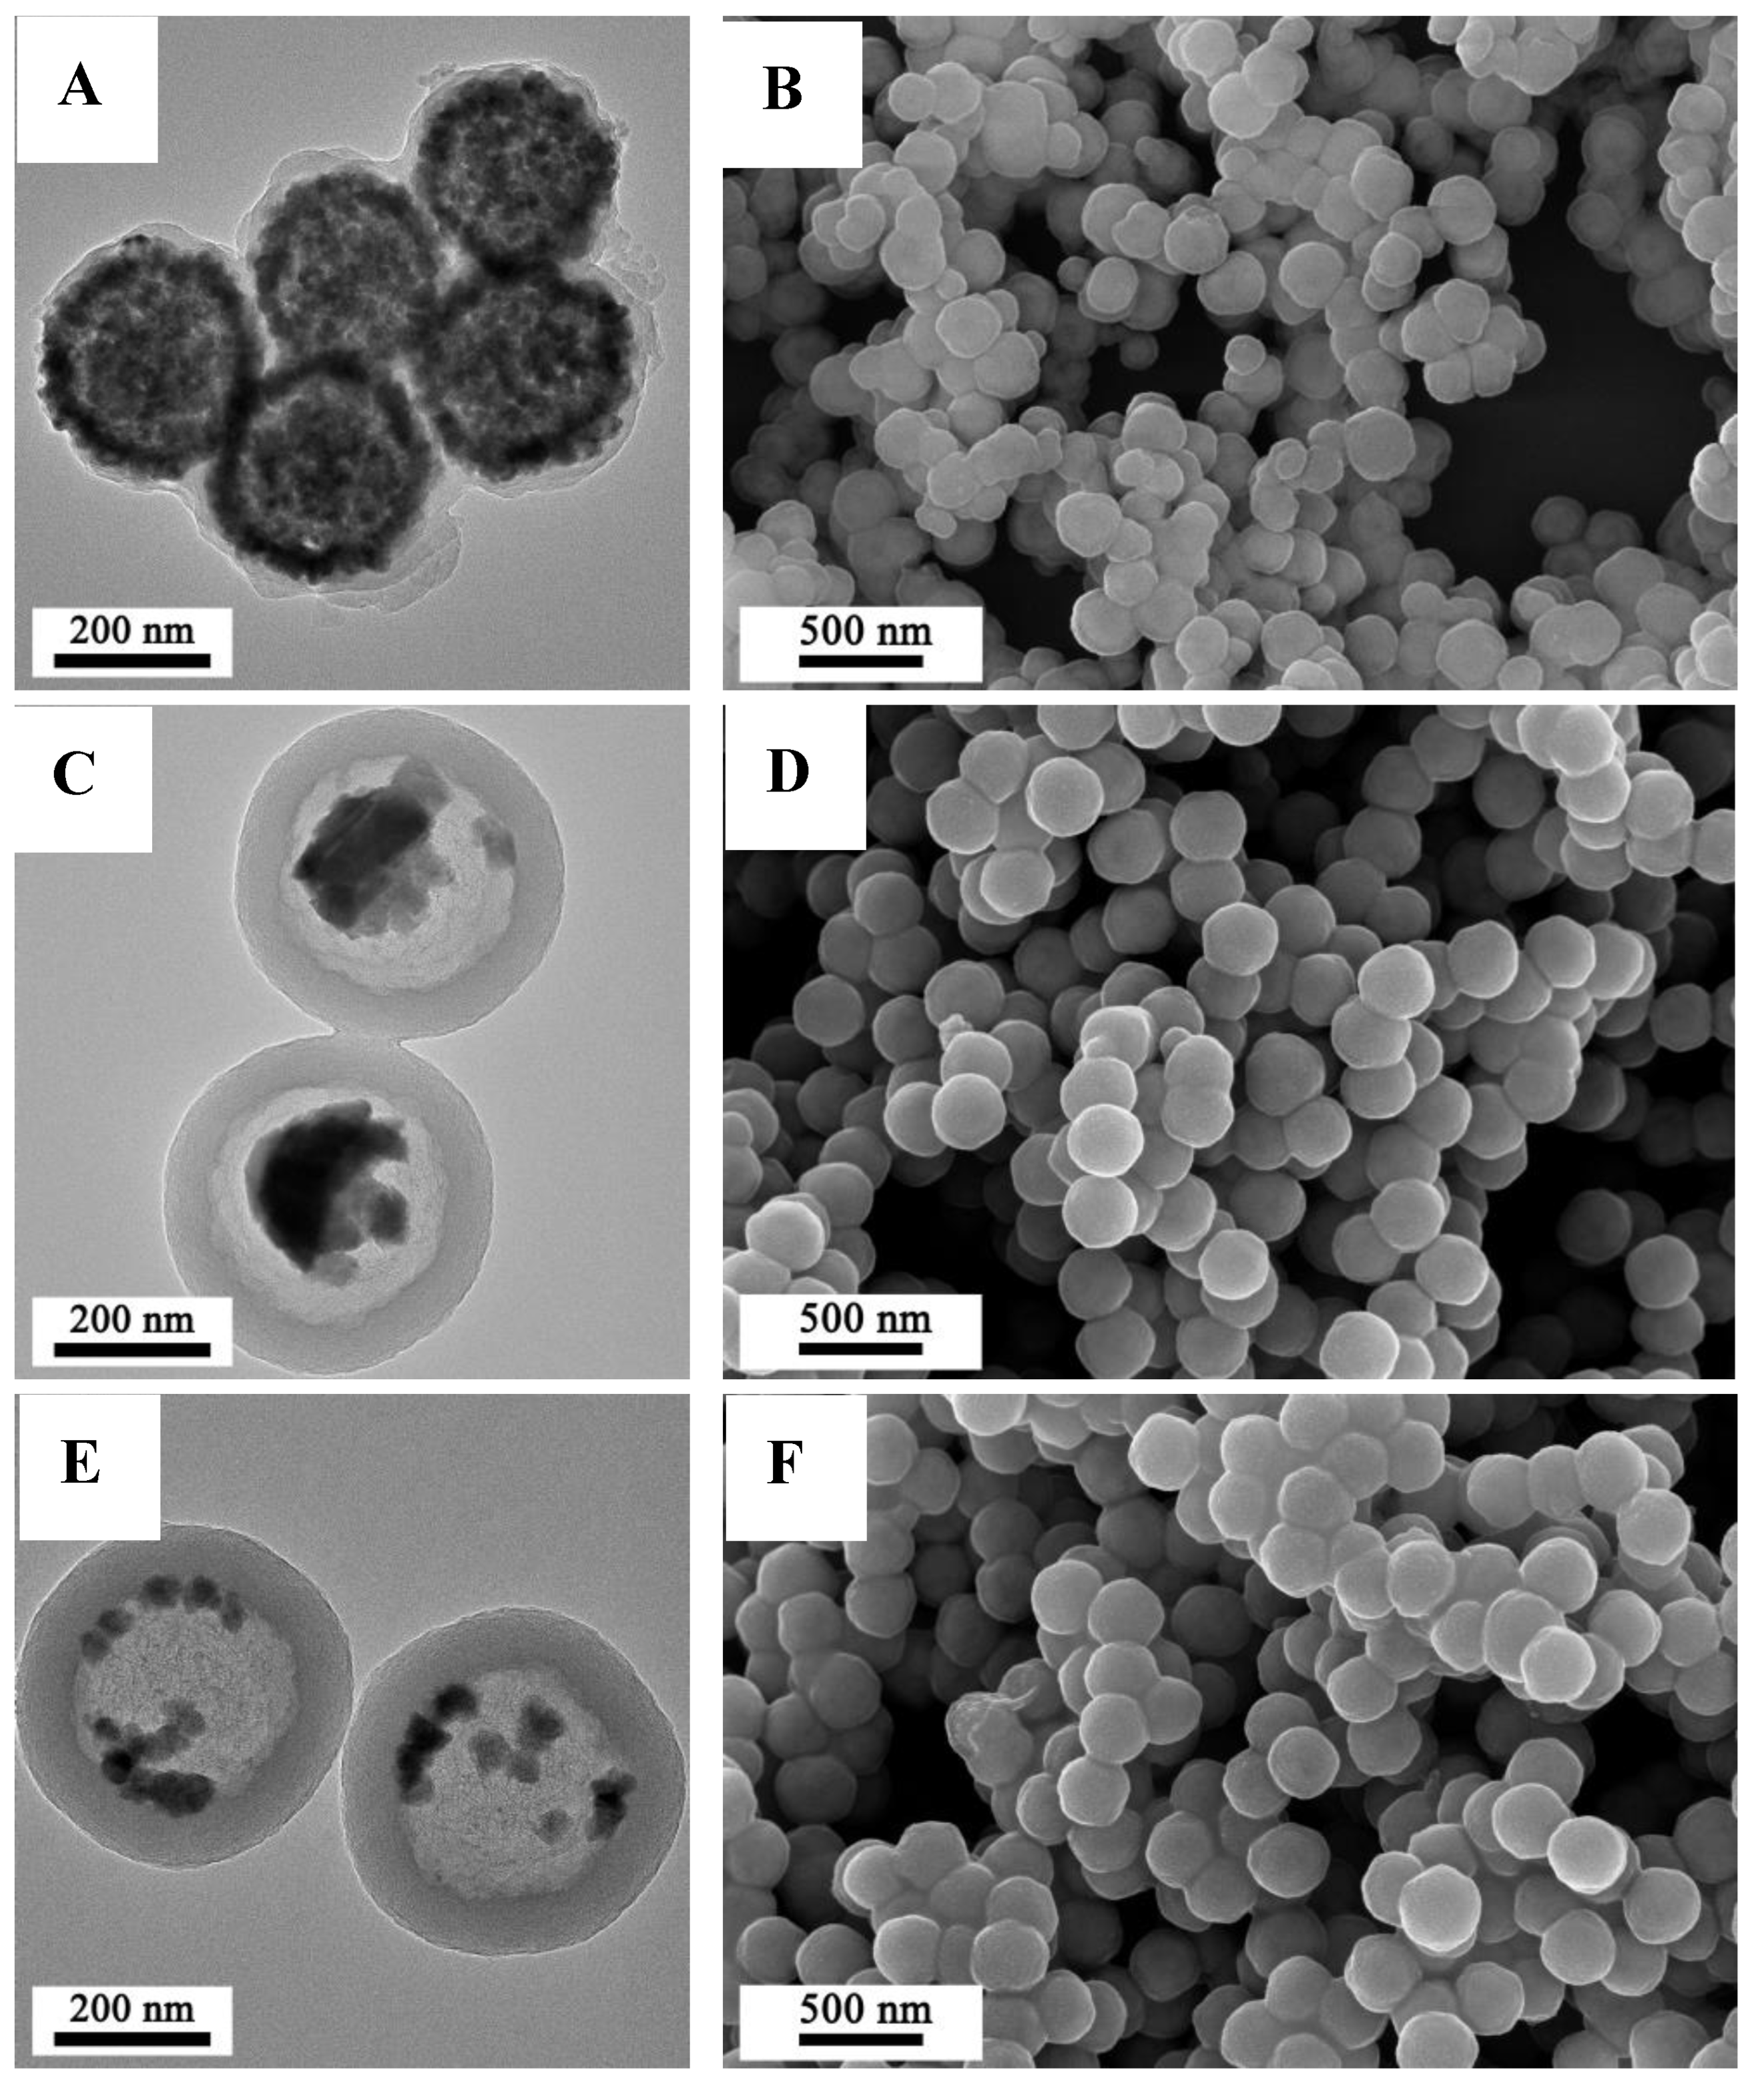
3.1. Shell Control of Fe3O4@RF Microspheres

The morphology of the Fe3O4 particles prepared using the hydrothermal method is shown in Figure 1A,B. The particle size distribution was uniform, the surface was rough, and the average particle size was about 230 nm (Figure 1A inset). The TEM images showed that the grain had a non-single crystal structure, which showed that the grain was stacked with a morphology of deep surrounding contrast and shallow middle contrast, indicating that it had an obvious hollow structure (Figure 1B). A series of hollow Fe3O4@RF composite microspheres with different shell thicknesses were prepared by controlling the polymerization reaction time of hydroquinone and formaldehyde. TEM images of the products are shown in Figure 1C–F. Compared with Figure 1B, it can be clearly seen that Fe3O4 had a phenolic shell layer on its surface, which means that the precipitation polymerization method successfully prepared Fe3O4@RF microspheres with a core–shell structure. The coated products still had good dispersion. With the increase in polymerization time, it was obvious that the thickness of the phenolic shell increased. When the polymerization time was 4 h, the surface change in Fe3O4 was not obvious, and only a few nanometers of the non-fully coated polymer layer could be seen in magnification (Figure 1C). When the reaction time exceeded 6 h, the phenolic shell became obvious and had been completely coated. The phenolic layer thickness of Fe3O4@RF-6, Fe3O4@RF-10 and Fe3O4@RF-12 was 18 nm, 62 nm and 67 nm, respectively.

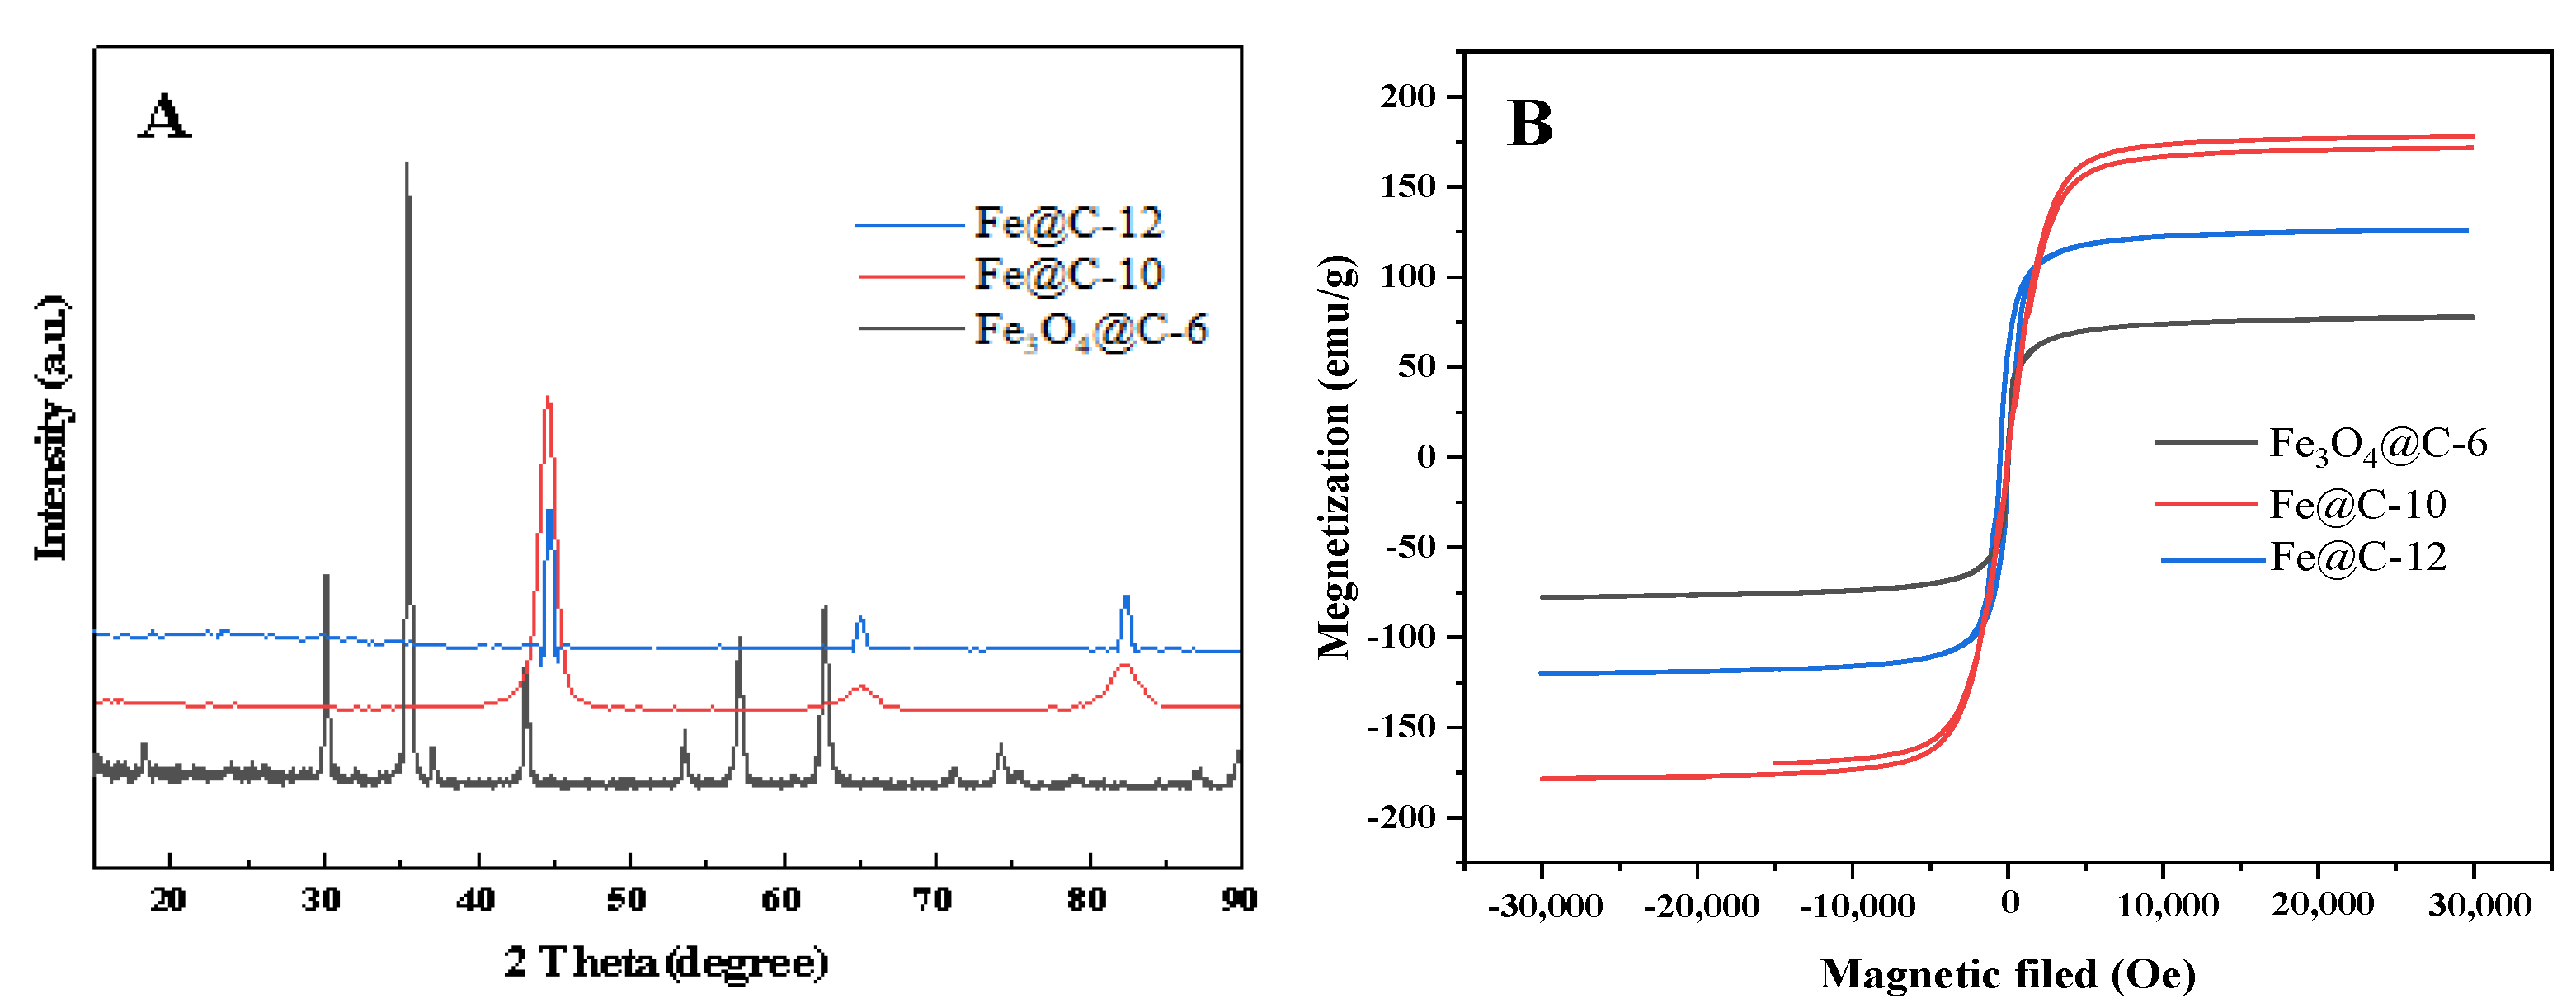
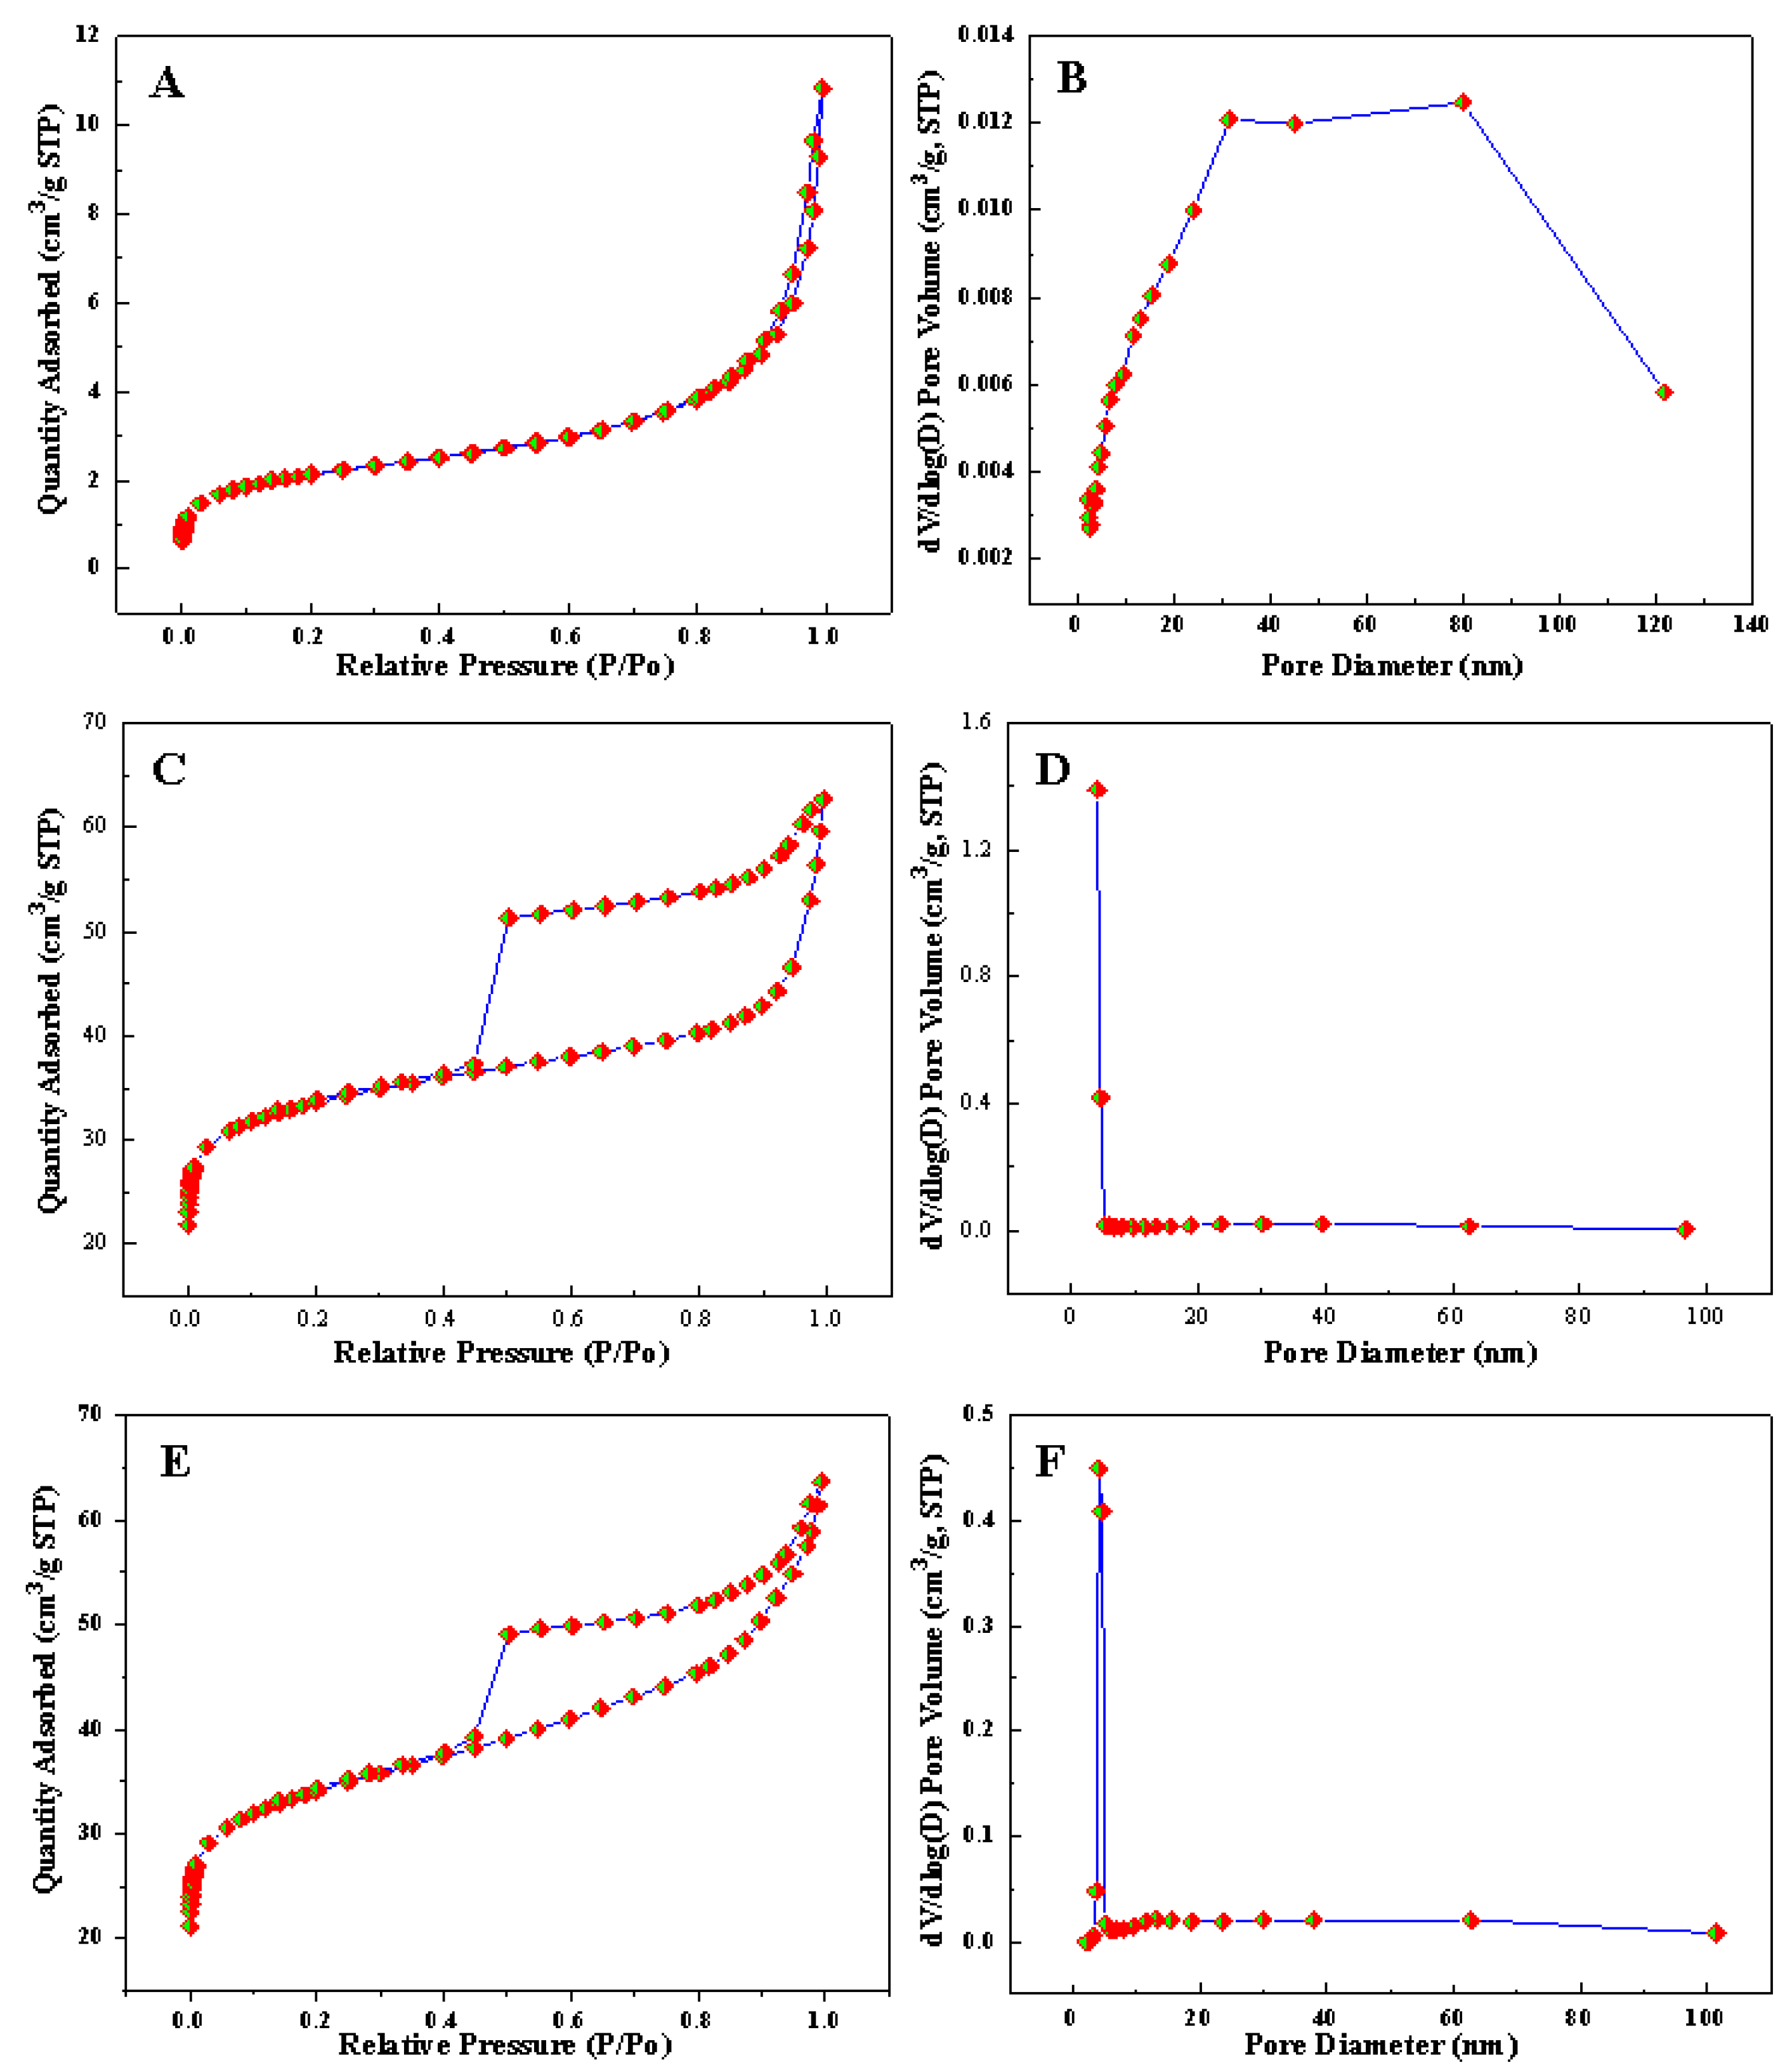
3.2. Characterization of Fe3O4@C Composite Microspheres

Phenolic is a polymer material with a high carbon content, which is why it was chosen for the shell. Fe3O4@RF microspheres were carbonized under vacuum conditions, and the phenolic layer was converted into a carbon layer. Magnetic microspheres composed of different components were prepared. Using Fe3O4@RF-12 as a precursor, the effect of calcination temperature on the properties of the product was investigated. TEM and SEM images of Fe3O4@C microspheres prepared at different carbonization temperatures are shown in Figure 2. It can be seen that the morphology of the microspheres was not significantly damaged by the high-temperature carbonization, and the obtained Fe3O4@C still maintained a good spherical morphology and a narrow particle size distribution (Figure 2B,D,F). The shell thickness of the carbonated products at 550 °C, 650 °C and 700 °C was 35 nm, 32 nm and 31 nm, respectively. With the increase in the carbonization temperature, the decomposition degree of the phenolic layer on the surface of the microspheres deepened slightly. When the organic matter was fully lost, part of the carbon was also lost, which led to the gradual thinning of the carbon layer remaining in the product (Figure 2A,C,E). A careful observation of Figure 2C,E showed that the aggregation degree of Fe3O4 in the microsphere increased, the particle size became larger, the hollow structure was more obvious, and the lattice stripes were vaguely visible. The lattice fringes were measured, and there was a 0.2 nm lattice spacing corresponding to the (110) crystal plane of Fe (Figure 2E inset), indicating that part of Fe3O4 may be reduced to Fe by high-temperature carbon.
In order to confirm the crystal information of the inorganic components in the prepared Fe3O4@C microspheres, XRD detection was carried out as can be seen in Figure 3A. The diffraction peaks of Fe3O4@C-550 and pure Fe3O4 (JCPDS card no. 19-0629) were exactly the same. The main diffraction peaks of Fe3O4@C-650, Fe3O4@C-700 and Fe3O4@C-550 were basically the same, indicating that the magnetic components in the Fe3O4@C microspheres were mainly Fe3O4. Figure 3B shows the FTIR spectra of hollow Fe3O4, Fe3O4@RF and Fe3O4@C. After coating with phenolic aldehyde, the elastic shock absorption peak of the C-H bond on the aromatic hydrocarbon appeared near 3100 cm−1. Moreover, 1612 cm−1, 1448 cm−1 and 1406 cm−1 were the stretching shock absorption peaks of the benzene ring C=C skeleton, indicating the presence of a benzene ring (phenolic). After carbonization, the absorption peak of the sample was significantly reduced, and the absorption peak of the organic matter basically disappeared, indicating that the carbonization was relatively complete. The absorption peak of 1614 cm−1 was attributed to the stretching vibration of the unsaturated C=C bond. The TGA curves of the Fe3O4@C microspheres prepared at different carbonization temperatures are shown in Figure 3C. The mass remaining after high-temperature calcination was used as the content of the magnetic component, and the mass increase caused by the conversion of Fe3O4 to Fe2O3 during this process was ignored. Fe3O4@C began to lose weight when the calcination temperature reached about 350 °C. With the increase in the carbonization temperature during the preparation process, the temperature of the initial weight loss increased, indicating that the carbonization temperature can improve the thermal stability of Fe3O4@C microspheres. The magnetic content of Fe3O4@C-550, Fe3O4@C-650 and Fe3O4@C-700 was 19.58%, 21.56% and 25.22%, respectively [25,26].

3.3. Morphology and Structure of Rattle-Shaped Fe@C Composite Microspheres

It can be seen from Figure 2 and Figure 3A that increasing the carbonization temperature may cause the carbon formed by the carbonization of the phenolic shell to reduce the internal Fe3O4. Based on this discovery, by extending the carbonization reaction time to deepen the degree of reduction, rattle-shaped Fe@C composite microspheres were prepared. Figure 4 shows the TEM and SEM images of Fe3O4@RF microspheres with different shell thicknesses carbonized at 700 °C for 12 h. Compared with the situation prior to carbonization (Figure 1D), the morphology of Fe3O4@RF-6 after carbonization has no significant change (Figure 4A,B). This may be due to the thin and incomplete coating of the polymer shell, resulting in less carbon converted, which had no significant effect on the reduction of Fe3O4 to Fe. When the thickness of the Fe3O4@RF phenolic shell increased, it was found that the Fe3O4 with high-quality and thick contrast in the microspheres changed significantly. The inorganic crystals clustered together and separated from the surrounding low-contrast carbon shell, presenting a rattle-like structure (Figure 4C,E). When the carbonization time was prolonged, the thickness of the carbon shell decreased, but the overall microsphere morphology was well maintained, as shown in Figure 4C–F. The above results show that the thickness of the polymer shell had a significant effect on the morphology of subsequent carbonized products, and the influence mechanism was mainly the amount of the carbon layer determining the reduction degree of Fe3O4.
The crystal form of the carbonized products of Fe3O4@RF microspheres with different shell thicknesses was determined, and the XRD pattern is shown in Figure 5A. The XRD peaks of the Fe3O4@RF-6 carbonization products at 18.3°, 30.1°, 35.5°, 43.1°, 53.4°, 57.1° and 62.8° corresponded to the inverse spinel structure Fe3O4 (JCPDS75-0033) crystal faces of (111), (220), (311), (400), (422), (511) and (440) in the face-centered cubic lattice [27,28]. This showed that Fe3O4 had not been reduced at this time. The XRD patterns of the products with the carbonization time of 10 h and 12 h had the same peak positions. The diffraction peaks at 44.7°, 65.2°, and 82.5° in the spectrum corresponded to the (110), (200), and (211) crystal planes of elemental Fe. This was highly consistent with the standard XRD pattern of Fe (JCPDS 87-0722) in the peak position and intensity. There were no other impurity peaks, indicating that Fe3O4 was completely reduced to Fe crystals with higher crystallinity. The magnetic properties of the prepared products were analyzed using the vibrating sample magnetometer. The VSM curve is shown in Figure 5B. The maximum specific saturation magnetization of Fe3O4@C-6, Fe@C-10 and Fe@C-12 was 77 emu/g, 123 emu/g and 177 emu/g, respectively. Before Fe3O4 was reduced to Fe, the magnetic properties of the microspheres were relatively low, but after the reduction, the magnetic properties were significantly enhanced. Meanwhile, the coercivity of the three samples, Fe3O4@C-6, Fe@C-10 and Fe@C-12, was 25 Oe, 265 Oe and 14 Oe, respectively, and the three were quite different. The coercive force represented the magnetic loss performance of the sample to a certain extent, but the subsequent analysis showed that the dielectric loss still dominated the EMW absorption.
The nitrogen adsorption–desorption isotherms and pore size distribution curves of Fe3O4@RF microspheres before and after carbonization are shown in Figure 6. The nitrogen adsorption–desorption isotherm of Fe3O4@RF-12 belonged to type III (Figure 6A), indicating that there were almost no pores in the material. The pore information was caused by the stacking between particles, and its BET specific surface area was 7.60 m2/g (Table 1). The small specific surface area and pore volume proved this again (Figure 6B). This was because phenolic aldehyde effectively coated Fe3O4 with a hollow and stacked structure, so its surface area was only the outer surface of the microspheres and the surface of the stacked holes. As shown in Figure 6C,E, the nitrogen adsorption–desorption isotherm of Fe3O4@C-700 and Fe@C-12 microspheres belonged to type IV, which was a typical mesoporous material with an H2-type hysteresis ring, indicating that the material had ink bottle-shaped pores [29]. The high surface area of Fe@C-12 comes from the pores created by the loss of organic matter from RF. The pore size distribution curve of Fe@C-12 (Figure 6F) basically showed a single peak, indicating that the pore size was narrow and concentrated.

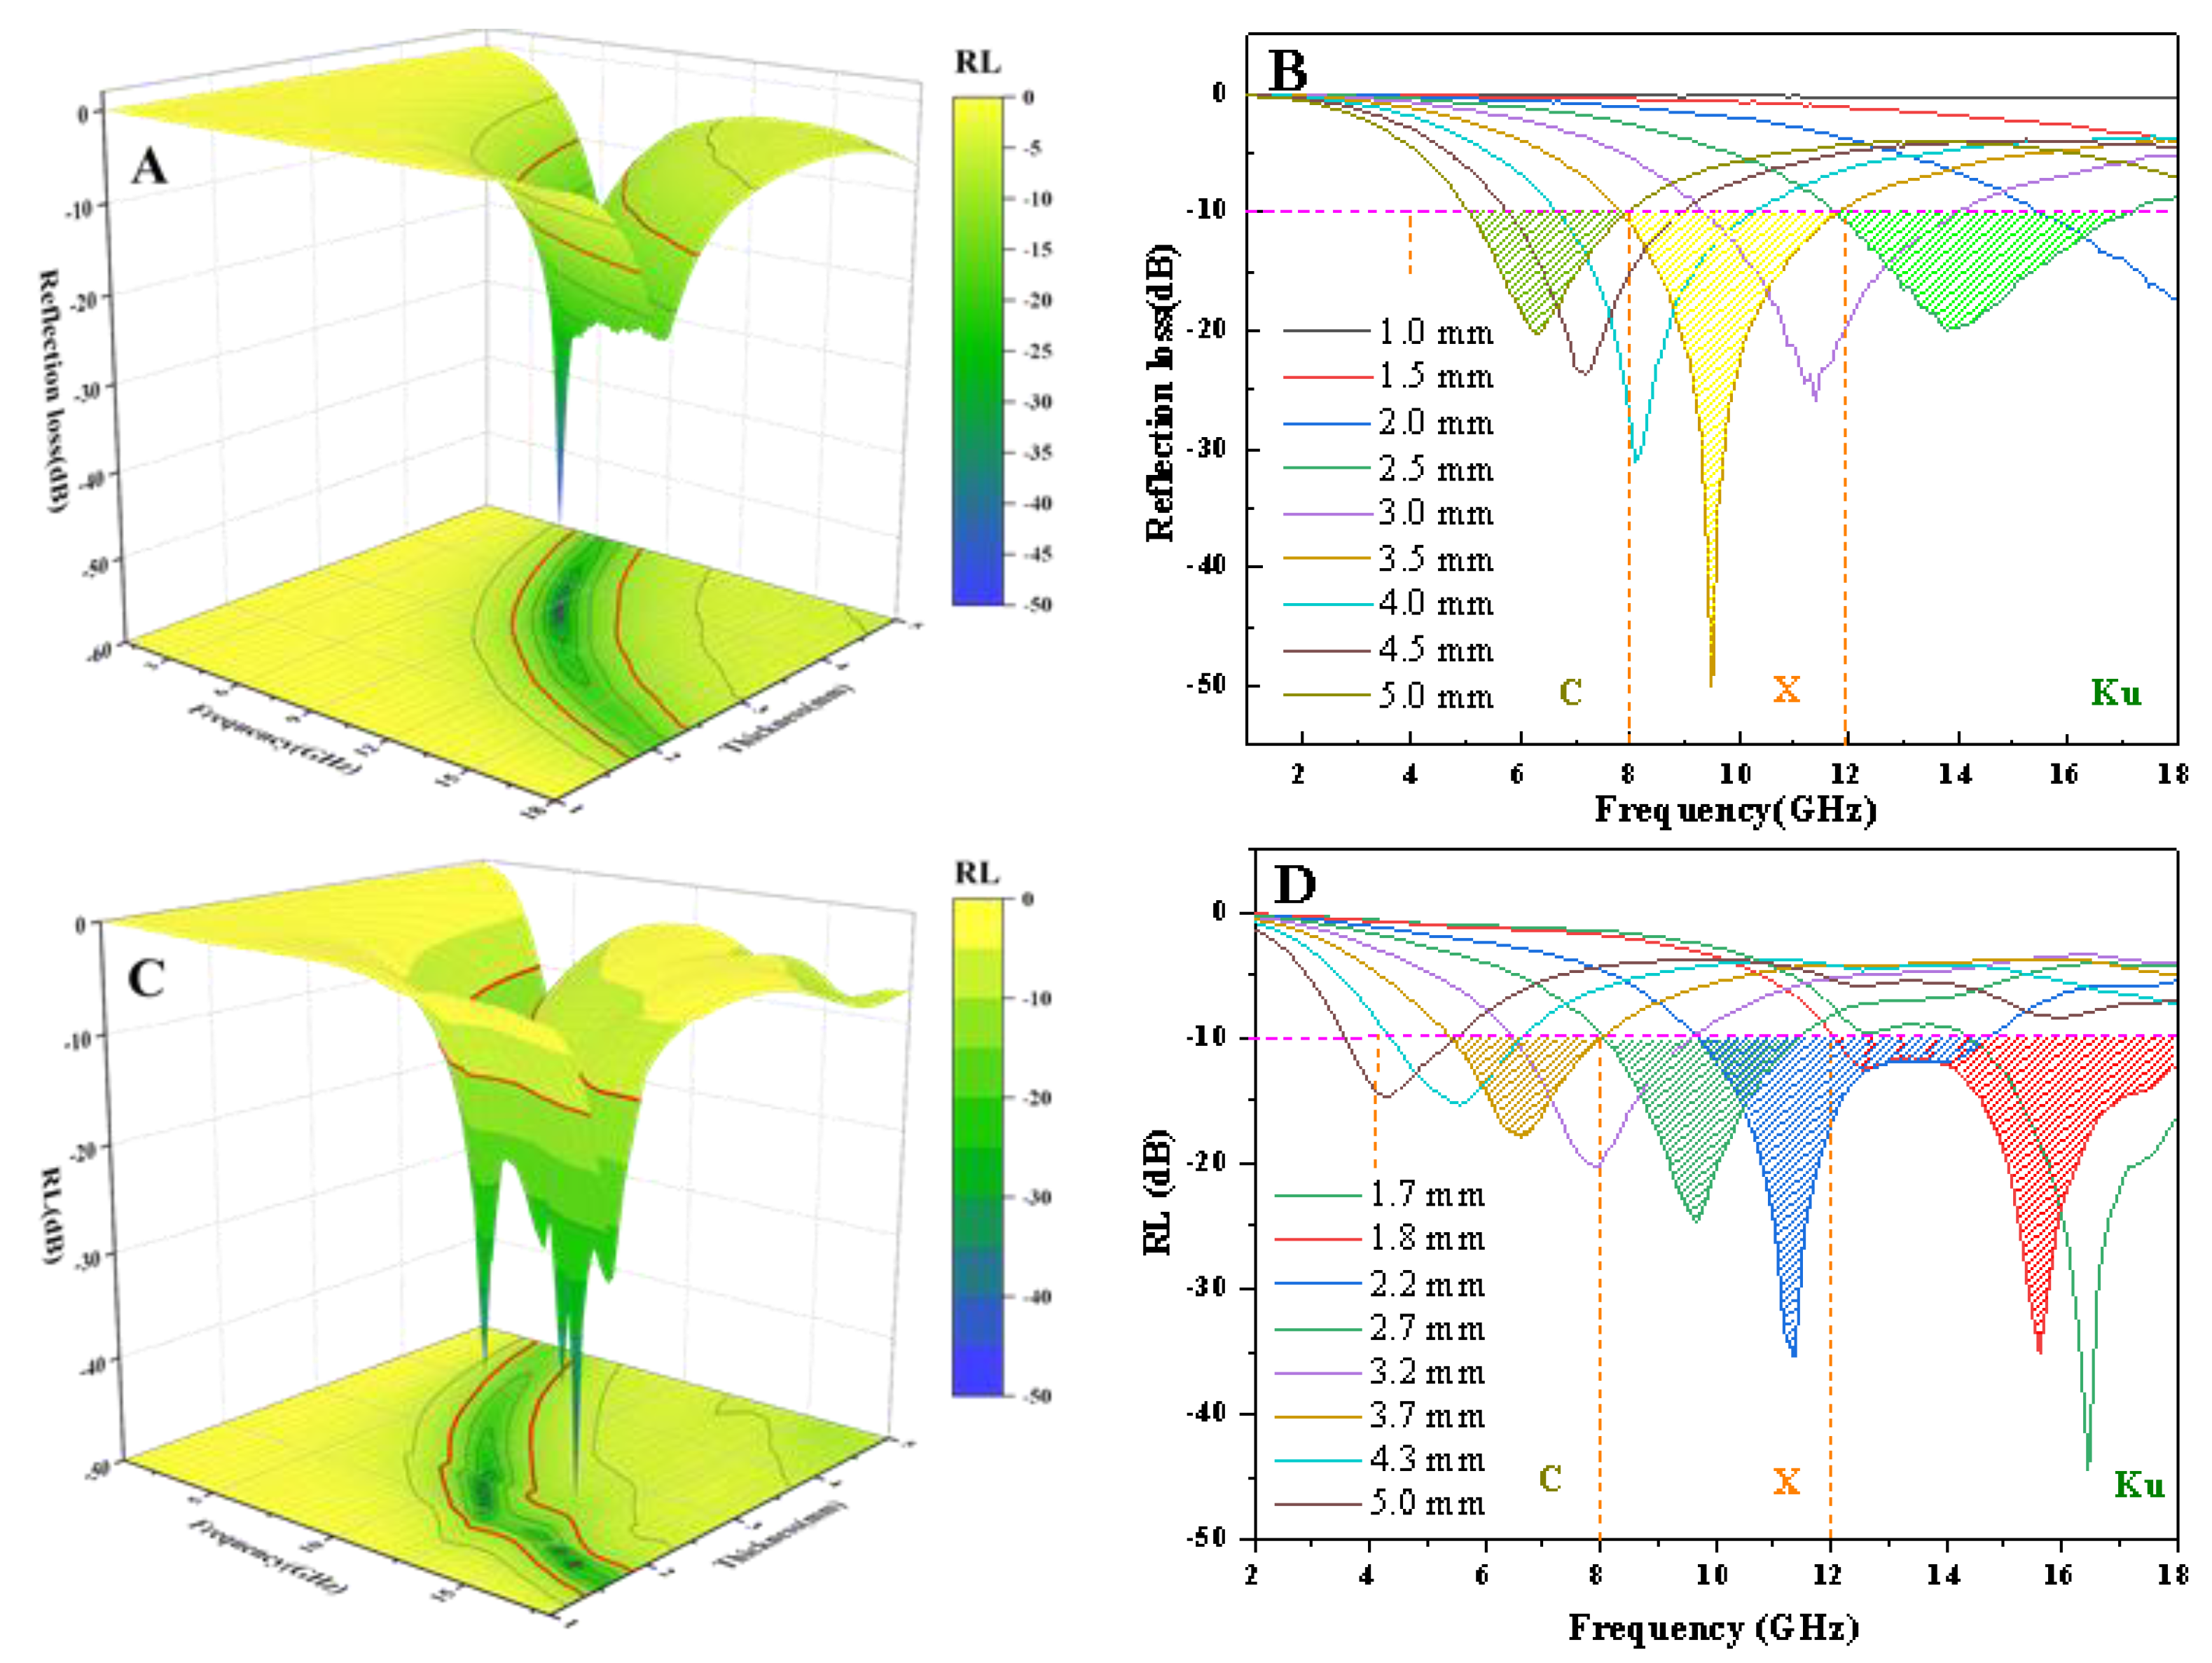
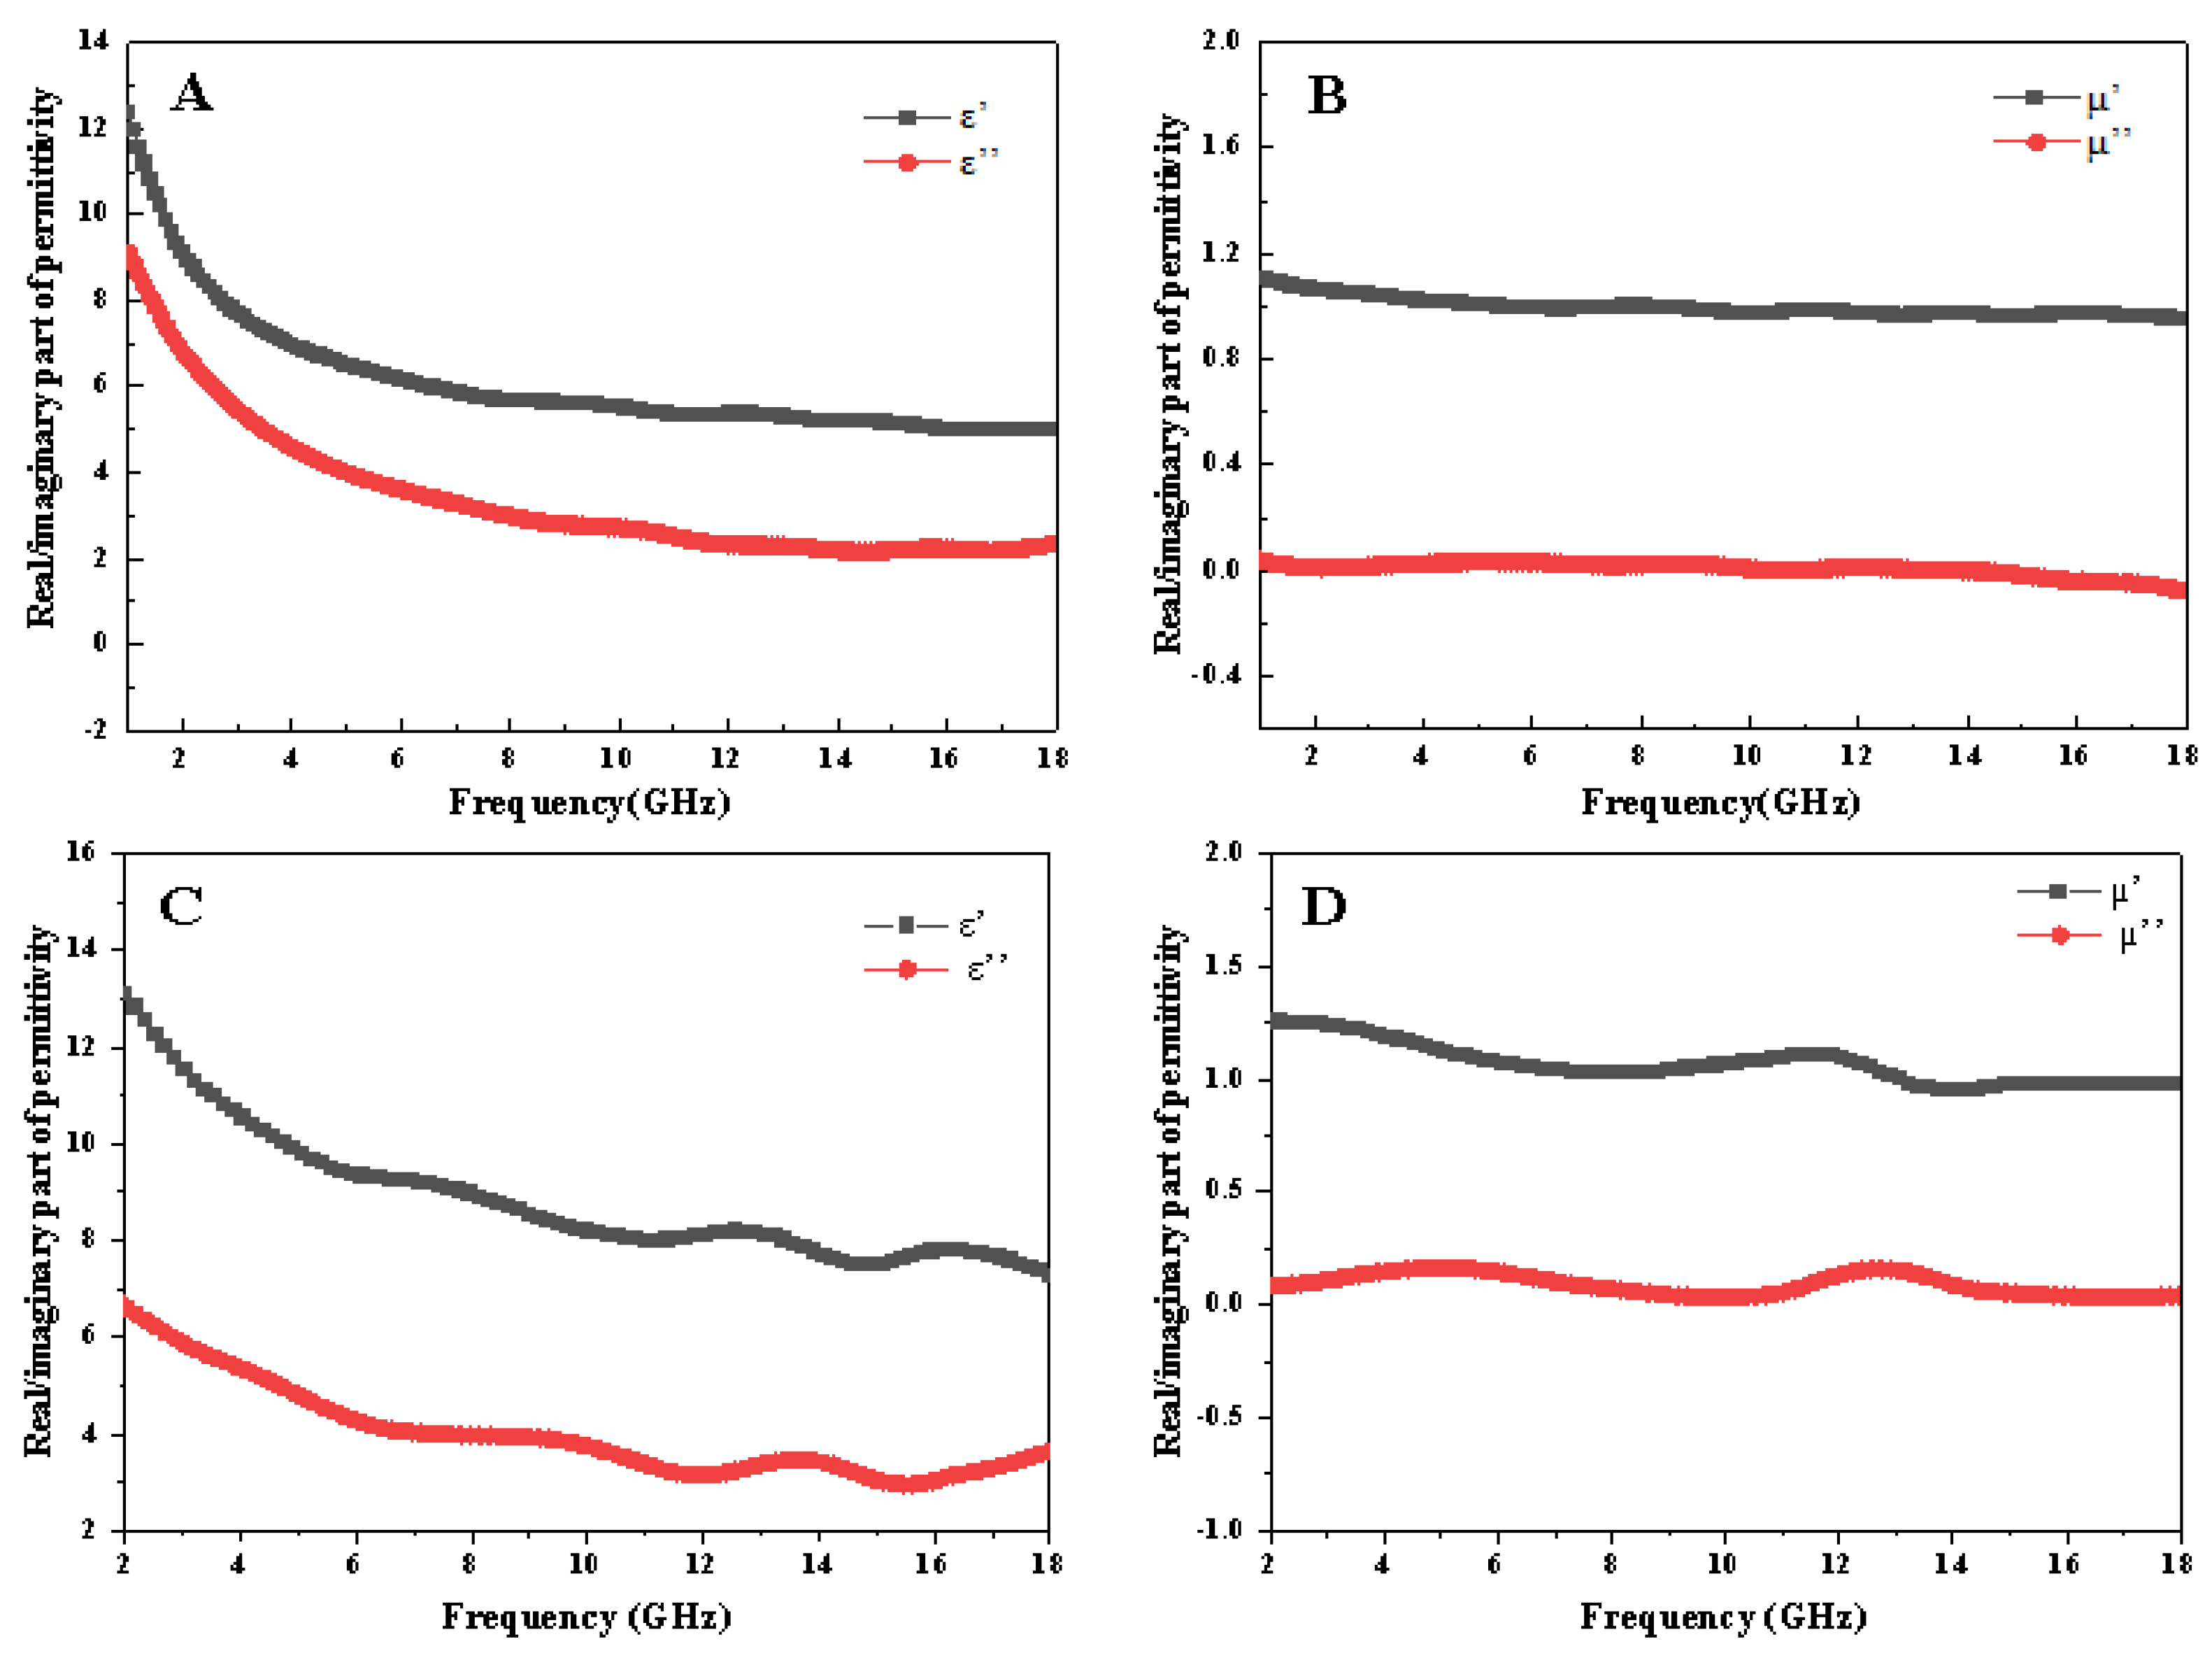
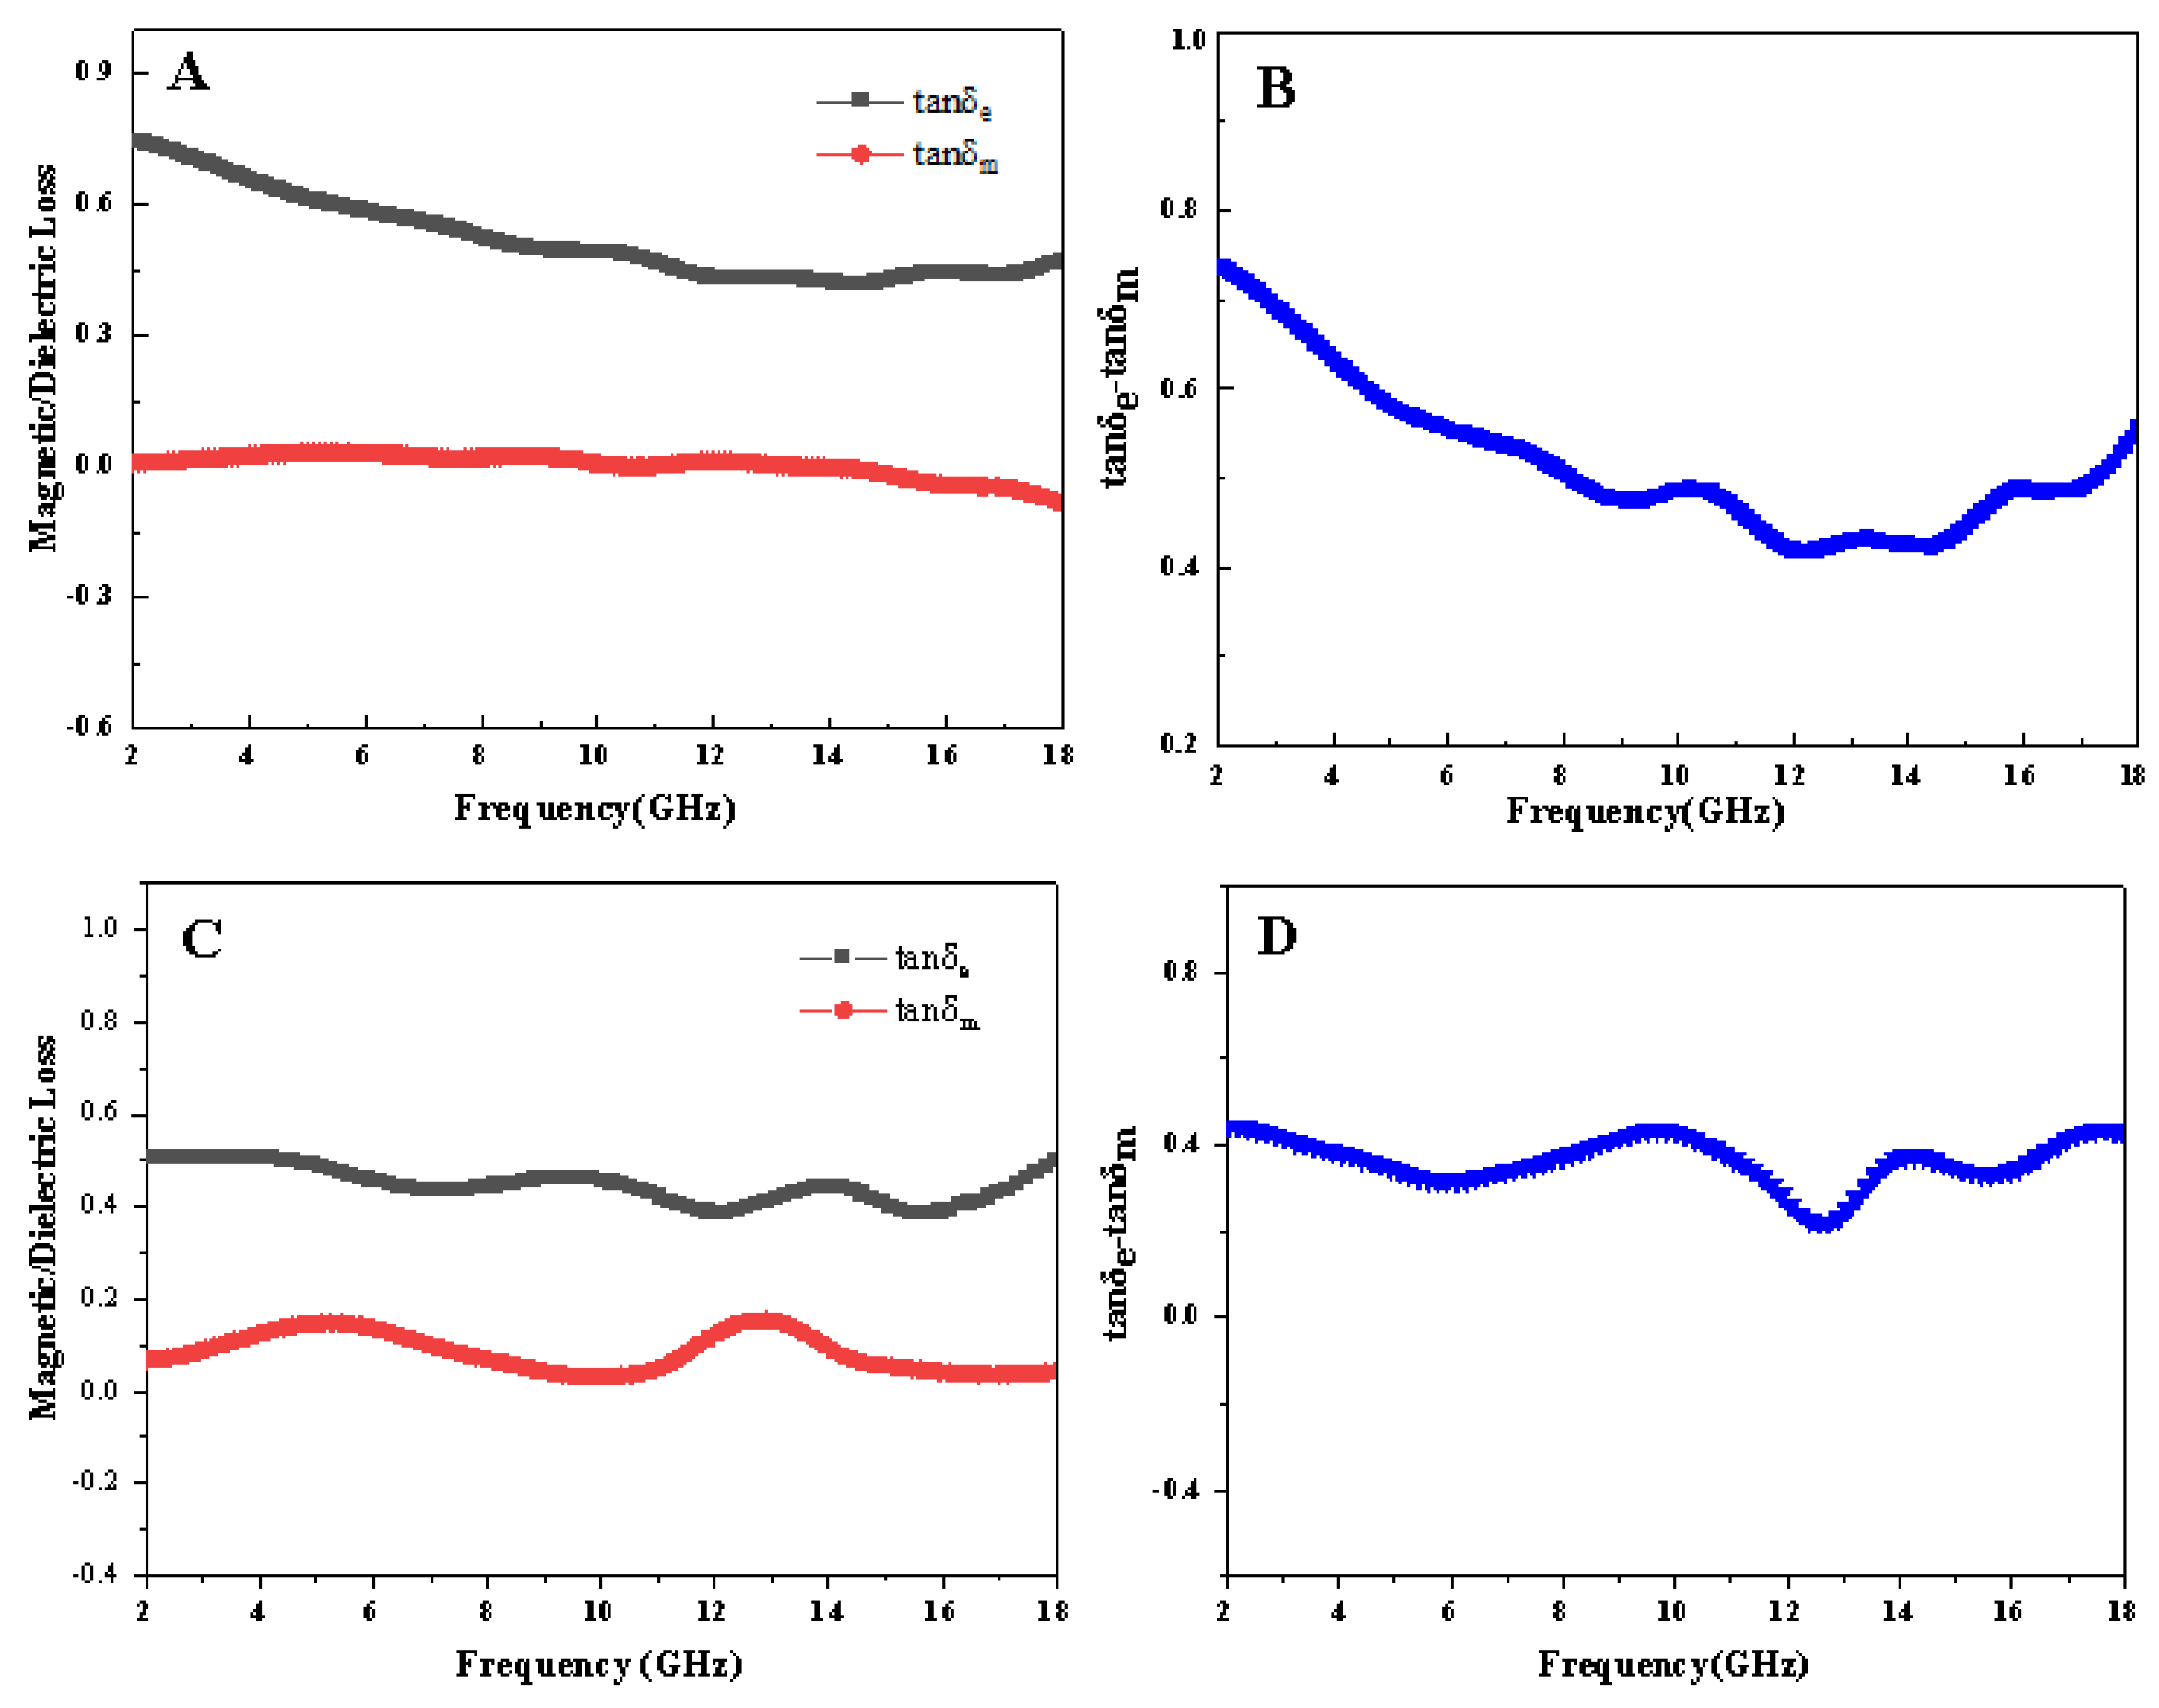
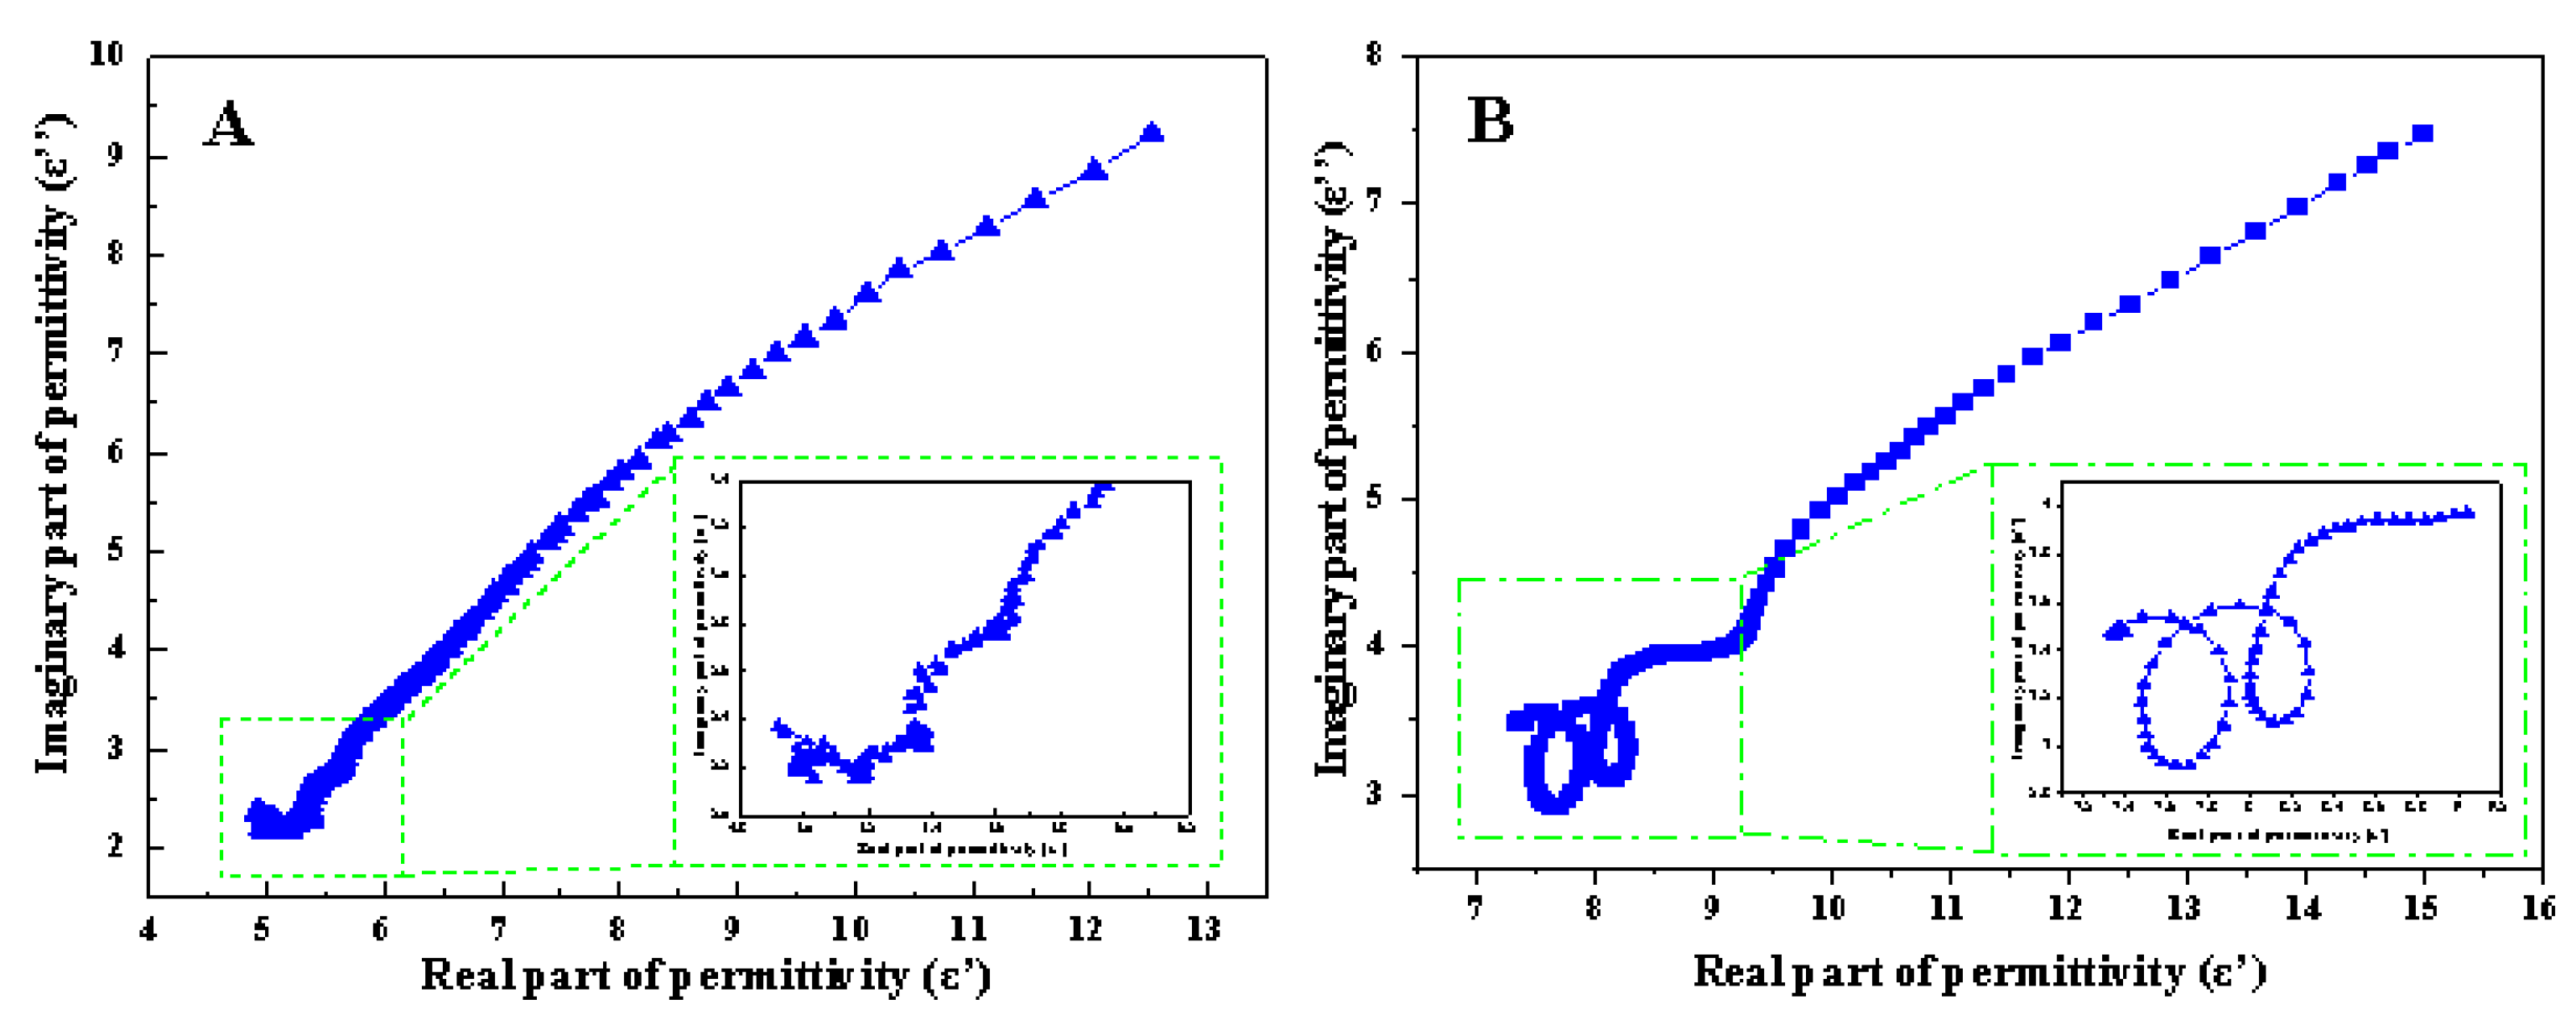
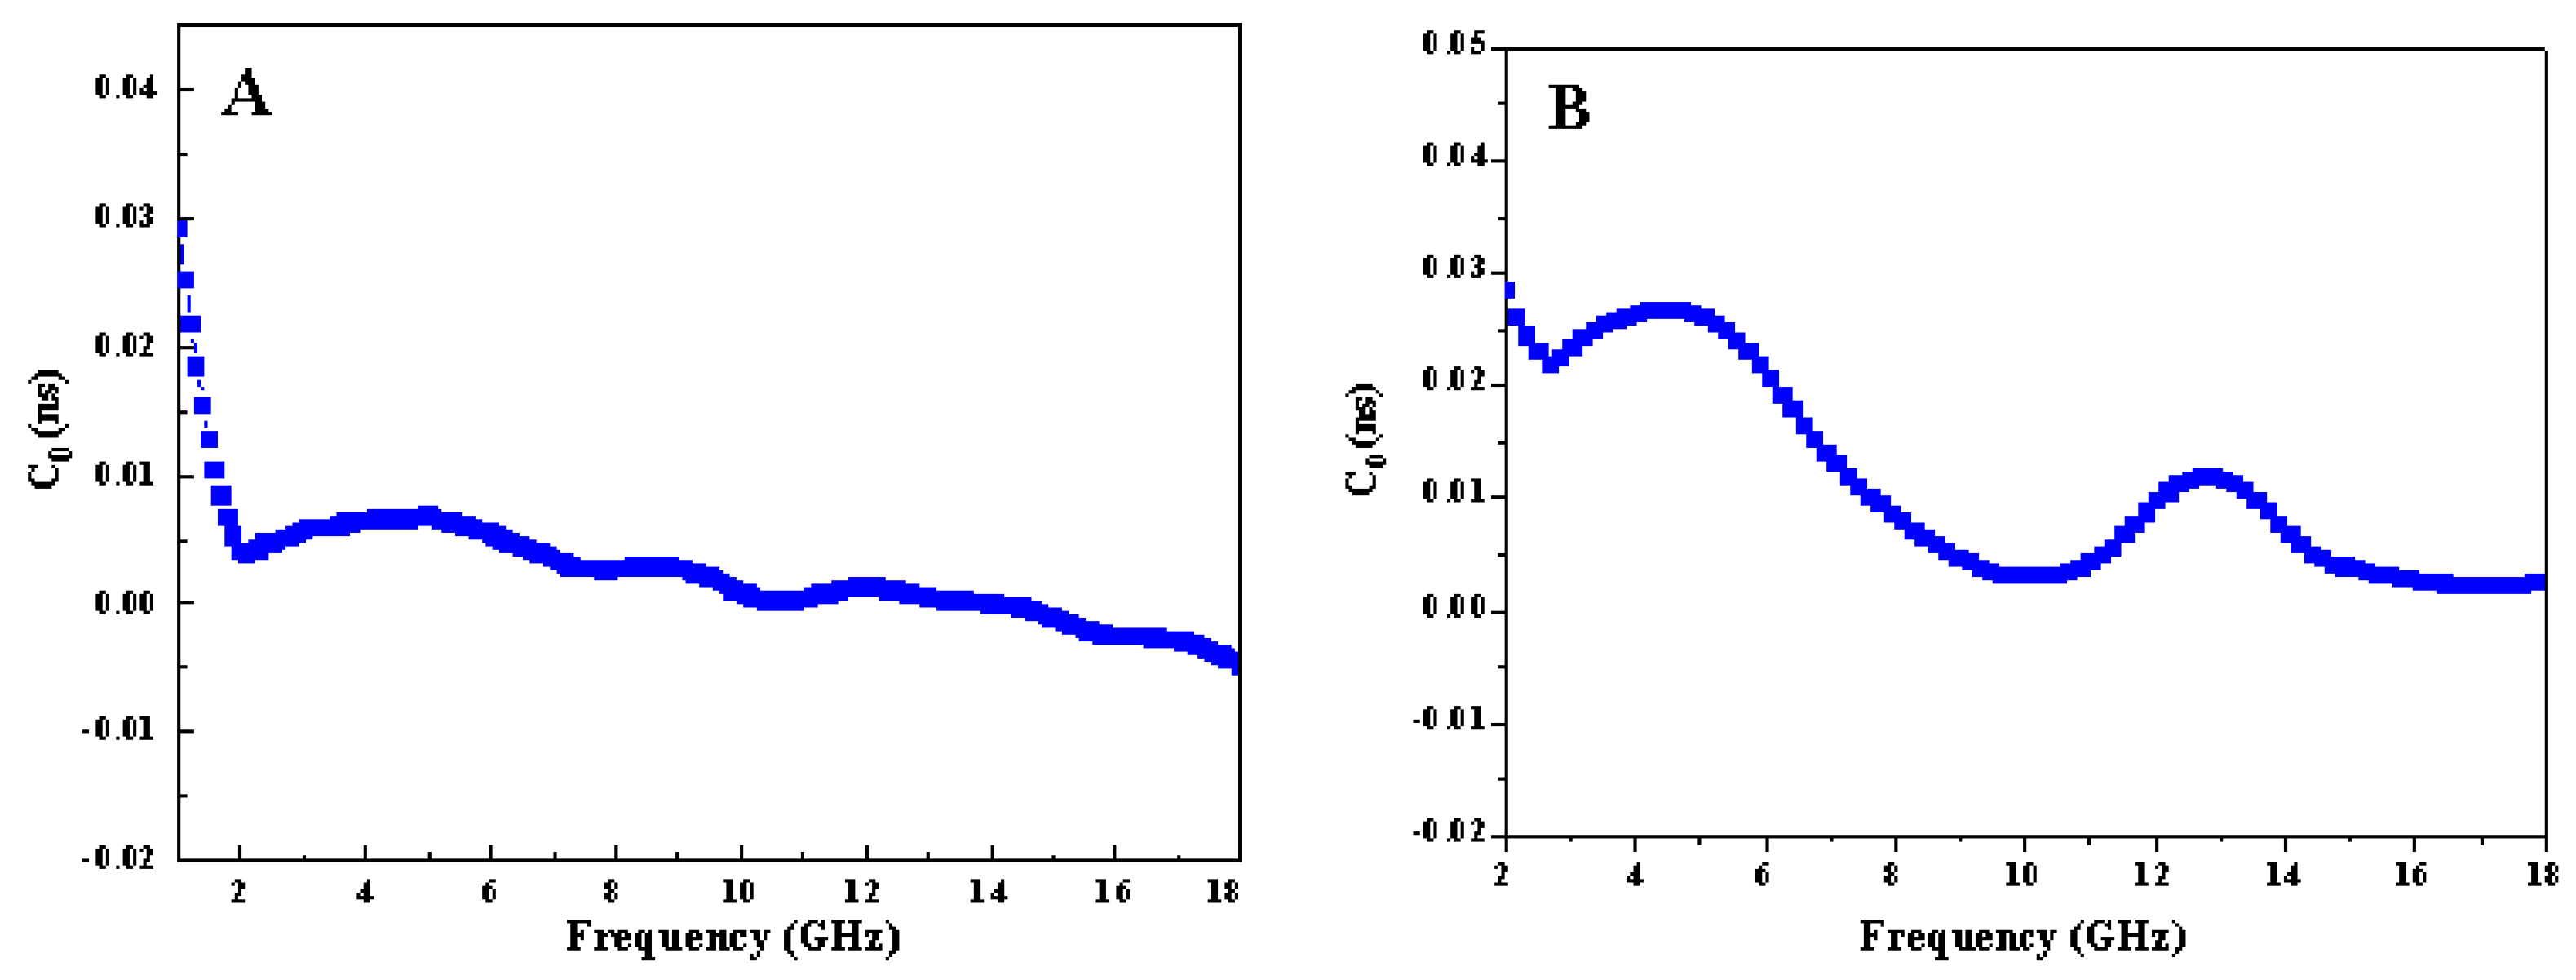
3.4. Evaluation of Microwave Absorption Performance

In order to systematically evaluate the absorbing performance of the composite microspheres, the electromagnetic parameters of Fe@C-12 and Fe3O4@C-700 microspheres were measured at 50 wt% filler content with paraffin as the matrix. Based on the transmission line theory, the reflection loss of the samples with different matching thicknesses was calculated according to the following formula [30,31,32]:
Z = | Z in Z O | = | μ r ε r |   tan h [ j ( 2 π fd c ) μ r ε r ]
RL ( dB ) = 20   log 10 | Z in Z 0 Z in + Z 0 |
where Zin is the input impedance of the wave absorber, Z0 is the impedance of free space, f is the frequency of EMW, c is the speed of light, and d is the thickness of the wave absorber. As can be seen from Figure 7A,B, as the thickness of the absorber layer continued to increase, the reflection loss curve of Fe@C-12 moved to the high-frequency direction. When the thickness was 3.5 mm, the peak value of the curve was the largest; that is, the ability to lose EMW was the strongest, and RLmax reached −50.15 dB. At this time, the effective absorption frequency range was 7.8 GHz–11.9 GHz (reflection loss was less than −10 dB), covering almost the entire X-band (Figure 7B), which was the working band of military radars, such as THAAD. Figure 7C,D showed 3D and 2D reflection loss curves of Fe3O4@C-700. At a thickness of 1.7 mm, RLmax was −44.42 dB, which was slightly worse than that of Fe@C-12. However, at a thickness of 1.8 mm, the EAB was 6.0 GHz (12 GHz–18 GHz), covering the entire Ku band; at this time, RLmax was −35.12 dB. The above results indicate that the magnetic composite microspheres prepared in this paper had excellent EMW absorption effects and can meet the requirements of related fields. Meanwhile, the effective frequency range can also be expanded to other wavebands by changing the thickness of the absorbing layer to enrich application scenarios. Table 2 compares the absorbing properties with Fe-based materials and other magnetic materials [18,19,20,21,33,34]. Obviously, both Fe@C-12 and Fe3O4@C-700 showed absolute advantages in performance. The reason is the great relationship with the design of the material. That is, the composite of the dielectric component and the magnetic component and the design of the rattle-like structure had an important influence on its absorbing performance.
In order to reveal the EMW loss mechanism of the magnetic composite microspheres, the electromagnetic parameters of the composite microspheres were analyzed. The real parts (ε′ and μ′) of the complex dielectric constant (εr = ε′ − jε″) and the complex permeability (μr = μ′ − jμ″) represented the capacity of the material to store electric and magnetic energy. The imaginary parts (ε″ and μ″) represented the capacity of the material to lose electric and magnetic energy [35]. As can be seen from Figure 8, the ε′ and ε″ of Fe@C-12 and Fe3O4@C-700 gradually decreased with the increase in electromagnetic frequency (Figure 8A,C), while μ′ and μ″ approached 1 and 0, respectively (Figure 8B,D). In addition, in Figure 8B,D, μ″ was almost unchanged, and negative values appeared in some regions, indicating the existence of eddy current losses. This was because the vortex created an opposing magnetic field that canceled out the natural field, causing the permeability to become negative [12,13,14,15,16]. Meanwhile, it can be found by comparison that the material permeability parameter was much smaller than the dielectric constant parameter, indicating that the dielectric loss dominated the EMW loss process of the two materials.
Dielectric loss and magnetic loss can be expressed by the tangent value of the dielectric loss (tanδe = ε″/ε′) and magnetic loss (tanδm = μ″/μ′). Figure 9A,C show the relationship curves of the dielectric loss tangent value and the magnetic loss tangent value of Fe@C-12 and Fe3O4@C-700 with frequency. It can be seen from the curve that the dielectric loss tangent value was obviously greater than the magnetic loss tangent value, which further proved the dominance of dielectric loss. The dielectric loss tangent value of Fe@C-12 first decreased and then increased as the frequency increased, while the magnetic loss tangent value presented the opposite trend, and the difference value between the two appeared to be the minimum at about 12 GHz (Figure 9B). The smaller the value, the smaller the difference between the dielectric loss and the magnetic loss, which meant better impedance matching. The dielectric loss tangent value and the magnetic loss tangent value of Fe3O4@C-700 fluctuated with the increase in frequency, and the minimum value of the difference appeared at 13 GHz. The EMW loss ability of materials was mainly controlled by the dielectric loss, and the dielectric loss was greater in the low-frequency region. Under the combined action of the EMW loss ability and impedance-matching factors, the RLmax appeared in the X and Ku bands, respectively.
Dielectric loss mainly included four ways of interface polarization, dipole polarization, conduction loss and Debye relaxation. Among them, the interface polarization occurred on the interface with different electromagnetic parameters on both sides. For the above two materials, there were many heterogeneous interfaces between the carbon shell, cavities, Fe3O4/Fe and matrix paraffin. In addition, a large amount of unevenly distributed space charges accumulated between the interfaces, resulting in the continuous occurrence of polarization and dipolar polarization. Dipolar polarization was also related to defects formed inside the material, including crystal defects and atomic doping. The Debye relaxation phenomenon occurred in various polarization processes, and the Debye relaxation process can be easily judged from ε″-ε′ curves. If Debye relaxation occurred, then ε″ and ε′ would have satisfied the following equation [36,37,38]:
( ε ε s + ε 2 ) 2 + ( ε ) 2 = ( ε s ε 2 ) 2
where εs is the static permittivity, and ε is the relative permittivity at the high-frequency limit. In this case, the ε″-ε′ curve should be semicircle, namely, a Cole–Cole semicircle, and each semicircle corresponded to a Debye relaxation process. Figure 10 shows the ε″-ε′ curves of the two magnetic composite microspheres. From the enlarged illustration, multiple obvious semicircles can be observed, confirming the existence of multiple Debye relaxation processes. A long linear part appeared after the semicircle. The existence of the linear part was a typical feature of strong conductive loss, which indicated that the materials formed an effective 3D conductive network in the matrix paraffin.
The magnetic loss came from the hysteresis effect and the eddy current effect. The hysteresis effect can be judged by the area surrounded by the hysteresis loop in the VSM curve of the absorber, and its value was the loss energy of the hysteresis effect. The eddy current loss effect can be described by the following equation [39]:
C0 = μ″(μ′)−2f−1 = 2πμ0d2σ
where μ0 is the transmittance in the vacuum, and σ is the electrical conductivity. If the eddy current loss existed in the EMW absorption process, C0 was always constant with the change of frequency. Figure 11 displays the curves of the magnetic composite microsphere C0 and frequency. In Figure 11A, the curve fluctuated slightly in the high-frequency band and was close to a straight line, indicating that the eddy current loss existed in the high-frequency region. The fluctuation in the low-frequency region was mainly related to natural resonance. For Fe3O4@C-700 (Figure 11B), there were fluctuations in the high and low-frequency curves, indicating that ferromagnetic resonance had played an important role. The fluctuations at the low frequency were mainly related to natural resonance, while those at high frequency were related to exchange resonance [40].
In summary, Figure 12 shows the absorbing mechanism of rattle-shaped magnetic composite microspheres. Excellent impedance matching performance made EMW penetrate the material and be absorbed. The loss of EMW was mainly provided by dielectric loss and magnetic loss. Magnetic loss mainly included hysteresis loss and eddy current loss, as well as natural resonance and exchange resonance. Dielectric loss mainly included interface polarization, dipole polarization, conduction loss and Debye relaxation. The existence of heterogeneous interfaces and the accumulation of a large number of unevenly distributed space charges between the interfaces enhanced the occurrence of interface polarization. Abundant lattice defects and atomic doping were conducive to the occurrence of dipole polarization. In addition, the design of the rattle-like structure was conducive to the multiple reflections of EMW in the cavity structure, allowing the EMW to be converted into heat and dissipated. Meanwhile, the effective construction of the 3D conductive network provided a strong conductive loss, making the material exhibit excellent wave-absorbing properties.

4. Conclusions

To summarize, we prepared a sandwich structure Fe3O4@RF precursor, combined with a high-temperature annealing process, to obtain Fe3O4@C-700 and a rattle-shaped Fe@C-12 composite wave absorber. Comparing the absorbing performance of the two, the results show that the construction of the yolk–shell structure is conducive to the occurrence of multiple interface reflections and effectively dissipates EMW. The influence of electromagnetic parameters on the absorbing performance was analyzed in detail, and the absorbing mechanism was revealed. The synergistic effect of multiple components makes the material possess excellent impedance matching, strong interfacial polarization, dipole polarization and enhanced conduction loss, which, together, enhance the dielectric loss performance of the material. Coupled with excellent magnetic loss, the material exhibits excellent absorbing properties. We believe that Fe@C-12 is expected to become one of the candidate materials for the next generation of new wave-absorbing materials. It has potential application values in civil applications, such as anti-electromagnetic pollution, building wave absorption, electromagnetic protection and electronic equipment.

Author Contributions

Conceptualization, X.L.; methodology, X.L.; validation, P.L. and L.Y.; formal analysis, P.L.; investigation, L.Y.; data curation, L.Y.; writing—original draft preparation, X.L.; writing—review and editing, X.L., P.L. and L.Y.; visualization, L.Y.; project administration, X.L. All authors have read and agreed to the published version of the manuscript.

Funding

This research received no external funding.

Institutional Review Board Statement

Not applicable.

Informed Consent Statement

Not applicable.

Data Availability Statement

Not applicable.

Conflicts of Interest

The authors declare no conflict of interest.

References

  1. Xu, X.; Shi, S.; Tang, Y.; Wang, G.; Zhou, M.; Zhao, G.; Zhou, X.; Lin, S.; Meng, F. Growth of NiAl Layered Double Hydroxide on Graphene toward Excellent Anticorrosive Microwave Absorption Application. Adv. Sci. 2021, 8, 2002658. [Google Scholar] [CrossRef] [PubMed]
  2. Zhou, M.; Wan, G.; Mou, P.; Teng, S.; Lin, S.; Wang, G. CNT@NiO/natural rubber with excellent impedance matching and low interfacial thermal resistance toward flexible and heat-conducting microwave absorption application. J. Mater. Chem. C 2021, 9, 869–880. [Google Scholar] [CrossRef]
  3. Hou, T.; Jia, Z.; Wang, B.; Li, H.; Liu, X.; Bi, L.; Wu, G. MXene-based accordion 2D hybrid structure with Co9S8/C/Ti3C2Tx as efficient electromagnetic wave absorber. Chem. Eng. J. 2021, 414, 128875. [Google Scholar] [CrossRef]
  4. Xu, X.; Wang, G.; Wan, G.; Shi, S.; Hao, C.; Tang, Y.; Wang, G. Magnetic Ni/graphene connected with conductive carbon nano-onions or nanotubes by atomic layer deposition for lightweight and low-frequency microwave absorption. Chem. Eng. J. 2020, 382, 122980. [Google Scholar] [CrossRef]
  5. Ning, M.; Lu, M.; Li, J.; Chen, Z.; Dou, Y.; Wang, C.Z.; Rehman, F.; Cao, M.S.; Jin, H.B. Two-dimensional nanosheets of MoS2: A promising material with high dielectric properties and microwave absorption performance. Nanoscale 2015, 7, 15734–15740. [Google Scholar] [CrossRef]
  6. Wu, F.; Liu, Z.; Xiu, T.; Zhu, B.; Khan, I.; Liu, P.; Zhang, Q.; Zhang, B. Fabrication of ultralight helical porous carbon fibers with CNTs-confined Ni nanoparticles for enhanced microwave absorption. Compos. Part B Eng. 2021, 215, 108814. [Google Scholar] [CrossRef]
  7. Matatagui, D.; Sánchez, J.L.; Pea, A.; Serrano, A.; Horrillo, M.D.C. Ultrasensitive NO2 gas sensor with insignificant NH3-interference based on a few-layered mesoporous graphene. Sens. Actuators B Chem. 2021, 335, 129657. [Google Scholar] [CrossRef]
  8. Xu, H.; Yin, X.; Zhu, M.; Han, M.; Hou, Z.; Li, X.; Zhang, L.; Cheng, L. Carbon Hollow Microspheres with a Designable Mesoporous Shell for High-Performance Electromagnetic Wave Absorption. ACS Appl. Mater. Interfaces 2017, 9, 6332–6341. [Google Scholar] [CrossRef]
  9. Wang, J.; Huyan, Y.; Yang, Z.; Zhang, A.; Zhang, Q.; Zhang, B. Tubular carbon nanofibers: Synthesis, characterization and applications in microwave absorption. Carbon 2019, 152, 255–266. [Google Scholar] [CrossRef]
  10. Cui, Y.; Liu, Z.; Li, X.; Ren, J.; Wang, Y.; Zhang, Q.; Zhang, B. MOF-derived yolk-shell Co@ZnO/Ni@NC nanocage: Structure control and electromagnetic wave absorption performance. J. Colloid Interface Sci. 2021, 600, 99–110. [Google Scholar] [CrossRef]
  11. Wang, Y.; Yang, S.; Wang, H.; Wang, G.; Sun, X.; Yin, P. Hollow Porous CoNi/C Composite Nanomaterials Derived from MOFs for Efficient and Lightweight Electromagnetic Wave Absorber. Carbon 2020, 167, 485–494. [Google Scholar] [CrossRef]
  12. Yang, K.; Cui, Y.; Liu, Z.; Liu, P.; Zhang, Q.; Zhang, B. Design of core-shell structure NC@MoS2 hierarchical nanotubes as high-performance electromagnetic wave absorber. Chem. Eng. J. 2021, 426, 131308. [Google Scholar] [CrossRef]
  13. Cui, Y.; Liu, Z.; Zhang, Y.; Liu, P.; Ahmad, M.; Zhang, Q.; Zhang, B. Wrinkled three-dimensional porous MXene/Ni composite microspheres for efficient broadband microwave absorption. Carbon 2021, 181, 58–68. [Google Scholar] [CrossRef]
  14. Xu, J.; Cui, Y.; Wang, J.; Fan, Y.; Shah, T.; Ahmad, M.; Zhang, Q.; Zhang, B. Fabrication of Wrinkled Carbon Microspheres and the Effect of Surface Roughness on the Microwave Absorbing Properties. Chem. Eng. J. 2020, 401, 126027. [Google Scholar] [CrossRef]
  15. Cui, Y.; Yang, K.; Wang, J.; Shah, T.; Zhang, Q.; Zhang, B. Preparation of pleated RGO/MXene/Fe3O4 microsphere and its absorption properties for electromagnetic wave. Carbon 2020, 172, 1–14. [Google Scholar] [CrossRef]
  16. Yang, K.; Cui, Y.; Li, Q.; Liu, P.; Zhang, Q.; Zhang, B. Bimetallic MOFs-derived yolk-shell structure ZnCo/NC@TiO2 and its microwave absorbing properties. Appl. Surf. Sci. 2021, 556, 149715. [Google Scholar] [CrossRef]
  17. Zhou, C.; Wang, X.; Luo, H.; Deng, L.; Wei, S.; Zheng, Y.; Jia, Q.; Liu, J. Rapid and direct growth of bipyramid TiO2 from Ti3C2Tx MXene to prepare Ni/TiO2/C heterogeneous composites for high-performance microwave absorption. Chem. Eng. J. 2020, 382, 123095. [Google Scholar] [CrossRef]
  18. Wang, F.; Sun, Y.; Li, D.; Zhong, B.; Wu, Z.; Zuo, S.; Yan, D.; Zhuo, R.; Feng, J.; Yan, P. Microwave absorption properties of 3D cross-linked Fe/C porous nanofibers prepared by electrospinning. Carbon 2018, 134, 264–273. [Google Scholar] [CrossRef]
  19. Wang, J.; Cui, Y.; Wu, F.; Shah, T.; Ahmad, M.; Zhang, A.; Zhang, Q.; Zhang, B. Core-shell structured Fe/Fe3O4@TCNFs@TiO2 magnetic hybrid nanofibers: Preparation and electromagnetic parameters regulation for enhanced microwave absorption. Carbon 2020, 165, 275–285. [Google Scholar] [CrossRef]
  20. Wu, F.; Liu, P.; Wang, J.; Shah, T.; Ahmad, M.; Zhang, Q.; Zhang, B. Fabrication of Magnetic Tubular Fiber with Multi-Layer Heterostructure and Its Microwave Absorbing Properties. J. Colloid Interface Sci. 2020, 577, 242–255. [Google Scholar] [CrossRef]
  21. Li, X.; Deng, Z.; Li, Y.; Zhang, H.; Zhao, S.; Zhang, Y.; Wu, X.; Yu, Z. Controllable synthesis of hollow microspheres with Fe@Carbon dual-shells for broad bandwidth microwave absorption. Carbon 2019, 147, 172–181. [Google Scholar] [CrossRef]
  22. Li, J.; Lu, S.; Huang, H.; Liu, D.; Zhuang, Z.; Zhong, C. ZIF-67 as Continuous Self-Sacrifice Template Derived NiCo2O4/Co, N-CNTs Nanocages as Efficient Bifunctional Electrocatalysts for Rechargeable Zn-Air Batteries. ACS Sustain. Chem. Eng. 2018, 6, 10021–10029. [Google Scholar] [CrossRef]
  23. Dai, W.; Chen, F.; Luo, H.; Xiong, Y.; Wang, X.; Cheng, Y.; Gong, R. Synthesis of yolk-shell structured carbonyl iron@void@nitrogen doped carbon for enhanced microwave absorption performance. J. Alloys Compd. 2020, 812, 152083. [Google Scholar] [CrossRef]
  24. Zhang, B.; Huyan, Y.; Wang, J.; Chen, X.; Zhang, H.; Zhang, Q. Fe3O4@SiO2@CCS porous magnetic microspheres as adsorbent for removal of organic dyes in aqueous phase. J. Alloys Compd. 2018, 735, 1986–1996. [Google Scholar] [CrossRef]
  25. Wu, T.; Liu, Y.; Zeng, X.; Cui, T.; Zhao, Y.; Li, Y.; Tong, G. Facile Hydrothermal Synthesis of Fe3O4/C Core-Shell Nanorings for Efficient Low-Frequency Microwave Absorption. ACS Appl. Mater. Interfaces 2016, 8, 7370–7380. [Google Scholar] [CrossRef] [PubMed]
  26. Ji, J.; Huang, Y.; Yin, J.; Zhao, X.; Cheng, X.; He, S.; Li, X.; He, J.; Liu, J. Synthesis and Electromagnetic and Microwave Absorption Properties of Monodispersive Fe3O4/a-Fe2O3 Composites. ACS Appl. Nano Mater. 2018, 1, 3935–3944. [Google Scholar] [CrossRef]
  27. Wu, Z.; Tan, D.; Tian, K.; Hu, W.; Wang, J.; Su, M.; Li, L. Facile Preparation of Core-Shell Fe3O4@Polypyrrole Composites with Superior Electromagnetic Wave Absorption Properties. J. Phys. Chem. C 2017, 121, 15784–15792. [Google Scholar] [CrossRef]
  28. Deng, Z.; He, S.; Wang, W.; Xu, M.; Zheng, H.; Yan, J.; Zhang, W.; Yun, J.; Zhao, W.; Gan, P. Construction of Hierarchical SnO2@Fe3O4 Nanostructures for Efficient Microwave Absorption. J. Magn. Magn. Mater. 2020, 498. [Google Scholar] [CrossRef]
  29. Cui, Y.; Wu, F.; Wang, J.; Wang, Y.; Shah, T.; Liu, P.; Zhang, Q.; Zhang, B. Three dimensional porous MXene/CNTs microspheres: Preparation, characterization and microwave absorbing properties. Compos. Part A Appl. Sci. Manuf. 2021, 145, 106378. [Google Scholar] [CrossRef]
  30. Liu, Z.; Cui, Y.; Li, Q.; Zhang, Q.; Zhang, B. Fabrication of folded MXene/MoS2 composite microspheres with optimal composition and their microwave absorbing properties. J. Colloid Interface Sci. 2021, 607, 633–644. [Google Scholar] [CrossRef]
  31. Wang, J.; Wu, F.; Cui, Y.; Zhang, A.; Zhang, Q.; Zhang, B. Efficient synthesis of N-doped porous carbon nanoribbon composites with selective microwave absorption performance in common wavebands. Carbon 2021, 175, 164–175. [Google Scholar] [CrossRef]
  32. Xu, W.; Wang, G.; Yin, P. Designed Fabrication of Reduced Graphene Oxides/Ni Hybrids for Effective Electromagnetic Absorption and Shielding. Carbon 2018, 139, 759–767. [Google Scholar] [CrossRef]
  33. Gueye, B.; Jesús, S.; Navarro, E.; Serrano, A.; Marín, P. Control of the Length of Fe73.5Si13.5Nb3Cu1B9 Microwires to Be Used for Magnetic and Microwave Absorbing Purposes. ACS Appl. Mater. Interfaces 2020, 12, 15644–15656. [Google Scholar] [CrossRef] [PubMed]
  34. Yan, P.; Shen, Y.; Du, X.; Chong, J. Microwave Absorption Properties of Magnetite Particles Extracted from Nickel Slag. Materials 2020, 13, 2162. [Google Scholar] [CrossRef]
  35. Wang, K.; Chen, Y.; Tian, R.; Li, H.; Zhou, Y.; Duan, H.; Liu, H. Porous Co-C Core-Shell Nanocomposites Derived from Co-MOF-74 with Enhanced Electromagnetic Wave Absorption Performance. ACS Appl. Mater. Interfaces 2018, 10, 11333–11342. [Google Scholar] [CrossRef] [PubMed]
  36. Wu, F.; Li, K.Y.Q.; Shah, T.; Ahmad, M.; Zhang, Q.; Zhang, B. Biomass-derived 3D magnetic porous carbon fibers with a helical/chiral structure toward superior microwave absorption. Carbon 2021, 173, 918–931. [Google Scholar] [CrossRef]
  37. Liao, Q.; He, M.; Zhou, Y.; Nie, S.; Wang, Y.; Hu, S.; Yang, H.; Li, H.; Tong, Y. Highly Cuboid-Shaped Heterobimetallic Metal-Organic Frameworks Derived from Porous Co/ZnO/C Microrods with Improved Electromagnetic Wave Absorption Capabilities. ACS Appl. Mater. Interfaces 2018, 10, 29136–29144. [Google Scholar] [CrossRef]
  38. Wu, F.; Li, Q.; Liu, Z.; Shah, T.; Ahmad, M.; Zhang, Q.; Zhang, B. Fabrication of binary MOF-derived hybrid nanoflowers via selective assembly and their microwave absorbing properties. Carbon 2021, 182, 484–496. [Google Scholar] [CrossRef]
  39. Zhao, J.; Quan, X.; Chen, S.; Liu, Y.; Yu, H. Cobalt Nanoparticles Encapsulated in Porous Carbons Derived from Core-Shell ZIF-67@ZIF-8 as Efficient Electrocatalysts for Oxygen Evolution Reaction. ACS Appl. Mater. Interfaces 2017, 9, 28685–28694. [Google Scholar] [CrossRef]
  40. Liang, L.; Han, G.; Li, Y.; Zhao, B.; Zhou, B.; Feng, Y.; Ma, J.; Wang, Y.; Zhang, R.; Liu, C. Promising Ti3C2Tx MXene/Ni chain hybrid with excellent electromagnetic wave absorption and shielding capacity. ACS Appl. Mater. Interfaces 2019, 11, 25399–25409. [Google Scholar] [CrossRef]
Figure 1. SEM (A) and TEM (B) images of hollow Fe3O4; TEM images of Fe3O4@RF microspheres with different shell thicknesses: Fe3O4@RF-4 (C), Fe3O4@RF-6 (D), Fe3O4@RF-10 (E) and Fe3O4@RF-4 (F). The inset in Figure 1A is the statistical result of the particle size.
Coatings 12 00062 g001
Figure 2. TEM and SEM images of samples prepared at different carbonation temperatures: Fe3O4@C-550 (A,B), Fe3O4@C-650 (C,D) and Fe3O4@C-700 (E,F).
Coatings 12 00062 g002
Figure 3. XRD (A), FTIR (B) and TGA (C) curves of Fe3O4@C microspheres prepared at different calcination temperatures.
Coatings 12 00062 g003
Figure 4. TEM (A,C,E) and SEM (B,D,F) images of carbonization products of Fe3O4@RF microspheres with different shell thicknesses: Fe3O4@C-6, Fe@C-10 and Fe@C-12.
Coatings 12 00062 g004
Figure 5. XRD (A) and VSM (B) curves of Fe3O4@RF microsphere carbonization products with different shell thicknesses.
Coatings 12 00062 g005
Figure 6. BET curve and pore size distribution curve of Fe3O4@RF-12 (A,B), Fe3O4@C-700 (C,D) and Fe@C-12 (E,F).
Coatings 12 00062 g006
Figure 7. Three-dimensional and two-dimensional curves of the reflection loss of magnetic composite microspheres: Fe@C-12 (A,B) and Fe3O4@C-700 (C,D).
Coatings 12 00062 g007
Figure 8. Dielectric constant and permeability of magnetic composite microspheres: Fe@C-12 (A,B) and Fe3O4@C-700 (C,D).
Coatings 12 00062 g008
Figure 9. The relationship curve between the loss tangent and the difference between the loss tangent and the frequency of the magnetic composite microspheres: Fe@C-12 (A,B) and Fe3O4@C-700 (C,D).
Coatings 12 00062 g009
Figure 10. The real part (ε′) versus imaginary part (ε″) curve of the dielectric constant of magnetic composite microspheres: Fe@C-12 (A) and Fe3O4@C-700 (B).
Coatings 12 00062 g010
Figure 11. The frequency dependence curve of μ″(μ′)−2f−1 of magnetic composite microspheres: Fe@C-12 (A) and Fe3O4@C-700 (B).
Coatings 12 00062 g011
Figure 12. Schematic diagram of the microwave absorption mechanism of Fe@C-12.
Coatings 12 00062 g012
Table 1. Pore performance data of samples before and after calcination.
SampleBET (m2/g)Pore Volume (cm3/g)Average Pore Size (nm)
Fe3O4@RF-127.600.016814.71
Fe3O4@C-700114.250.09705.13
Fe@C-12116.950.09865.71
Table 2. The EMW absorbing properties of similar materials.
MaterialsThickness
(mm)
Effective Bandwidth
(GHz)
RLmin (dB)Reference
FeCPNFs2.03.0−26.1[18]
Fe/Fe3O4@TCNFs@TiO21.63.7−44.8[19]
TCF@Fe3O4@NCLs3.34.6−43.6[20]
Fe@C (HFC)4.58.1−54.4[21]
Fe73.5Si13.5Nb3Cu1B90.144.4−45.97[33]
Nickel Slag5.01.7−34.00[34]
Fe3O4@C-7001.86.0−35.12This work
Fe@C-123.54.1−50.15This work
Publisher’s Note: MDPI stays neutral with regard to jurisdictional claims in published maps and institutional affiliations.

