Article

Investigation of Accelerated Degradation Methods to Cause Blisters for Non-Defective Vinyl Ester Resin Glass Flake Organic Coatings

1
National Research Institute of Fire and Disaster, 4-35-3, Jindaiji-Higashimachi, Chofu, Tokyo 182-8508, Japan
2
Graduate School of Engineering, Yokohama National University, 79-5, Tokiwadai, Hodogaya-ku, Yokohama 240-8501, Japan
3
Japan Oil, Gas and Metals National Corporation, 10-1, Toranomon, 2-Chome Minato-ku, Tokyo 105-0001, Japan
*
Author to whom correspondence should be addressed.
Coatings 2022, 12(1), 76; https://doi.org/10.3390/coatings12010076
Submission received: 22 November 2021 / Revised: 28 December 2021 / Accepted: 28 December 2021 / Published: 10 January 2022

Abstract

:
Organic coatings are applied as a corrosion prevention measure, but their effectiveness may degrade over time. In this study, the acceleration effects of typical degradation methods in non-defective vinyl ester resin organic coatings containing glass flakes such as high-temperature immersion and immersion in chemical accelerators are clarified using physiochemical techniques. Immersion in an acetic acid (AcOH) aqueous solution causes resin swelling, and the behaviors are quantitatively evaluated through gravimetric, thickness, and electrochemical impedance spectroscopy (EIS) measurements. Furthermore, a combined process of immersion in hydrofluoric acid and an AcOH aqueous solution reduces the electrical properties and eventually blisters the thick coating surface. This result suggests that an appropriate combination of the resin swelling and the glass degradation (glass dissolution and/or formation of the gap between glass and resin) decrease mechanical properties of the glass flake coating and causes blisters. In order to help the health diagnosis of the visually non-defective aged glass flake coating, the relationship between the electrical characteristic values and the invisible degradation by accelerated tests is finally indicated.

1. Introduction

Organic coatings are applied as corrosion prevention countermeasures for various large-scale steel structures in harsh environments. For example, crude oil tanks, especially those used to store crude oil for emergency use, must be maintained in good condition because accidental oil leaks may lead to a serious disaster. Oil storage tanks have several sections that are prone to corrosion. In particular, the inner steel surface of its bottom plate, which is constantly exposed to an electrolyte solution containing chloride and other aggressive ions [1], is highly susceptible to corrosion damage. Although it requires efficient countermeasures, the bottom plate is inaccessible once the tank is filled with crude oil.
Vinyl ester resin organic coatings containing glass flakes are often used to isolate inner surfaces of steel plates from a corrosive electrolyte solution. This method realizes a durable coating. The multi-layered structure of the glass flakes effectively slows corrosion at the coating/steel substrate interface because water and ions permeate along the glass flake/resin interface. 
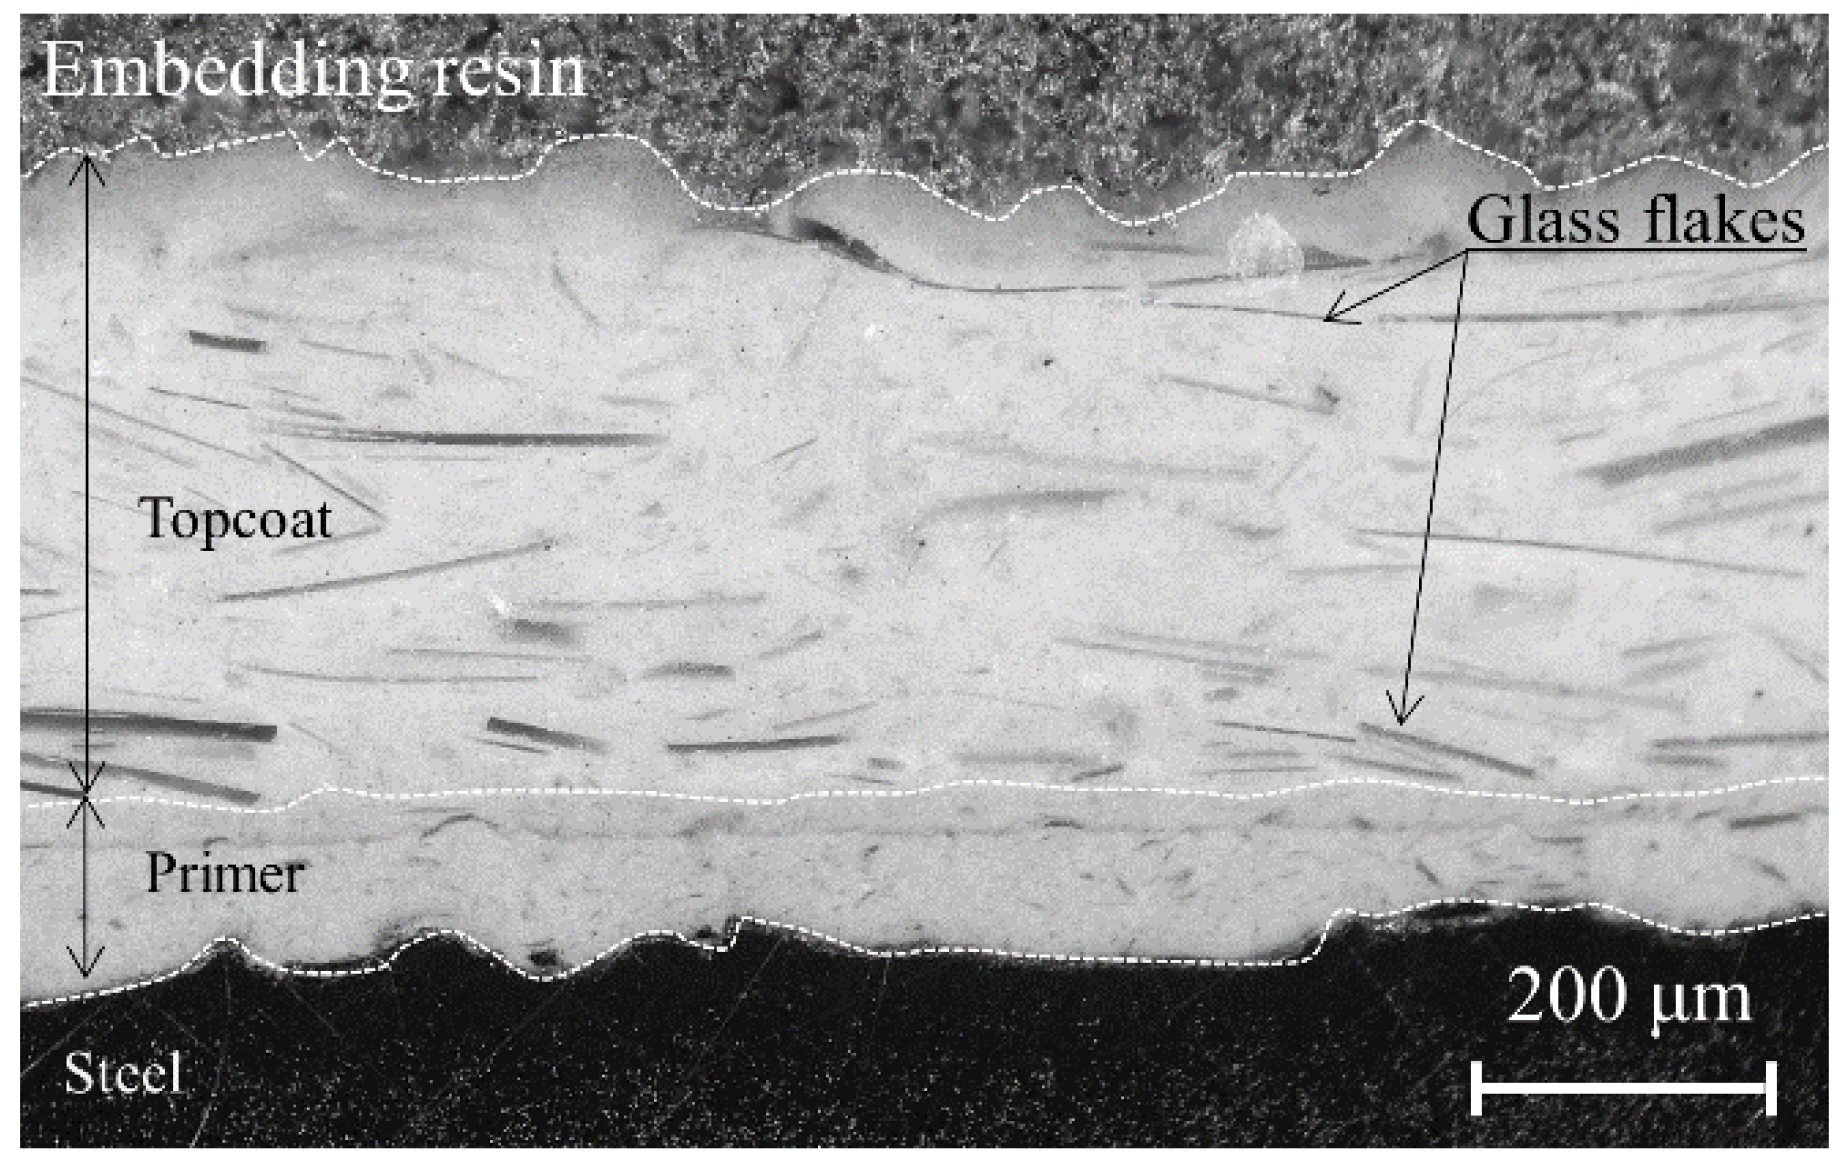
Figure 1 shows a typical cross-sectional view of an intact coating. However, aging degradation may reduce the anti-corrosion performance of glass flake coatings due to the lack of maintenance over a few decades.
After a long service period, glass flake coating systems often blister. These blisters can be as large as several millimeters. These are a type of visible failure originating from the corrosion at the coating/steel substrate interface as well as deteriorated coating performance [2,3,4,5]. The occurrence of blisters may be considered the ultimate index of the lifetime for high-performance and quality coatings without initial defects. From a practical maintenance viewpoint, visual inspections are inadequate to prevent severe corrosion of coating systems applied to inner bottom plates, especially since the plates cannot be checked during long-term service periods. Instead, a health diagnosis during the overhaul inspection period and quantitative estimates of the residual lifetime are necessary as they can detect aging degradation at a stage much earlier than blistering.
Electrochemical impedance spectroscopy (EIS) has been effectively used to evaluate the barrier properties of organic coatings in a non-destructive manner [6,7,8]. Previously, we investigated the impedance characteristics of visually non-defective glass flake coating systems applied on the inner surface of the bottom plate of an actual crude oil storage tank via a field survey. The coating impedance deviated largely from the ideal dielectric property, and the behaviors were related to a decrease in the coating’s barrier property [1]. This method would be able to realize a lifetime diagnosis in the field until blisters form.
An appropriate accelerated degradation test, which reproduces blisters within a reasonable timescale, is necessary to estimate the lifetime via laboratory experiments. Several studies have considered different accelerated degradation methods for coated steel plates [9,10,11,12,13,14,15,16,17]. For example, thermal cycling tests accelerate the degradation of coating systems by rearranging the polymer molecule chain because heat loosens the polymer network and accelerating water accumulation in the coating, which increases the transport rate of the electrolyte solution [9,10,11]. Ultraviolet (UV) radiation is effective in an outdoor coating system, and has several applications [12,13]. However, it is beyond the scope of our research because the inside of an oil storage tank is hardly exposed to sunshine. An ac–dc–ac accelerated test was recently applied to some coating systems [8,14]. This method repeatedly applies the dc potential difference and employs EIS measurements after holding the relaxation time of dc polarization. Ac–dc–ac methods cause coating failure via forced ion migration and enhance the cathodic hydrogen evolution reaction at the coating/substrate (i.e., enhancing coating degradation and interface delamination). Several studies [15,16] have reported that the impedance characteristic of coated steel under mechanical stress. The electrical properties of the coatings under tensile stress in an electrolyte solution significantly decrease compared with the unstressed and compressed states. This behavior may be caused by the expansion of the polymer chain spatial distribution (opening of the network structure) due to the stress load. Although various degradation accelerated tests have been performed to reproduce actual aging degradation, an effective method to generate blisters in glass flake coatings has yet to be realized.
Degradation of the glass flake coatings inside oil storage tanks should mainly progress by the permeation process of a mixture of water, ions, and oil. In order to accelerate this process and observe it in a laboratory, it is effective to increase the concentration and/or temperature of accelerators in contact. Of course, it is necessary to set severe conditions to accelerate degradation process quickly. Even under harsh test conditions, it is assumed that the accelerated degradation process in the natural environment can be adequately reproduced as long as the focus is on the bulk degradation due to the permeation in the highly durable glass flake coating.
To degrade vinyl ester resin organic coating containing glass flakes, first, resin degradation must be promoted. In an oil environment, swelling is presumed to be an important degradation mechanism. Van Westing et al. [18] showed that a coating immersed in n-butanol swelled more than those immersed in MILLI-Q water and this behavior was in accordance with the results obtained with the impedance measurements. On the other hand, it is also important to focus on the delamination of the resin/glass interface in composite materials such as a glass flake coating. Li Liu et al. [17] indicated that a crack of the glass/resin interface forms via degradation processes in an epoxy-based glass flake coating for deep-sea exploration enclosures under high-pressure conditions. T. C. da Silva et al. [7] suggested that repeated thermal shock tests for the epoxy-based glass flake coating can increase the defects at the glass/resin interface of the coating, decreasing the impedance. Caddock et al. [19] indicated that the uptake of hydrochloric acid (HCl) for polyester resin type glass-fiber-reinforced plastic is smaller than that of water in resin but water can attack the glass fiber/resin interface by a process of percolation through stress-induced microcracks. Consequently, acid immersion of a glass flake coating may cause a similar situation to the previous report. In the inner surface of the tank bottom plate, it is assumed that the resin/glass flake interfaces are gradually delaminated from the coating surface due to diffusion of the water and ionic species in the gap between the interfaces for many years. Thus, to assess the performance of glass flake coatings over time, it is essential to establish an accelerated degradation method that degrades both the resin itself and the glass/resin interfaces. Although there have been studies focusing on the independent degradation mechanism of the resin [18] and the glass/resin interface [7,17,19], there have been no studies that investigated the combination of these accelerated tests and the mechanisms in detail.
Of course, the development of accelerated degradation tests will be useful for the evaluation of the residual lifetime of coatings used in the petroleum industry. Determination of the acceleration factor of the electrical properties of the glass flake coating and clarification of the relationship between the electrical properties and the service years in the actually used coatings will lead to the establishment of the residual life prediction method. Glass flake coatings in a different environment from oil storage tanks may also more or less cause the resin degradation itself and/or the glass/resin delamination. Thus, the combination of the methods discussed in this study and the various acceleration methods of previous studies [9,10,11,12,13,14,15,16,17] is expected to the establishment of a method to reproduce the actual degradation under various environment. Therefore, this study is also very important as a basic study for application to various coating systems.
In the present paper, the impedance characteristics and the surface conditions for vinyl ester resin organic coating containing glass flakes are monitored during various accelerated degradation tests. By screening and combining these methods, an accelerated degradation test method to reproduce blisters of vinyl ester resin containing glass flake coating systems and the relationship between quantitative values and the degradation of the visually non-defective coating are investigated.

2. Materials and Methods

2.1. Coating Samples

Coated steel plates and free films were prepared as follows by a professional contractor (KASHIWABARA CORPORATION, Yamaguchi, Japan). For a coated SS400 steel plate (JIS G 3101: P < 0.05, S < 0.05, General-purpose steel specified by Japanese industrial standards), which had dimensions of 150 mm × 70 mm × 3.2 mm, the coating was applied on both sides. The plate was sandblasted to a surface finish of type ISO-Sa 2 1/2. A layer of primer of approximately 50 μm was coated using a brush or roller to ensure adhesion for the steel substrate. Once the primer was completely cured, an airless sprayer (ELEMRNTAL ARMOUR CORPORATION, Fukuoka, Japan) applied a topcoat to secure the film thickness so that it functioned properly. The target film thickness of the top coat was 200 μm to 400 μm. The amount of the coating liquid at the time of the application was carefully adjusted so as to be close to the target coating thickness. The drying period was at least one day. Table 1 shows the coating specifications of the primer and the topcoat. To minimize corrosion of the edges of coated steel plates during the immersion test, the edges were sufficiently thick edge-treated. Table 2 summarizes the dry film thicknesses and the standard deviations of the coated steel plates. These values were measured ten times using a coating thickness meter (Elcometer 456 coating thickness gauge, Elcometer limited, Manchester, England). Free films were prepared by applying the same coating solvents as the topcoat on a polypropylene (PP) substrate, curing for at least one day, and delaminating it from the PP plate.

2.2. Monitoring of Gravimetric and Thickness Changes

Free films were immersed in test solutions. The immersion period was determined based on results of impedance measurement described later. The gravimetric and thickness changes of the coating were monitored. Gravimetric measurements were conducted using an electronic balance (10−5 g precision, AUW220D, SHIMADZU CORPORATION, Kyoto, Japan). The droplets remaining on the surface were carefully wiped off immediately after removing the test specimen from the test solution. Then, the gravimetric data were acquired within 60 s and converted into the mass percentage by the following equation
x m = W t W 0 W 0 × 100
where Wt is the measured mass at time t and W0 is the initial mass for free films. The film thicknesses were measured by cross-sectional observations with a digital microscope (Dino-Lite edge 3.0, AnMo Electronics Corporation, Hsinchu City, Taiwan). The film thickness was the average of ten measurement points. The dry film’s average thickness of the AcOH immersed sample was 405 μm with a standard deviation of 35 μm. That of 3 wt.% NaCl immersed sample at 60 °C was 510 μm with a standard deviation 27 μm. The test panel sizes were 50 mm × 20 mm or 100 mm × 50 mm. To confirm the reproducibility, experiments were performed on two to four identical samples.

2.3. Impedance Measurements

The impedance measurements were conducted with two or three-electrode setups. The coated specimen was used as the working electrode. An acrylic cell was fixed on the coating surface, exposing a surface area of 31 cm2. Then, the cell was filled with a 3 wt.% NaCl solution. A platinum wire and KCl saturated Ag/AgCl electrode were used as the counter and reference electrodes, respectively. The experimental cell was open to the air, and the laboratory temperature was kept at 23 ± 2 °C. The measurements were performed using a frequency response analyzer and potentiostat (HZ-7000, HOKUTO DENKO CORPORATION, Tokyo, Japan). The impedance spectra were obtained in a frequency range from 10 mHz to 10 kHz (5 points/decade).
The sinusoidal ac voltage was adjusted between 30 mVp–p to 1 Vp–p according to the coating impedance characteristics. For example, the noise due to the large cell resistance of the intact coating made impedance measurements with a small amplitude difficult. In this case, 1 Vp–p was adopted to improve the signal-to-noise ratio. Applying such a large amplitude may disturb the interface between the coating and steel due to polarization compared with that of typical impedance measurements [7,8]. However, it was assumed that polarization did not occur at the coating/steel substrate interface because the dc resistance values of intact coatings should be very large. In addition, we compared the impedance characteristics with potential amplitudes of 30 mVp–p and 1 Vp–p for an intact coating immersed in 3 wt.% NaCl solution for several days. Although noise resulted in data scattering at low amplitudes, both amplitudes exhibited similar behaviors in this frequency range. For intact coatings, it was advantageous to use 1 Vp–p to reduce noise and maintain the linearity of the measurement. On the other hand, a large amplitude may influence the coating/substrate interface as the coating resistance value decreased. Thus, the measurement was performed with a small amplitude as possible. When the electrical resistivity of the coating was below the order of 1013 Ωcm and 1012 Ωcm, measurements were conducted with an amplitude of 300 mVp–p and 100 mVp–p. When a stable potential was detected, a measurement with a 30 mVp–p amplitude was performed.

2.4. Estimation of the Coating Resistance by Equivalent Circuit Analysis

A typical circuit model representing the intact organic coating impedance was the parallel combination of a coating capacitance (Cf) and a coating resistance (Rf). The coating capacitance had a value proportional to the relative permittivity (ε) of the coating. Generally, the capacitance value increases with the immersion time because the relative permittivity of water is larger than that of a dry coating. For this reason, this value can be linked to the volume fraction of water into organic coatings [20,21]. With reference to the study of Brasher and Kingsbury [22], the relationship between the percentage by the volume of absorbed water and the coating capacitance can be expressed by Equation (2), assuming that water within the coating is random and uniform.
X V = 100 × log ( C m C m , 0 ) log 80
where Cm and Cm,0 are the measured capacitance at any time t and at zero, respectively. A total of 80 is the relative permittivity of water at 20 °C. In the BK equation, it is assumed that the relative permittivity of the water in the coating is equal to that of bulk water.
The coating resistance can be interpreted as the conductive pathway through which water and ions pass, reflecting the anti-corrosion property of the coating system. B. R. Hinderliter et al. [23] reported that the absolute value of the low-frequency impedance (approximate coating resistance) decreased gradually during a long accelerated test period. Hence, the resistance value can effectively monitor aging degradation of the coating.
Electrical equivalent circuit (EEC) analysis efficiently extracted time constants from the impedance characteristics. Since organic coating impedance often shows non-ideal behavior, a simple EEC model (e.g., Randles circuit; R//C) cannot accurately describe the impedance characteristics [24]. Thus, analytical methods that focus on time-constant distributions along the coating thickness direction are often applied to interpret the impedance characteristics of coatings [24,25,26,27,28]. The Voigt series is a measurement model that provides a good fit to the impedance spectra used by Agarwal et al. [28]. Figure 2 shows EEC model of the series combination of R//C (Voigt) elements. This is a circuit model with several R//C connected in series. It should be a promising EEC model, which can well express the physical properties of an organic coating in contact with an electrolyte solution. Yu min Chen et al. [27] showed that the complex frequency dependences of phase angles appearing in the coating impedance characteristics can be expressed by the Voigt measurement model.
In this report, the coating resistance Rf and capacitance Cf based on Equations (3) and (4) from the fitting curve describe the coating impedance characteristics using the Voigt measurement model.
R f = k R k
C f = ( k 1 C k ) 1
The number of Voigt elements, which was determined as the maximum number not including zero in the 95.4% confidence interval. The analysis was performed with a new program that can implement regression analysis using the Voigt measurement model [29,30]. The scattering noise was excluded for accurate analysis. Although time constants that may be due to corrosion of the steel were sometimes observed at low frequencies after the occurrence of blisters, those time constants were excluded. That is, the analysis was applied only to the coating time-constant. The coating resistance Rf was finally converted into the volume electrical resistivity ρ that does not depend on the dimensions of samples by using Equation (5).
ρ = R f A d
where A is the immersion area A, and d is the coating thickness. The coating capacitance was converted into volume of absorbed water in the coating using Equation (2).

2.5. Accelerated Degradation Method

The coated specimens in wet conditions were subjected to various test methods, and the impedance characteristics and surface conditions were monitored. In most cases, the impedance was measured once every two or three days.

2.5.1. High Temperature Immersion

NaCl solution (3 wt.%), which was poured into the acrylic cell fixed on the coating, was kept at 60 °C by an immersion heater. Measurements were performed after confirming that the water temperature reached room temperature.

2.5.2. Immersion in a Degradation Accelerator

To identify an effective accelerator for an enhanced degradation reaction, three kinds of chemicals were tested: acetic acid (AcOH) aqueous solution, aqua regia and hydrofluoric acid (HF) aqueous solution. Organic acids such as AcOH are metabolic intermediates of the degradation components of crude oil and are structurally related to the hydrocarbon precursor [31]. Thus, immersing the coating in an AcOH aqueous solution should have the same effect as immersing in a mixture of oil and water. On the other hand, aqua regia and HF aqueous solution were selected in anticipation of damage to the glass.
AcOH and HF aqueous solution concentration was adjusted by diluting AcOH and HF reagent (The former has a concentration >99% and latter has a concentration of 46%–48%) with distilled water. The solution concentrations for a single immersion were adjusted to 50 and 75 wt.% for AcOH and 5 wt.% for HF. Aqua regia was prepared by mixing HCl (concentrations of 35%–37% (mass/mass)) and HNO3 (concentrations of 60%–61% (mass/mass)) in a ratio of 3:1. The test was conducted by immersing the coated specimen in a chemical-resistant container containing accelerators without stirring. The containers of the AcOH and aqua regia were warmed by a constant temperature water bath in expectation of enhancing degradation acceleration effect. The accelerator was poured regularly to keep it constant during the test period. The average AcOH and aqua regia temperatures checked regularly during the test were 34 and 40 °C, respectively. The HF immersion test was performed at room temperature under closed conditions. In addition to a single immersion, a combination test of 15 wt.% HF aqueous solution and 60 wt.% AcOH aqueous solution was conducted to confirm the effect of combined accelerated degradation.

3. Results and Discussion

3.1. Effect of Various Accelerated Degradation Methods

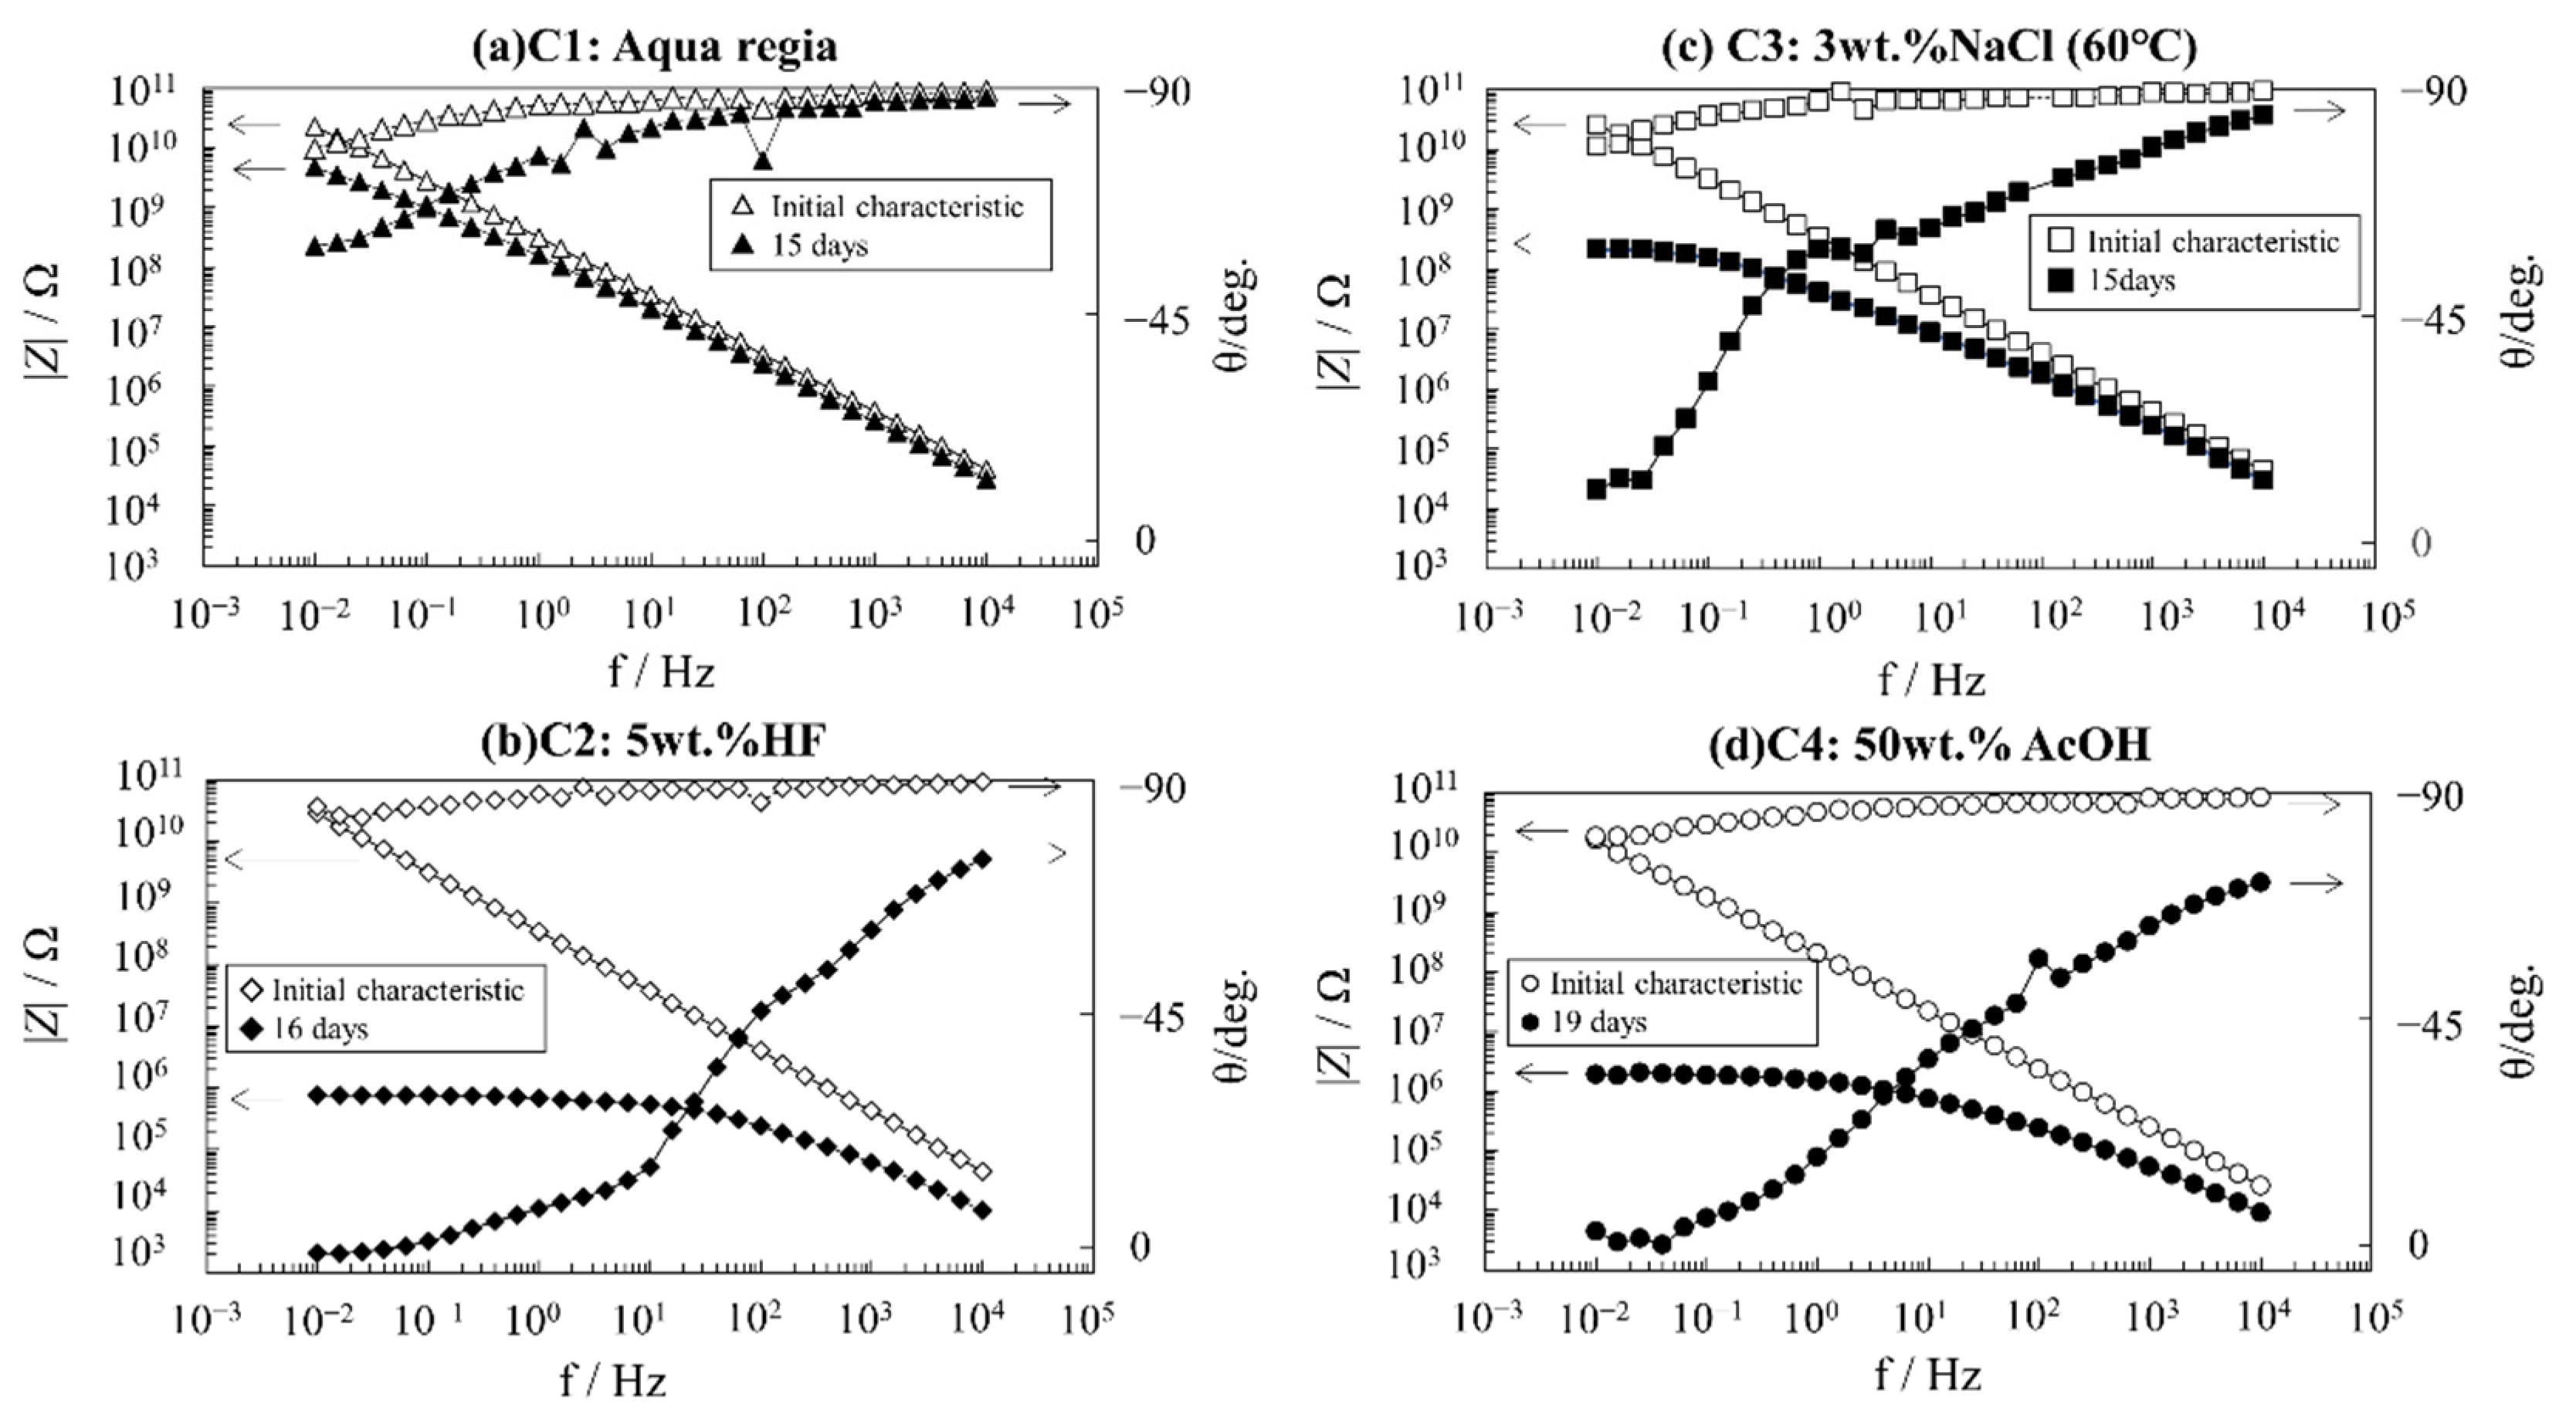
Figure 3 shows the frequency dependence of the impedance modulus |Z| and phase angles θ of the glass flake coating after performing various accelerated degradation methods. First, the impedance data were measured upon immersing in a 3 wt.% NaCl solution at room temperature for a couple of hours to measure the initial characteristics of the impedance for each specimen. This was used as the reference condition. All samples showed almost the same capacitive behavior. The |Z| depended on the frequency and θ changes around −90°. Then, accelerated degradation tests were conducted by immersing in (a) aqua regia, (b) 5 wt.% HF aqueous solution, (c) 3 wt.% NaCl at 60 °C, and (d) 50 wt.% AcOH aqueous solution.
The aqua regia immersion test did not exhibit the resistive behavior (constant value of |Z|) in the low-frequency range (Figure 3a). Thus, this method does not decrease the impedance in a short period. It is possible that a longer test period is necessary.
The 5 wt.% HF solution immersion test significantly decreased the impedance (Figure 3b). Figure 4 shows a cross-sectional view of the glass flake coating after immersion. It can be seen from the comparison of Figure 1 and Figure 4 that the glass flakes near the surface and inner layer disappeared, but those near the steel substrate remained. The corrosion potential could be measured after a few days of immersion. Hence, treatment with HF acid degrades the interface between glass and resin from the coating surface to the steel substrate in a stepwise manner. On the 16th day, the electrolyte solution reached the steel substrate via micro electrolyte pathways along the relatively weak resin/glass flake interfaces, leading to a drastic decrease in the impedance.
The 3 wt.% NaCl solution immersion test at 60 °C decreased the impedance modulus (Figure 3c). The 3 wt.% NaCl easily permeated into the coating by loosening the polymer network under the high-temperature condition. Upon cooling to room temperature, the electrolyte accumulated in the coating remained and could be detected in the impedance measurements. Hence, the decrease in impedance is attributed to electrolyte solution uptake.
The 50 wt.% AcOH solution also decreased the impedance modulus (Figure 3d). However, the effects of AcOH immersion on the physicochemical behavior and electrical properties of the coating were unclear. The physical changes during AcOH immersion are investigated in the next section.

3.2. Immersion in an AcOH Solution

Figure 5a,b shows the changes in the mass percentage xm and the thickness for free films immersed in 50 wt.% AcOH at 39 °C and 3 wt.% NaCl solutions at 60 °C as functions of time. The thickness is expressed as a normalized thickness dnormalized, which was obtained by dividing the measured thickness dt at time t by the initial thickness d0. The plots represent the average value for four samples, whereas the upper and lower values of the error bars show the maximum and minimum measurements. Immersing in 50 wt.% AcOH markedly increased the mass percentage xm and normalized thickness compared with immersing in 3 wt.% NaCl at 60 °C. This remarkable decrease in the impedance by AcOH immersion is attributed to the large uptake of the electrolyte solution due to resin swelling. For 50 wt.% AcOH immersion, the dnormalized increases significantly initially and then gradually decreases. With the immersion time, the polymer network structure will gradually expand, and the permeating electrolyte solution can easily pass through the resin. Thus, the amount of the solution that has irreversibly permeated has decreased, and the coating thickness at the time of observation (after drying room temperature) may have decreased.
The solubility parameter (SP) value indicates the relative solvency behavior of a specific solvent. The closer the SP value between the two components, the higher the compatibility. The SP values of AcOH and vinyl ester have been reported to have 10.5 and 9.72, respectively [32,33]. They show relatively close values and can be interpreted as having high solubility. On the other hand, careful attention should be paid to treating the SP value of the resin alone for the cured coating containg additives (glasses). However, assuming that even the cured vinyl ester resin still maintains the mixing property with AcOH aqueous solution to some extent, it is presumed that the AcOH with water enters the network structure of the polymer chains and affect the swelling.
As a diferent perspective, to investigate the change of the chemical structure of the coating before and after AcOH aqueous solution immersion test, Fourier transform infrared spectroscopy (FT-IR) was conducted (Nicolet is 10, Thermo-fisher.corp). The analysis was carried out by scraping the samples from the surface of the coating with sharp blade and putting these on the detection position of the ATR. The integration number is 32 times, and the spectrum was recorded from 4000 to 600 cm−1. As a result, peak shifts and/or disappearance due to the rupture of the main chain could not be observed. This result would support the inference that the decrease in impedance in AcOH is caused by the change in physical properties such as swelling.

3.3. Immersion in 3 wt.% NaCl at 60 °C or 50 wt.% AcOH

The impedance characteristics and surface conditions were monitored while immersing in 3 wt.% NaCl at 60 °C and 50 wt.% AcOH as these two conditions induced physical changes in the resin. Figure 6 shows the Bode plots, which are representative of the impedance characteristics of the specimens immersed in the AcOH aqueous solution under the conditions above, and the fitting curves obtained using the Voigt measurement model. The phase angles of the coating impedance plots during the tests largely increased from the initial capacitive behavior.
The phase angle showed a frequency dependence where the angle increased as the frequency decreased. Because this behavior cannot be simply expressed by R//C, the time-constant distribution of this coating system must be considered. The fitting curves obtained by the Voigt measurement model considering the time-constant distribution clearly simulate the impedance plots, including the initial characteristics. Table 3 shows a comparison of the Rf and Cf and chi-squared values when the plots in Figure 6 is analyzed by the circuit model of single R//C and the Voigt measurements model in Figure 2. The chi-squared is an index of goodness of fit and is calculated by the software. The smaller this value, the better the goodness of fit. The chi-squared values are clearly smaller in analysis with the Voigt measurements model. (i.e., the analysis accuracy is clearly better when using Voigt measurements model than when using single R//C).
Figure 7a,b indicates the changes in the electrical resistivity ρ and the percentage of volume fraction Xv calculated from the coating resistance and capacitance obtained from the accurately described fitting curves in the impedance spectra with time. Figure 7c shows the typical surface conditions. Figures S1 and S2 show all impedance characteristics (Bode plot) of the C3 and C4 specimens during accelerated tests. Tables S1 and S2 are the fitting parameters obtained by the EEC analysis of their impedance characteristics by using the Voigt measurement model. Actually, coating swelling must be considered when estimating Xv under AcOH immersion conditions. However, it would be difficult to accurately estimate the degree of swelling from the experimental values of the experimental data of xm and dnormalized, because the behavior of the immersion test of free films are likely to be different from the coated steel system. In this report, the approximate volume fraction was estimated using Equation (2) without considering swelling. Further study on the swelling constant will be needed to accurately estimate the volume fraction.
The initial electrical resistivity value was about 1014 Ωcm. The decrease was drastic for a few days but became gradual (Figure 7a). In addition, the electrical resistivity values for the immersion test in 50 wt.% AcOH were at least one order of magnitude lower than those for the immersion test in 3 wt.% NaCl at 60 °C during the test period. Thus, the 50 wt.% AcOH immersion method decreases the corrosion resistance of the coating compared with the immersion test in 3 wt.% NaCl at 60 °C.
Xv for both coatings increased significantly in the beginning but became gradual. The increase in Xv was larger in the 50 wt.% AcOH immersion test than that in the immersion test in 3 wt.% NaCl solution at 60 °C (Figure 7b). These results are consistent with the changes in the mass percentage and film thickness described above. On the other hand, the mass percentage value calculated from the impedance method was larger than that of the gravimetric measurement. This behavior has been shown in a previous study [22] and is attributed to the distribution of water in pores normal to the surface.
In terms of the surface condition, immersing in 3 wt.% NaCl solution at 60 °C did not induce blisters during the test period. On the other hand, small blisters formed on the coating surface of the sample immersed in 50 wt.% AcOH after 12 days (Figure 7c, arrows). These small blisters (φ 5–10 mm) were randomly generated on the surface due to the small delamination of the coating/steel interface accompanied by permeation of the local electrolyte solution into the coating. As the test time increased, the blister region increased (Figure 7c, photo B). At this stage, delamination at the coating/steel substrate interface rapidly proceeded. Although such a serious degradation state is rarely observed in practical excellent coating systems, the acceleration effect should also be high in the blister growth stage. Xv at this time decreased even though the resistivity remained almost unchanged. This result suggests that the capacitance value should be treated with caution when evaluating severe degradation.

3.4. Immersion in Highly Concentrated AcOH

The acceleration effect in an AcOH aqueous solution at higher concentrations was investigated. Figure 8a,b show the changes in electrical resistivity and volume fraction as functions of the immersion time. Figure 8c shows representative surface conditions of the coating sample in a 75 wt.% AcOH solution. Immersion tests were conducted on two coating samples with different coating thicknesses. Figures S3 and S4 show all impedance characteristics (Bode plot) of the C5 and C6 specimens during accelerated tests. Tables S3 and S4 are the fitting parameters obtained by the EEC analysis of their impedance characteristics by using the Voigt measurement model. A higher concentration of AcOH decreased the electrical resistivity but increased the volume fraction. A comparison of Figure 7 and Figure 8 demonstrated that a high-concentration AcOH aqueous solution quickly degrades the anti-corrosion performance of the coatings.
The decrease rate of the electrical resistivity in a thin coating (C5) was larger than that for a thick one (C6). For example, the number of days until the electrical resistivity reached 1010 Ωcm (dotted line) was about 1 day and about 4 days for C5 and C6, respectively. The observation that thicker coatings showed better durability falls within the range of general knowledge in coating technology. However, the effect of thickness against blistering was very strong, even though C6 was only about 1.5 times thicker than C5.
The volume fraction of C5 gradually decreased after an initial rapid increase (Figure 8b). This decrease corresponded to the occurrence of significant blisters (Figure 8c, photo A). The relative permittivity of C6 indicated a slower increase compared with that of C5. This may represent the behavior of the AcOH aqueous solution as it gradually permeated into a relatively thick coating.
The surface appearance of the coating changed at day 4 for C5 and day 19 for C6 (Figure 8c). In C5, small blisters were distributed on the coating surface, whereas in C6, a wide coating area was delaminated and large blisters occurred. As the coating thickness increases, the mechanical strength may increase because the amount of glass flakes, which is directly related to the mechanical property of the coating, was high. Thus, the high mechanical strength of thick film suppresses blister degradation of the resin itself. In addition, the localized weak portion should be preferentially attacked and severe corrosion under this portion should selectively enlarge the delamination area.

3.5. Combined Accelerated Degradation Test

A combined accelerated degradation test was conducted for a thick coating by sequential immersion in HF and AcOH aqueous solutions. First, immersing in an HF aqueous solution causes the dissolution of the glass and/or the delamination of the glass/resin interface in the coating. These phenomena would reduce the mechanical properties of the glass flake coating and allow a lot of water to permeate into the coating and steel substrate early. Then, the AcOH aqueous solution diffuses into the resin through voids and/or pathways prepared by the HF pretreatment. Finally, deep penetration of the AcOH aqueous solution readily induces blistering, which is distributed uniformly on the surface.
Figure 9a,b show the changes in the electrical resistivity and the volume fraction of C7 during this degradation test. Figure 9c is representative of surface conditions. The concentration of each solution is indicated in the figure. Figure S5 shows all impedance characteristics (Bode plot) of the C7 specimens during accelerated tests. Table S5 is the fitting parameters obtained by the EEC analysis of their impedance characteristics by using the Voigt measurement model. The electrical resistivity was greatly decreased by the first immersion in the HF solution. This is attributed to the formation of conductive pathways along the glass flake/resin interface by immersion in the HF solution. The value slightly increased upon immersing in the AcOH aqueous solution, and then decreased gradually over time. It is inferred that this behavior is due to resin swelling, which blocks the conductive pathways, and the AcOH sequentially permeates inside the coating. C7 showed a larger increase in the volume fraction than C6, although they had almost the same film thickness (Figure 9b). This corresponds to the fact that the dissolution of the glass makes it easier for the electrolyte solution to penetrate the coating. An even distribution of small blisters on the surface was observed at 12 days, and the blister area increased with immersion time (Figure 9c). This blistering pattern differed from that observed in the high concentration AcOH aqueous solution immersion test of C6. This result suggests that this combined test can effectively generate randomly scattered blisters in the glass flake coating.

3.6. Coating Blistering Process

Figure 10a–c summarizes the conceptual diagram of the blistering process of the glass flake coating with various thickness which the accelerated degradation methods shown in this paper is applied. (a,b) are the conditions for immersing a thin and thick coating in AcOH aqueous solution; (c) is a conducting combined accelerated degradation test for a thick coating by sequential immersion in HF and AcOH aqueous solutions.
Initially, the degradation accelerator is expected to reach the steel substrate from conductive pathways where the glass flakes are relatively few under all conditions. As mentioned above, this mechanism can be inferred from the result that Xv calculated from BK formula is larger than that of the gravimetric measurement (i.e., this tendency is exhibited when the water is distributed in the surface and normal directions of the coating [22].).
Y. Liu et al. [34] indicated that the occurrence of blisters for the glass flake coatings is dominated by the corrosion reaction at the coating/steel interface due to the slow permeation of the electrolyte solution by laminated glass flakes. Thus, it is supposed that blisters occur when corrosion products formed by microcells at the coating/steel interface accumulate there and push up the coating.
The contact between the coating and AcOH aqueous solution causes swelling of the resin from the surface. The resin may soften as its network structure is opened, promoting water uptake and reducing its mechanical properties. Conversely, the addition of glass flakes in the coating improves the mechanical properties. For the thin coating, it is dominated by the decrease in mechanical properties due to swelling, rather than the improvement in mechanical properties by glass flakes; the force that locally pushes up the coating by the formed corrosion products exceeds the blistering resistance. For this reason, it may lead to the occurrence of small blisters (Figure 10a). Vice versa, thick coatings would still have high mechanical properties due to the large amount of glass flakes even if the resin softens, and the coating cannot be locally pushed up by corrosion products, and small blisters are not induced. However, when the corrosion reaction at the coating/steel interface progresses remarkably, the underside of the coating may delaminate extensively, eventually forming large blisters (Figure 10b).
In terms of Figure 10c, many voids should be formed near the surface of the coating by HF aqueous solution immersion. There is no doubt that the relative permittivity has been significantly increased due to the water entering these voids. In addition, additional conductive pathways due to the formation of gaps between the resin and the glass might appear near the steel. In sequential immersion in HF and AcOH aqueous solutions, the effective thickness of the coating for suppressing blister decrease due to the disappearance of glass flakes and the swelling. Therefore, blisters similar to thin coatings may have occurred. Obviously, the immersion in HF aqueous solution is quite radical, so it is necessary to sufficiently investigate the correspondence between the combined test and the actual degradation in the future. On the other hand, it can be mentioned that the blistering occurrence by the swelling of the glass flake coating is due to a thin coating thickness and/or a locally low amount of glass flakes.
The reproducibility was simply checked by opposite side of the evaluating coating (i.e., the accelerated degradation tests were conducted by immersing with double-sided coating, two electrical properties and surface conditions can be observed with one specimen). Although the tendencies of decrease in electrical characteristics are almost the same in both sides, the occurrence of blisters was not always confirmed. Specifically, there was no obvious blistering on the opposite side of C4 and C7, whereas C5 and C6 had blistering on both sides. Since the coating was applied under well-controlled conditions, it is assumed that the application conditions were relatively uniform. Thus, the presence or absence of blisters is most likely due to the differences in physical characteristics in very small areas (e.g., the coating thickness is thin or thick, and/or the amount of glass or the adhesive at the coating/steel interface is large or small).

3.7. Relationship between Electrical Property Values and Degradation

To investigate the relationship between the electrical property values and the degradation, Figure 11 summarizes the electrical resistivity ρ and Xv values in Figure 7, Figure 8 and Figure 9 as a scatter diagram. Black circles indicate that the blisters have occurred. This figure suggests that blisters may not occur when the electrical resistivity is above 5 × 10⁹ Ωcm and when the Xv is below 15% (dot line). Although the data are limited and the determined value should be treated very carefully, this area can be interpreted as a relatively sound coating due to its low water content and low ionic conductivity.
Leidheiser [21] show that the steel corrosion under organic coating occurs when the surface resistivity falls below 107 Ω. This reference value is converted as the volume electrical resistivity of 3 × 10⁸ Ωcm in a coating having a thickness of 366 μm (i.e., the average film thickness of the test specimens in Figure 7, Figure 8 and Figure 9). Since blisters occurred when the value below 3 × 10⁸ Ωcm (dashed line), the experimental data should be valid. On the other hand, this resistivity value is about an order of magnitude smaller than 5 × 10⁹ Ωcm. Thus, it is expected that the coating maintenance can be performed at the earlier stage before the corrosion of steel is activated by setting this value as the degradation threshold.
In terms of Xv, blisters may not occur even if it shows a very high value. The plots that gather near Xv > 35% correspond to the degradation types shown in Figure 10c. Therefore, the significant increase in the Xv should be water ingress into voids formed by disappearance of the glass. If this behavior appears in aged coatings, the coating should be defective. Those that Xv gathered near 15% to 25% are classified into those whose resistivity exceeds or does not exceed the threshold. The former corresponds to the degradation type in Figure 10b, and the latter is Figure 10a. The behavior of the plots classified in Figure 10a shows that the water would permeate prior to the ions. The data plotted in this area may be a caution zone where the blistering process have begun. The behavior of the plots classified in Figure 10b suggest that thick coating may not induce blisters even if both Xv and ρ exceed the thresholds because of high mechanical properties. However, it is possible that the corrosion under the coating has occurred, considering the degradation process. Hence, if the two indicators have passed the thresholds but there are no blisters, it may be judged that continuous use has a potential risk of the corrosion of the steel.

4. Conclusions

An appropriate accelerated degradation test, which reproduces blisters within a reasonable timescale is necessary to estimate the lifetime via laboratory experiments. In this study, various accelerated degradation methods were employed for realizing blisters of vinyl ester resin organic coating containing glass flakes and their effects were evaluated. The impedance significantly decreases in a short period under three immersion conditions: in a high temperature 3 wt.% NaCl solution, an AcOH aqueous solution, and a HF aqueous solution. The impedance decreases upon immersing in an AcOH aqueous solution due to uptake of the electrolyte solution into the coating by resin swelling. Monitoring of the weight of the free film during immersion confirmed that the coating thickness affects the electrolyte solution uptake. The electrical resistivity ρ and the volume fraction X during the immersion test in an AcOH aqueous solution under various concentrations were estimated from the analysis obtained using an electrical equivalent circuit of the series connection of R//C, which can accurately describe the impedance spectra. The electrical resistivity decreases but the volume fraction increases as the concentration of the AcOH aqueous solution increases. Although we tried to immerse in an HF aqueous solution to delaminate the resin/glass interface, this method was found to greatly reduce the electrical properties by dissoluving the glass itself in the coating. However, a combined immersion test in an AcOH aqueous solution and a HF aqueous solution was conducted to verify the original idea that both degradation of the resin itself and the glass/resin interfaces is essential. As a result, it was suggested that the decrease in the impedance and the blistering phenomena for the thick coating systems are achieved by causing resin swelling and dissolution of the glass. The relationship between electrical property values and the degradation mode by accelerated tests in this paper were summarized as a scatter diagram of ρ and Xv. It is expected that the degradation of the visually non-defective aged coating can be accurately evaluated based on two indicators of the corrosion resistance and the water contents. Further investigation of the degradation mechanism is needed to improve the accuracy of the diagnosis.

Supplementary Materials

The following are available online at https://www.mdpi.com/article/10.3390/coatings12010076/s1, Figure S1: All impedance characteristics (Bode plot) of the C3 specimen during immersion in a 3wt.% NaCl solution at 60 °C, Figure S2: All impedance characteristics (Bode plot) of the C4 specimen during immersion in a 50 wt.% AcOH aqueous solution, Figure S3: All impedance characteristics (Bode plot) of the C5 specimen during immersion in a 75 wt.% AcOH aqueous solution, Figure S4: All impedance characteristics (Bode plot) of the C6 specimen during immersion in a 75 wt.% AcOH aqueous solution, Figure S5: All impedance characteristics (Bode plot) of the C7 specimen exposed to the combined degradation accelerated test, which consists of serial immersions in HF and AcOH aqueous solutions, Table S1: Resistance and capacitance values for each R//C element and their standard deviations obtained by equivalent circuit analysis using the Voigt measurement model for the impedance characteristics of each measurement date in C3 specimen, Table S2: Resistance and capacitance values for each R//C element and their standard deviations obtained by equivalent circuit analysis using the Voigt measurement model for the impedance characteristics of each measurement date in C4 specimen, Table S3: Resistance and capacitance values for each R//C element and their standard deviations obtained by equivalent circuit analysis using the Voigt measurement model for the impedance characteristics of each measurement date in C5 specimen, Table S4: Resistance and capacitance values for each R//C element and their standard deviations obtained by equivalent circuit analysis using the Voigt measurement model for the impedance characteristics of each measurement date in C6 specimen, Table S5: Resistance and capacitance values for each R//C element and their standard deviations obtained by equivalent circuit analysis using the Voigt measurement model for the impedance characteristics of each measurement date in C7 specimen.

Author Contributions

Conceptualization, K.T. and S.O.; methodology, K.T.; validation, K.T.; formal analysis, K.T.; investigation, K.T.; resources, K.T. and S.K.; data curation, K.T.; writing—original draft preparation, K.T.; writing—review and editing, S.O.; visualization, K.T.; supervision, S.O.; project administration, S.K.; funding acquisition, K.T. and S.K. All authors have read and agreed to the published version of the manuscript.

Funding

This study was supported by Japan Oil, Gas and Metals National Corporation and JSPS KAKENHI Grant Number JP18K13815.

Institutional Review Board Statement

Not applicable.

Informed Consent Statement

Not applicable.

Data Availability Statement

Not applicable.

Conflicts of Interest

The authors declare that they have no known competing financial interest or personal relationships that could have appeared to influence the work reported in this paper.

References

  1. Tokutake, K.; Nishi, H.; Ito, D.; Okazaki, S.; Serizawa, Y. Relationship between degradation characteristics of organic coating on internal bottom plate of oil storage tank and constant-phase element parameter values. Prog. Org. Coat. 2015, 87, 69–74. [Google Scholar] [CrossRef]
  2. Schneider, O.; Kelly, R.G. Localized coating failure of epoxy-coated aluminum alloy 2024-T3 in 0.5 M NaCl solutions: Correlation between coating degradation, blister formation and local chemistry within blisters. Corros. Sci. 2007, 49, 594–619. [Google Scholar] [CrossRef]
  3. Van Der Weude, D.H.; Van Westing, E.P.M.; De Wit, J.H.W. EIS measurements on artificial blisters in organic coatings. Electrochim. Acta 1996, 41, 1103–1107. [Google Scholar] [CrossRef]
  4. Brunt, N.A. Bllistering of painting layers as an effect of selling by water. J. Oil Colour Chem. Ass. 1964, 47, 31–42. [Google Scholar]
  5. Funke, W. Blistering of paint films and filiform corrosion. Prog. Org. Coat. 1981, 9, 29–46. [Google Scholar] [CrossRef]
  6. Silva, E.; Fedel, M.; Deflorian, F.; Cotting, F.; Lins, V. Properties of Post-Consumer Polyethylene Terephthalate Coating Mechanically Deposited on Mild Steels. Coatings 2019, 9, 28. [Google Scholar] [CrossRef] [Green Version]
  7. Da Silva, T.C.; Mallarino, S.; Touzain, S.; Margarit-Mattos, I.C.P. DMA, EIS and thermal fatigure of organic coatings. Electrochim. Acta 2019, 318, 989–999. [Google Scholar] [CrossRef]
  8. Upadhyay, V.; Battocchi, D. Exploring the combined effect of DC polarization and high temperature exposure on barrier properties of organic coatings. Prog. Org. Coat. 2017, 110, 42–46. [Google Scholar] [CrossRef]
  9. Li, J.; Jeffcoate, C.S.; Bierwagen, G.P.; Mills, D.J.; Tallman, D.E. Thermal transition effects and electrochemical properties in organic coatings: Part 1-Initial studies on corrosion protective organic coatings. Corrosion (NACE) 1998, 54, 763–771. [Google Scholar] [CrossRef]
  10. Bierwagen, P.G.; He, L.; Li, J.; Ellingson, L.; Tallman, D.E. Studies of a new accelerated evaluation method for coating corrosion resistance-thermal cycling testing. Prog. Org. Coat. 2000, 39, 67–78. [Google Scholar] [CrossRef]
  11. Valentinelli, L.; Vogelsang, J.; Ochs, H.; Fedrizzi, L. Evaluation of barrier coatings by cycling testing. Prog. Org. Coat. 2002, 45, 405–413. [Google Scholar] [CrossRef]
  12. Hattori, M.; Nishikata, A.; Tsuru, T. EIS study on degradation of polymer-coated steel under ultraviolet radiation. Corros. Sci. 2010, 52, 2080–2087. [Google Scholar] [CrossRef]
  13. Bedoya, F.E.; Gallego, L.M.; Bermudez, A.; Castano, J.G.; Echeverria, F.; Calderon, J.A. New strategy to assess the performance of organic coatings during ultraviolet-condensation weathering test. Electrochim. Acta 2014, 124, 119–127. [Google Scholar] [CrossRef]
  14. Allahar, N.K.; Bierwagen, P.G.; Gelling, J.V. Understanding ac-dc-ac accelerated test results. Corros. Sci. 2010, 52, 1106–1114. [Google Scholar] [CrossRef]
  15. Fredj, N.; Cohendoz, S.; Feaugas, X.; Touzain, S. Effect of mechanical stress on kinetics of degradation of marine coatings. Prog. Org. Coat. 2008, 65, 316–322. [Google Scholar] [CrossRef]
  16. Yang, H.; Zhang, Q.; Tu, S.; Wang, Y.; Li, Y.; Huang, Y. A study on effects of elastic stress on protective properties of marine coatings on mild steel in artificial seawater. Prog. Org. Coat. 2016, 99, 61–71. [Google Scholar] [CrossRef]
  17. Tian, W.; Liu, L.; Meng, F.; Liu, Y.; Li, Y.; Wang, F. The failure behavior of an epoxy glass flake coating/steel system under marine alternating hydrostatic pressure. Corros. Sci. 2014, 86, 81–92. [Google Scholar] [CrossRef]
  18. Van Westing, E.P.M.; Ferrari, G.M.; De Wit, J.H.W. The determination of coating performance with impedance measurements II. Water uptake of coatings. Corros. Sci. 1994, 36, 957–977. [Google Scholar] [CrossRef]
  19. Caddock, B.D.; Evans, K.E.; Hull, D. The diffusion of hydrochloric acid in polyester thermosetting resins. J. Mater. Sci. 1987, 22, 3368–3372. [Google Scholar] [CrossRef]
  20. Deflorian, F.; Fedrizzi, L.; Rossi, S.; Bonora, P.L. Organic coating capacitance measured by EIS: Ideal and actual trends. Electrochim. Acta 1999, 44, 4243–4249. [Google Scholar] [CrossRef]
  21. Leidheiser, H., Jr. Electrical and electrochemical measurements as predictors of corrosion at the metal-organic coating interface. Prog. Org. Coat. 1979, 7, 79–104. [Google Scholar] [CrossRef]
  22. Brasher, D.M.; Kingsbury, A.H. Electrical measuremnts in the study of immersed paint coatings on metal. 1. Comparison between capacitance and gravimetric methods of estimating water uptake. J. Appl. Chem. 1954, 4, 62–72. [Google Scholar] [CrossRef]
  23. Hinderliter, B.R.; Croll, S.G.; Tallman, D.E.; Su, Q.; Bierwagen, G.P. Interpretation of EIS data from accelerated exposure of coated metals based on modeling of coating physical properties. Electrochim. Acta 2006, 51, 4505–4515. [Google Scholar] [CrossRef]
  24. Bouvet, G.; Nguyen, D.D.; Mallarino, S.; Touzain, S. Analysis of the non-ideal capacitive behavior for high impedance organic coatings. Prog. Org. Coat. 2014, 77, 2045–2053. [Google Scholar] [CrossRef]
  25. Schiller, C.A.; Strunz, W. The evaluation of experimental dielectric data of barrier coatings by means of different models. Electrochim. Acta 2001, 46, 3619–3625. [Google Scholar] [CrossRef]
  26. Nguyen, A.S.; Musiani, M.; Orazem, M.E.; Pebere, N.; Tribollet, B.; Vivier, V. Impedance analysis of the distributed resistivity of coatings in dry and wet conditions. Electrochim. Acta 2015, 179, 452–459. [Google Scholar] [CrossRef] [Green Version]
  27. Chen, Y.; Nguyen, A.S.; Orazem, M.E.; Tribollet, B.; Pebere, N.; Musiani, M.; Vivier, V. Identification of resistivity distributions in dielectric layers by measurement model analysis of impedance spectroscopy. Electrochim. Acta 2016, 219, 312–320. [Google Scholar] [CrossRef] [Green Version]
  28. Agarwal, P.; Orazem, M.E.; Garcia-Rubio, L.H. Measurement models for electrochemical impedance spectroscopy, I. Demonstration of applicability. J. Electrochim. Soc. 1992, 139, 1917–1927. [Google Scholar] [CrossRef]
  29. Watson, W.; Orazem, M.E. EIS: Measurement Model Program, ECSArXiv 2020. Available online: https://ecsarxiv.org/kze9x/ (accessed on 18 December 2021).
  30. Liao, H.; Watson, W.; Dizon, A.; Tribollet, B.; Vivier, V.; Orazem, M.E. Physical Properties Obtained from Measurement Model Analysis of Impedance Measurements. Electrochim. Acta 2020, 354, 136747. [Google Scholar] [CrossRef]
  31. Cozzarelli, I.M.; Baedecker, M.J.; Eganhouse, R.O.; Goerlitz, D.F. The geochemical evolution of low-molecular-weight organic acids derived from the degradation of petroleum contaminants in groundwater. Geochim. Cosmochim. Acta 1994, 58, 863–877. [Google Scholar] [CrossRef]
  32. Hansen, M.C. The Three Dimensional Solubility Parameter and Solvent Diffusion Coefficient; Danish Technical Press: Copenhagen, Denmark, 1967; p. 19. [Google Scholar]
  33. Kang, H.K.; Yoon, T.H.; Bump, M.; Riffle, J.S. Effect of solubility and miscibility on the adhesion behavior of polymer-coated carbon fibers with vinyl ester resins. J. Appl. Electrochem. 2001, 79, 1042–1053. [Google Scholar] [CrossRef]
  34. Liu, Y.; Wang, J.; Liu, L.; Li, Y.; Wang, F. Study of the failure mechanism of an epoxy coating system under high hydrostatic pressure. Corros. Sci. 2013, 74, 59–70. [Google Scholar] [CrossRef]
Figure 1. Typical cross-sectional view of the non-defective vinyl ester resin organic coating with glass flakes.
Coatings 12 00076 g001
Figure 2. Electrical circuit model of the series combination of R//C (Voigt) elements.
Coatings 12 00076 g002
Figure 3. Bode plots of the glass flake coating subject to various accelerated degradation methods. Test conditions are as follows: (a) immersion in aqua regia, (b) immersion in a 5 wt.% hydrofluoric acid (HF) aqueous solution, (c) immersion in 3 wt.% NaCl at 60 °C, and (d) immersion in 50 wt.% acetic acid (AcOH) aqueous solution. Initial characteristic is the impedance obtained by only immersing in 3 wt.% NaCl solution for about a couple of hours.
Coatings 12 00076 g003
Figure 4. Typical cross-sectional image of the glass flake coating after immersion in a hydrofluoric (HF) acid aqueous solution.
Coatings 12 00076 g004
Figure 5. (a,b). Changes in the physical properties over time for free films immersed in 50 wt.% AcOH and 3 wt.% NaCl solution at 60 °C: (a) mass percentage xm and (b) coating thicknesses.
Coatings 12 00076 g005
Figure 6. Typical impedance characteristics (Bode plot) of the specimens during immersion in a 50 wt% AcOH aqueous solution and the fitting curves obtained using a R//C series connection (dashed line).
Coatings 12 00076 g006
Figure 7. (a,b) Changes in the electrical resistivity and volume fraction over time for coating specimens immersed in 50 wt.% AcOH and 3 wt.% NaCl solution at 60 °C, and (c) typical surface conditions of the specimen.
Coatings 12 00076 g007
Figure 8. (a,b) Changes in the electrical resistivity and the volume fraction with time for two coating specimens with different thicknesses immersed in a 75 wt.% AcOH solution, and (c) typical surface conditions.
Coatings 12 00076 g008
Figure 9. (a,b) Changes in the electrical resistivity and the volume fraction exposed to the combined degradation accelerated test, which consists of serial immersions in HF and AcOH aqueous solutions, and (c) typical surface conditions.
Coatings 12 00076 g009
Figure 10. (ac) Conceptual diagram of the blistering process of the glass flake coating when accelerated tests are applied to coatings of various thicknesses. (a,b) are the conditions for immersing a thin and thick coating in AcOH aqueous solution; (c) is a conducting combined accelerated degradation test for a thick coating by sequential immersion in HF and AcOH aqueous solutions.
Coatings 12 00076 g010
Figure 11. Scatter diagram of the electrical resistivity ρ and Xv values in Figure 7, Figure 8 and Figure 9.
Coatings 12 00076 g011
Table 1. Coating specifications of the primer and the top coat.
LayerType of Vinyl Ester Resin HardenerMixing Ratio *1
(Base Coating Solvent: Hardener)
Glass Flake Contents (wt.%)
PrimerBis-phenolMethyl ethyl ketone peroxide100:1.1-
Top coatNovolac100:0.5620 *2
*1 The value is the application condition at 20 °C. Typically, the hardener contents are low at high temperatures and high at low temperatures. *2 The topcoat includes glass flakes in the range from 18 wt.% to 27 wt.%, which was determined in Japanese regulation.
Table 2. Dry film thicknesses and their standard deviations of the coated steel plates.
SampleDry Film Thickness/μmStandard Deviation
C140335
C240328
C341923
C428926
C528423
C639923
C745335
Table 3. Comparison of Rf and Cf and chi-squared values when the data in Figure 6 are analyzed by the circuit model of single R//C and the Voigt model in Figure 2.
Voigt ModelSingle R//C
RfCf/FChi-SquareRfCf/FChi-Square
0 day1.1 × 10116.2 × 10−101.5 × 10−46.3 × 10107.8 × 10−101.4× 10⁻²
5 days3.8 × 1079.7 × 10−93.4 × 10−51.5 × 1079.0 × 10−91.8 × 10⁻¹
19 days1.9 × 1061.2 × 10−91.3 × 10−41.2× 1066.6 × 10−91.3 × 10⁻¹
Publisher’s Note: MDPI stays neutral with regard to jurisdictional claims in published maps and institutional affiliations.

