Article

Effects of Y2O3 Addition on the Microstructure and Static Lead-Bismuth Eutectic Thermal Corrosion Behaviors of FeCrAlTiC-xY2O3 Laser Clade Coatings

School of Materials Science and Engineering, Jiangsu University, Zhenjiang 212013, China
*
Authors to whom correspondence should be addressed.
Coatings 2022, 12(11), 1759; https://doi.org/10.3390/coatings12111759
Submission received: 20 October 2022 / Revised: 7 November 2022 / Accepted: 9 November 2022 / Published: 17 November 2022

Abstract

:
In order to prevent the lead-bismuth eutectic (LBE) corrosion of stainless-steel components used in nuclear reactors, the FeCrAlTiC-xY2O3 coatings were prepared on 304 stainless steel (304SS) by laser cladding. After adding Y2O3, Y2TiO5 and Y2Ti2O7 formed, which have a combined strengthening effect on improving hardness. The 0.2 wt.% Y2O3 coating showed the highest hardness as ~489 HV. In the 400 °C wear test, the weight loss of coating samples was less than ~5.2 mg, while the weight loss of 304SS samples was ~35.5 mg. The 0 wt.% Y2O3 coating showed the highest wear resistance, indicating that adding Y2O3 could result in the decrease of wear resistance. The LBE corrosion behaviors of coatings at 500 °C were investigated. The results showed that a uniform and dense oxide scale with a low growth rate was obtained on the coating surface, and no penetration of LBE into the coating was observed. After 1000 h of corrosion, the oxide scale of coatings grew to merely a ~0.3 μm thickness. The corrosion resistance mechanism of the coating in oxygen-saturated LBE at 500 °C was proposed based on experimental results along with a thermodynamic and kinetic analysis.

1. Introduction

Lead-bismuth eutectic (LBE) alloy is viewed as a primary expecting material for coolant in an accelerator driven sub-critical system (ADS) [1]. The commonly used structural materials, such as F/M steel and austenite steel, could be easily corroded by the LBE, leading to the failure of reactor system [2,3,4]. According to previous studies, liquid metal corrosion (LMC) mainly includes dissolution corrosion, oxidation corrosion, and cavitation erosion in liquid LBE [5,6]. Apart from the LMC, liquid metal embrittlement (LME) would lead to the failure of materials [7,8]. Therefore, it still remains a great challenge in finding effective protective methods.
To improve the LBE corrosion resistance of structural steels, a general strategy is to fabricate a protective coating on the steel surface. Coatings made of refractory metals, such as W, Mo, and their alloys, could increase the resistance to the dissolution corrosion because of their low solubilities in liquid LBE [9]. However, these refractory metals form unstable and even volatile oxides for their poor resistance to oxidation corrosion in liquid LBE [10,11]. It makes the deposition of refractory metal coating a challenge. Candidate ceramic coating materials comprise oxides, carbides, and Max phases. Research has demonstrated the excellent resistance to oxidation corrosion in liquid LBE [12,13,14,15]. However, ceramic coatings are generally brittle, resulting in cracking and spallation under certainly applied loads [16]. Ceramic coatings lack self-healing after cracking somehow. Another method is to add oxide formation elements such as Al and Ti into the structural materials. Recent works reported that the functional composition (alloying elements, Al, etc.) would exert obvious influences on the density of state distribution, bonding states, and surface separation energy, which determine the interaction between coatings and substrate [17,18]. Additionally, Ti may affect the composition and distribution of Cu-based solid solutions in some corresponding coating materials, enhancing the mechanical performance of substrate [19]. In an environment with a certain amount of oxygen, Al-containing coatings can generate dense, thin, and self-healing oxide scales on the surface. Several FeAl or FeCrAl alloy coatings were deposited on the steel surface, showing an impressive resistance to the LBE oxidation corrosion [20,21,22,23]. However, it remains a challenge to develop a novel coating that could serve under aggressive environments and provide protection for the structural materials applied in ADS. For instance, there are significantly different mechanical or thermophysical properties between oxide and alloy coatings. In flowing LBE, the oxide/coating interface is easy to fracture and fail under the thermal-mechanical coupled effect, reducing the equipment’s lifetime [24,25]. Thus, improving the hardness and toughness of coatings is a main issue to be solved.
To strengthen LBE corrosion resistance, a general way is adding carbides to coatings, e.g., TiC or WC [26,27,28]. However, this may lead to a serious segregation of carbides in the coatings, resulting in an increase of crack sensitivity [29]. In order to deal with such problems, synthesizing in situ TiC during laser processing was proposed. The distribution of TiC would be relatively homogeneous and effectively strengthen the wear resistance [30,31]. Another way is adding rare earth oxide, such as Y2O3 and Ce2O3. Recent research demonstrated that the coatings would show impressive improvement on toughness after adding such rare earth oxides [32,33,34]. Moreover, some research indicated that Y2O3 may react with Ti into Y-, Ti-, O- enriched clusters such as Y2TiO5 and Y2Ti2O7 [35,36,37].
In order to provide knowledge about the LBE corrosion resistance of composite coating, five kinds of FeCrAlTiC-xY2O3 coatings were prepared on a 304SS surface by laser cladding in this work, and their corrosion behaviors in static oxygen-saturated LBE at 500 °C were studied. By investigating the corrosion characteristic of the surface and cross-section, the corrosion mechanism of the as-prepared coating is revealed.

2. Materials and Methods

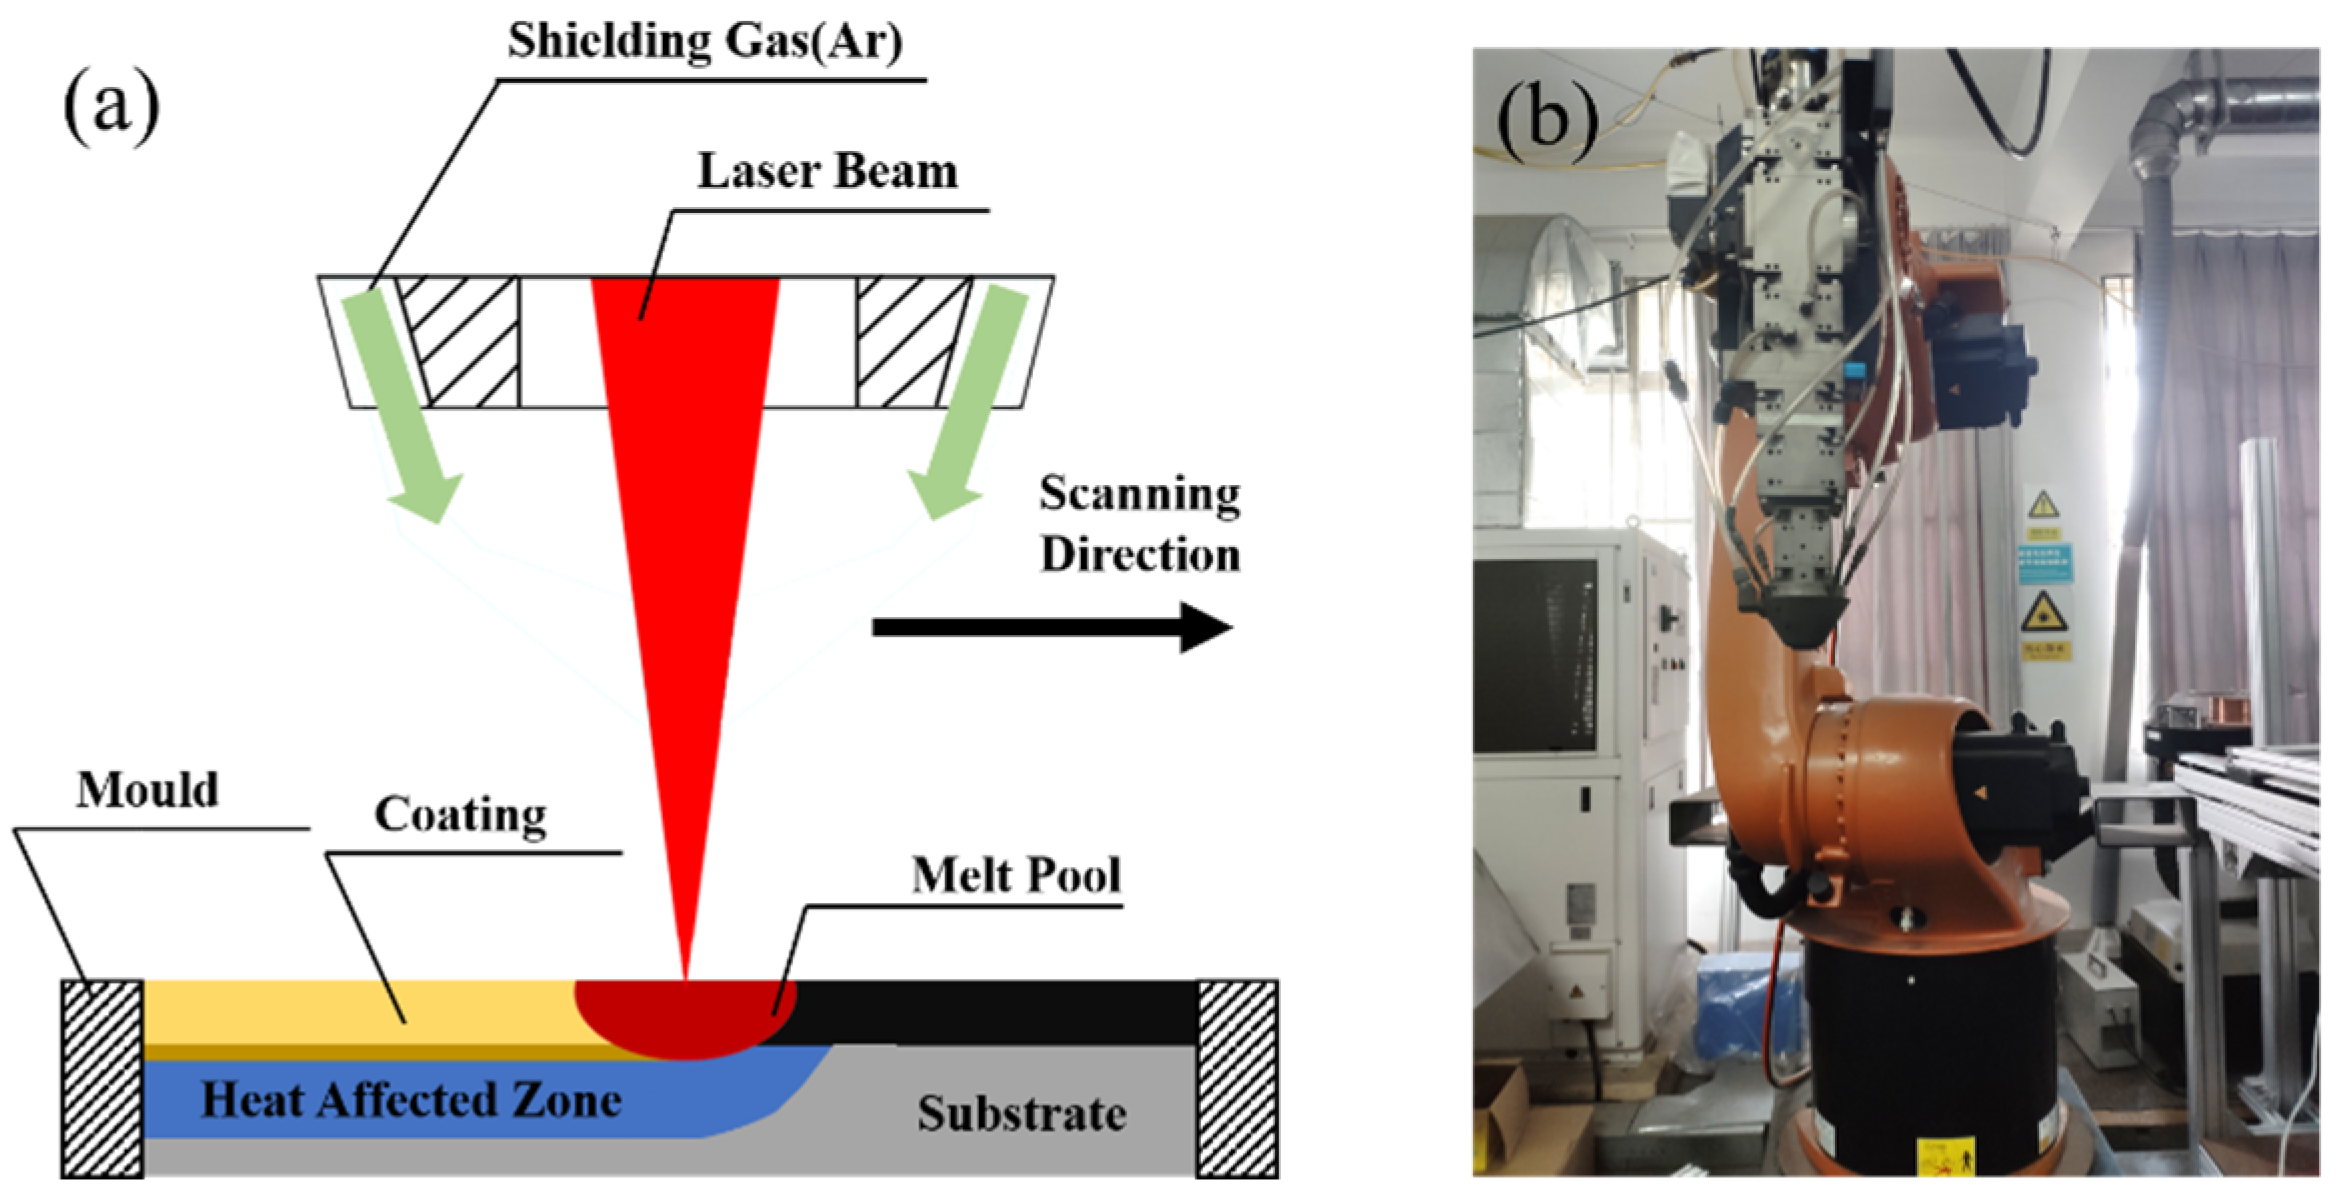
2.1. Preparation of Powder and Coating

FeCrAlTiC-xY2O3 laser clad powders were blended from the powder of Ti (purity ≥99.99%, Avimetal powder metallurgy technology Co., Ltd., Beijing, China), FeCr (Cr 60 wt.%, C 7~8 wt.%, Fe bal., Nangong Xindun Alloy Welding Consumables Spraying Co., Ltd., Xingtai, China), FeAl (Al 50 wt.%, Fe 50 wt.%, Nangong Xindun Alloy Welding Consumables Spraying Co., Ltd., Xingtai, China), and nano-Y2O3 (purity ≥99.999%, Jinlei Technology Co., Ltd., Ningbo, China). Five groups of powders were prepared, and the detailed compositions are listed in Table 1. The powders were mixed by a high-energy planetary ball milling (Changsha Miqi Instrument Technology Co., Ltd., Changsha, China) operated at 180 rpm using 304SS vials (vacuum atmosphere) and 304SS balls (the ball-to-powder weight ratio of 1:1) for up to a cumulative period of 20 h (with intermittent intervals of 5 min per 30 min). Before laser cladding, the powders were dried in a vacuum stove at 120 °C for 2 h. Then, the powders compacted by an automatic table press were preplaced on the 304SS surface.
An Afs-R6000 laser material processing system was employed to fabricate the coating with argon protection, as shown in Figure 1. The laser cladding parameters determined by pre-orthogonal experiments were as follows: a laser power of 2200 W, a scanning velocity of 5 mm/s, and an overlapping rate of 50%.

2.2. Micro-Hardness and 400 °C Wear Test

A Vickers hardness tester (FM-ARS900, SURTTZ Instrument Co., Ltd., Shanghai, China) was employed to test the microhardness of samples at intervals of 0.07 mm. The wear tests were carried out using a friction and wear tester (MMU-5GA, Jinan Yihua Tribology Testing Technology Co., Ltd., Jinan, China). The test method determined the wear of materials during sliding using a pin-on-disk apparatus. Five kinds of the coatings with different Y2O3 additions and 304SS were machined into pin specimens with dimensions of Ø 4.64 mm × 10.50 mm. The size of the grinding disk was Ø 53.6 mm × 7.9 mm, and the hardness was 60–62 HRC. Figure 2 shows the schematic of the wear test. The parameters of the wear test were as follows: load of 150 N, temperature of 400 °C, linear velocity of 0.188 m/s, and wear time of 60 min. For evaluating the wear performance, the weight loss of the pin was measured by an electronic balance with an accuracy of 0.1 mg.

2.3. LBE Corrosion Test

The FeCrAlTiC-xY2O3 coatings were fabricated into specimens with dimensions of 20 mm × 10 mm × 10 mm for LBE corrosion. Then, surfaces of the specimens were polished with SiC paper up to 400 grits. Static LBE corrosion tests were conducted in a vacuum resistance furnace (with pressure −0.1 Pa) containing LBE at 500 °C. At 500 °C, the oxygen concentration co (wt.%) in the oxygen-saturated LBE was calculated to be 6.3 × 10⁻⁴ wt.% according to Equation (1) [1]:
log c o = 1.2 3400 / T
where T is the temperature (K).

2.4. Characterization

The constituent phases of the FeCrAlTiC-xY2O3 coatings were investigated by an X-ray diffraction (XRD, Bruker D8 Advance, Bruker Co., Berlin, Germany). The cross-section of coatings was polished with SiC paper up to 1500 grits and 0.5 μm carbide suspension. After that, all samples were electro-polished by 5% oxalic acid solution at 7.5 V up to 15 s. The cross-section of samples was characterized by a scanning electron microscopy (SEM, NovaNamo450, Thermo Fisher Scientific Inc., Waltham, MA, USA) equipped with an Energy Dispersive Spectrometer (EDS, Thermo Fisher Scientific Inc., Waltham, MA, USA). A transmission electron microscope (TEM, FEI Talos F200X, Thermo Fisher Scientific Inc., Waltham, MA, USA) was employed to analyze the composition of the coatings.
After LBE corrosion, the cross-section of 304SS and coatings was prepared by the usual metallographic techniques. The cross-section morphologies of 304SS and coatings were studied by SEM. Moreover, an electron probe map analysis (EPMA, EPMA-1720, SHIMADZU Co., Kyoto, Japan) was employed to show the element distribution in the coating after 1000 h of LBE corrosion.
X-ray photoelectron spectroscopy (XPS, Thermo Scientific K-Alpha, Thermo Fisher Scientific Inc., Waltham, MA, USA) was used in this study with the aim of analyzing the state chemical bonding and elemental composition. The spectrometer was Thermo Scientific K-Alpha. Before the XPS test, the surface residual LBE of the 0.2 wt.% Y2O3 coating after 1000 h corrosion was removed by a mixed solution (acetic acid:ethyl alcohol:hydrogen peroxide = 1:1:1). The sample was not sputter-etched prior to analyses. The excitation source was Al anode (1486.6 eV). The electron emission angle was 60°. The size of the analyzed sample area was 400 μm2. The charge neutralizer was used. The base pressure in the analysis chamber during spectra acquisition was lower than 5.0 × 10⁻⁷ mBar. Recent research indicated that the conventional C 1s peak of adventitious carbon could not reflect the results of XPS accurately [38,39,40]. Thus, the calibration and linearity of the binding energy scale were confirmed by the work function method [41,42]. Work function øSA measurements by ultraviolet photoelectron spectroscopy (UPS) were performed in the same instrument with unmonochromatized He I radiation (21.20 eV). A sample bias of −5 V was applied to observe the secondary electron cutoff. Figure 3 shows the valence band spectra as recorded from the 0.2 wt.% Y2O3 coating after 1000 h of corrosion. The work function øSA can be determined as 3.97 eV by the difference between the photon energy and the binding energy of the secondary cutoff edge. Thus, the binding energy of the C 1s peak could be set at 285.61 eV (289.58 eV−øSA), and all other core-levels shifted accordingly.

3. Results and Discussions

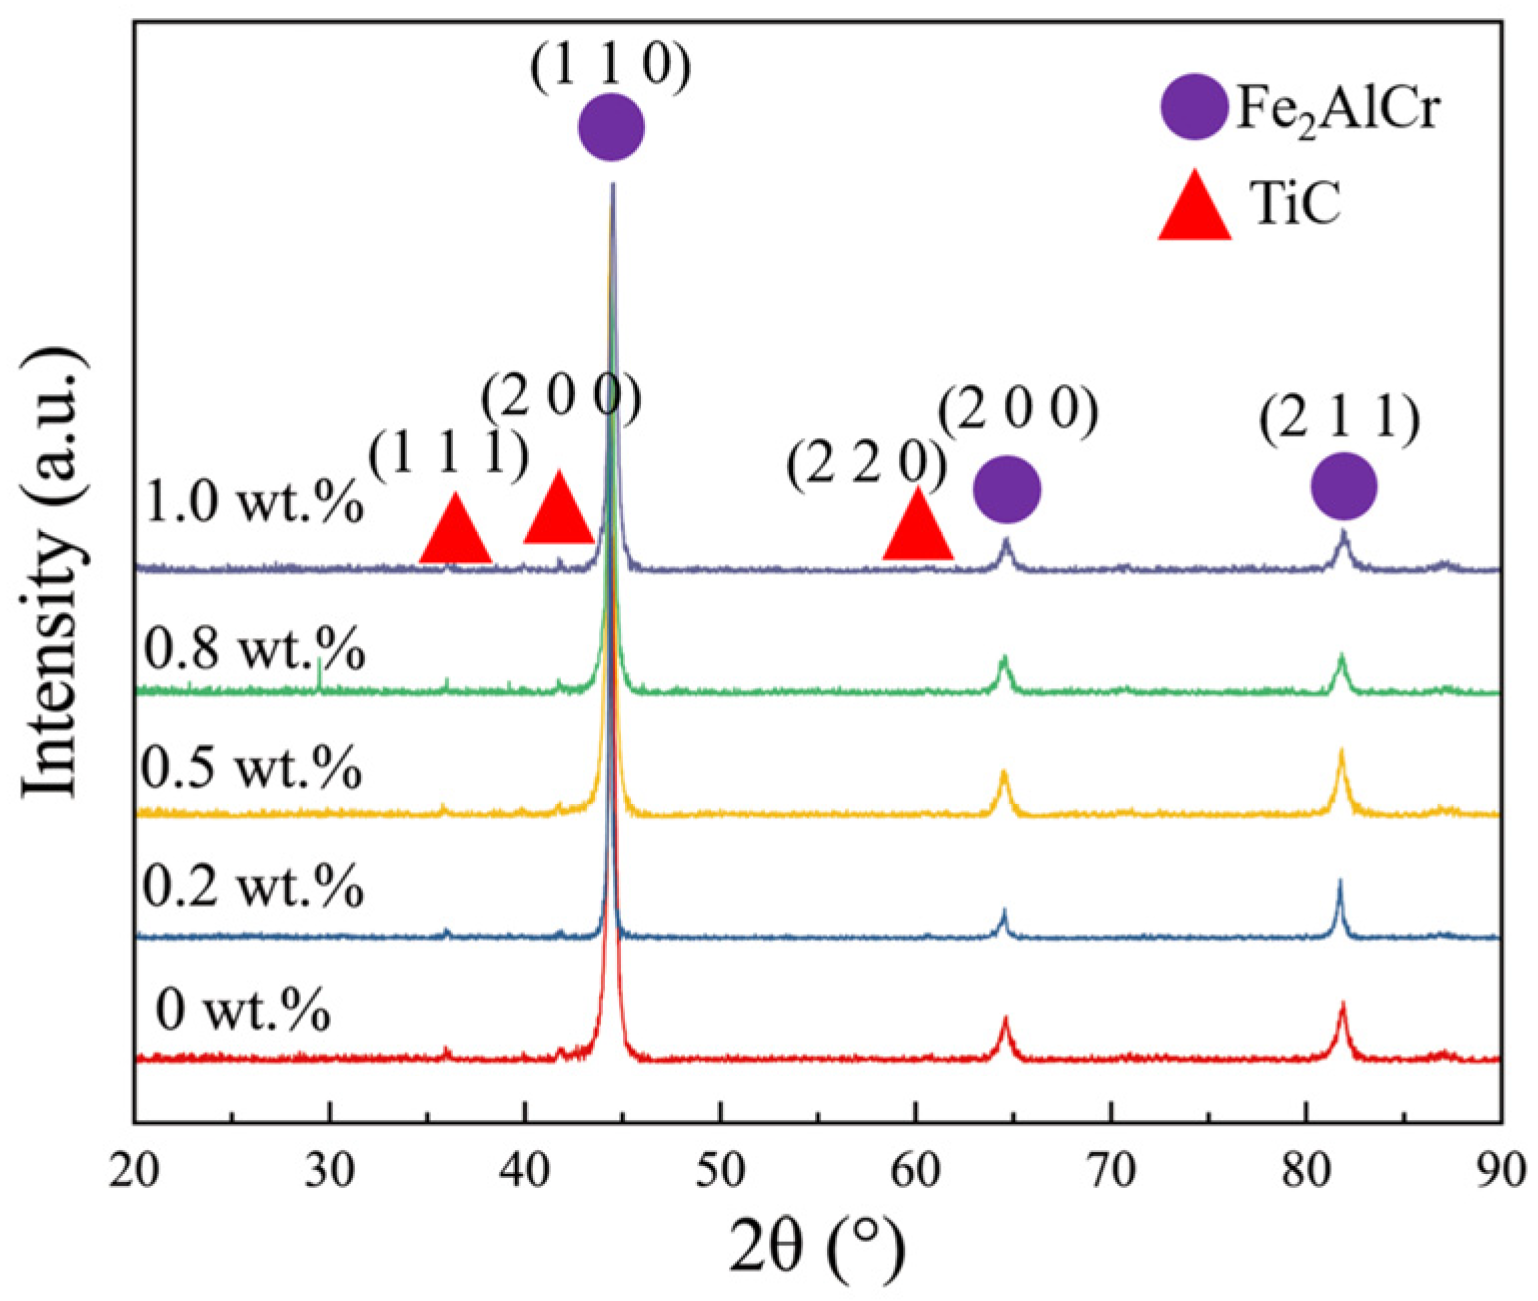
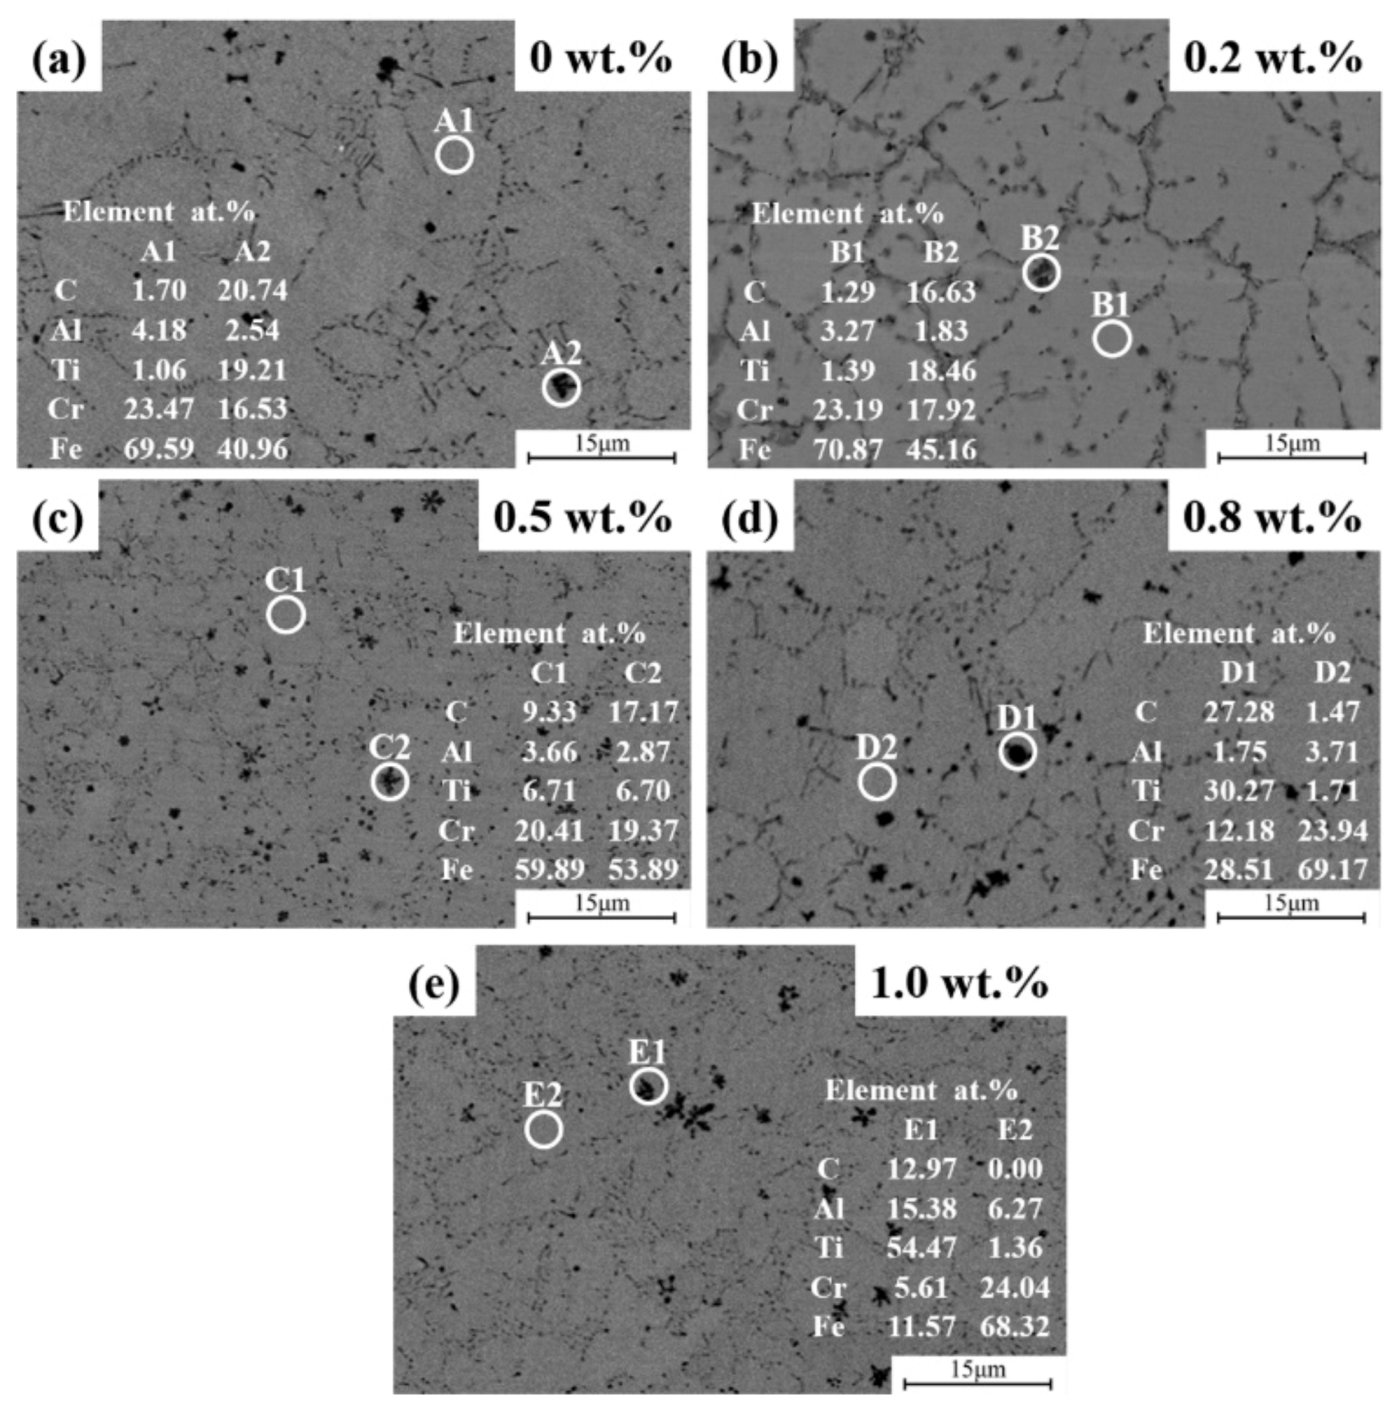
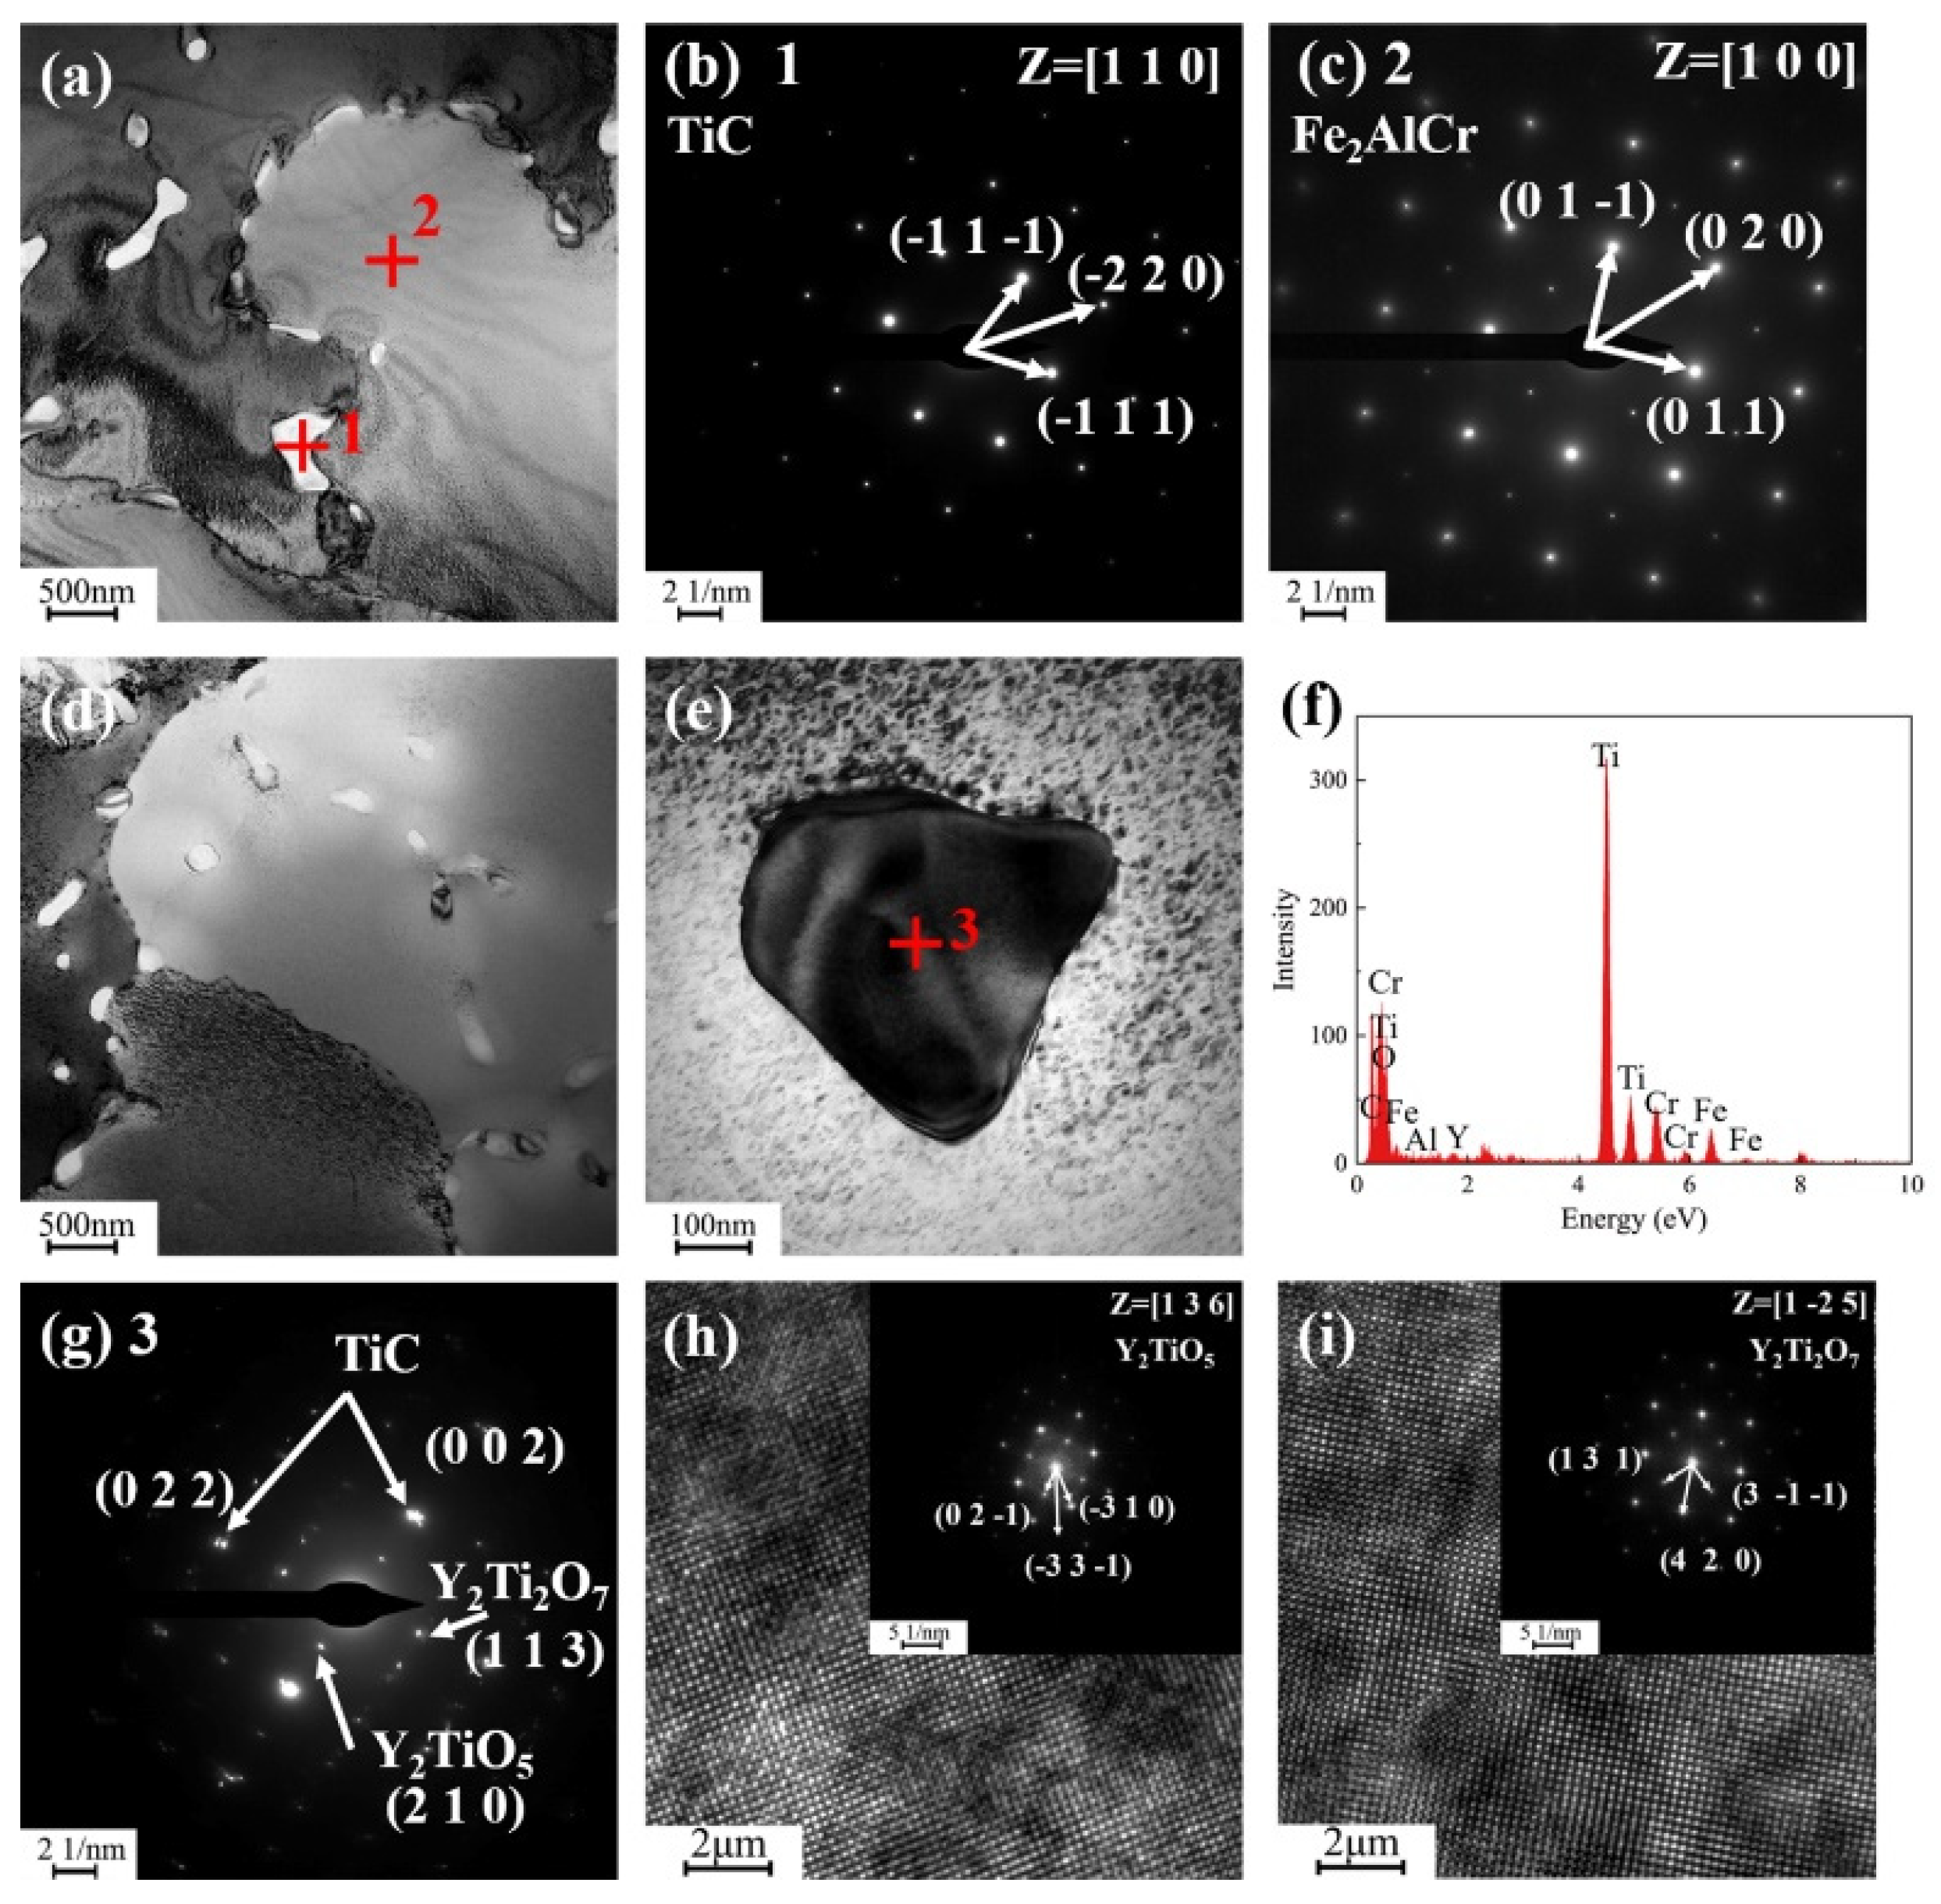
3.1. Phase Composition and Microstructures of Composite Coating

The XRD pattern of FeCrAlTiC-xY2O3 coatings is presented in Figure 4. The major phases of the coating without Y2O3 addition are Fe2AlCr (BCC, PDF#54-0387) and TiC (FCC, PDF#32-1383). This demonstrates that Fe, Cr, and Al powders generate Fe-Cr-Al compounds, and TiC is synthesized during laser processing. After adding different contents of Y2O3, the XRD result of the coatings showed that the characteristic peaks were similar to the result of the 0 wt.% Y2O3 coating. This indicates that the coatings with Y2O3 mainly consist of Fe2AlCr and TiC. However, owing to the low content of Y2O3, it is difficult to distinguish the corresponding composition in coatings by XRD.
Figure 5 shows the SEM images and the corresponding EDS analysis of the coatings. In Figure 5a, the coating without Y2O3 comprised a Fe2AlCr phase with TiC distributing at grain boundaries. With the addition of Y2O3, more TiC particles precipitated within the grains (Figure 5b). Figure 5c reveals the microstructure of the 0.5 wt.% Y2O3 coating. Some flower-shaped dark phase was observed, indicating the micro-segregation of TiC. In Figure 5d, TiC segregated at the grain boundary in the 0.8 wt.% Y2O3 coating. When the content of Y2O3 increased to 1.0 wt.%, the segregation of TiC was further serious at the grain boundary (Figure 5e). It is obvious that the addition of Y2O3 influenced the distribution of TiC. However, EDS could not identify element Y because of its low mass fraction in raw materials.
Further, to clarify the microstructure, the TEM microstructures and the corresponding SAD patterns of the cross-section microstructure of coatings with 0 wt.% and 0.2 wt.% Y2O3 are shown in Figure 6. Figure 6a shows the microstructure of the coating without Y2O3. SAED patterns in Figure 6b,c confirm the presence of TiC and Fe2AlCr. These indicate that the TiC particles prefer to precipitate at the grain boundaries of the Fe2AlCr matrix and present as bar-shaped. TiC mainly distributes at the grain boundaries of the matrix, which relates to the incomplete or complete wetting of grain boundaries [43]. During solidification, the solid grains are isolated by liquid interlayers. These liquid materials are enriched with TiC, which solidify and remain solid along the first solidifying grain boundaries. Therefore, the TiC partially or fully isolated the grains of Fe2AlCr matrix after solidification. The microstructure of the 0.2 wt.% Y2O3 coating is shown in Figure 6d. The TiC particles precipitate within the grains after the addition of 0.2 wt.% Y2O3 and prefer to present as sphere or short-bar. It could be inferred that adding Y2O3 causes the evolution of TiC. Figure 6e shows the microstructure of a TiC particle in 0.2 wt.% Y2O3 coating. The EDS result in Figure 6f reveals that element Y exists in TiC particles. Further, in Figure 6g, the corresponding SAED pattern in the same particle includes diffraction spots from Y2Ti2O7 and Y2TiO5, along with the pattern of TiC. Moreover, according to the HRTEM image and corresponding fast Fourier transform (FFT) patterns shown in Figure 6h,i, it could be confirmed that Y2Ti2O7 and Y2TiO5 particles distribute in the TiC, respectively. It is reported that Y2TiO5 and Y2Ti2O7 could be generated by means of the partial substitution of Y with Ti in Y2O3 during laser processing [36,37,44]. These Y-Ti oxides could promote the solidification of materials and lead to the evolution of TiC morphology from bar-shape to short-bar-shape or sphere. Meanwhile, the fraction of the grain boundaries that were occupied by TiC decreased because more intragranular TiC precipitated, as shown in Figure 6d.

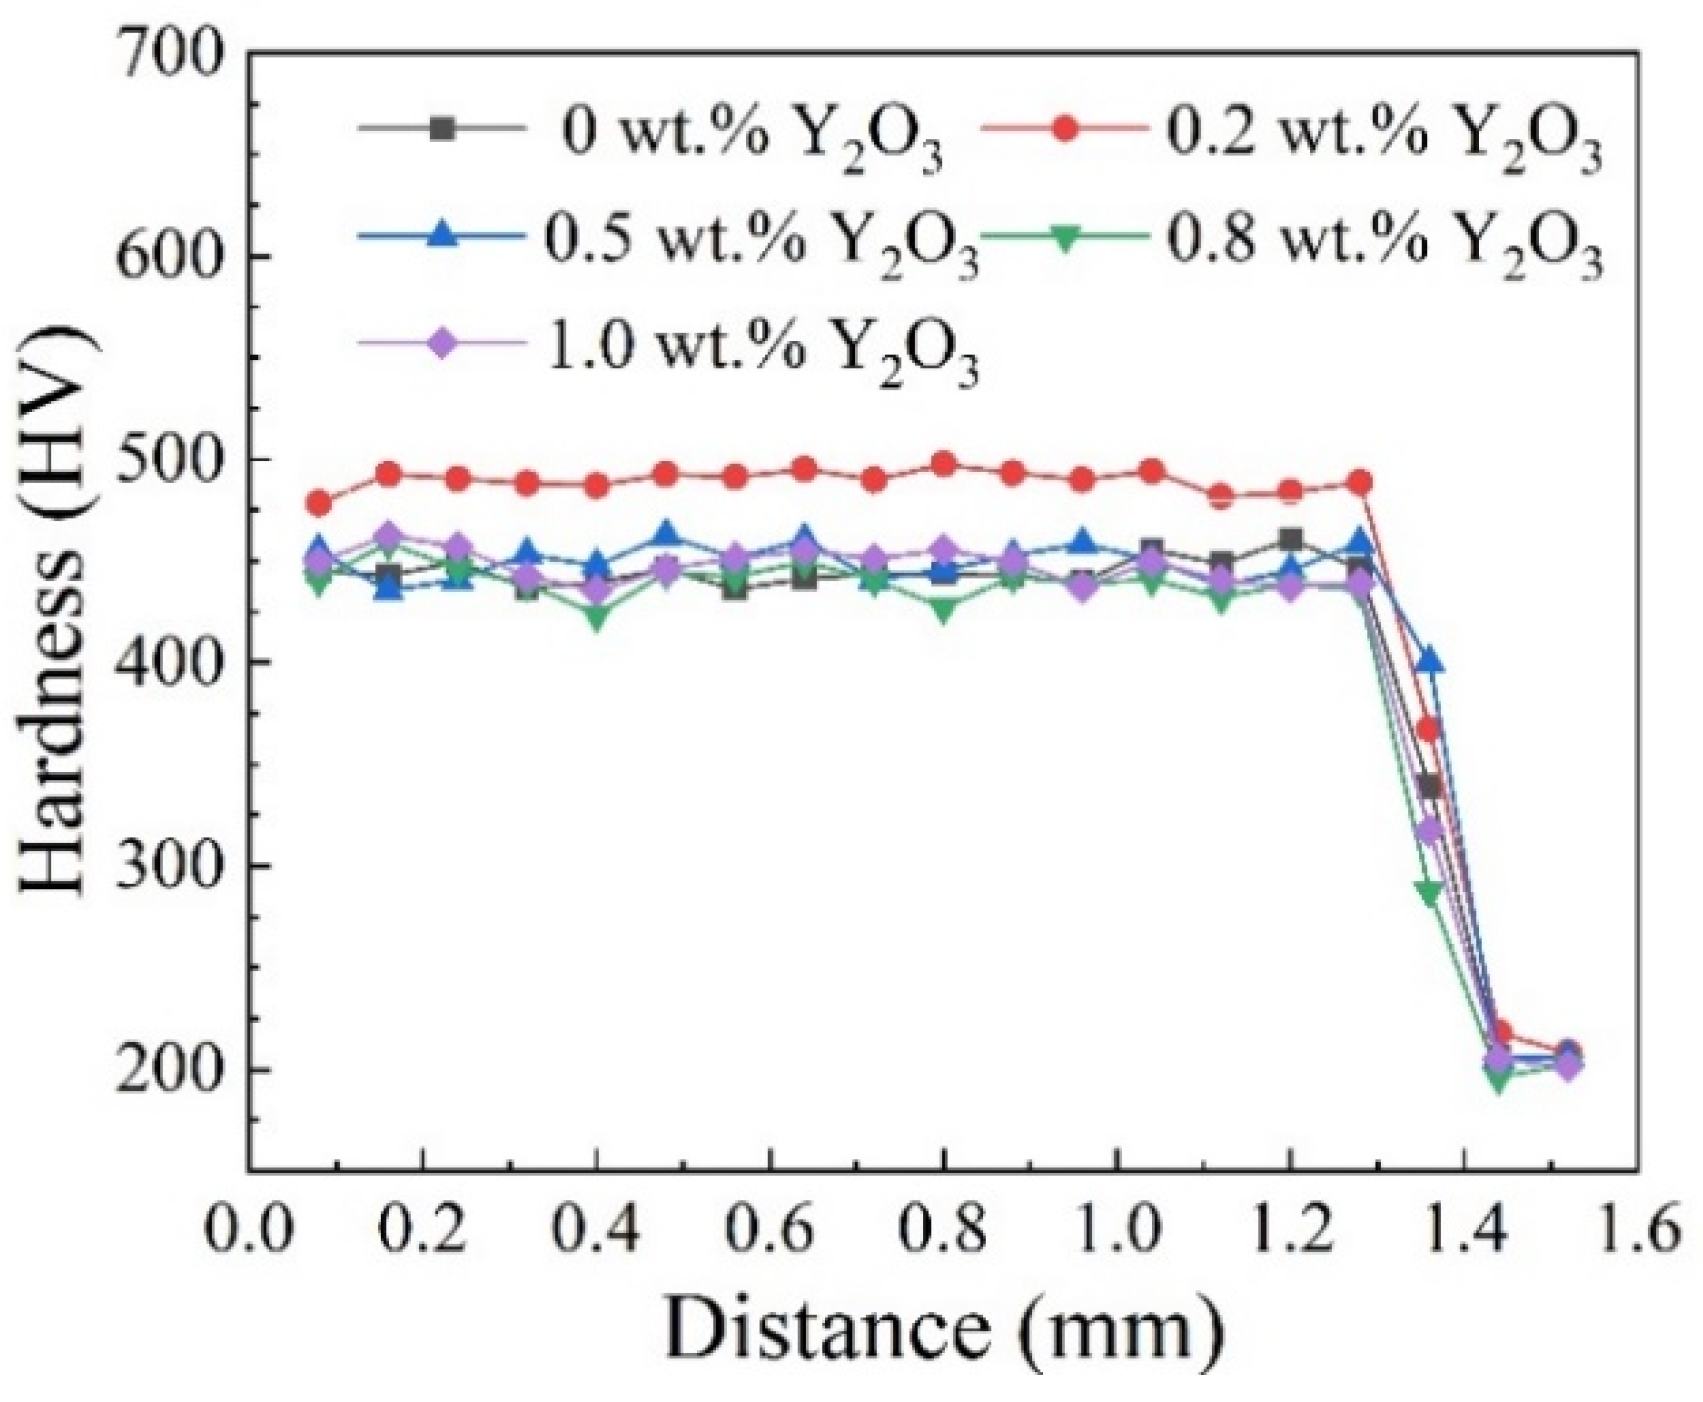
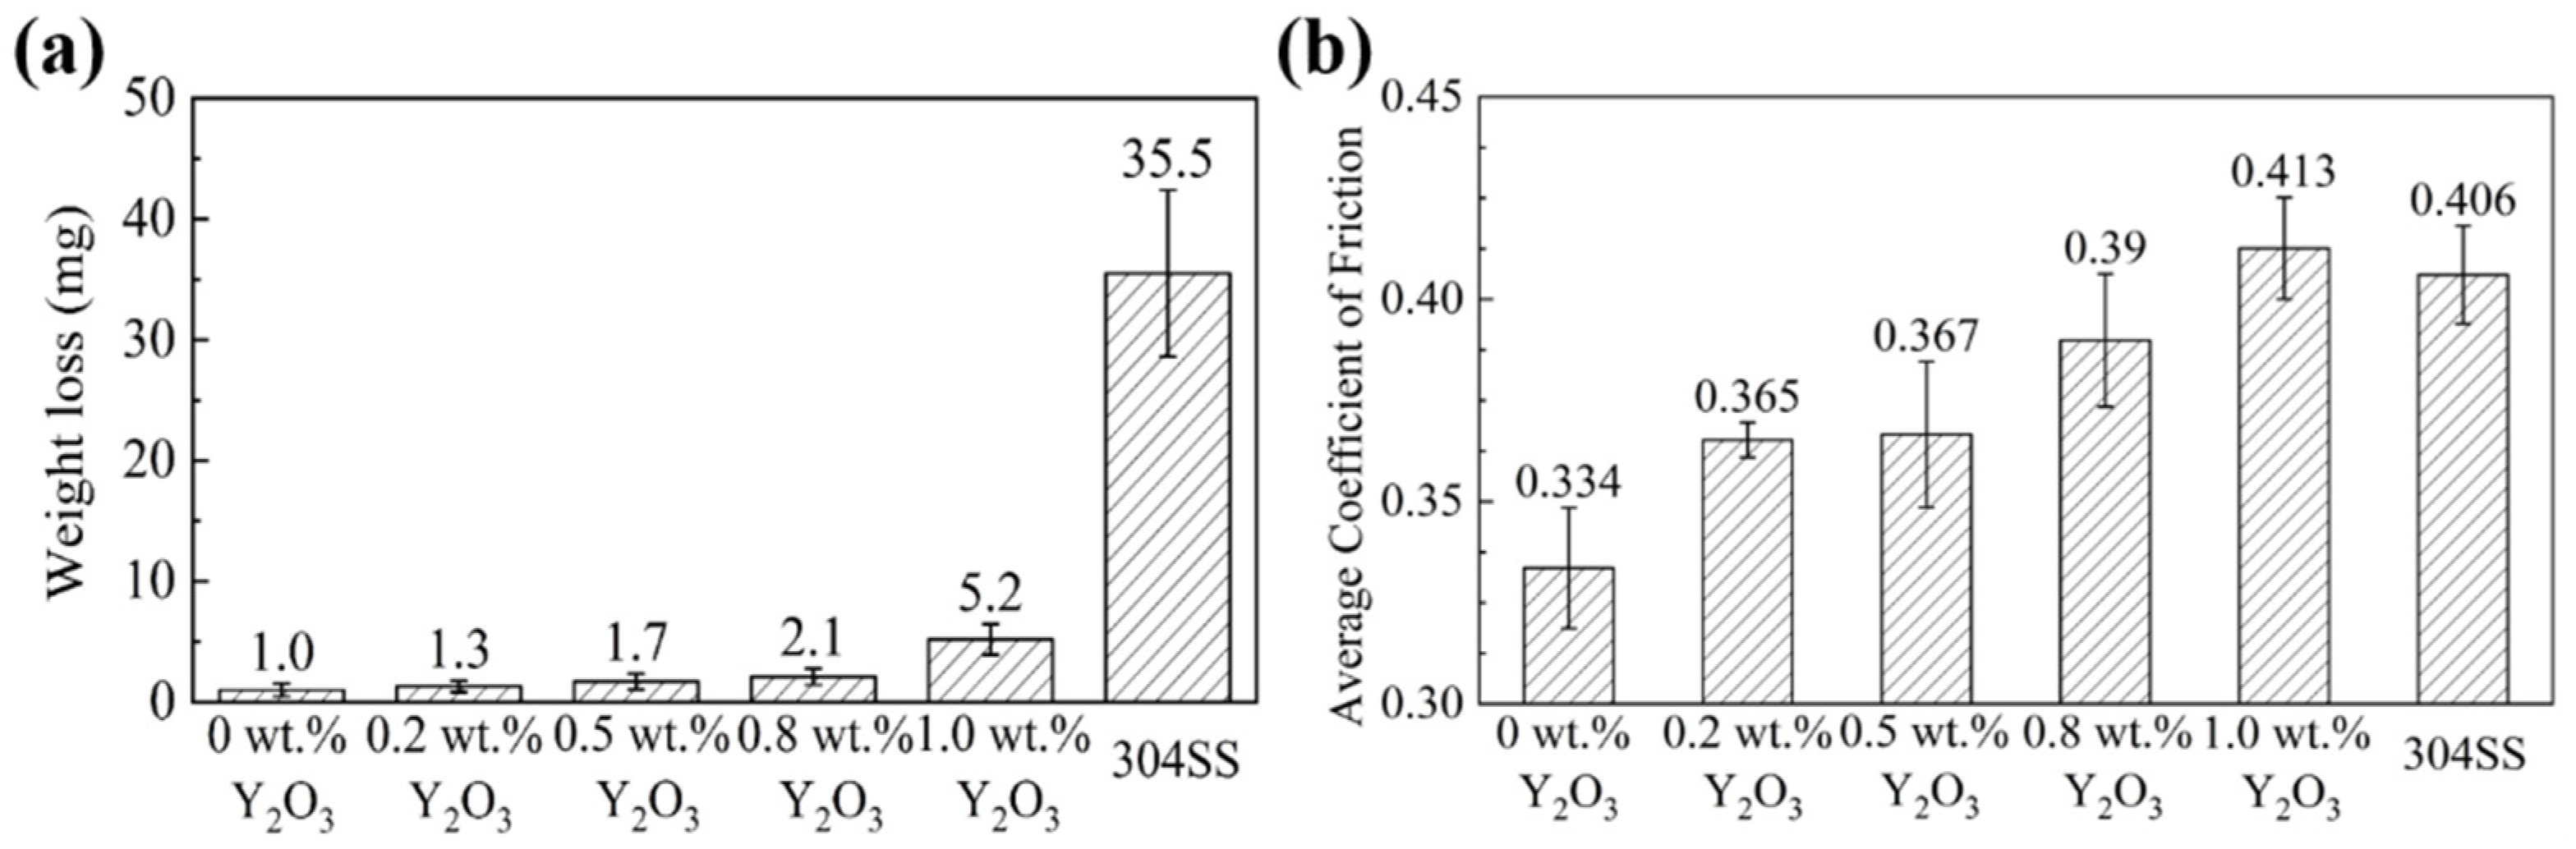
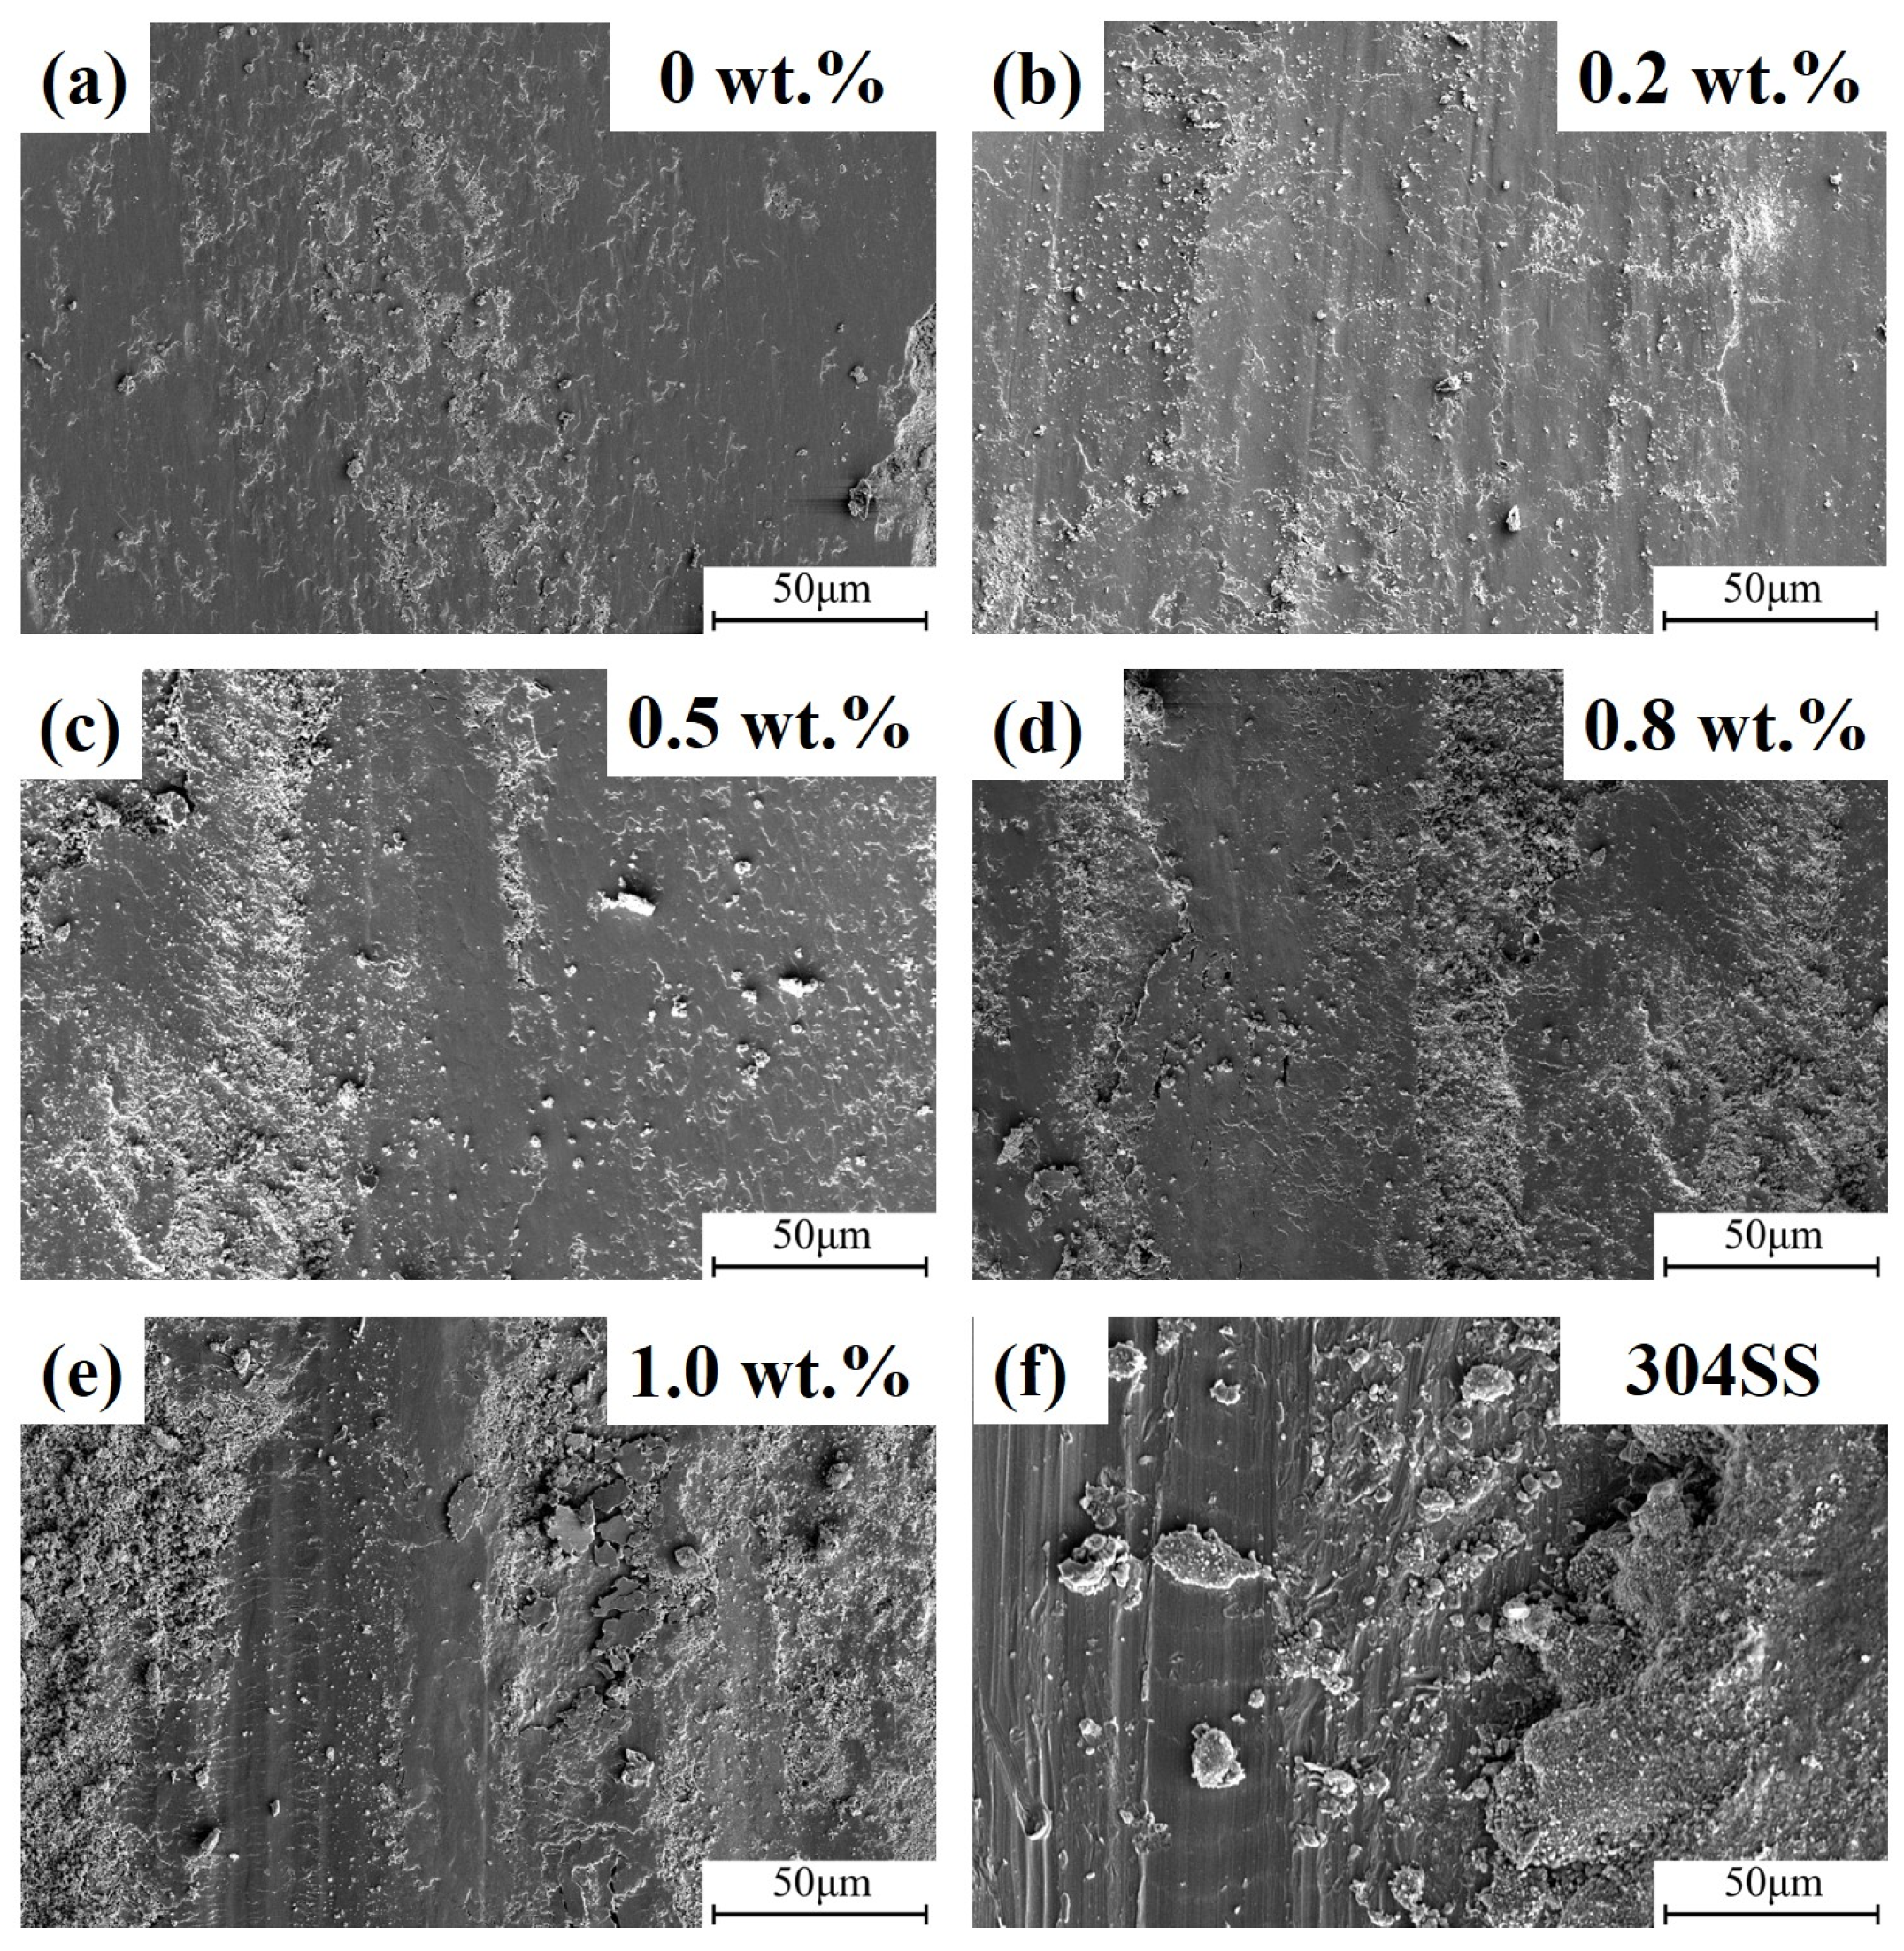
3.2. Micro-Hardness and 400 °C Wear Test

Figure 7 shows the micro-hardness along the depth direction of the cross-section of the coatings. Every point in Figure 7 is an average value achieved from five indentations. It was found that the 0.2 wt.% Y2O3 coating had the highest hardness of ~489 HV. For the other coatings with different Y2O3 additions, the value of micro-hardness was similar to ~445 HV. The addition of Y2O3 causes the microstructure evolution, resulting in the change of hardness [45]. For the 0 wt.% Y2O3 coating, the existence of TiC cause the secondary phase strengthening effectively. After adding 0.2 wt.% Y2O3, the microstructure and distribution of TiC was refined, as shown in Figure 5 and Figure 6. With more TiC distributing intragranular, the ratio of fully wetted grain boundaries declined, reducing the isolation of the matrix and strengthening the effect of secondary phase strengthening. Moreover, according to the strengthening mechanism revealed by Hu [46], Y2Ti2O7 and Y2TiO5 can efficiently purify impurity oxygen at the grain boundaries and coordinate the secondary phases. Thus, the hardness of the 0.2 wt.% Y2O3 coating increases. When more than 0.5 wt.% Y2O3 was added, the segregation of TiC caused the descending of micro-hardness.
Figure 8 exhibits the weight loss and coefficients of friction of the samples. According to the weight loss shown in Figure 8a, it was found that the values of the weight loss of coatings were much lower than that of 304SS, indicating a higher wear resistance of coatings than 304SS. Figure 8b shows the friction coefficient of the samples. Friction coefficient is a key factor indicating the wear resistance of materials. For the coatings, it was found that weight loss had the same tendency as the friction coefficient, namely higher friction coefficient induces greater weight loss. Compared to the coating without Y2O3, the addition of Y2O3 caused the decrease of wear resistance. Meanwhile, with the increase of Y2O3 content in the coating, the wear resistance was gradually reduced.
Figure 9 shows the SEM images of the worn surface morphologies. In Figure 9a, the worn surface of the 0 wt.% Y2O3 coating is smooth, and the small powder-like wear debris is dispersed. Additionally, there were numerous shallow grooves. This indicates that the coating without Y2O3 mainly followed a typical abrasive wear pattern. Figure 9b shows an abrasive worn surface with more wear debris, indicating an abrasive wear pattern of the 0.2 wt.% Y2O3 coating. When content of Y2O3 increase to 0.5 wt.%, more cracks and debris appeared due to the micro-segregation in the coating (Figure 9c). In the coating with 0.8 wt.% Y2O3, apart from more wear debris and cracks, bulk-like spalls were found (Figure 9d). Since the segregation of TiC became more serious, the coating with 1 wt.% Y2O3 presented numerous bulk-like spalls with bigger sizes, as shown in Figure 9e. The 304SS showed deeper scratches and had a large amount of materials peeling. Thus, the stress concentration at the wear interface was exacerbated, decreasing the stability of the coating performance. TiC could improve the bonding strength of the coating and prevent peeling. However, for the 0.2 wt.% Y2O3 coating, during the reciprocating sliding process against the grinding disk, more materials of the disk were extruded and rolled into powder-like abrasive particles due to the higher hardness [47]. When the content of Y2O3 increased to more than 0.5 wt.%, the segregation of TiC promoted the crack sensitivity and induced the toughness of coating. Thus, the wear resistance of the coating decreased. Compared with coating samples, a lower value of hardness of 304SS led to more materials being peeled off, indicating its poor wear resistance.

3.3. Corrosion Behavior in Static LBE at 500 °C

To investigate the corrosion resistance of the FeCrAlTiC-xY2O3 coating, 304SS and the coating specimens were immersed in the same LBE conditions. Figure 10 illustrates the cross-section of the specimens after corrosion for 500 and 1000 h. The oxide scale on the coatings were estimated to be ~0.2 μm in the first 500 h. After 1000 h of corrosion, the thickness of the oxide scale increased to a merely average ~0.3 μm. This illustrates that the oxide scale on the coating surface could keep stabilization and effectively protect substrate from the LBE corrosion. When comparing the coatings with different Y2O3 additions, no obvious differences of the oxide thickness were observed. This indicates that the Y2O3 addition showed less influence on the corrosion resistance in static LBE. For the 304SS surface in Figure 10l, an oxide scale grew to ~10.4 μm after 1000 h of exposure in the static LBE, which could be determined as (Fe,Cr)3O4 [2,3,48]. After 1000 h of corrosion, the oxide scale of 304SS grew to an average ~10.4 μm. Compared with 304SS, the coating with different Y2O3 exhibited better resistance to the LBE corrosion.
To clarify the composition of the oxide scale on the coating surface, XPS was adopted on the 0.2 wt.% Y2O3 coating surface, as shown in Figure 11. In Figure 11a, the investigation of XPS spectra revealed typical C 1s, O 1s, Al 2p, Fe 2p, and Ti 2p peaks from 0.2 wt.% Y2O3 coating surface. Additionally, Bi 4f, Pb 4d, Pb 4p, and Pb 4f peaks from residual LBE were found. The C 1s spectra, as shown in Figure 11b, had peaks at 285.6, 287.0, and 289.2 eV, signifying C-C/C-H, C-O/Al-O, and O-C=O, respectively. The presence of C-C/C-H, O-C=O bonds might result from using a mixed solution for removing residual LBE. The O 1s peak in Figure 11c can be resolved into three peaks with binding energies of 530.1 eV (Ti-O/Fe-O), 531.8 eV (C=O), and 533.0 eV (C-O). The Al 2p spectra In Figure 11d had peaks at 74.4 eV, demonstrating Al-O from Al2O3. In Figure 5c, each Fe 2p region spectrum consisted of a 2p3/2–Fe 2p1/2 doublet with a difference of 13.2 eV. The peaks at 711.1 and 724.3 eV correspond to the Fe 2p3/2–Fe 2p1/2 doublet from the Fe2O3. The second set of spin-split peaks of the Fe 2p3/2 and Fe 2p1/2 components at 709.8 and 723.0 eV presented the formation of FeO. In Figure 11f, the Ti 2p doublet is shown at 458.5 and 464.3 eV with an energy difference of 5.8 eV corresponding to the Ti 2p3/2–Ti 2p1/2, demonstrating the presence of TiO2. XPS results indicate that the composition of the oxide scale on the coating surface were mainly Al2O3, Fe3O4, and TiO2.
Figure 12 shows the EPMA results of the cross-section of the 0.2 wt.% Y2O3 coating. The SEM images of the tested area are shown in Figure 12a. There is no Pb or Bi penetrating the coating, demonstrating that the coating can strongly prevent LBE penetration by the oxide scale formed on the surface, as shown in Figure 12b,c. Several Cr enrichments were observed below the oxide scale in Figure 12g. Oxides of Al and Fe were further confirmed to be the main composition of the oxide scale by EPMA (Figure 12d,f,h). EPMA results show Ti enrichments near the interface of the oxide/coating, as seen in Figure 12e. Combined with the XPS results, these zones could be TiO2, which was obtained by the oxidation of TiC exposed to LBE. This TiO2 could inhibit oxidation, as shown in Figure 12.

3.4. Corrosion Resistance Mechanism of Coating in Static LBE at 500 °C

According to the analysis results mentioned above, the corrosion mechanism of the coating in static LBE at 500 °C could be concluded as shown in Figure 13.
The corrosion mechanism of the Fe2AlCr phase could be defined as that of ternary Fe-Cr-Al alloys, which have been known for a long time. Fe-Cr-Al alloys have the tendency to form complex oxide scales after being exposed to LBE corrosion, and the stability of the Al-oxide plays a key role in the protection mechanism [23,49]. To clarify the LBE corrosion resistance mechanism of the coatings, the Gibbs formation energy of probable oxides at 500 °C were calculated and are listed in Table 2. The Gibbs formation energy of various oxides can be expressed as follows:
Δ f G m Θ = Δ f H m Θ T Δ f S m Θ   ( numb . )
where Δ f G m Θ is the standard Gibbs energy of formation, Δ f H m Θ is the standard enthalpy of formation, T is the reaction temperature (K), and Δ f S m Θ is the standard entropy of formation.
The values in Table 2 indicate that Δ   r G A l 2 O 3 Θ < Δ   r G T iO 2 Θ < Δ   r G C r 2 O 3 Θ < Δ   r G F e 3 O 4 Θ < Δ   r G F e 2 O 3 Θ at 500 °C. Therefore, in this research, it was determined that Al2O3 was priorly formed on the exposed coating, and, following that, Fe-Cr spinel oxides grew (Figure 13a,b). The consequence showed that the oxidation of Cr is thermodynamically preferred compared to that of Fe. Previous research confirmed that the diffusion coefficient of Fe is much higher than that of the Cr in Fe-Cr spinel oxides [50,51]. Thus, a Fe3O4 layer would form and cover the surface of Fe-Cr spinel oxides (Figure 13c). As the corrosion period prolonged, a large amount of Fe would diffuse along the grain boundaries and transfer into Fe3O4. This leads to Cr presenting several Cr enrichments around grain boundaries below the oxide scales (Figure 13d). Therefore, oxide scales on the coating surface mainly contain Al2O3 and Fe3O4.
When corrosion continues, TiC particles distributed in coatings are exposed to LBE, which leads to a different pattern of the corrosion mechanism (Figure 13a). Shi et al. explained the probable oxidation reaction of TiC in the oxygen-saturated LBE as follows [52]:
TiC + 2PbO → TiO2 + 2Pb + C
The Gibbs reaction energy for the standard state for Equation (3) was evaluated at −343.5 kJ/mol, indicating that the oxidation of TiC into the TiO2 was spontaneous under the 500 °C static LBE. Combined with the XPS results, the exposed TiC particles was totally oxidized into TiO2 (Figure 13b). C produced in oxidation floated away and dissolved in the liquid LBE. Then, the growth of Fe-Cr spinel oxides on the exposed surface was inhibited because of the formation of Al2O3/TiO2 oxide (Figure 13c). As corrosion continued, the Fe-Cr spinel oxides around Al2O3/TiO2 were entirely oxidized into Fe3O4, while the remaining Cr presented as Cr enrichment zones as mentioned above. Then, Al2O3/TiO2/Fe3O4 mixture oxides were formed on the coating surface (Figure 12d).

4. Conclusions

FeCrAlTiC-xY2O3 laser clad coatings (x = 0 wt.%, 0.2 wt.%, 0.5 wt.%, 0.8 wt.%, and 1.0 wt.%) were fabricated. The micro-hardness, wear resistance, and corrosion resistance in static LBE at 500 °C of the coatings and 304SS were tested and comprehensively compared. The following conclusions were obtained:
(1) The main phases of FeCrAlTiC-xY2O3 coatings mainly were Fe2AlCr and TiC phases. After adding Y2O3, the Y2Ti2O7 and Y2TiO5 were formed and could change the TiC into a sphere shape. When the content of Y2O3 exceeded 0.5 wt.%, serious segregation of TiC occurred.
(2) The coatings with 0.2 wt.% Y2O3 addition showed the highest micro-hardness, due to its homogeneous distribution of secondary phases. Compared with the coatings without Y2O3, the hardness of the 0.2 wt.% Y2O3 coating increased by 9.8%.
(3) The 0 wt.% Y2O3 coating showed the highest wear resistance. With the addition of 0.2 wt.% Y2O3, the influence of abrasive wear was increased, resulting in the decrease of wear resistance. When the content of Y2O3 was more than 0.5 wt.%, the wear resistance of the coating was induced due to the decrease in toughness caused by the segregation of TiC.
(4) The improved LBE corrosion resistance of the coatings could be attributed to the generation of a dense oxide scale on material surface. The oxide scale formed on the coating surface comprised Al2O3, TiO2, and Fe3O4. The addition of Y2O3 had no obvious influence on the corrosion resistance of coatings in static LBE.

Author Contributions

Conceptualization, X.Z.; methodology, D.W., Q.Z. and T.L.; formal analysis, H.J.; investigation, H.J.; data curation, H.J.; writing—original draft preparation, H.J.; supervision, Y.L.; funding acquisition, X.Z. and Y.L. All authors have read and agreed to the published version of the manuscript.

Funding

This work was supported by the Natural Science Foundation of Jiangsu Province (Grant No. BK20200915), and National Natural Science Foundation of China (Grant No. 52105349 and 51875264).

Institutional Review Board Statement

Not applicable.

Informed Consent Statement

Not applicable.

Data Availability Statement

Not applicable.

Conflicts of Interest

The authors declare no conflict of interest.

References

  1. Gong, X.; Short, M.P.; Auger, T.; Charalampopoulou, E.; Lambrinou, K. Environmental degradation of structural materials in liquid lead-and lead-bismuth eutectic-cooled reactors. Prog. Mater. Sci. 2022, 126, 100920. [Google Scholar] [CrossRef]
  2. Tian, S.J. Growth and Exfoliation Behavior of the Oxide scale on 316L and T91 in flowing liquid lead–bismuth eutectic at 480 °C. Oxid. Met. 2020, 93, 183–194. [Google Scholar] [CrossRef]
  3. Zhang, J. A review of steel corrosion by liquid lead and lead-bismuth. Corros. Sci. 2009, 51, 1207–1227. [Google Scholar] [CrossRef]
  4. Martinellia, L.; Ginestara, K.; Botton, V.; Delisle, C.; Balbaud-Célériera, F. Corrosion of T91 and pure iron in flowing and static Pb-Bi alloy between 450 °C and 540 °C: Experiments, modelling and mechanism. Corros. Sci. 2020, 176, 108897. [Google Scholar] [CrossRef]
  5. Gong, X.; Chen, H.; Wang, Z.; Peng, X.; Chen, Z.; Li, Y.; Du, J.; Yu, X.; Yin, Y. Effect of pre-exposure and simulated corrosion “pits” on liquid metal embrittlement of T91 steel exposed to liquid lead-bismuth eutectic at 350 °C. J. Nucl. Mater. 2022, 563, 153641. [Google Scholar] [CrossRef]
  6. Yao, C.; Zhang, H.; Chang, H.; Sheng, Y.; Shen, T.; Zhu, Y.; Pang, L.; Cui, M.; Wei, K.; Xu, Y.; et al. Structure of surface oxides on martensitic steel under simultaneous ion irradiation and molten LBE corrosion. Corros. Sci. 2022, 195, 109953. [Google Scholar] [CrossRef]
  7. Gong, X.; Yang, Z.; Deng, Y.; Xiao, J.; Wang, H.; Yu, Z.; Yin, Y. Creep failure of a solution-annealed 15-15Ti steel exposed to stagnant lead-bismuth eutectic at 550 and 600 °C. Mater. Sci. Eng. A 2020, 798, 140230. [Google Scholar] [CrossRef]
  8. Serre, I.P.; Vogt, J.B. Liquid metal embrittlement sensitivity of the T91 steel in lead, in bismuth and in lead-bismuth eutectic. J. Nucl. Mater. 2020, 531, 152021. [Google Scholar] [CrossRef]
  9. Heinzel, A.; Müller, G.; Weisenburger, A. Corrosion behaviour of welds and Ta in liquid lead. J. Nucl. Mater. 2016, 469, 62–71. [Google Scholar] [CrossRef]
  10. Cairang, W.; Ma, S.; Gong, X.; Zeng, Y.; Yang, H.; Xue, D.; Qin, Y.; Ding, X.; Sun, H. Oxidation mechanism of refractory Molybdenum exposed to oxygen-saturated lead-bismuth eutectic at 600 °C. Corros. Sci. 2021, 179, 109132. [Google Scholar] [CrossRef]
  11. Rivai, A.K.; Takahashi, M. Corrosion investigations of Al-Fe-coated steels, high Cr steels, refractory metals and ceramics in lead alloys at 700 °C. J. Nucl. Mater. 2010, 398, 146–152. [Google Scholar] [CrossRef]
  12. Li, H.; Bai, P.; Lin, Z.; Zhang, J.; Tang, Q.; Pan, Y. Corrosion resistance in Pb-Bi alloy of 15-15Ti steel coated with Al2O3/SiC bilayer thin films by magnetron sputtering. Fusion Eng. Des. 2017, 125, 384–390. [Google Scholar] [CrossRef]
  13. Wu, Z.Y.; Zhao, X.; Liu, Y.; Cai, Y.; Li, J.Y.; Chen, H.; Wan, Q.; Yang, D.; Tan, J.; Liu, H.D.; et al. Lead-bismuth eutectic (LBE) corrosion behavior of AlTiN coatings at 550 and 600 °C. J. Nucl. Mater. 2020, 539, 152280. [Google Scholar] [CrossRef]
  14. Rivai, A.K.; Takahashi, M. Compatibility of surface-coated steels, refractory metals and ceramics to high temperature lead-bismuth eutectic. Prog. Nucl. Energy 2008, 50, 560–566. [Google Scholar] [CrossRef]
  15. Ferré, F.G.; Mairov, A.; Iadicicco, D.; Vanazzi, M.; Bassini, S.; Utili, M.; Tarantino, M.; Bragaglia, M.; Lamastra, F.R.; Nanni, F.; et al. Corrosion and radiation resistant nanoceramic coatings for lead fast reactors. Corros. Sci. 2017, 124, 80–92. [Google Scholar] [CrossRef]
  16. Han, J.C. Thermal shock resistance of ceramic coatings. Acta Mater. 2007, 55, 3573–3581. [Google Scholar] [CrossRef]
  17. Yan, Y.; Liu, T.; Lin, J.; Qiao, L.; Tu, J.; Qin, S.; Cao, J.; Qi, J. Interaction between the third alloying element and the interfacial structure of AgCu-alloy brazed heterogeneous metal integration. J. Alloys Compd. 2021, 883, 160933. [Google Scholar] [CrossRef]
  18. Yan, Y.; Lin, J.; Liu, T.; Liu, B.; Wang, B.; Qiao, L.; Tu, J.; Cao, J.; Qi, J. Corrosion behavior of stainless steel-tungsten carbide joints brazed with AgCuX (X = In, Ti) alloys. Corros. Sci. 2022, 200, 110231. [Google Scholar] [CrossRef]
  19. Wang, P.; Xu, Z.; Liu, X.; Wang, H.; Qin, B.; Lin, J.; Cao, J.; Qi, J.; Feng, J. Regulating the interfacial reaction of SC2W3O12/AgCuTi composite filler by introducing a carbon barrier layer. Carbon 2022, 191, 290–300. [Google Scholar] [CrossRef]
  20. Fetzer, R.; Weisenburger, A.; Jianu, A.; Müller, G. Oxide scale formation of modified FeCrAl coatings exposed to liquid lead. Corros. Sci. 2012, 55, 213–218. [Google Scholar] [CrossRef]
  21. Lim, J.; Nam, H.O.; Hwang, I.S.; Kim, J.H. A study of early corrosion behaviours of FeCrAl alloys in liquid lead-bismuth eutectic environments. J. Nucl. Mater. 2010, 407, 205–210. [Google Scholar] [CrossRef]
  22. Weisenburger, A.; Heinzel, A.; Müller, G.; Muscher, H.; Rousanov, A. T91 cladding tubes with and without modified FeCrAlY coatings exposed in LBE at different flow, stress and temperature conditions. J. Nucl. Mater. 2008, 376, 274–281. [Google Scholar] [CrossRef]
  23. Giacco, M.D.; Weisenburger, A.; Jianu, A.; Lang, F.; Mueller, G. Influence of composition and microstructure on the corrosion behavior of different Fe-Cr-Al alloys in molten LBE. J. Nucl. Mater. 2012, 421, 39–46. [Google Scholar] [CrossRef]
  24. Hong, S.; Li, J.; Zhao, P.; Yu, Y.; Li, W. Evolution in wear and high-temperature oxidation resistance of laser-clad AlxMoNbTa refractory high-entropy alloys coatings with Al addition content. Coatings 2022, 12, 121. [Google Scholar] [CrossRef]
  25. Popovic, M.P.; Bolind, A.M.; Aussat, Y.; Gubser, A.J.; Hosemann, P. Oxidative passivation of Fe-Cr-Al steels in lead-bismuth eutectic under oxygen-controlled static conditions at 700 °C and 800 °C. J. Nucl. Mater. 2019, 523, 172–181. [Google Scholar] [CrossRef]
  26. Liu, Y.; Xu, T.; Li, G. Research on wear and corrosion resistance of Ni60-WC coating fabricated by laser on preheated copper alloy. Coatings 2022, 12, 1537. [Google Scholar] [CrossRef]
  27. Li, A.; Xu, L.; Lin, N.; He, Y. Effect of WC and Mo2C additions on microstructure and corrosion resistance of Ti(C,N)-based cermet. J. Netshape Form. Eng. 2021, 13, 13–20. [Google Scholar] [CrossRef]
  28. Yue, K.; Lian, G.; Chen, C.; Feng, M. Effect of powder particle size of laser cladding on the forming control of cladding layer. J. Netshape Form. Eng. 2022, 14, 58–67. [Google Scholar] [CrossRef]
  29. Zhang, Z.; Wang, X.; Zhang, Q.; Liang, Y.; Ren, L.; Li, X. Fabrication of Fe-based composite coatings reinforced by TiC particles and its microstructure and wear resistance of 40Cr gear steel by low energy pulsed laser cladding. Opt. Laser Technol. 2019, 119, 105622. [Google Scholar] [CrossRef]
  30. Mi, H.; Chen, T.; Deng, Z.; Li, S.; Liu, J.; Liu, D. Microstructure and mechanical properties of TiC/TiB composite ceramic coatings in-situ synthesized by ultrasonic vibration-assisted laser cladding. Coatings 2022, 12, 99. [Google Scholar] [CrossRef]
  31. Yue, H.; Lv, N.; Guo, C.; Zhao, L.; Li, Q.; Zhang, J.; Zhang, Y. Microstructure and mechanical properties of TiC/FeCrSiB coating by laser additive remanufacturing on shearer spiral blade. Surf. Coat. Technol. 2022, 431, 128043. [Google Scholar] [CrossRef]
  32. Zhu, H.; Geng, S.; Chen, G.; Wang, F. Ni-Mn3O4-CeO2 composite coating on ferritic stainless steel interconnects. Corros. Sci. 2022, 194, 109932. [Google Scholar] [CrossRef]
  33. Du, M.; Wang, L.; Gao, Z.; Yang, X.; Liu, T.; Zhan, X. Microstructure and element distribution characteristics of Y2O3 modulated WC reinforced coating on Invar alloys by laser cladding. Opt. Laser Technol. 2022, 153, 108205. [Google Scholar] [CrossRef]
  34. Ma, H.; Miao, Q.; Liang, W.; Liu, Y.; Liu, H.; Ma, H.; Zuo, S.; Xue, L. High temperature oxidation resistance of Y2O3 modified ZrB2-SiC coating for carbon/carbon composites. Ceram. Int. 2021, 47, 6728–6735. [Google Scholar] [CrossRef]
  35. London, A.J.; Santra, S.; Amirthapandian, S.; Panigrahi, B.K.; Sarguna, R.M.; Balaji, S.; Vijay, R.; Sundar, C.S.; Lozano-Perez, S.; Grovenor, C.R.M. Effect of Ti and Cr on dispersion, structure and composition of oxide nano-particles in model ODS alloys. Acta Mater. 2015, 97, 223–233. [Google Scholar] [CrossRef]
  36. Ribis, J.; Mouton, I.; Baumier, C.; Gentils, A.; Loyer-Prost, M.; Lunéville, L.; Siméone, D. Nano-structured materials under irradiation: Oxide dispersion-strengthened steels. Nanomaterials 2021, 11, 2590. [Google Scholar] [CrossRef]
  37. Karak, S.K.; Majumdar, J.D.; Witczak, Z.; Lojkowski, W.; Manna, I. Microstructure and mechanical properties of nano-Y2O3 dispersed ferritic alloys synthesized by mechanical alloying and consolidated by hydrostatic extrusion. Mater. Sci. Eng. A 2013, 580, 231–241. [Google Scholar] [CrossRef]
  38. Veyan, J.; Obaldia, E.; Alcantar-Peña, J.; Montes-Gutierrez, J.; Arellano-Jimenez, M.; Yacaman, M.; Auciello, O. Argon atoms insertion in diamond: New insights in the identification of carbon C 1s peak in X-ray photoelectron spectroscopy analysis. Carbon 2018, 134, 29–36. [Google Scholar] [CrossRef]
  39. Zhao, J.; Gao, F.; Pujari, S.; Zuilhof, H.; Teplyakov, A. universal calibration of computationally predicted N 1s binding energies for interpretation of XPS experimental measurements. Langmuir 2017, 33, 10792–10799. [Google Scholar] [CrossRef]
  40. Bagus, P.; Sousa, C.; Illas, F. XPS binding energy shifts as a function of bond distances: A case study of CO. J. Phys.: Condens. Matter 2022, 34, 154004. [Google Scholar] [CrossRef]
  41. Greczynski, G.; Hultman, L. X-ray photoelectron spectroscopy: Towards reliable binding energy referencing. Prog. Mater. Sci. 2020, 107, 100591. [Google Scholar] [CrossRef]
  42. Biesinger, M. Accessing the robustness of adventitious carbon for charge referencing (correction) purposes in XPS analysis: Insights from a multi-user facility data review. Appl. Surf. Sci. 2022, 597, 153681. [Google Scholar] [CrossRef]
  43. Straumal, B.B.; Korneva, A.; Kuzmin, A.; Lopez, G.A.; Rabkin, E.; Straumal, A.B.; Gerstein, G.; Gornakova, A.S. The grain boundary wetting phenomena in the Ti-containing high-entropy alloys: A review. Metals 2021, 11, 1881. [Google Scholar] [CrossRef]
  44. Jiang, Y.; Smith, J.R.; Odette, G.R. Prediction of structural, electronic and elastic properties of Y2Ti2O7 and Y2TiO5. Acta Mater. 2010, 58, 1536–1543. [Google Scholar] [CrossRef]
  45. Gornakova, A.S.; Straumal, A.B.; Khodos, I.I.; Gnesin, I.B.; Mazilkin, A.A.; Afonikova, N.S.; Straumal, B.B. Effect of composition, annealing temperature, and high pressure torsion on structure and hardness of Ti–V and Ti–V–Al alloys. J. Appl. Phys. 2019, 125, 082522. [Google Scholar] [CrossRef]
  46. Hu, B.; Han, J.; Ge, S.; Hua, X.; Li, S.; Xing, H.; Wang, K.; Hu, P.; Fu, J.; Zhang, W.; et al. Secondary phases strengthening-toughening effects in the Mo-TiC-La2O3 alloys. Mater. Sci. Eng. A 2022, 831, 142271. [Google Scholar] [CrossRef]
  47. Zhuang, H.; Zhang, Q.; Zhang, D. Microstructure and tribological properties of Ni-based laser-clad coatings by rare earth modification. J. Therm. Spray Technol. 2021, 30, 1410–1431. [Google Scholar] [CrossRef]
  48. Chen, G.; Ju, N.; Lei, Y.; Wang, D.; Zhu, Q.; Li, T. Corrosion behavior of 410 stainless steel in flowing lead-bismuth eutectic alloy at 550°C. J. Nucl. Mater. 2019, 522, 168–183. [Google Scholar] [CrossRef]
  49. Wagner, C. Passivity and inhibition during the oxidation of metals at elevated temperature. Corros. Sci. 1965, 5, 751–764. [Google Scholar] [CrossRef]
  50. Hodge, J.D. Diffusion of chromium in magnetite as a function of oxygen partial pressure. J. Electrochem. Soc. 1978, 125, 55C–57C. [Google Scholar] [CrossRef]
  51. Cox, M.G.C.; McEnaney, B.; Scott, V.D. Phase interactions in the growth of thin oxide films on iron-chromium alloys. Philos. Mag. 1974, 29, 585–600. [Google Scholar] [CrossRef]
  52. Shi, Q.Q.; Yan, W.; Sha, W.; Wang, W.; Shan, Y.Y.; Yang, K. Corrosion resistance of self-growing TiC coating on SIMP steel in LBE at 600 °C. Mater. Corros. 2016, 67, 1204–1212. [Google Scholar] [CrossRef] [Green Version]
Figure 1. Diagram and appearance of laser cladding. (a) The laser cladding equipment and the prepared coating; (b) Afs-R6000 laser material processing system.
Coatings 12 01759 g001
Figure 2. The schematic of the wear test. Where R is the wear track radius, F is the normal force on the pin, and ω is the rotation velocity of the disk.
Coatings 12 01759 g002
Figure 3. The valence-band spectra pattern of the 0.2 wt.% Y2O3 coating.
Coatings 12 01759 g003
Figure 4. The XRD pattern of FeCrAlTiC-xY2O3 coatings.
Coatings 12 01759 g004
Figure 5. SEM microstructures and EDS analysis results of the coatings with different Y2O3 additions: (a) 0 wt.% and EDS of point A1, A2, (b) 0.2 wt.% and EDS of point B1, B2, (c) 0.5 wt.% and EDS of point C1, C2, (d) 0.8 wt.% and EDS of point D1, D2, (e) 1.0 wt.% and EDS of point E1, E2.
Coatings 12 01759 g005
Figure 6. TEM results of coatings (a) microstructure of 0 wt.% Y2O3 coating, SAD of (b) point 1, (c) point 2; 0.2 wt.% Y2O3, (d) microstructure of 0.2 wt.% Y2O3 coating, (e) TEM image of precipitated TiC, (f) EDS of point 3, (g) SAD of point 3; HRTEM and FFT patterns of (h) Y2TiO5 (i) Y2Ti2O7.
Coatings 12 01759 g006
Figure 7. The effects of different Y2O3 additions on the micro-hardness of coatings.
Coatings 12 01759 g007
Figure 8. The results of 400 °C wear tests of the coatings and substrate: (a) weight loss; (b) average coefficient of friction.
Coatings 12 01759 g008
Figure 9. SEM images after wear test: (a) 0 wt.% Y2O3; (b) 0.2wt.% Y2O3; (c) 0.5 wt.% Y2O3; (d) 0.8 wt.% Y2O3; (e) 1.0 wt.% Y2O3; (f) 304SS.
Coatings 12 01759 g009
Figure 10. The SEM and EDS analysis results of the specimen cross-sections after LBE corrosion: (a) 0 wt.% Y2O3 coating after 500 h corrosion; (b) 0 wt.% Y2O3 coating after 1000 h corrosion; (c) 0.2 wt.% Y2O3 coating after 500 h corrosion; (d) 0.2 wt.% Y2O3 coating after 1000 h corrosion; (e) 0.5 wt.% Y2O3 coating after 500 h corrosion; (f) 0.5 wt.% Y2O3 coating after 1000 h corrosion; (g) 0.8 wt.% Y2O3 coating after 500 h corrosion; (h) 0.8 wt.% Y2O3 coating after 1000 h corrosion; (i) 1.0 wt.% Y2O3 coating after 500 h corrosion; (j) 1.0 wt.% Y2O3 coating after 1000 h corrosion; (k) 304SS after 500 h corrosion; (l) 304SS after 1000 h corrosion.
Coatings 12 01759 g010
Figure 11. XPS results of the 0.2 wt.% Y2O3 coating surface after 1000 h LBE corrosion: (a) XPS survey spectrum; XPS spectra of (b) C1s; (c) O 1s; (d) Al 2p; (e) Fe 2p; (f) Ti 2p.
Coatings 12 01759 g011
Figure 12. EPMA results of the 0.2 wt.% Y2O3 coating cross-section after 1000 h LBE corrosion: (a) Image of tested area; (b) Bi; (c) Pb; (d) O; (e) Ti; (f) Al; (g) Cr; (h) Fe.
Coatings 12 01759 g012
Figure 13. Corrosion mechanism of the coating in the static LBE at 500 °C. (a) the origin of corrosion; (b) the first oxidation; (c) the oxidation of Fe-Cr spinel oxides and TiC; (d) the Cr enrichment.
Coatings 12 01759 g013
Table 1. Chemical composition of the mixed powders (wt.%).
No.CrAlTiCY2O3Fe
12420202.80Bal.
22420202.80.2Bal.
32420202.80.5Bal.
42420202.80.8Bal.
52420202.81.0Bal.
Table 2. Values of Δ f G m Θ , Δ f H m Θ , and Δ f S m Θ in the Gibbs formation energy expressions (T = 773.15 K).
Compound Δ f H m Θ (kJ/mol) Δ f S m Θ (J/mol·K) Δ f G m Θ (kJ/mol)
Al2O3−1115.8−207.6−995.3
TiO2−941.0−178.6−802.9
Cr2O3−750.4−169.8−619.1
Fe3O4−547.1−153.1−428.7
Fe2O3−541.1−168.7−410.6
Publisher’s Note: MDPI stays neutral with regard to jurisdictional claims in published maps and institutional affiliations.

