Article

Effect of Heat Sealing and Storage on Mechanical and Barrier Properties of Maillard Modified Fish Skin Gelatin/L-arabinose Composite Films

1
College of Food Science and Technology, Henan University of Technology, Zhengzhou 450001, China
2
College of Food Science and Nutritional Engineering, China Agricultural University, Beijing 100083, China
*
Author to whom correspondence should be addressed.
Coatings 2022, 12(12), 1929; https://doi.org/10.3390/coatings12121929
Submission received: 13 October 2022 / Revised: 2 November 2022 / Accepted: 4 November 2022 / Published: 8 December 2022

Abstract

:
The increasing accumulation of non-degradable plastic food packaging is a global concern. In this study, we aimed to optimize the heat-sealing process of fish skin gelatin/L-arabinose (FG-Ara) composite films modified by the Maillard reaction. The effects of storage temperature, humidity, and time on the mechanical and barrier properties of the modified FG-Ara composite films were investigated. The optimal heat-sealing parameters were 24 V, with vacuum, heat-sealing, and cooling times of 7.0, 3.0, and 3.0 s, respectively. After 120 days of storage at low temperatures (4, −17 °C), the tensile strength of the composite films decreased to 11.15 ± 1.64 and 13.14 ± 1.68 MPa, respectively, and the elongation at break increased by 39.07% and 18.29% compared with the initial value, respectively. Moreover, the water vapor permeability in the low-temperature treatment groups remained relatively stable at the initial stages of storage (0–40 days) and reached 39.57 ± 3.09 and 26.95 ± 18.50 g·mm/m2·d·kPa after 120 days, respectively. The milk powder packed in the FG-Ara composite films had good quality and no hardening in low-temperature environments. After 120 days of storage, the peroxide value of the soybean oil packed in the films still met the quality standard of first-grade soybean oil. Furthermore, the Arrhenius equation was used to fit the peroxide values of soybean oil at different temperatures. The maximum shelf life of soybean oil coated by the composite film was predicted to be 250 days. The experimental results demonstrated that the optimized films might serve as effective food packaging materials.

Graphical Abstract

1. Introduction

In recent years, plastic films have been widely used in food packaging owing to their excellent packaging properties; however, only 9% are recycled at the end of their life cycle. The continuous accumulation of these polymers in the environment has become a major global concern [1]. Therefore, the production of edible, degradable, and environmentally friendly replacements for traditional petroleum-based plastic packaging materials has gradually become a research focal point [2].
Polysaccharides, proteins, and lipids are often the main components utilized in edible film production [3]. Moreover, proteins possess desirable properties in this regard, such as their abundance, film-forming ability, transparency, appropriate mechanical properties, and excellent oxygen, carbon dioxide, and lipid barrier properties [4]. Gelatin is hydrolyzed from collagen, which is a protein obtained from connective tissues such as animal skin and bones [5,6]. Furthermore, gelatin prepared from fish skin proteins has functional properties, such as its biocompatibility, film-forming ability, and biodegradability, which promotes its application in packaging, medicine, and biomedicine [7,8,9]. Gelatin-based edible films have uniform transparency and excellent barrier performance. However, considering the brittle texture of a single gelatin film and the high concentration of hydrophilic amino acids contained therein, gelatin films are generally modified to broaden their application field. A common modification method is to cross-link and combine biological molecules, such as proteins and polysaccharides, to improve their properties [10,11,12,13]. Accordingly, Zhao et al. [14] demonstrated enhanced the pseudoplasticity of conjugates obtained via glycosylation of fish skin gelatin with gum arabic. An et al. [15] successfully prepared poly-L-lactic acid (PLLA)/fish gelatin composite nanofibers by mixing PLLA with gelatin at a 3:1 ratio. Furthermore, Hui et al. [16] successfully prepared salmon skin gels and zein composite films via the glutaraldehyde cross-linking method with an optimal formulation of 3% zein and 0.02% glutaraldehyde.
L-arabinose, a five-carbon aldose extracted from plant cell walls, is associated with various probiotic functions, including the reduction in blood lipid levels [17], downregulation of adipogenesis [18], and improving the intestinal environment [19]. Although many studies exist on improving the properties of gelatin films via modification processes, there are few reports on the composite preparation of fish skin gelatin films using L-arabinose as a carbonyl donor.
In this study, edible films were prepared by the solution casting method [20]. Fish skin gelatin and L-arabinose were used as film-forming substrates, while glycerol and sorbitol served as plasticizers, resulting in composite films with excellent mechanical properties. Composite films were subsequently modified by the Maillard reaction, after which the heat-sealing test was carried out. Finally, fish skin gelatin/L-arabinose (FG-Ara) composite films with high heat-sealing performance were selected for storage application research in the hope of preparing an edible packaging material to replace the traditional plastic packaging so as to effectively reduce the energy consumption and white pollution related to food packaging [21]. Moreover, FG-Ara composite edible films modified by the Maillard reaction have certain antioxidant capabilities, providing a data reference for the preparation of functional packaging materials.

2. Materials and Methods

2.1. Chemicals and Reagents

Fish skin gelatin (type A; bloom: 250 g) was obtained from Yonghe Co., Ltd. (Zhengzhou, China) and L-arabinose from Shandong Longli Biotechnology Co., Ltd. (Jinan, China). Glycerin, sorbitol, trichloromethane, glacial acetic acid, potassium iodide, and sodium thiosulfate (analytical pure) were purchased from Tianjin Kermio Chemical Reagent Co., Ltd. (Tianjin, China) All other chemicals were analytical reagents.

2.2. Preparation of Maillard Modified FG-Ara Composite Films

A mass ratio of fish skin gelatin and L-arabinose (2:8) was combined with a glycerol: sorbitol (2:1) plasticizer mixture at a concentration of 20%. The FG-Ara film-forming solution was obtained by swelling (room temperature of 25 °C, 2 h) and subsequent heat treatment in a water bath (60 °C, 40 min). Thereafter, the prepared film-forming solution was degassed in a 0.09 MPa vacuum drying oven (DZF-1, Beijing Yongguangming Medical Instrument Co., Ltd., Beijing, China) for 15 min and subsequently poured into a polycarbonate Petri dish (90 mm) while ensuring the absence of obvious bubbles. The solution was allowed to solidify naturally for 2 h before it was transferred to a fume hood for drying, all the while keeping the film container level. After the film was uncovered, it was stored in a dryer at a relative humidity of 54% for 48 h and subsequently heated to 85 °C for 24 h. Finally, following the Maillard reaction modification, the application test was carried out. The specific process is shown in Figure 1:

2.3. Determination of Heat-Sealing Strength

The flat, non-microporous film sample was folded in half and subsequently heat-sealed using a multifunctional vacuum packaging machine (DZ-400/ZL, Tongzhou Jinshan Machinery Factory, Beijing, China). Each sample was made in parallel and in triplicate.
Immediately following film sample equilibration (54% RH, 25 °C, 2 d), the samples were measured using a texture analyzer (TAXT Plus, Stable Micro Systems, Surrey, UK). The heat-sealed film was unfolded and cut into a rectangle (60 × 15 mm2). Thereafter, the two unheated sides were placed on the fixture and stretched at a test speed of 3.0 mm/s until the heat cover was completely broken. The sealing strength was subsequently determined as the maximum load (N/15 mm) at which the sample breaks.

2.3.1. Single-Factor Experiments

The Maillard-modified FG-Ara composite films were heat-sealed at 24 V. On this basis, the effects of vacuum time (1.0, 3.0, 5.0, 7.0, 9.0 s), heat-sealing time (0.5, 1.0, 1.5, 2.0, 2.5 s), cooling time (2.0, 2.5, 3.0, 3.5, 4.0 s) on the heat-sealing performance of the composite film were investigated.

2.3.2. Response Surface Optimization Test

Design-Expert software Version 8.0.6. devised by George E. P. Box and Donald Behnken, was utilized during the response surface analysis. Briefly, the optimal values of the single-factor test results served as the center point, vacuum time (A), heat-sealing time (B) and cooling time (C) were selected as independent variables, and the composite film heat-sealing strength served as the response index. Additionally, three factors and three levels were included in the design. The relevant codes and levels of each factor are presented in Table 1.

2.4. Storage Stability of FG-Ara Composite Film Modified by the Maillard Reaction

The prepared Maillard-modified FG-Ara composite films were stored under five conditions, namely freezing (−17 °C), cold storage (4 °C), and room temperature (25 °C; RH 43%, 54%, and 65%). The mechanical and barrier properties were measured in 20-day increments to evaluate the storage stability of the films in different environments.

2.4.1. Determination of Mechanical Properties

Tensile strength (TS) and elongation at break (EAB) were measured by a physical property meter with the sample size of 60 × 10 mm2, initial clamping distance of 30 mm and speed of 1 mm/s. Six parallel samples were made each time and the average value was taken.

2.4.2. Water Vapor Transmittance (WVP)

WVP was measured using a modified ASTM (American Society for Testing and Materials, 1992) [22] method as described by Gontard [23]. Cut the flat and non-porous membrane sample to be tested into a circle with a diameter of 90 mm with a sample cutter. Put an appropriate amount of anhydrous calcium chloride in the sample cup, fix the sample in the sample cup, and then place it in the test chamber with 90% RH and the test temperature at 25 °C. The mass changes of 24 h anhydrous calcium chloride were detected, and each group was repeated three times. Water vapor permeability of gelatin film was calculated by the following equation [24]:
WVP gm 1 s 1 Pa 1   =   G l A 1 t 1 Δ P 1
where G is weight change, g; t is time, h; A is the test area, m2; l is the thickness of the test sample, mm; ΔP is the partial pressure difference in water vapor between two sides of the film.

2.5. Preparation and Storage of Modulated Milk Powder Packets

The smooth and non-porous film material was cut into a rectangle (120 × 100 mm2) and folded in half along the long edge. Thereafter, heat-sealing was performed using the optimized heat-sealing parameters, and 5 g of freshly opened, modulated milk powder was encased in the package.
The packaged milk powder was stored at freezing (−17 °C), cold (4 °C) and room temperature (25 °C, RH 43%, 54%, and 65%), and the contents of the packaged milk powder were determined in 20-day increments.

2.5.1. Wetting Time

After the addition of 100 mL distilled water (70 °C) into a 250 mL beaker, 1 g of milk powder was evenly spread on the water surface. The time (s) required for the complete settlement of the milk powder was subsequently measured.

2.5.2. Dispersion Time

After the addition of 100 mL distilled water (70 °C) into a 250 mL beaker, 5 g of milk powder was rapidly poured into the water and mixed on a constant temperature magnetic stirrer at 100 rpm/min. The time (s) was recorded from the initiation of stirring to the complete dispersion and dissolution of the milk powder.

2.5.3. Protein Dispersion Index

Milk powder (5 g) was placed in a 50 mL beaker and distilled water (30 mL, 70 °C) was added to dissolve the milk powder. The dissolved milk powder was poured into a 50 mL measuring bottle, cooled, and diluted to 50 mL. After thoroughly agitating the mixture, 15 mL was centrifuged at 5000 rpm/min for 10 min. Thereafter, 1 mL of supernatant was extracted, subjected to digestion and nitrogen measurement, and protein content quantification. The protein dispersion index (PDI) was subsequently calculated (Equation (2)) [25].
PDI %   =   m 1 m 0   ×   100 %
where m1 is the mass of the dispersed proteins in the water (g), and m0 is the total protein mass of the milk powder (g).

2.5.4. Insoluble Index

The dissolved milk powder (15 mL) was used to determine the insolubility index of the milk powder. The lower precipitation was transferred into a scaled glass centrifuge tube (50 mL), supplemented with distilled water (50 mL, 50 °C), and centrifuged (5000 rpm/min, 10 min). After removal of the supernatant, distilled water (50 mL, 50 °C) was added, and the centrifugation process was repeated. The insolubility index was measured (mL) as the sediment obtained at the bottom of the centrifuge tube.

2.6. Preparation and Storage of Oil Packs

The smooth and non-porous film material was cut into a rectangle (120 × 100 mm2) and folded in half along the long edge. The optimized heat-sealing parameters were applied, 5 mL fresh soybean oil was loaded into the film, and FG-Ara composite film oil packages were prepared after sealing. Biaxially oriented polypropylene (BOPP)-polyethene (PE) films were prepared using the same method and served as the control.
FG-Ara composite and BOPP-PE commercial film oil packages were stored under three conditions, namely freezing (−17 °C), cold storage (4 °C), and room temperature (25 °C). The peroxide value (POV) of the soybean oil was measured in increments of 20 days and the variation in quality of the contents was evaluated after 120 days.

2.6.1. Evaluation of the Drop Test

The composite film bags were evaluated using a drop test to verify whether they meet the requirements for convenient food transportation. The vegetable oil-containing packaging bags were dropped three times from a height of 1500 mm and subsequently inspected for cracks and leakages.

2.6.2. Evaluation of Compressive Test

The compression test of the composite films was executed by testing the static pressure resistance of a single oil bag, thereby evaluating whether they met stacking requirements. This was performed by applying a static pressure of 200 N for 60 s and subsequently observing whether the oil bag ruptured or leaked.

2.6.3. Determination of POV

Soybean oil was accurately weighed (2.000 g) in an iodine flask (250 mL) and thoroughly mixed with chloroform-glacial acetic acid (30 mL). Saturated potassium iodide solution (1 mL) was added, and the mixture was kept in the dark for 3 min, after which degassed distilled water (100 mL) was added. The mixture was subsequently titrated with sodium thiosulfate until a bright yellow color was obtained. A starch indicator (1 mL) was added, and the mixture was titrated against 0.01 N of sodium thiosulfate solution until the blue color of the solution completely disappeared [26]. The POV was calculated according to Equation (3) [27].
POV   ( mmol / kg )   =   V     V 0 × c m   ×   1000
where V depicts the volume sodium thiosulfate solution consumed by sample (mL), V0 the volume of sodium thiosulfate consumed by blank sample (mL), c the sodium thiosulfate solution concentration (mol/L), and m is the weight of the oil sample.

2.6.4. Kinetic Analysis of POV

The kinetic analysis of POV commenced according to Equation (4) [28].
d A d t   =   k A n
where k depicts the reaction rate and n the reaction order.
Equation (3) was converted into a function of time (t) as F(A) = kt, where F(A) depicts the quality function of the soybean oil. Moreover, different reaction stages correspond to different functional expressions and are indicated in Table 2 [29].
Oil oxidation in food takes place as a first-order reaction. Here, the POV was used as an index to evaluate the degree of oil oxidation and combined with Table 3 to transform Equation (4) into Equation (5) [28].
L n POV   =   k t   +   L n POV 0
where POV depicts the peroxide value of soybean oil stored for t days, POV0 the initial peroxide value of soybean oil, k the reaction rate, and t the storage days.

2.6.5. Establishment of Arrhenius Model

The Arrhenius equation is derived from thermodynamics and statistical mechanics and dynamically describes the changing shelf life related to the type of food being studied and the environment in which it is stored. The main advantage of the Arrhenius equation (Equation (6)) [28,30] is that data can be collected under high-temperature conditions and subsequently extrapolated to determine the shelf life at lower temperatures [31].
k   =   k 0 exp ( E A R T )
The logarithm of Equation (6) is presented in Equation (7) [28].
L n k   =   L n k 0     E A R T
where k depicts the reaction rate constant, k0 the pre-exponential factor, EA the activation energy (J/mol), R the gas constant (8.3144 J/K/mol), and T the thermodynamic temperature (K).
According to Equation (6), the logarithm (Lnk) and thermodynamic temperature (1/T) of the reaction rate constant at different temperatures are obtained as a linear function, and the slope is E A R . Congruent with the first-order kinetic reaction equation and the Arrhenius model, the shelf life of soybean oil can be predicted according to Equation (8) [32].
S   =   L n   POV L L n   POV 0 e L n k 0 E A R T
where POV0 depicts the initial peroxide value, POVL the peroxide value at the maximum critical state, and S the predicted value of the shelf model (d).

2.7. Statistical Analysis

All experiments were performed in triplicate. Data analyses and standard deviation calculations were conducted using SPSS 20 (IBM, Chicago, IL, USA). A p < 0.05 was considered indicative of statistically significant differences.

3. Results and Discussion

3.1. The Results of Single Factor Test

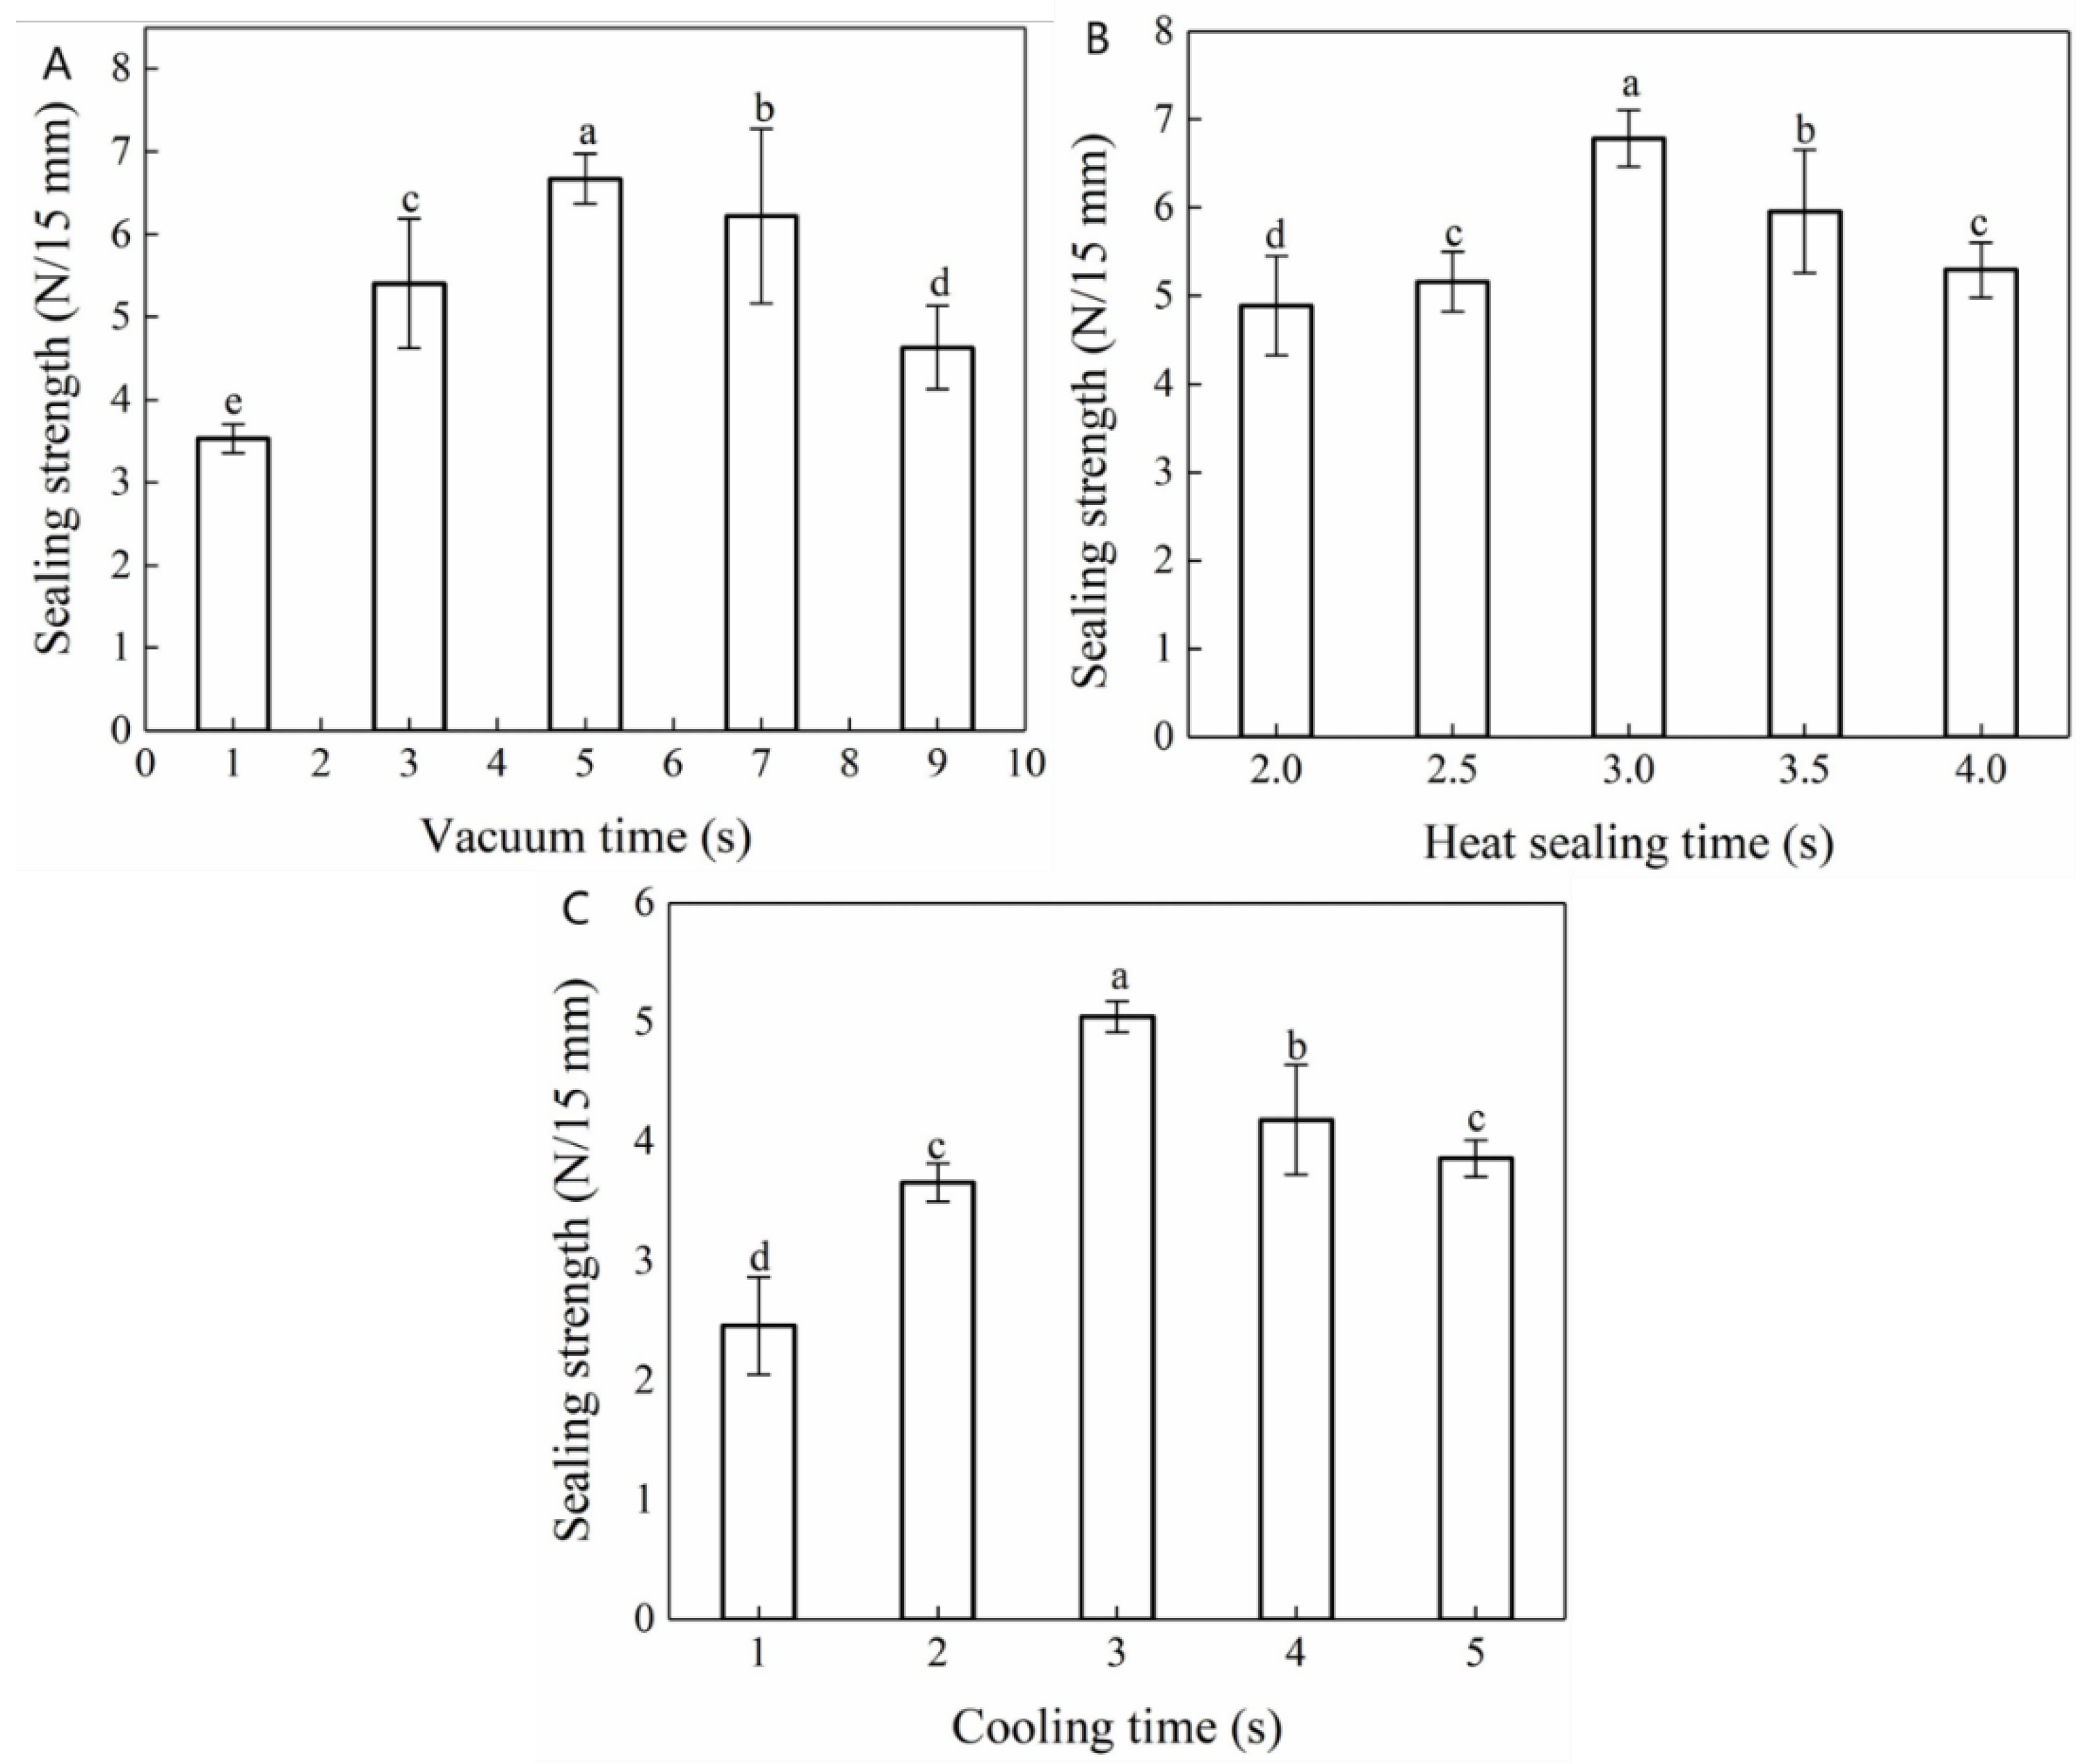
The operational panel of the vacuum packaging machine indicated that the vacuum pressure was regulated by the vacuum time and increased gradually with the extension of the vacuum time. Accordingly, Figure 2A reflects the influence of vacuum time on the heat-sealing strength of the composite films. At shorter vacuum times (<5.0 s), the vacuum pressure was maintained between 0.02 and 0.06 MPa, resulting in poor sealing strength. This may be ascribed to insufficient adhesion between the two films and the existence of gaps as a consequence of the low vacuum pressure. The thermal sealing strength of the composite films increased substantially with a prolonged vacuum time, peaking (6.67 ± 0.30 N/15 mm) at a vacuum time of 5.0 s. However, by further prolonging the vacuum time (>5.0 s), the vacuum pressure gradually increased to 0.08 MPa, which resulted in a gradual decrease in the heat-sealing strength of the composite films. During the heat-sealing process, the seal area became tapered with the application of heat. After increasing the vacuum pressure, the area surrounding the seal appeared crimped and deformed, resulting in a reduced sealing strength. Thus, when a pressure was applied that exceeded a certain limit, a fracture occurred [33].
This indicated that, under appropriate heat-sealing pressure and temperature conditions, an extended heat-sealing time resulted in a stronger bond between the composite films at the sealing interface. However, when the heat-sealing time exceeded a certain limit, the composite film heat-sealing strength gradually decreased. This may be ascribed to heat-sealing time-induced internal water loss, which resulted in wrinkling, deformation, and the scorched, dry, and cracked appearance of the composite films [34].
During the hot-pressing process, the films melted and deformed instantly. At this time, a reduction in the heat-sealing temperature can not only allow for a closer fit between the films but also allow for the formation of regular lines at the seal, improving its practicability and aesthetic effect. The influence of cooling time on the heat-sealing strength of the Maillard-modified FG-Ara composite films is shown in Figure 2C. As the cooling time increased, the heat-sealing strength of composite films initially increased and subsequently decreased. This indicated that an insufficient cooling time was associated with a shorter squeezing time of the hot sealing strip at the mouth of the bag, resulting in incomplete bond formation between the corresponding films and the consequential reduction in their heat-sealing strength [35]. However, an extended cooling time resulted in secondary thermal dissolution during heat-sealing and prolonged the overall sealing working time.
In summary, the vacuum times of 3.0, 5.0, 7.0 s, the heat-sealing times of 2.0, 2.5, 3.0 s and the cooling times of 2.0, 3.0, 4.0 s were selected for the response surface experiment design.

3.2. Analysis of Response Surfaces and Verification of Predictive Model

Using the heat seal strength as the response value, Design-Expert Version 8.0.6. software was utilized to perform the analysis of variance and quadratic regression analysis on the test results depicted in Table 3. The analysis of variance and model fit results are presented in Table 4 and were used to obtain the second-order polynomial model Equation (9) as shown below:
Y   =   6.74   +   0.42 A   +   0.34 B   +   0.15 C     0.23 A B     0.19 × A   2     0.22 × B 2     0.83 × C 2
where A, B and C represent coded values.
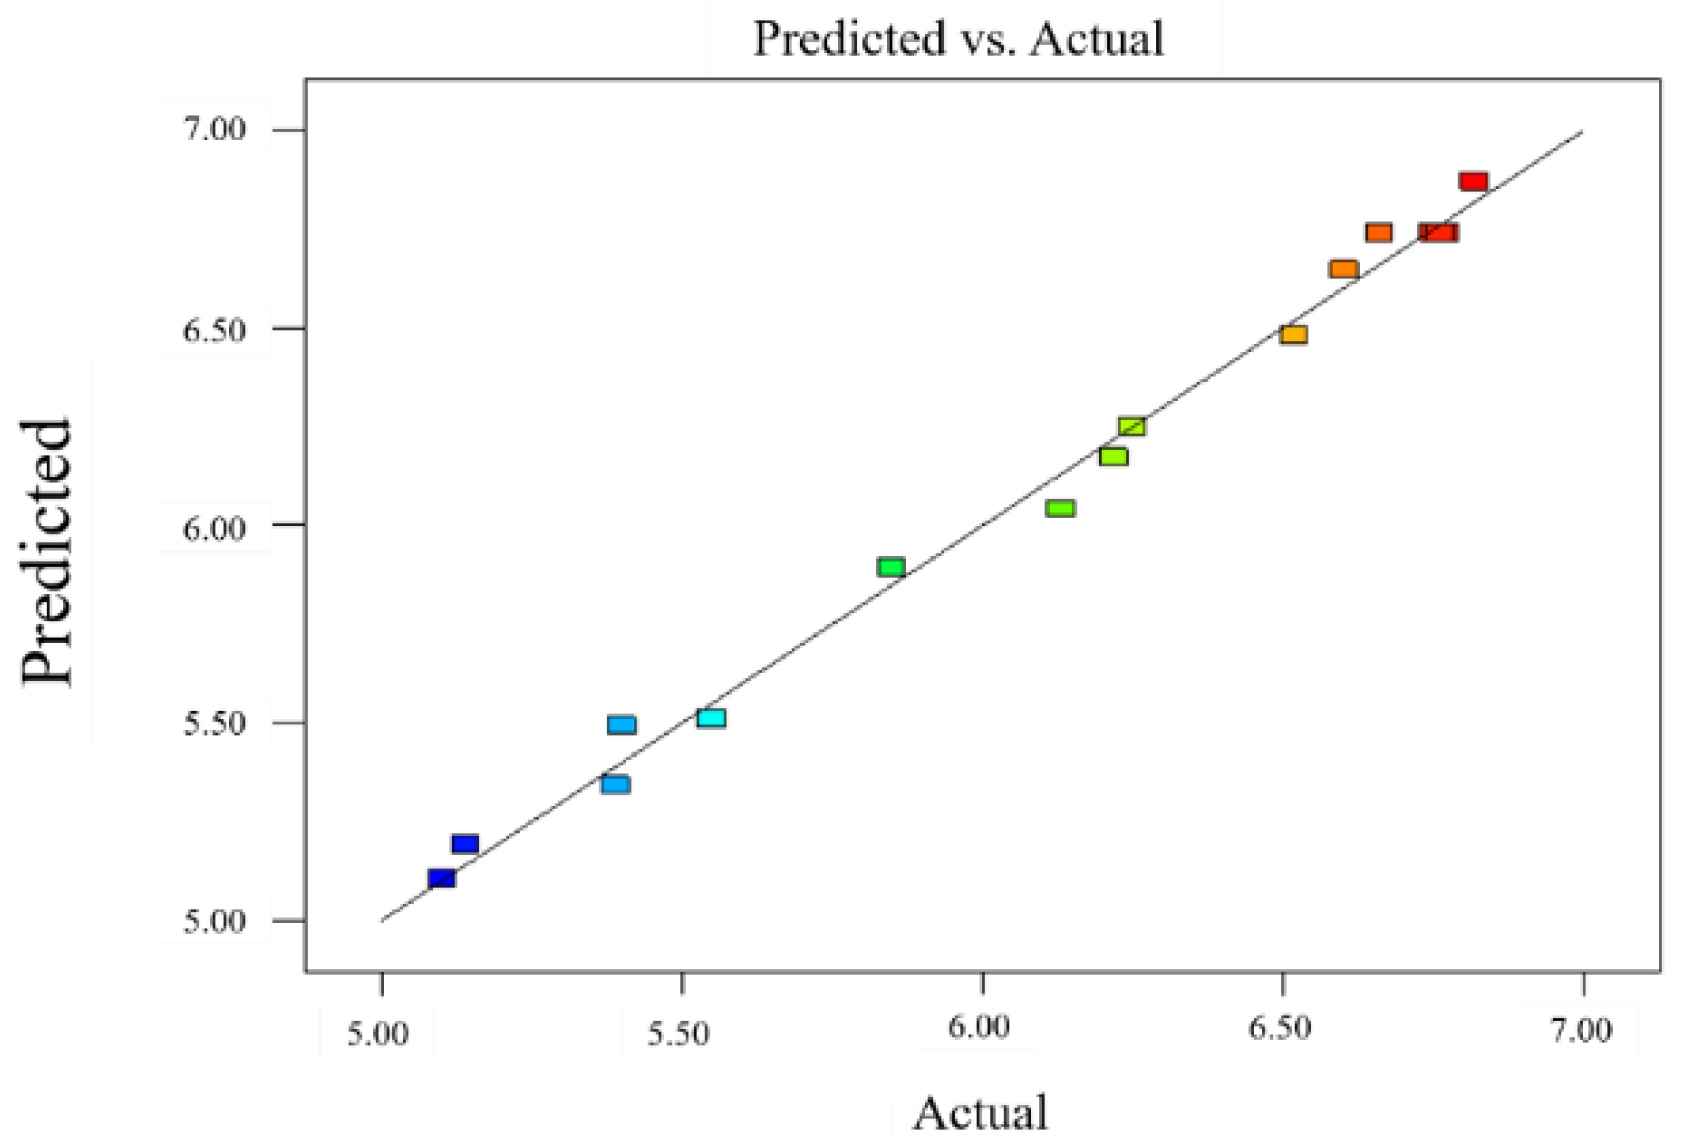
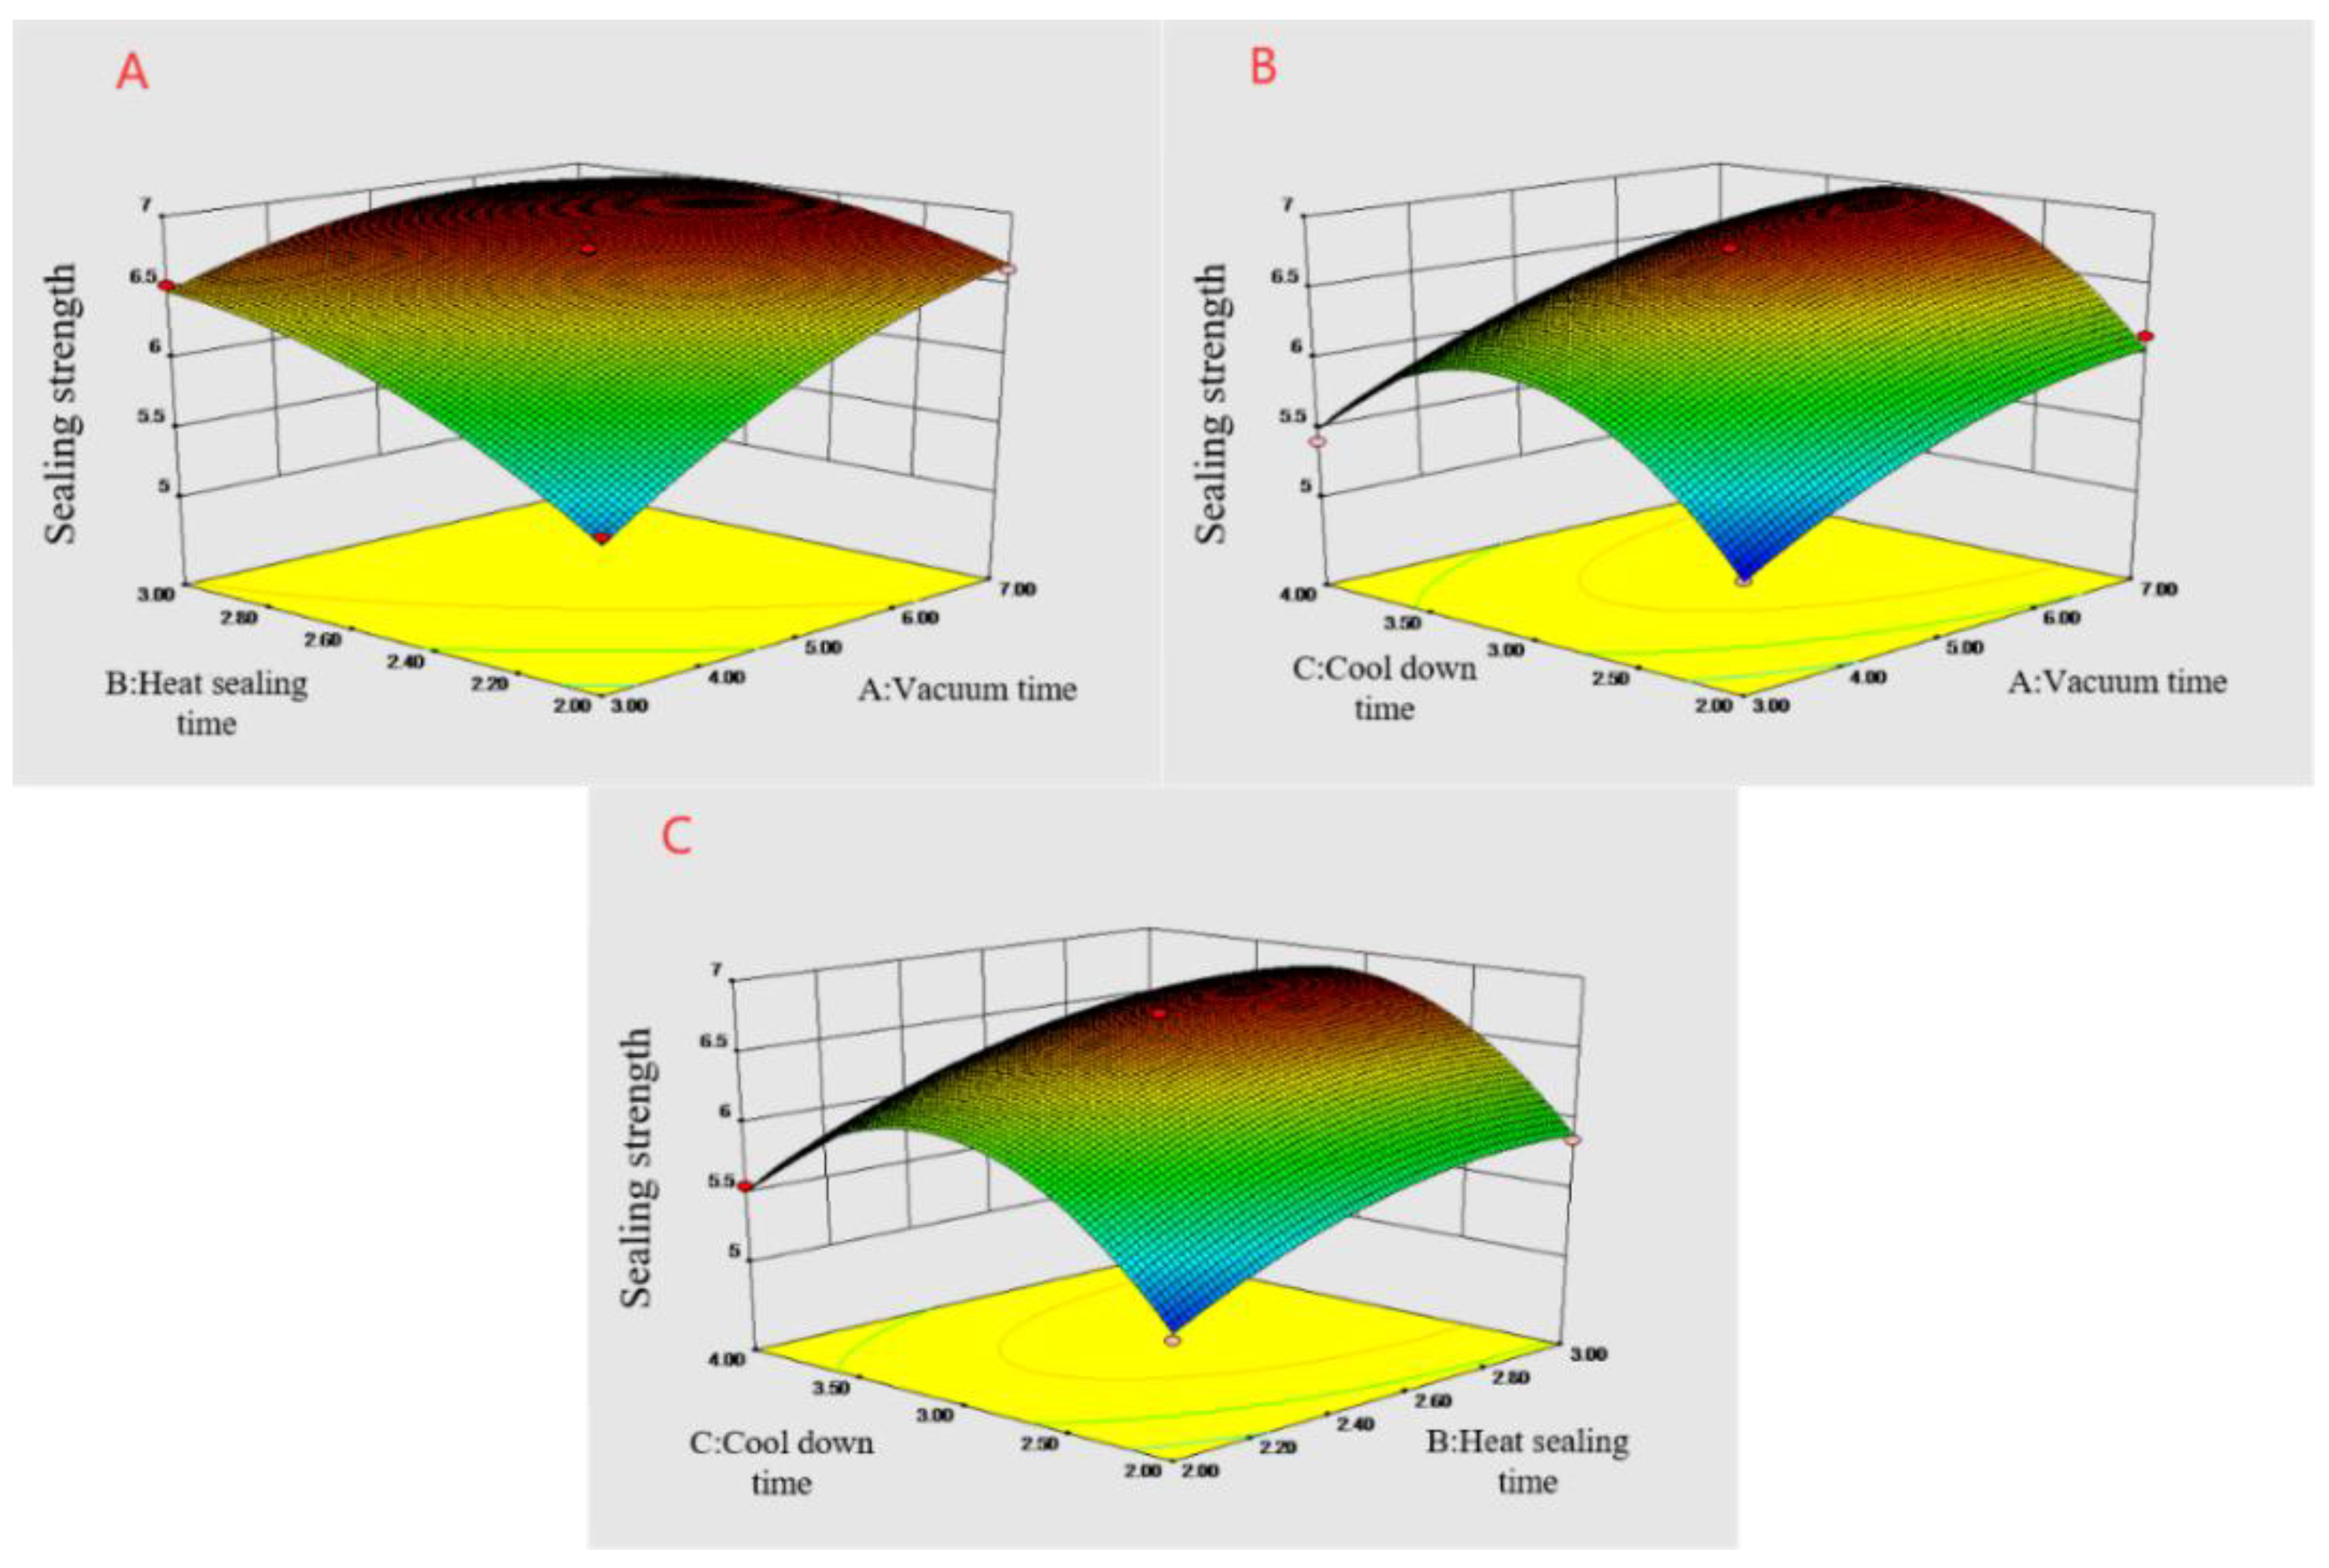
The results depicted in Table 4 demonstrated that the regression model was significant (p < 0.0001), the mismatch term was not significant (p = 0.0691 > 0.05), R2 = 0.9933, R2adj = 0.9848, and the difference between the corrected and predicted correlation coefficients were <0.2, substantiating the significance of the model. The predicted and measured values fitted well (Figure 3), the coefficient of variation was 1.26%, and the mismatch term was not significant, indicating the validity of the experimental data and analysis results. The regression model of the heat-sealing strength was analyzed by response surface, and the three-dimensional analysis diagram of each response surface was obtained (Figure 4).
The results of the variance analysis demonstrated that A, B, and C significantly influenced the thermal sealing strength of the film materials. The F-value demonstrated that each factor influenced the heat-sealing strength in the order of A > B > C. The AB interaction was significant (p = 0.0006), indicating that the interaction between the vacuum and heat-sealing times had a large influence on the heat-sealing strength of the FG-Ara composite films, while the AC and BC interactions were not significant. Additionally, the influence of A2, B2 and C2 on the heat-sealing strength of the composite films was also significant, indicating that the quadratic terms of the vacuum, heat-sealing, and cooling times were closely related to the heat-sealing strength.

3.3. Optimization and Verification of Sealing Strength Process Conditions

The optimal extraction conditions of the sealing strength obtained from the regression model described above were 6.89, 2.64 and 3.06 s for the vacuum, heat-sealing, and cooling times, respectively, and the associated theoretical sealing strength was 6.99 N/15 mm. For operational convenience, the above conditions were revised to 7, 3 and 3 s for the vacuum, heat-sealing, and cooling times, respectively, resulting in an associated sealing strength of 7.03 N/15 mm (RSD = 0.12%). Considering the insignificant difference between the sealing strength and the theoretical prediction, it may be deduced that the equation accurately described the actual process, substantiating the validity of the model.

3.4. Storage Properties of FG-Ara Composite Film Modified by Maillard Reaction

3.4.1. Effect of Storage Conditions on Mechanical Properties

The mechanical properties of packaging materials should be kept relatively stable to facilitate food protection during the storage process and to extend the shelf life of the food. The changes in TS and EAB of the FG-Ara composite films stored in different environmental factors are shown in Figure 5. Overall, the TS of the FG-Ara composite films demonstrated a decreasing trend, while the EAB demonstrated an increasing trend. In the low humidity environment (RH 43%), the TS initially increased before it decreased with time, and peaked (40.61 ± 1.88 MPa) at 20–40 days, which was 6.25% higher than the initial value. Furthermore, the EAB decreased significantly from 0 to 40 days, after which it gradually stabilized. After 120 days of storage at low temperatures (4 °C, −17 °C), the TS of the composite films decreased to 11.15 ± 1.64 and 13.14 ± 1.68 MPa, respectively, while the EAB increased substantially by 39.07% and 18.29%, respectively, compared to the initial values. At an ambient humidity of 65%, the TS decreased and the EAB increased with time, and the largest change was demonstrated at 60 days, at which time the TS decreased by 79.25% and the EAB increased 0.86-fold compared to the initial value.
These results may be explicated by the low environmental humidity associated with the initial storage stage, which may induce additional covalent cross-linking between protein chains. This may further enhance the covalent bonding force between L-arabinose and fish skin gelatin, thus making FG-Ara composite films exhibit high tensile strength [36]. Meanwhile, because the polysaccharide molecular chains in the system contain a large number of -OH groups, which are involved in the strong intermolecular bonding and electrostatic interactions between fish skin gelatin and L-arabinose, these interactions may include hydrogen bonding, dipole-dipole, and charge effects, so that the tensile strength of the composite membrane is improved [37,38]. In addition, the migration of water molecules and plasticizers, such as glycerol, to the membrane surface with storage time may have increased the force between protein macromolecules, whereas membranes with strong protein molecule interactions are more likely to be compact in the matrix, which results in lower migration of water through the film [39]. Thereby maintaining TS at a higher level. However, the prolonged storage time would lead to the degradation of some components in the composite films, such as gelatin protein, resulting in weakened noncovalent binding capacity and increased ductility [40]. This would make the modified FG-Ara composite films still have higher affinity for water molecules as well as higher mobility of water molecules under highly wet environments. Moreover, high water activity increases the fluidity of the components of the gelatin film, which is an important explanation for its high ductility [41].

3.4.2. Effect of Storage Conditions on Barrier Performance

Table 5 presents the variation of FG-Ara composite film water vapor permeability (WVP) in different storage environments over time. Overall, the WVP increased as the environmental RH increased. The lowest water-resistance performance of the composite films was observed after 120 days of storage in high humidity (RH 65%), demonstrating the highest WVP (379.36 ± 18.69 g·mm/m2·d·kPa) among all treatment groups due to the good plasticizing effect of the water molecules. Moreover, the WVP remained relatively stable at the initial stage of storage (0–40 d) and demonstrated a much smaller variation range in the low-temperature treatment group (4, −17 °C) than that in the humidity treatment group. After 120 days of storage at 4 and −17 °C, the WVP of the composite films reached 39.57 ± 3.09 and 26.95 ± 18.50 g·mm/m2·d·kPa, respectively, which were much lower than that under room temperature (25 °C; 54% RH). This is because edible films obtained from proteins show good mechanical properties, but their water vapor barrier properties are generally poor due to their hydrophilicity [42]. As the storage time increases, the film structure gradually loosened, increasing the probability of water molecules penetrating the film material. Moreover, the overall EAB of FG-Ara composite films increased during storage, which further confirmed the role of water molecules. Under dry conditions, the composite film was not easily degraded, and the water content was low, which greatly increased the density and improved the water resistance of the composite film structure. This may be ascribed to the diminished activity of the water molecules at low temperatures, effectively reducing the transfer efficiency of water molecules in the film [43,44]. Thus, both storage temperature and ambient humidity had an influence on the WVP of the resulting film after extended storage.

3.5. Effect of Storage Conditions on Milk Powder Quality

Modulated milk powder is rarely used as solid packaging material. However, the quality variation of powdered milk can be used to measure the effectiveness of FG-Ara composite film packaging [45]. Therefore, this paper uses a Maillard-modified FG-Ara composite film to package the prepared milk powder and discusses the difference in the quality change in the prepared milk powder in the storage process.

3.5.1. Effect of Storage Conditions on Soaking Time of Prepared Milk Powder

Infiltration time is a measurement index to judge whether instant powder has instant solubility. The effect of storage conditions on the soaking time of the prepared milk powder is depicted in Figure 6A. The soaking time gradually increased with the extension of storage time under different humidity conditions. Consequentially, the time required to prepare the milk powder was also prolonged, and the instantaneous solubility worsened. After 120 days of storage at 65% RH, the most rapid increase in penetration time was observed. Moreover, the penetration time was significantly higher than that of the other treatment groups, indicating ineffective storage of the prepared milk powder under this condition. The WVP was high under conditions of 54% and 65% RH, and a large amount of water vapor entered the independent packaging through the composite films. This resulted in gradual hygroscopicity and hardening of the milk powder particles, thus shortening their shelf life. However, storage of the prepared milk powder at a low temperature and humidity resulted in a relatively stable soaking time, indicating that dry and low-temperature environments were more suitable for the storage of milk powder.

3.5.2. Effect of Storage Conditions on Dispersion Time of Prepared Milk Powder

The dispersion time is the measurement of milk powder particle dispersion in water after being uniformly stirred. Figure 6B shows the influence of the storage conditions on the prepared milk powder dispersion time. The dispersion time of the prepared milk powder gradually increased with the extension of storage time and indicated that the dispersion of the prepared milk powder decreased. Moreover, the variation trend of the dispersion time was similar to that of the infiltration time. The dispersion time of the milk powder stored at 65% RH increased substantially, demonstrating a 17-fold increase after 120 days of storage. Furthermore, the volume of the milk powder and insoluble paste corresponded significantly with the increase in dispersion time. Moreover, the dispersion time trend changed with the extension of storage time. The dispersibility of milk powder decreased gradually after 80 days at 54% RH. However, the treatment at RH 43%, 4 °C, and −17 °C had little effect on the dispersibility of the milk powder with the extension of storage time. This may be ascribed to relatively poor water vapor transmittance of gelatin films. In the high-humidity environment, water molecules gradually penetrated the packaging, and agglomerated once, which critically reduced the agglomeration effect.

3.5.3. Effect of Storage Conditions on Protein Dispersion Index of Prepared Milk Powder

As an organic macromolecular substance, protein exists in a dispersed state in water. As such, solubility of proteins does not occur in water. The corresponding dispersion amount or dispersion level of proteins in water is referred to as protein solubility and can be characterized by the PDI. As depicted in Figure 6C, the PDI of the prepared milk powder decreased significantly with increased storage time due to the different RH conditions. At 65% RH, the PDI of the prepared milk powder decreased by approximately 30% after 120 days of storage. Due to the poor water vapor resistance of the film under high-humidity conditions, the proportion of the suspended proteins in the supernatant inevitably decreased after dissolution. When frozen at −17 °C, the PDI decreased at the slowest rate, followed by 4 °C, which was similar to the changed wettability of the prepared milk powder.

3.5.4. Effect of Storage Conditions on Insoluble Index of Prepared Milk Powder

As indicated in Figure 6D, the insolubility index of the prepared milk powder increased in varying degrees with the extension of time. Specifically, the insolubility index changed the least with the extension of storage time under low-temperature conditions (4 and −17 °C). After 120 days of low-temperature (4 and −17 °C) storage, the insolubility index of the prepared milk powder increased to 0.38 and 0.40 mL, respectively, demonstrating an increase of 52% and 50%, respectively, from the initial value. This demonstrated that the prepared milk powder packaged with the composite film was suitable for storage under cold and freezing conditions, maintaining similar properties to that of the original packaging. Under 65% RH conditions, the insolubility index gradually increased with the extension of storage time. Moreover, after 120 days of storage, the insolubility index increased approximately three-fold compared to the initial value. At 54% RH, the insolubility index of the prepared milk powder remained relatively unchanged within the first 60 days; however, it rapidly increased after 60 days of storage.

3.6. Preparation of Oil Bale and the Effect of Storage Conditions on Oil Bale

3.6.1. Evaluation of Drop Test

No breaks, drips, or oil leakages were noted after freely dropping the vegetable oil-containing sealing bags three times from a height of 1500 mm. Figure 7A presents the oil bag samples before and after the fall, demonstrating no significant changes in their appearance or shape. These results adhere to the requirements of convenient food transportation.

3.6.2. Evaluation of Compressive Test

Figure 7B visualizes the oil bale and filter paper samples after the application of 60 s of static pressure (200 N). No breaks were observed in the oil bales, and no residual oil droplets were present on the filter paper. Therefore, the oil packages prepared using the composite films were able to meet the stacking requirements of food packaging.

3.6.3. Changes of POV during Soybean Oil Storage

(1)
Order Dynamic Model Analysis
The first-order dynamic model can be expressed as an exponential function (Equation (10)) [30].
POV   =   POV 0 e k t
where POV0 depicts the initial peroxide value, POV the peroxide value after storage time (t), and k the reaction rate.
The experimental data were analyzed using the regression equation with the exponential function, and the kinetic models of the peroxide values of two packaging films at three temperatures were obtained (Table 6).
It was demonstrated that the R2 of the two packaging materials at different temperatures was greater than 0.9 and indicated that the experimental data were well described by the equation. The k value gradually increased with increasing temperature, indicating a close relation between the oxidation rate and temperature.
(2)
Establishment of Arrhenius Prediction Model
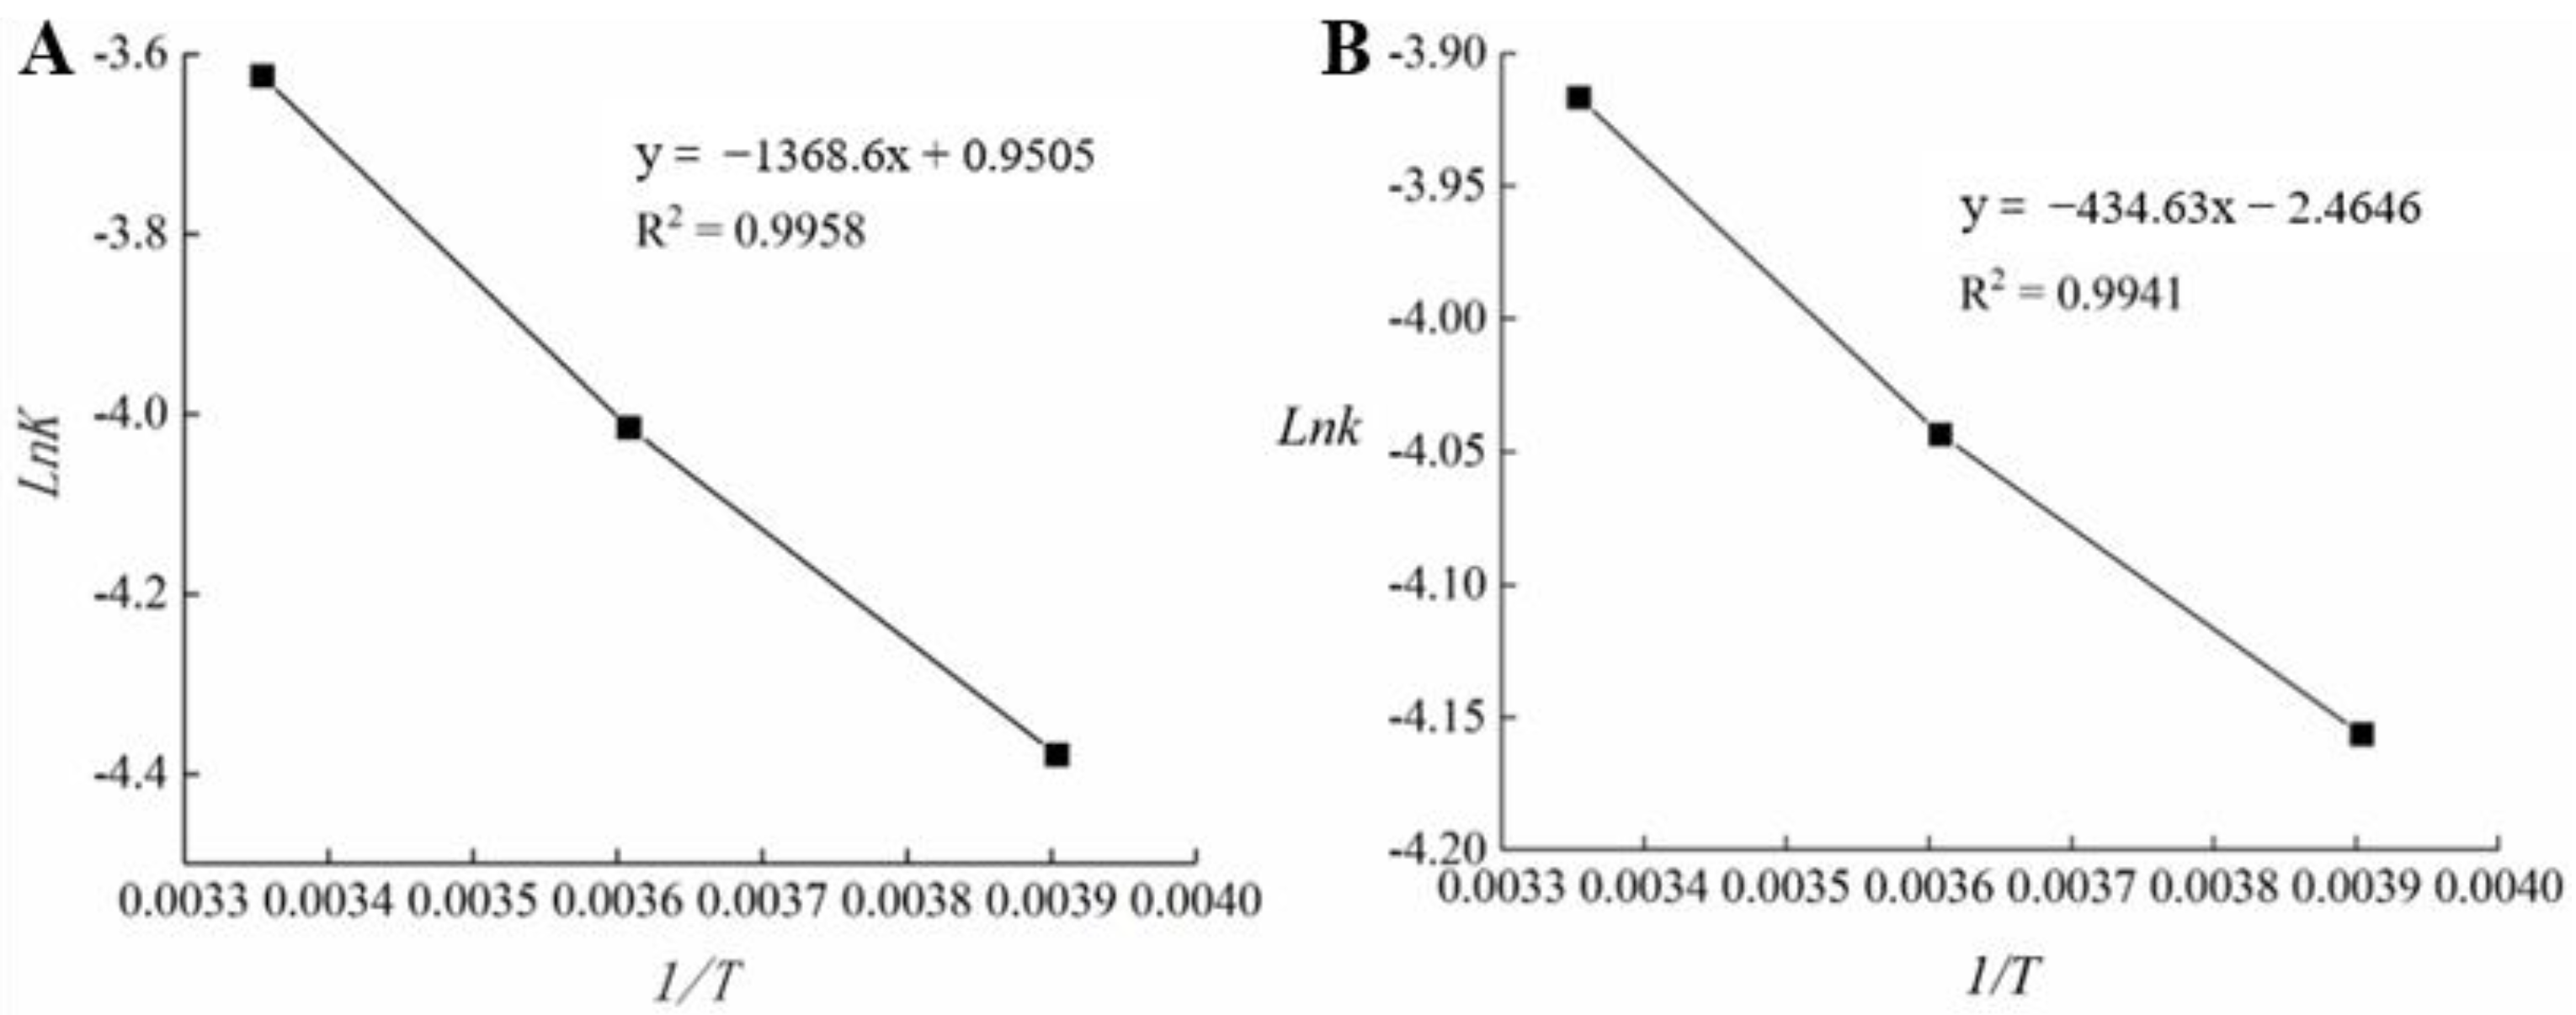
The k value was obtained at different temperatures, and a linear equation was obtained by plotting Lnk against the reciprocal of the thermodynamic temperature (1/T). Table 7 and Figure 8 demonstrate the determination of EA and k0 [32,46].
When Table 7 and Figure 8 were combined, the linear regression equations of the BOPP-PE and FG-Ara oil packages were
y   =   1368.6 x   +   0.9505   R 2 = 0.9958
y   =   434.62 x     2.4646   R 2 = 0.9941
An EA of 11,379.14 and 3613.602 J/mol were obtained for BOPP-PE and FG-Ara oil packages, respectively, which accurately described the relationship between Lnk and 1/T. Combined with Equation (8), the shelf-life prediction formula of BOPP-PE (Equation (13)) and FG-Ara (Equation (14)) film packaged soybean oil was as follows:
S   =   L n POV L L n POV O e 1368.6 T + 0.9505
S   =   L n POV L L n POV O e 434.62 T 2.4646
(3)
Arrhenius Model Verification
To verify the accuracy of the established shelf-life model, it had to be validated through experiments, which were not included in the test group values (−17, 4 and 25 °C). Therefore, experiments at 20 °C (fume hood dark storage) of two packages were prepared to verify the accuracy of shelf-life [47,48]. According to the shelf-life models of soybean oil under different packages, obtained from Equations (13) and (14), the time required to reach the measured POV was calculated and compared with the actual measurement times (Table 8).
The results depicted in Table 8 indicated that the model can also be applied with slightly fluctuating external temperatures. The error between the shelf life calculated using the Arrhenius model and the actual shelf-life value was 0.6–0.18 and 0.7–0.15 for the soybean oil packaged with BOPP-PE and FG-Ara composite films, respectively. At the initial stage of storage (>20 days), the storage effect of FG-Ara composite films was better than that of the BOPP-PE commercial films. According to this model and Table 9, it was calculated that the longest shelf-life of the BOPP-PE and FG-Ara composite packages of soybean oil was 315 and 250 days, respectively. In conclusion, the shelf-life model conformed to the first-order equation and could be described by the Arrhenius equation. Through the verification experiments, it was confirmed that the shelf-life model had high reliability with an error within 0.2.
From what has been discussed above, in the film formation system, the Maillard reaction induced by L-arabinose will give the composite film excellent antioxidant performance [49,50], and after Maillard modification, the heat-sealing conditions of the modified FG-Ara composite film are optimized. By studying the TS, EBA and WVP of the composite film under different storage conditions, it can be found that the mechanical properties and barrier properties of the modified FG-Ara composite film have been greatly improved. Moreover, through the application experiment of modified FG-Ara composite film, the encapsulation performance of the film was explored, and the encapsulation performance was compared with that of the traditional packaging. The Arrhenius prediction model was used to conclude that the shelf life of the packaging of two different materials was similar. Therefore, it is concluded that FG-Ara composite film modified by Maillard is likely to replace the traditional packaging.

4. Conclusions

In this study, FG-Ara composite film modified by the Maillard reaction was used as the packaging matrix to conduct heat-sealing process research and a storage encapsulation experiment. After heat-sealing, the composite film was firm, and no membrane separation occurred. The optimal heat-sealing process was determined as vacuum time 7.0 s, heat sealing time 3.0 s and cooling time 3.0 s. In the process of exploring the effect of storage conditions on the mechanical properties and barrier properties of the film, it was found that the composite film had a good performance at low temperatures and low humidity. The milk powder packed with the composite film also shows better quality under the conditions of low temperature and low humidity. This is of great significance for evaluating the shelf life of food packaging materials. In this paper, soybean oil was also sealed into the package bag prepared by the composite film, and combined with the drop test and compression test, it was proved that the composite film (bag) could meet the requirements of food internal packaging, transportation, and stacking. The shelf life of soybean oil at different temperatures was fitted by the Arrhenius equation with POV as the index. By comparing the storage experiments at a constant temperature (20 °C), the shelf life of soybean oil packaged with BOPP-PE film and FG-Ara composite film was predicted to be 315 and 250 days, respectively. It can be concluded that the packaging performance of the Maillard-modified FG-Ara composite films were similar to that of traditional packaging materials. Therefore, the Maillard-modified FG-Ara composite films can successfully replace traditional packaging, broaden the application of the composite film in the food industry and provide an effective data reference for the industrialization of degradable, ecologically friendly packaging.

Author Contributions

Conceptualization, Q.Z. (Qiankun Zheng) and L.Y.; formal analysis, Q.Z. (Qiankun Zheng); investigation, Q.Z. (Qiankun Zheng); validation, Q.Z. (Qiankun Zheng); writing of original draft, Q.Z. (Qiankun Zheng); visualization, Q.Z. (Qiankun Zheng); data curation, Q.Z. (Qiang Zhang); writing—review, and editing, Q.Z. (Qiang Zhang) and F.C.; supervision, F.C.; project administration, F.C.; funding acquisition, F.C. and L.Y. All authors have read and agreed to the published version of the manuscript.

Funding

This study was supported by the National Natural Science Foundation of China (Grant No. U21A20270).

Institutional Review Board Statement

Not applicable.

Informed Consent Statement

This study does not involve any human or animal testing.

Data Availability Statement

Not applicable.

Conflicts of Interest

The authors declare no conflict of interest.

References

  1. Groh, K.J.; Backhaus, T.; Carney-Almroth, B.; Geueke, B.; Inostroza, P.A.; Lennquist, A.; Muncke, J. Overview of known plastic packaging-associated chemicals and their hazards. Sci. Total Environ. 2019, 651, 3253–3268. [Google Scholar] [CrossRef] [PubMed]
  2. Galus, S.; Kadzińska, J. Food applications of emulsion-based edible films and coatings. Trends Food Sci. Technol. 2015, 45, 273–283. [Google Scholar] [CrossRef]
  3. Rangaraj, V.M.; Rambabu, K.; Banat, F.; Mittal, V. Natural antioxidants-based edible active food packaging: An overview of current advancements. Food Biosci. 2021, 43, 101251. [Google Scholar] [CrossRef]
  4. Haghighi, H.; Biard, S.; Bigi, F.; De Leo, R.; Bedin, E.; Pfeifer, F.; Siesler, H.W.; Licciardello, F.; Pulvirenti, A. Comprehensive characterization of active chitosan-gelatin blend films enriched with different essential oils. Food Hydrocoll. 2019, 95, 33–42. [Google Scholar] [CrossRef]
  5. Etxabide, A.; Uranga, J.; Guerrero, P.; De la Caba, K. Development of active gelatin films by means of valorisation of food processing waste: A review. Food Hydrocoll. 2017, 68, 192–198. [Google Scholar] [CrossRef]
  6. Wasswa, J.; Tang, R.; Gu, X.H. Utilization of fish processing by-products in the gelatin industry. Food Rev. Int. 2007, 23, 159–174. [Google Scholar] [CrossRef]
  7. Bhutani, U.; Laha, A.; Mitra, K.; Majumdar, S. Sodium alginate and gelatin hydrogels: Viscosity effect on hydrophobic drug release. Mater. Lett. 2016, 164, 76–79. [Google Scholar] [CrossRef]
  8. Li, Y.; Li, C.; Mujeeb, A.; Jin, Z.; Ge, Z. Optimization and characterization of chemically modified polymer microspheres and their effect on cell behavior. Mater. Lett. 2015, 154, 68–72. [Google Scholar] [CrossRef]
  9. Tokuda, N. Homoepitaxial diamond growth by plasma-enhanced chemical vapor deposition. In Novel Aspects of Diamond. Topics in Applied Physics; Yang, N., Ed.; Springer: Cham, Switzerland, 2019; Volume 121, pp. 1–29. [Google Scholar] [CrossRef]
  10. Lin, J.; Guo, X.; Ai, C.; Zhang, T.; Yu, S. Genipin crosslinked sugar beet pectin–whey protein isolate/bovine serum albumin conjugates with enhanced emulsifying properties. Food Hydrocoll. 2020, 105, 105802. [Google Scholar] [CrossRef]
  11. Lin, J.; Wang, Z.; Meng, H.; Guo, X. Genipin crosslinked gum arabic: Synthesis, characterization, and emulsification properties. Carbohydr. Polym. 2021, 261, 117880. [Google Scholar] [CrossRef]
  12. Siracusa, V.; Rocculi, P.; Romani, S.; Dalla Rosa, M. Biodegradable polymers for food packaging: A review. Trends Food Sci. Technol. 2008, 19, 634–643. [Google Scholar] [CrossRef]
  13. Lin, J.; Yu, S.; Ai, C.; Zhang, T.; Guo, X. Emulsion stability of sugar beet pectin increased by genipin crosslinking. Food Hydrocoll. 2020, 101, 105459. [Google Scholar] [CrossRef]
  14. Zhao, H.; Kang, X.; Zhou, X.; Tong, L.; Yu, W.; Zhang, J.; Yang, W.; Lou, Q.; Huang, T. Glycosylation fish gelatin with gum Arabic: Functional and structural properties. LWT Food Sci. Technol. 2021, 139, 110634. [Google Scholar] [CrossRef]
  15. An, K.; Liu, H.; Guo, S.; Kumar, D.N.T.; Wang, Q. Preparation of fish gelatin and fish gelatin/poly(l-lactide) nanofibers by electrospinning. Int. J. Biol. Macromol. 2010, 47, 380–388. [Google Scholar] [CrossRef] [PubMed]
  16. Song, Y.; Hu, Q.; Wu, Y.; Pei, F.; Kimatu, B.M.; Su, A.; Yang, W. Storage time assessment and shelf-life prediction models for postharvest Agaricus Bisporus. Lebensm. Wiss. Technol. 2018, 101, 360–365. [Google Scholar] [CrossRef]
  17. Ooi, L.G.; Liong, M.T. Cholesterol-lowering effects of probiotics and prebiotics: A review of in vivo and in vitro findings. Int. J. Mol. Sci. 2010, 11, 2499–2522. [Google Scholar] [CrossRef] [Green Version]
  18. Osaki, S.; Kimura, T.; Sugimoto, T.; Hizukuri, S.; Iritani, N. L-arabinose feeding prevents increases due to dietary sucrose in lipogenic enzymes and triacylglycerol levels in rats. J. Nutr. 2001, 131, 796–799. [Google Scholar] [CrossRef] [Green Version]
  19. Fujii, M.; Hatozoe, M.; Hou, D.X.; Sanada, H.; Osaki, S.; Hizukuri, S. Effects of L-arabinose on serum neutral lipid, weights of fat pads and cecum, and on organic acids in cecum in rats. J. Appl. Glycosci. 2000, 47, 355–361. [Google Scholar] [CrossRef]
  20. Mu, Y.; Hang, L.; Zhao, G.; Wang, X.; Zhou, Y.; Cheng, Z. Modeling and simulation for the investigation of polymer film casting process using finite element method. Math. Comput. Simul. (MATCOM) 2020, 169, 88–102. [Google Scholar] [CrossRef]
  21. Lim, S.L.; Rosli, W. Nutritional composition and lipid oxidation stability of beef patties packed with biodegradable and non-biodegradable materials. Sains Malays. 2014, 43, 1197–1203. [Google Scholar]
  22. ASTM. E96-93 Standard Test Methods for Water-Vapor Transmission of Materials; Annual Book of ASTM Standards; American Society for Testing and Materials: Philadelphia, PA, USA, 1993. [Google Scholar]
  23. Gontard, N.; Guilbert, S.; Cuq, J.L. Edible wheat gluten films: Influence of the main process variables on film properties using Response Surface Methodology. J. Food Sci. 1992, 57, 190–196. [Google Scholar] [CrossRef]
  24. Mchugh, T.H. Effects of Chemical Properties and Physical Structure on Mass Transfer in Whey Protein-Based Edible Film Systems; University of California: Los Angeles, CA, USA, 1993. [Google Scholar]
  25. Schuck, P.; Mejean, S.; Dolivet, A.; Gaiani, C.; Banon, S.; Scher, J.; Jeantet, R. Water transfer during rehydration of micellar casein powders. Le Lait 2007, 87, 425–432. [Google Scholar] [CrossRef] [Green Version]
  26. Rangaraj, V.M.; Rambabu, K.; Banat, F.; Mittal, V. Effect of date fruit waste extract as an antioxidant additive on the properties of active gelatin films. Food Chem. 2021, 355, 129631. [Google Scholar] [CrossRef] [PubMed]
  27. Yildiz, E.; Bayram, I.; Sumnu, G.; Sahin, S.; Ibis, O.I. Development of pea flour based active films produced through different homogenization methods and their effects on lipid oxidation. Food Hydrocoll. 2021, 111, 106238. [Google Scholar] [CrossRef]
  28. Yang, X.; Liu, Y.; Chen, J.; Lv, Y.; Luo, Y. Quality Attributes and Shelf Life Modeling of Pacific White Shrimp (Litopenaeus vannamei) Stored at Different Temperatures. J. Aquat. Food Prod. Technol. 2018, 27, 998–1008. [Google Scholar] [CrossRef]
  29. Gennadios, A.; Ghorpade, V.M.; Weller, C.L.; Hanna, M.A. Heat curing of soy protein films. Trans. Asae 1996, 39, 575–579. [Google Scholar] [CrossRef] [Green Version]
  30. Nelson, K.; Labuza, T. Water activity and food polymer science: Implications of state on Arrhenius and WLF models in predicting shelf life. J. Food Eng. 1994, 22, 271–289. [Google Scholar] [CrossRef]
  31. Guerrero, P.; Leceta, I.; Penalba, M.; Caba, K. Optical and mechanical properties of thin films based on proteins. Mater. Lett. 2014, 124, 286–288. [Google Scholar] [CrossRef]
  32. Wang, Z.-C.; Qin, C.-Q.; Zhang, X.; Wang, Q.; Li, R.-X.; Ren, D.-F. Effect of whey protein isolate/chitosan/microcrystalline cellulose/PET multilayer bottles on the shelf life of rosebud beverages. Food Chem. 2021, 347, 129006. [Google Scholar] [CrossRef]
  33. Lim, W.S.; Ock, S.Y.; Park, G.D.; Lee, I.W.; Park, H.J. Heat-sealing property of cassava starch film plasticized with glycerol and sorbitol. Food Packag. Shelf Life 2020, 26, 100556. [Google Scholar] [CrossRef]
  34. Mazzola, N.; Cáceres, C.A.; França, M.P.; Canevarolo, V.S. Correlation between thermal behavior of a sealant and heat sealing of polyolefin films. Polym. Test. 2012, 31, 870–875. [Google Scholar] [CrossRef]
  35. Das, M.; Chowdhury, T. Heat sealing property of starch based self-supporting edible films. Food Packag. Shelf Life 2016, 9, 64–68. [Google Scholar] [CrossRef]
  36. Su, J.F.; Yuan, X.Y.; Huang, Z.; Xia, W.L. Properties stability and biodegradation behaviors of soy protein isolate/poly (vinyl alcohol) blend films. Polym. Degrad. Stab. 2010, 95, 1226–1237. [Google Scholar] [CrossRef]
  37. Guerrero, P.; Hanani, Z.A.N.; Kerry, J.P.; de la Caba, K. Characterization of soy protein-based films prepared with acids and oils by compression. J. Food Eng. 2011, 107, 41–49. [Google Scholar] [CrossRef]
  38. Nazmi, N.N.; Isa, M.I.N.; Sarbon, N.M. Preparation and characterization of chicken skin gelatin/CMC composite film as compared to bovine gelatin film. Food Biosci. 2017, 19, 149–155. [Google Scholar] [CrossRef]
  39. Tongnuanchan, P.; Benjakul, S.; Prodpran, T.; Songtipya, P. Properties and Stability of Protein-based Films from Red Tilapia (Oreochromis niloticus) Protein Isolate Incorporated with Antioxidant during Storage. Food Bioprocess Technol. 2013, 6, 1113–1126. [Google Scholar] [CrossRef]
  40. Chinma, C.E.; Ariahu, C.C.; Abu, J.O. Development and characterization of cassava starch and soy protein concentrate based edible films. Int. J. Food Sci. Technol. 2012, 47, 383–389. [Google Scholar] [CrossRef]
  41. Brown, E.; Ma, C.; Acharya, J.; Ma, B.; Wu, J.; Li, J. Controlling Dielectric and Relaxor-Ferroelectric Properties for Energy Storage by Tuning Pb0.92La0.08Zr0.52Ti0.48O3 Film Thickness. ACS Appl. Mater. Interfaces 2014, 6, 22417–22422. [Google Scholar] [CrossRef]
  42. Tongnuanchan, P.; Benjakul, S.; Prodpran, T. Roles of lipid oxidation and pH on properties and yellow discolouration during storage of film from red tilapia (Oreochromis niloticus) muscle protein. Food Hydrocoll. 2011, 25, 426–433. [Google Scholar] [CrossRef]
  43. Rambabu, K.; Bharath, G.; Banat, F.; Loke, P.; Hernández, H. Mango leaf extract incorporated chitosan antioxidant film for active food packaging. Int. J. Biol. Macromol. 2019, 126, 1234–1243. [Google Scholar] [CrossRef]
  44. Freitas, P.A.; Silva, R.R.; de Oliveira, T.V.; Soares, R.R.; Junior, N.S.; Moraes, A.R.; Pires, A.C.D.S.; Soares, N.F. Development and characterization of intelligent cellulose acetate-based films using red cabbage extract for visual detection of volatile bases. LWT 2020, 132, 109780. [Google Scholar] [CrossRef]
  45. Zhang, W.; Luo, Z.; Wang, A.; Gu, X.; Lv, Z. Kinetic models applied to quality change and shelf life prediction of kiwifruits. LWT 2020, 138, 110610. [Google Scholar] [CrossRef]
  46. Li, D.; Xie, H.; Liu, Z.; Li, A.; Li, J.; Liu, B.; Liu, X.; Zhou, D. Shelf life prediction and changes in lipid profiles of dried shrimp (Penaeus vannamei) during accelerated storage. Food Chem. 2019, 297, 124951. [Google Scholar] [CrossRef] [PubMed]
  47. Bravi, E.; Sileoni, V.; Perretti, G.; Marconi, O. Accelerated shelf-life model of gluten-free rusks by using oxidation indices. Food Chem. 2020, 326, 126971. [Google Scholar] [CrossRef]
  48. Kchaou, H.; Benbettaieb, N.; Jridi, M.; Nasri, M.; Debeaufort, F. Influence of Maillard reaction and temperature on functional, structure and bioactive properties of fish gelatin films. Food Hydrocoll. 2019, 97, 105196. [Google Scholar] [CrossRef]
  49. Oh, S.; Park, J.; Nam, J.; Hyun, Y.; Jin, H.-J.; Kwak, H.W. Antioxidant and UV-blocking glucose-crosslinked sericin films with enhanced structural integrity. React. Funct. Polym. 2021, 165. [Google Scholar] [CrossRef]
  50. Granda-Restrepo, D.; Peralta, E.; Troncoso-Rojas, R.; Soto-Valdez, H. Release of antioxidants from co-extruded active packaging developed for whole milk powder. Int. Dairy J. 2009, 19, 481–488. [Google Scholar] [CrossRef]
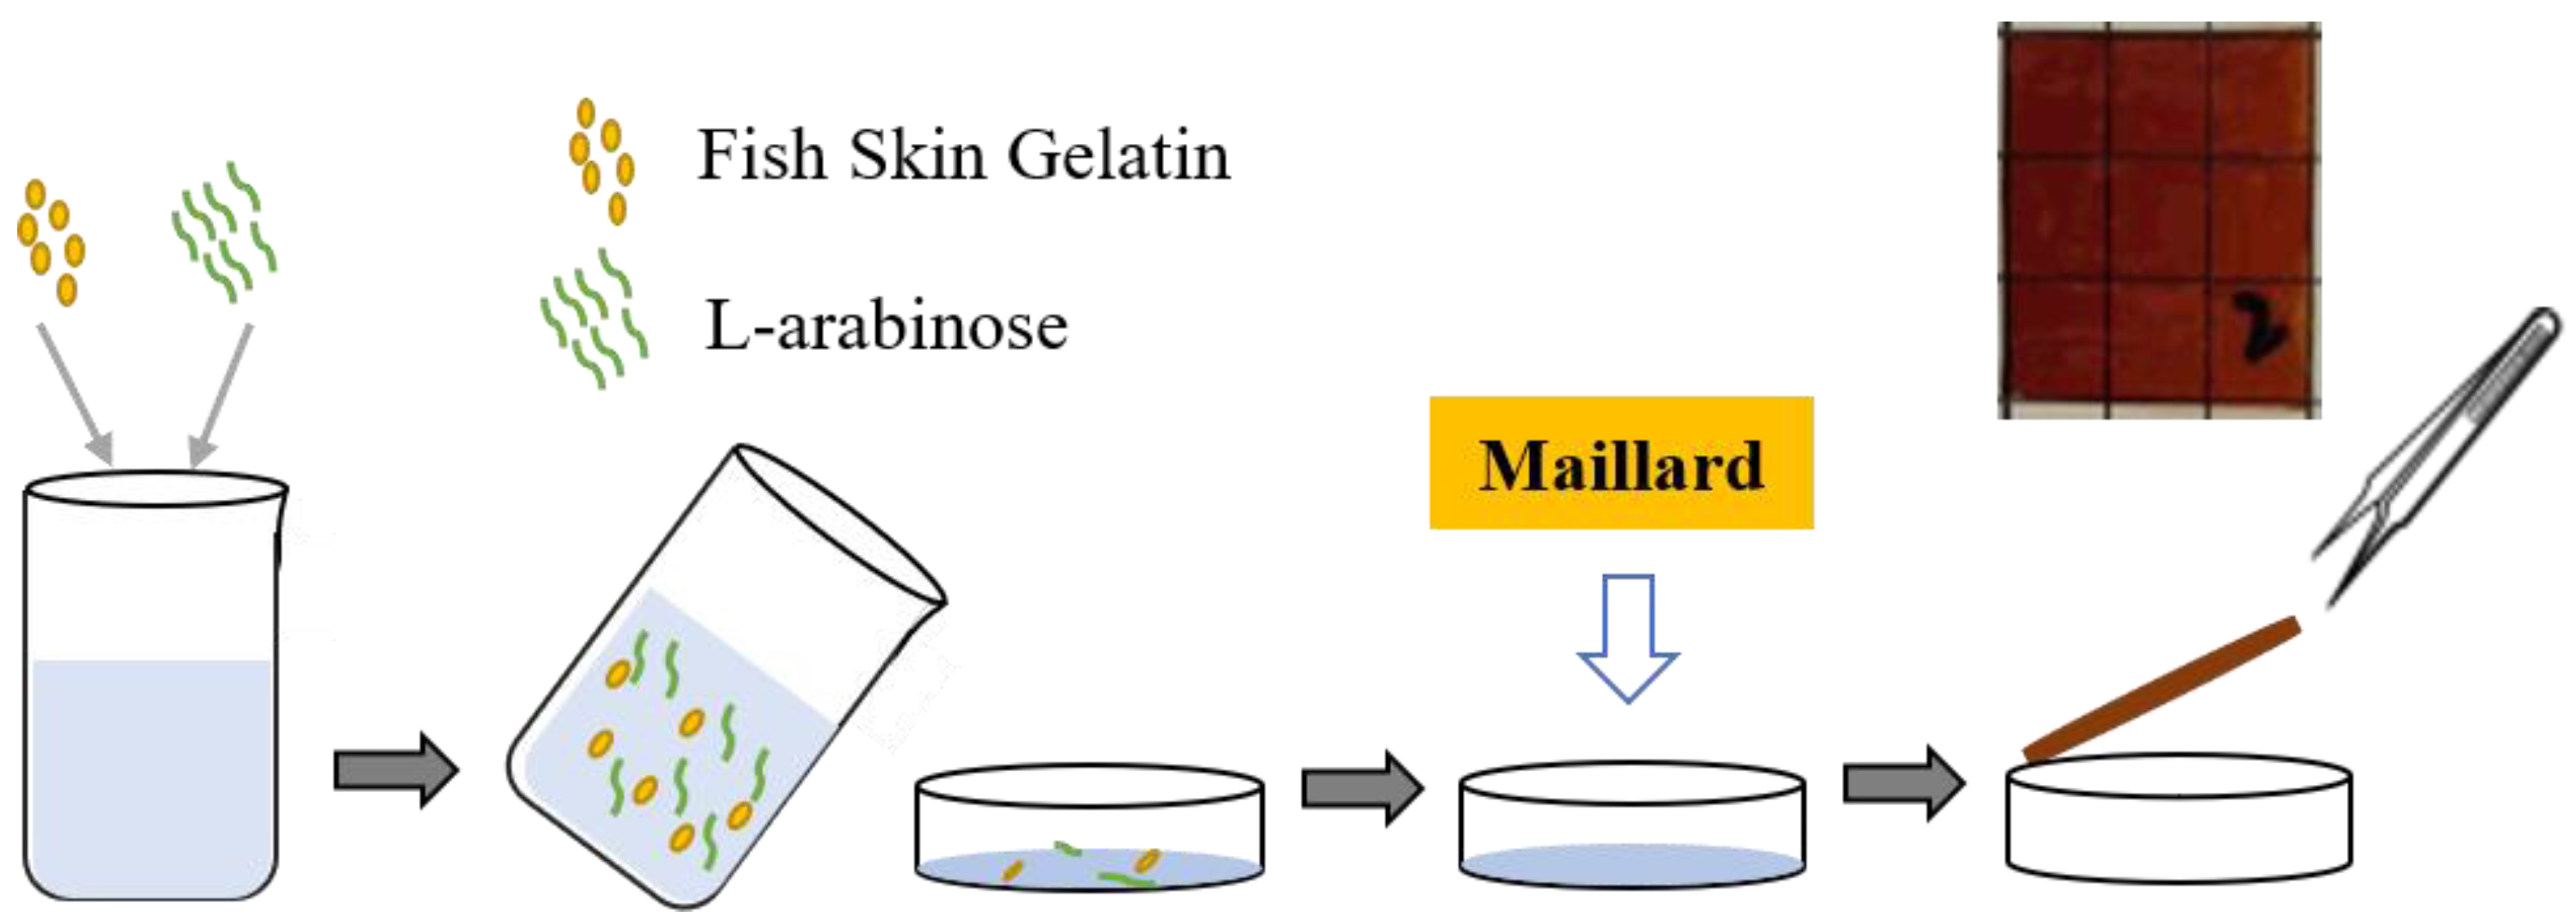
Figure 1. Preparation flow chart of Maillard-modified fish skin gelatin/L-arabinose (FG-Ara) composite films.
Coatings 12 01929 g001
Figure 2. Effect of (A) vacuum time, (B) heat-sealing time, and (C) cooling time on the heat-sealing performance of Maillard-modified FG-Ara composite films. a. b, c, d indicate the results of significance analysis. Figure 2B demonstrates that the heat-sealing strength of the composite films initially increased and subsequently decreased with the extension of heat-sealing time, and peaked (6.78 ± 0.32 N/15 mm) at a heat-sealing time of 3.0 s.
Coatings 12 01929 g002
Figure 3. Comparison between the true value and the predicted value in the response surface model.
Coatings 12 01929 g003
Figure 4. Response surface diagram of the influence of the interaction of various factors on the strength of the heat-sealing. (A) Vacuum time and heat-sealing time interaction; (B) vacuum time and cooling time interaction; and (C) heat-sealing time and cooling time interaction.
Coatings 12 01929 g004
Figure 5. Changes in mechanical properties of Maillard-modified FG-Ara composite films during storage. (a) Tensile strength (TS); (b) elongation at break (EAB).
Coatings 12 01929 g005
Figure 6. Quality change in prepared milk powder during packaging and storage. (A) the infiltration time, (B) the dispersion time, (C) the protein dispersion index and (D) the insolubility index.
Coatings 12 01929 g006
Figure 7. (A) is the composite film oil coating before (left) and after (right) throwing. (B) is the compressed composite film oil packaging sample (left) and filter paper (right).
Coatings 12 01929 g007
Figure 8. Regression analysis of the relationship between temperature and reaction rate of commercial films (A) and fish skin gelatin/L-arabinose (FG-Ara) composite films (B).
Coatings 12 01929 g008
Table 1. Factors and levels in the Box–Behnken test design scheme.
FactorCodeCode Level
−101
Vacuum timeA5.07.09.0
Heat-sealing timeB2.02.53.0
Cooling timeC2.03.04.0
Table 2. Expression of quality function under different reaction orders.
Reaction Order012
Quality function F(A)A–A0Ln(A/A0)L/(n − 1)(A01−n–A1−n)
Table 3. Response surface experimental design and results of the influence of vacuum time, heat-sealing time, and cooling time on heat-sealing strength.
Test NumberA: Vacuum TimeB: Heat-Sealing TimeC: Cool-Down TimeSealing Strength (N/15 mm)
110−16.13
21−106.66
30005.40
4−1016.76
51016.77
6−10−15.55
70006.52
80006.82
901−16.25
100005.39
111106.60
12−1105.10
130116.22
140006.75
150−1−15.85
16−1−106.76
170−115.14
Table 4. Model variance analysis of the influence of vacuum time, heat-sealing time, and cooling time on sealing strength.
SourceSum of SquaresFreedomMean SquareF Valuep-Value
Model6.2390.69115.82<0.0001 **
A1.4411.44240.80<0.0001 **
B0.9310.93155.50<0.0001 **
C0.1810.1829.920.0009 **
AB0.2110.2134.880.0006 **
AC8.10 × 10−318.10 × 10−31.360.2825
BC4.00 × 10−414.00 × 10−40.0670.8033
A20.1510.1525.070.0016 **
B20.2010.2033.990.0006 **
C22.9112.91487.58<0.0001 **
Residual0.04275.97 × 10−3--
Misfit0.03430.0115.37<0.0691
Pure error8.321 × 10−442.08 × 10⁻⁵--
Total deviation6.2716---
Note: ** means extremely significant (p < 0.01).
Table 5. The effect of storage conditions on water vapor permeability (WVP) of fish skin gelatin/L-arabinose (FG-Ara) composite films (g·mm/m2·D·kPa).
Storage ConditionsWVP20dWVP40dWVP60dWVP80dWVP100dWVP120d
RH 43%13.01 ± 4.23 F41.43 ± 10.33 E70.12 ± 15.31 D90.36 ± 18.37 C105.86 ± 20.85 B121.26 ± 22.38 A
RH 54%47.80 ± 0.84 F120.31 ± 2.73 E199.99 ± 4.64 D248.95 ± 5.05 C297.10 ± 3.81 B322.11 ± 4.32 A
RH 65%44.09 ± 8.62 F131.47 ± 11.97 E240.90 ± 19.18 D294.60 ± 29.62 C310.21 ± 30.38 B379.36 ± 18.69 A
4 °C8.16 ± 1.50 E13.81 ± 1.07 E24.17 ± 3.19 D30.01 ± 2.93 C34.17 ± 3.33 B39.57 ± 3.09 A
−17 °C9.82 ± 3.21 F11.42 ± 5.01 E16.73 ± 11.03 D20.61 ± 15.2 C23.53 ± 15.52 B26.95 ± 18.50 A
Note: Capital letters indicate that the WVP of the cross-linked film varies significantly with the storage time (p < 0.05), RH: relative humidity.
Table 6. First-order kinetic equation of peroxide value of oil at different storage temperatures.
Packing MaterialTemperature/°CRegression EquationkR2
BOPP-PE25 °Cy = 0.301e0.02239x0.02666003R2 = 0.9492
4 °Cy = 0.2691e0.0154x0.016804181R2 = 0.9339
−17 °Cy = 0.1827e0.0143x0.014939658R2 = 0.9545
FG-Ara25 °Cy = 0.2502e0.0181x0.119442956R2 = 0.9604
4 °Cy = 0.2634e0.0153x0.017536026R2 = 0.9379
−17 °Cy = 0.1916e0.0155x0.015662590R2 = 0.9580
Note: BOPP-PE: biaxially oriented polypropylene (BOPP)-polyethene (PE), FG-Ara: fish skin gelatin/L-arabinose.
Table 7. Corresponding relationship between temperature and oxidation rate of soybean oil encapsulated by biaxially oriented polypropylene-polyethene (BOPP-PE) film and fish skin gelatin/L-arabinose (FG-Ara) film.
Packing MaterialTemperature/°C (K)1/TLnk
BOPP-PE25 °C (298.15)0.0033540−3.624589842
4 °C (277.15)0.0036082−4.015846265
−17 °C (256.15)0.0039039−4.379312057
FG-Ara25 °C (298.15)0.0033540−3.916675848
4 °C (277.15)0.0036082−4.043497866
−17 °C (256.15)0.0039039−4.156480185
Table 8. Validation results under natural conditions.
Packing MaterialPOV (mmol/kg)Actual Storage Time (d)Estimated Days (d)SE
BOPP-PE0.40 ± 0.172024.470.18
0.52 ± 0.063033.600.10
0.68 ± 0.064042.890.06
FG-Ara0.31 ± 0.102023.780.15
0.39 ± 0.093034.430.12
0.42 ± 0.054043.320.07
Note: BOPP-PE: biaxially oriented polypropylene (BOPP)-polyethene (PE), FG-Ara: fish skin gelatin/L-arabinose, POV: peroxide value.
Table 9. Maximum shelf life of different packaging materials.
Packing MaterialStorage Temperature (°C)Estimated Storage Time (d)
BOPP-PE25148.4084351
4210.1593997
−17314.9964312
FG-Ara25196.8612664
4219.8575097
−17250.0089675
Note: BOPP-PE: biaxially oriented polypropylene (BOPP)-polyethene (PE), FG-Ara: fish skin gelatin/L-arabinose.
Publisher’s Note: MDPI stays neutral with regard to jurisdictional claims in published maps and institutional affiliations.