Article

Study on Using Microbubbles to Reduce Surface Damage of Mercury Target for Spallation Neutron Source

1
College of Physics and Mechanical Engineering, Longyan University, Longyan 364000, China
2
Proton Accelerator Research Complex, Japan Atomic Energy Agency (JAEA), Tokai 319-1195, Ibaraki, Japan
3
Key Laboratory E&M, Zhejiang University of Technology, Hangzhou 310014, China
4
Golden Dragon Rare-Earth Co., Ltd., Changting 366300, China
*
Author to whom correspondence should be addressed.
Coatings 2022, 12(12), 1960; https://doi.org/10.3390/coatings12121960
Submission received: 1 November 2022 / Revised: 30 November 2022 / Accepted: 10 December 2022 / Published: 14 December 2022
(This article belongs to the Special Issue Surface Treatments for Stainless Steels)

Abstract

:
A liquid mercury target, which is used to explore the neutrons produced by spallation reactions, has been installed at the Materials and Life Science Experimental Facility (MLF) in the Japan Proton Accelerator Research Complex (J-PARC). As the proton beams bombard the target, pressure waves are generated on the interface between liquid and solid metals due to thermal shock. The negative-pressure-induced cavitation causes severe pitting damage to the vessel surface of the mercury target. To reduce the surface damage of the mercury target and prolong its service life, we developed vibratory horn experiments in bubbly water. In this study, the effect of microbubbles on cavitation damage on the workpiece surface was investigated using ultrasonic erosion tests. Experimental results showed that surface damage was significantly reduced under the condition of injecting microbubbles. Additionally, we developed a simulation code to analyze the change in pressure waves in the water. The analysis results showed that the pressure amplitude of the pressure waves was significantly reduced under the condition of injecting microbubbles, and the fluctuation of the pressure waves became more regular when injecting microbubbles. We also found that the pressure amplitude of the pressure waves was decreased with a decrease in the diameter of the microbubbles.

1. Introduction

Research into various types of radiation utilization technology is essential for the development of science and technology. Currently, secondary particles, such as neutrons, antiprotons, K mesons, π mesons, and neutrinos tertiary particles, are used in research fields, such as high-energy physics, nuclear physics, energy science, material science, and medicine. A mercury target has been installed at the Materials and Life Science Experimental Facility (MLF) in the Japan Proton Accelerator Research Complex (J-PARC) by Futakawa et al. [1,2].
In the past, the liquid metal mercury target has been adopted in conventional spallation neutron sources (SNSs), which has been used in the USA and Japan [3]. However, because a proton beam at MW level enters the target in the J-PARC, the spallation neutron source not only has the function of a target, but it is also filled with mercury as a liquid metal from the point of view of improving the cooling effect [4]. However, at the moment the protons bombard in mercury, thermal shock is generated in mercury and pressure waves are induced. Then, aggressive cavitation generates in mercury with pressure-wave propagation. With the recovery of the pressure, the generated microjet causes damage on the wall of the vessel when the bubble collapses, which affects the structural soundness of the vessel [5,6]. Specially, the mercury vessel is most affected by the generated microjet, so the service life of the vessel is less than half a year (2500 h) [7].
The USA has also imported a nuclear spallation neutron source with a high-power proton beam, and the high power of the beam has been studied and tested. They used a vessel with a double-wall structure to improve the cooling effect and to reduce the damage effect of the spallation neutron source. McClintock et al. removed samples from SNS target vessels after service and observed the surface damage [8,9]. They also obtained the result that the damage of the narrow channel with double walls was significantly less than that of the bulk side. Recently reported research results show that gas injection effectively mitigated erosion damage and reduced strain in SNS target vessels [10]. On the other hand, Riemer et al. conducted a proton-beam incident experiment equivalent to 1MW at the Weapon Neutron Research Facility (WNR) in Los Alamos National Research Institute, and they further reported that the damage to the top and bottom was greater than that to the front plate in the double-wall structure through a series of experiments [11,12].
To mitigate damage to the wall of the vessel, the two following approaches are proposed: the protection of the vessel wall and the suppression of the pressure waves. The former involves the hardening of the target vessel wall, and the latter involves the softening of mercury. In this study, a microbubble injection into mercury is expected to absorb the thermal expansion and attenuate pressure-wave propagation. Thus, in order to quantitatively investigate the effect of microbubbles on microsecond-scale cavitation, the simulation experiments of cavitation damage were performed using a vibratory horn in bubbly water.

2. Experimental Procedure
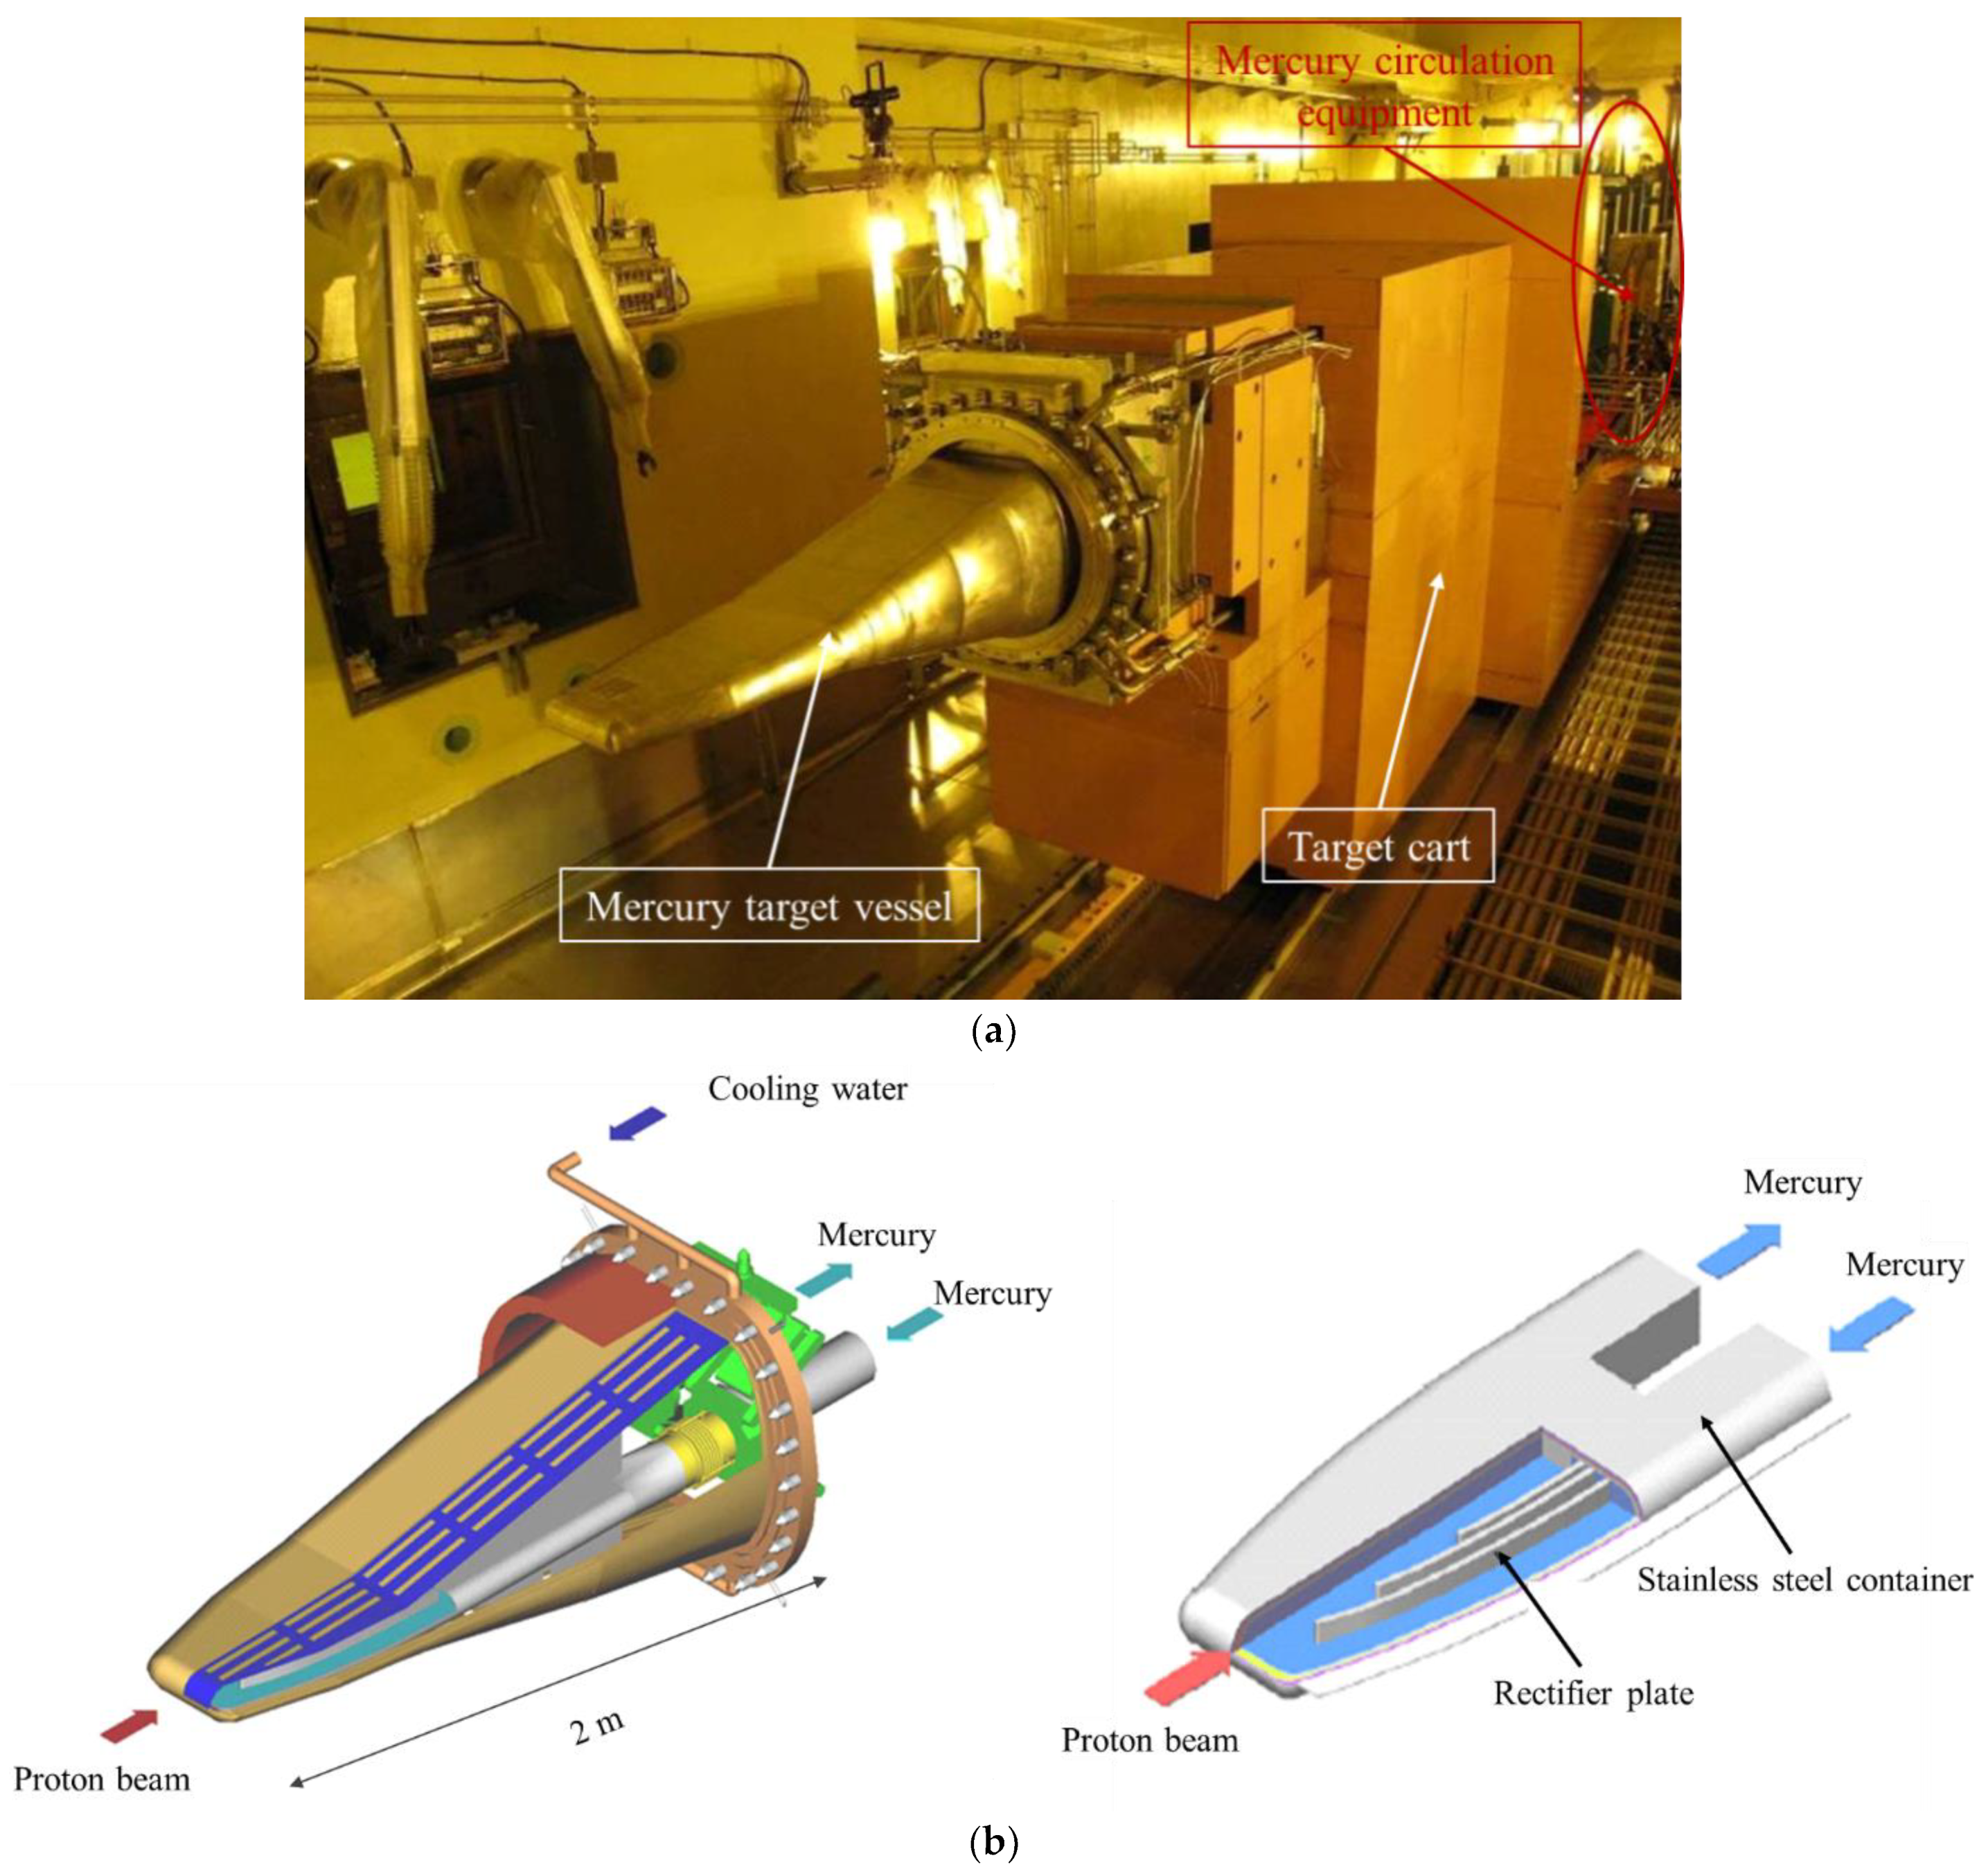
2.1. Mercury Target

The object of diagnostic technology in this research is the mercury target vessel installed in the MLF, which is a part of the mercury target system as shown in Figure 1a. The mercury target system consists of a mercury target container, a target cart, and a mercury circulation system. The mercury target system is 2.6 m in width, 12.2 m in length, and 4 m in height, and it is set on the workbench (track platform). The total weight of the mercury target system, including the weight of mercury, is 290 T [13,14].
The mercury target vessel has a three-layer structure consisting of a mercury vessel and a double-layer safety hull as shown in Figure 1b. Mercury circulates in the mercury vessel, helium gas circulates between the mercury vessel and the safety hull, and heavy water circulates in the safety hull of the double vessel structure. Each vessel is cooled by the circulation of mercury and heavy water. In addition, helium gas around the mercury container is constantly detected by the electric mercury-leaking sensor. As such, it is possible to detect the leakage of minuscule amounts of mercury caused by breakage in the mercury container. Mercury flows along six guide vanes in the mercury target, crossing the proton beam incident on the tip of the target (beam window). The guide vane also has the function of supporting the mechanical strength of the mercury container.

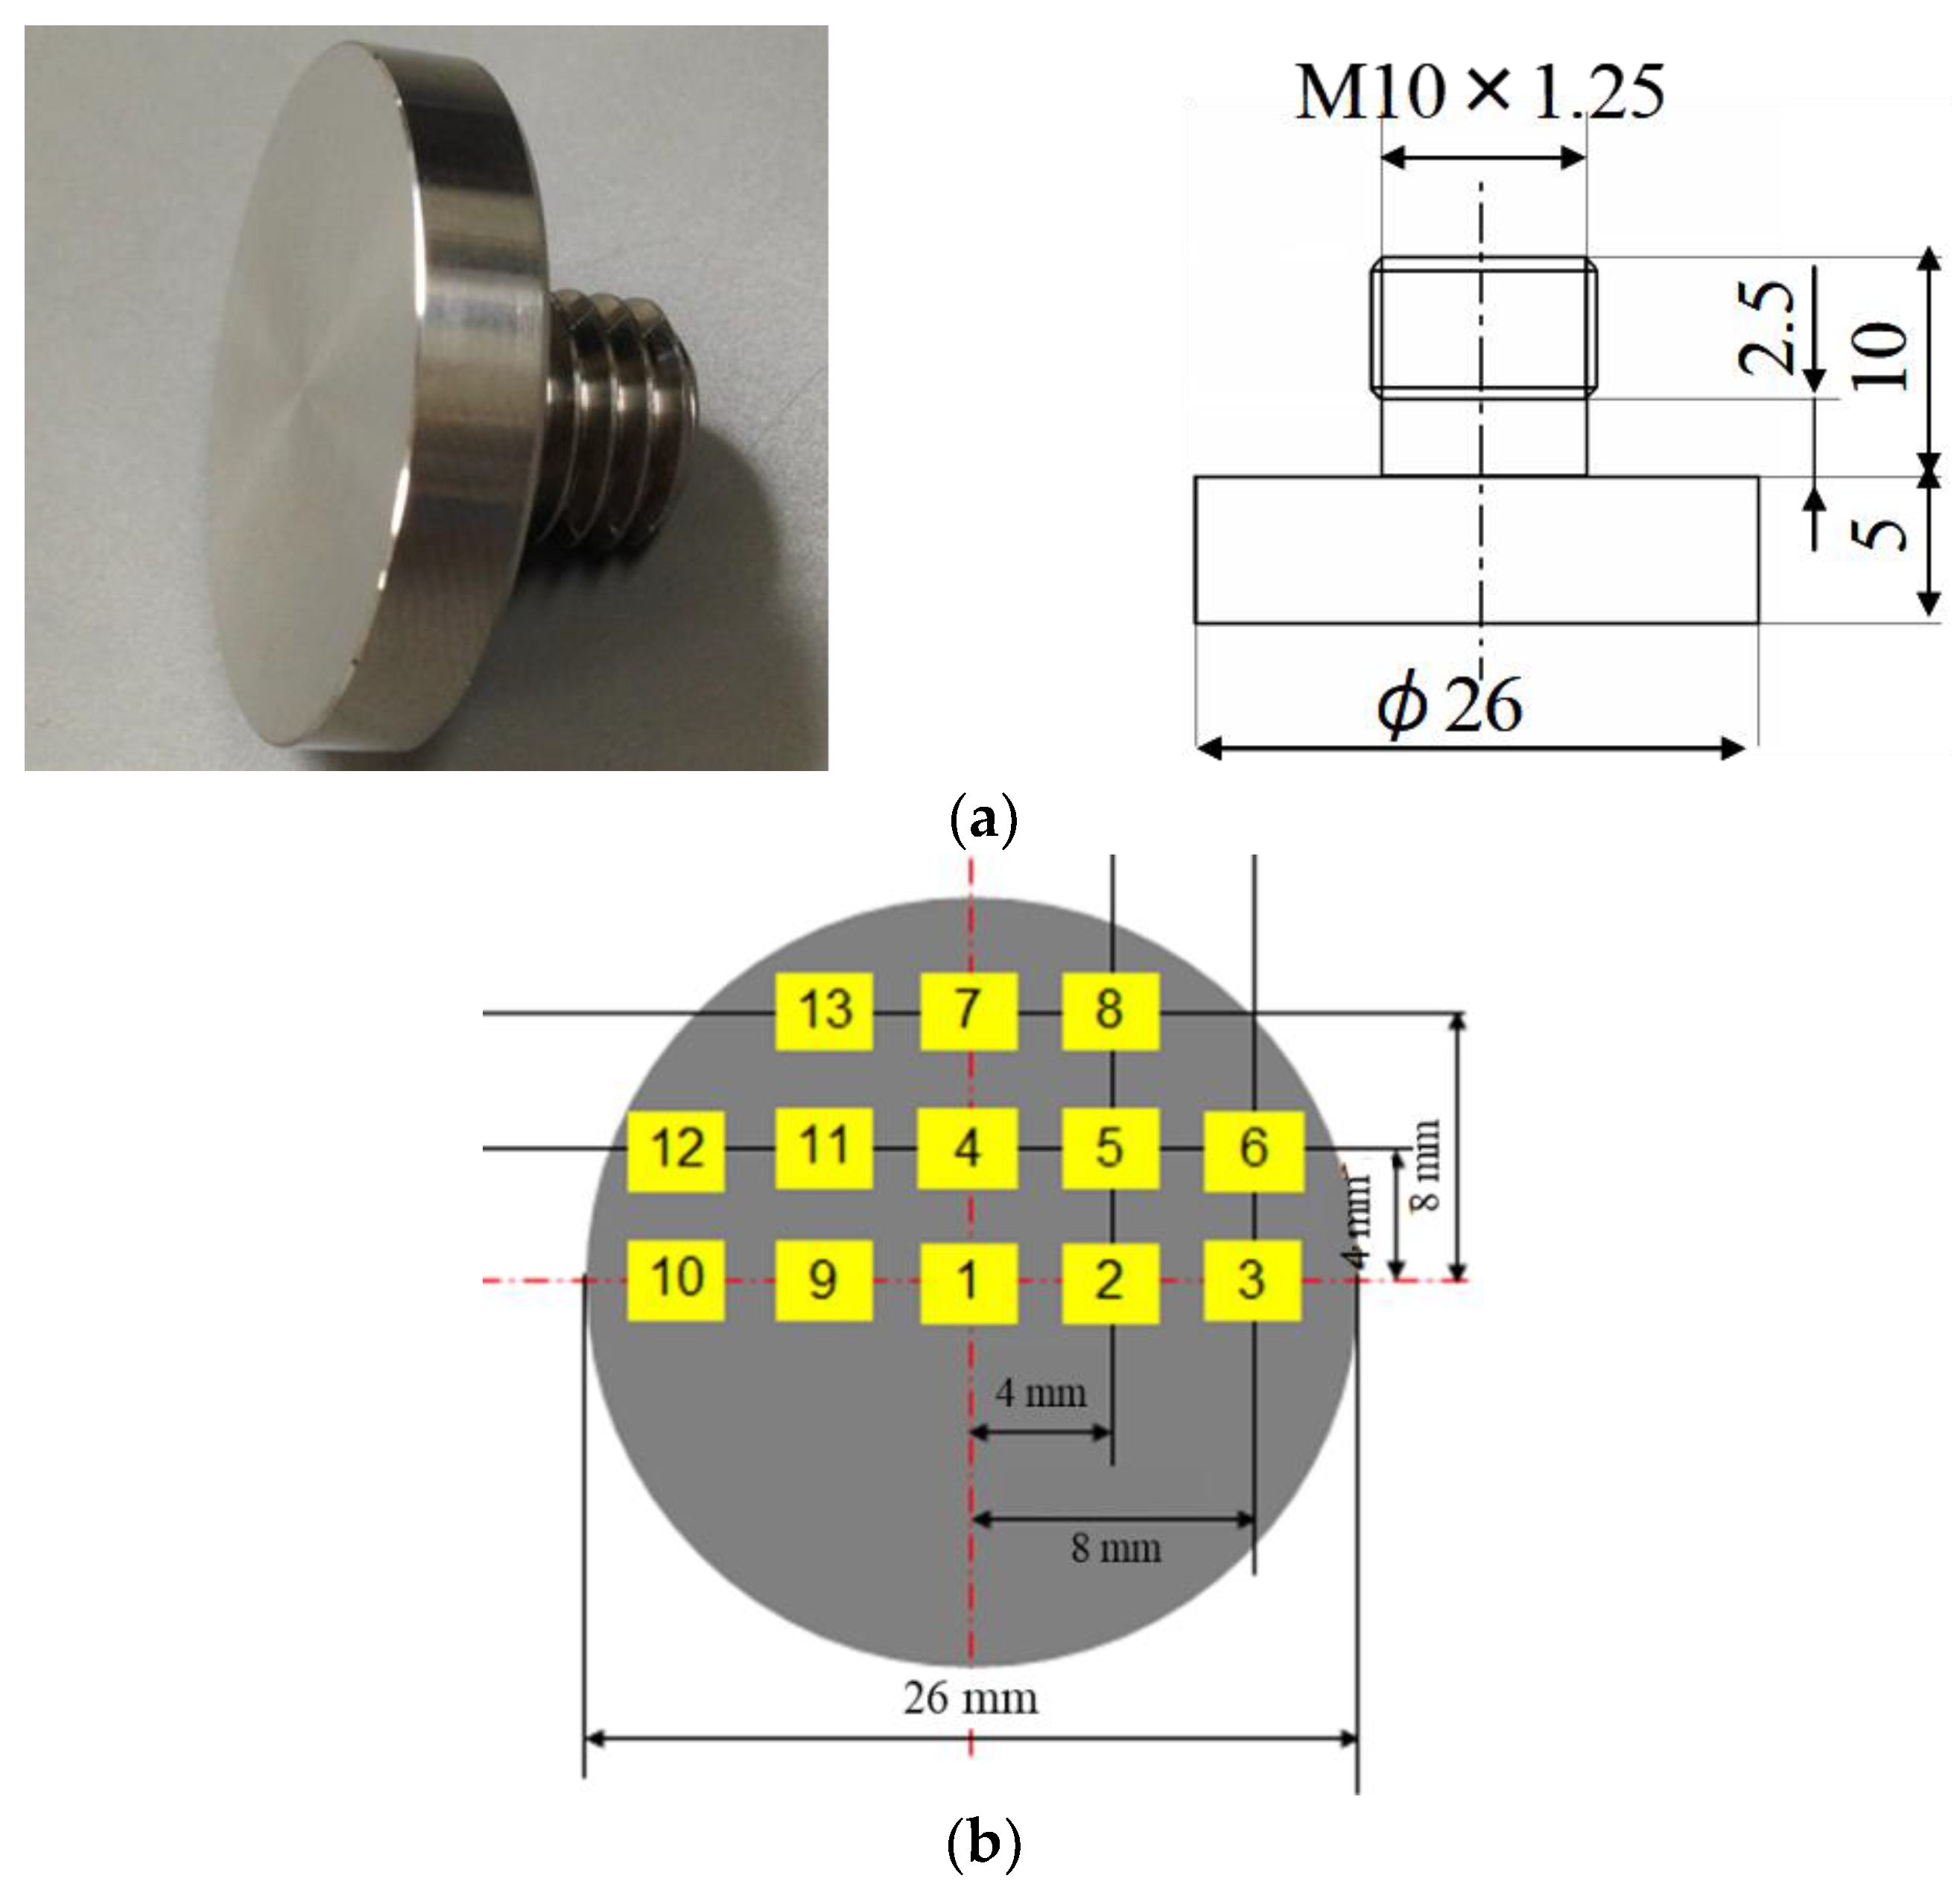
2.2. Experimental Specimen

In this research, the specimen was polished by a grinder, and a mirror-polished surface (less than 1 μm) was obtained before the experiment. The appearance and basic dimensions of the workpiece specimen are shown in Figure 2a. Because the surface of the sample with cavitation damage was uneven, it was difficult to observe the surface state with an optical microscope. Therefore, we used a laser microscope (Keyence VK-9510, Osaka, Japan) to take all-focus images and compare the degree of damage. In addition, because the laser microscope can obtain three-dimensional information of the sample, the unevenness of the sample surface was measured as a depth profile. After each step, we observed the damage of the fixed points on the workpiece surface. All of the observed points are shown in Figure 2b.

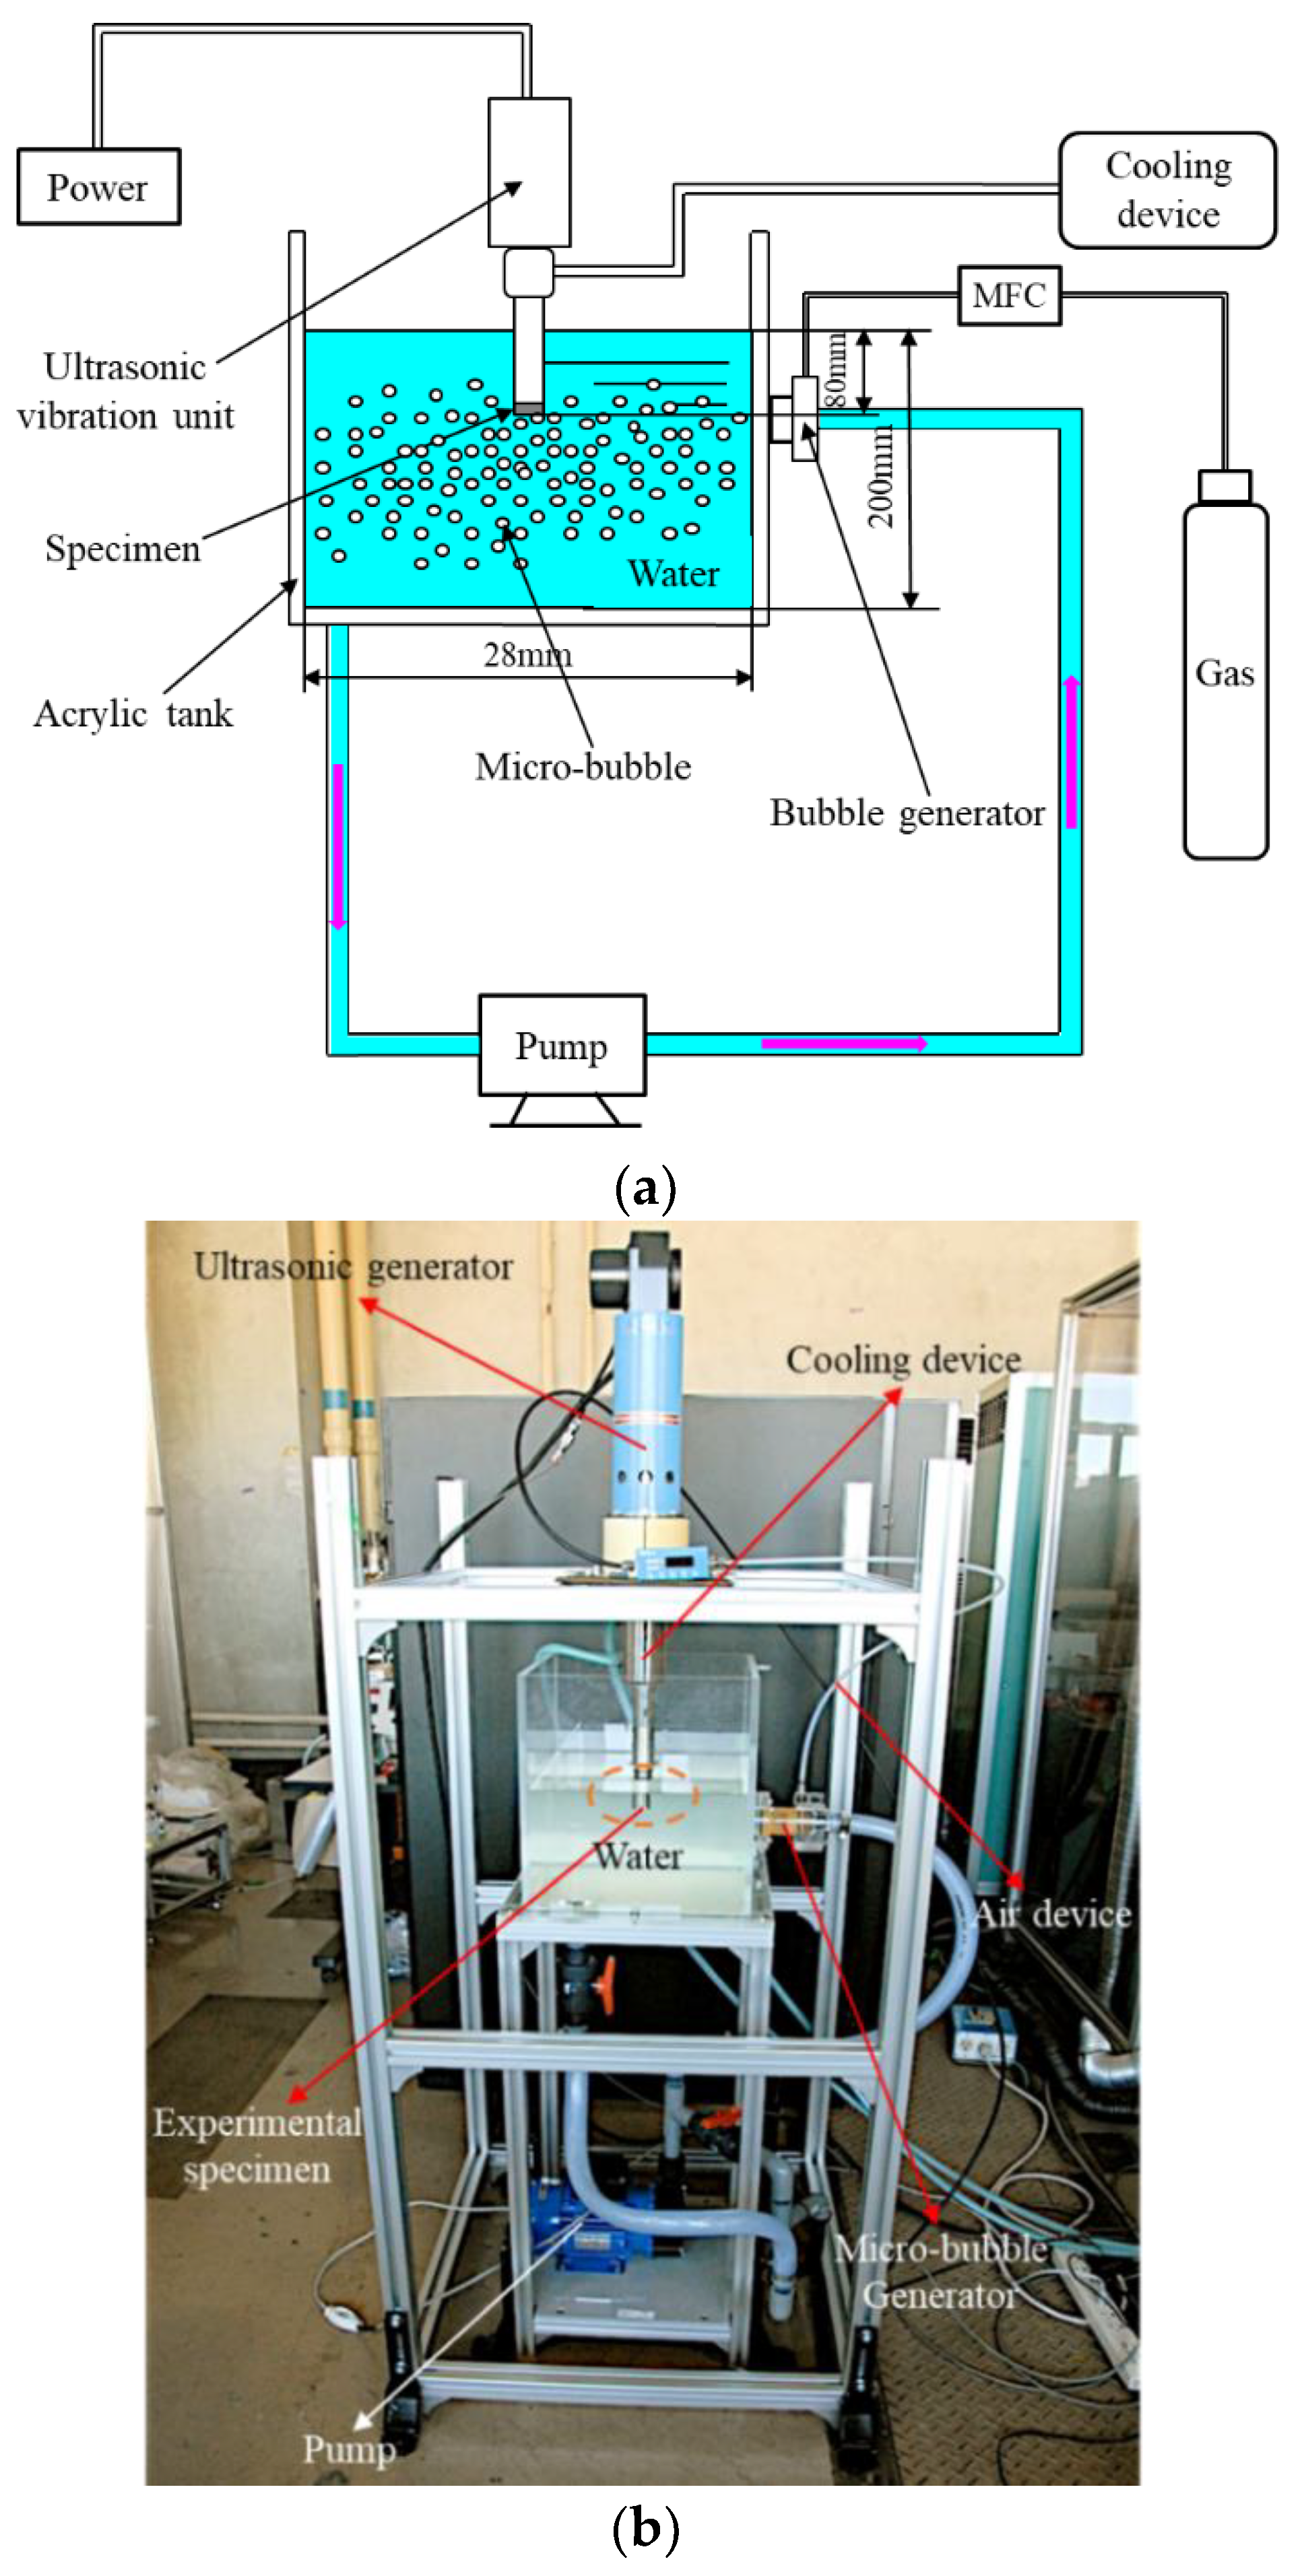
2.3. Experimental Setup and Experimental Proceed

In order to explore the effect of microbubbles on cavitation damage on the workpiece surface, an experiment of ultrasonic erosion was performed to generate ultrasonic cavitation in water (room temperature) by using a vibratory horn as shown in Figure 3. The experimental specimen was fixed on the tip of the vibratory horn through a threaded shank. The tip of the vibratory horn oscillated at a constant frequency of 20 kHz with a peak-to-peak vibrational amplitude of approximately 22 μm. The microbubble generator was composed of a gas flowmeter (MODEL8500.), a pump (CPM-250FU-B), and a water tank. Microbubbles were formed by injecting gas into the flowing water, so the status of the generated bubbles mainly depends on the flow rate of the liquid and gas. In order to investigate the microbubble distribution under various conditions, an image of the microbubbles was taken using a high-speed camera, and then the obtained image of the microbubbles was 2D-processed. Finally, the frequency of the microbubbles with a different radius was counted from the 2D-processed image. The two-dimensional image-processing procedure is shown in Figure 4. In order to compare the effect of the liquid state on cavitation damage, cavitation damage tests were performed under various conditions of stagnant water, flowing water without injecting gas, and flowing water with injecting gas (hereinafter called bubbling). After the tests, the specimen surfaces were observed at 13 locations as shown in Figure 2b, and the surface roughness was measured through a laser microscope.
According to the ultrasonic horn experimental conditions (various gas-flow rates in water), a numerical simulation code developed by other members of the same team was applied to prove the effect of injected microbubbles on the suppression of the pressure waves and to explore the suppression effect of the microbubbles with different diameters on the pressure waves.

2.4. Experimental Conditions

The detailed experimental conditions are shown in Table 1. A button-shaped workpiece, 26 mm in diameter and 5 mm in thickness, was used in the experiments, and the material of the specimen was austenitic stainless steel SUS316, which is same as the material of the target container [15]. A constant frequency of 20 kHz from the vibratory horn was exerted on the workpiece surface. The working conditions were stagnant water, flowing water, and bubbling water. The flowing rates of the water and air were, respectively, 75 L/min and 4 L/min (or 5 L/min) by adjusting the water-flow valve and gas-flow meter. The exposure time of cavitation was selected as 1, 3, 5, and 10 min to compare the damage difference in the different experimental conditions, referred to as the incubation period.

3. Results

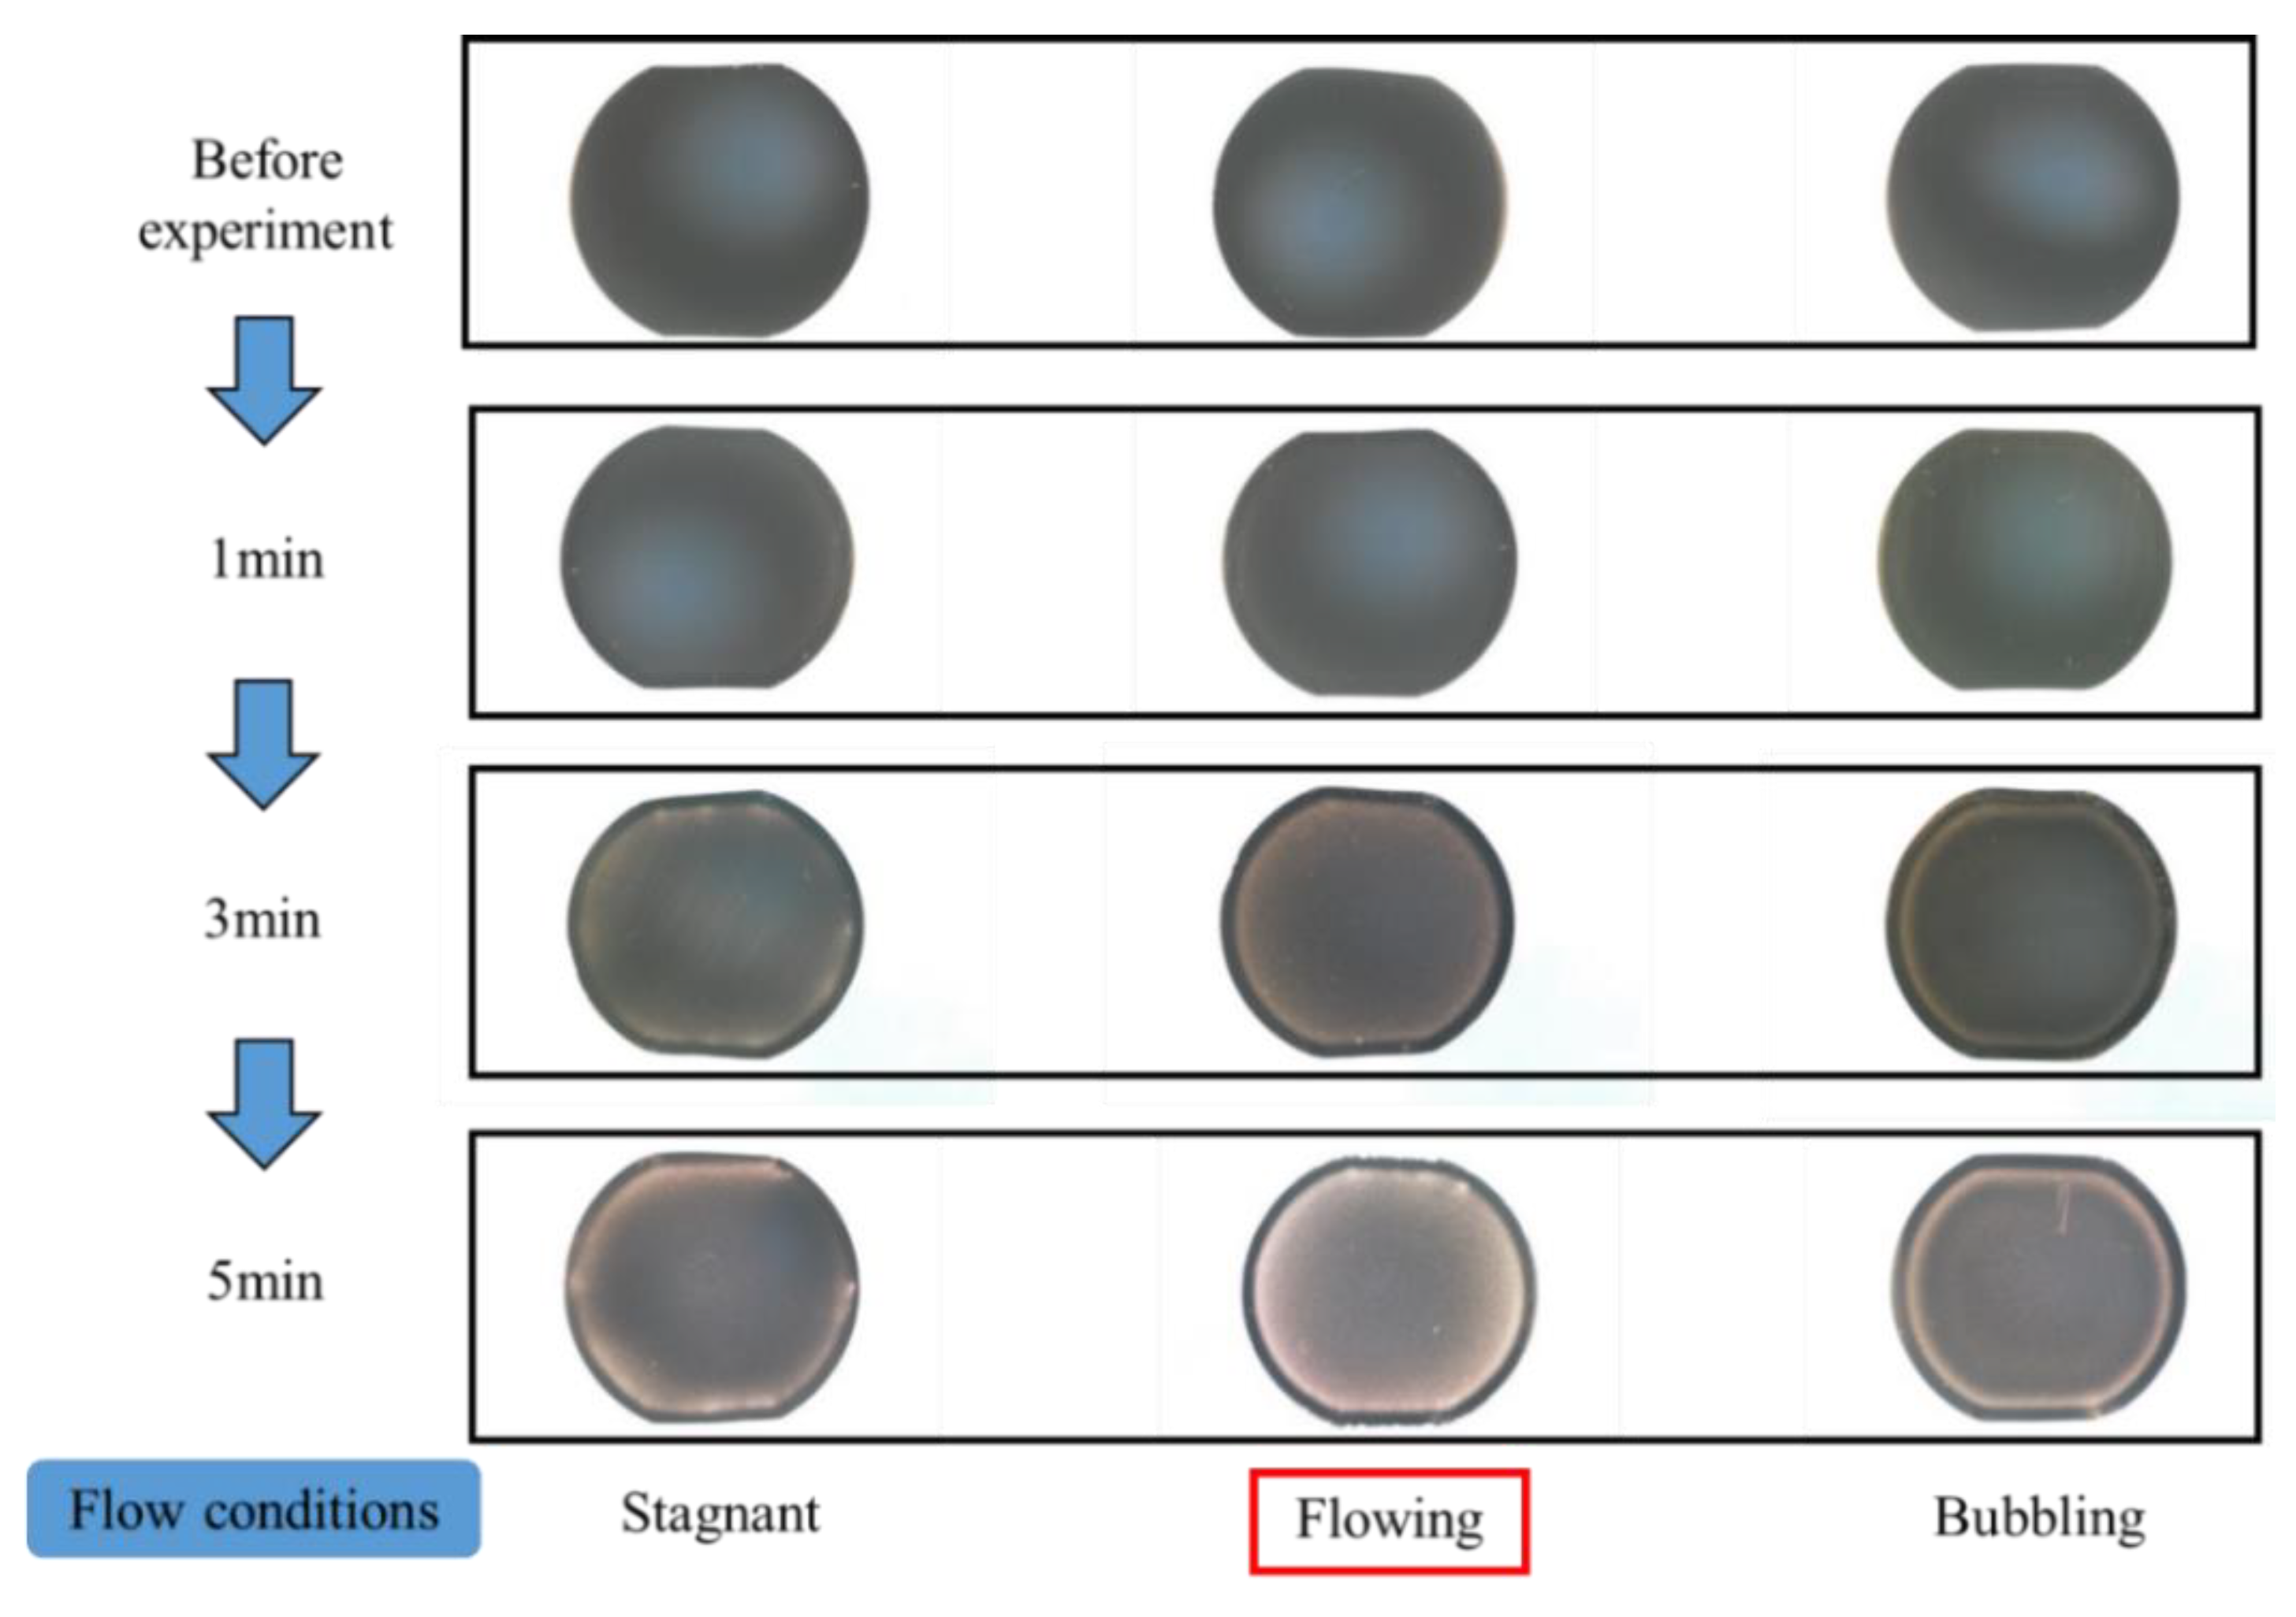
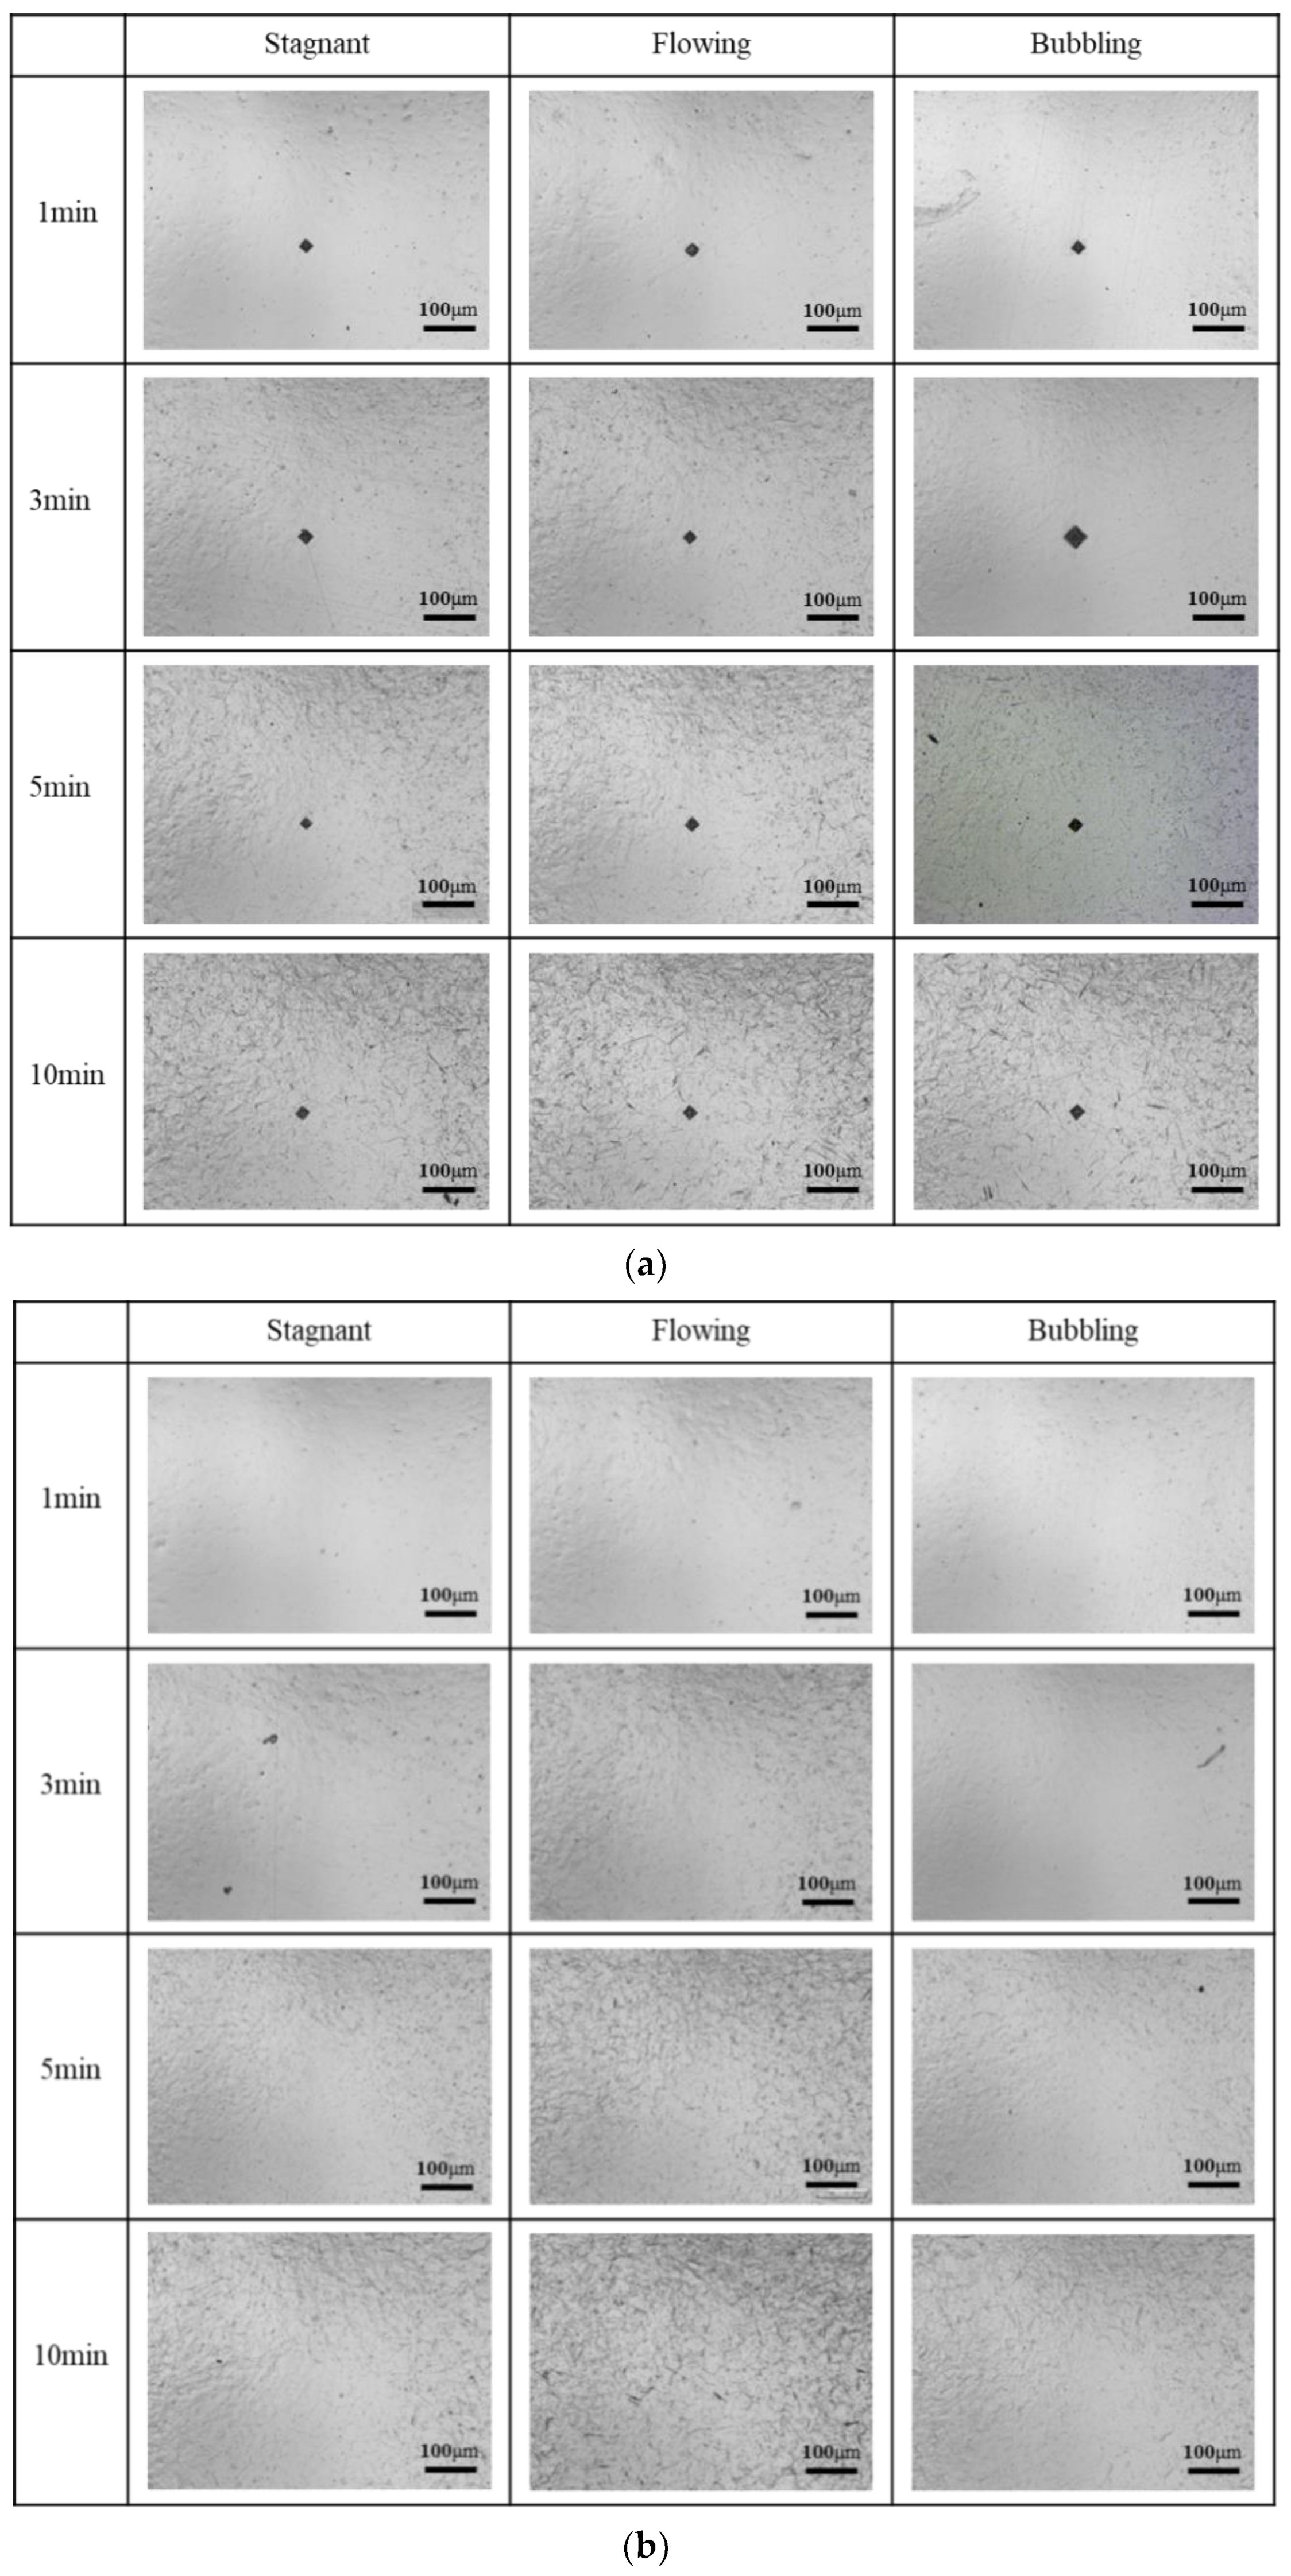
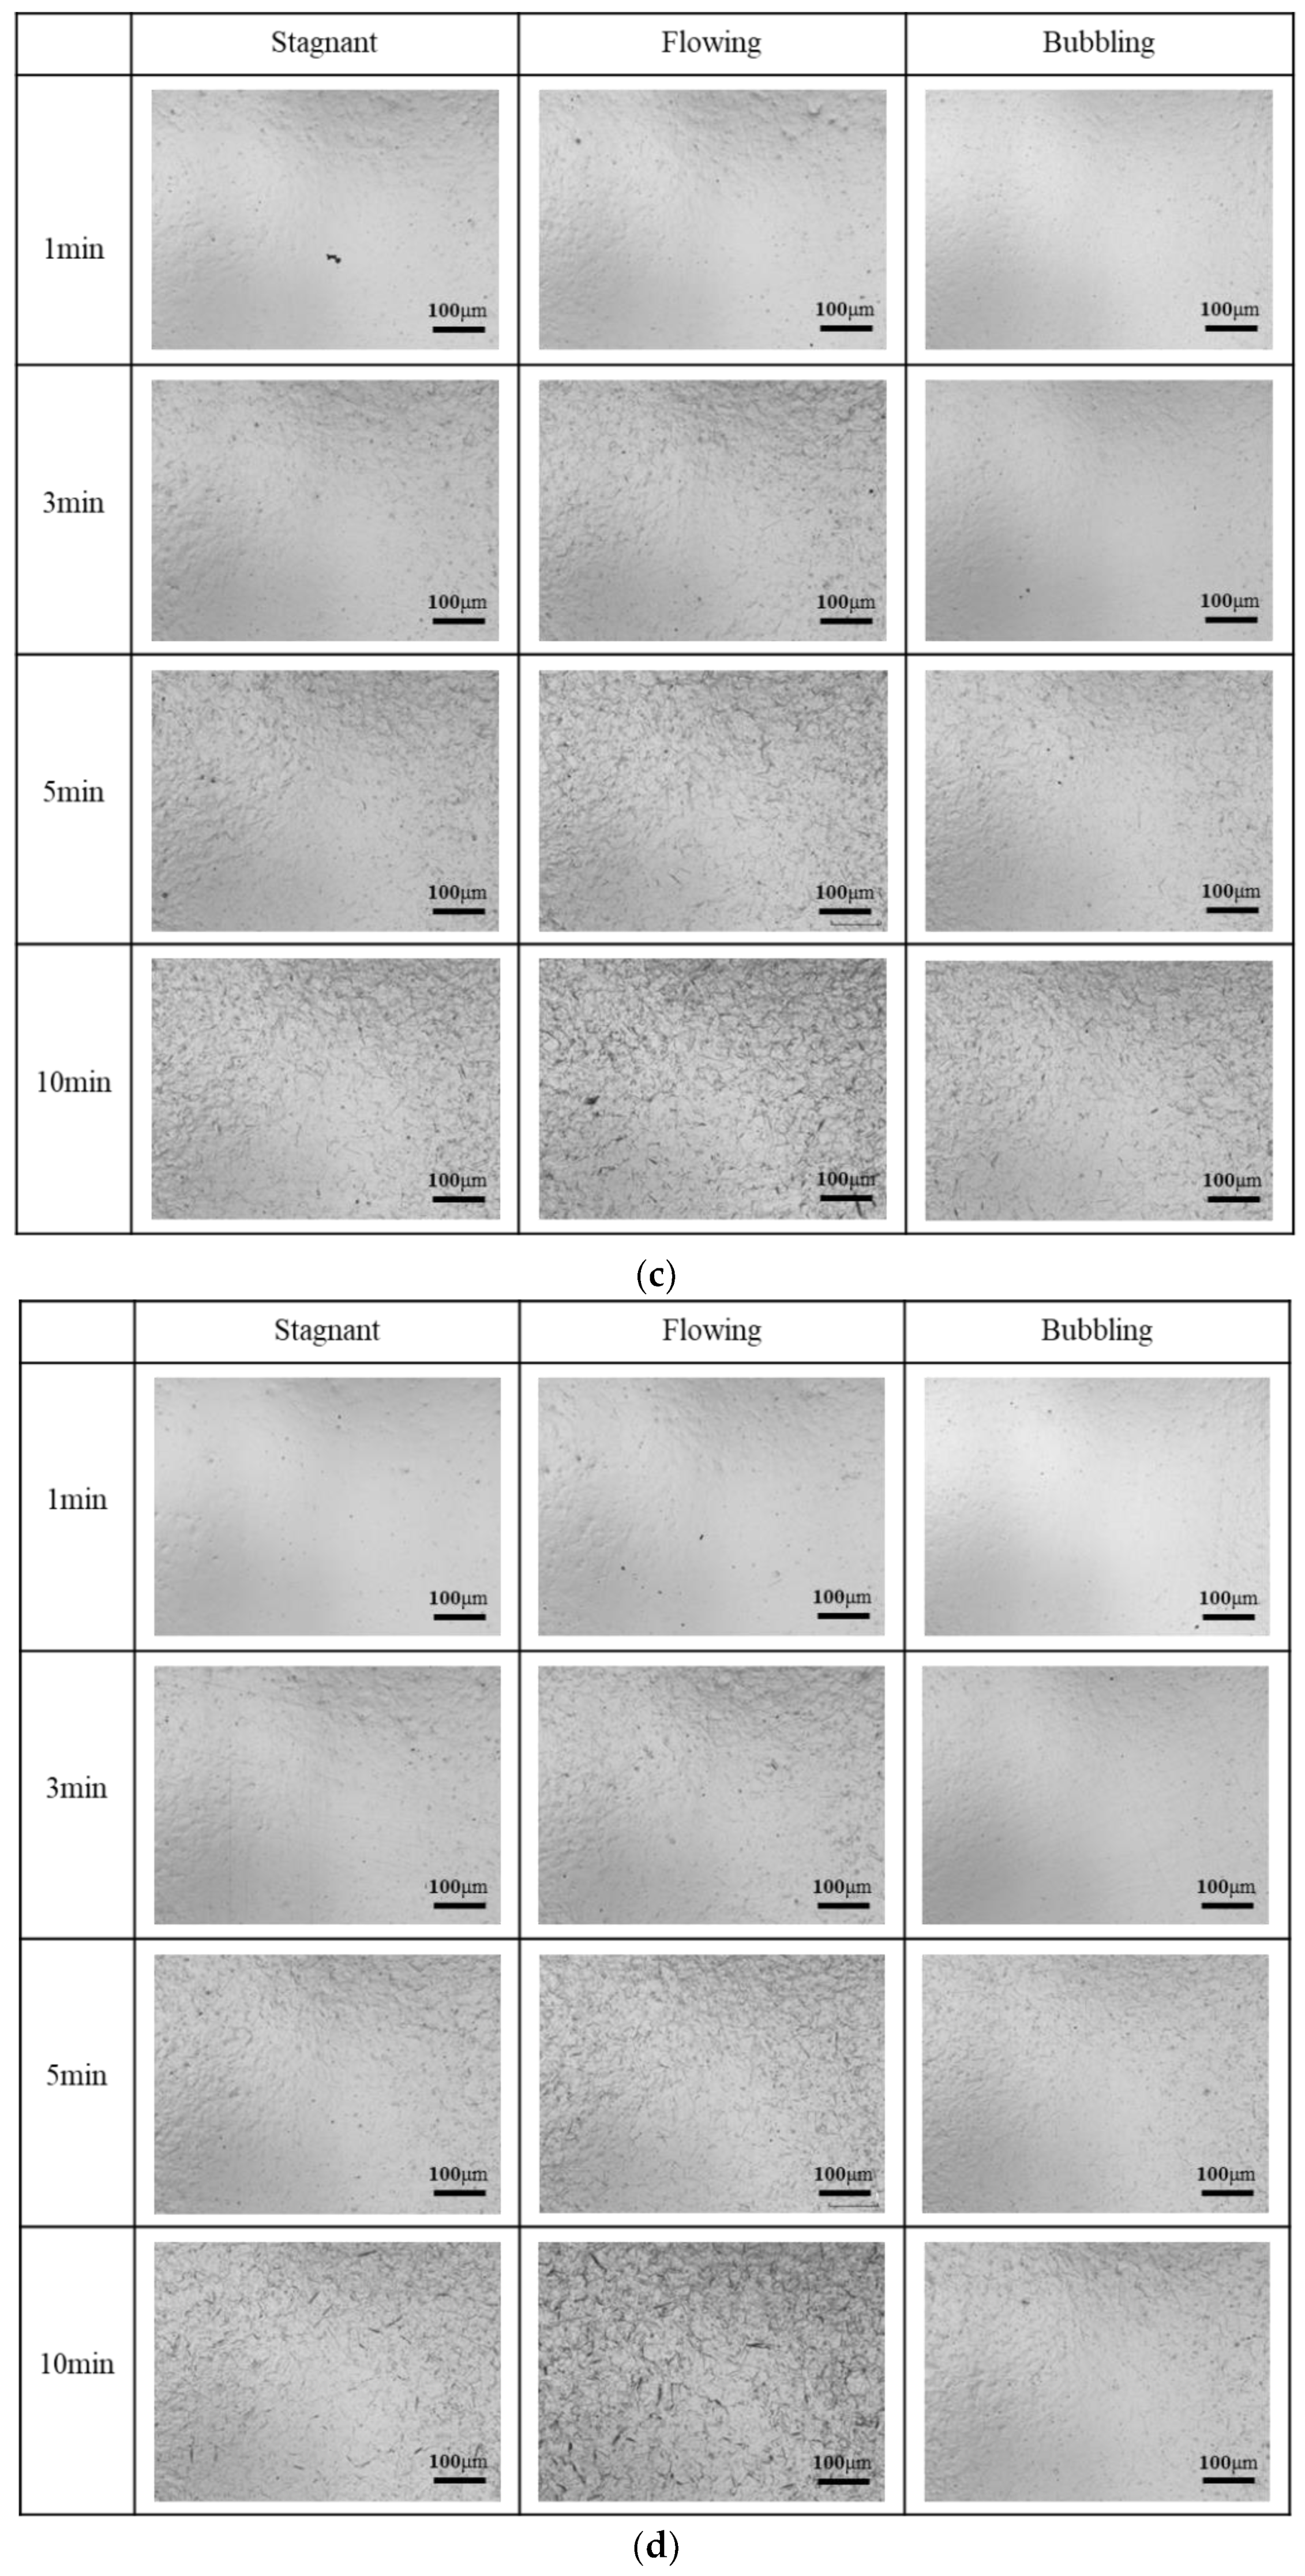
3.1. Surface Damage in Three Different Experimental Conditions

Figure 5 shows that the surface photographs of the test piece were taken with a laser microscope under each experimental condition. As the experimental times increased, it was confirmed that the mirror-polished surface of the specimens lost their gloss in the same working condition. The specimen surface tended to lose gloss during 3 min experiments because the cavitation damage formed on the specimen surface. The specimen surface also significantly lost gloss during 5 min experiments in various working conditions. Additionally, the degree of losing gloss was the most serious under the working condition of flowing water.
Figure 6 shows the macroscopic confocal images of the damaged surfaces at point 1 (Figure 6a), 3 (Figure 6b), 7 (Figure 6c), and 10 (Figure 6d) under different experimental conditions obtained by a laser microscope. It was seen that the number of pits was highest in the flowing case. In other words, the damage degree of the specimen surface was most serious in the flowing case. Additionally, it was recognized that the damage degree of the specimen surface in the bubbling case was slightly better than that in the stagnant case.
Finally, in order to quantitatively compare the difference in damage among the three kinds of conditions, we measured the surface roughness RZ of the specimen (maximum height: JIS B 6001-2001, captured field of 281 × 210 μm2) from images which were taken with a laser microscope and compared the surface roughness RZ of the specimen under the three different working conditions. Figure 7 shows the change in surface roughness RZ as a function of exposure time under various working conditions. The surface roughness RZ refers to the average surface roughness of 13 locations. It was recognized that the surface roughness RZ under the bubbling case was remarkably smaller than that of the stagnant case during 3, 5, and 10 min tests. Moreover, the largest roughness was observed in the flowing case. However, in the case of any 1 min test, it was difficult to discriminate the damage difference from the surface roughness RZ because the number of pits was small in each case.
In the bubbling case, injected microbubbles were deposited in the negative pressure region and cavitation bubbles remained around the specimen. The bubbles might act similarly to the injected microbubbles to absorb negative pressure, which generated cavitation. However, in the flowing case, deposited bubbles might flow off as a result of the water flow. Therefore, it can be regarded that the most severe damage was observed in flowing case. From the experimental results, it was confirmed that microbubble injections had a better cavitation-reduction effect.

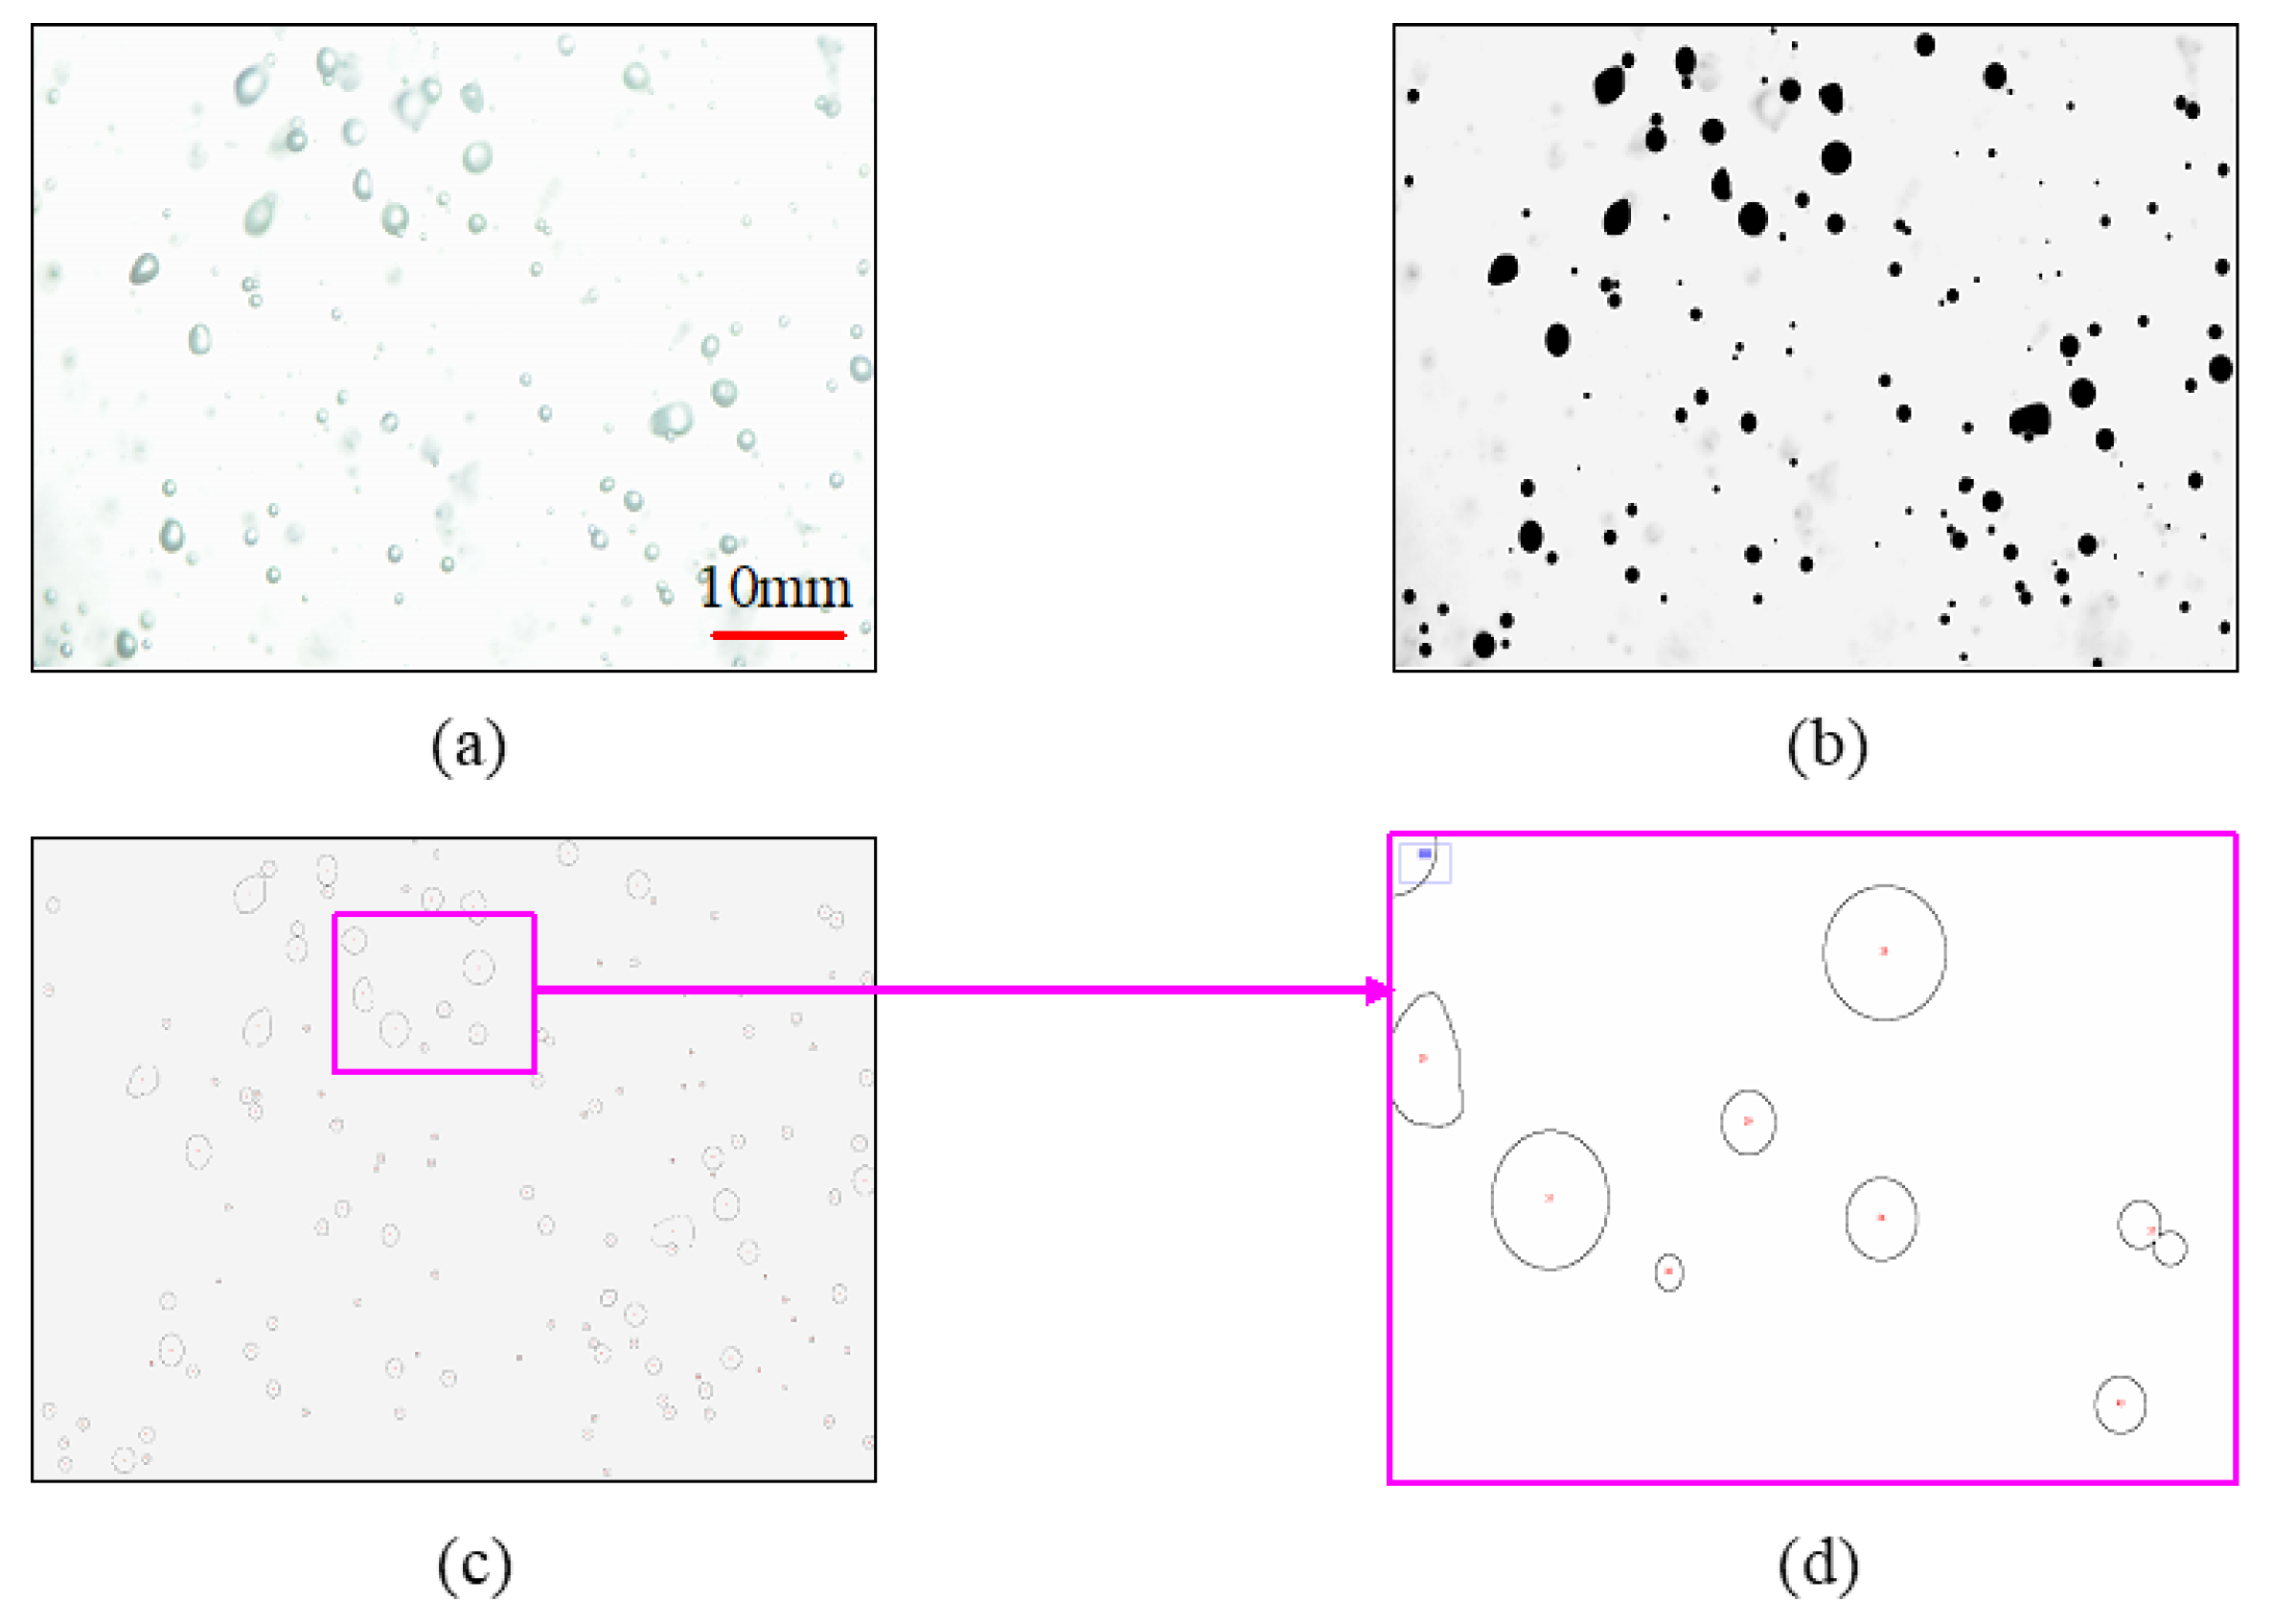
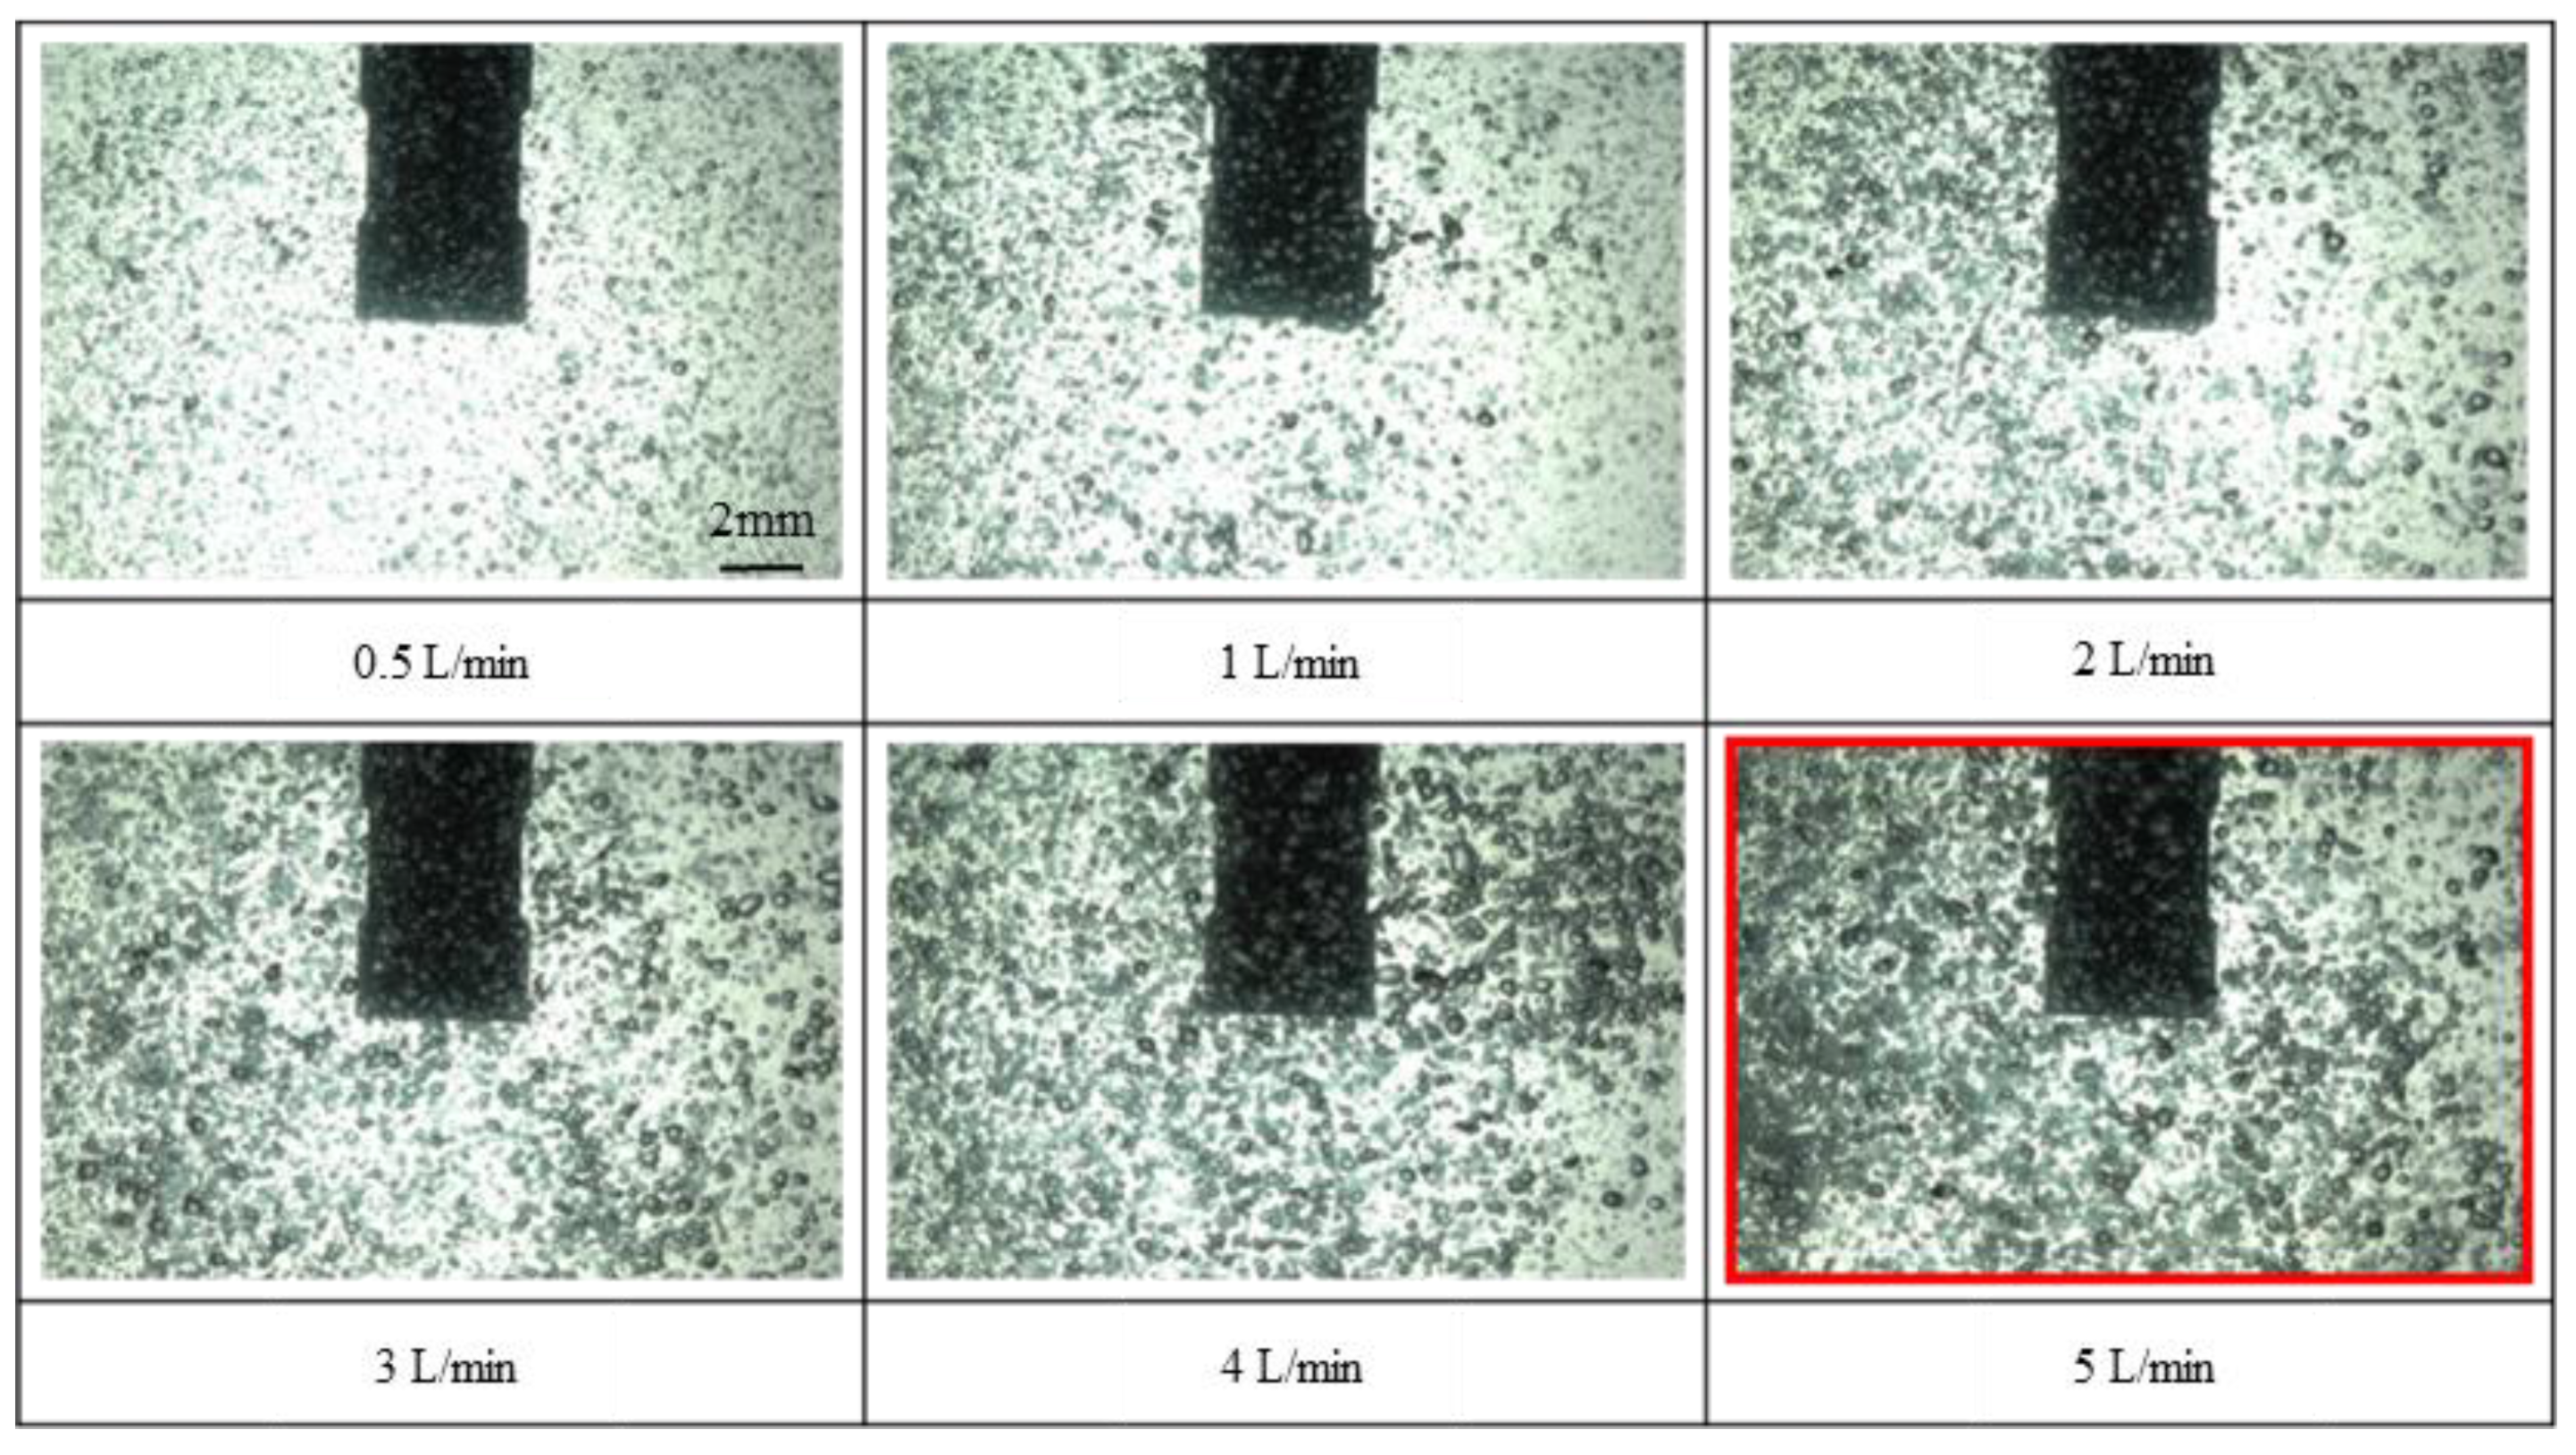
3.2. Investigations on the Amount and Size of Microbubbles

In this study, it was vital to examine the number and distribution of microbubbles with a different air-flow rate. The number of bubbles was counted from the image which was taken using the high-speed camera. Figure 8 shows the status of the microbubbles with different air-flow rates. It was confirmed that the number of microbubbles increased, and the distribution of microbubbles became dense with an increase in the air-flow rate.
From Figure 8, it can be seen that the number of microbubbles at the 4 and 5 L/min air-flow rate was obviously more than that under other conditions. Thus, the number and size of the microbubbles were quantitatively counted by the binary processing of the image near the specimen. Figure 9 shows that the number of microbubbles was near the specimen with different diameters when the air-flow rate was 4 and 5 L/min. The total number of microbubbles was 87 at the 4 L/min air-flow rate, and the number of microbubbles with a diameter of less than 30 µm was 45. However, the total number of microbubbles was 143 at the 5 L/min air-flow rate, and the number of microbubbles with a diameter of less than 30 µm was 86. Both the total amount of microbubbles and the number of microbubbles with a diameter of less than 30 µm at the 5 L/min air-flow rate were nearly twice of that at the 4 L/min air-flow rate.

3.3. Effect of Flow Rate on the Surface Damage

Figure 10 shows the surface damage at various points under the experimental conditions of different flow rates. By comparing the images of surface damage under the two different conditions, it can be seen that the number of pits at the 5 L/min air-flow rate was obviously less than that at the 4 L/min air-flow rate when the test time was 5 min. However, the number of pits at the 4 and 5 L/min air-flow rate were almost the same when the test time were 1, 3, and 10 min.
Meanwhile, we also measured the surface roughness RZ of the specimen from images and compared the surface roughness RZ of the specimen under the two different conditions. The change in surface roughness RZ as a function of exposure time in the bubbling condition with different air-flow rates are shown in Figure 11. It was confirmed that the surface roughness RZ at the 5 L/min air-flow rate was slightly smaller than that at the 4 L/min air-flow rate when the test time was 5 min. In addition, it was also seen that there was little difference in surface roughness RZ at 4 and 5 L/min air-flow rate when the test time were 3 and 10 min.

4. Discussion

In order to explain that the effect of dispersed microbubbles surrounding the specimen on microsecond-scale pressure waves, a numerical simulation code for pressure waves was developed by the team members [16,17]. We used this code to simulate the effect of microbubbles on suppressing pressure waves and analyze the suppression effect of microbubbles with different diameters on pressure waves. The comparison of pressure waves under the conditions of no bubbles and microbubbles is shown in Figure 12. Compared with the pressure amplitude of the pressure wave under the condition of no bubbles, the pressure amplitude of the pressure wave was significantly reduced under the condition of injecting 100 μm microbubbles, and the fluctuation of the pressure wave became more regular when injecting microbubbles.
Figure 13 shows the change in microsecond-scale pressure waves with different sizes of microbubbles. The response time was set to 100 µs in the numerical simulation code. The results revealed that the pressure of the pressure wave decreased with a decrease in the bubble diameter. The max pressure amplitude of the pressure wave was 0.2 MPa when injecting 10 μm microbubbles, and the max pressure amplitude of the pressure wave was nearly equal (approximately 1.5 MPa) when injecting 70 μm and 100 μm microbubbles. Compared with the pressure amplitude of the pressure wave when injecting 70 μm or 100 μm microbubbles, the pressure amplitude of the pressure wave was reduced by 17 times when injecting 10 μm microbubbles.

5. Conclusions

In order to investigate the effect of microbubbles on microsecond-scale negative pressure, which generated cavitation, this study quantitatively evaluated the effect of microbubbles through vibratory horn experiments in bubbly water and developed simulation. The cavitation damage tests in bubbly water were conducted using the vibratory horn in order to investigate the effect of microbubbles on microsecond-scale negative pressure, which generated cavitation. The experimental results showed that the cavitation damage on the specimen surface was markedly reduced in the microbubble case. Furthermore, the effect of dispersed microbubbles surrounding the specimen surface on the microsecond-scale pressure waves was analyzed using the developed numerical simulation code. The main conclusions are summarized as follows:
  • It was confirmed that the method of microbubble injection was able to mitigate damage on the specimen surface by comparing the images of surface damage and surface roughness.
  • The distribution of microbubbles and the number of microbubbles with different sizes of diameters were investigated. The number of microbubbles increased with an increase in air-flow rate.
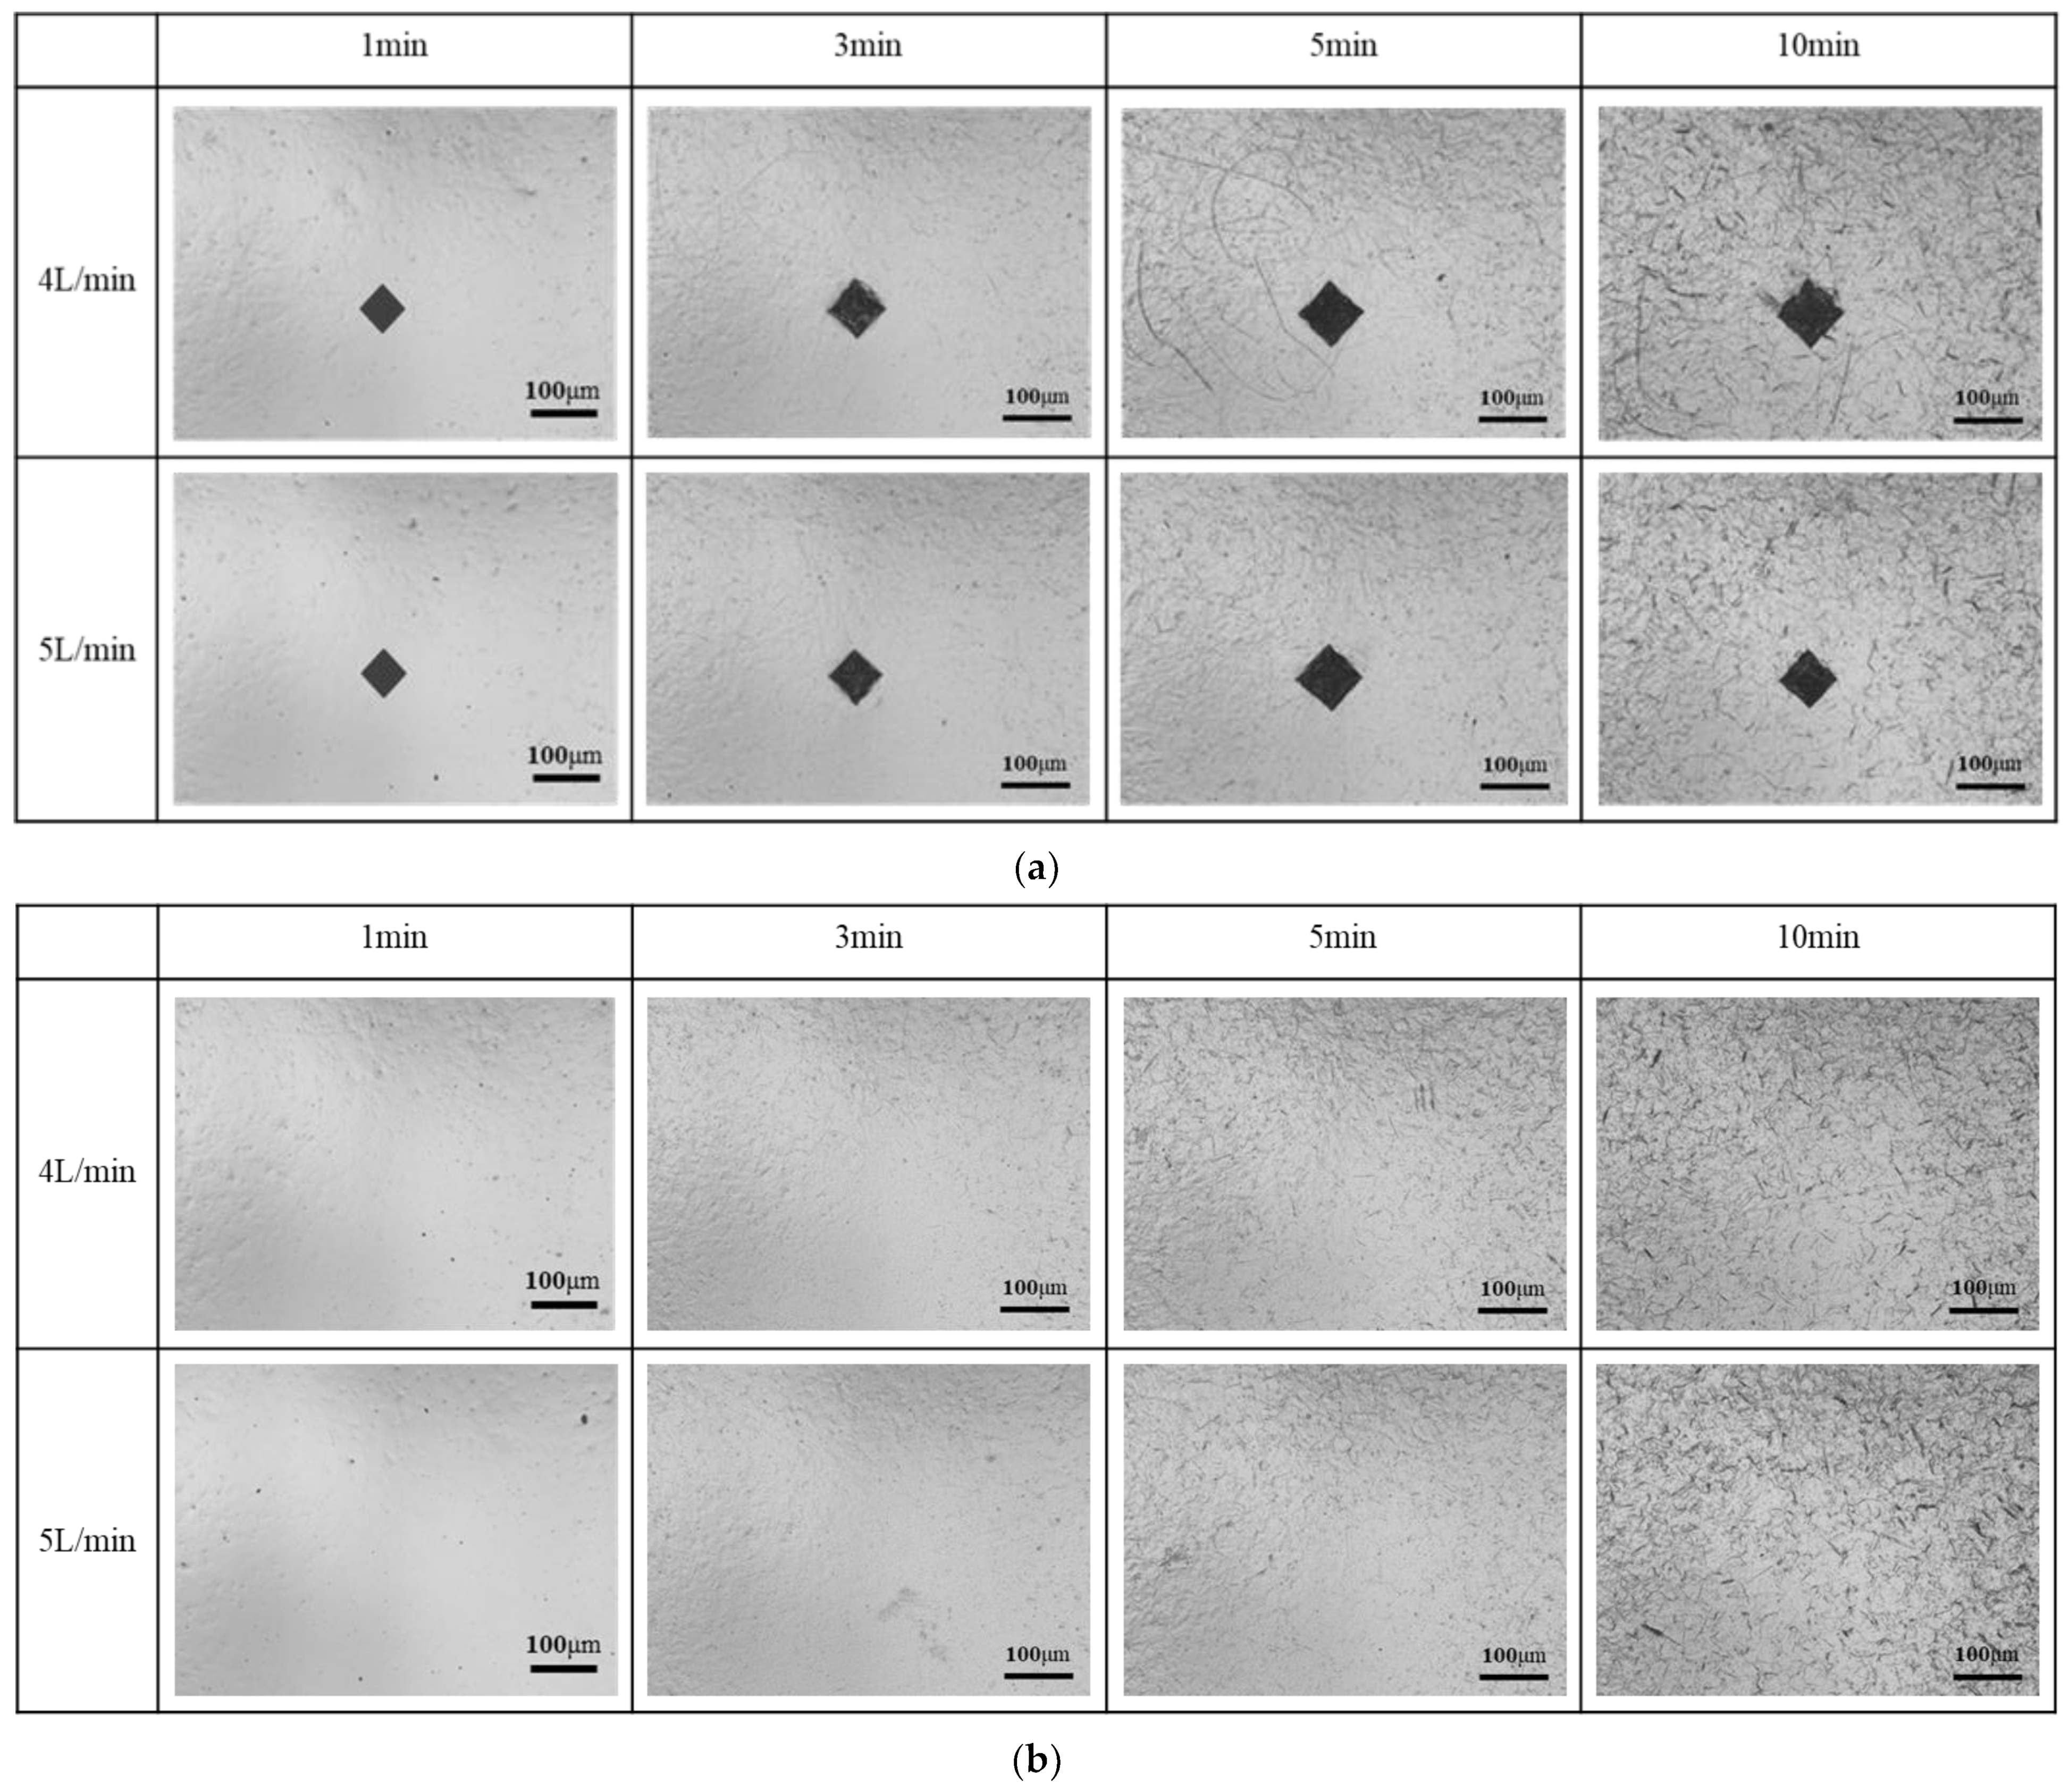
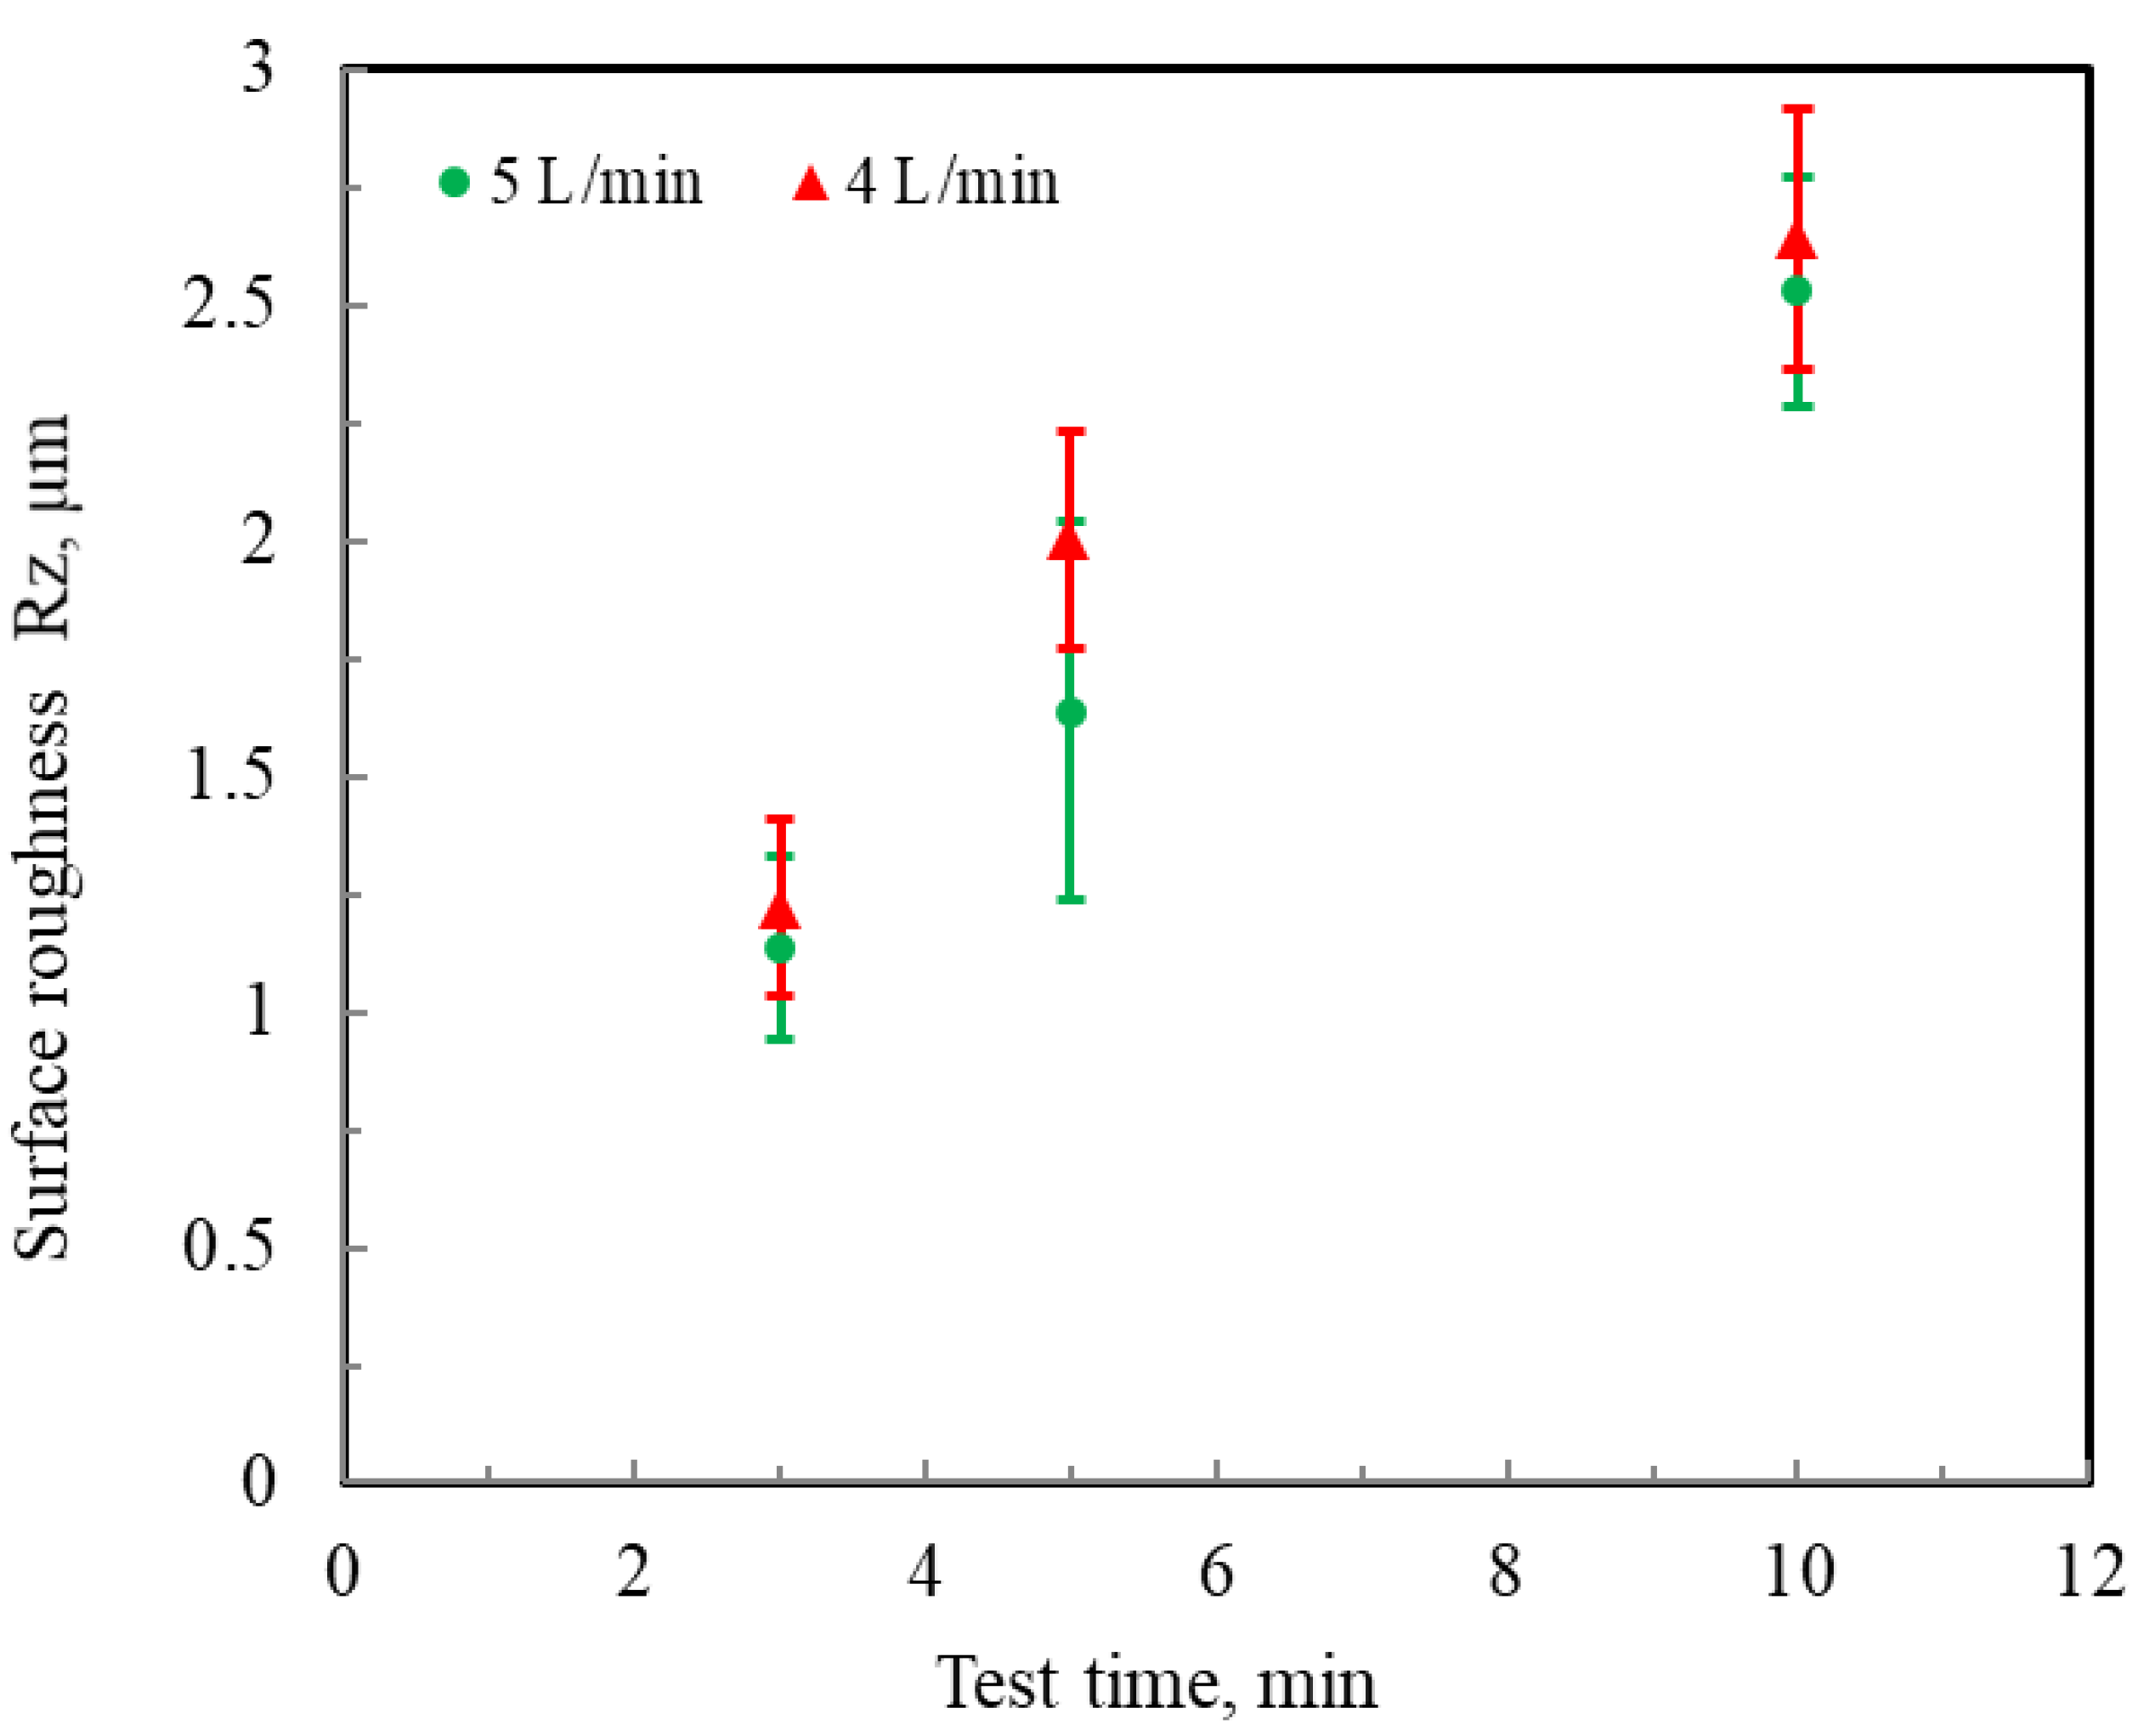
  • The effect of flow rate on the surface damage was also investigated by the images of surface damage and surface roughness at a 4 and 5 L/min air-flow rate.
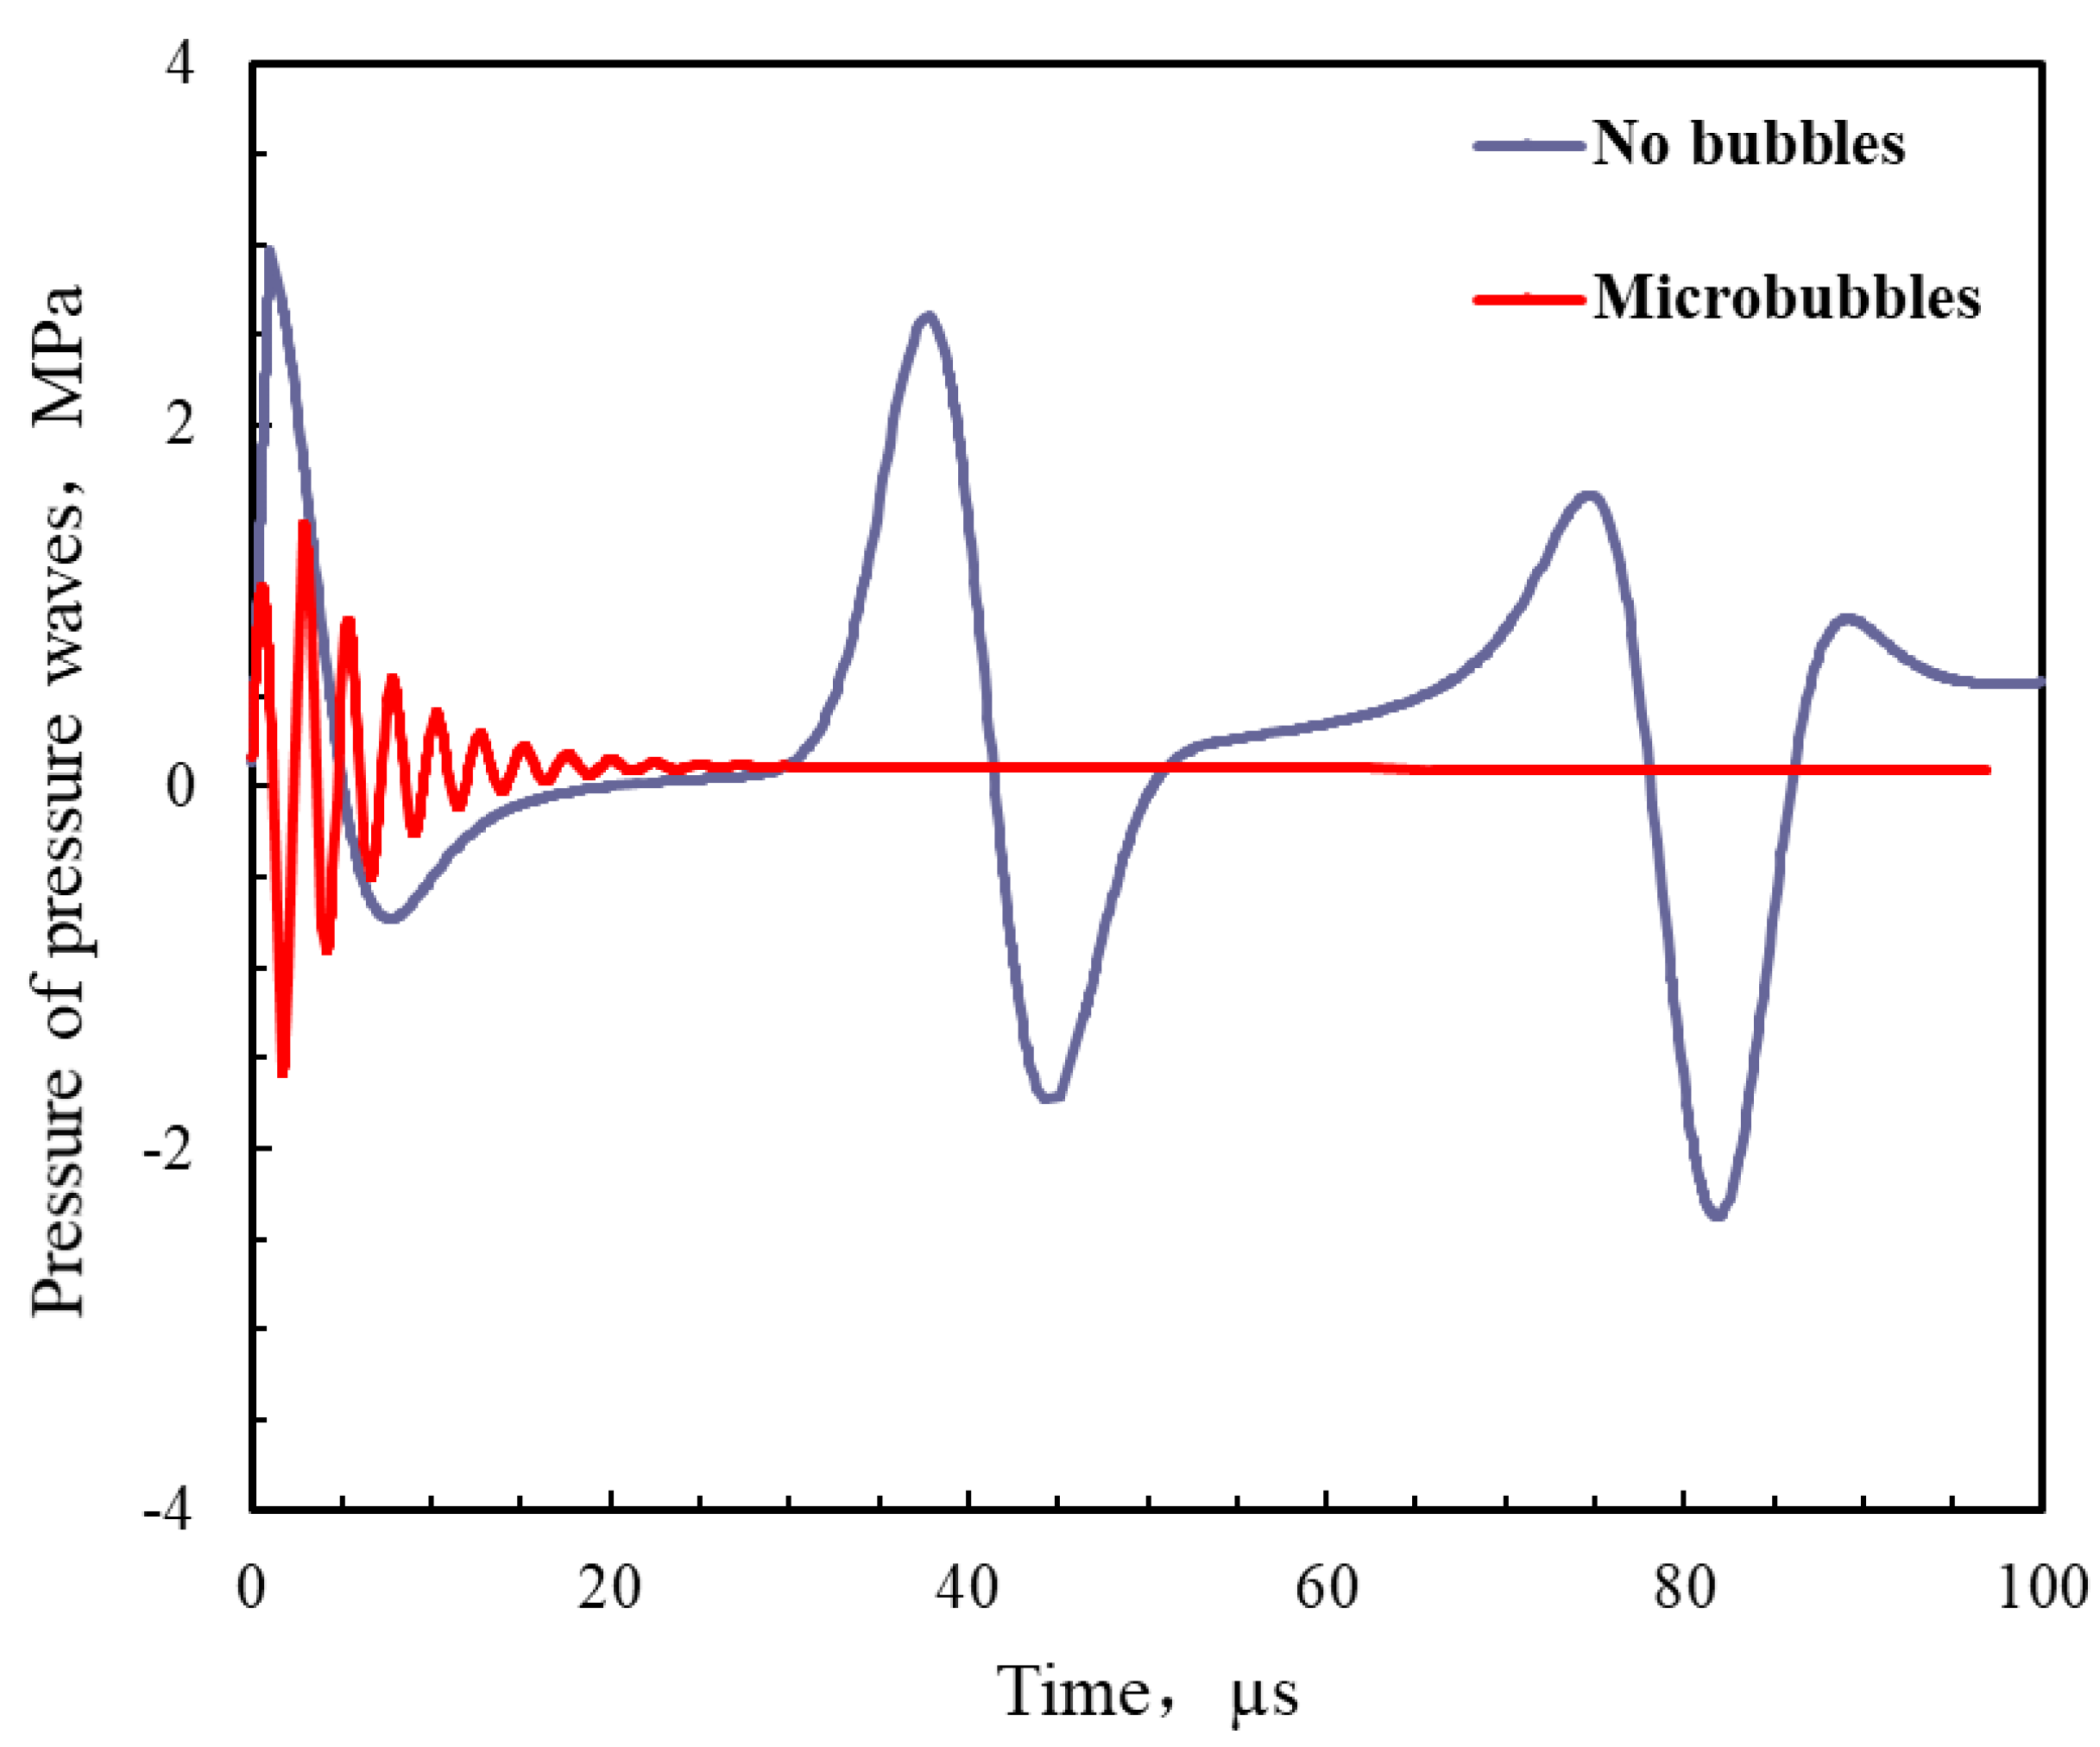
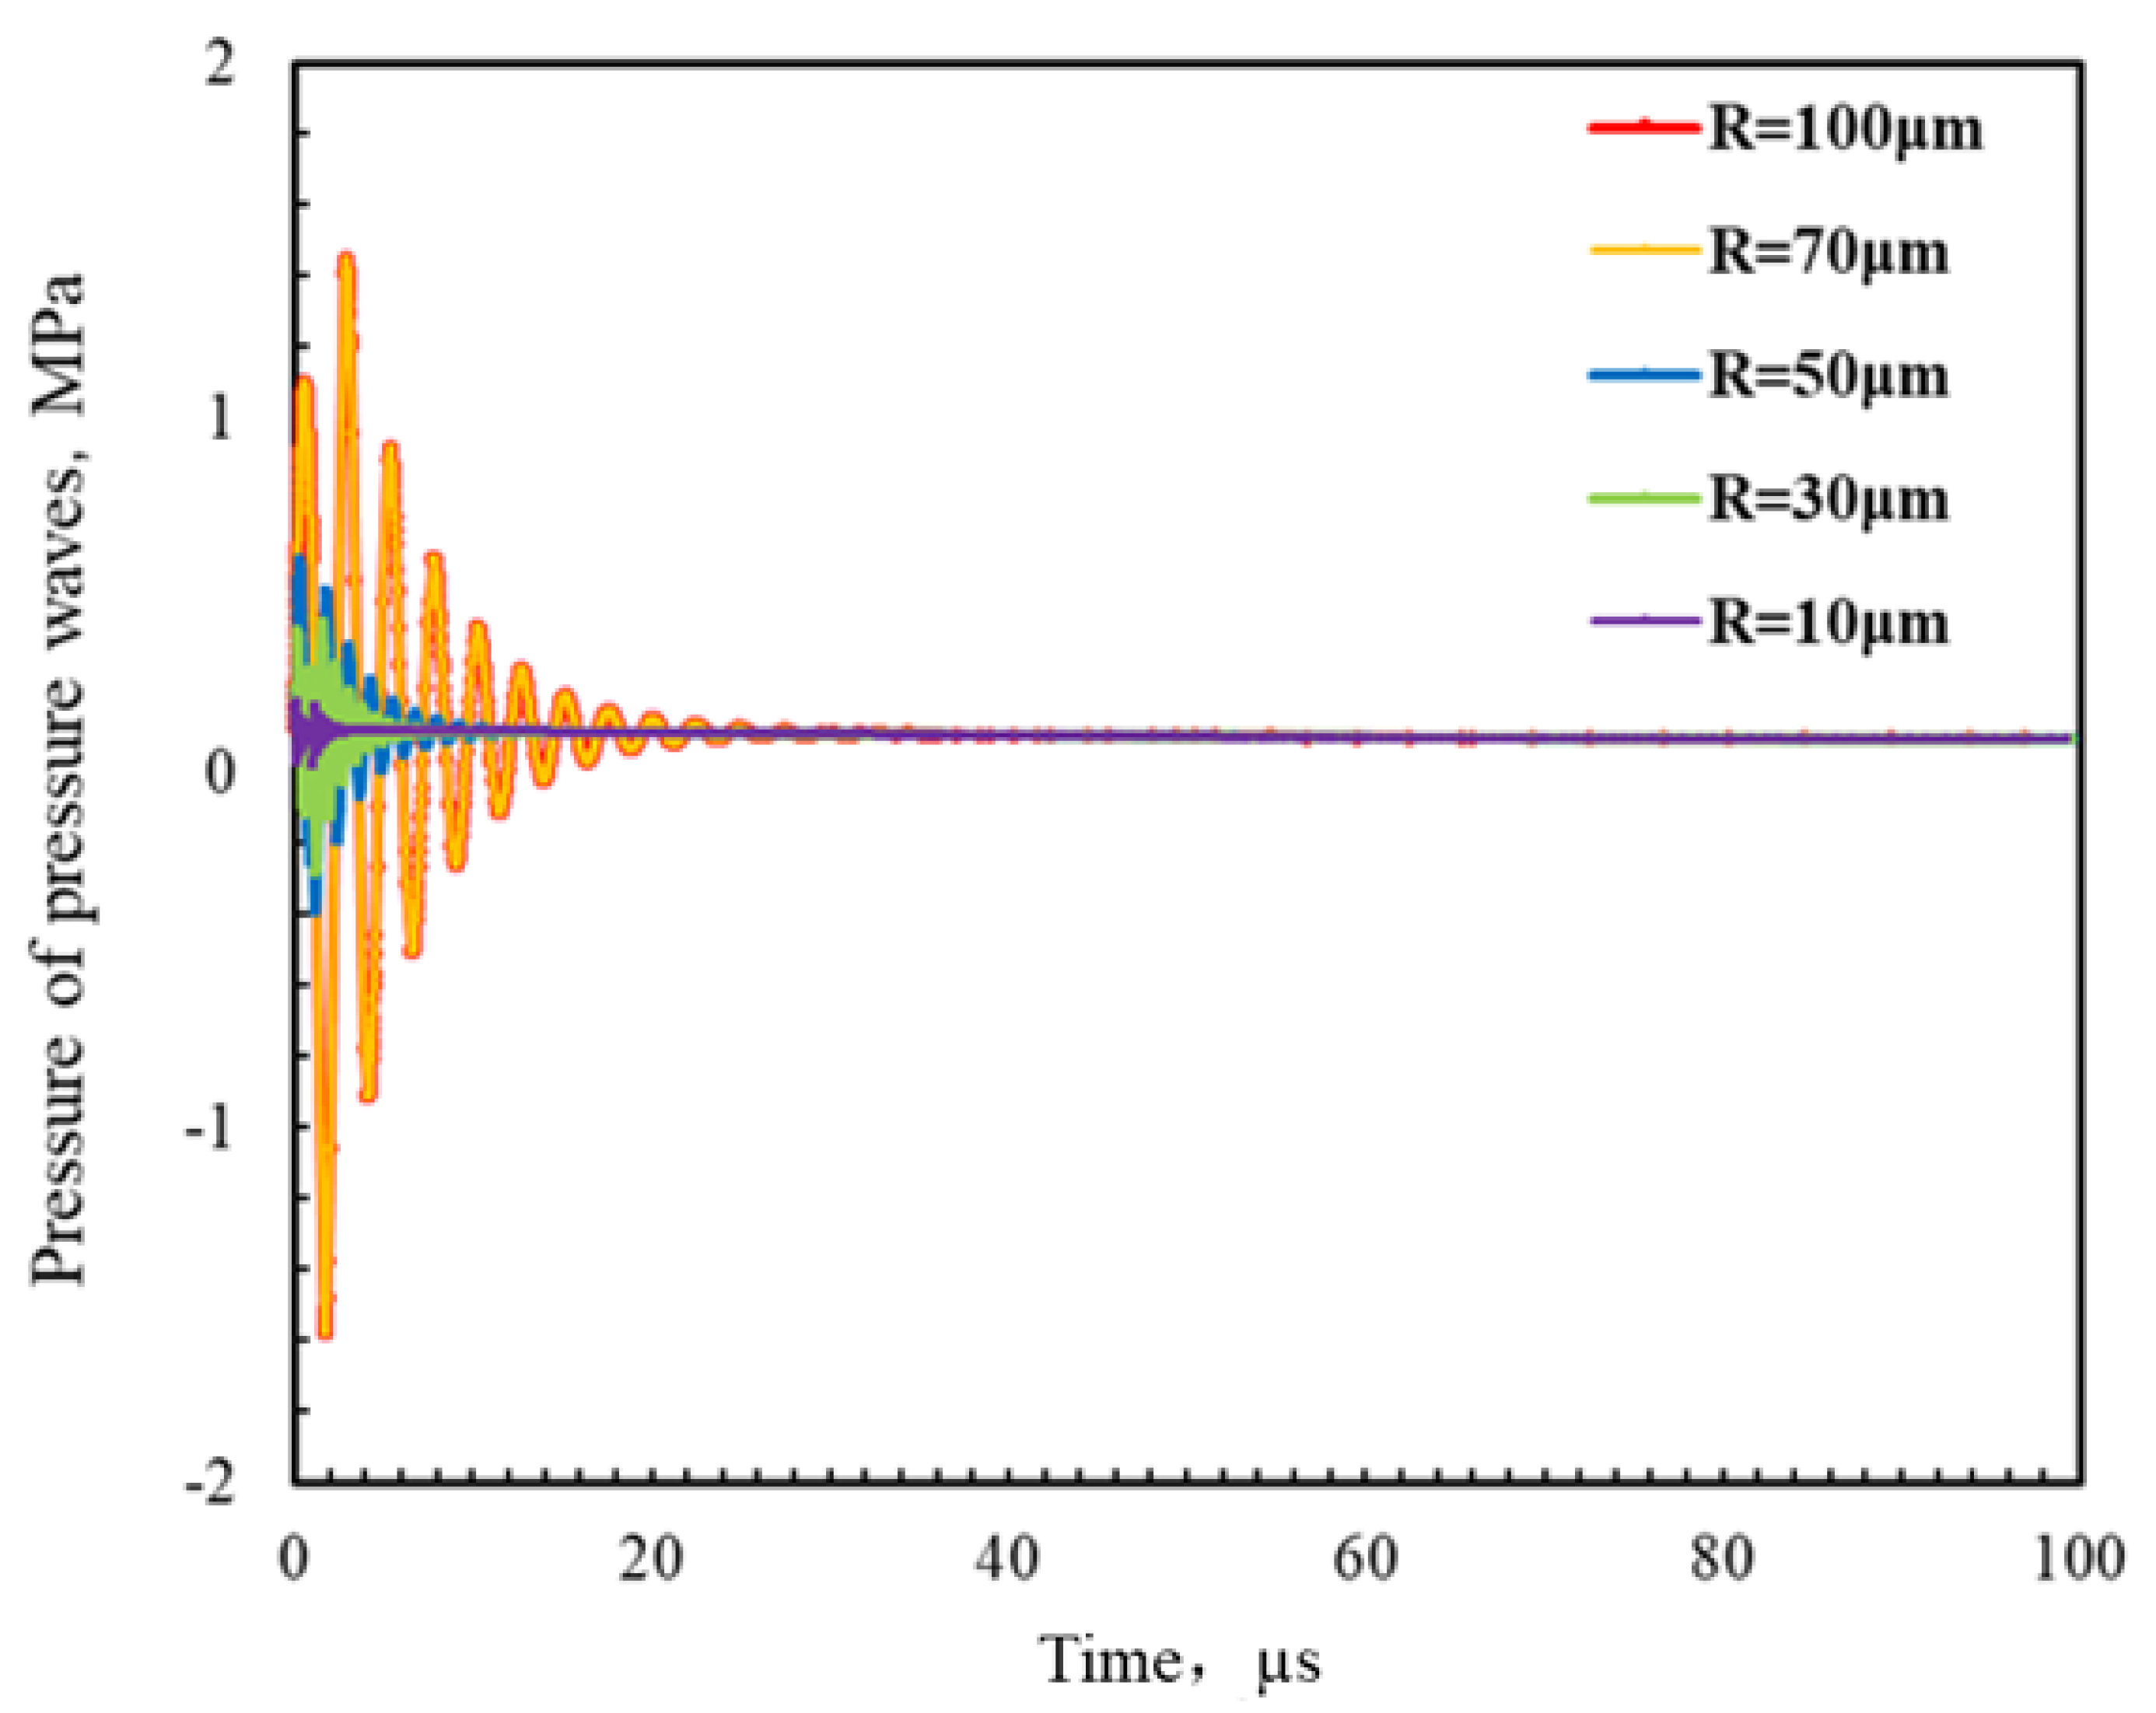
  • A numerical simulation code was developed to investigate the effect of dispersed microbubbles surrounding the specimen surface on microsecond-scale pressure waves. The results showed that microbubble injections could effectively suppress microsecond-scale pressure waves, and the pressure amplitude of the pressure waves was markedly reduced by the smaller microbubbles.

Author Contributions

The first author, X.S., was responsible writing the paper and participating in the experiments and analyses. The corresponding author, Y.Y., was responsible for proposing the method, planning the experiments, and developing the experiments. F.L. and Y.F. were responsible for performing the experiments. Y.X. was responsible for collecting and processing the data. W.H. and S.Z. were responsible for statistically analyzing and measuring the works. All authors have read and agreed to the published version of the manuscript.

Funding

This research was funded by the Natural Science Foundation of Fujian Province (2022J011148), the Doctor Start Funding of Longyan University (LB2019002), the Huaqiao University Engineering Research Center of Brittle Materials Machining (MOE, 2020IME-003), the Natural Science Foundation of Zhejiang Province (LZY23E050004), and the Young Teachers’ Education Research Project of Fujian (JAT210448).

Institutional Review Board Statement

Not applicable.

Informed Consent Statement

Not applicable.

Data Availability Statement

Not applicable.

Conflicts of Interest

The authors declare no conflict of interest.

References

  1. Futakawa, M.; Haga, K.; Wakui, T.; Kogawa, H.; Naoe, T. Development of the Hg target in the J-PARC neutron source. Nucl. Instrum. Methods Phys. Res. Sect. A 2009, 600, 18–21. [Google Scholar] [CrossRef]
  2. Takada, H.; Haga, K.; Teshigawara, M.; Aso, T.; Meigo, S.; Kogawa, H.; Naoe, T.; Wakui, T.; Ooi, M.; Harada, M.; et al. Materials and Life Science Experimental Facility at the Japan Proton Accelerator Research Complex I: Pulsed Spallation Neutron Source. Qnant. Beam Sci. 2017, 1, 8. [Google Scholar] [CrossRef] [Green Version]
  3. Haines, J.; McManamy, T.; Gabriel, T.; Battle, R.; Chipley, K.; Crabtree, J.; Jacobs, L.; Lousteau, D.; Rennich, M.; Riemer, B. Spallation neutron source target station design, development, and commissioning. Nucl. Instrum. Methods Phys. Res. A 2014, 764, 94–115. [Google Scholar] [CrossRef]
  4. Futakawa, M.; Kogawa, H.; Hasegawa, S.; Naoe, T.; Ida, M.; Haga, K. Mitigation technologies for damage induced by pressure waves in high-power mercury spallation neutron sources (II)-Bubbling effect to reduce pressure wave. J. Nucl. Sci. Technol. 2008, 45, 1041–1048. [Google Scholar] [CrossRef]
  5. Naoe, T.; Wakui, T.; Kinoshita, H.; Kogawa, H.; Haga, K.; Harada, M.; Takada, H.; Futakawa, M. Cavitation damage in double-walled mercury target vessel. J. Nucl. Mater. 2018, 506, 35–42. [Google Scholar] [CrossRef]
  6. Naoe, T.; Kogawa, H.; Wakui, T.; Haga, K.; Teshigawara, M.; Kinoshita, H.; Takada, H.; Futakawa, M. Cavitation damage prediction for the JSNS mercury target vessel. J. Nucl. Mater. 2016, 468, 313–320. [Google Scholar] [CrossRef] [Green Version]
  7. Futakawa, M.; Naoe, T.; Kogawa, H.; Teshigawara, M.; Ikeda, Y. Effects of pitting damage on fatigue limit and lifetime in mercury target. J. Nucl. Mater. 2006, 356, 168–177. [Google Scholar] [CrossRef]
  8. McClintock, D.; Riemer, B.; Ferguson, P.; Carroll, A.; Dayton, M. Initial observations of cavitation-induced erosion of liquid metal spallation target vessels at the Spallation Neutron Source. J. Nucl. Mater. 2012, 431, 147–159. [Google Scholar] [CrossRef]
  9. Riemer, B.; Wendel, M.; Felde, D.; Sangrey, R.; Abdou, A.; West, D.; Shea, T.; Hasegawa, S.; Kogawa, H.; Naoe, T.; et al. Small gas bubble experiment for mitigation of cavitation damage and pressure waves in short-pulse mercury spallation targets. J. Nucl. Mater. 2014, 450, 192–203. [Google Scholar] [CrossRef]
  10. McClintock, D.; Liu, Y.; Bruce, D.; Winder, D.; Schwartz, R.; Kyte, M.; Blokland, W.; Sangrey, R.; Carroll, T.; Long, C.; et al. Small-bubble gas injection to mitigate cavitation-induced erosion damage and reduce strain in target vessels at the Spallation Neutron Source. Mater. Des. 2022, 221, 110937. [Google Scholar] [CrossRef]
  11. Riemer, B.; Haines, J.; Wendel, M.; Bauer, G.; Futakawa, M.; Hasegawa, S.; Kogawa, H. Cavitation damage experiments for mercury spallation targets at the LANSCE–WNR in 2005. J. Nucl. Mater. 2008, 377, 162–173. [Google Scholar] [CrossRef]
  12. Riemer, B.; McClintock, D.; Kaminskas, S.; Abdou, A. Correlation between simulations and cavitation-induced erosion damage in Spallation Neutron Source target modules after operation. J. Nucl. Mater. 2014, 450, 183–191. [Google Scholar] [CrossRef]
  13. Hasegawa, S.; Naoe, T.; Futakawa, M. Solubility of helium in mercury for bubbling technology of the spallation neutron mercury target. J. Nucl. Mater. 2010, 398, 189–192. [Google Scholar] [CrossRef]
  14. Kogawa, H.; Haga, K.; Wakui, T.; Futakawa, M. Development on mercury pump for JSNS. Nucl. Instrum. Methods Phys. Res. A 2009, 600, 97–99. [Google Scholar] [CrossRef]
  15. Vevera, B.; McClintock, D.; Hyers, J.; Riemer, B. Characterization of irradiated AISI 316L stainless steel disks removed from the Spallation Neutron Source. J. Nucl. Mater. 2014, 450, 147–162. [Google Scholar] [CrossRef]
  16. Kogawa, H.; Naoe, T.; Kyotoh, H.; Haga, K.; Kinoshita, H.; Futakawa, M. Development of microbubble generator for suppression of pressure waves in mercury target of spallation source. J. Nucl. Sci. Technol. 2015, 52, 1461–1469. [Google Scholar] [CrossRef]
  17. Kogawa, H.; Naoe, T.; Futakawa, M.; Haga, K.; Wakui, T.; Harada, M.; Takada, H. Mitigation technologies for damage induced by pressure waves in high-power mercury spallation neutron sources (IV)–measurement of pressure wave response and microbubble effect on mitigation in mercury target at J-PARC. J. Nucl. Sci. Technol. 2017, 54, 733–741. [Google Scholar] [CrossRef]
Figure 1. Appearance and model of mercury target (a) Appearance of mercury target system (b) Model diagram of target vessel and mercury vessel.
Coatings 12 01960 g001
Figure 2. Experimental specimen. (a) Appearance and dimensions of specimen, (b) Observed point of specimen.
Coatings 12 01960 g002
Figure 3. Schematic diagram and real object of ultrasonic erosion test equipment. (a) Schematic diagram of ultrasonic erosion test equipment, (b) Real object of ultrasonic erosion test equipment.
Coatings 12 01960 g003
Figure 4. Two-dimensional image-processing procedure. (a) Image of microbubbles, (b) Two-dimensional image processing, (c) Count amount of microbubbles, (d) Count the enlarged image.
Coatings 12 01960 g004
Figure 5. Surface appearance of the specimen before and after experiments.
Coatings 12 01960 g005
Figure 6. Surface damage at different points in experimental conditions of different flow states. (a) Surface damage at point 1 in different experimental conditions, (b) Surface damage at point 3 in different experimental conditions, (c) Surface damage at point 7 in different experimental conditions (d) Surface damage at point 10in different experimental conditions.
Coatings 12 01960 g006aCoatings 12 01960 g006b
Figure 7. Change in the surface roughness RZ as a function of the exposure time in different working conditions.
Coatings 12 01960 g007
Figure 8. The distribution of microbubbles with different air-flow rates.
Coatings 12 01960 g008
Figure 9. The number and size of microbubbles was near the specimen with different air-flow rates.
Coatings 12 01960 g009
Figure 10. Surface damage at various points under the experimental conditions of different gas-flow rates. (a) Surface damage at point 1 with different gas-flow rates, (b) Surface damage at point 3 with different gas-flow rates, (c) Surface damage at point 7 with different gas-flow rate, (d) Surface damage at point 10 with different gas-flow rate.
Coatings 12 01960 g010aCoatings 12 01960 g010b
Figure 11. Change in the surface roughness RZ as a function of the exposure time in the bubbling conditions with different air-flow rate.
Coatings 12 01960 g011
Figure 12. Comparison of microsecond-scale pressure waves under different working conditions.
Coatings 12 01960 g012
Figure 13. Change in microsecond-scale pressure waves with different d of microbubbles.
Coatings 12 01960 g013
Table 1. Experimental conditions.
SpecimenSUS316 Button Shape, 26 mm in Diameter and 5 mm in Thickness
Vibration frequency20 kHz
Flowing rate of water75 L/min
Flowing rate of air4 L/min & 5 L/min
Working conditionsStagnant water
Flowing water
Bubbling water
Test time1, 3, 5, 10 min
Publisher’s Note: MDPI stays neutral with regard to jurisdictional claims in published maps and institutional affiliations.

