Article

Improvement of Corrosion Resistance and Biocompatibility of Biodegradable Mg–Ca Alloy by ALD HfZrO2 Film

1
Department of Materials Science and Engineering, National Taiwan University, Taipei 10617, Taiwan
2
Department of Dental Technology, College of Oral Medicine, Taipei Medical University, Taipei 11031, Taiwan
3
Institute of Physics of Advanced Materials, Ufa State Aviation Technical University, 450008 Ufa, Russia
*
Authors to whom correspondence should be addressed.
Coatings 2022, 12(2), 212; https://doi.org/10.3390/coatings12020212
Submission received: 22 December 2021 / Revised: 3 February 2022 / Accepted: 4 February 2022 / Published: 6 February 2022

Abstract

:
Polycrystalline HfZrO2 (HZO) film can be fabricated on as-extruded Mg–Ca alloy, which is identified by the results of XRD and TEM. HZO film can improve the corrosion resistance of as-extruded Mg–Ca alloy to further result in a decrease in the corrosion rate of Mg–Ca alloy. Corrosion current density, pH value evaluation, and the corrosion surface image provide evidence of improvement in corrosion rate. Compared with ZrO2 film, HZO film shows better short-term corrosion resistance. The results of WST-1 assay and LDH assay show that HZO film has low toxicity and is suitable for the protective coating of biological implants.

1. Introduction

The self-limiting chemical property as a unique characteristic leads atomic layer deposition (ALD) to have several benefits, including precise thickness control, conformal coverage, large-scale fabrication, and excellent uniformity [1,2,3]. Accordingly, the ALD technique is applied in the field of the corrosion protection of metal. Many oxide materials prepared by ALD have been investigated, and the coverage of ALD films results in excellent corrosion protection for many metals [4,5,6,7,8]. J. S. Daubert et al. have studied the corrosion protection of different ALD oxide films, including Al2O3, TiO2, ZnO, ZrO2, and HfO2 films, on copper. Those oxide films deposited by ALD show different corrosion resistance values and decline of corrosion resistance which reflects in the different extent of the short-term and long-term corrosion protection [5]. Among those materials, ZrO2 shows excellent corrosion protection, good mechanical property, and biocompatibility, which makes ZrO2 film suitable for use as a protective layer for bio-metals.
The studies of ZrO2 film on metal corrosion protection are widely reported, but HfO2 film has rarely been reported in the field of corrosion protection [5]. J. S. Daubert et al. first reported the protection performance of HfO2 film as a protection layer for copper in NaCl solution. Under the same corrosion conditions, HfO2 film shows higher corrosion resistance and lower corrosion current density than ZrO2 film. However, it is worth noting that the short-term corrosion protection of HfO2 film is better than that of ZrO2 film, but the long-term corrosion protection is the opposite [5]. For biocompatibility, both ZrO2 and HfO2 have low toxicity to the human body and are suitable for implant applications [9,10]. So far, HZO material as a famous dielectric material is rarely used in the biomedical or anti-corrosion fields. Most of the studies about HfZrO2 (HZO) are focused on the electrical properties in the semiconductor field [11,12,13]. Therefore, to get higher short-term corrosion resistance and keep the long-term corrosion resistance of ZrO2 film, we employed the HfZrO2 material, which is one famous dielectric material film like ZrO2, to be the protection layer for Mg–Ca alloy. In this work, HZO films were prepared by alternately depositing HfO and ZrO layers at a ratio of 1:1 to form HZO films with 100 and 200 cycles. The characteristics of short-term corrosion resistance and also the decline of long-term corrosion resistance of ALD–HZO films were investigated. The results of the EIS measurement of HZO film are compared with the results of ZrO2 film to determine the effect of changing the material from ZrO2 to HZO in terms of corrosion protection. In addition, the biocompatibility of HZO and pH value evaluation are also studied to judge the potential of HZO film as a biomaterial.

2. Experimental Procedure

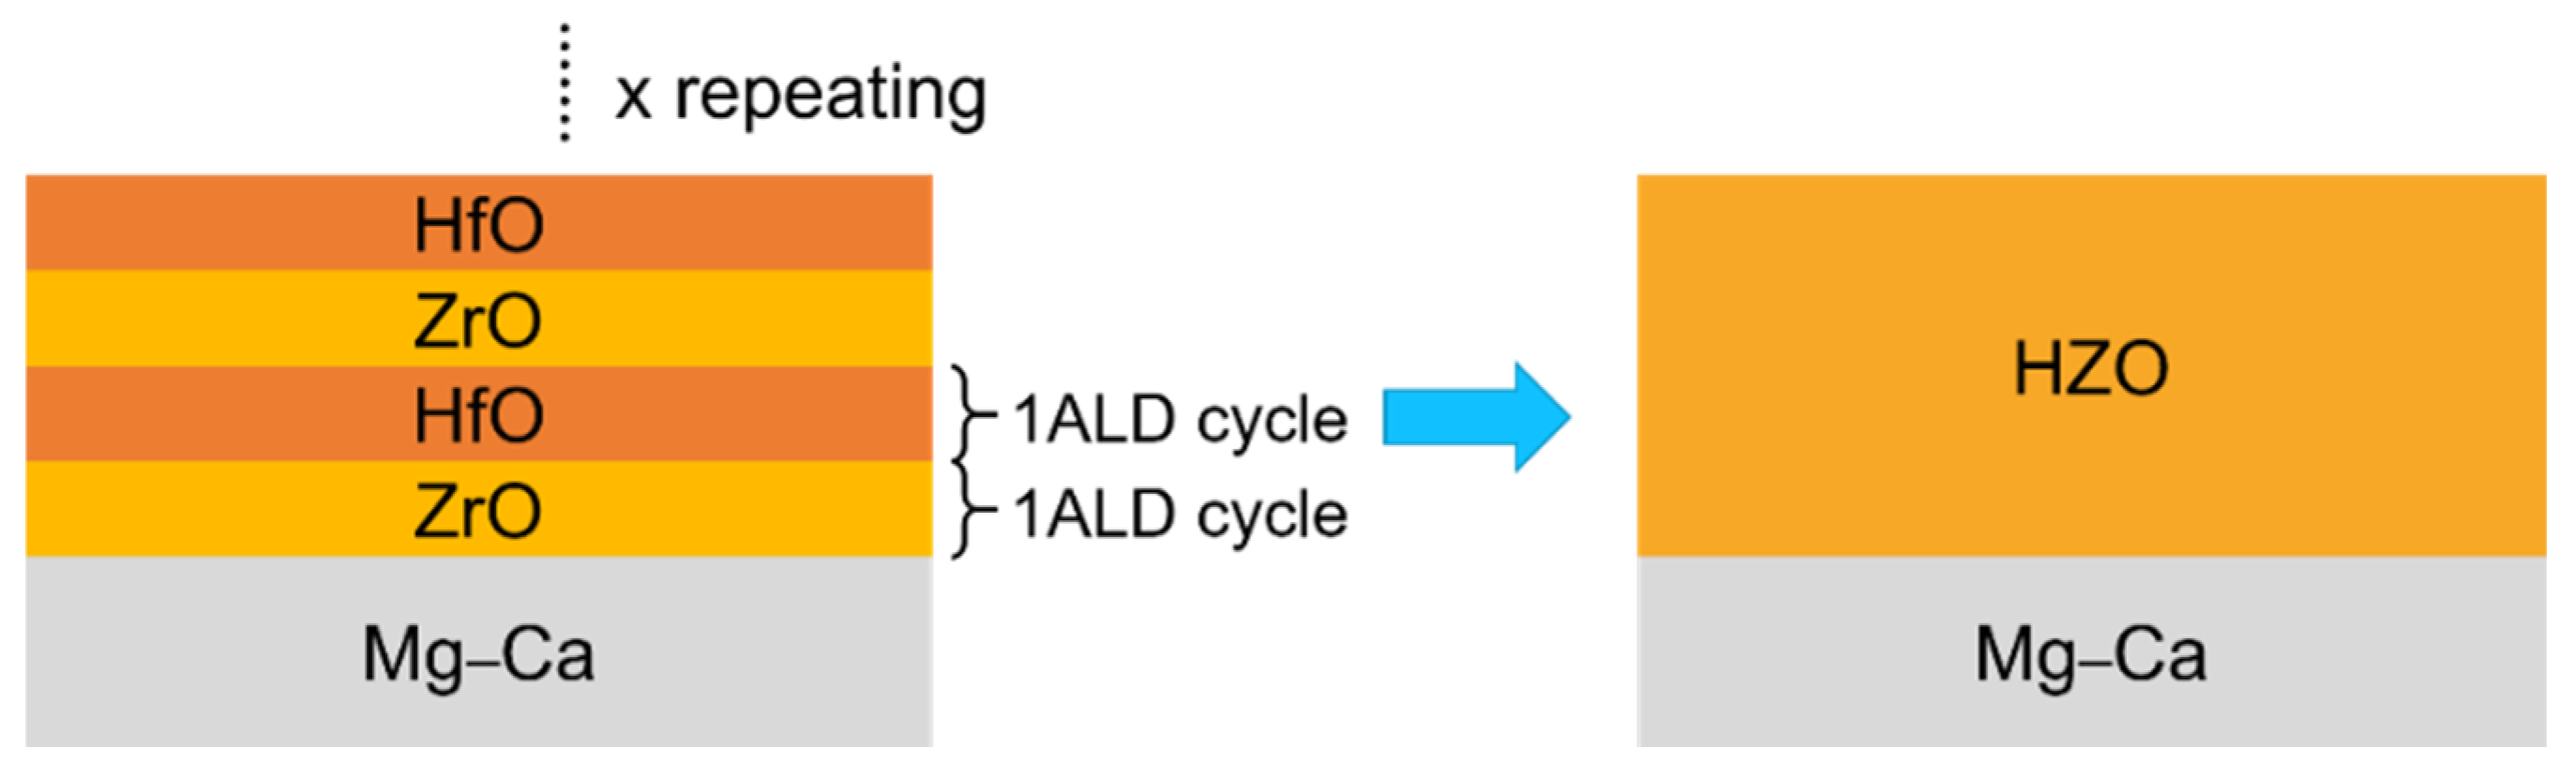
2.1. Sample Preparation

The Mg–1.0%Ca (wt.%) alloy used in this study was melted in a vacuum furnace (Amli Materials Technology Co., Ltd., Taoyuan, Taiwan). The ingot was extruded at 300 °C into a rod with a diameter of 25.4 mm. Specimens with the size of φ 25 mm × 4 mm thickness were prepared from this extruded rod. The surfaces of the specimens were grounded with P400 ~ P4000 SiC abrasive papers to remove the natural oxide layer. Then all samples were polished with 1- and 0.3-μm Al2O3 powders to smooth the surface roughness of all specimens. Before the ALD process, all specimens were cleaned with acetone in an ultrasonic generator to remove residual organics and then dried with flowing nitrogen.
The HfZrO2 (HZO) and ZrO2 films were deposited using a conventional ALD system (Fiji, Cambridge NanoTech Inc., Waltham, MA, USA) with plasma-enhanced ALD (PEALD) mode. Figure 1 shows the schematic diagram of the growth process of ALD–HZO film. By alternately depositing the HfO and ZrO layer by ALD at the ratio 1:1, a signal layer HfZrO2 (HZO) film, which is one kind of oxide material, was formed. The thickness of HZO film was fixed at 100 cycles and 200 cycles. In the ALD process of each ZrO and HfO layer, the tetrakis-(dimethylamino)-zirconium (TDMAZr, >99% Strem Chemicals, Newburyport, MA, USA) and tetrakis-(dimethylamino)-hafnium (TDMAHf, >99% Strem Chemicals, Newburyport, MA, USA) were used as the reaction sources, and the oxygen plasma generated by the remote plasma was used as the reactant, and 20 sccm of oxygen was passed into the generator to generate oxygen plasma, which was ionized at a 300 watts. The pulse time of TDMAZr and TDMAHf was about 0.5 s, the exposure time of oxygen plasma was 20 s, and the purging time of each step was 20 s. The carrier gas and purge gas were ultra-high purity argon. Moreover, the working pressure of the fabrication process was 3.5 × 10⁻¹ Torr, and the chamber temperature was maintained at 200 °C.

2.2. Characterization of Mg–Ca Alloy and ALD–HZO Film

The surface observation and element distribution of as-extruded Mg–1.0%Ca specimens were carried out by wavelength-dispersive X-ray spectroscopy (WDS, JEOL JXA-8530F plus FE-EPMA, Tokyo, Japan). In addition, the HZO film was characterized by transmission electron microscope (FEI Tecnai G2 F20, FEI Company, Hillsboro, OR, USA) and X-ray diffractometer (Rigaku TTRAX 3, Tokyo, Japan) to identify the film thickness and crystalline structure.

2.3. Corrosion Evaluation

The corrosion properties of the specimen were analyzed by electrochemical measurement. The electrochemical measurements were carried out using a self-made three-electrode electrochemical cell including a specimen, a platinum sheet, and a saturated calomel electrode (Ag/AgCl) which are used as a working electrode with the working area of 1.767 cm2, counter electrode, and reference electrode, respectively. The corrosive environment is set with simulated body fluid (SBF) solution at 37 °C. The results of electrochemical measurements, including electrochemical impedance spectroscopy (EIS) and potentiodynamic polarization (PDP) curves, were recorded by a potentiostat (Autolab PGSTATM 204) (Metrohm, Herisau, Switzerland). The electrochemical measurement was conducted by applying a sinusoidal perturbation amplitude, which induces the impedance or polarization, to the specimen at a frequency from 10−2 to 105 Hz. Before the electrochemical measurement, the electrochemical system was stabilized until the potential drift of open-circuit potential (OCP) of the system was less than 10 mV. Moreover, the corroded surface was observed by scanning electron microscope (Nova Nano SEM 450) (FEI Company, Hillsboro, OR, USA), and the pH value was measured by pH value meter. The SBF solution used in this study was composed of 6.54 g/L NaCl, 2.26 g/L NaHCO3, 0.37 g/L KCl, 0.17 g/L Na2HPO4·2H2O, 0.31 g/L MgCl2·6H2O, 0.36 g/L CaCl2·2H2O, 0.07 g/L Na2SO4, and 6.1 g/L (CH2OH)3CNH2 was added to keep the pH value at 7.4 [14].

2.4. Biocompatibility

Human osteoblast-like cells (MG-63) were cultured in H-DMEM as cells for cell tests. Bare Mg–Ca and HZO(200 cycles)/Mg–Ca disc specimens were extracted with DMEM at 37 °C and 6 cm2/1 mLq medium for 24 h for cell culture. MG-63 cells (~1 × 10⁵ cells) were plated in 24-well plates, cultured overnight in normal culture medium (control group), and then the medium was changed to the extract of bare Mg–Ca and HZO(200 cycles)/Mg–Ca, and continue to culture for 1 and 3 days. After that, WST-1 (water-soluble tetrazolium reagent-1) and LDH assay were used to evaluate cell viability the death of the cell, respectively.

3. Results and Discussion

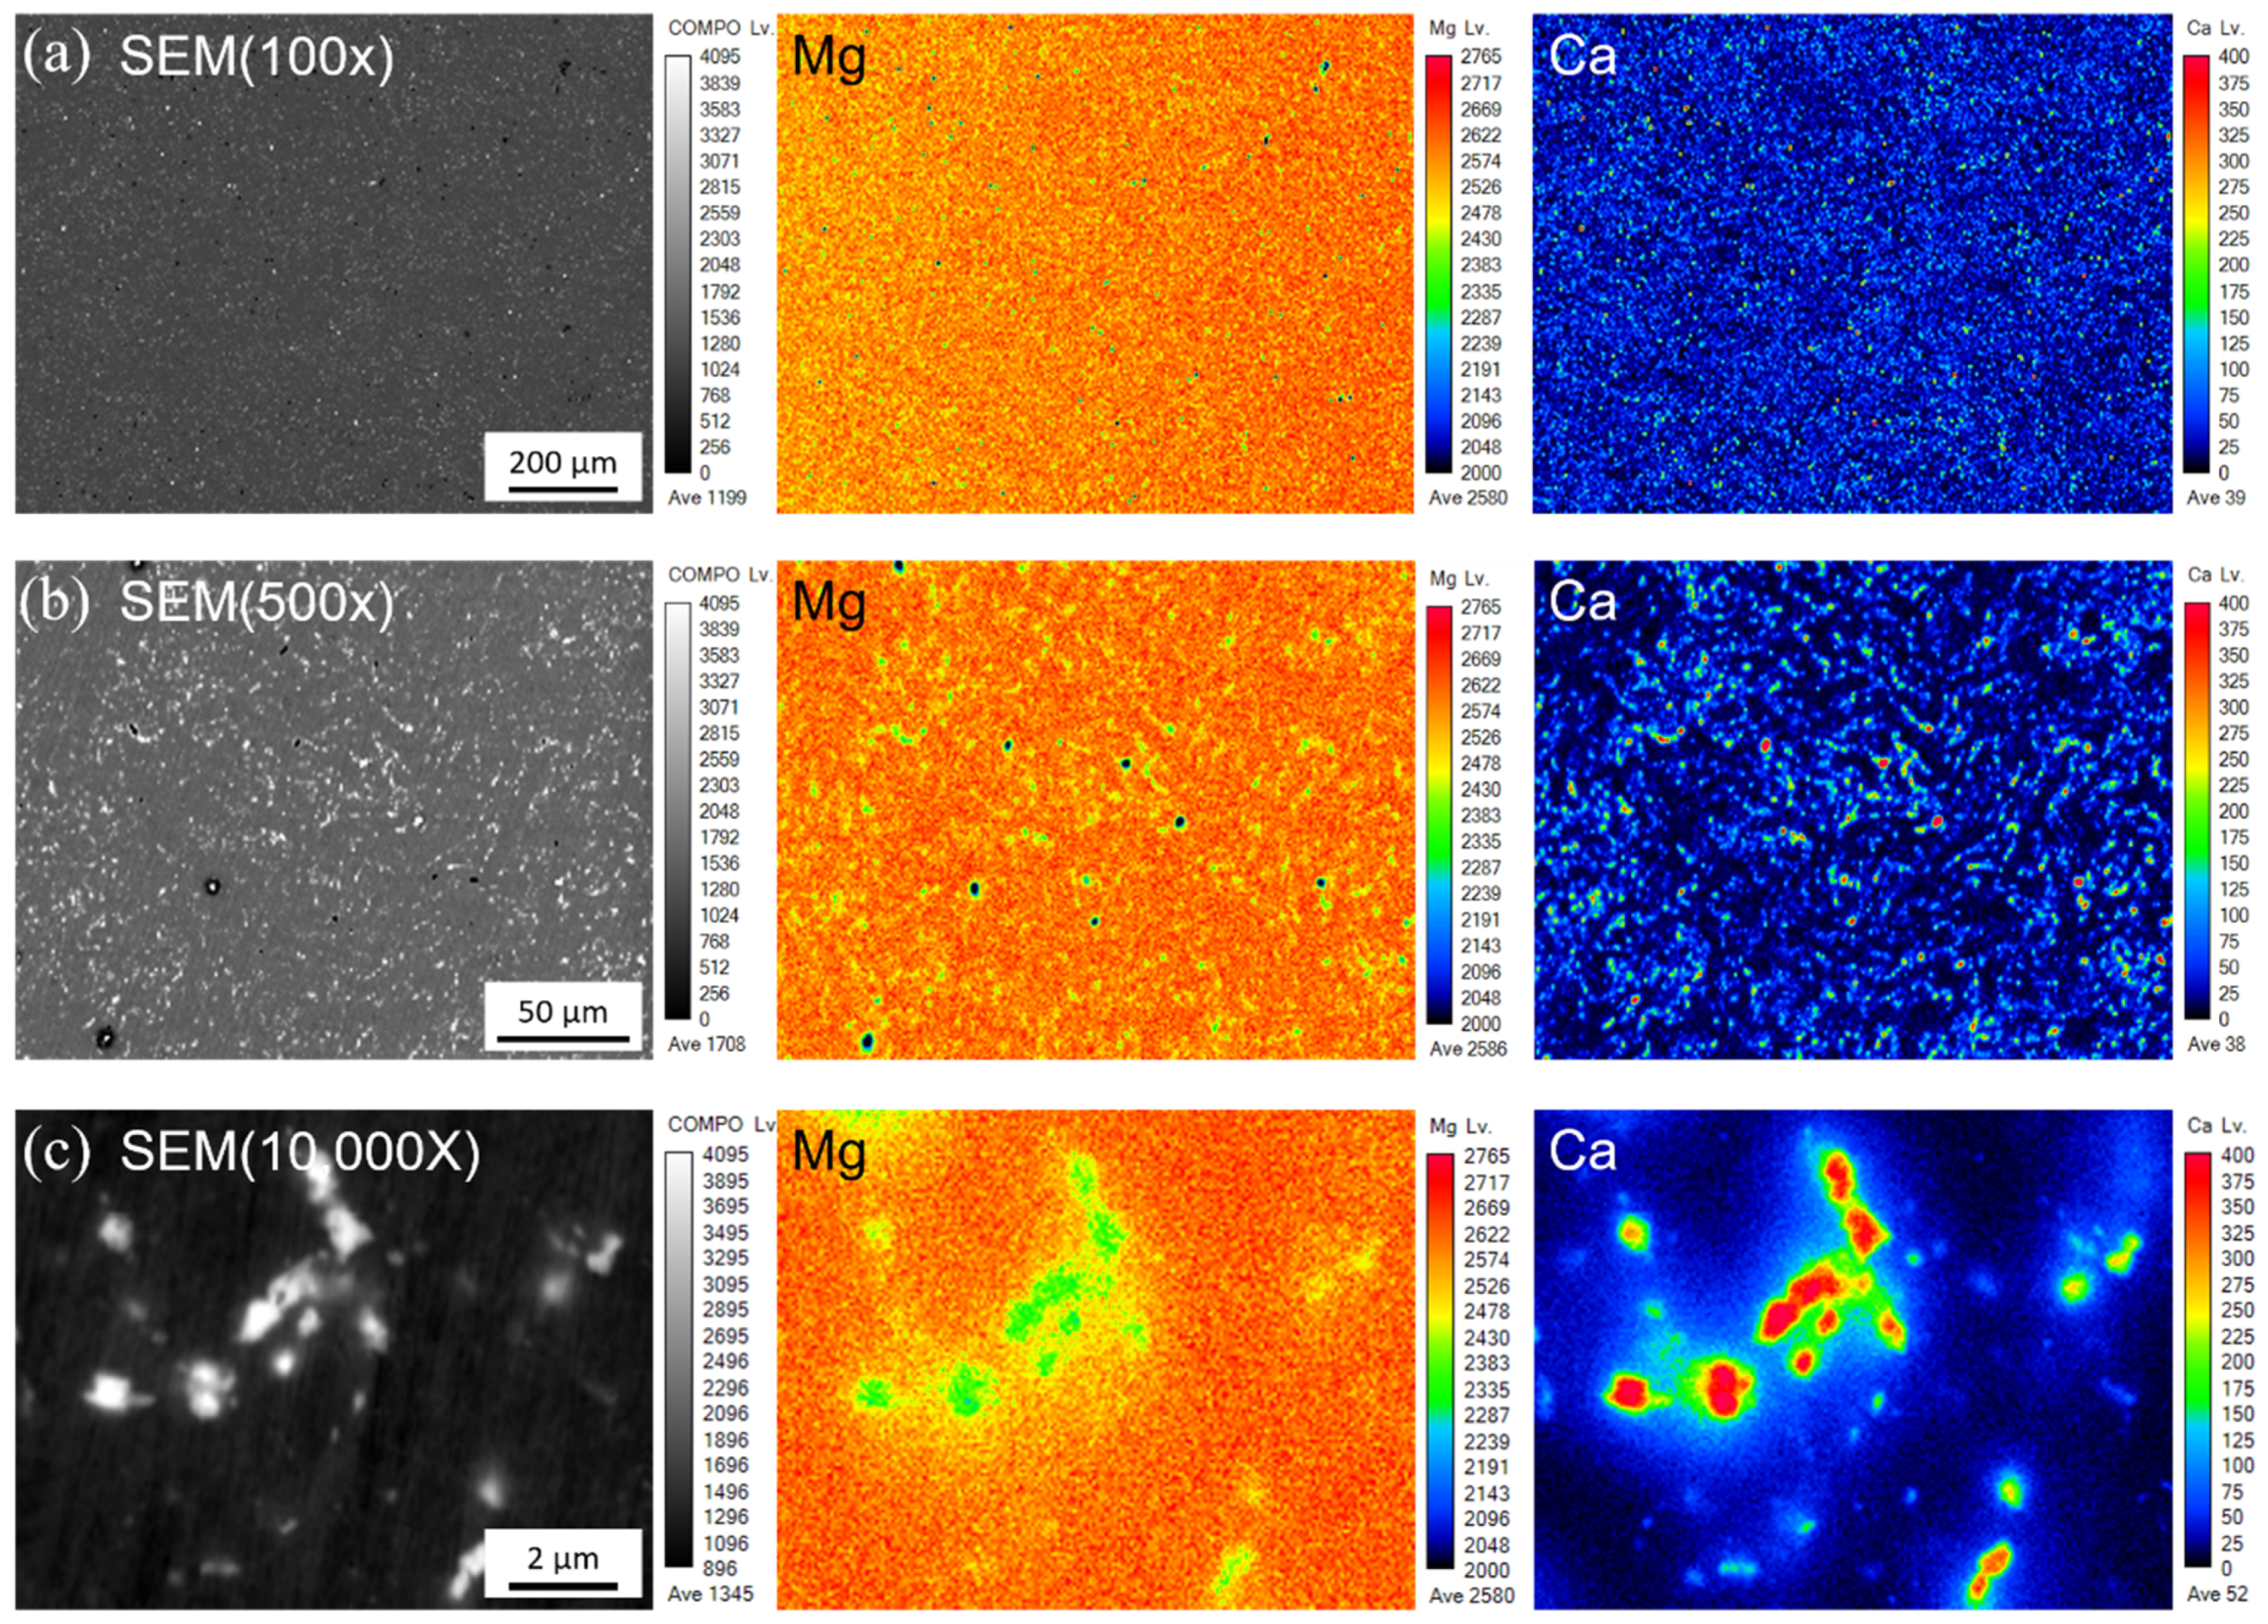
3.1. Precipitate of as-Extruded Mg–Ca Alloy

The element distribution of the as-extruded Mg–Ca alloy is mapped through wavelength-dispersive X-ray spectroscopy (WDS). Figure 2c shows the point region with a high Ca concentration, which is corresponding to the Mg2Ca precipitation of Mg–Ca [15,16]. Also, it can be seen that fine Mg2Ca precipitates are uniformly distributed in the Mg–Ca alloy as shown in Figure 2a,b.

3.2. Characteristics of HZO Film

The cross-sectional TEM images and corresponding EDS mapping of HZO(200 cycles) film deposited on Mg–Ca alloy are shown in Figure 3. As shown in Figure 3a,b, HZO film uniformly covers the Mg–Ca alloy. The thickness of HZO(200 cycles) film is 24.57 nm, so the growth rate of the HZO film is about 1.23 Å/cycle. Through the Fast Fourier transformation (FFT) diagram shown in the inset of Figure 3b, diffraction spots without diffraction halos are observed, which indicates that the HZO film is crystalline. EDS composition mapping shown in Figure 3c is used to determine which elements the ALD film contains. In the region of ALD film, Zr, Hf, and O signals are observed, which indicates that the ALD film is the HZO film. Therefore, the crystalline HZO film is successfully fabricated on Mg–Ca alloy, and conformal and uniform coverage is achieved.
The crystal structures of HZO films are determined by XRD measurement. As shown in Figure 4, the two peaks located at 28.2° and 35.4° are the diffraction signal of the monoclinic structure of (111) and (200) planes, and the other three peaks located at 30.3°, 50.5°, and 60.1° are the diffraction results of orthorhombic or tetragonal structure, corresponding to signal of (111), (220), and (311) planes [17,18]. The other peaks are the diffraction signals of the Mg–Ca substrate. The observation of the signals of different planes from HZO films indicates the HZO films deposited on Mg–Ca alloy in this case are polycrystalline. Also, as the film thickness increases, the peak intensity of all diffraction peaks of the HZO film becomes stronger.

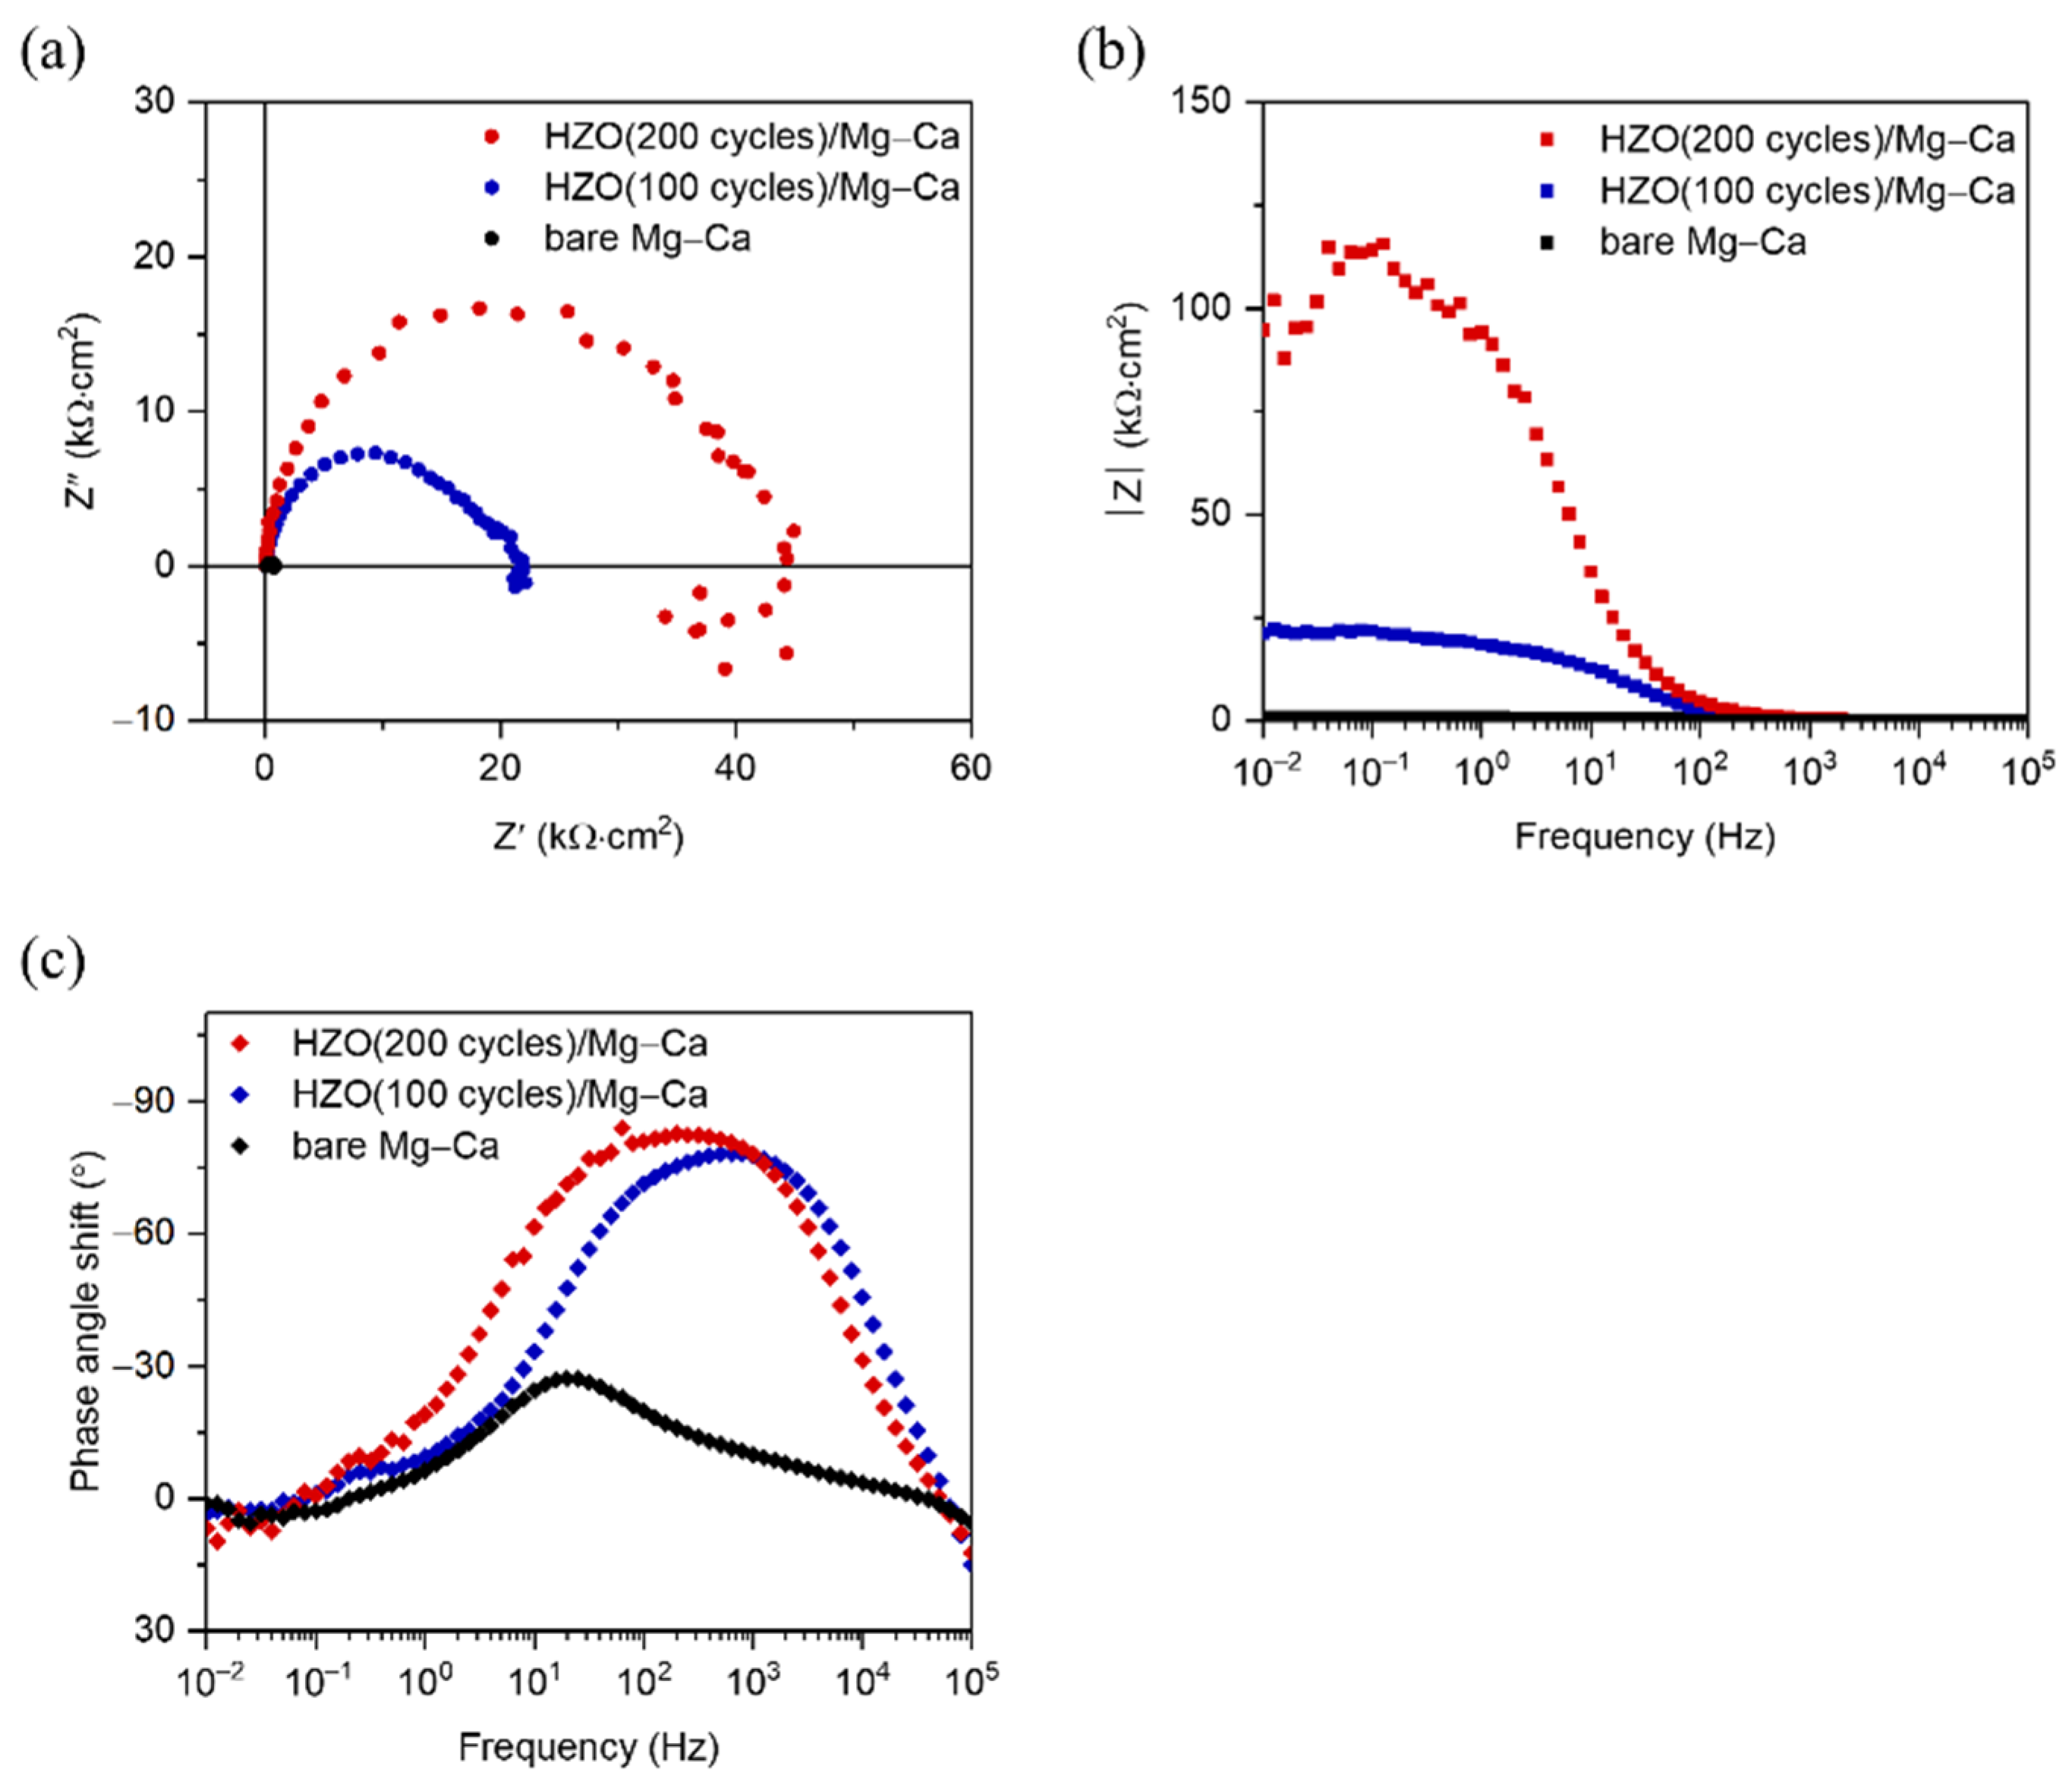
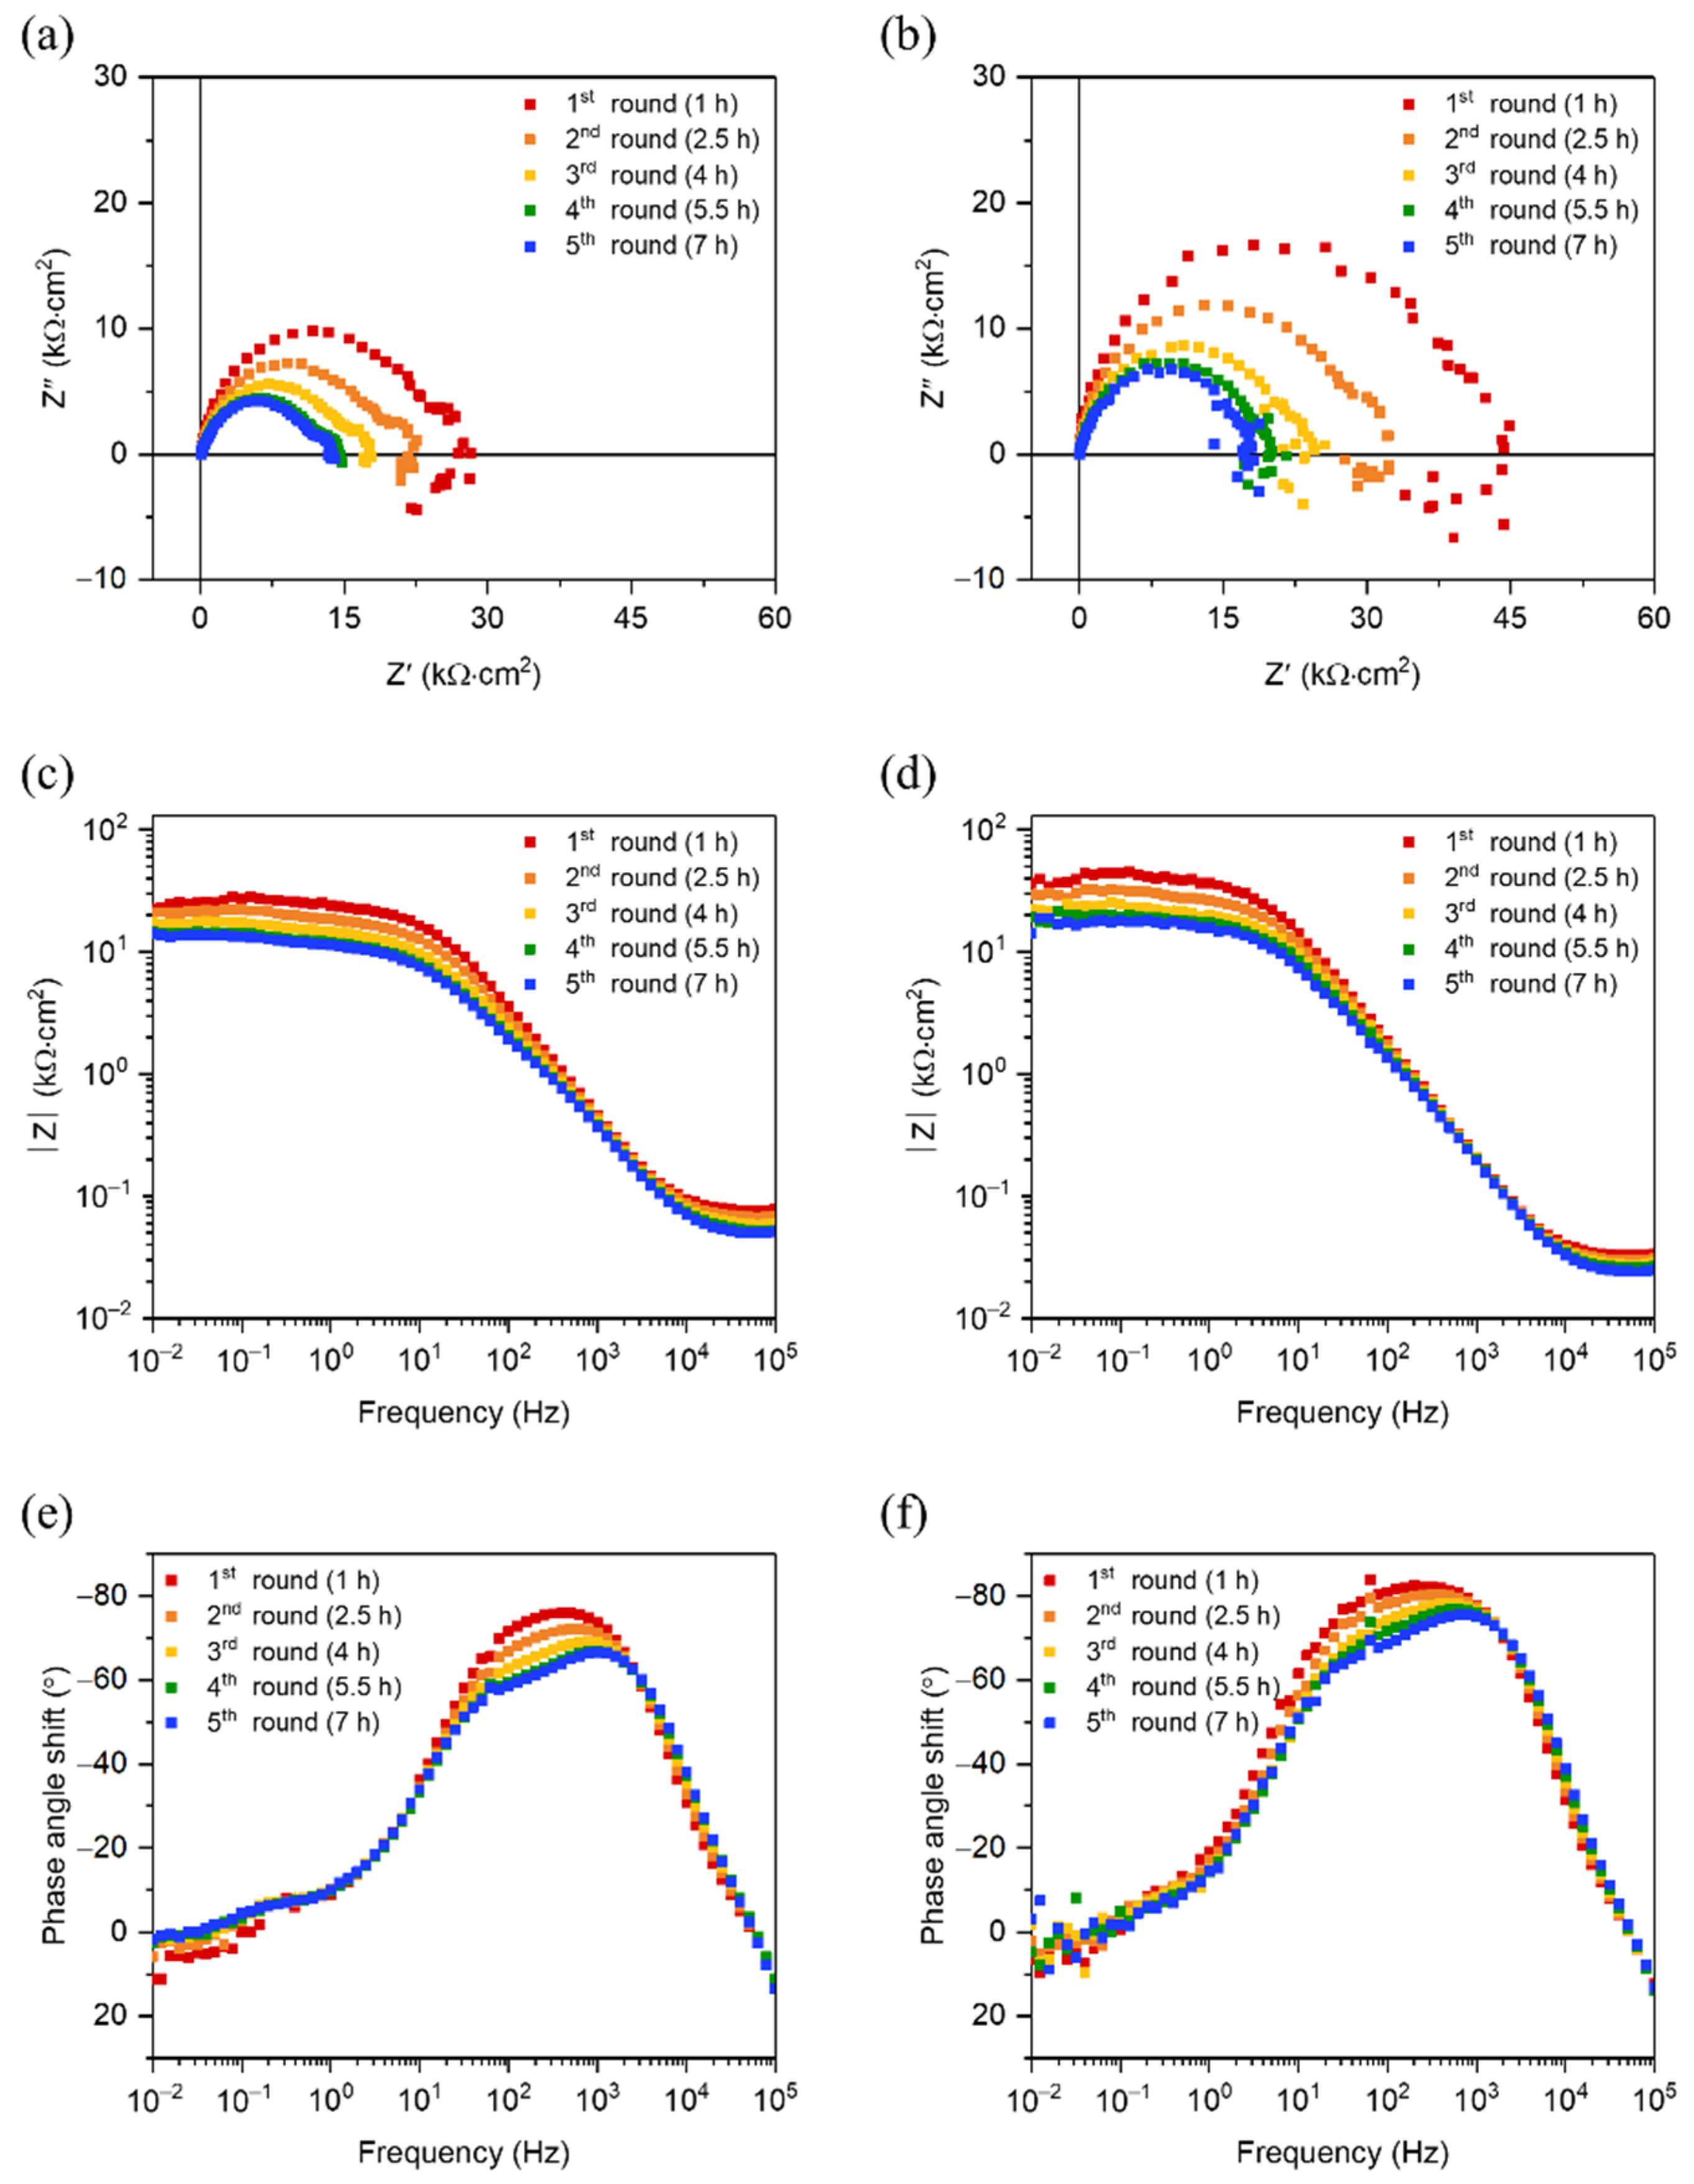
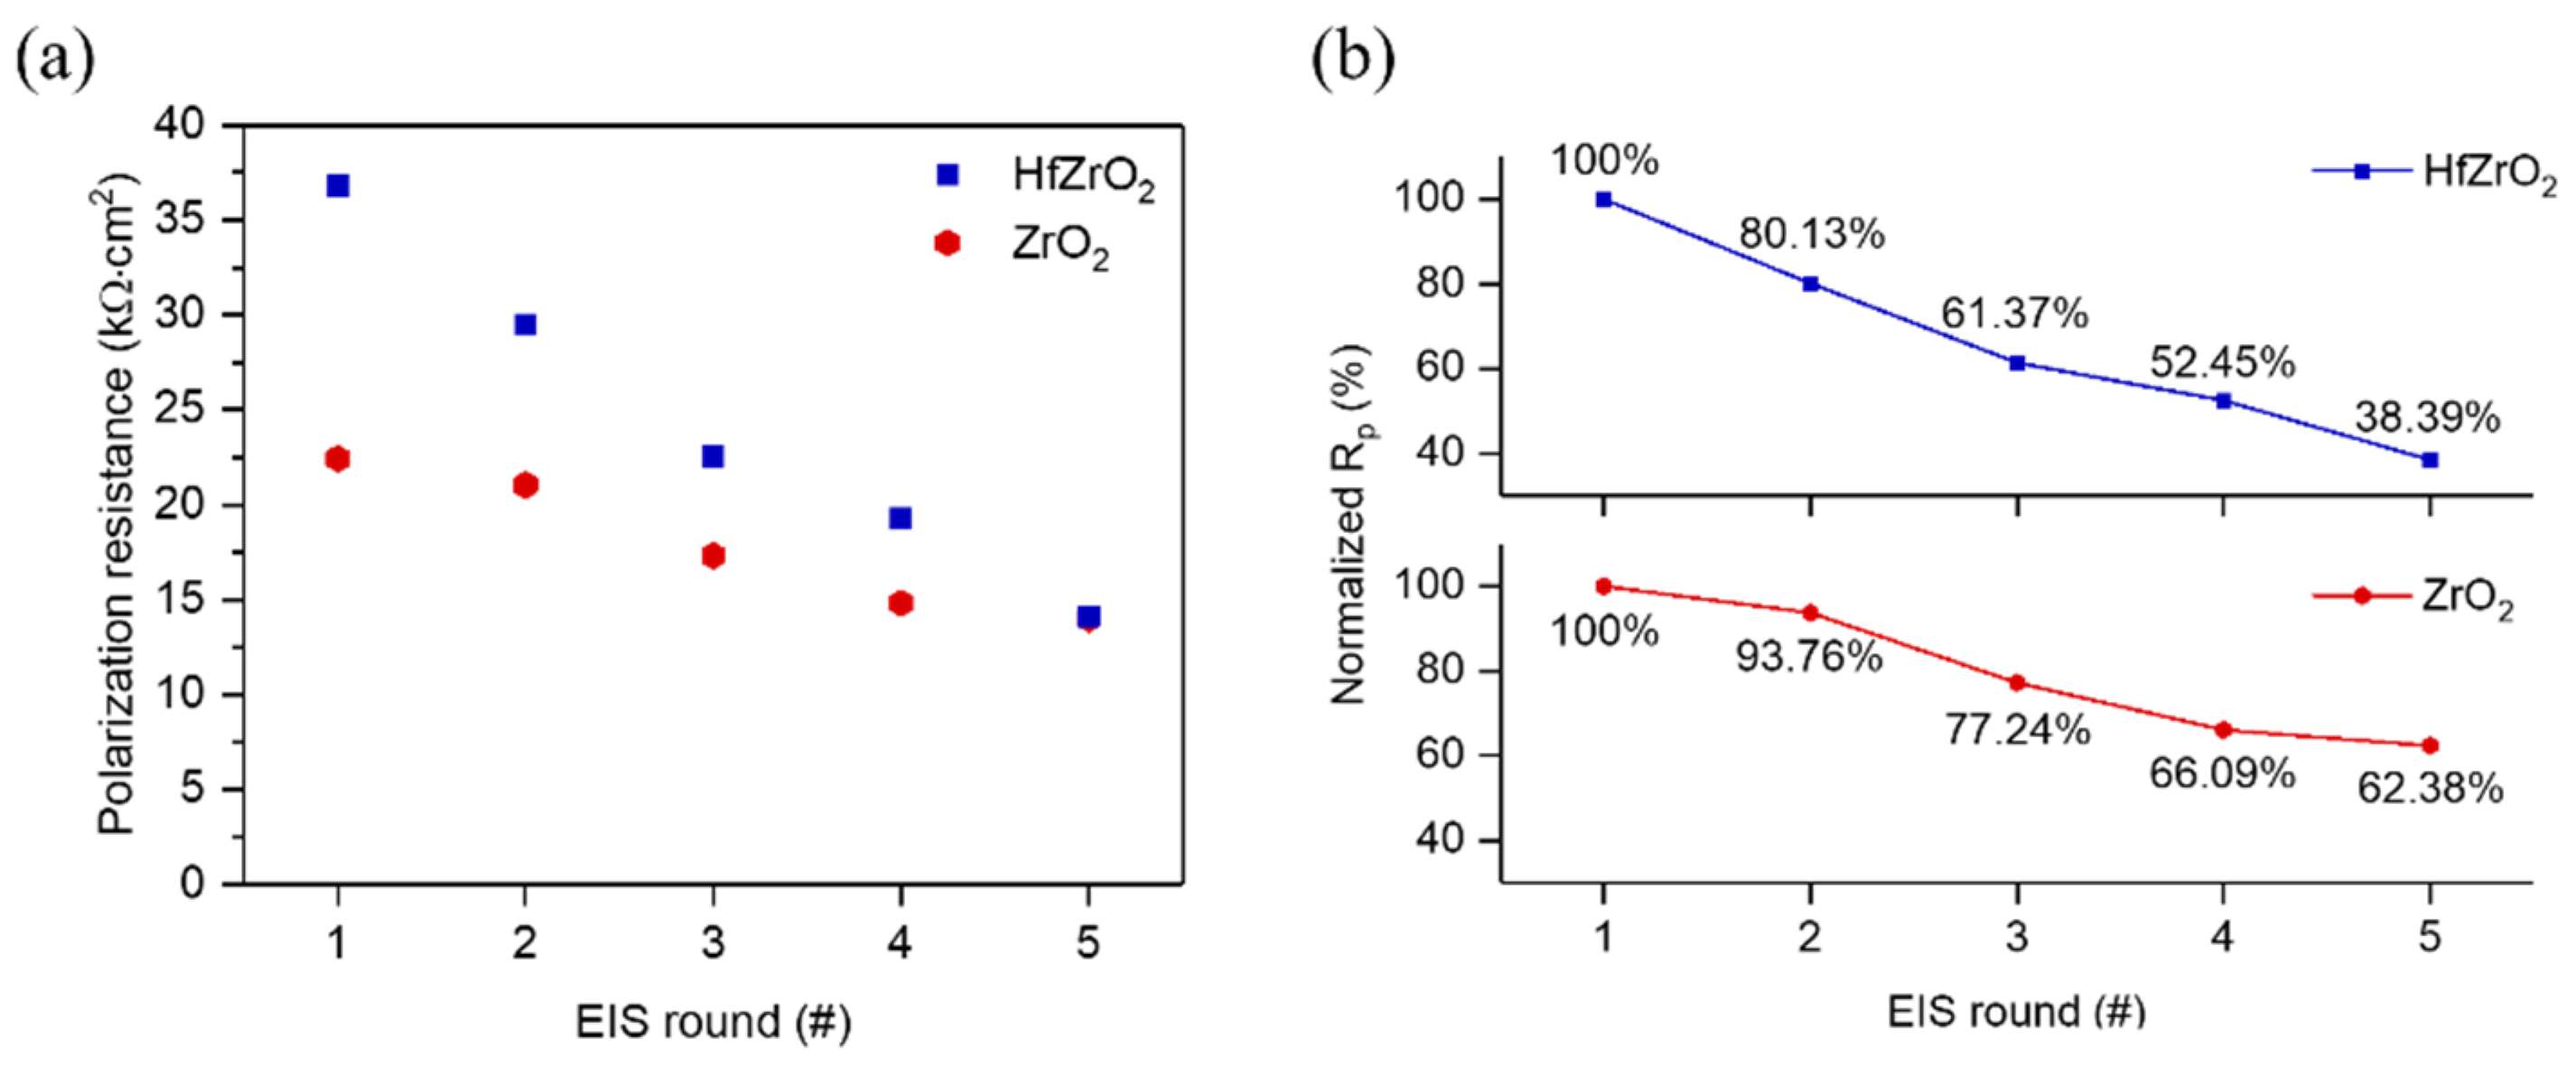
3.3. Corrosion Resistance of HZO Film

The Nyquist plots of HZO films are measured by the EIS tests, and the results are shown in Figure 5a. It is found that the diameter of the Nyquist plot of Mg–Ca becomes larger as the coverage of HZO films and the diameter of the Nyquist plot of HZO(200 cycles)/Mg–Ca is much larger than HZO(100 cycles)/Mg–Ca, indicating that the thicker HZO film has better corrosion protection performance, which is consistent with the previous reports [4]. The corrosion resistance of bare Mg–Ca alloy and Mg–Ca alloy covered with HZO films of 100 and 200 cycles are 0.78, 21.27, and 94.77 kΩ·cm2, respectively. Here, the corrosion resistance is determined by the absolute impedance of the Bode plot in Figure 5b at a frequency of 10−2 Hz because the implant system would not be applied with an external voltage generally.
On the other hand, the quality of the capacitance characteristics of the HZO film depends on the phase angle shift of the output wave, as shown in Figure 5c. The phase angle shift of the output wave on the bare Mg–Ca alloy is −27.2°. After covering the HZO film for 100 and 200 cycles, it increases to −78.1° and −82.5°, respectively. For a perfect capacitance, the phase angle shift is −90°. Those results indicate the HZO films show good capacitance characteristics, and the thicker film shows higher capacitance characteristics.

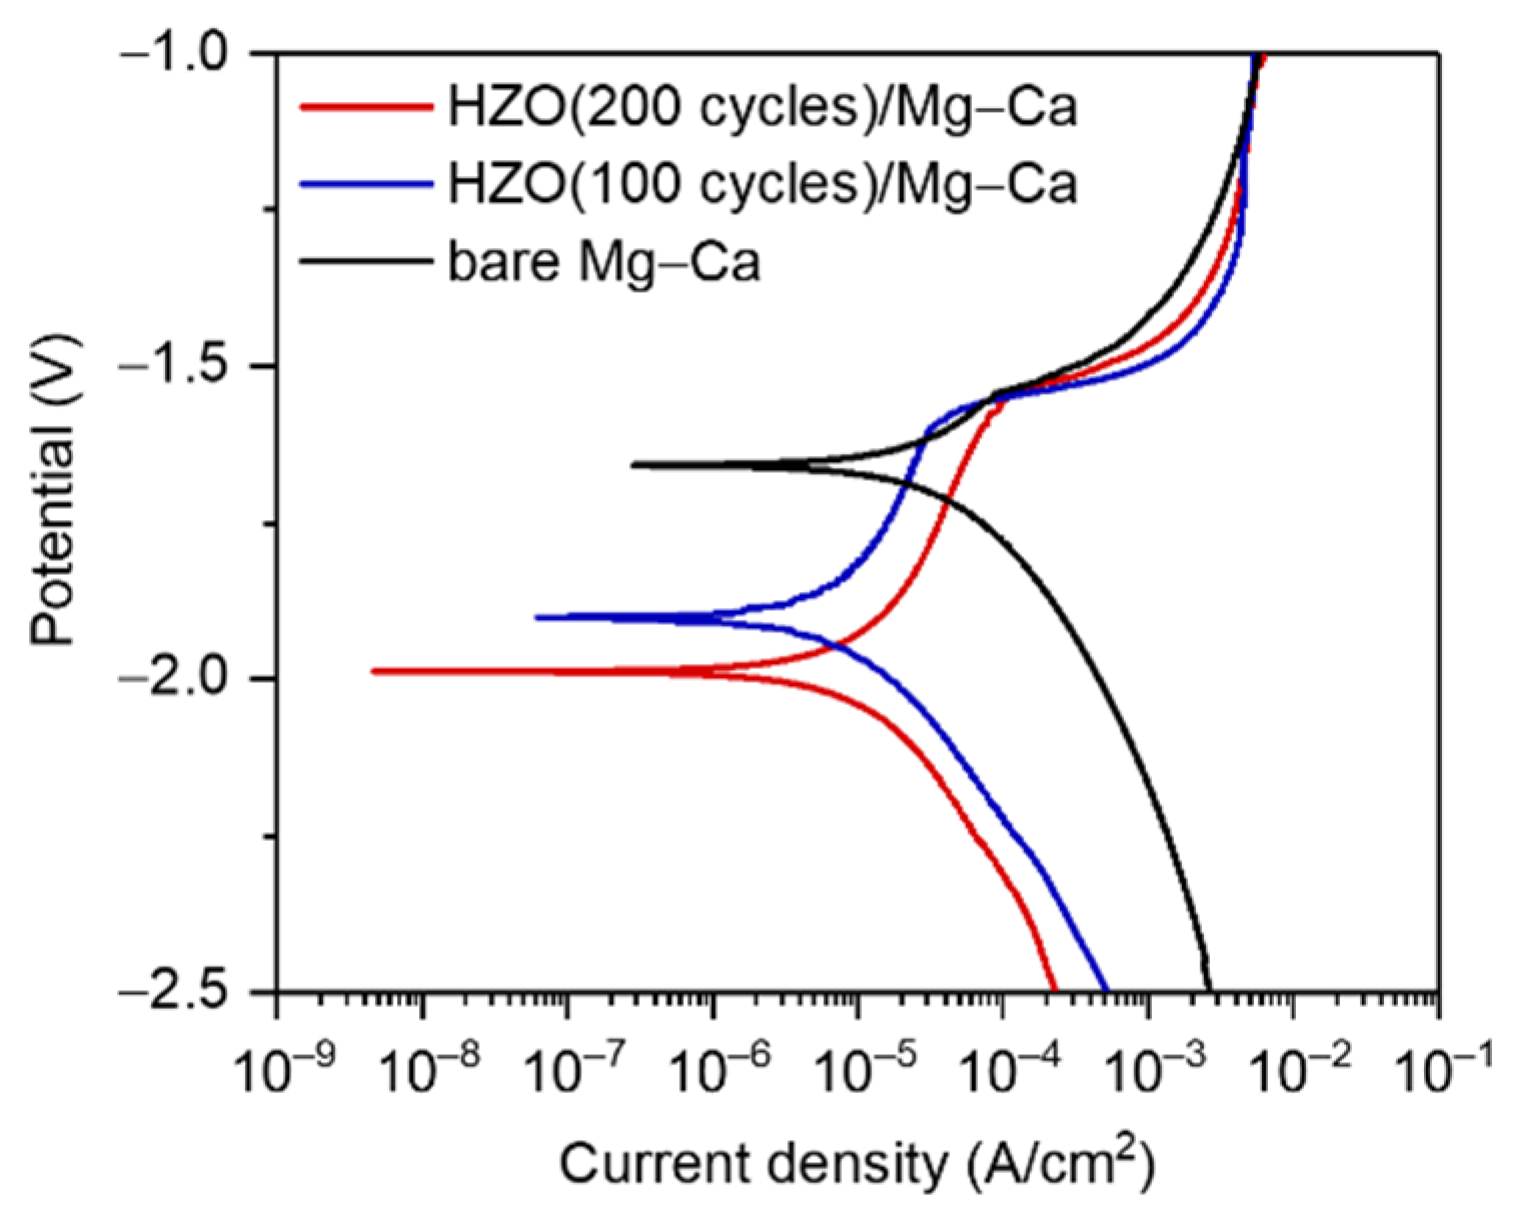
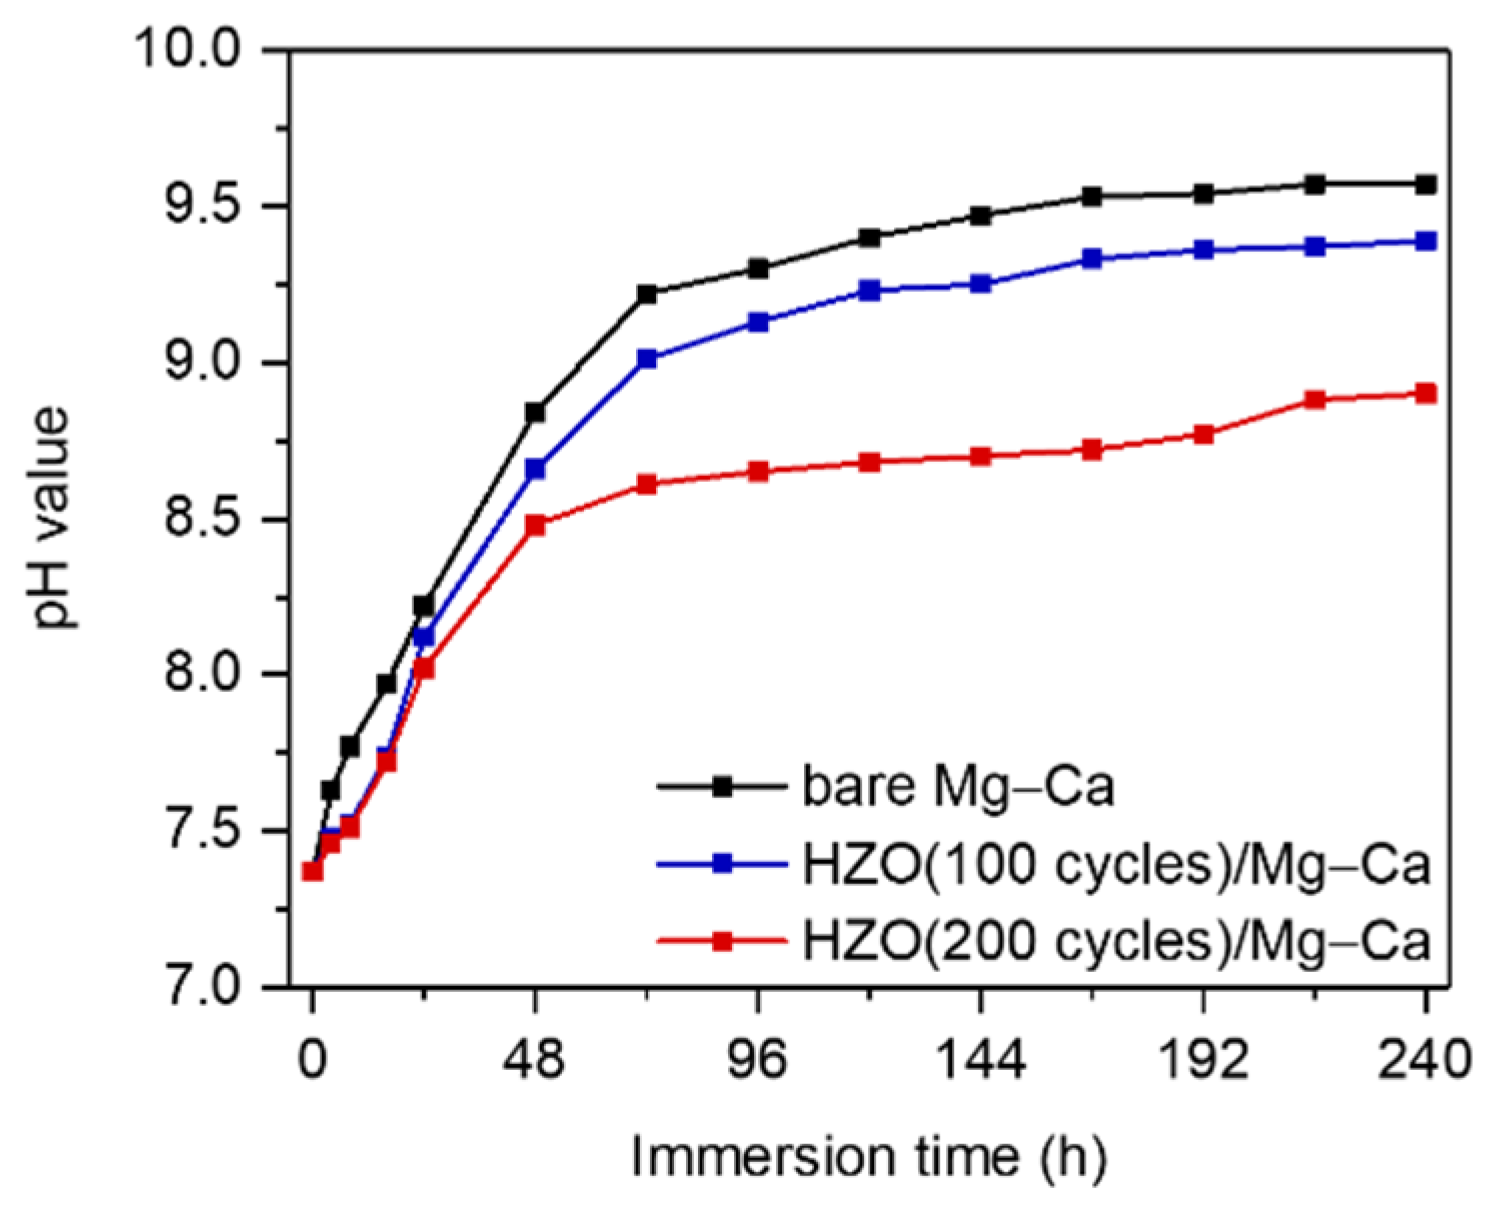
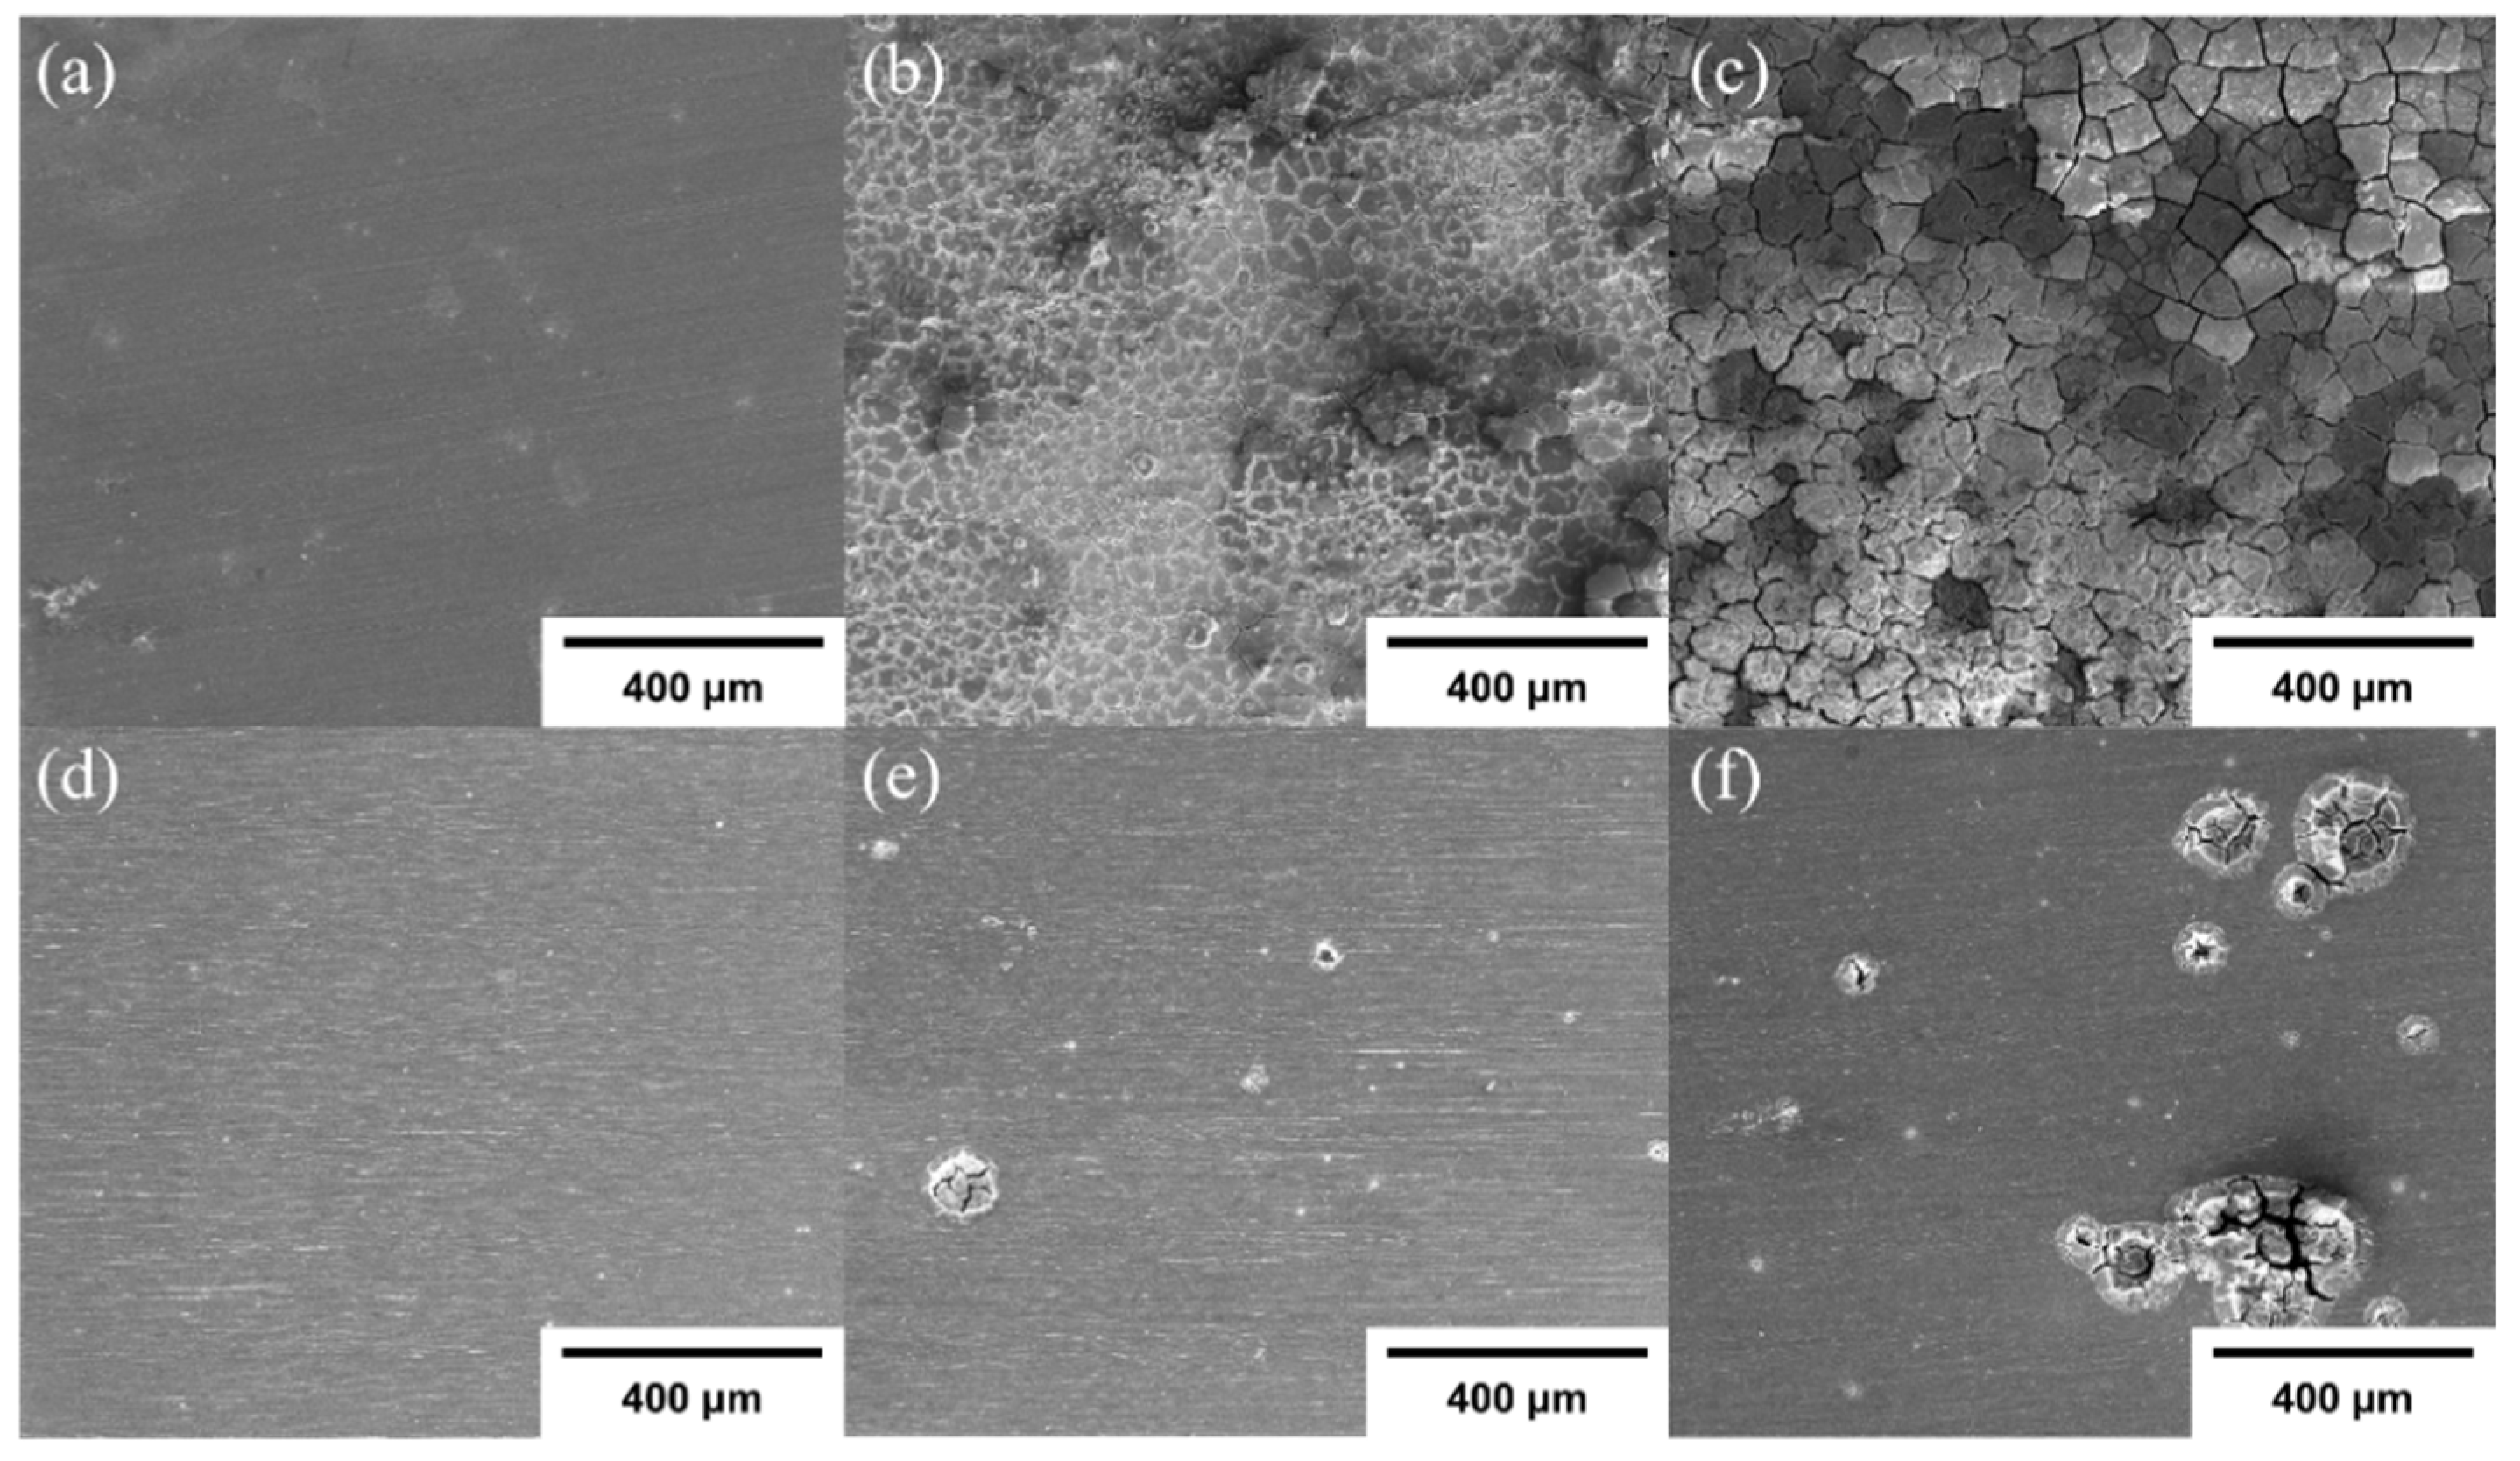
3.4. Corrosion Rate of Mg–Ca Alloy with/without HZO Film

It is reported that the coverage of ALD oxide film increases the corrosion resistance of metals, which is accompanied by the decrease of the corrosion rate of metal [5]. The corrosion rate is determined by the corrosion current density measured from PDP analysis. During the PDP measurement, the current density is a function of the applied voltage, the analyzed region is from −1 to 1 V vs OCP, and the scan rate is 1 mV/s. After the results of current density are recorded, the corrosion current density of each sample is calculated by Tafel interpolation with the voltage range of ± 120 mV vs Ecorr.
As shown in Figure 6, the corrosion current density (icorr) of bare Mg–Ca alloy is 2.56 × 10⁻⁵ A/cm2, and the icorr of HZO(200 cycles)/Mg–Ca and HZO(100 cycles)/Mg–Ca are 8.39 × 10⁻⁶ A/cm2 and 7.31 × 10⁻⁶ A/cm2, respectively. Lower corrosion current density of Mg–Ca alloy is observed after the coverage of the HZO films indicating that the increase of corrosion resistance from HZO films effectively reduces the corrosion rate of Mg–Ca alloy. Table 1 lists the corrosion potential (Ecorr) and pitting potential (Epitting) of all specimens. It can be seen that the pitting potentials of all three specimens are around −1.54 V. However, the corrosion potential (Ecorr) of the bare Mg–Ca alloy is −1.66 V, and it moves to −1.89 V and −1.98 V after covering the HZO film of 100 cycles and 200 cycles, respectively. The corrosion potential becomes more negative with the coverage of HZO films, which is different from the general concept of corrosion behavior. This is because the corrosion potential is directly related to the surface state [19,20].
To determine the performance of corrosion protection, the difference between Ecorr and Epitting as the passive potential region [21] is utilized as the criteria here. As the Mg–Ca alloy is deposited by the HZO films of 100 and 200 cycles, the absolute passivation potential region increases from 0.12 to 0.32 or 0.43 V, indicating that the corrosion protection becomes stronger, and it is consistent with the results of corrosion resistance [21].
On the other hand, the corrosion current density is proportional to the biodegradation rate. In the implant application, the biodegradation rate of Mg–Ca alloy is related to the release of the pH value. Thus, the change in pH value is measured to evaluate the biodegradation rate of Mg–Ca alloy. Figure 7 shows the pH value of the SBF solution immersed with Mg–Ca and HZO-coated Mg–Ca alloy as a function of immersion time. The initial pH value of the SBF solution is 7.4. With the corrosion resistance of bare Mg–Ca alloy being poor, the pH value of SBF solution increases dramatically from 7.4 to 8.84 within 48 h. As the process progresses, the pH value increases to 9.57 and reaches saturation. However, when the Mg–Ca alloy is covered with HZO film of 100 cycles, the pH value of the SBF solution reaches 8.66 within 48 h. After that, the pH value continues to rise and reaches saturation. In case the thickness of the covered HZO film is increased to 200 cycles, the pH value of the SBF solution only reaches 8.48 after immersion for 48 h. In the same immersion time, the pH value rises slowly. The deceleration of the increase of pH value indicates the coverage of HZO films inhibits the rising of pH value, which signifies that fewer possible side effects may be produced when Mg–Ca alloy is used as an implant.
The electrochemical measurements and immersion test show the corrosion reaction of Mg–Ca alloy is inhibited. To understand the change on the surface, the corroded surface is taken by SEM to observe the change during the corrosion. Before the corrosion, as shown in Figure 8a,d, the surfaces of Mg–Ca alloy with and without HZO film are similar, which means that the ALD process has no obvious effect on the specimen surface. However, after immersion in SBF solution for 8 h, crevices appear on the whole surface of bare Mg–Ca alloy, but only some pits are observed on the surface of Mg–Ca alloy with HZO film of 200 cycles, as displayed in Figure 8b,e. As the immersion time keeps increasing to 16 h, the crevices on the surface of the bare Mg–Ca alloy become larger, and more obvious irregular regions are found. For the case of Mg–Ca alloy with HZO film of 200 cycles, although the pits grow, most of the surface is still fine, as shown in Figure 8c,f. From our previous result, the formation of pits is caused by the galvanic corrosion of Mg–Ca alloy. The H2O molecule and Cl ion diffuse through ALD film and react with Mg2Ca precipitate due to the galvanic corrosion, which results in surface distortion. As the reaction goes continuously, the surface distortion becomes serious until the surface is broken to form the pits [22]. Although the diffusion of ions becomes harder, those results display the coverages of HZO films reduce the reaction area of Mg–Ca alloy so that lower corrosion rate and slower pH rising rate are observed from electrochemical and immersion tests.
In this case, the application of HZO film is used to get better short-term and long-term corrosion resistance. The corrosion resistance of HZO film and ZrO2 film is measured by EIS analysis. Continuous EIS measurements are used to analyze the decline in long-term corrosion resistance because the thickness of these protective layers are thin enough.
The continuous EIS measurement is performed for five continuous rounds to determine the attenuation of corrosion resistance. The 5 rounds of EIS measurements for ZrO2 and HZO films of 200 cycles are shown in Figure 9. It can be seen that the diameter of the Nyquist plot of HZO film is larger than ZrO2 film in the first round, which means that the short-term corrosion resistance of HZO film is higher than ZrO2 film. When the EIS measurement is carried out to the fifth round, the diameter of the Nyquist plot of the ZrO2 and HZO film decreases. As shown in Figure 10a, the polarization resistance of HZO film measured from the first to the fourth EIS measurement is higher than ZrO2 film. Both the polarization resistance of HZO film and ZrO2 film decrease during each EIS measurement. However, from the fifth EIS measurements, the polarization resistance of HZO film is 14.12 kΩ/cm2, and ZrO2 film is 13.98 kΩ/cm2, which means the corrosion protection performance of HZO and ZrO2 films are similar at this moment. The decline of corrosion resistance is determined by the normalization of corrosion resistance, and the corrosion resistance measured in the first round of EIS measurement is set as the standard (100%). From the results of the normalized ratio, as shown in Figure 10b, the normalized percentage of corrosion resistance of ZrO2 film decreases from 100% to 62.38%; however, the normalized percentage of corrosion resistance of HZO film decreases significantly to 38.89%, which shows that the long-term corrosion decline of ZrO2 film is better than that of HZO film. In addition, in the first round of EIS measurement, as shown in Figure 9c, the phase angle shifts (corresponding to the capacitance characteristics) of the ZrO2 and HZO films are −76.0° and −82.5°, respectively. After the EIS measurement of 5 times, the phase angle shifts of ZrO2 and HZO films decrease to −65.7° and −75.2°, which signifies the capacitance characteristics of films in a corrosive environment have decreased. For the perfect capacitance, the phase angle shift is −90°. Accordingly, the phase angle shift of HZO film is higher than ZrO2 film, which means that the HZO film shows better capacitance characteristics than the ZrO2 film.

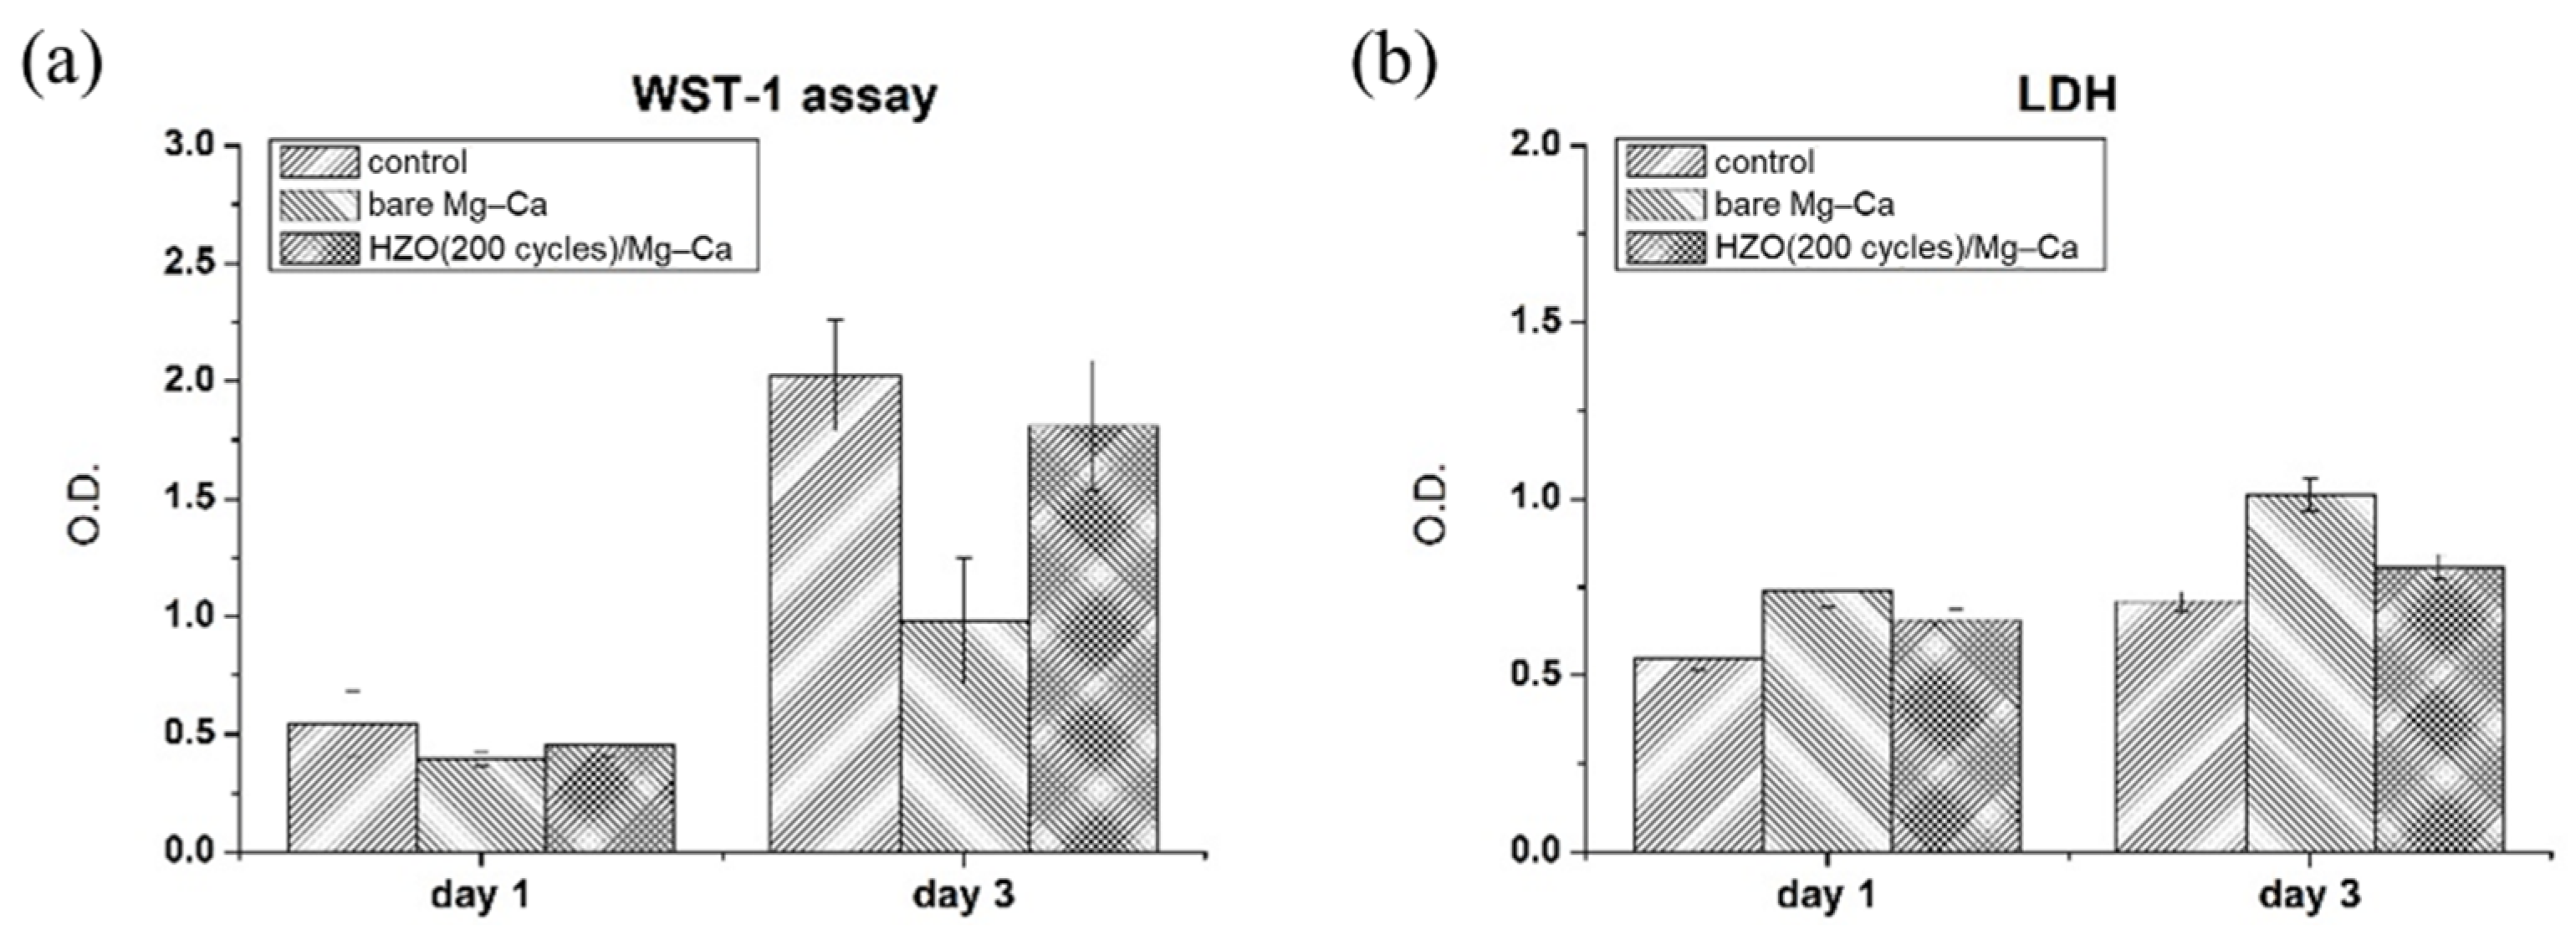
3.5. Biocompatibility of HZO Film

The biocompatibility of HfO2 and ZrO2 has been studied in that they are biocompatible and their toxicities are low [9,23]. To further clarify the biocompatibility of HZO film, the mitochondrial activity of cells and LDH concentration are utilized to identify the biocompatibility of HZO film. Figure 11a shows the mitochondrial activity of cells measured by WST-1 assay. It can be found that after cells are cultured in the extract with bare Mg–Ca alloy for three days, the mitochondrial activity of cells significantly decreases, which is statistically significantly lower than that of HZO(200 cycles)/Mg–Ca (p < 0.001). However, there is no statistical difference between HZO(200 cycles)/Mg–Ca and the control group. In terms of cytotoxicity, as shown in Figure 11b, the LDH concentration of MG-63 cells cultured in the extract of bare Mg–Ca alloy for one day is higher than that of the control group (p < 0.01), which means the test extract components released by bare Mg–Ca alloy have adverse effects on cell viability and toxicity. However, no statistical difference in LDH concentration is observed between the HZO(200 cycles)/Mg–Ca extract group and the control group on the first day and third day, indicating that HZO(200 cycles)/Mg–Ca does not affect cell viability and death. In short, the results of biocompatibility and pH value evaluation show the HZO film is low toxic and can reduce the possible side effects of Mg–Ca alloy, which means the HZO has the potential to be used as the coating layer of bio-metal.

4. Conclusions

The ALD–HZO film can be fabricated on the as-extruded Mg–Ca alloy to improve the corrosion resistance. The short-term corrosion resistance of HZO film is higher than ZrO2 film. However, the decline of the long-term corrosion resistance of HZO film is faster than ZrO2 film within five continuous ESI measurements.
With the improvement of the corrosion resistance of Mg–Ca alloy, the biodegradation rate of Mg–Ca alloy is further improved. These characteristics are confirmed by the results of the corrosion current density measured by the PDP, the evaluation of pH value, and the corroded surface images.
As a potential protection layer for bio-metal, the toxicity of HZO film is low, which is confirmed by the analyses of WST-1 assay and LDH concentration. In addition, the results of pH value evaluation show the usage of HZO film may improve the possible side effects from Mg–Ca alloy.

Author Contributions

Conceptualization, P.-C.L.; Data curation, K.L., Y.-H.L. and K.-C.Y.; Formal analysis, P.-C.L. and K.-C.Y.; Methodology, V.I.S.; Supervision, H.-C.L. and M.-J.C.; Writing–original draft, P.-C.L.; Writing–review & editing, H.-C.L. All authors have read and agreed to the published version of the manuscript.

Funding

This research was funded by the program of Ministry of Science and Technology of Taiwan (Contract No.: MOST 109-2221-E-002-116 and MOST 110-2221-E-002-047-MY3) and the Russian Foundation for Basic Research (Project No.: 20-58-S52001).

Institutional Review Board Statement

Not applicable.

Informed Consent Statement

Not applicable.

Data Availability Statement

The authors confirm that the data supporting the findings of this study are available within the article.

Acknowledgments

The authors thank the Instrumentation Center, National Taiwan University for EPMA, SEM, and TEM experiments, and National Tsing Hua University for ICP-OES analysis.

Conflicts of Interest

The authors declare no conflict of interest.

References

  1. George, S.M. Atomic layer deposition: An overview. Chem. Rev. 2010, 110, 111–131. [Google Scholar] [CrossRef] [PubMed]
  2. Puurunen, R.L. Surface chemistry of atomic layer deposition: A case study for the trimethylaluminum/ water process. J. Appl. Phys. 2005, 97, 121301. [Google Scholar] [CrossRef]
  3. Profijt, H.B.; Potts, S.E.; van de Sanden, M.C.M.; Kessels, W.M.M. Plasma-assisted atomic layer deposition: Basics, opportunities, and challenges. J. Vac. Sci. Technol. A Vac. Surf. Film. 2011, 29, 050801. [Google Scholar] [CrossRef] [Green Version]
  4. Yang, Q.; Yuan, W.; Liu, X.; Zheng, Y.; Cui, Z.; Yang, X.; Pan, H.; Wu, S. Atomic layer deposited ZrO2 nanofilm on Mg–Sr alloy for enhanced corrosion resistance and biocompatibility. Acta Biomater. 2017, 58, 515–526. [Google Scholar] [CrossRef]
  5. Daubert, J.S.; Hill, G.T.; Gotsch, H.N.; Gremaud, A.P.; Ovental, J.S.; Williams, P.S.; Oldham, C.J.; Parsons, G.N. Corrosion protection of copper using Al2O3, TiO2, ZnO, HfO2, and ZrO2 atomic layer deposition. ACS Appl. Mater. Interfaces 2017, 9, 4192–4201. [Google Scholar] [CrossRef] [PubMed]
  6. Peron, M.; BinAfif, A.; Dadlani, A.; Berto, F.; Torgersen, J. Comparing physiologically relevant corrosion performances of Mg AZ31 alloy protected by ALD and sputter coated TiO. Surf. Coatings Technol. 2020, 395, 125922. [Google Scholar] [CrossRef]
  7. Fusco, M.; Oldham, C.; Parsons, G. Investigation of the corrosion behavior of atomic layer deposited Al2O3/TiO2 nanolaminate thin films on copper in 0.1 M NaCl. Materials 2019, 12, 672. [Google Scholar] [CrossRef] [Green Version]
  8. Marin, E.; Lanzutti, A.; Guzman, L.; Fedrizzi, L. Corrosion protection of AISI 316 stainless steel by ALD alumina/titania nanometric coatings. J. Coatings Technol. Res. 2011, 8, 655–659. [Google Scholar] [CrossRef]
  9. García-Saucedo, C.; Field, J.A.; Otero-Gonzalez, L.; Sierra-Álvarez, R. Low toxicity of HfO2, SiO2, Al2O3 and CeO2 nanoparticles to the yeast, Saccharomyces cerevisiae. J. Hazard. Mater. 2011, 192, 1572–1579. [Google Scholar] [CrossRef]
  10. Kaliaraj, G.S.; Vishwakarma, V.; Alagarsamy, K.; Kamalan Kirubaharan, A.M. Biological and corrosion behavior of m-ZrO2 and t-ZrO2 coated 316L SS for potential biomedical applications. Ceram. Int. 2018, 44, 14940–14946. [Google Scholar] [CrossRef]
  11. Kim, S.J.; Mohan, J.; Summerfelt, S.R.; Kim, J. Ferroelectric Hf0.5Zr0.5O2 thin films: A review of recent advances. JOM 2019, 71, 246–255. [Google Scholar] [CrossRef]
  12. Lee, M.H.; Chen, P.G.; Liu, C.; Chu, K.Y.; Cheng, C.C.; Xie, M.J.; Liu, S.N.; Lee, J.W.; Huang, S.J.; Liao, M.H.; et al. Prospects for ferroelectric HfZrOx FETs with experimentally CET = 0.98 nm, SSfor = 42 mV/dec, SSrev = 28 mV/dec, switch-off < 0.2 V, and hysteresis-free strategies. In Proceedings of the 2015 IEEE International Electron Devices Meeting (IEDM), Washington, DC, USA, 7–9 December 2015. [Google Scholar] [CrossRef]
  13. Cao, R.; Liu, Q.; Liu, M.; Song, B.; Shang, D.; Yang, Y.; Luo, Q.; Wu, S.; Li, Y.; Wang, Y.; et al. Improvement of endurance in HZO-based ferroelectric capacitor using ru electrode. IEEE Electron. Device Lett. 2019, 40, 1744–1747. [Google Scholar] [CrossRef]
  14. Kokubo, T.; Takadama, H. How useful is SBF in predicting in vivo bone bioactivity? Biomaterials 2006, 27, 2907–2915. [Google Scholar] [CrossRef] [PubMed]
  15. Drynda, A.; Hassel, T.; Hoehn, R.; Perz, A.; Bach, F.W.; Peuster, M. Development and biocompatibility of a novel corrodible fluoride-coated magnesium-calcium alloy with improved degradation kinetics and adequate mechanical properties for cardiovascular applications. J. Biomed. Mater. Res. Part A 2009, 93, 764–775. [Google Scholar] [CrossRef] [PubMed]
  16. Hort, N.; Huong, Y.; Kainer, K.U. Intermetallics in magnesium alloys. Adv. Eng. Mater. 2006, 8, 235–240. [Google Scholar] [CrossRef]
  17. Onodera, A.; Takesada, M. Ferroelectricity in simple binary crystals. Crystals 2017, 7, 232. [Google Scholar] [CrossRef] [Green Version]
  18. Triyoso, D.H.; Gregory, R.; Park, M.; Wang, K.; Lee, S.I. Physical and electrical properties of atomic-layer-deposited HfxZr1−xO2 with TEMAHf, TEMAZr, and ozone. J. Electrochem. Soc. 2007, 155, 43–46. [Google Scholar] [CrossRef]
  19. Magaino, S.; Kawaguchi, A.; Hirata, A.; Osaka, T. Spectrum analysis of corrosion potential fluctuations for localized corrosion of type 304 stainless steel. J. Electrochem. Soc. 1987, 134, 2993–2997. [Google Scholar] [CrossRef]
  20. Yamakawa, K.; Inoue, H. Analysis of corrosion potential fluctuation for stress corrosion cracking. Corros. Sci. 1990, 31, 503–508. [Google Scholar] [CrossRef]
  21. Sun, H.; Cooke, K.; Eitzinger, G.; Hamilton, P.; Pollet, B. Development of PVD coatings for PEMFC metallic bipolar plates. Thin Solid Film. 2013, 528, 199–204. [Google Scholar] [CrossRef]
  22. Lin, P.C.; Lin, K.F.; Chiu, C.; Semenov, V.I.; Lin, H.C.; Chen, M.J. Effect of atomic layer plasma treatment on TALD-ZrO2 film to improve the corrosion protection of Mg-Ca alloy. Surf. Coatings Technol. 2021, 427, 127811. [Google Scholar] [CrossRef]
  23. Kong, Y.M.; Bae, C.J.; Lee, S.H.; Kim, H.W.; Kim, H.E. Improvement in biocompatibility of ZrO2–Al2O3 nano-composite by addition of HA. Biomaterials 2005, 26, 509–517. [Google Scholar] [CrossRef]
Figure 1. Schematic diagram of the growth process of ALD–HZO film. The HfZrO2 film is deposited by one layer of ZrO followed by one layer of HfO. In this case, the ratio between Zr and Hf is 1:1.
Coatings 12 00212 g001
Figure 2. SEM surface observation and EPMA element distribution of as-extruded Mg–Ca alloy at a magnification of (a) 100×, (b) 500×, and (c) 10,000×. The SEM images were the backscattered electron images (BSE).
Coatings 12 00212 g002
Figure 3. Cross-sectional TEM images of HZO(200 cycles)/Mg–Ca at magnification of (a) 64,000× and (b) 440,000×. The inset of (b) is the diffraction pattern of the central region calculated by FFT. (c) The corresponding EDS mapping results of (a). The text colors listed on the left of (c) correspond to the colors in the diagram.
Coatings 12 00212 g003
Figure 4. XRD patterns of bare Mg–Ca alloy and Mg–Ca alloy with HZO films of 100 and 200 cycles. The label of m-, t-, and o- are corresponding to the monoclinic structure, tetragonal structure, and orthorhombic structure, respectively.
Coatings 12 00212 g004
Figure 5. (a) Nyquist plots of bare Mg–Ca alloy and Mg–Ca alloy with HZO films of 100 and 200 cycles. (b) Bode plots of absolute impedance, and (c) phase angle shift of output wave of HZO films of 100 and 200 cycles.
Coatings 12 00212 g005
Figure 6. Potentiodynamic polarization curves of bare Mg–Ca alloy and HZO films of 100 and 200 cycles.
Coatings 12 00212 g006
Figure 7. The pH value of SBF solutions as a function of immersion time after immersing bare Mg–Ca alloy, HZO(100 cycles)/Mg–Ca, and HZO(200 cycles)/Mg–Ca specimens.
Coatings 12 00212 g007
Figure 8. SEM images of the uncorroded surfaces of (a) bare Mg–Ca alloy and (d) HZO(200 cycles)/Mg–Ca. The corroded surfaces of bare Mg–Ca alloy immersed in SBF solution for (b) 8 h, and (c) 16 h and the corroded surfaces of HZO(200 cycles)/Mg–Ca immersed in SBF solution for (e) 8 h, and (f) 16 h.
Coatings 12 00212 g008
Figure 9. The results of continuous EIS measurement. (a,b) Nyquist plots, (c,d) Bode plots of absolute impedance, and (e,f) phase angle shifts of ZrO2 and HZO films with the thickness is 200 cycles. The acquisition time of each round is corresponding to the corrosion time for sample.
Coatings 12 00212 g009
Figure 10. The decline of corrosion resistance of ZrO2 and HZO films. (a) the absolute value of polarization resistance, and (b) normalized polarization resistance of each EIS measurement. The corrosion resistance measured in each round of EIS is normalized with the corrosion resistance of the 1st round of EIS.
Coatings 12 00212 g010
Figure 11. The cytotoxicity of bare Mg–Ca alloy and HZO(200 cycles)/Mg–Ca. (a) WST-1 assay to test mitochondrial activity and (b) LDH concentration to analyze cell viability and death.
Coatings 12 00212 g011
Table 1. Results of the corrosion current density (icorr), corrosion potential (Ecorr), pitting potential (Epitting), and the potential difference between Ecorr and Epitting of PDP curves in Figure 6.
Sampleicorr (A/cm2)Ecorr (V)Epitting (V)Epitting-Ecorr (V)
Bare Mg–Ca alloy2.56 × 10−5−1.66−1.540.12
HZO(100 cycles)/Mg–Ca8.39 × 10−6−1.89−1.570.32
HZO(200 cycles)/Mg–Ca7.31 × 10−6−1.98−1.550.43
Publisher’s Note: MDPI stays neutral with regard to jurisdictional claims in published maps and institutional affiliations.

