Abstract
The use of thin films consisting of TiO2 and reduced graphene oxide (TiO2–rGO) in solar harnessing devices is gaining momentum thanks to improved charge-transporting characteristics. In this report, we propose a facile spin-coating methodology for the deposition of crack-free and thickness-controllable TiO2–rGO thin films. A range of characterization techniques were utilized to confirm the formation of the TiO2–rGO thin film. Improved charge-transporting properties of TiO2–rGO composite thin films were confirmed by measuring their photoelectrochemical (PEC) activity under simulated solar light illumination. In particular, it was found that the TiO2–rGO composite thin film yielded a better photocurrent response (~151.3 µA/cm2) than the bare TiO2 thin film (~71.6 µA/cm2) at 1.23 eV vs. the reversible hydrogen electrode (RHE). The obtained results suggested that rGO addition remarkably improves the charge-transporting properties in TiO2 films.
1. Introduction
Mesoporous TiO2 thin films are widely utilized as electron transport layers in solar harvesting devices, such as dye-sensitized solar cells [1,2], perovskite solar cells [3,4], and photoelectrochemical cells [5]. However, the efficiency of electron transport in these TiO2 thin films is hindered because of charge trapping, recombination, and grain boundary scattering effects [6,7]. Hence, it is of great scientific interest to develop a fabrication methodology for TiO2 thin films with improved charge transfer and reduced charge recombination characteristics. The addition of rGO into TiO2 films can be considered an efficient way to tackle the issues mentioned previously. For example, TiO2–rGO films demonstrated improved light absorbance, better charge transfer, and reduced charge recombination compared to bare TiO2 films [6,7,8]. Hence, TiO2–rGO films are extensively employed for the construction of sensors [9], dye-sensitized solar cells [10], perovskite solar cells [11,12], photoelectrochemical (PEC) cells [13], for field-emission display applications [14], etc.
To date, sol–gel [10,11], aerosol-assisted chemical vapor deposition combined with dip-coating [13], and spray pyrolysis [15] techniques are commonly used for the preparation of TiO2–rGO films. In general, the above-mentioned methods make it possible to obtain TiO2–rGO films with uneven thicknesses, cracks and rough surfaces. Therefore, it is still a challenging task to deposit thickness-controllable and crack-free TiO2–rGO films, which is a typical requirement for solar harvesting devices. Furthermore, the majority of nanoparticles-based films have a tendency to form cracks after thermal treatment, which is detrimental to the device functionality. In addition, it is also of great interest to develop a methodology that is user-friendly, scalable, and not time-consuming. Spin-coating is the most widely used method for the preparation of perovskite solar cells, polymeric films, photoelectrochemical cells, and metal oxide-based sensors thanks to the deposition simplicity and control over the film thickness. In this report, we propose a facile and effective spin-coating methodology for the deposition of crack-free TiO2–rGO films. We strongly believe that the proposed methodology can be employed for the construction of solar harvesting devices with improved charge-transporting properties.
2. Materials and Methods
Graphene nanoplatelets (GNPs, few nm thickness, particle size < 2 µm, and surface area ~750 m2/g, CAS number 7782-42-5) and other high purity reagents were purchased from Merck KGaA (Darmstadt, Germany) and used as received. TiO2 slurry paste was prepared according to a method reported earlier [16]. In brief, 6 g of TiO2 nanoparticles (NPs, P25, d~20–26 nm) was ground for 3 min in a mortar with 5 mL of ethanol (97%) to make a slurry paste. Next, the slurry paste was transferred to 100 mL of ethanol, dispersed by sonication, and stirred for 10 min. Later, 20 g of terpineol (≥98%) was added, and the mixture was stirred for 30 min. Finally, 3 g of ethyl cellulose (48.0–49.5 w/w) was added, and the mixture was kept under vigorous stirring for 24 h. Finally, ethanol and traces of water were evaporated, leaving a TiO2 paste with high viscosity. TiO2 paste with high viscosity was diluted with 1 mL of absolute ethanol (≥99.8%) and mixed with GNP. A mixture was vigorously stirred for 24 h to yield a mixed paste with a concentration of 0.2 mg of GNPs per 1 mL of TiO2 paste (~59 mg of pure TiO2).
Clean fluorine-doped tin oxide (FTO)-coated glasses (15 mm × 20 mm, 12–16 Ω·cm−2) or polished silicon wafers were used as substrates for films deposition. Prepared pastes were deposited on clean FTO glasses or silicon wafers using a spin coater (SPIN-1200T, MIDAS SYSTEM, Daejeon, Korea) at 4000 rpm for 25 s. Obtained films were dried at ambient conditions for 1 h, and then heat-treated at 500 °C (ramping rate 40 °C·s−1) for 10 min using Rapid Thermal Annealing (RTA, MILA 5000, ULVAC Technologies, Inc., Methuen, MA, USA) system under the constant nitrogen flow (4 L·min−1).
Morphological and elemental analyses were conducted using a scanning electron microscope SEM (Auriga Crossbeam 540, Carl Zeiss, Oberkochen, Germany) equipped with energy-dispersive X-ray spectroscopy (EDX, Aztec, Oxford Instruments, Abingdon, UK). Atomic force microscopy (AFM, SmartSPM 1000, AIST-NT Inc., Novato, CA, USA) was used to obtain topographic images of the films. X-ray diffraction patterns were collected using a Rigaku SmartLab X-ray Diffractometer (XRD, Rigaku Corp., Tokyo, Japan) with a Cu Kα radiation source. UV–Vis light absorption measurements were performed using a Genesys 50 UV–Visible spectrophotometer (Thermo Fisher Scientific Inc., Waltham, MA, USA). Raman analysis was performed using a Horiba LabRam Evolution system (Horiba Ltd., Kyoto, Japan). The photoluminescence properties of the prepared films were assessed by an absolute quantum yield spectrometer (C9920-02, Hamamatsu Photonics K.K., Hamamatsu, Japan). The PEC activity of the prepared films was tested using a PalmSens4 potentiostat/galvanostat (PalmSens BV, Rahdhoeve, The Netherlands) in NaOH (0.1 M) aqueous solution using a three-electrode configuration. Three samples were tested per batch to ensure reproducibility of the results. A Newport LCS-100 solar simulator (100 W, 1.5 AM, Newport-Spectra Physics GmbH, Darmstadt, Germany) calibrated with a reference silicon cell was used as a light source. Ag/AgCl electrode and platinum wire were employed as reference and counter electrodes, respectively. The measured potentials V vs. Ag/AgCl were converted to the reversible hydrogen electrode (RHE) scale according to the following equation:
where, EAg/AgCl is the measured potential against the Ag/AgCl reference electrode and E°Ag/AgCl = 0.1976 V at 25 °C.
ERHE = EAg/AgCl + 0.059 pH + E°Ag/AgCl
3. Results and Discussion
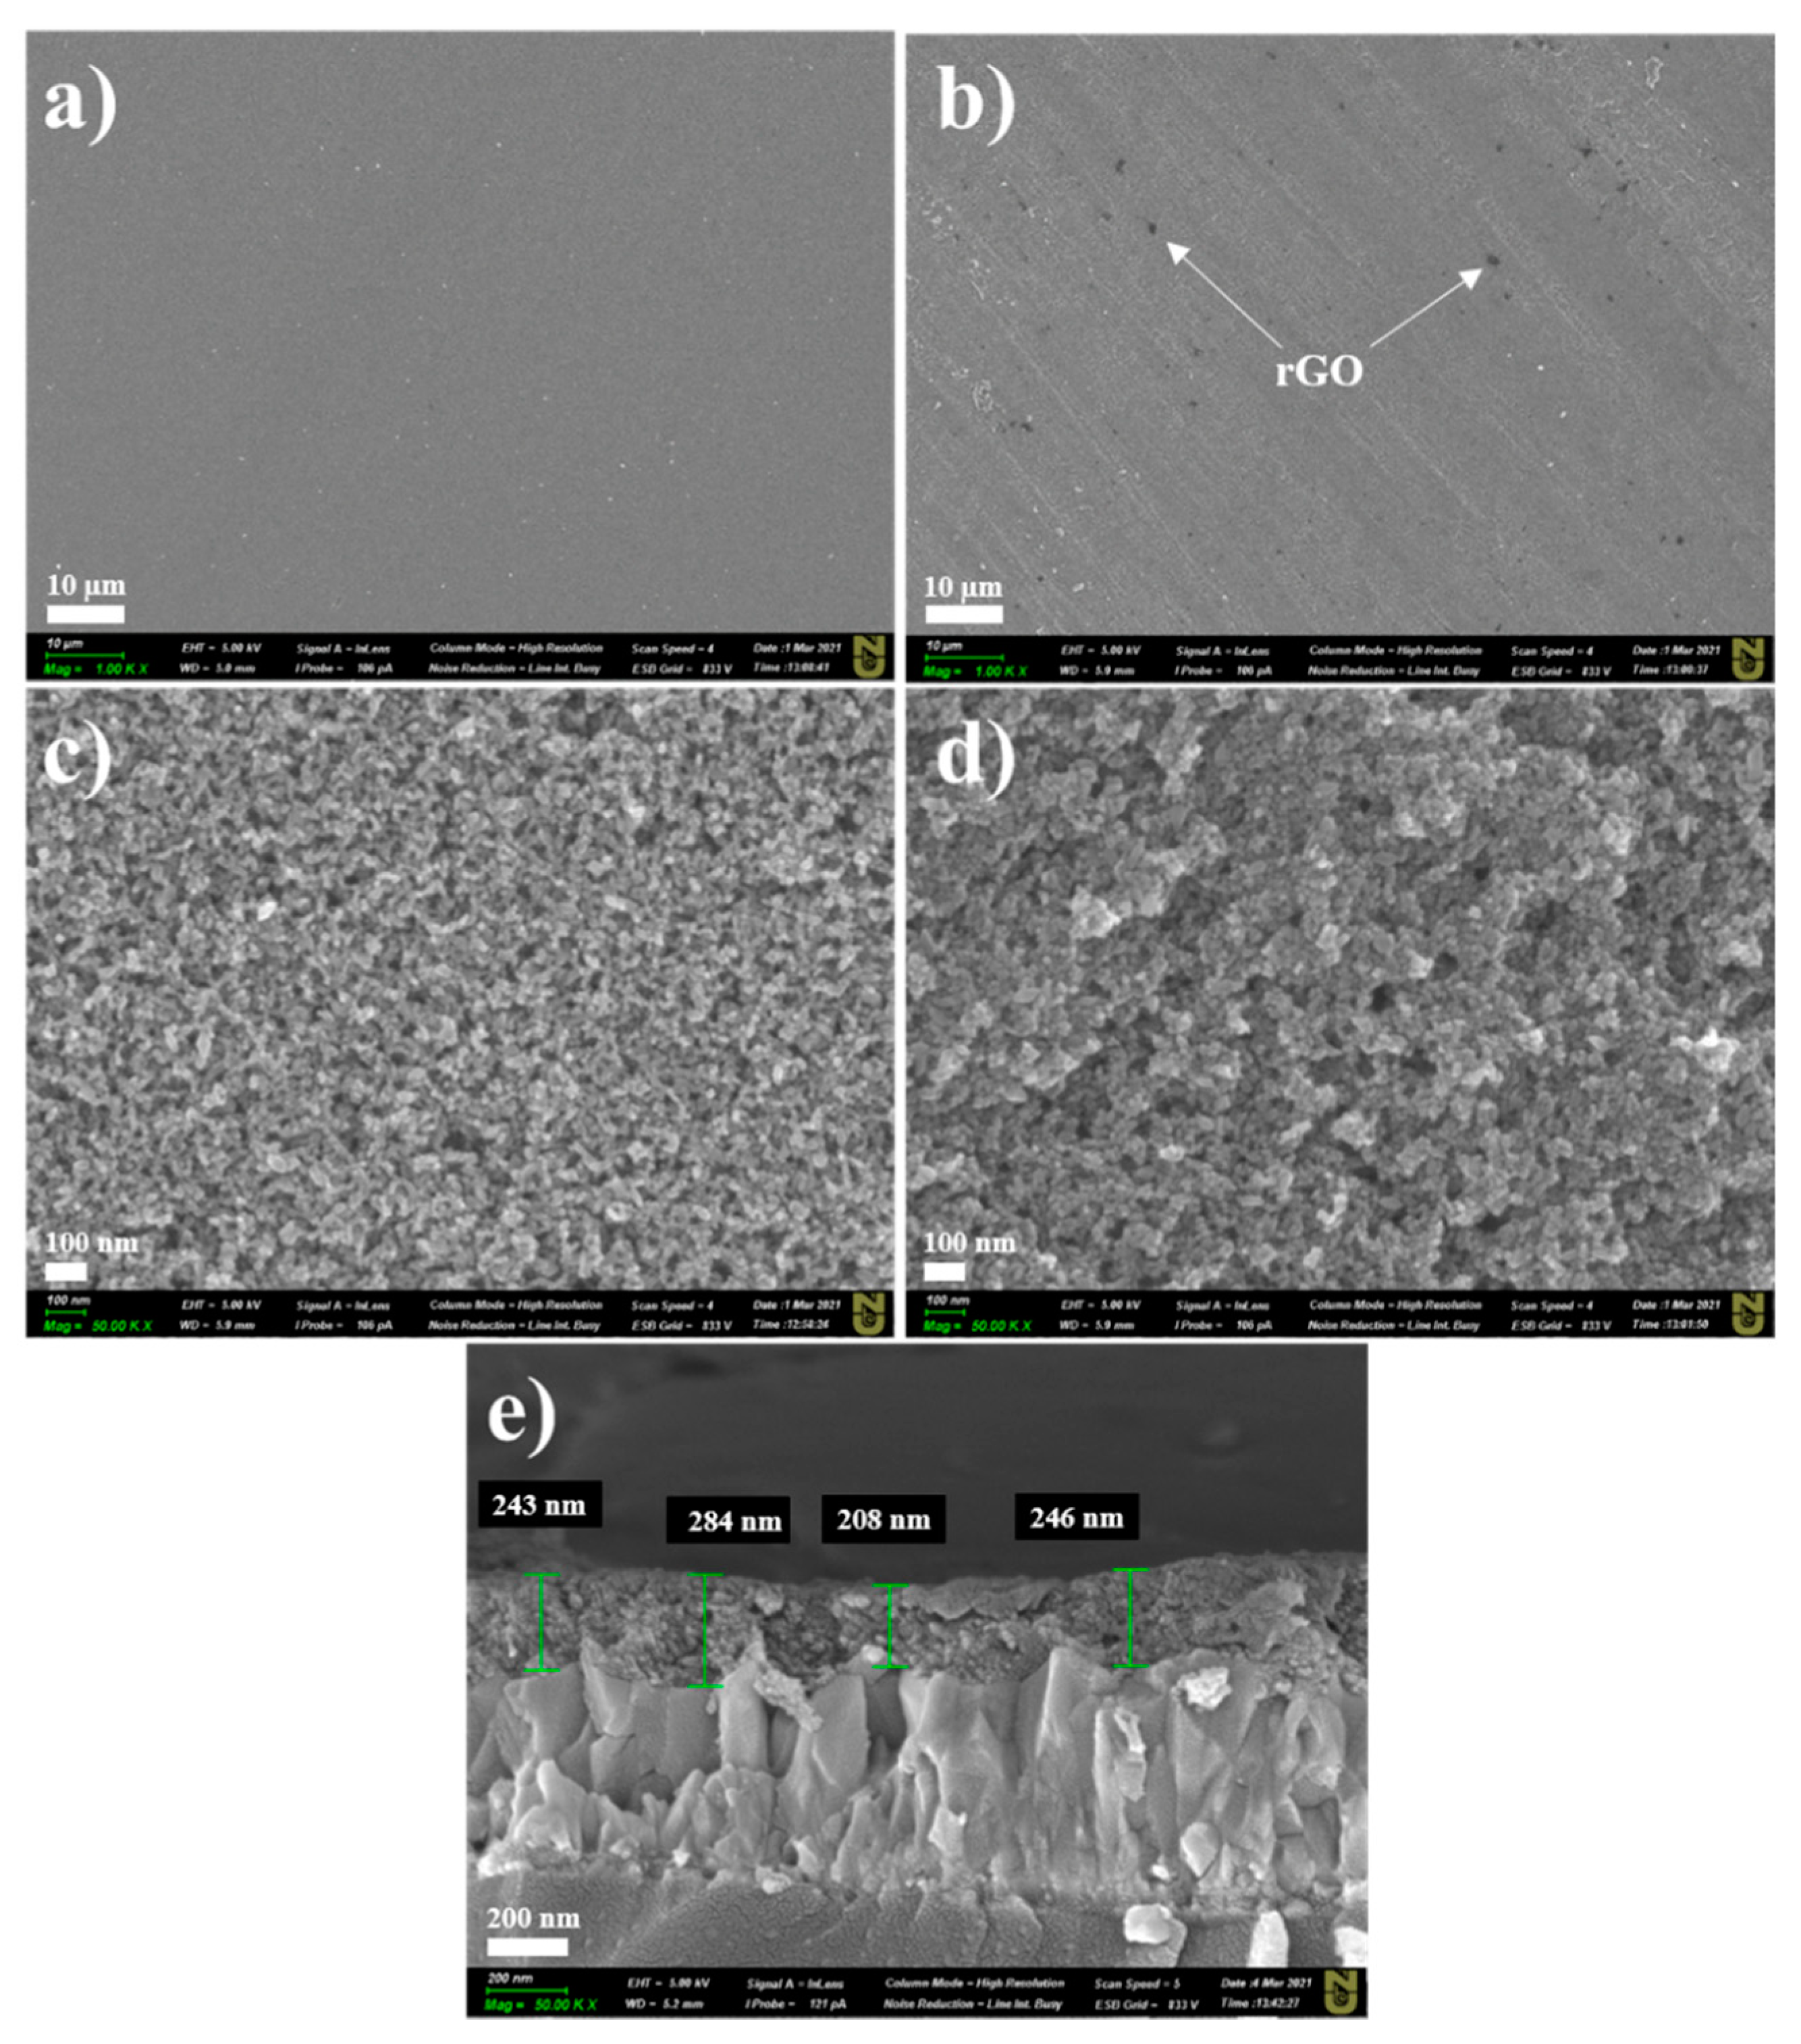
GNPs in the TiO2 layer inevitably undergo oxidation during the heat treatment [17,18]; hence, constant nitrogen flow is very important for protection purposes. Figure S1 (Supporting Information) shows the Raman analysis of the as-purchased GNPs. One can easily observe a typical pattern of multilayered graphene (ID/IG ratio ~0.41) [19]. During the heat treatment, GNPs were converted to rGO; thus, the final film was denoted TiO2–rGO. Figure 1 shows low- and high-resolution images of bare TiO2 and TiO2–rGO films deposited on FTO glasses at 4000 rpm. Morphological analysis over a large area revealed that crack-free films were formed in both cases. Visually, some differences can be easily observed between these two films. For example, the TiO2–rGO film contains some black spots on the surface that are typically explained by the presence of rGO flakes (marked). In addition, high-resolution SEM images revealed that TiO2 nanoparticles are better interconnected with each other in the TiO2–rGO film than in the bare TiO2 film. Thus, one can expect that the TiO2–rGO film will demonstrate better charge-transporting properties. A cross-sectional image confirmed the uniform deposition of TiO2–rGO film on FTO glass with an average thickness of ~245 ± 38 nm. The thickness variation is largely attributed to the high roughness of FTO (Figure 1e). It should be mentioned that the film thickness can be easily controlled by the rotation speed. As a proof-of-concept, TiO2–rGO films were deposited on cleaned silicon wafers at 1000 and 3000 rpm (Figure S2, Supporting Information). A thicker film of ~1.4 µm can be obtained at low speed (1000 rpm). A thinner film (~665 nm) was obtained at 3000 rpm. Thus, one can easily adjust the film thickness by controlling the speed of rotation.
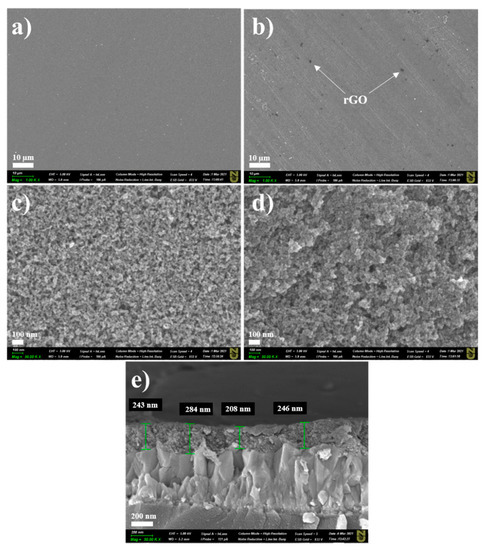
Figure 1.
Low-resolution SEM images of (a) TiO2 film and (b) TiO2–rGO film (scale bar—10 µm). High-resolution SEM images of (c) TiO2 film and (d) TiO2–rGO film (scale bar—100 nm). Cross-sectional SEM image of (e) TiO2–rGO film (scale bar—200 nm).
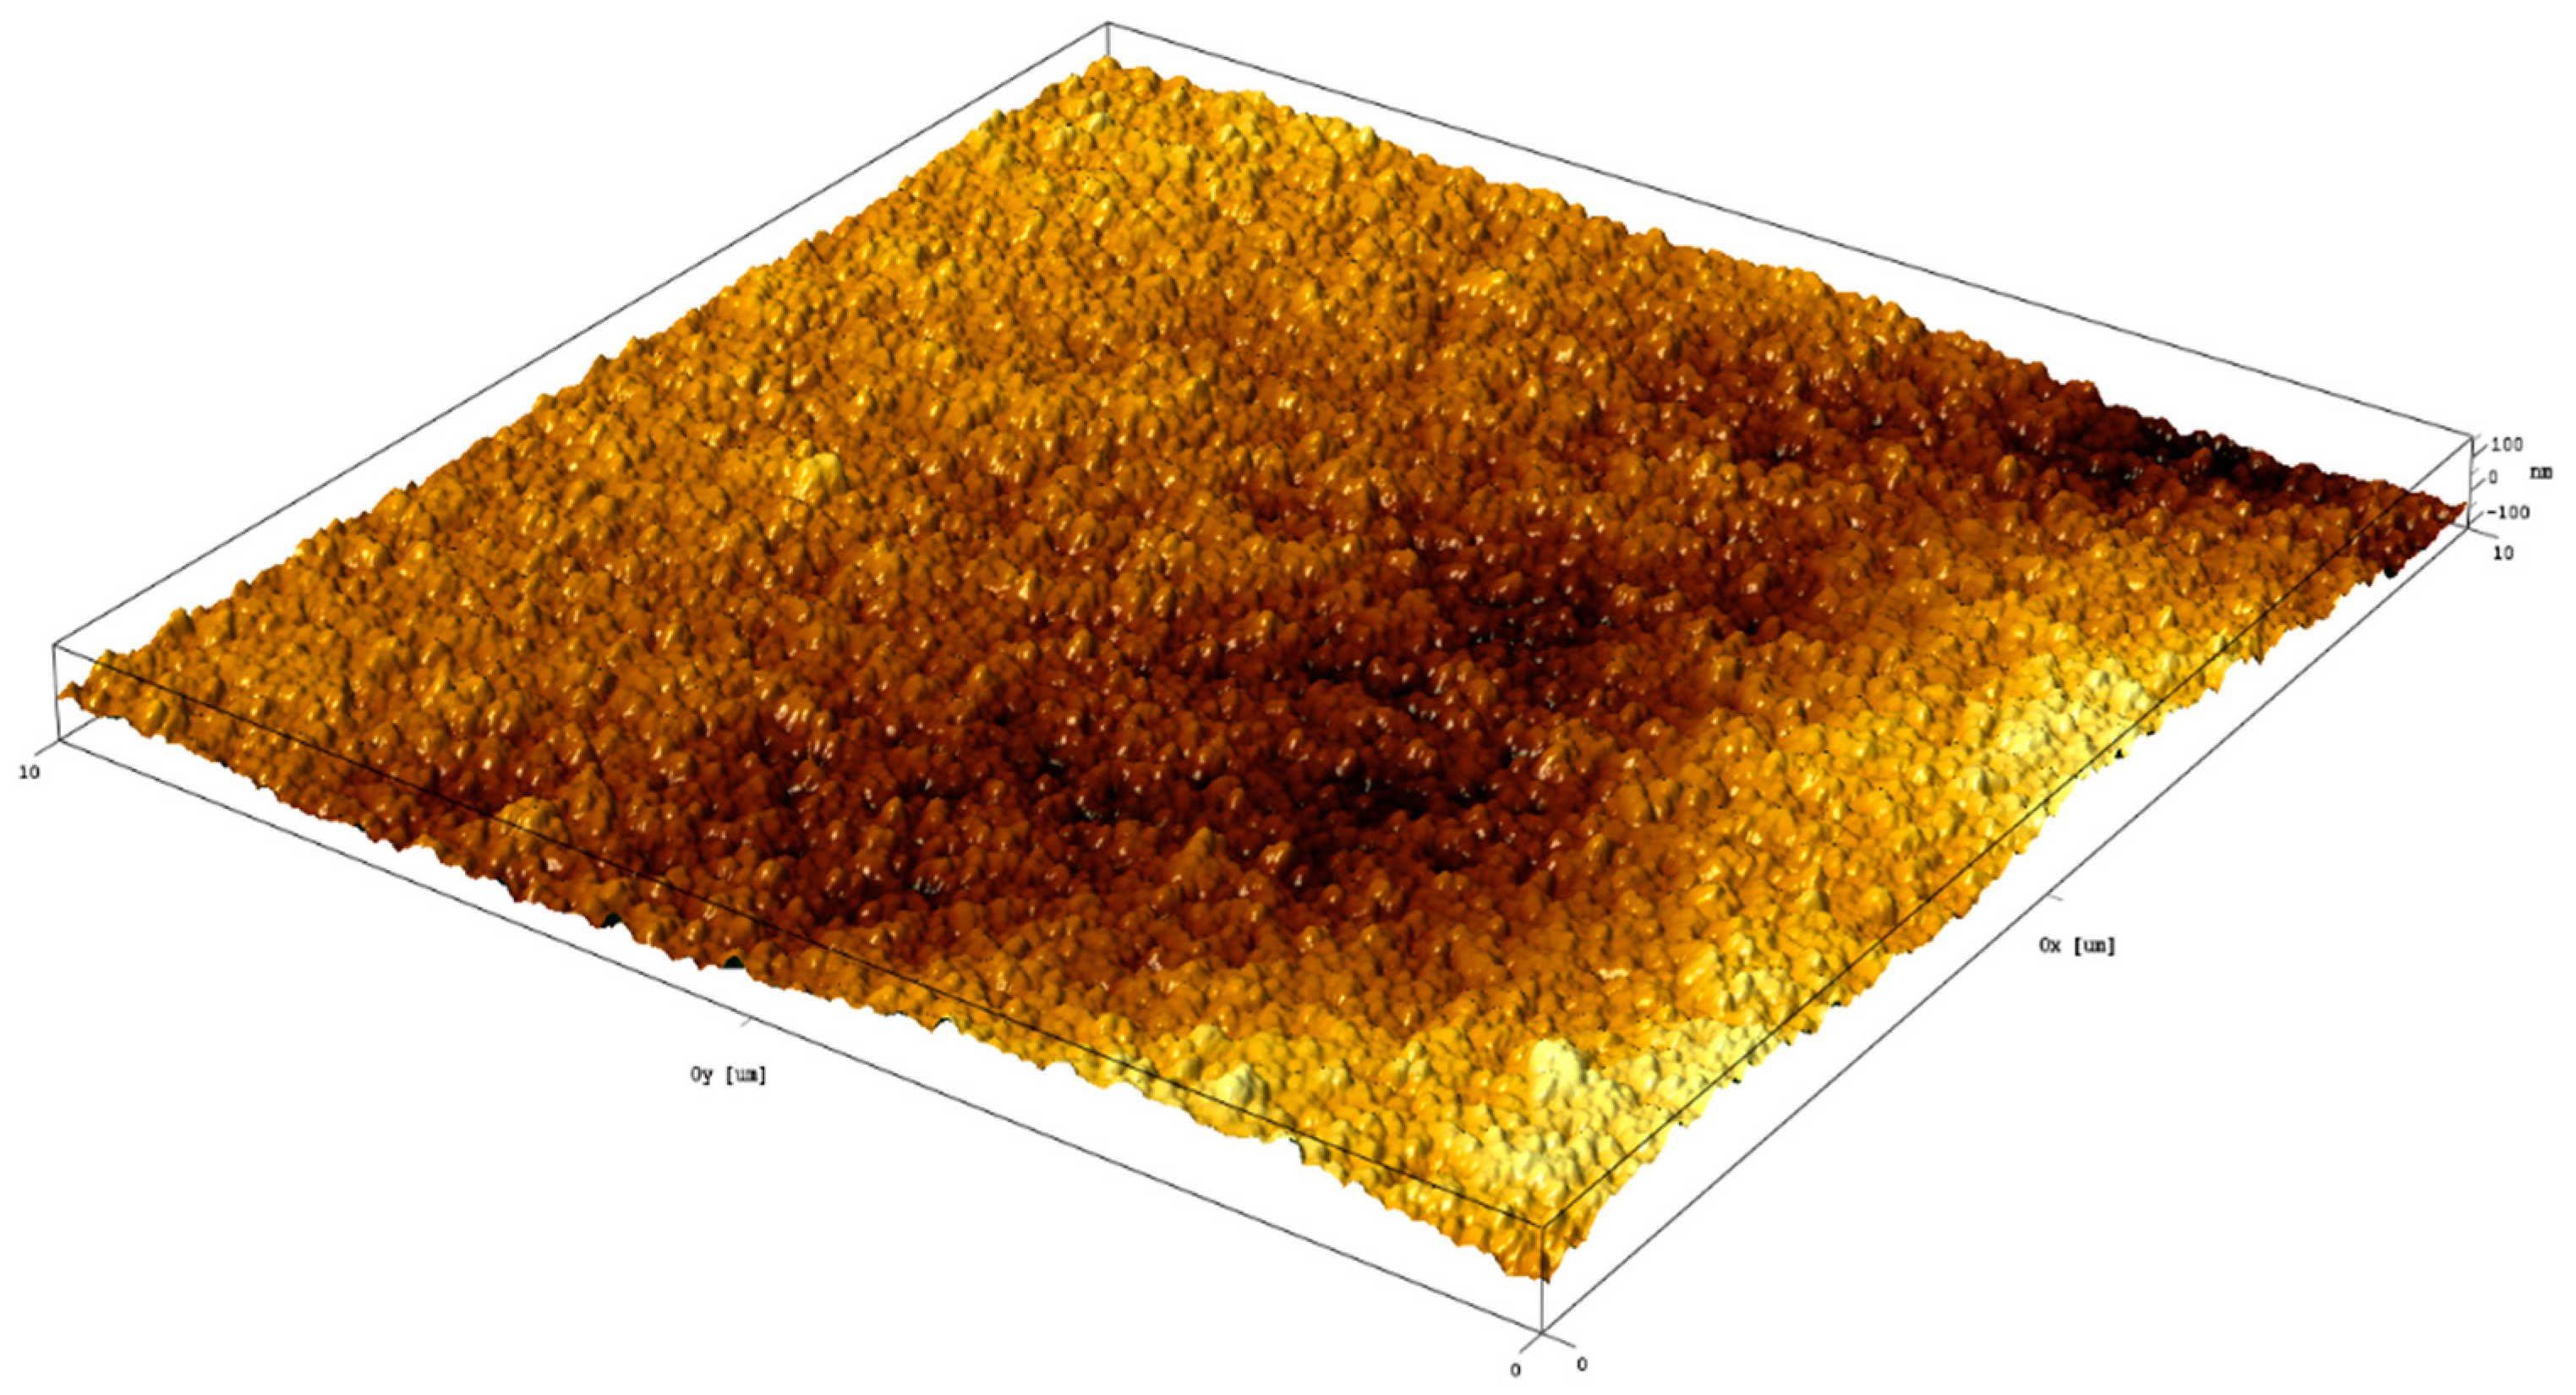
EDX elemental mapping of the TiO2–rGO film (Figure S3, Supporting Information) also confirmed the presence of rGO in TiO2. In particular, rGO nanoflakes can be easily detected as carbon-rich spots. It should be noted that elements such as Sn and Si were detected because of the FTO glass substrate. The surface topography and TiO2–rGO film roughness were further investigated by AFM. Figure 2 shows a 3D topography image measured on an area of 10 µm × 10 µm. Analysis of the surface topography revealed that the roughness of the films is represented by (a) film thickness variation and (b) roughness arising from TiO2 nanoparticles. The average surface roughness (Ra) estimated by AFM was found to be ~44 nm. For comparison, the surface of bare FTO glass was found to be rougher Ra ~91 nm (Figure S4, Supporting Information). In general, TiO2–rGO scaffolds with a smoother surface is highly promising for dye-sensitized solar cells or perovskite solar cells. Therefore, a proposed method allows thickness-controllable and crack-free deposition of TiO2–rGO films.
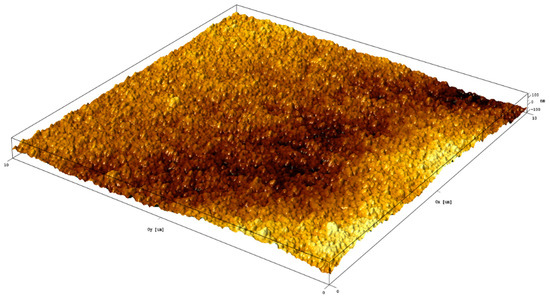
Figure 2.
AFM 3D image of TiO2–rGO film.
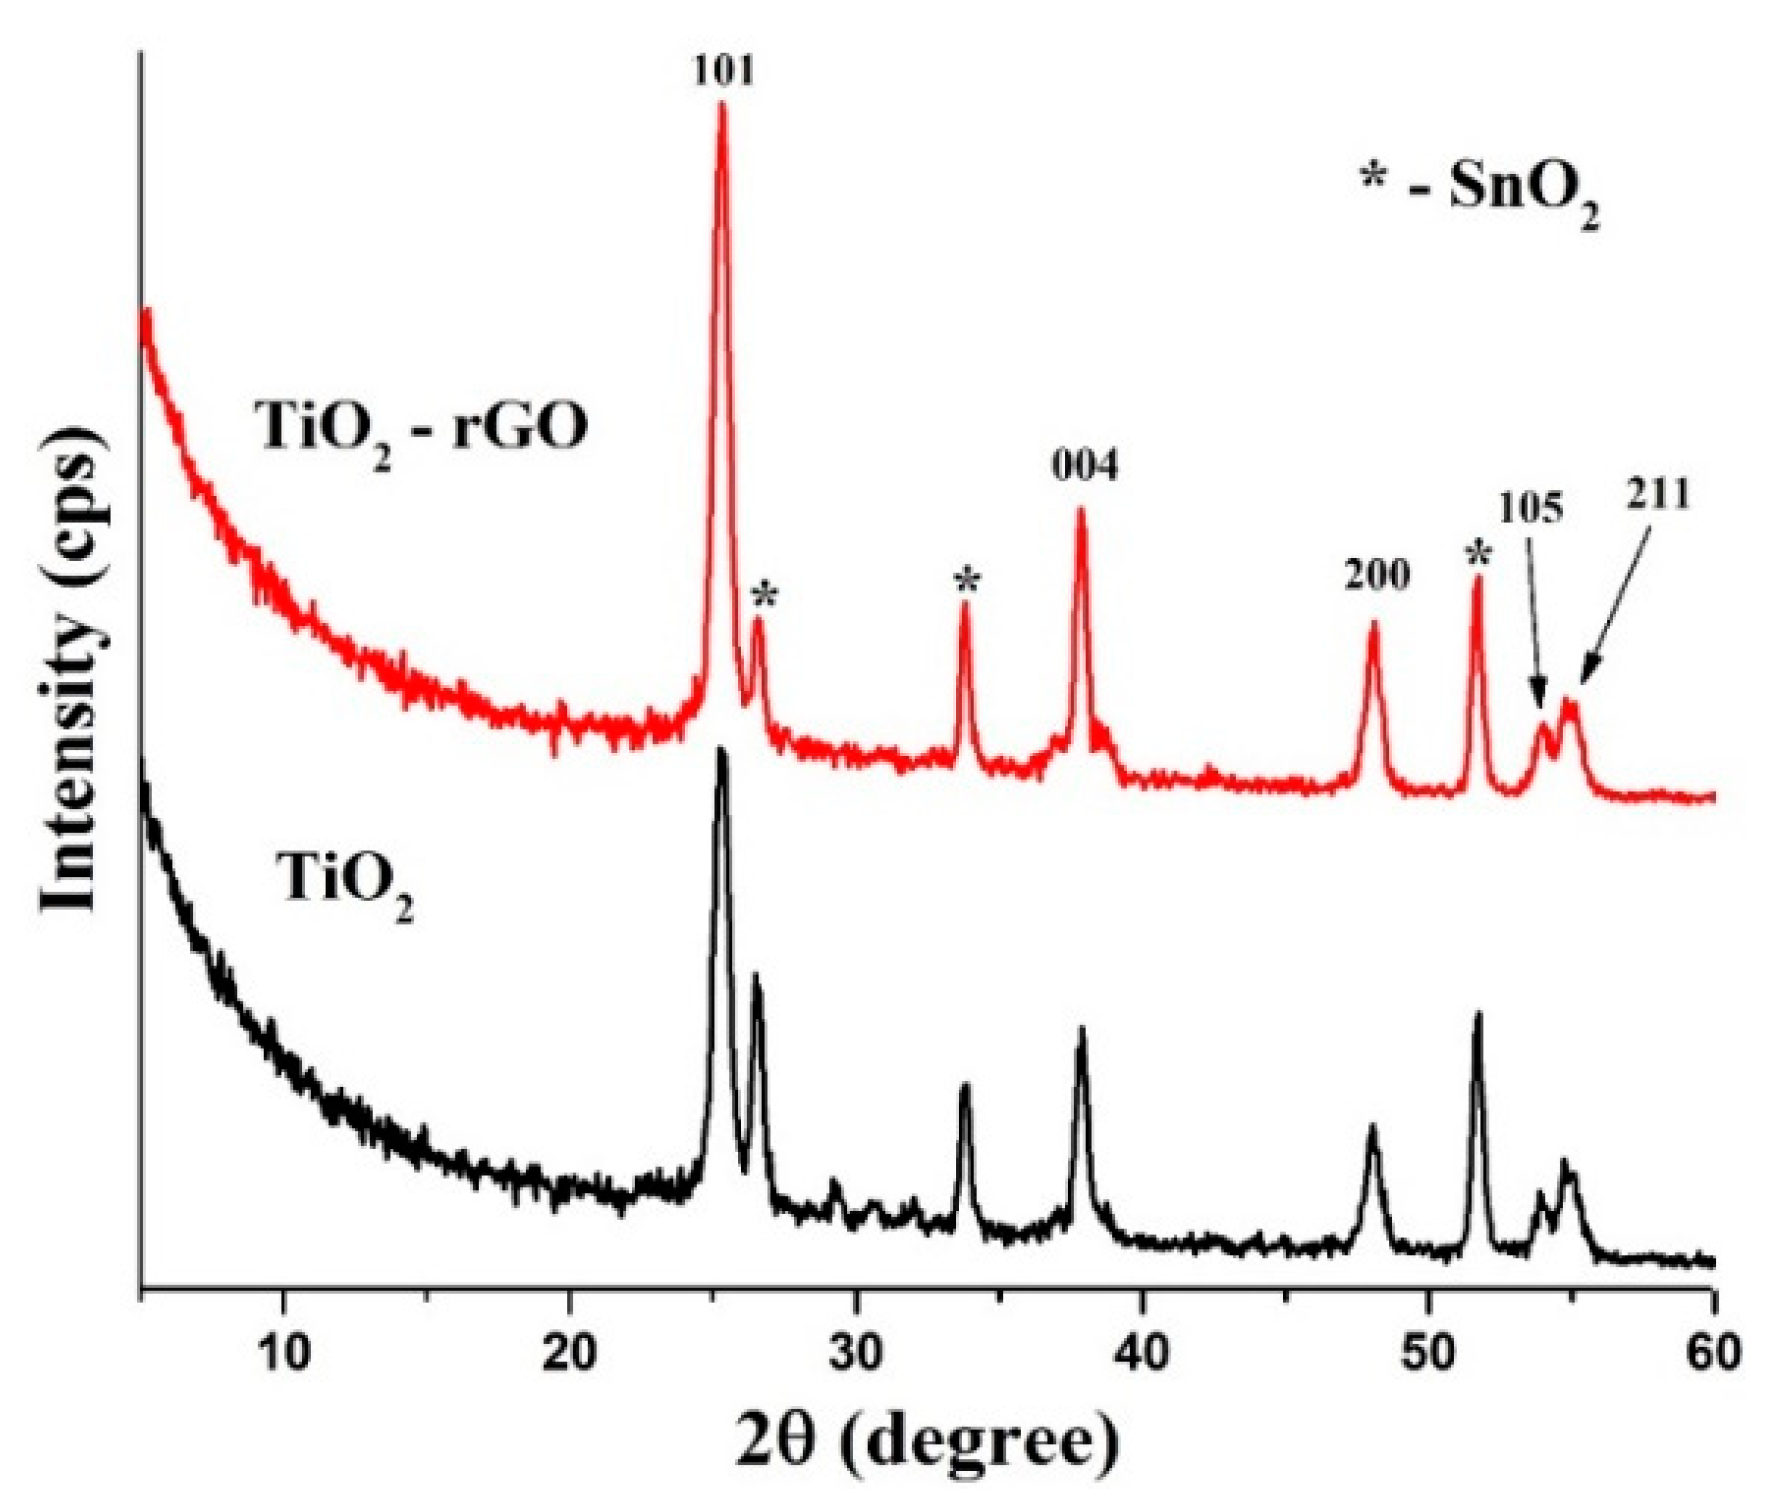
Figure 3 illustrates typical diffraction patterns of TiO2 and TiO2–rGO films deposited on FTO glasses. All peaks can be easily assigned to the anatase form of TiO2 (ICDD, # 01-071-1166). In particular, peaks at 25.3°, 37.7°, 48.1°, 52.8°, and 55.0° were attributed to the (101), (004), (200), (105), and (211) crystal planes, respectively. Additional peaks that belong to FTO are also labeled for clarity.

Figure 3.
XRD patterns of TiO2 and TiO2–rGO films.
According to the XRD analysis, there is no difference between TiO2 and TiO2–rGO films, suggesting that the rGO additive has no influence on the anatase TiO2 phase. On the other hand, the TiO2–rGO film yields more intense peaks, suggesting better crystallinity. We can speculate that rGO can interconnect the nearby TiO2 nanoparticles and make contacts more intimate, as shown in Figure 1d. However, it should be validated separately with various rGO concentrations in TiO2 thin films and beyond the scope of current work. Furthermore, it can be also related to the fact that TiO2–rGO film has a higher density because of the rGO additive.
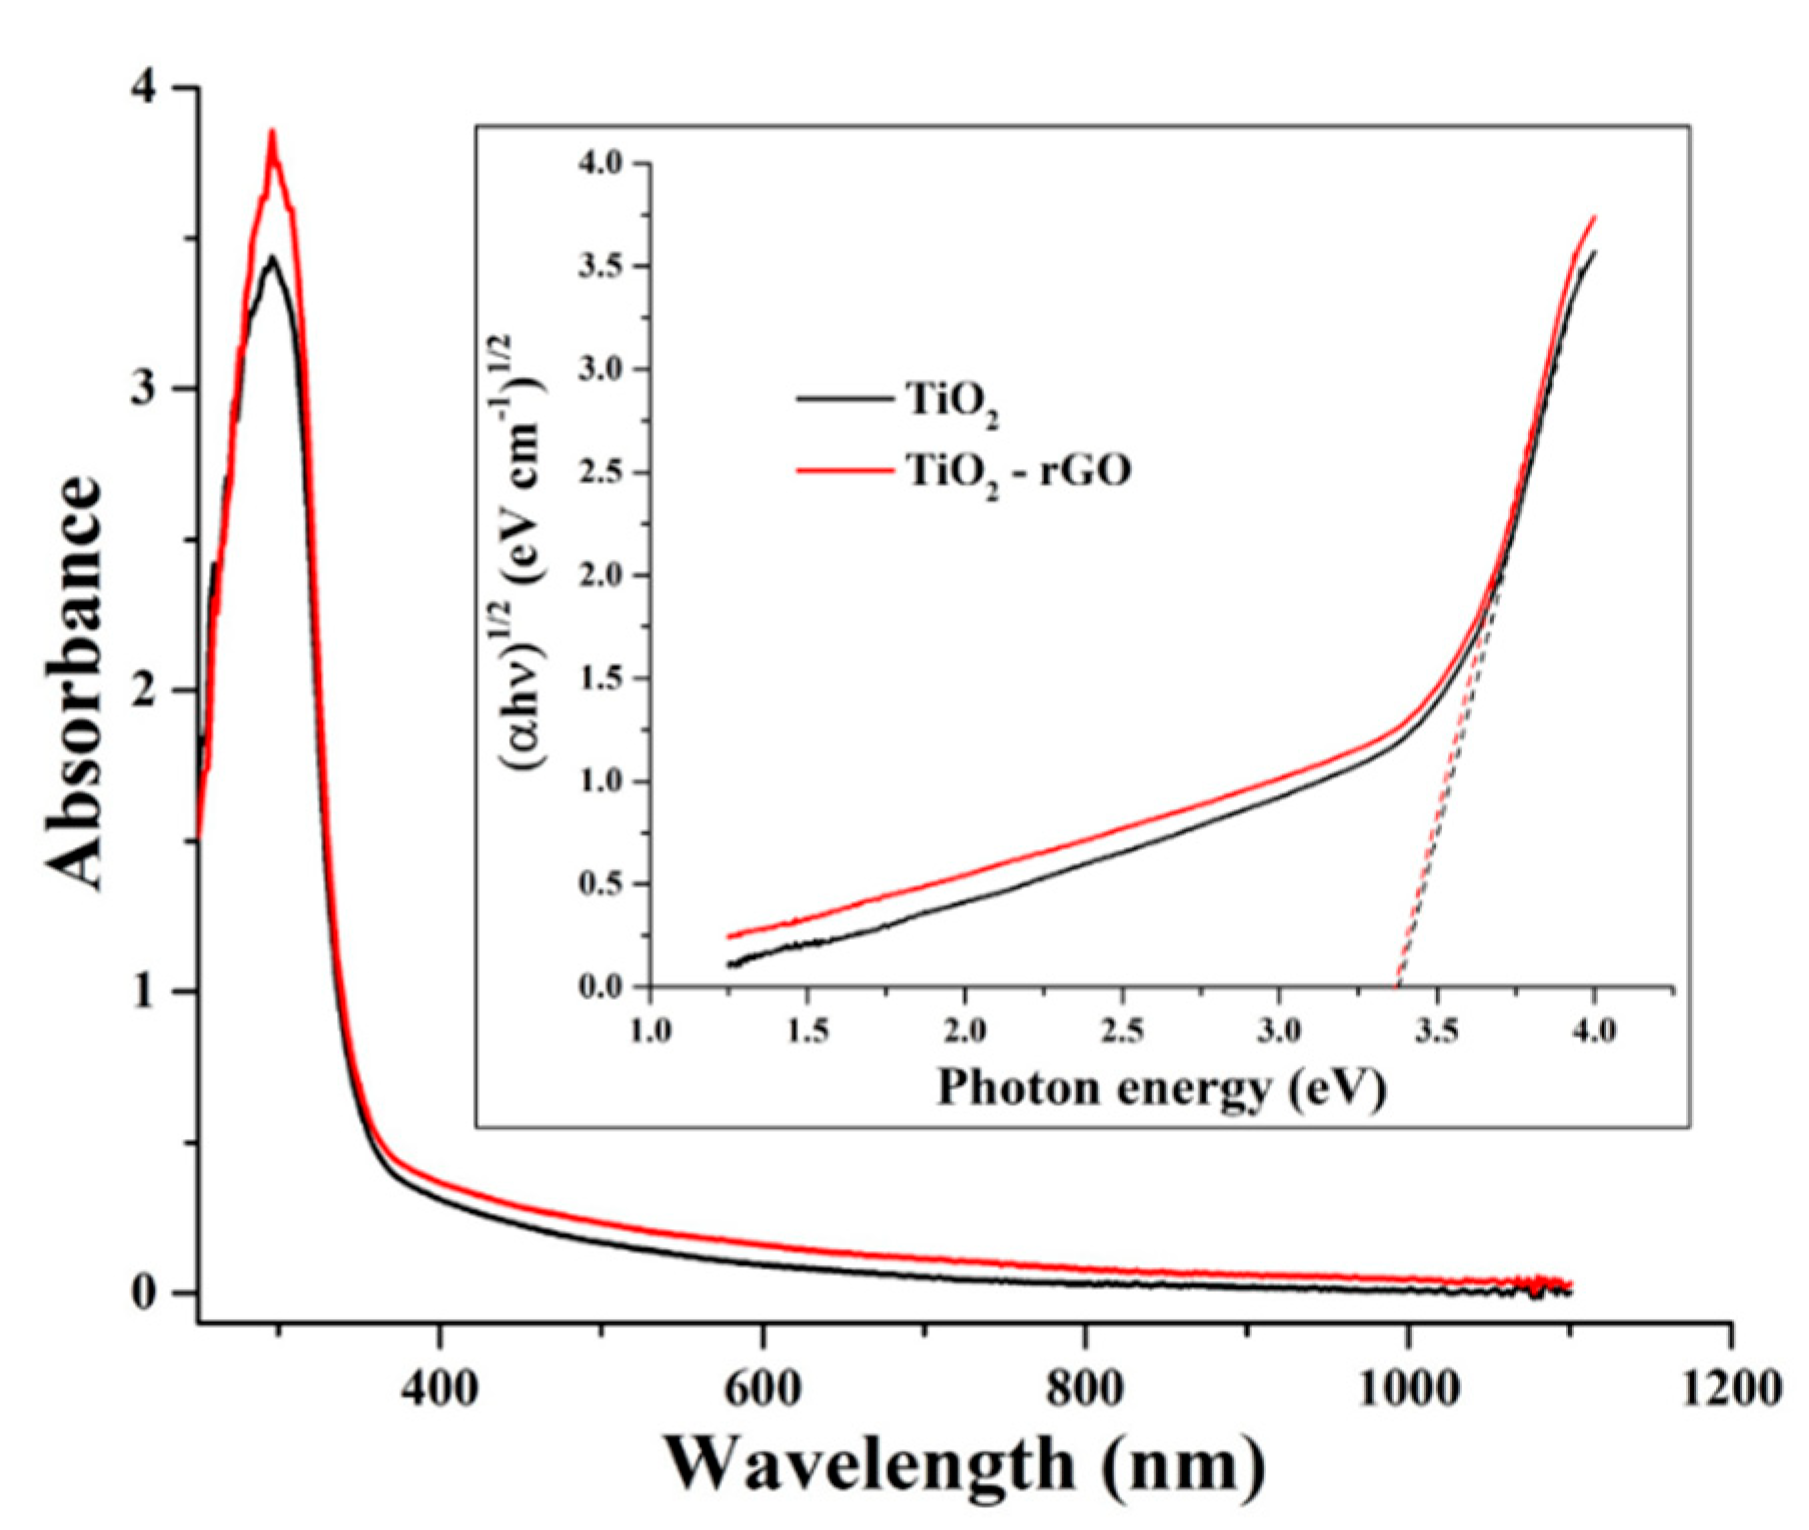
Figure 4 shows UV–Vis-NIR absorption spectra of TiO2 and TiO2–rGO films taken in the range of 250–1100 nm. In both films, strong absorbance in the UV region is attributed to the presence of TiO2. The obtained results suggested that the absorbance of the TiO2–rGO film is slightly improved in the visible–NIR range. However, a significant improvement was observed in the UV range, suggesting an interaction between TiO2 and rGO upon the generation of charge carriers [10]. The bandgaps of the formed films were evaluated using a Tauc method according to a recently revised protocol [20]. Estimated bandgap values (Figure 4 inset) were found to be 3.37 and 3.34 eV for TiO2 and TiO2–rGO films, respectively. It should be noted that these values are comparable; hence, one can conclude that the presence of rGO does not significantly affect the bandgap value in this report. The most plausible reason is the difference in the fabrication process; in this study rGO content in TiO2 was significantly lower (1 µg rGO to 295 µg of TiO2) as compared to some previous reports. For instance, R. Raja et al. [10] reported that bandgap values range from 3.23 to 2.88 eV for TiO2–rGO films containing rGO in the range of 60 µg–1.5 mg. Titanium isopropoxide (0.4 mL) was used for all films, which correspond to ~8.5 mg of pure TiO2 [10].

Figure 4.
The absorbance of TiO2 and TiO2–rGO films. Inset shows bandgap determination using a Tauc method.
Raman spectroscopy was further utilized for the analysis of prepared films. Figure 5 shows that bands located at 1347 cm−1 (D-band) and 1590 cm−1 (G-band) associated with rGO were easily detected in the TiO2–rGO film, while these bands were absent in the bare TiO2 film. The G-band is typically associated with sp2 bonding of carbon atoms, while the D-band represents the disorder/defects in rGO [15]. The intensity ratio between these bands (ID/IG) can provide valuable information about the oxidation degree. For example, an intensity ratio ID/IG > 1 is typically associated with the formation of rGO [15,21]. In our case, the ID/IG ratio was ~1.07, confirming the successful formation of TiO2–rGO films.
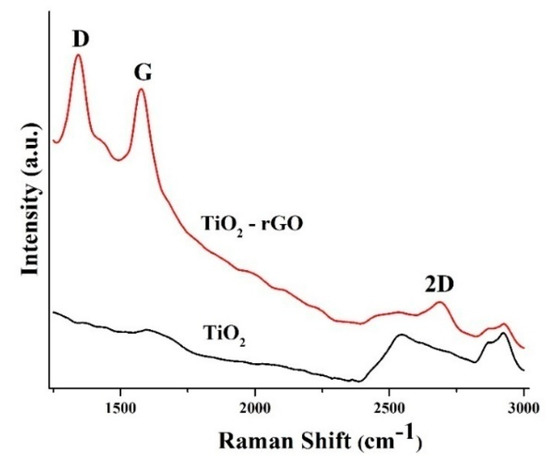
Figure 5.
Raman spectra of TiO2 and TiO2–rGO films.
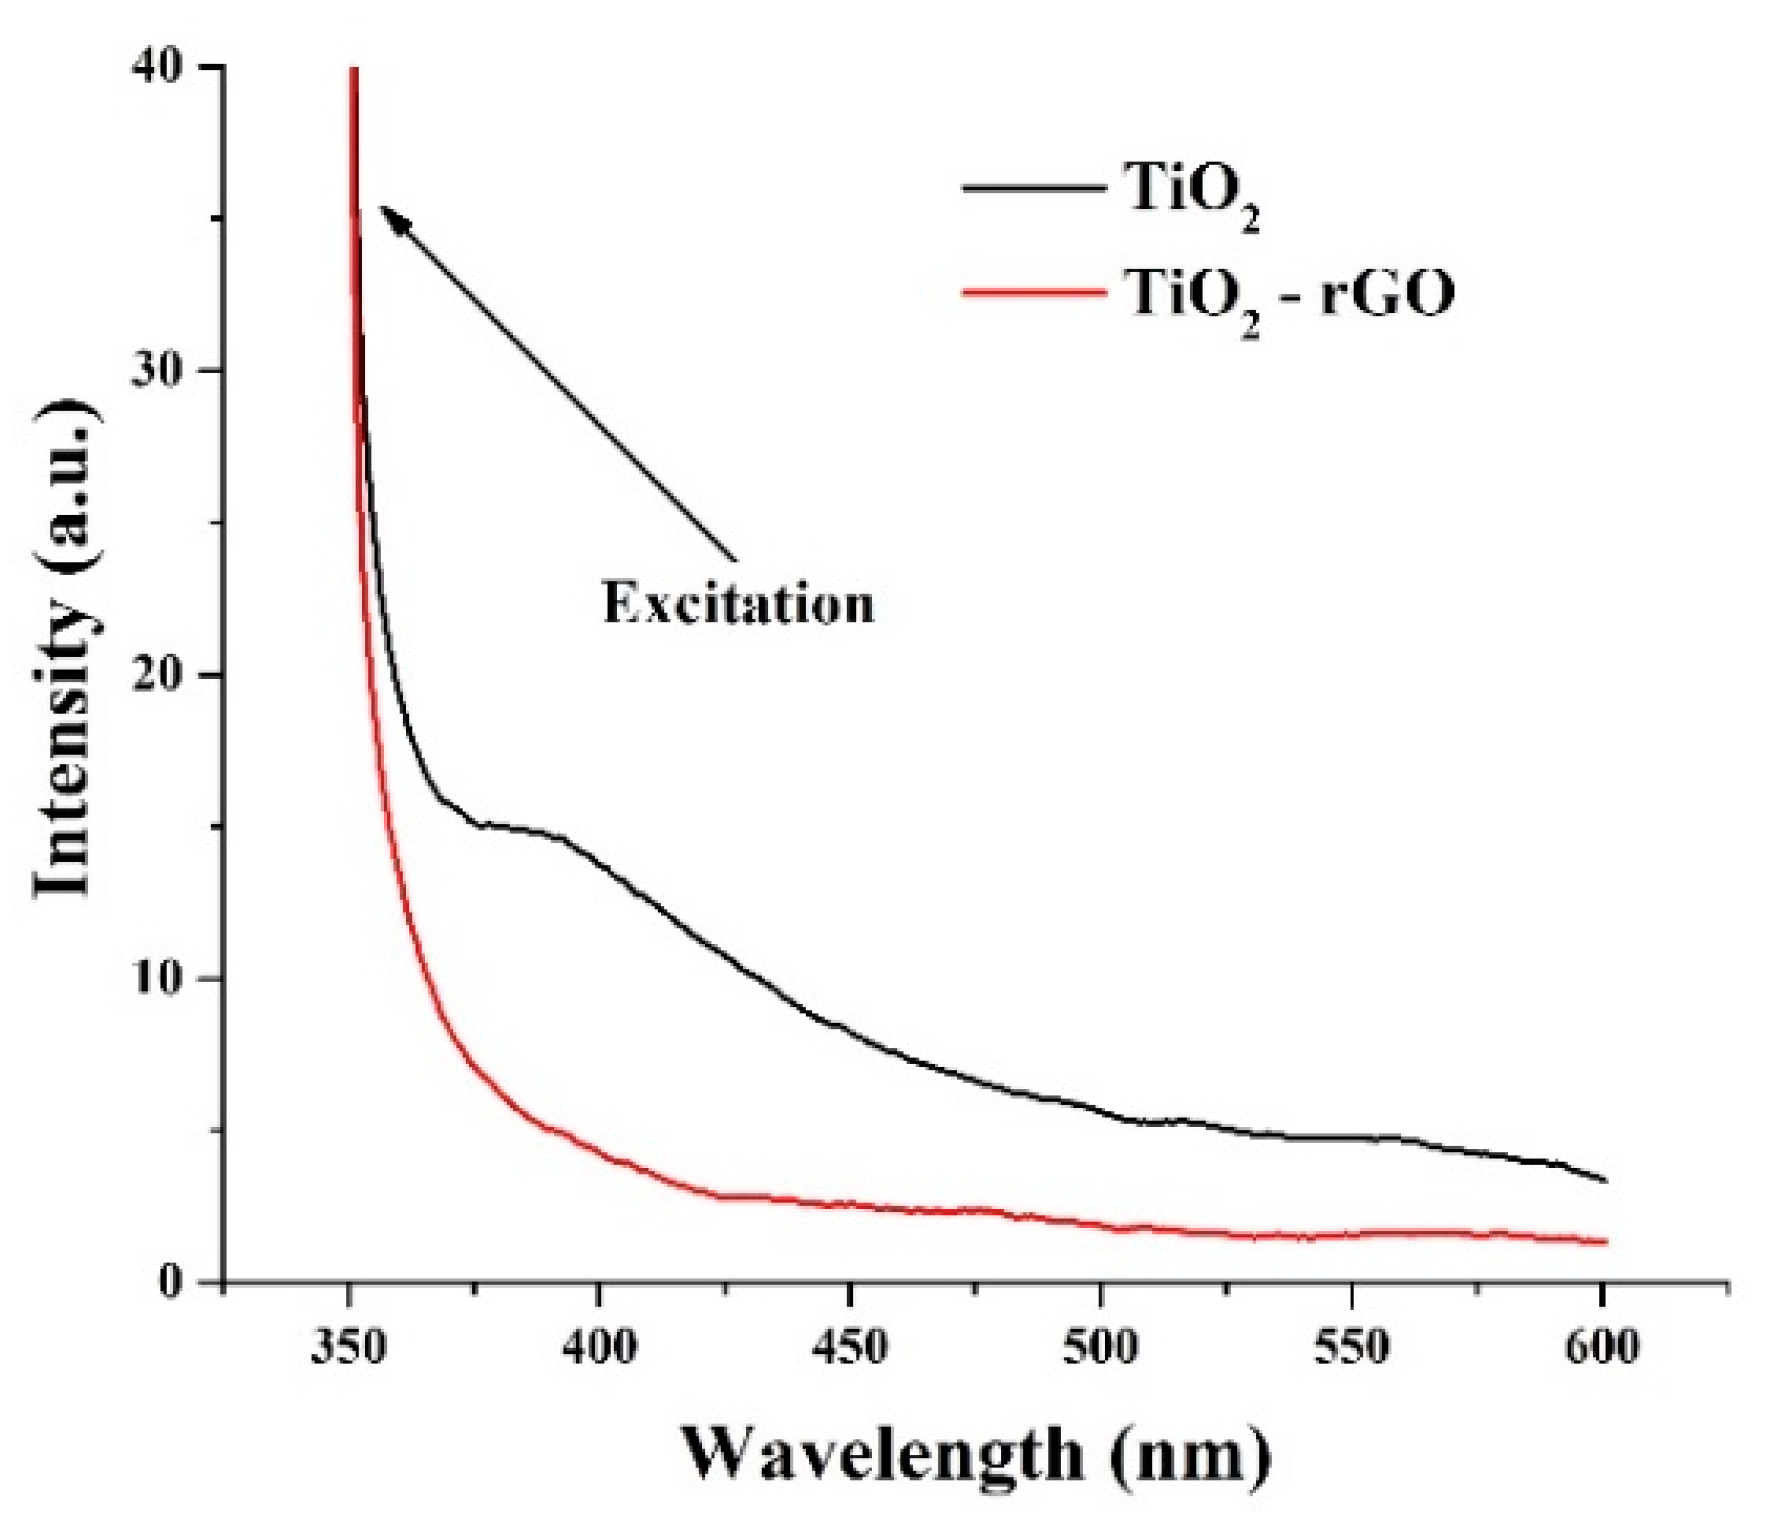
PL analysis of the prepared films (λexc = 350 nm) was further performed. Figure 6 shows the steady-state PL patterns of TiO2 and TiO2–rGO films. The bare TiO2 film has a broad peak extending from the UV to visible range. The intense peak in the UV range (<400 nm) is attributed to the direct recombination of electrons from the conduction band with holes in the valence band [22]. Overlapping emission bands in the blue–green region are usually described by intrinsic defect states such as defect levels in the bandgap, oxygen defects, or surface states [22,23]. One can notice that such a peak was not observed in TiO2–rGO film suggesting that even small rGO concentration can effectively suppress the charge recombination processes in TiO2–rGO films.
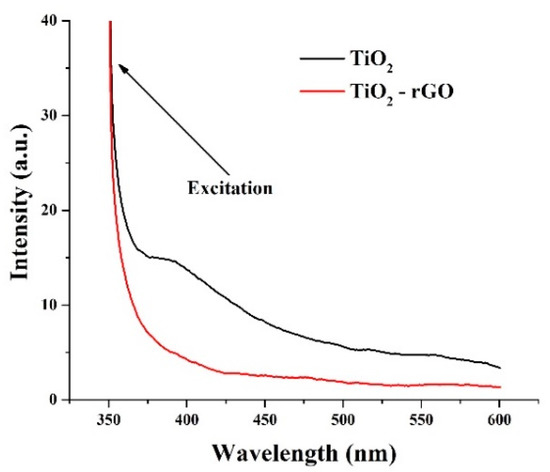
Figure 6.
PL analysis of TiO2 and TiO2–rGO films.
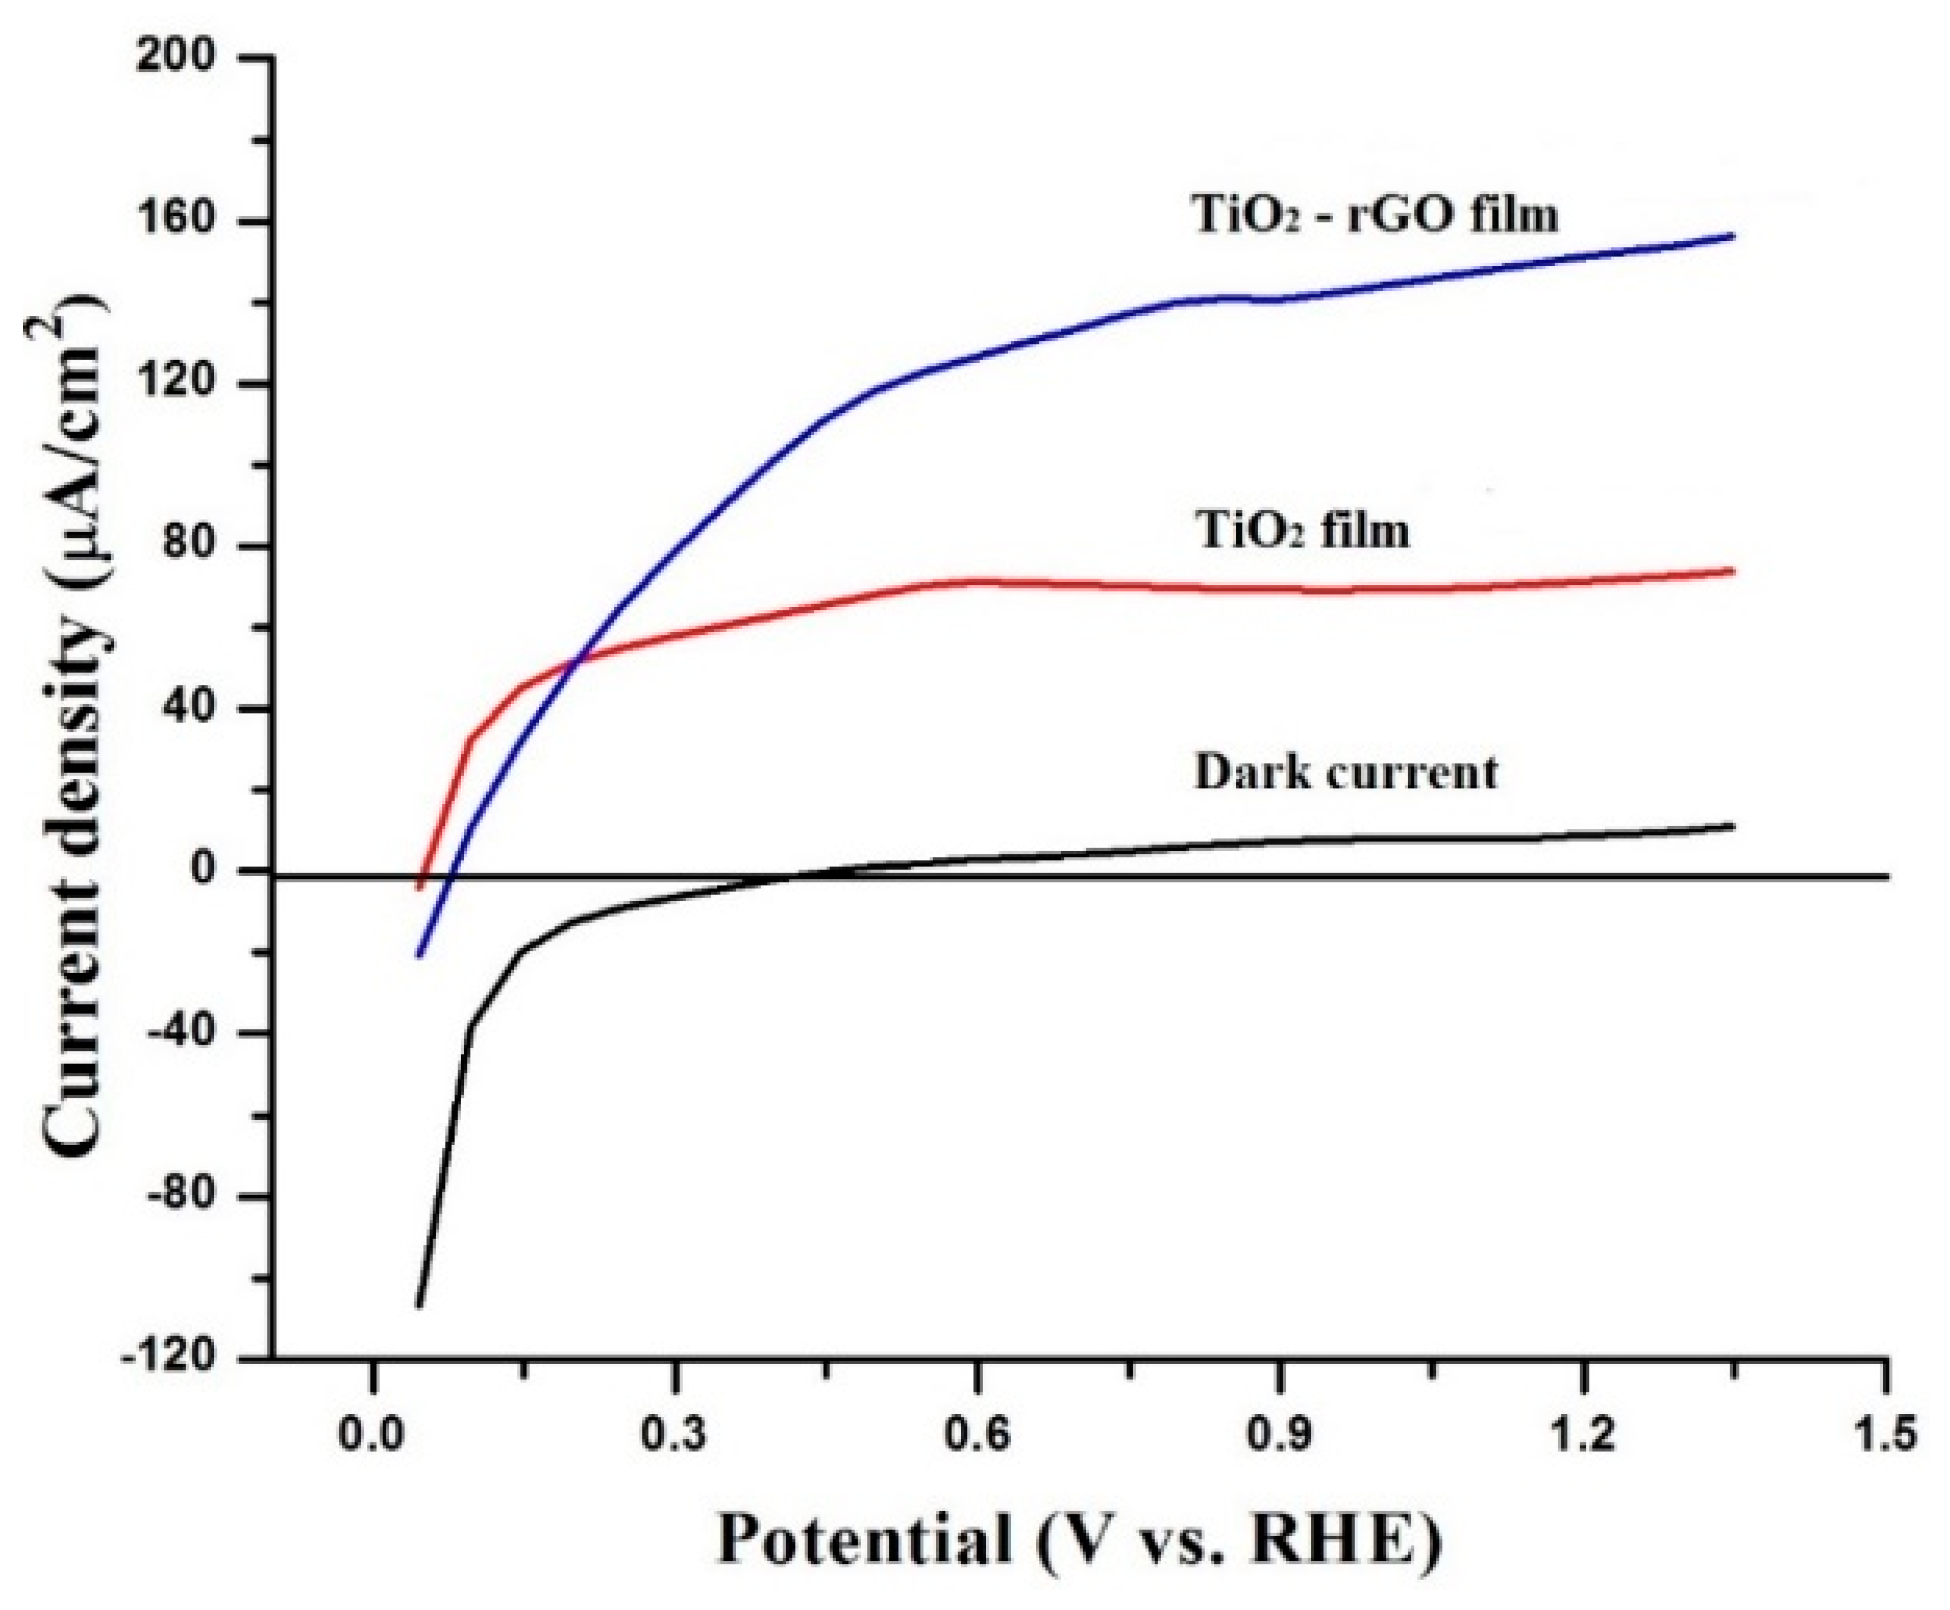
The charge-transporting properties of the prepared films were further compared by testing their PEC activity. In the literature, the theoretical oxidation potential of water (1.23 V vs. RHE) is commonly used to collate the PEC activity of photoelectrodes. Figure 7 shows that the dark current (without light) for both photoelectrodes was negligible. However, the photocurrent response dramatically changed under simulated solar light illumination. For example, the measured photocurrent densities were ~71.6 µA/cm2 and ~151.3 µA/cm2 at 1.23 eV vs. RHE for TiO2 and TiO2–rGO films, respectively. Photocurrent generated by the TiO2–rGO film in this study (~151.3 µA/cm2) was found to be higher than that of optimized TiO2–rGO prepared by aerosol-assisted chemical vapor deposition (~80.2 µA/cm2) [13]. A remarkable photocurrent enhancement can be associated with several factors, such as uniform distribution of rGO in TiO2, improved charge transfer, and reduced charge recombination [7,8,10,11,12,13]. It is also important to mention that rGO concentration was fixed in the present study and should be optimized to yield the highest performance, as shown in some earlier studies [10,13]. However, high rGO content in TiO2 film can be also detrimental for charge transporting properties because of light-blocking effects, which result in lower charge generation by TiO2 [7]. Therefore, the addition of rGO at different concentrations and optimization of TiO2–rGO films can be performed in future studies.

Figure 7.
Photocurrent densities of TiO2 and TiO2–rGO films without and with light illumination.
4. Conclusions
In summary, a facile spin-coating method is proposed for the fabrication of TiO2–rGO films. SEM analysis revealed that TiO2–rGO films are uniformly coated and crack-free, suggesting their excellent applicability for the construction of solar harnessing devices. Raman, PL, and linear sweep voltammetry analyses of TiO2 and TiO2–rGO films confirm the successful incorporation and beneficial role of rGO in TiO2 films. In particular, it was found that the photocurrent in TiO2–rGO film can be significantly improved due to the improved charge transport properties and reduced charge recombination processes. We believe that the proposed method can be expanded for the preparation of other metal oxide–rGO films, for example, ZnO–rGO and SnO2–rGO to name a few.
Supplementary Materials
The following are available online at https://www.mdpi.com/article/10.3390/coatings12020218/s1, Figure S1: Raman analysis of as-purchased graphene flakes, Figure S2: SEM images of TiO2–rGO films deposited at various speeds, Figure S3: EDX elemental mapping and survey of TiO2–rGO film, Figure S4: AFM analysis of bare FTO substrate.
Author Contributions
Conceptualization, A.M., Y.-H.H. and T.S.A.; methodology, A.M. and T.S.A.; validation, A.M., Y.-H.H. and T.S.A.; formal analysis, L.K., S.E. and A.M.; investigation, L.K., S.E. and A.M.; resources, T.S.A.; data curation, A.M., Y.-H.H. and T.S.A.; writing—original draft preparation, A.M. and T.S.A.; writing—review and editing, A.M., Y.-H.H. and T.S.A.; supervision, Y.-H.H. and T.S.A.; funding acquisition, Y.-H.H. and T.S.A. All authors have read and agreed to the published version of the manuscript.
Funding
This research was funded by Nazarbayev University FDCRDG, Grant No. 240919FD3929. This work was also supported by the National Research Foundation of Korea (NRF) grant funded by the Korea government (MSIT) (No. 2020R1A2C2007590).
Institutional Review Board Statement
Not applicable.
Informed Consent Statement
Not applicable.
Acknowledgments
Anara Molkenova acknowledge the NU postdoctoral fellowship program.
Conflicts of Interest
The authors declare no conflict of interest.
References
- Agrawal, A.; Siddiqui, S.A.; Soni, A.; Khandelwal, K.; Sharma, G.D. Performance analysis of TiO2 based dye sensitized solar cell prepared by screen printing and doctor blade deposition techniques. Sol. Energy 2021, 226, 9–19. [Google Scholar] [CrossRef]
- Vu, H.H.T.; Atabaev, T.S.; Ahn, J.Y.; Dinh, N.N.; Kim, H.-K.; Hwang, Y.-H. Dye-sensitized solar cells composed of photoactive composite photoelectrodes with enhanced solar energy conversion efficiency. J. Mater. Chem. A 2015, 3, 11130–11136. [Google Scholar] [CrossRef]
- Hernández-Granados, A.; Corpus-Mendoza, A.N.; Moreno-Romero, P.M.; Rodríguez-Castañeda, C.A.; Pascoe-Sussoni, J.E.; Castelo-González, O.A.; Menchaca-Campos, C.; Escorcia-García, J.; Hu, H. Optically uniform thin films of mesoporous TiO2 for perovskite solar cell applications. Opt. Mater. 2019, 88, 695–703. [Google Scholar] [CrossRef]
- Slawek, A.; Starowicz, Z.; Lipinski, M. The influence of the thickness of compact TiO2 electron transport layer on the performance of planar CH3NH3PbI3 perovskite solar cells. Materials 2021, 14, 3295. [Google Scholar] [CrossRef] [PubMed]
- Atabaev, T.S.; Lee, D.H.; Hong, N.H. Fabrication of TiO2/CuO photoelectrode with enhanced solar water splitting activity. Funct. Mater. Lett. 2017, 10, 1750084. [Google Scholar] [CrossRef]
- Gillespie, P.N.O.; Martsinovich, N. Origin of charge trapping in TiO2/reduced graphene oxide photocatalytic composites: Insights from theory. ACS Appl. Mater. Interfaces 2019, 11, 31909–31922. [Google Scholar] [CrossRef] [Green Version]
- Bell, N.J.; Ng, Y.H.; Du, A.; Coster, H.; Smith, S.; Amal, R. Understanding the enhancement in photoelectrochemical properties of photocatalytically prepared TiO2-reduced graphene oxide composite. J. Phys. Chem. C 2011, 115, 6004–6009. [Google Scholar] [CrossRef]
- Tayebi, M.; Kolaei, M.; Tayebi, A.; Masoumi, Z.; Belbasi, Z.; Lee, B.-K. Reduced graphene oxide (RGO) on TiO2 for an improved photoelectrochemical (PEC) and photocatalytic activity. Sol. Energy 2019, 190, 185–194. [Google Scholar] [CrossRef]
- Lee, E.; Lee, D.; Yoon, J.; Yin, Y.; Na Lee, Y.; Uprety, S.; Yoon, Y.S.; Kim, D.-J. Enhanced gas-sensing performance of GO/TiO2 composite by photocatalysis. Sensors 2018, 18, 3334. [Google Scholar] [CrossRef] [Green Version]
- Raja, R.; Govindaraj, M.; Antony, M.D.; Krishnan, K.; Velusamy, E.; Sambandam, A.; Subbaiha, M.; Williams Rayar, V. Effect of TiO2/reduced graphene oxide composite thin film as a blocking layer on the efficiency of dye-sensitized solar cells. J. Solid State Electrochem. 2017, 21, 891–903. [Google Scholar] [CrossRef]
- Han, G.S.; Song, Y.H.; Jin, Y.U.; Lee, J.-W.; Park, N.-G.; Kang, B.K.; Lee, J.-K.; Cho, I.S.; Yoon, D.H.; Jung, H.S. Reduced graphene oxide/mesoporous TiO2 nanocomposite based perovskite solar cells. ACS Appl. Mater. Interfaces 2015, 7, 23521–23526. [Google Scholar] [CrossRef] [PubMed]
- Cho, K.T.; Grancini, G.; Lee, Y.; Konios, D.; Paek, S.; Kymakis, E.; Nazeeruddin, M.K. Beneficial role of reduced graphene oxide for electron extraction in highly efficient perovskite solar cells. ChemSusChem 2016, 9, 3040–3044. [Google Scholar] [CrossRef]
- Jumeri, F.A.; Lim, H.N.; Zainal, Z.; Huang, N.M.; Pandikumar, A. Titanium dioxide-reduced graphene oxide thin film for photoelectrochemical water splitting. Ceram. Int. 2014, 40, 15159–15165. [Google Scholar] [CrossRef]
- Agrawal, Y.; Kedawat, G.; Kumar, P.; Dwivedi, J.; Singh, V.N.; Gupta, R.K.; Gupta, B.K. High-performance stable field emission with ultralow turn on voltage from rGO conformal coated TiO2 nanotubes 3D arrays. Sci. Rep. 2015, 5, 11612. [Google Scholar] [CrossRef] [PubMed]
- AlShammari, A.S.; Halim, M.M.; Yam, F.K.; Kaus, N.H.M. Synthesis of titanium dioxide (TiO2)/reduced graphene oxide (rGO) thin-film composite by spray pyrolysis technique and its physical properties. Mater. Sci. Semicond. Process. 2020, 116, 105140. [Google Scholar] [CrossRef]
- Ito, S.; Chen, P.; Comte, P.; Nazeeruddin, M.K.; Liska, P.; Péchy, P.; Grätzel, M. Fabrication of screen-printing pastes from TiO2 powders for dye-sensitised solar cells. Prog. Photovolt Res. Appl. 2007, 15, 603–612. [Google Scholar] [CrossRef]
- Nan, H.Y.; Ni, Z.H.; Wang, J.; Zafar, Z.; Shi, Z.X.; Wang, Y.Y. The thermal stability of graphene in air investigated by Raman spectroscopy. J. Raman Spectrosc. 2013, 44, 1018–1021. [Google Scholar] [CrossRef]
- Liu, F.; Wang, M.; Chen, Y.; Gao, J. Thermal stability of graphene in inert atmosphere at high temperature. J. Solid. State Chem. 2019, 276, 100–103. [Google Scholar] [CrossRef]
- Al-Sherbini, A.-S.; Bakr, M.; Ghoneim, I.; Saad, M. Exfoliation of graphene sheets via high energy wet milling of graphite in 2-ethylhexanol and kerosene. J. Adv. Res. 2017, 8, 209–215. [Google Scholar] [CrossRef]
- Makuła, P.; Pacia, M.; Macyk, W. How to correctly determine the band gap energy of modified semiconductor photocatalysts based on UV–Vis spectra. J. Phys. Chem. Lett. 2018, 9, 6814–6817. [Google Scholar] [CrossRef] [Green Version]
- Bo, Z.; Shuai, X.; Mao, S.; Yang, H.; Qian, J.; Chen, J.; Yan, J.; Cen, K. Green preparation of reduced graphene oxide for sensing and energy storage applications. Sci. Rep. 2014, 4, 4684. [Google Scholar] [CrossRef] [PubMed] [Green Version]
- Anitha, V.S.; Lekshmy, S.S.; Joy, K. Effect of annealing on the structural, optical, electrical, and photocatalytic activity of ZrO2-TiO2 nanocomposite thin films prepared by sol-gel dip coating technique. J. Mater. Sci. Mater. Electron. 2017, 28, 10541–10554. [Google Scholar] [CrossRef]
- Mohan, R.; Drbohlavova, J.; Hubalek, J. Water-dispersible TiO2 nanoparticles via a biphasic solvothermal reaction method. Nanoscale Res. Lett. 2013, 8, 503. [Google Scholar] [CrossRef] [PubMed] [Green Version]

Publisher’s Note: MDPI stays neutral with regard to jurisdictional claims in published maps and institutional affiliations. |
© 2022 by the authors. Licensee MDPI, Basel, Switzerland. This article is an open access article distributed under the terms and conditions of the Creative Commons Attribution (CC BY) license (https://creativecommons.org/licenses/by/4.0/).