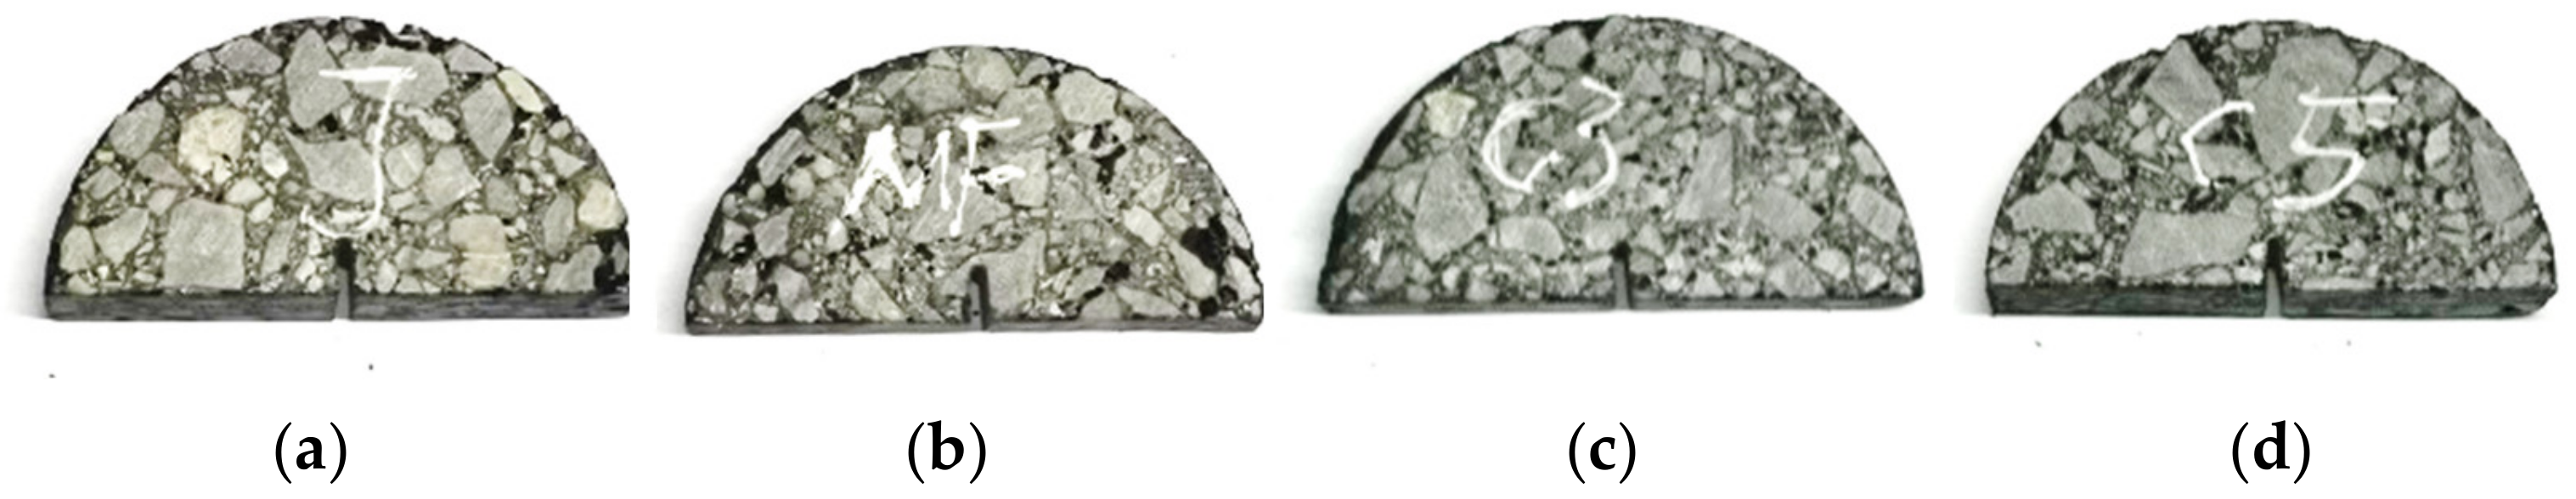
Figure 1.
Specimens under low-temperature performance test (SCB test): (a) common asphalt mixture, (b) MFPCM-modified asphalt mixture, (c) CGMFPCM2-modified asphalt mixture and (d) CGMFPCM3-modified asphalt mixture.
Figure 1.
Specimens under low-temperature performance test (SCB test): (a) common asphalt mixture, (b) MFPCM-modified asphalt mixture, (c) CGMFPCM2-modified asphalt mixture and (d) CGMFPCM3-modified asphalt mixture.
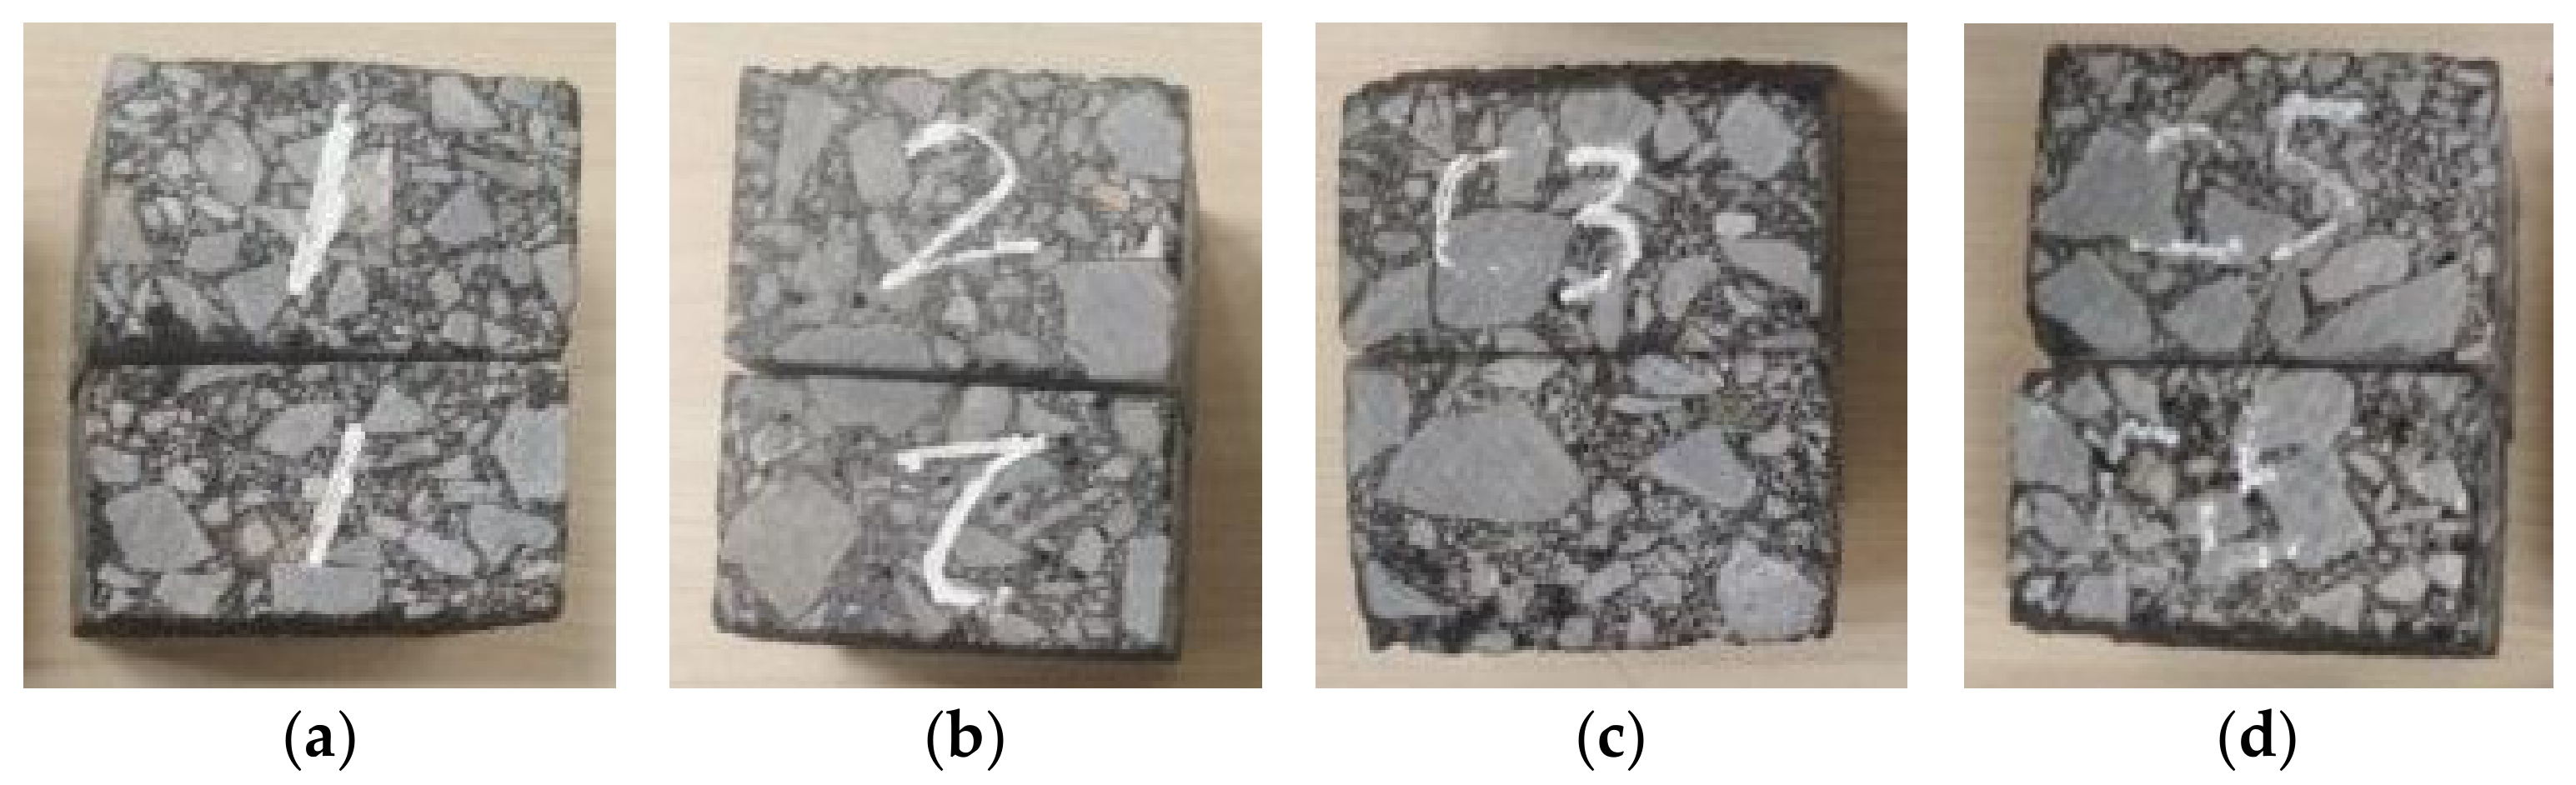
Figure 2.
Specimens for the thermal conductivity and volume-specific heat capacity tests: (a) common asphalt mixture, (b) MFPCM-modified asphalt mixture, (c) CGMFPCM2-modified asphalt mixture, and (d) CGMFPCM3-modified asphalt mixture.
Figure 2.
Specimens for the thermal conductivity and volume-specific heat capacity tests: (a) common asphalt mixture, (b) MFPCM-modified asphalt mixture, (c) CGMFPCM2-modified asphalt mixture, and (d) CGMFPCM3-modified asphalt mixture.
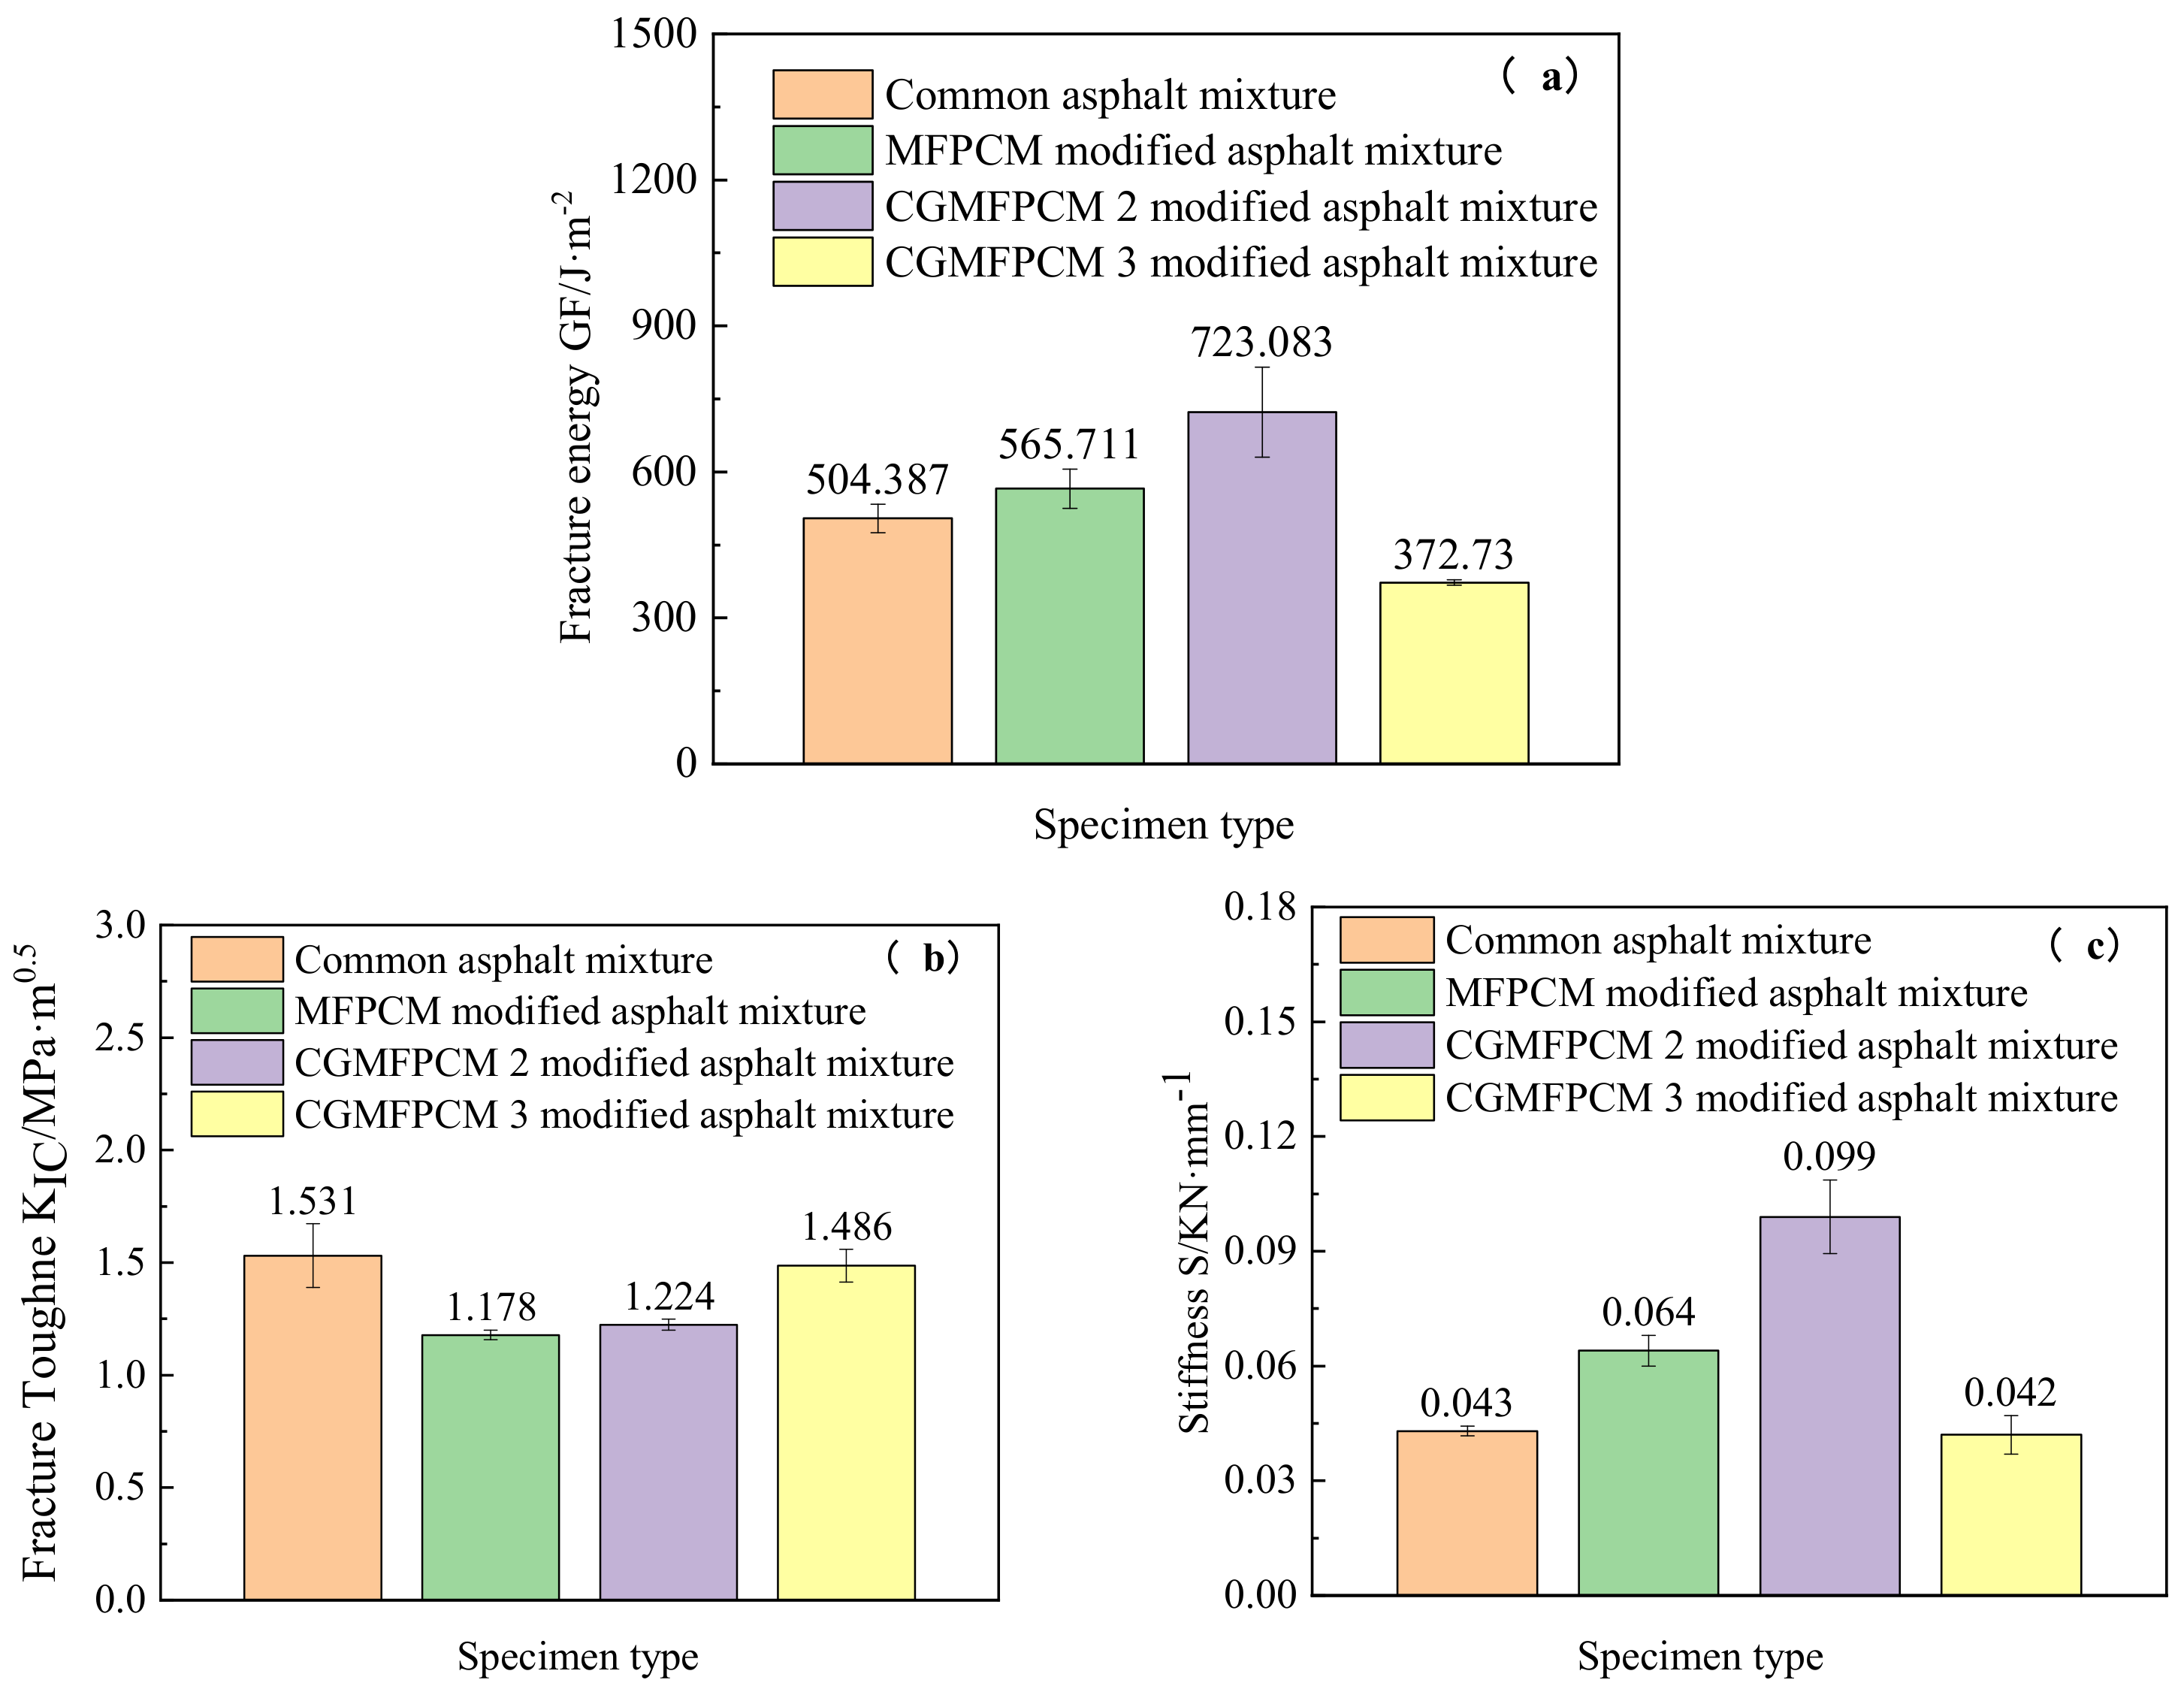
Figure 3.
SCB test (−20 °C) results for common and modified asphalt mixtures: (a) the fracture energy , (b) the fracture toughness and (c) the stiffness S.
Figure 3.
SCB test (−20 °C) results for common and modified asphalt mixtures: (a) the fracture energy , (b) the fracture toughness and (c) the stiffness S.
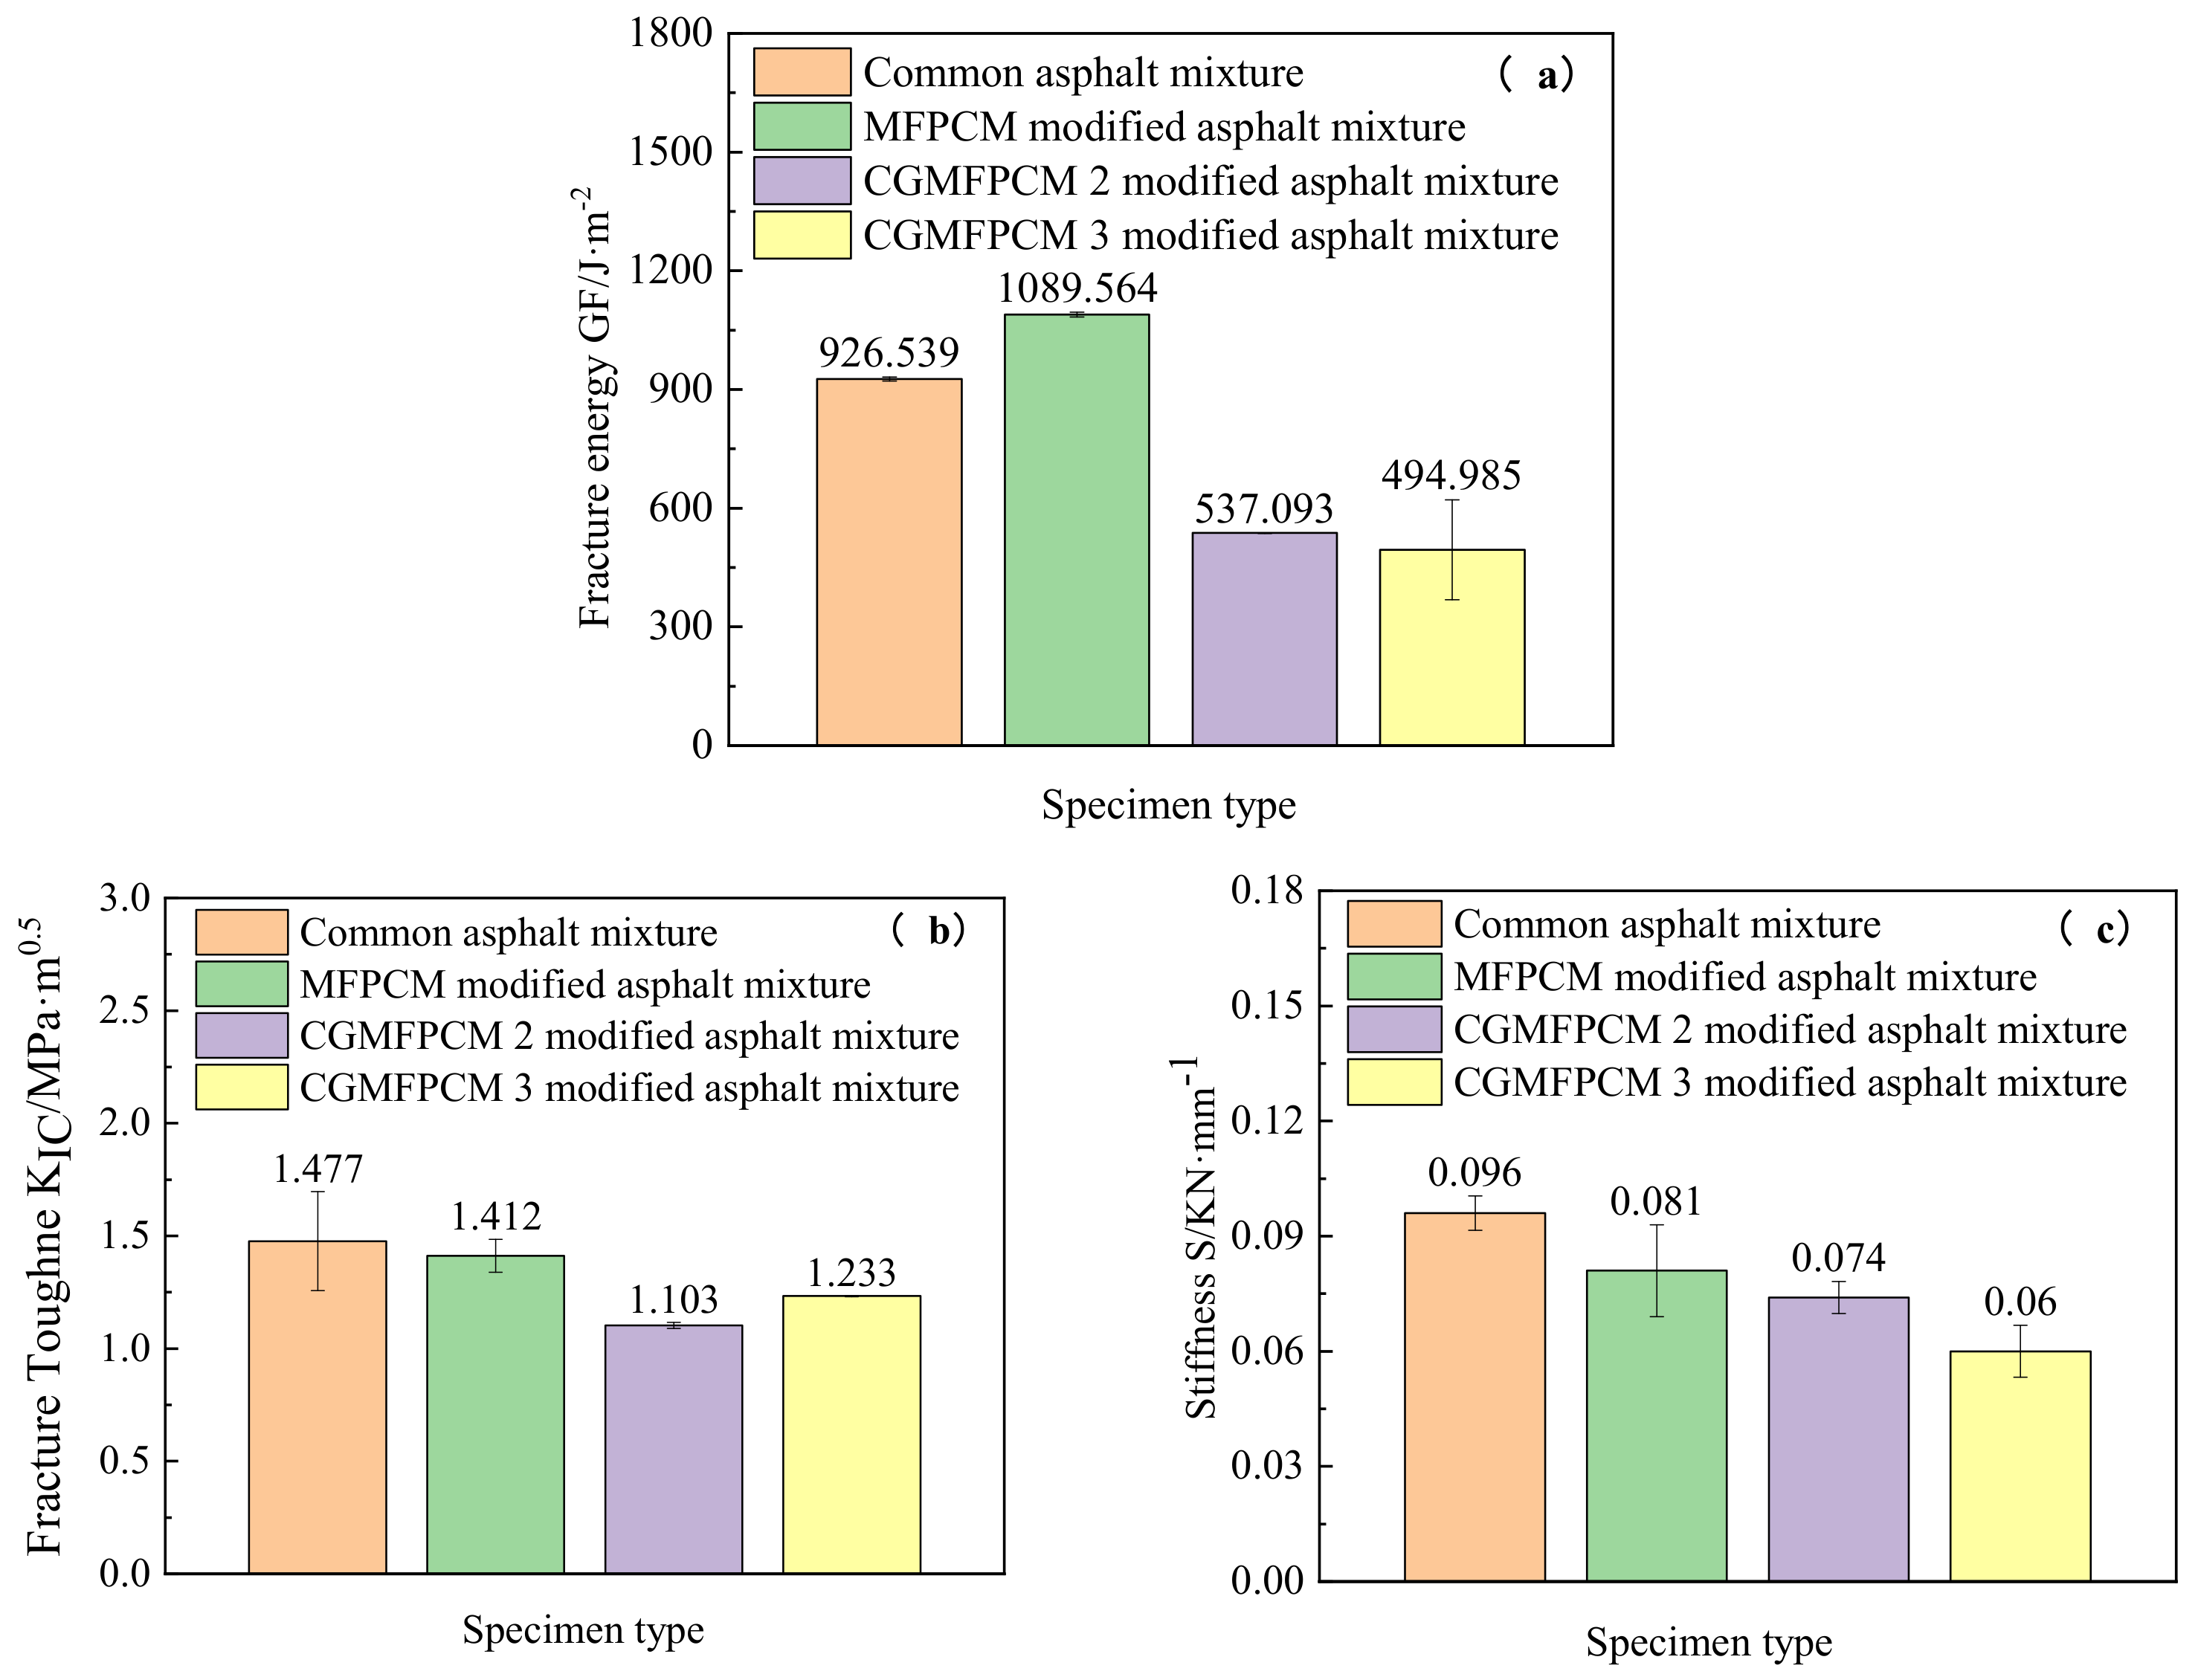
Figure 4.
SCB test (−10 °C) results for common and modified asphalt mixtures: (a) the fracture energy , (b) the fracture toughness and (c) the stiffness S.
Figure 4.
SCB test (−10 °C) results for common and modified asphalt mixtures: (a) the fracture energy , (b) the fracture toughness and (c) the stiffness S.
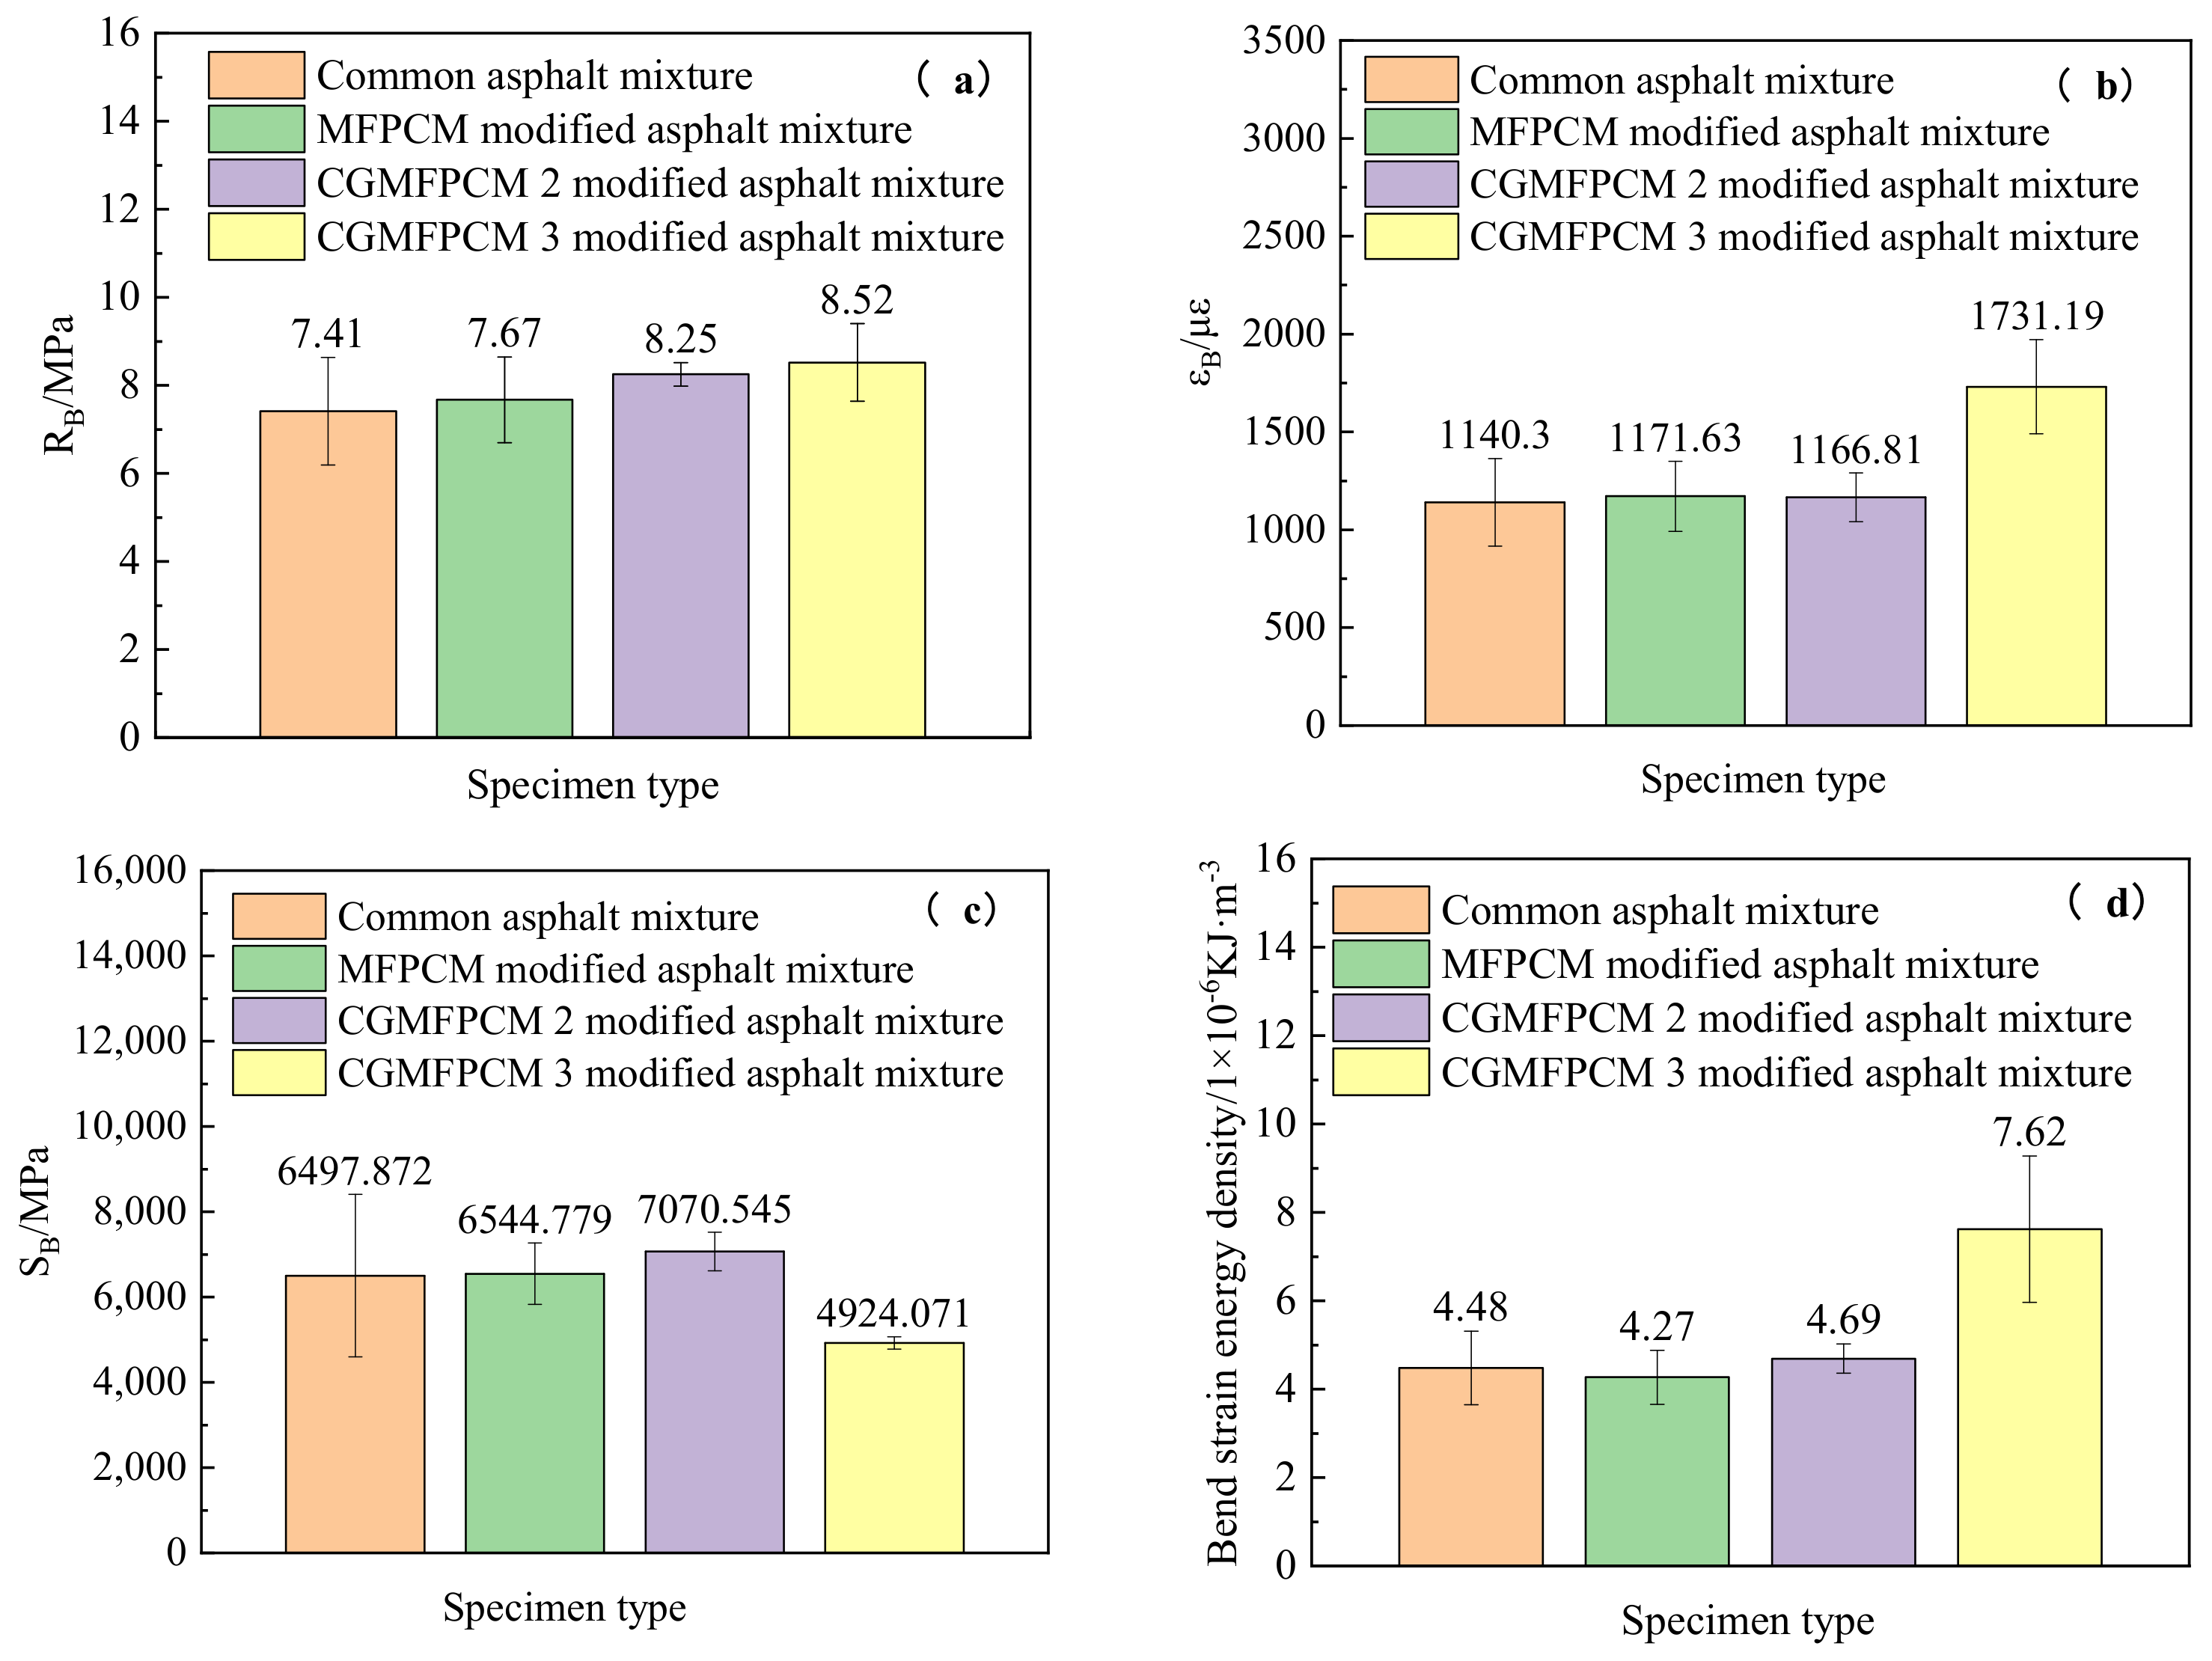
Figure 5.
Bending test results for common and modified asphalt mixtures: (a) bending strength , (b) bending failure strain , (c) bending stiffness modulus and (d) bending strain energy density .
Figure 5.
Bending test results for common and modified asphalt mixtures: (a) bending strength , (b) bending failure strain , (c) bending stiffness modulus and (d) bending strain energy density .
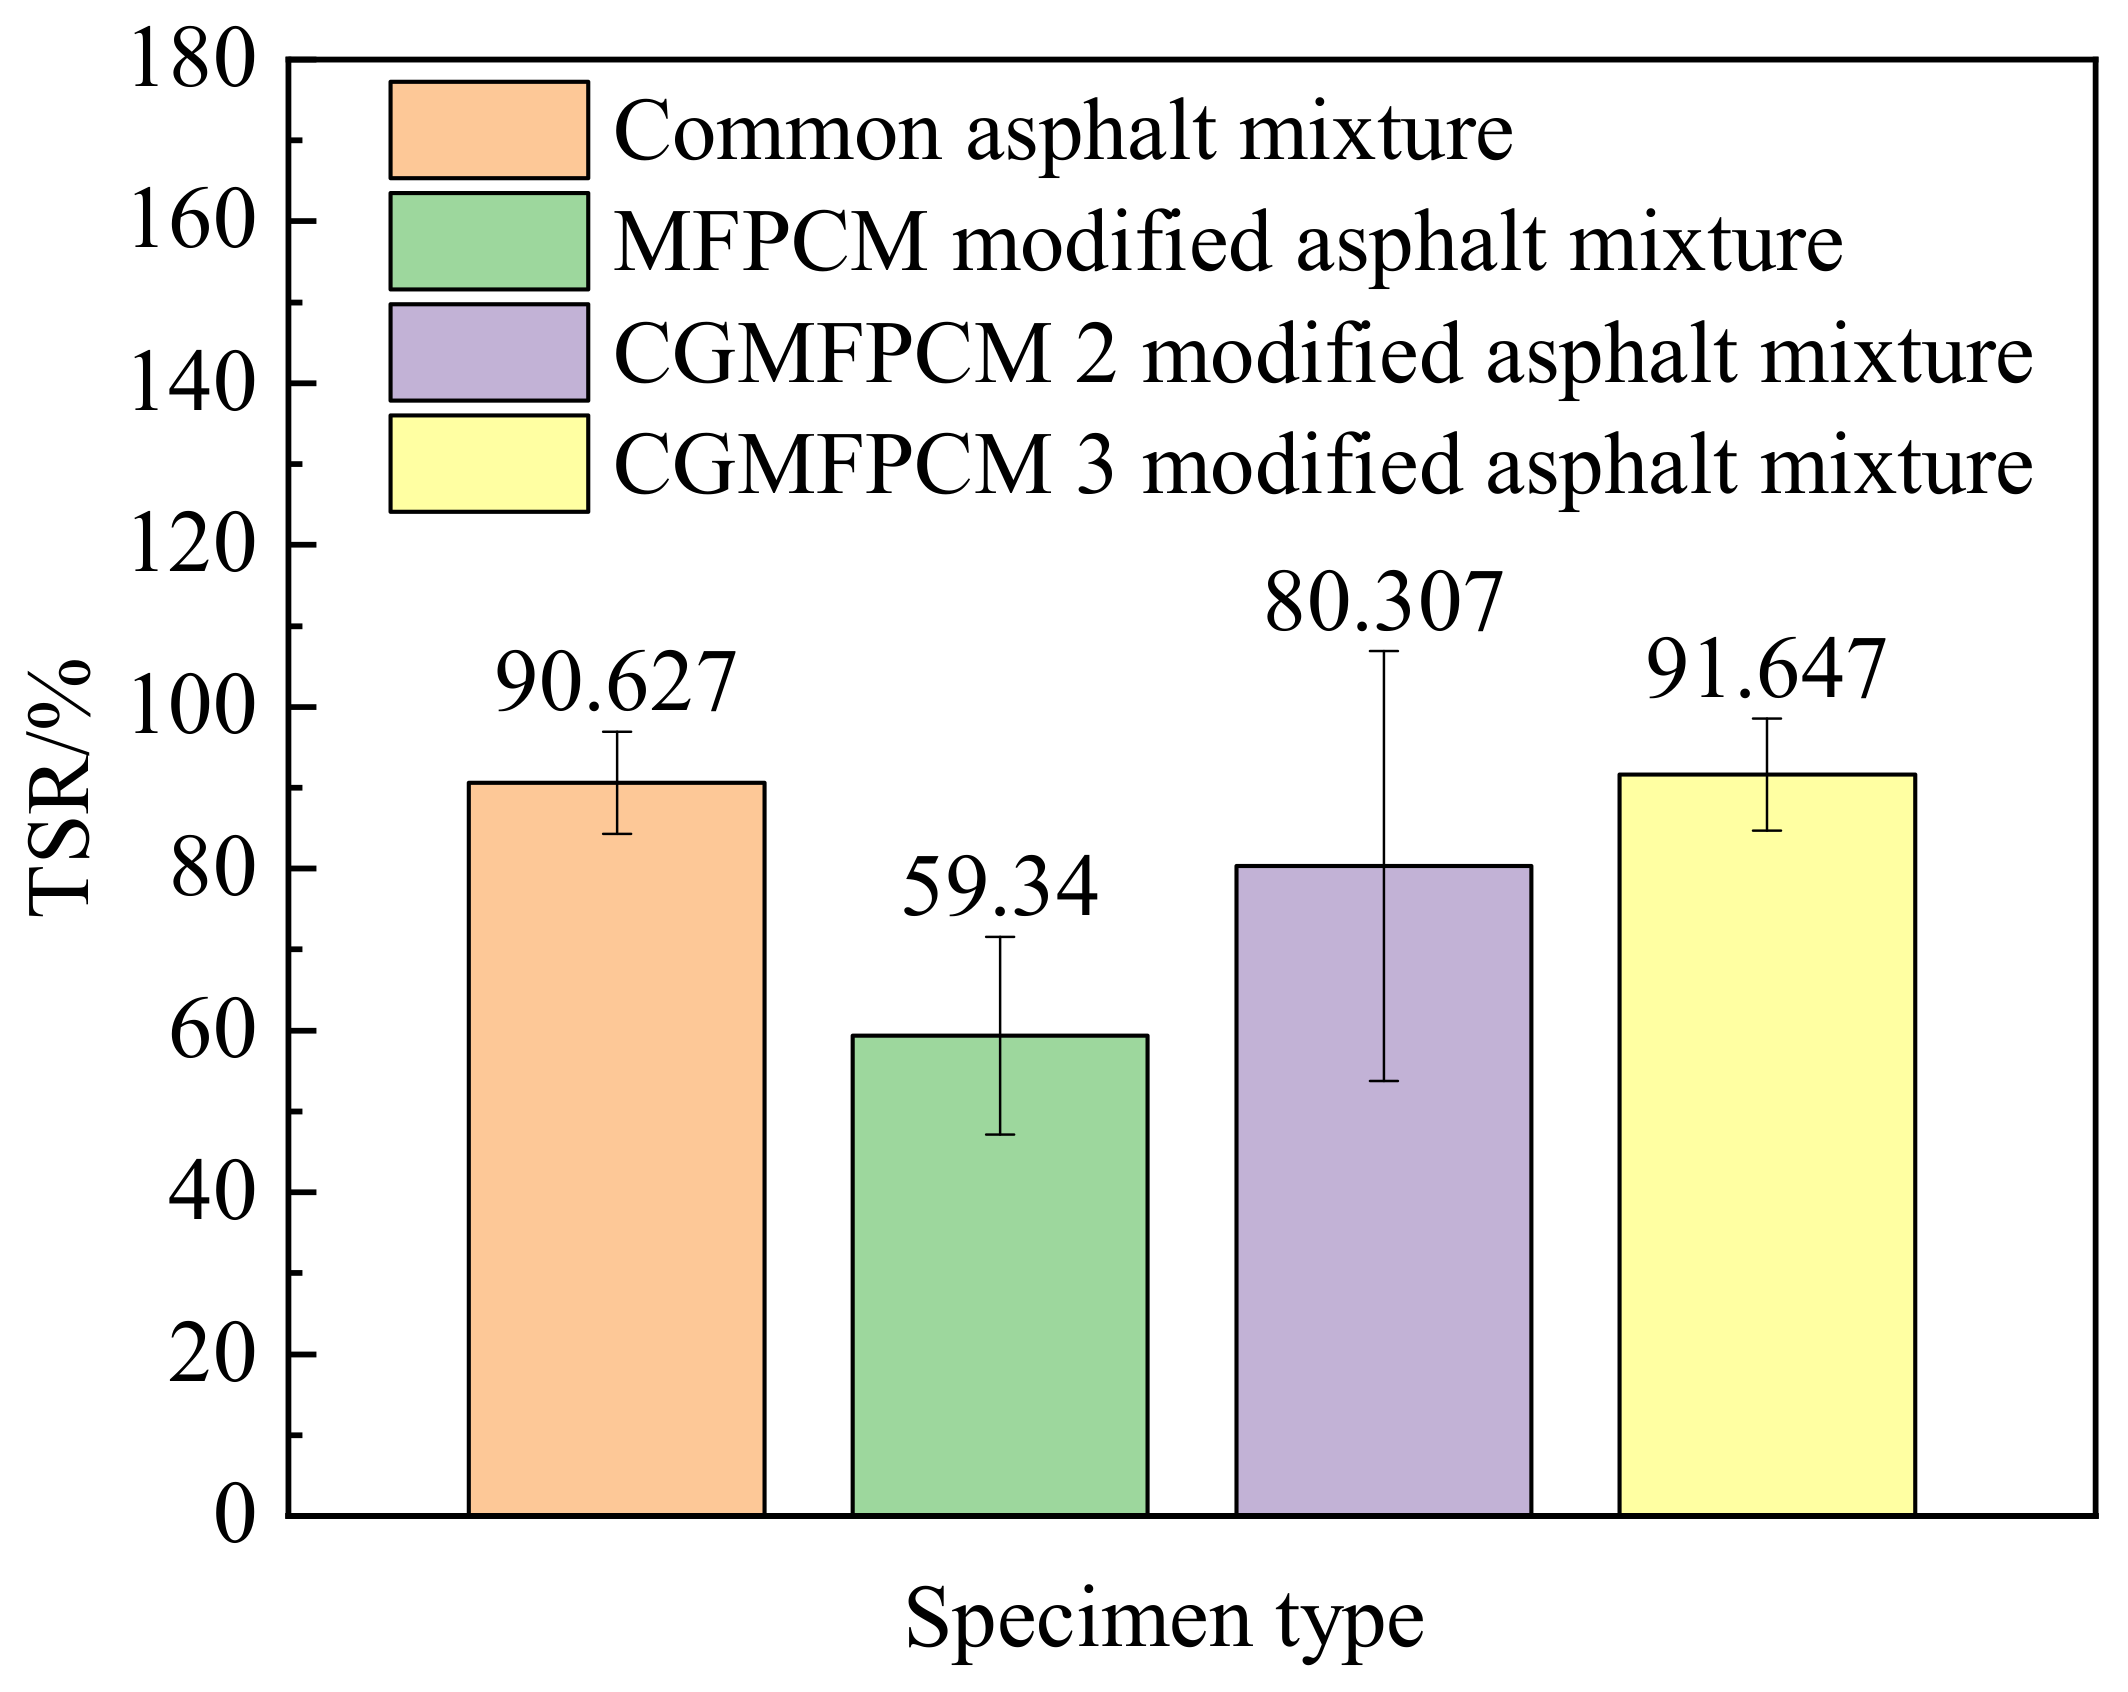
Figure 6.
TSR results for common and modified asphalt mixtures in the performed freeze–thaw splitting tests.
Figure 6.
TSR results for common and modified asphalt mixtures in the performed freeze–thaw splitting tests.
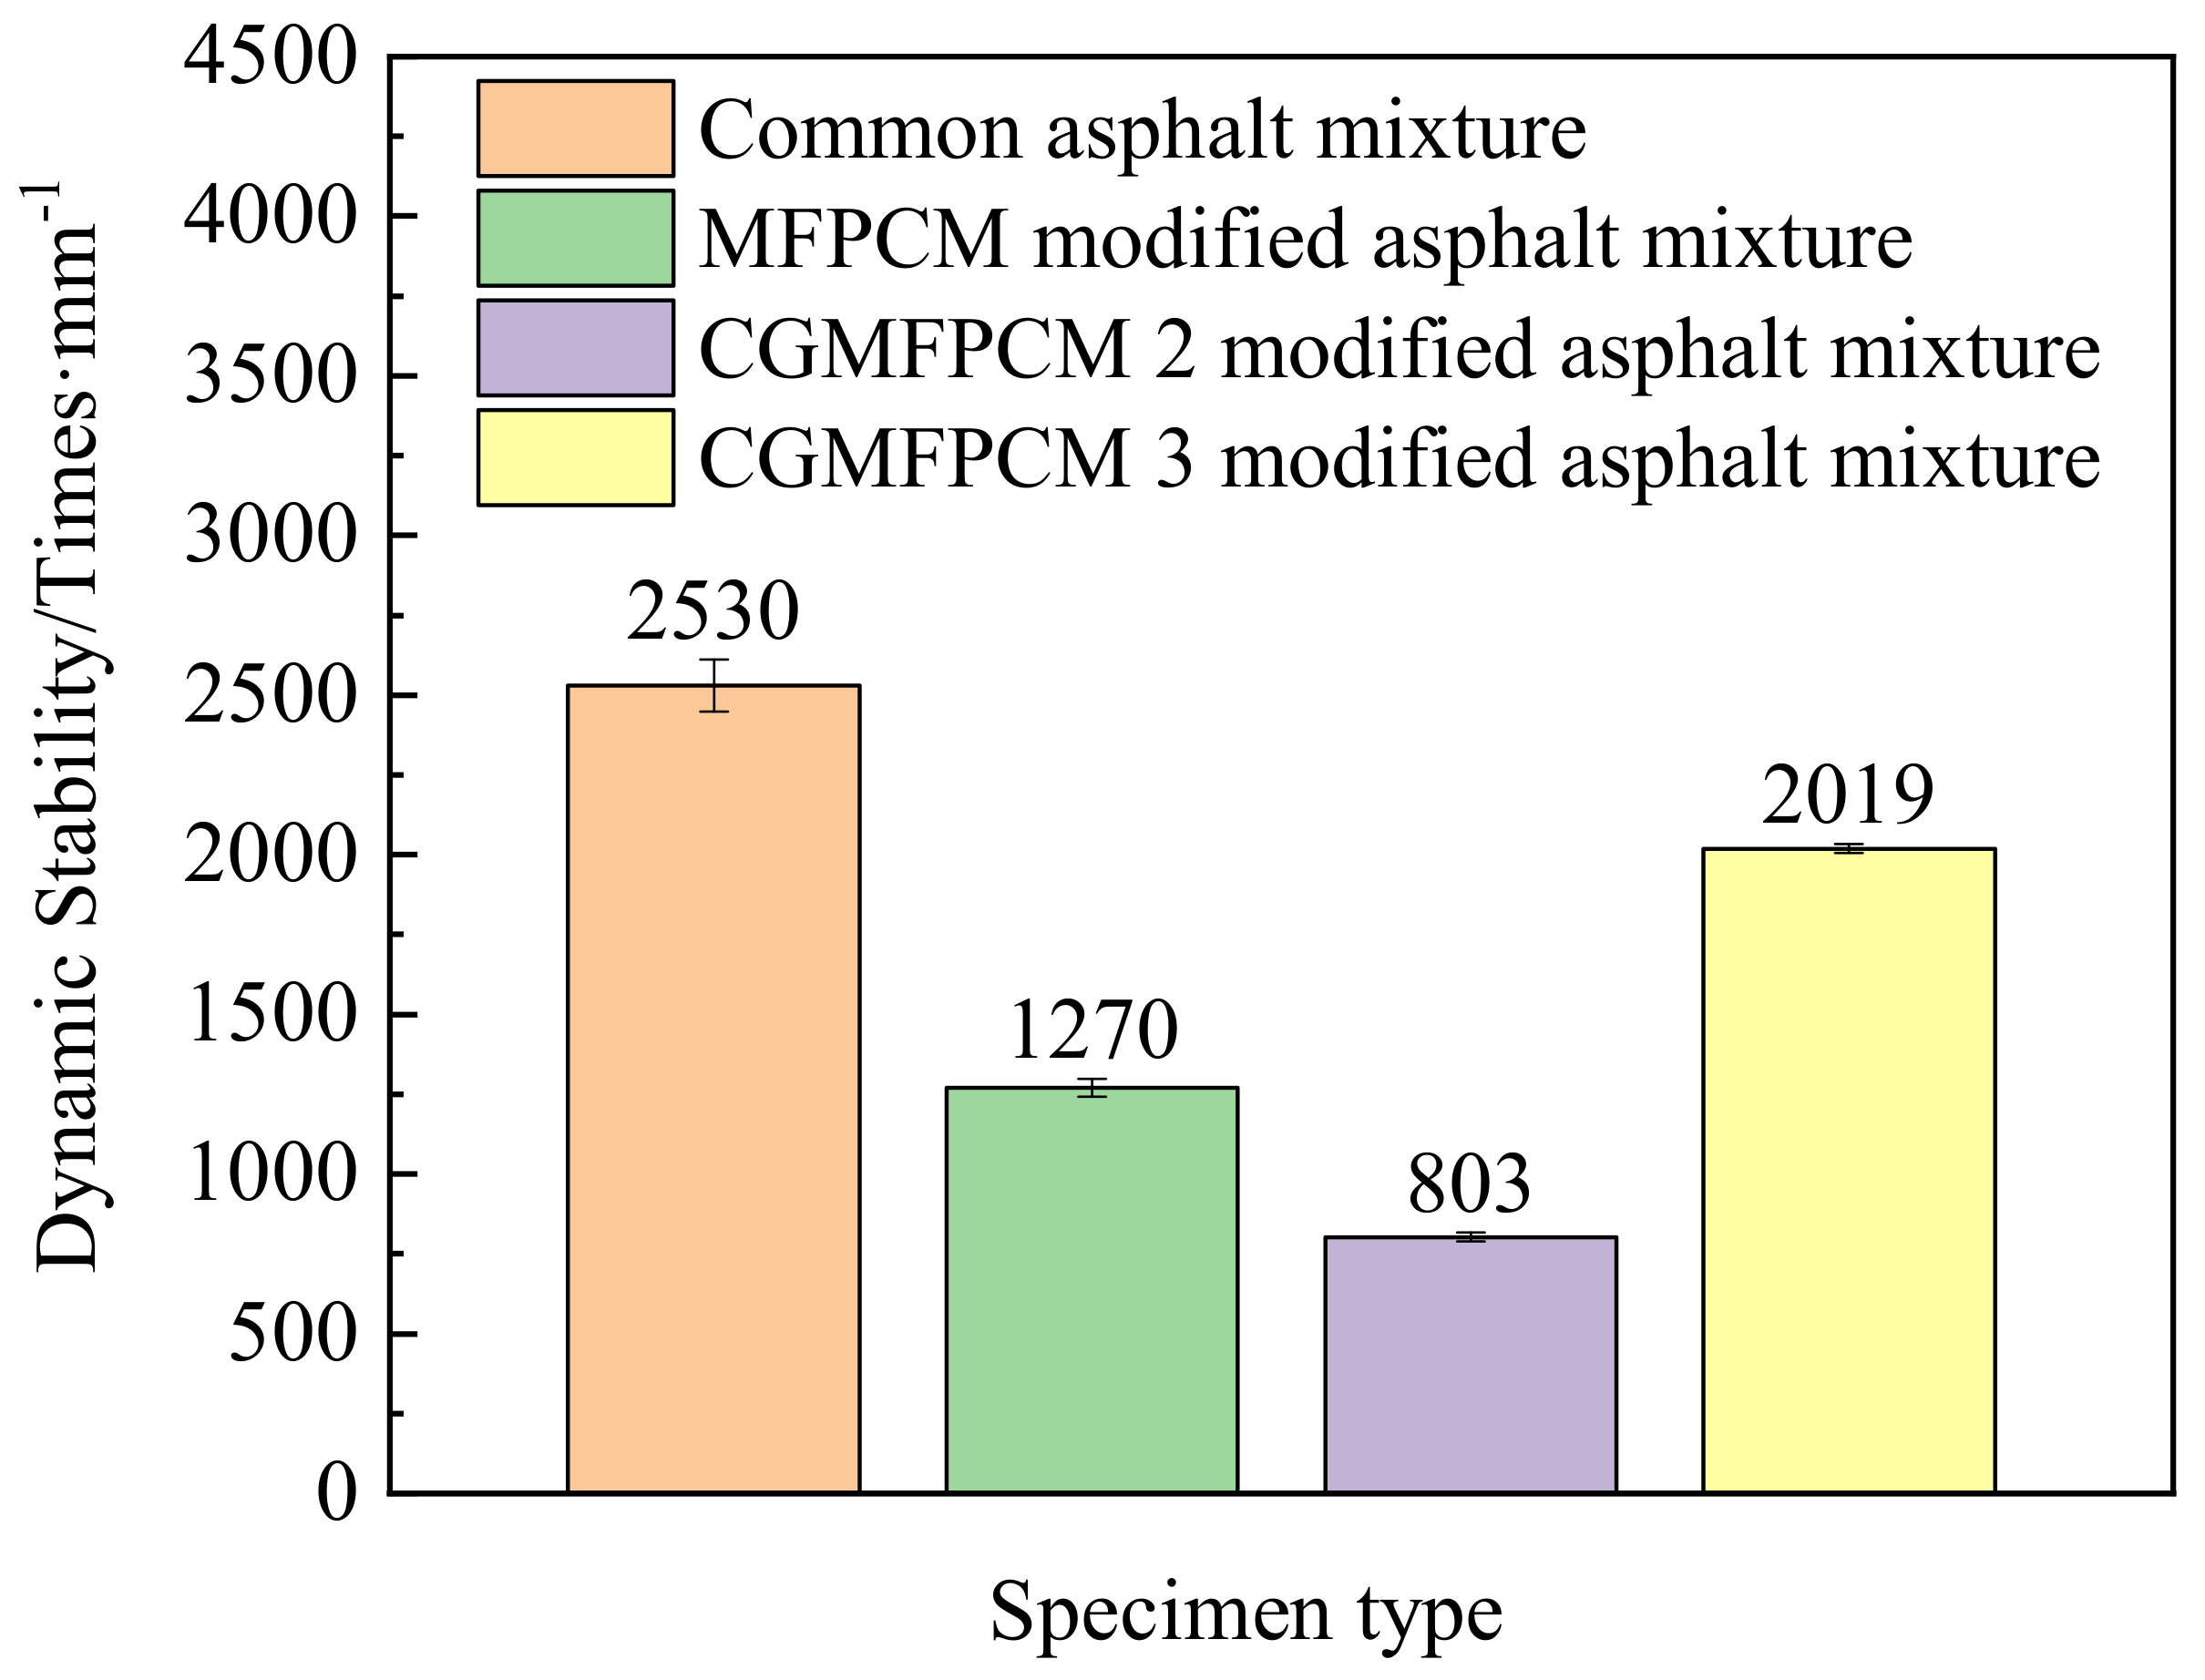
Figure 7.
Wheel tracking test results of common and modified asphalt mixtures.
Figure 7.
Wheel tracking test results of common and modified asphalt mixtures.
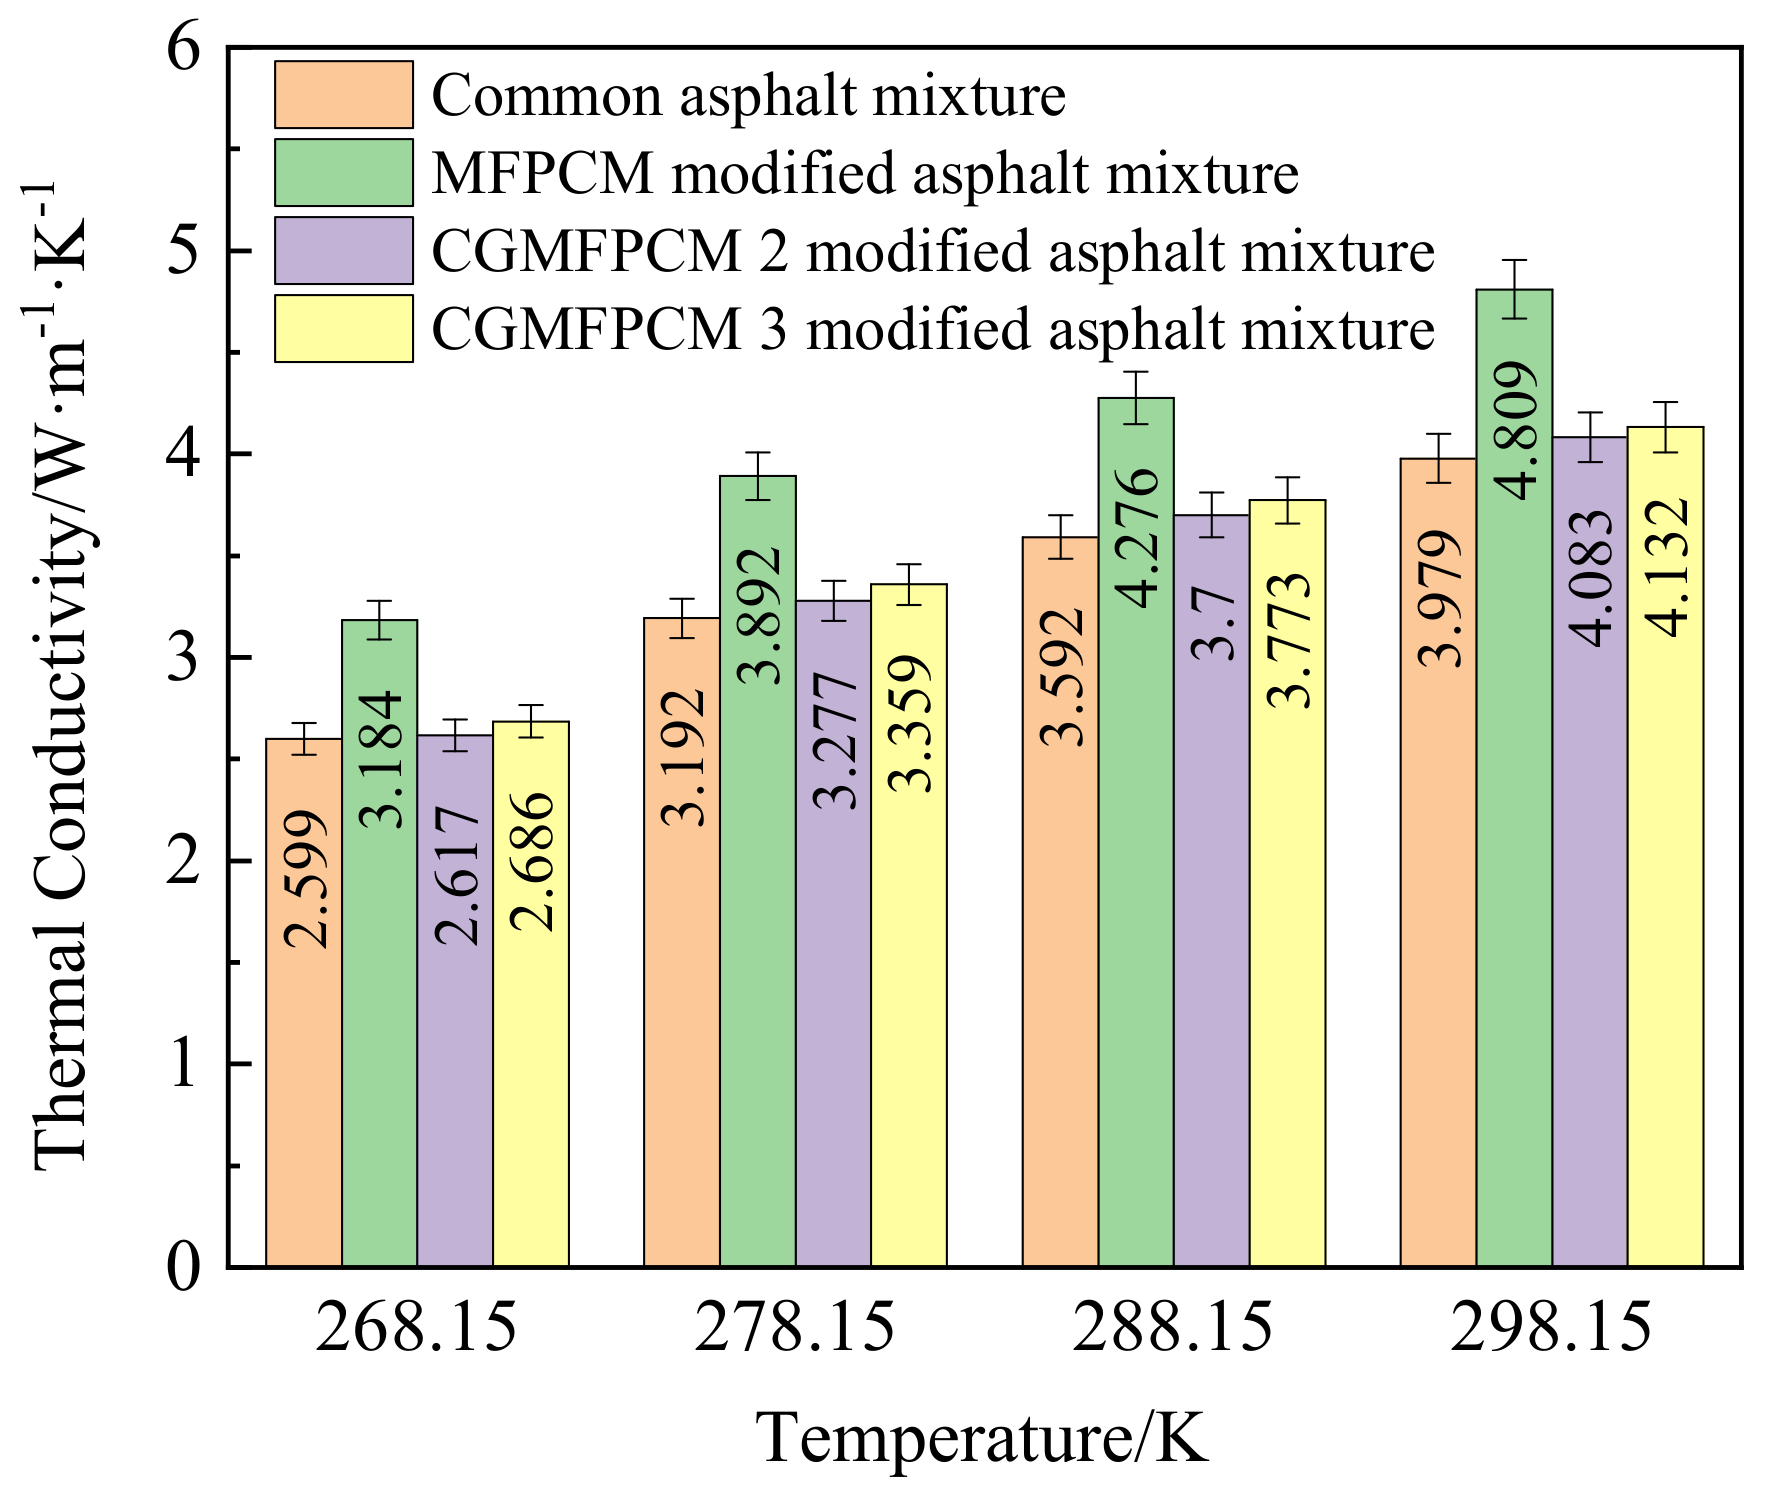
Figure 8.
Thermal conductivity versus temperature curves of common and modified asphalt mixtures.
Figure 8.
Thermal conductivity versus temperature curves of common and modified asphalt mixtures.
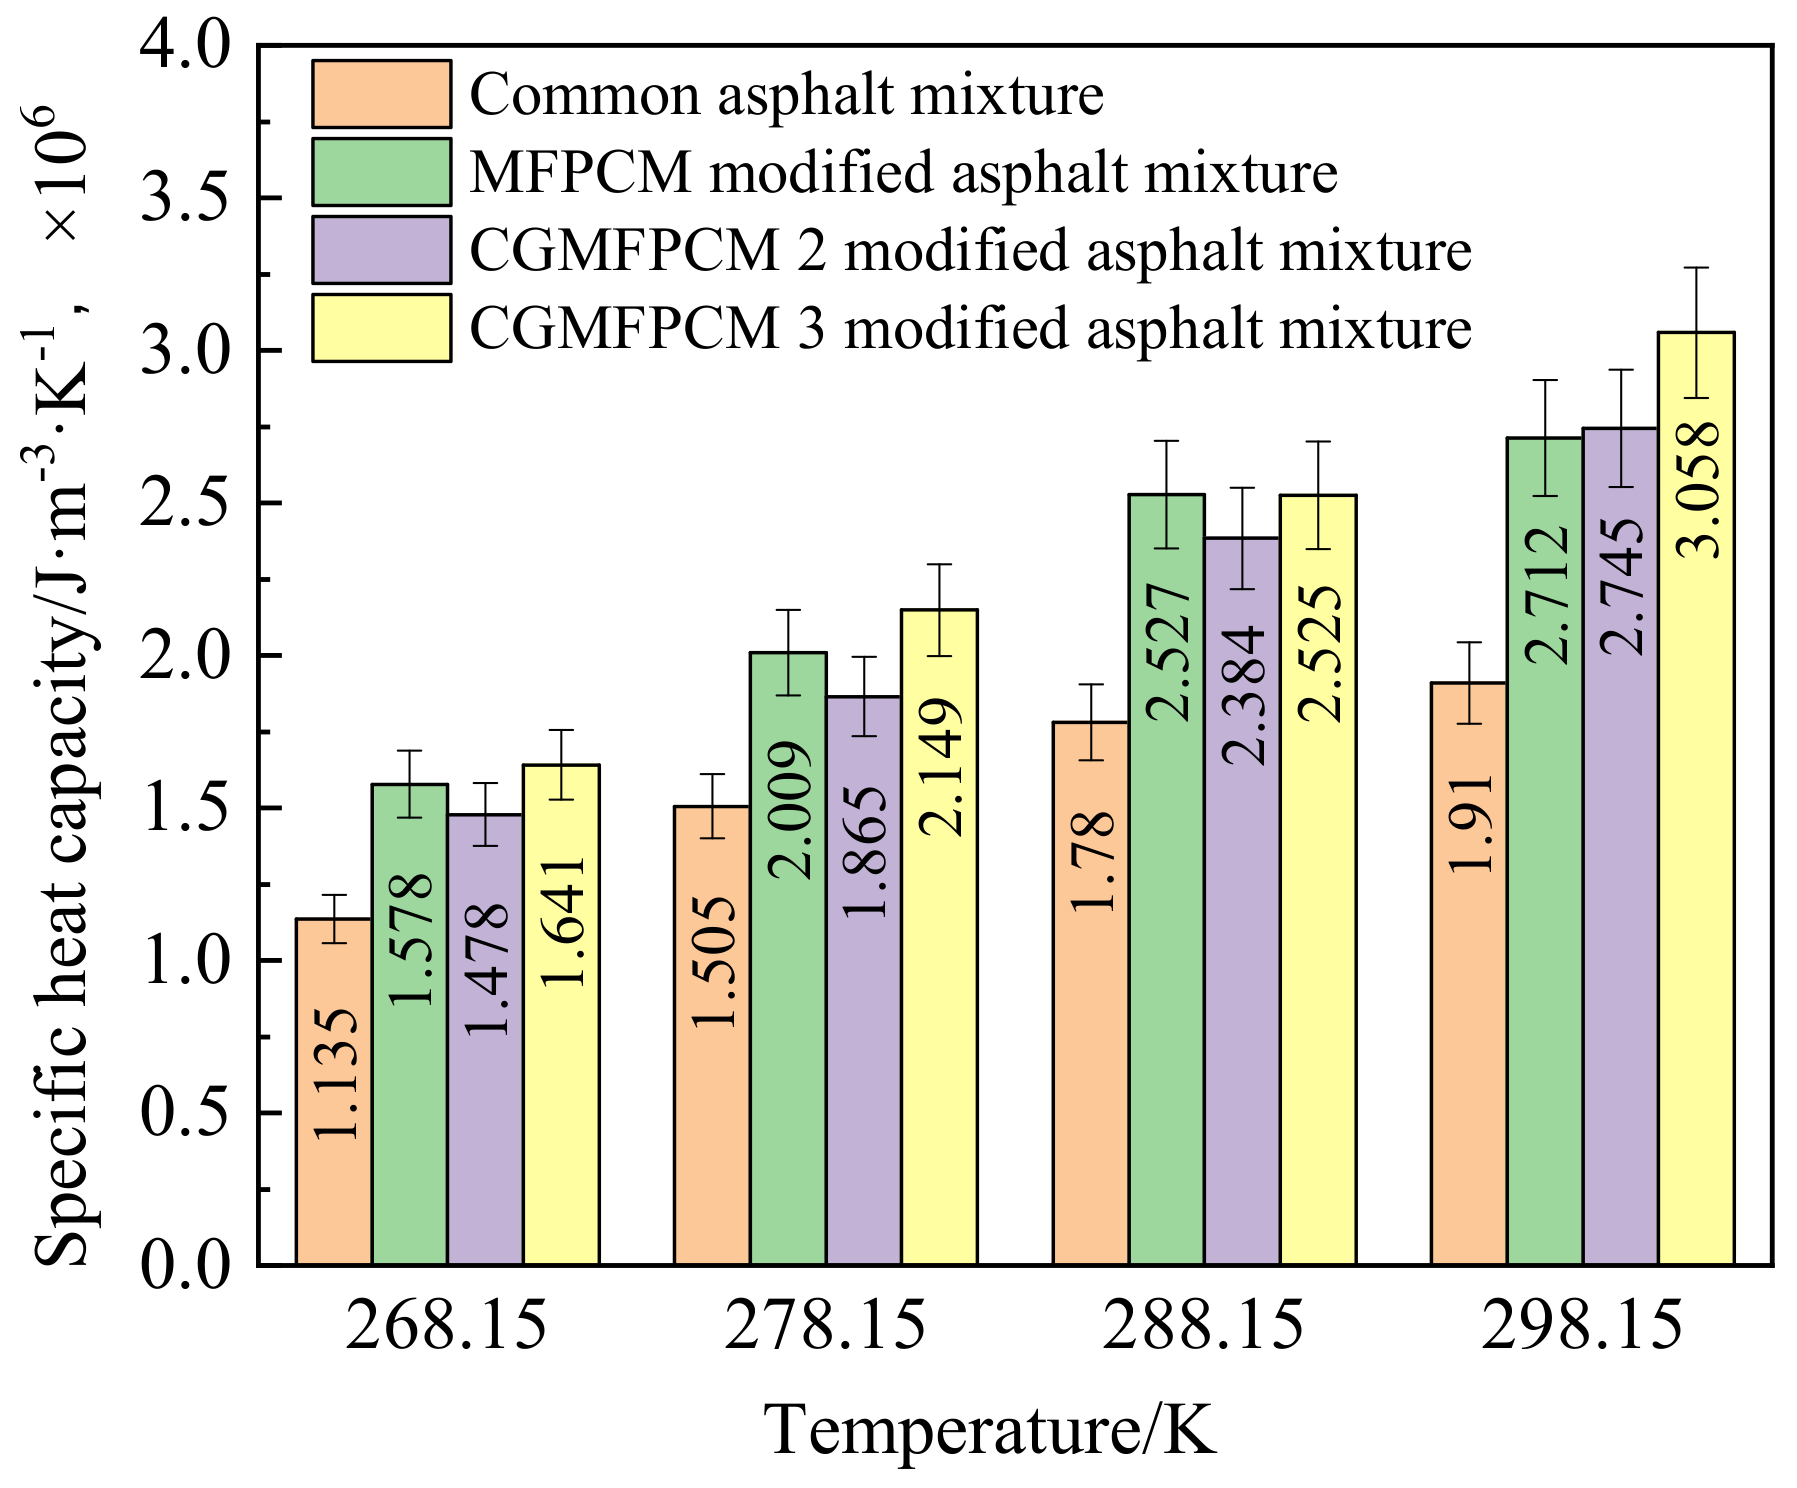
Figure 9.
Measured volume-specific heat capacities of common and modified asphalt mixtures.
Figure 9.
Measured volume-specific heat capacities of common and modified asphalt mixtures.
Table 1.
Technical properties of the matrix asphalt.
Table 1.
Technical properties of the matrix asphalt.
| Technical Properties | Test Result | Specification
Limits | Standard in China (JTG E20-2011) |
|---|
| Penetration (25 °C, 0.1 mm) | 77.9 | 60–80 | T0604-2011 |
| Softening point (°C) | 46 | ≥46 | T0606-2011 |
| Dynamic viscosity (60 °C, Pa·s) | 240 | ≥180 | T0620-2000 |
| Penetration index | −1.24 | −1.5~+1.0 | T0604-2011 |
| Density (15 °C, g/cm3) | 1.023 | — | T0603-2011 |
| Solution (Chloral, %) | 99.95 | ≥99.5 | T0607-2011 |
| Flash point(°C) | 300 | ≥260 | T0611-2011 |
| Ductility (10 °C, cm) | 40.5 | ≥25 | T0605-2011 |
| Ductility (15 °C, cm) | >100 | ≥100 | T0605-2011 |
| Wax content (Distillation, %) | 1.1 | ≤2.2 | T0615-2011 |
Table 2.
Technical specifications of phase change microcapsules.
Table 2.
Technical specifications of phase change microcapsules.
| Type | Phase Transition Temperature/°C | Latent Heat/kJ·kg−1 | Content of CG in Microcapsule Wall Material/% |
|---|
| MFPCM | 3.05~6.61 | 26.89 | — |
| CGMFPCM2 | 4.07~6.73 | 99.90 | 0.30 |
| CGMFPCM3 | 2.12~5.85 | 9.09 | 0.45 |
Table 3.
The passing rate of each sieve of the mixture’s grade.
Table 3.
The passing rate of each sieve of the mixture’s grade.
| Sieve/mm | 19 | 16 | 13.2 | 9.5 | 4.75 | 2.36 | 1.18 | 0.6 | 0.3 | 0.15 | 0.075 |
| Passing rate/% | 100 | 94.4 | 83.8 | 72.8 | 49.4 | 36.1 | 30.3 | 18.4 | 9.6 | 6.7 | 5.7 |
Table 4.
Optimal asphalt-aggregate of the AC-16 bitumen.
Table 4.
Optimal asphalt-aggregate of the AC-16 bitumen.
| Type of Asphalt | Optimal Asphalt-Aggregate Ratio/% | Gross Volume Relative Density | Void Ratio/% | Void Ratio of Mineral Aggregate/% | Saturation Degree of Asphalt/% |
|---|
| Matrix asphalt | 4.5 | 2.490 | 4.0 | 13.3 | 70.0 |
| MFPCM | 4.5 | 2.495 | 4.0 | 13.4 | 69.8 |
| CGMFPCM2 | 4.5 | 2.519 | 3.5 | 12.9 | 72.8 |
| CGMFPCM3 | 4.5 | 2.495 | 4.0 | 13.3 | 69.8 |
Table 5.
Variance analysis of the fracture energy results in the performed SCB tests.
Table 5.
Variance analysis of the fracture energy results in the performed SCB tests.
| Temperature | Source of Variance | Sum of Squares | Degrees of Freedom | Mean Square
Error | F | F0.05 |
|---|
| −20 °C | Graphene content in the PCM microcapsules | 199,978.099 | 2 | 99,989.049 | 0.32 | 9.55 |
| Error | 924,428.746 | 3 | 308,142.915 | | |
| Sum | 1,124,406.844 | 5 | | | |
| −10 °C | Graphene content in the PCM microcapsules | 36,033.046 | 2 | 18,016.523 | 0.03 | 9.55 |
| Error | 2,036,094.788 | 3 | 678,698.263 | | |
| Sum | 2,072,127.834 | 5 | | | |
Table 6.
Variance analysis of the fracture toughness results in the present SCB test.
Table 6.
Variance analysis of the fracture toughness results in the present SCB test.
| Temperature | Source of Variance | Sum of Squares | Degrees of Freedom | Mean Square Error | F | F0.05 |
|---|
| −20 °C | Graphene content in PCM microcapsules | 0.480 | 2 | 0.240 | 0.14 | 9.55 |
| Error | 5.064 | 3 | 1.688 | | |
| Sum | 5.543 | 5 | | | |
| −10 °C | Graphene content in the PCM microcapsules | 0.149 | 2 | 0.075 | 0.04 | 9.55 |
| Error | 4.995 | 3 | 1.665 | | |
| Sum | 5.145 | 5 | | | |
Table 7.
Variance analysis of the stiffness results in the present SCB test.
Table 7.
Variance analysis of the stiffness results in the present SCB test.
| Temperature | Source of Variance | Sum of Squares | Degrees of Freedom | Mean Square Error | F | F0.05 |
|---|
| −20 °C | Graphene content in PCM microcapsules | 0.005 | 2 | 0.002 | 0.50 | 9.55 |
| Error | 0.014 | 3 | 0.005 | | |
| Sum | 0.018 | 5 | | | |
| −10 °C | Graphene content in the PCM microcapsules | 0.005 | 2 | 0.002 | 0.50 | 9.55 |
| Error | 0.014 | 3 | 0.005 | | |
| Sum | 0.018 | 5 | | | |
Table 8.
Variance analysis of the bending strength results in the performed beam bending tests.
Table 8.
Variance analysis of the bending strength results in the performed beam bending tests.
| Source of Variance | Sum of Squares | Degrees of Freedom | Mean Square Error | F | F0.05 |
|---|
| Graphene content in PCM microcapsules | 1.893 | 2 | 0.947 | 1.33 | 4.10 |
| Error | 7.137 | 10 | 0.714 | | |
| Sum | 9.030 | 12 | | | |
Table 9.
Variance analysis of the bending failure strain results in the performed beam bending tests.
Table 9.
Variance analysis of the bending failure strain results in the performed beam bending tests.
| Source of Variance | Sum of Squares | Degrees of Freedom | Mean Square
Error | F | F0.05 |
|---|
| Graphene content in PCM microcapsules | 824,130.234 | 2 | 412,065.117 | 2.79 | 3.98 |
| Error | 1,624,549.828 | 11 | 147,686.348 | | |
| Sum | 2,448,680.063 | 13 | | | |
Table 10.
Variance analysis of the bending stiffness modulus results in the performed beam bending tests.
Table 10.
Variance analysis of the bending stiffness modulus results in the performed beam bending tests.
| Source of Variance | Sum of Squares | Degrees of Freedom | Mean Square Error | F | F0.05 |
|---|
| Graphene content in PCM microcapsules | 8,373,855.446 | 2 | 4,186,927.723 | 0.74 | 3.98 |
| Error | 62,298,028.765 | 11 | 5,663,457.160 | | |
| Sum | 70,671,884.210 | 13 | | | |
Table 11.
Variance analysis of the bending strain energy in the performed beam bending tests.
Table 11.
Variance analysis of the bending strain energy in the performed beam bending tests.
| Source of Variance | Sum of Squares | Degrees of Freedom | Mean Square Error | F | F0.05 |
|---|
| Graphene content in PCM microcapsules | 4.60309 × 10⁻¹¹ | 2 | 2.30154 × 10⁻¹¹ | 9.13 | 4.26 |
| Error | 2.26957 × 10⁻¹¹ | 9 | 2.52174 × 10⁻¹² | | |
| Sum | 6.87266 × 10⁻¹¹ | 11 | | | |
Table 12.
Freeze–thaw splitting test results for common and modified asphalt mixtures.
Table 12.
Freeze–thaw splitting test results for common and modified asphalt mixtures.
| Specimen Type | RT2/MPa | RT1/MPa | TSR/% |
|---|
| Test Result | JTG F40 |
|---|
| Common asphalt mixture | 0.927 | 1.022 | 90.627 | ≥70 |
| MFPCM-modified asphalt mixture | 0.544 | 0.916 | 59.340 | ≥75 |
| CGMFPCM 2-modified asphalt mixture | 0.660 | 0.822 | 80.307 |
| CGMFPCM 3-modified asphalt mixture | 0.787 | 0.859 | 91.647 |
Table 13.
Variance analysis of the bending strain energy in the performed freeze–thaw splitting test.
Table 13.
Variance analysis of the bending strain energy in the performed freeze–thaw splitting test.
| Source of Variance | Sum of Squares | Degrees of Freedom | Mean Square Error | F | F0.05 |
|---|
| Graphene content in PCM microcapsules | 0.162 | 2 | 0.081 | 0.19 | 3.88 |
| Error | 5.085 | 12 | 0.424 | | |
| Sum | 5.247 | 14 | | | |
Table 14.
Wheel tracking test results for common and modified asphalt mixtures.
Table 14.
Wheel tracking test results for common and modified asphalt mixtures.
| Sample Name | Dynamic Stability/
Times·mm−1 | JTG F40/Times·mm−1 |
|---|
| Common asphalt mixture | 2530 | ≥600 |
| MFPCM-modified asphalt mixture | 1270 | ≥1800 |
| CGMFPCM 2-modified asphalt mixture | 803 | ≥1800 |
| CGMFPCM 3-modified asphalt mixture | 2019 | ≥1800 |
Table 15.
Variance analysis of the bending strain energy in the performed wheel tracking test.
Table 15.
Variance analysis of the bending strain energy in the performed wheel tracking test.
| Source of Variance | Sum of Squares | Degrees of Freedom | Mean Square Error | F | F0.05 |
|---|
| Graphene content in PCM microcapsules | 1,933,268.019 | 2 | 966,634.010 | 1.06 | 5.14 |
| Error | 5,480,226.750 | 6 | 913,371.125 | | |
| Sum | 7,413,494.769 | 8 | | | |
Table 16.
Thermal Conductivity Rate of change of common and modified asphalt mixtures.
Table 16.
Thermal Conductivity Rate of change of common and modified asphalt mixtures.
| Sample Name | Thermal Conductivity
Rate of Change/W·m−1·K−2 | R2 |
|---|
| Common asphalt mixture | 0.0454 | 0.9883 |
| MFPCM modified asphalt mixture | 0.0526 | 0.9866 |
| CGMFPCM 2 modified asphalt mixture | 0.0482 | 0.9821 |
| CGMFPCM 3 modified asphalt mixture | 0.0475 | 0.9769 |
Table 17.
Volume specific heat capacity Rate of change of common and modified asphalt mixtures.
Table 17.
Volume specific heat capacity Rate of change of common and modified asphalt mixtures.
| Sample Name | Volume Specific Heat Capacity
Rate of Change/(J·m−3·K−2, ×106) | R2 |
|---|
| Common asphalt mixture | 0.026 | 0.9588 |
| MFPCM modified asphalt mixture | 0.0392 | 0.9658 |
| CGMFPCM 2 modified asphalt mixture | 0.0432 | 0.9953 |
| CGMFPCM 3 modified asphalt mixture | 0.0463 | 0.996 |
Table 18.
Preparation cost of phase change microcapsule modified asphalt mixture.
Table 18.
Preparation cost of phase change microcapsule modified asphalt mixture.
| Type of Phase-Change Microcapsule | Preparation Cost per Ton of Phase Change Microcapsule
Modified Asphalt Mixture, RMB/USD |
|---|
| Laboratory Preparation | Industrial Production |
|---|
| MFPCM | 3728.59/586.13 | 45.24/7.11 |
| CGMFPCM 2 | 7034.06/1105.75 | 96.09/15.11 |
| CGMFPCM 3 | 8686.79/1365.56 | 121.52/19.10 |


