Article

Top-Down Formulation of Goethite Nanosuspensions for the Production of Transparent, Inorganic Glass Coatings

by
Christoph Peppersack
1,*,
Karsten Wermbter
2,
Arno Kwade
1,
Georg Garnweitner
1 and
Sandra Breitung-Faes
1
1
Institute for Particle Technology, Technische Universität Braunschweig, Volkmaroder Straße 5, 38104 Braunschweig, Germany
2
Glas-Plus Beschichtungs GmbH & Co. KG, Galileo-Galilei-Straße 28, 55129 Mainz, Germany
*
Author to whom correspondence should be addressed.
Coatings 2022, 12(3), 330; https://doi.org/10.3390/coatings12030330
Submission received: 27 January 2022 / Revised: 23 February 2022 / Accepted: 24 February 2022 / Published: 2 March 2022
(This article belongs to the Special Issue Optical Thin Films: Preparation, Application and Development)

Abstract

:
This study presents a simple but effective process route for the production of transparent coatings on glass substrates from inorganic pigment goethite. For this purpose, coating suspensions were prepared by wet milling with a stirred media mill. A water/ethanol mixture was used as the liquid medium to take advantage of the resulting low surface tension for the coating process. In this manner, stable suspensions with particles of down to 50 nm in size were obtained, which already showed a significant increase in transparency. With regard to grinding characteristics, particularly low stress energies proved to be energetically reasonable. The coating step was performed by wet film deposition, achieving coating thicknesses in a range of 0.5–2.5 µm via dip coating. Highly transparent coatings were obtained by applying small particles of 50 nm, which exhibited a significantly lower scattering loss of light (≈3%) in comparison to particles of around 300 nm (70–80%). Additionally, the film color could be adjusted through a variation of the drying temperature due to a conversion of goethite to hematite by dehydration. Since transparency was not affected, this provides an easy-to-implement process adaptation for controlling coating colors.

1. Introduction

Transparent coatings play a major role in various fields of application, both in research and industry. For example, they are often used as conductive films for solar panels or displays as mechanically protective coatings with additional properties such as specific optical, self-cleaning or water-repellent characteristics as well as simply for decorative purposes [1,2,3,4]. The functionality of the coating is in many cases defined by a particle component that delivers the desired property. In this context, the size of the particles has to be considered as decisive in order to achieve the effect of transparency. In principle, it is known that transparency occurs if the scattering loss of the incident light is small, which is only the case for very fine particles in the nanometer range [5,6]. As a reference, these particles should be smaller than the wavelength of visible light by a factor of 10 [7,8].
From the common methods for wet film deposition, dip coating constitutes the oldest applied coating process. At first, the substrate to be coated is immersed and wetted in a precursor solution or a suspension. A wet film is applied by pulling out the substrate in a controlled manner, which is followed by the evaporation of the solvent, resulting in film formation. The latter step can be promoted by additional heat [9]. A major advantage of the method is that the procedure is comparatively simple, but complex structures in terms of their shape can still be coated. In many cases, the coating matrix is formed during the dip-coating step, for example, in a sol–gel process. The functional particle component may also be formed during this step, but it is generally provided as presynthesized particles dispersed in the coating solvent, referred to as the coating suspension. If the particle component cannot be directly synthesized in the desired, small particle size range or if only coarse particle structures are available from natural resources, a top-down formulation represents the only method to prepare coating suspensions. Bearing this in mind, grinding in stirred media mills provides a well-established and suitable method to obtain nanoparticulate suspensions [10,11,12,13]. Breitung-Faes or Schilde et al., for example, achieved a size of <20 nm during the comminution of α-Al2O3 or zinc oxide and, as a consequence, significantly increased the suspension’s transparency [14,15]. Moreover, it is known that the aforementioned grinding procedure offers a good opportunity for a scale up so that high production capacities can be achieved [16,17].
In addition to achieving the desired optical properties, it is also of great interest to develop universally applicable manufacturing methods that in principle can be transferred to various particle systems for these coatings. Furthermore, the investigation was targeted to be able to vary function-oriented properties (e.g., film color) by rather simple strategies. Within this context, the presented studies were conducted on the exemplary inorganic material goethite, which is a widely used yellow pigment. For this substance, a top-down processing method with respect to the nanometer range has been scarcely researched. Ding and Pacek examined the deagglomeration behavior of goethite using an ultrasonic grinding device [18]. They were able to break aggregates down to their primary particles, which ranged around 100 nm. However, regarding the realization of transparent dispersions and coatings, it can be assumed that such a particle size is still too large and that, in addition, the applied stressing mechanism would not be appropriate, since the minimum achievable particle size will always be limited by primary particles when stressed with ultrasound. Hence, milling with a stirred media mill was considered, because this method enables the breakage of the primary particles until the true grinding limit is reached [19]. To this end, the study includes the establishment of a suitable stabilization method as well as the characterization of the milling process with special focus on an energetic optimization depending on important operating parameters. Subsequently, obtained nanodispersions were utilized for the coating of glass substrates via a dip coating step. Taking formulation properties (e.g., solid content in the suspensions, particle size) and process parameters (e.g., withdrawal speed, drying temperature) into account, an in-depth evaluation was carried out, focusing on the homogeneity, transparency and color of the coatings.

2. Materials and Methods

2.1. Stirred Media Milling Experiments

The top-down processing of goethite (FeO(OH), Kremer Pigmente GmbH & Co. KG, Aichstetten, Germany) was performed in the stirred media mill PML 2 (Buehler AG, Uzwil, Switzerland) using the Centex™ S2 geometry as process unit, which entirely consisted of sintered silicon carbide (SSiC). The mill was operated in circuit mode in which the suspension was pumped from a vessel through the mill and back into the same vessel. For grinding, spherical grinding media consisting of yttria-stabilized zirconia (Yt-ZrO2) of type ZY-E (Sigmund Lindner GmbH, Warmensteinach, Germany) were used in various median sizes (243, 315 and 530 µm). A water/ethanol mixture with a volume fraction with respect to ethanol of ϕEtOH = 0.7 was selected as the suspension medium, and the solid content of goethite varied between wG = 0.05 and 0.25. During grinding, the total power input P introduced to the grinding chamber was recorded. To calculate the specific energy input Em according to Equation (1) [17], the no-load power P0 was also determined after each grinding run.
E m ( t ) = 0 t ( P ( t ) P 0 ) dt m P
The flow rate, V, grinding media filling ratio, ϕGM, pH* value that represents the pH in the water/ethanol mixture and temperature, T, were set to 30 L·h−1, 0.8, 2.5 (with hydrochloric acid) and 8–10 °C, respectively, and were kept constant throughout all experiments. Samples were taken from the vessel and processed or analyzed by at least one of the following methods.

2.2. Dip-Coating of Goethite Suspensions

Prior to the coating step, tetraorthosilicate (TEOS, Sigma Aldrich GmbH, Taufkirchen, Germany) was mixed as a cross-linking agent into the ground suspensions in a molar ratio of 0.2:1 with respect to the amount of goethite. Goethite coatings were obtained by a dip coating method (Coater 4, IDLab, Prague, Czech Republic) using commercially available microscope slides according to ISO 8037/1 as substrates [20]. Before application, glass substrates were cleaned with acetone and immersed in the suspension for 120 s. The wet coatings were fabricated on the substrates by applying defined withdrawal speeds vw between 10 and 200 mm·min−1. Subsequently, the coated glasses were dried in ambient air for 60 min at a drying temperature Tdry of either 100, 200 or 300 °C.

2.3. Suspension Properties

The particle size of the goethite feed material was determined by laser diffraction analysis (Helos, Sympatec GmbH, Clausthal-Zellerfeld, Germany), which was performed in a cuvette system by stirring at 1000 rpm. Samples were diluted with deionized water until an optical concentration of 15–20% was reached. In contrast, the decrease in particle size during the grinding experiments was monitored by dynamic light scattering (Nanophox, Sympatec GmbH, Clausthal-Zellerfeld, Germany). For preparation, samples were diluted with a water/ethanol mixture (ϕEtOH = 0.7 and pH* of 2.5) until an appropriate measurement signal was reached. All measurements were carried out three times. Additionally, the electroacoustic spectroscopy (DT1200, Dispersion Technology Inc., Lakewood, NJ, USA) was used to determine the zeta potential of the goethite particles under varying suspension conditions. Samples consisting of an ethanol/water mixture (ϕEtOH = 0.7) containing 0.01 mol·l−1 NaCl and a solid content of goethite of wG = 0.05 were measured in an external arrangement of the electroacoustic probe under constant stirring. Before each measurement, the sample’s pH* was adjusted to a defined value between 2 and 11 with either hydrochloric acid or sodium hydroxide. Viscosity was measured with a Bohlin Gemini 2 rheometer (Malvern Instruments Ltd., Worcestershire, United Kingdom) utilizing the Searle unit. Samples were tempered to 25 °C, and measurements were taken by applying a ramp-up/ramp-down procedure of different shear rates γ· in a range of 10–1000 s−1. Moreover, the surface tension of the coating suspensions was determined by the Wilhelmy plate method using a K20 force tensiometer (KRÜSS GmbH, Hamburg, Germany). Again, a sample temperature of 25 °C was chosen.

2.4. Coating Properties

The coating thickness h of goethite on the glass substrates was analyzed by profilometry. Prior to measurements, the coatings were scratched in a defined manner along the coating direction with a brass tip possessing a width of 0.5 mm. During this procedure, it was ensured that the glass substrate was not damaged. The depth of these scratches, which directly represents the thickness of the coatings, was measured with a DektakXT profilometer (Bruker Corporation, Billerica, MA, USA) using a diamond needle with a diameter of 5 µm [21,22,23]. The measurements were carried out at five different locations along the scratches. The optical properties of the coatings were analyzed using a UV/Vis spectrometer (tec5 AG, Steinbach, Germany). Measurements were performed with wavelengths between 305 and 1080 nm. Transmission and reflection were recorded from each sample.

2.5. Additional Methods

X-ray diffraction patterns of both the untreated goethite feed material and heat-treated powders (100, 200 and 300 °C for 60 min) were recorded with an EMPYREAN diffractometer (Malvern Panalytical GmbH, Kassel, Germany). To generate X-rays, a Cu-Kα source was used, and the measurements were performed at diffraction angles of 5° ≤ 2·θ ≤ 90°. Moreover, microscopic images of the ground suspensions as well as of glass coatings were taken by scanning electron microscopy (SEM) using a Helios G4 CX instrument (FEI Company, Hillsboro, Oregon, Germany). Other than the coatings for which smaller fragments were directly placed on a sample holder, the suspensions were first diluted with deionized water and a small drop was dried on a glass sample holder for 12 h at ambient conditions. All samples were sputtered with platinum prior to the measurement.

3. Results and Discussion

3.1. Stabilization of Goethite Particles

As a small particle size is required to achieve transparency in particle-based coatings, a sufficiently high stability of the dispersions against agglomeration is a fundamental necessity. Accordingly, the colloidal fragments resulting from the milling process must be stabilized for appropriate processing. For goethite particles, a common type of electrostatic stabilization was applied, which is characteristic for oxide materials and caused by a specific adsorption or desorption of protons on the amphoteric hydroxylic groups present on the surfaces in an aqueous environment [24,25,26]. Depending on the pH, repulsive electrostatic surface potentials can be induced, resulting in colloidal stability at a sufficient level [27]. To estimate the magnitude of repulsive interactions between colloidal particles, the zeta potential provides a useful parameter that is comparatively easy to access and often used for a qualitative evaluation of the suspension’s stability [28]. The measurements showed a positive potential for goethite in an acidic environment and a negative potential under basic conditions (Figure 1a). The isoelectric point (IEP) was found to be at a pH* value of approximately 6.5. In general, the obtained zeta potential curve is in good agreement with data from the literature for purely aqueous suspensions [18,29,30], indicating that ethanol content does not significantly affect the value of the measured potentials in dependence of the pH*. As observed in Figure 1a, the highest absolute zeta potential is achieved under acidic conditions, assuming this range as favorable in terms of particle stability.
In addition, a more profound analysis was performed by calculating particle–particle pair interaction potentials (Appendix A) at different pH* conditions for a uniform, characteristic particle size of 200 nm, which are shown in Figure 1b. A potential barrier greater than 15 kBT is solely present between particle surfaces at a low pH* value. The aforementioned value is generally considered to be the threshold for adequate suspension stability [25,31]. For higher pH* values of 6.6 and 10, attractive particle interaction dominates, presumably resulting in rapid agglomeration. In accordance with these results, a pH* value of 2.5 was set for processing goethite particles in the stirred media mill. However, especially for very small particle sizes and high solids contents, certain signs of suspension instability (e.g., gelling) were observed. This limitation could be diminished by lowering the temperature of the suspension. The fundamental connection between stability and a change of temperature is caused by particle–particle and particle–medium interactions. For electrostatic stabilization, in this respect, a shift of the charge density on the particle surfaces due to a displacement of the acid/base equilibrium between the particles and the surrounding medium, a change in dielectric properties of the medium and the temperature-dependent Brownian motion of the particles are considered to be decisive [32]. As it is noticeable from Figure 1a, comparable values for the zeta potential can be measured at a pH* value of 2.5 and a lower temperature of 10 °C. This suggests that the charge density at the particle’s interface appears to be mainly independent of temperature, which could also be confirmed from titration curves (Figure S1 in Supplementary Materials). By contrast, the dielectric constant of the used water/ethanol mixture increases from 40.76 (25 °C) to 44.32 (10 °C) [33], resulting in an overall higher potential barrier between the particles for the lower temperature (Figure 1b). According to these results, grinding and coating were carried out at a suspension temperature of 10 °C.

3.2. Top-Down Formulation of Goethite

Even though they are often desired, fine particle sizes in the sub-100 nm range cannot be achieved by grinding for every solid material. The causes for this can be manifold, but the phenomenon is often explained by a physical grinding limit, by mechanical material properties changing with smaller particle sizes or by insufficient stabilization [13,19,34]. Here, in order to provide a basic assessment of the grindability, typical relationships between particle size (x50,3 and x90,3) and the specific energy input whilst milling goethite particles are presented in Figure 2.
With reference to the figure, it is evident that for an increasing specific energy input, a steady decrease in the measured particle’s size can be identified, resulting in a final x50,3 value of 50 nm and an x90,3 value of 85 nm. From a mechanical and stabilization-related point of view, this confirms that very fine particles of goethite material can be obtained by grinding with a stirred media mill. As expected, the drastic reduction in particle size is accompanied by a change in the optical properties of the suspensions (Figure 3).
In fact, it can be clearly observed on the photographs of the sample suspensions (wG = 0.5 × 10⁻³) that optical appearance varies from completely opaque and turbid to clearly transparent for lower particle sizes. This effect can be essentially attributed to the fact that the smallest particle size of 50 nm, in particular, is well below the wavelength of the visible light, which significantly reduces light scattering by the particles; thus, a higher proportion of the light passes through the sample. The presence of particles of different sizes is further demonstrated by the respective SEM images in Figure 3. Coarser particles (x50,3 = 300 nm) exhibit a certain rod-like shape and still resemble the primary particles of the aggregated feed material (cf. Figure S2 in Supplementary Materials). Therefore, it may be concluded that the first stage of grinding comprises a disaggregation, which is eventually transformed into a real grinding of the primary particles by further stressing, so that very small particle sizes (x50,3 = 50 nm) can be achieved.
Particularly for the nanometer range, grinding processes with stirred media mills are usually energy-intensive, since, in addition to the mechanical stressing of the material, a high number of stressing events are required. Therefore, it is reasonable to consider not only the assurance of a certain product quality but also that its generation takes place under energetically optimized conditions. With regard to the specific energy Em and a characteristic product property (e.g., the particle size), Kwade developed an expression that allows describing and optimizing a grinding process for a certain mill type, process unit and defined product formulation [35]. In this context, the so-called stress energy of grinding media SEGM can be used to link the effects of the major operating parameters grinding media size dGM, grinding media density ρGM and stirrer tip speed vt with experimental data [36,37].
S E S E G M = d G M 3 · ρ G M · v t 2
Typically, the relationship between Em and SEGM exhibits an optimum value (minimum of Em) at which a certain product fineness is achieved under the most advantageous grinding conditions. As for a given stress energy, there is only one correlation between the achieved particle size and the specific energy; optimal operating parameters can be derived from the aforementioned minimum [17].
For the performed grinding experiments, Figure 4a shows the specific energy as function of the stress energy for two different target particle sizes. The complete grinding curves can be viewed in Figures S3–S5 (Supplementary Materials). Taking the graphs into account, it is evident that within the range of investigated stress energies from 3 × 10⁻⁶ to 1 × 10⁻⁴ Nm, the required specific energy steadily decreases with lower stress energy. Consequently, smaller stress energies and in particular smaller grinding media sizes prove to be appropriate in terms of process optimization (cf. Equation (2)). However, typical minimum values of the specific energy cannot be identified from the curves and are presumably only reached at even lower stress energies. It should be noted that a further reduction in stress energy was not possible with the used mill, as the smallest permissible grinding media size (ranging from 200 to 300 µm) had already been applied and also lower tip speeds were not considered appropriate in terms of maintaining the characteristic bead movement in the grinding chamber.
For stress energies greater than their optimum value (SEGM/SEGM,opt > 1), according to Kwade, conclusions can be drawn regarding breakage characteristics and the comminution behavior of particle structures. To this end, the relationship between the specific energy and the stress energy is expressed by Equation (3), in which exponent α reflects the comminution behavior characteristically with respect to the material [17,38]. Thereby, α can be directly determined from the slope of the resulting straight line in a log–log scaling (Figure S6 in Supplementary Materials).
E m S E G M 1 α with α = 0 for deagglomeration / disintegration 0 < α < 1 for grinding crystalline materials
The values of the exponent α can be found in Table 1 for obtaining three different target particle sizes.
In general, an increasing grinding resistance of the material is accompanied by higher α, since the fineness of the fragments at each stress event becomes proportional to stress energy; thus, energy utilization remains constant (slope: 1 − α ≈ 0) [38]. For deagglomeration, on the other hand, the result of a single stress event is independent of the stress energy as long as the stress energy is higher than its optimal value. Hence, a linear proportionality between specific energy and stress energy follows (slope: 1 − α ≈ 1) [38]. Considering Table 1, it can be essentially observed from the overall small α-values that goethite particles exhibit a comparatively low grinding resistance. Since the α-value represents a material constant, it can be further assumed from the increasing trend with decreasing target particle size that a change of particle structure occurs within the course of milling. As mentioned earlier, the deaggregation of the starting material is most likely dominant to reach a particle size of approximately 300 nm, which is reflected by the smaller value for α, as aggregates exhibit a lower resistance compared to primary particles of similar size. Accordingly, a certain increase in α seems plausible for achieving 200 or 100 nm, respectively, because single particles are primarily stressed. Within the investigated framework, this means that the impact of the stress energy on the required specific energy declines as the target particle size decreases [38].
For the presumed optimum stress energy of 3 × 10⁻⁶ Nm (dGM = 243 µm, vt = 6 m·s−1), the influence of the solids content on the grinding efficiency was also investigated (Figure 4b). This is shown by comparing the dependence between particle size and specific energy for a wG of 0.05, 0.15 and 0.25.
Taking the figure into account, it quickly becomes evident that the specific energy requirement can be significantly reduced with higher solid content, which can be directly transferred to an increase in production capacity. This is due to the fact that individual stressing events are used more efficiently as a result of a higher stressing probability with respect to single and multiple particle stressing. Accordingly, the highest solids fraction of wG = 0.25 proves to be an advantageous process adjustment, for which 30% or 70% of the required specific energy can be saved for achieving a size of 75 nm. It should be noted that a further increase in solid content can, in turn, result in a decrease in overall process efficiency, since higher viscosities of the product suspension may result in greater specific energy consumption [13,17]. However, the investigation of such an effect and, thus, an optimal solid content was not performed within this study.
With respect to the presented results, grinding at the energetic optimum does not automatically provide the highest production capacity. In order to maximize the output, the power draw of the mill must also be taken into account. As a general recommendation, power consumption should be as high as possible when utilizing the optimal grinding media size, which can be usually ensured by applying higher stirrer tip speeds and by the corresponding adjustment of the grinding media size to keep the stress energy constant [17]. However, such an approach would be limited for the investigated material and used mill due to the requirement of smaller grinding media than the permissible size (see discussion regarding Figure 4a). In this case, the only method to further increase production capacity would be to increase the stirrer tip speed, which can be followed by an increase in grinding media wear and may cause negative effects on the product’s quality. As an example, Breitung-Faes observed a decrease in transparency through the use of higher stirrer tip speeds when nanogrinding alumina suspensions, which was attributed to an increased degree of grinding media wear [14]. Bearing this in mind, the following investigations into the production of transparent coatings were carried out with suspensions that were obtained at the energetic optimum (SEGM = 3 × 10⁻⁶ Nm), applying a grinding media size of 243 µm and a comparatively low tip speed of 6 m·s−1.

3.3. Production of Transparent Glass Coatings

The coatings were generated via wet film deposition by dip coating. In such operations, the product’s quality is essentially controlled by both formulation properties of the suspension (particle size, viscosity ηsusp, surface tension σLV and density ρsusp) and process properties (withdrawal speed vw, wet film thickness h0 and drying temperature TDry). A widely used equation to describe a dip coating process is given by the approach of Laundau and Levich (Equtaion (4), [39]), used particularly for low withdrawal speeds (≈1–10 mm·s−1) and low viscosities, which is often the case for sol–gel film deposition [9].
h 0 = 0.94 · ( η s u s p · v w ) 2 / 3 σ L V 1 / 6 · ( ρ s u s p · g ) 1 / 2
The equation presents a relationship between wet film thickness, h0, and the withdrawal speed, vw, as well as important formulation properties, thus providing a helpful tool in explaining factors influencing the film’s quality. In the following, some of these factors will be discussed in detail.

3.3.1. Solid Content and Withdrawal Speed

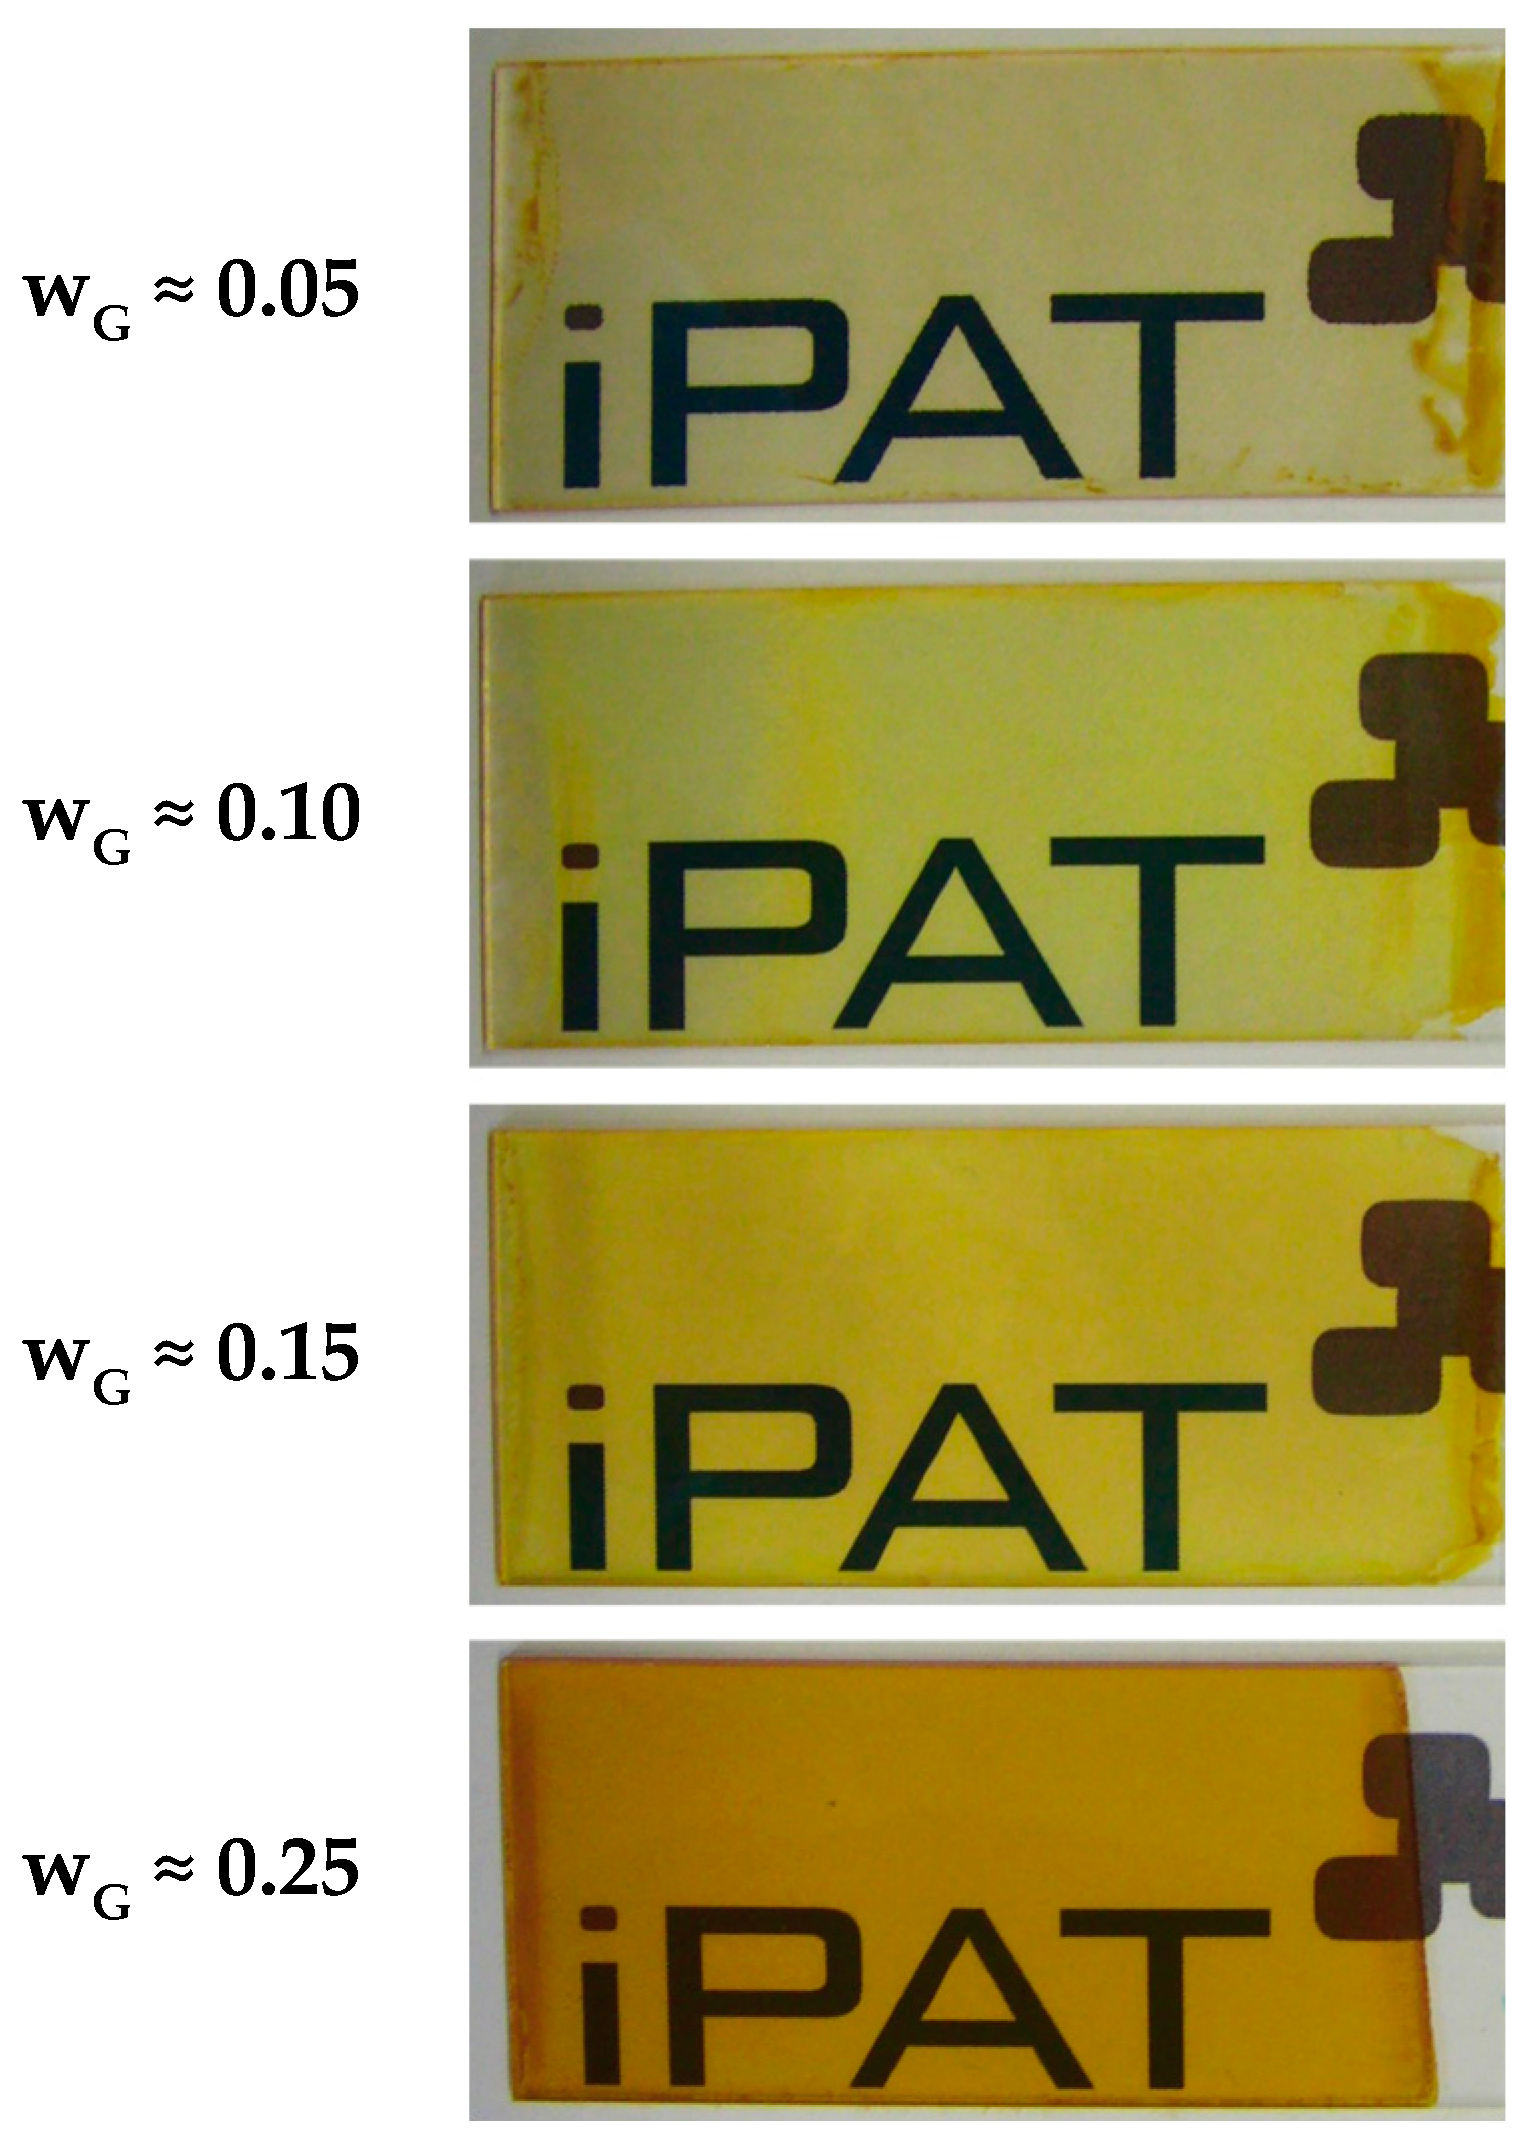
Figure 5 shows images of coatings obtained for a constant withdrawal speed of 50 mm·min−1 using a suspension with average particle size of 50 nm at pH* of 2.5 and the addition of TEOS. Within this investigation, the solid’s content wG of the coating suspensions was varied. Additional formulation parameters as well as the calculated wet film thickness h0 can be viewed in Table 2.
As expected from the observations in Section 3.2, high transparency can be observed for all samples due to the small particle size. However, the color impression appears to differ with higher mass fraction from slightly yellowish to orange, presumably indicating increasing coating thickness. With respect to Equation (4) and Table 2, this is plausible, since the viscosity of the suspension increases with increasing solid content, which tends to result in a thicker wet film h0. In addition, as more goethite particles are applied onto the glass substrate, the thickness of the dried coating also increases. Furthermore, it can be observed that the coatings appear more homogeneous when using higher wG, which also may be explained by viscosity effects. As a result of a high mobility of the fluid for low viscosities, clusters of several fluid layers are formed, especially at the edges of the glass substrate, before gelation takes place due to the onset of drying. It should be mentioned that the suspensions showed Newtonian viscosity behavior, which is the reason why no shear rate is provided for the viscosity values in Table 2.
A more practical method to specifically adjust coating thickness is to vary the withdrawal speed vw (cf. Equation (4)). Such an investigation was carried out for a coating suspension with a solid content of wG = 0.25 and a particle size of 50 nm (Figure 6). Regarding the optical appearance of coatings, the color impression changed with increasing withdrawal speeds from yellow to dark orange/brownish. As already mentioned in the discussion of Figure 5, this again indicates an increase in coating thickness. Even though optical transparency is present in all samples, it is noticeable that film flaking occurred in certain areas on the substrate when applying higher withdrawal speeds (100 and 200 mm·min−1). This represents a considerable reduction in product quality and may be attributed to excessive material deposition. Overall, it can be concluded from Figure 5 and Figure 6 that higher solids contents of the coating suspensions in combination with comparatively lower withdrawal speed prove to be advantageous for obtaining a homogenous and transparent coating.
The applied withdrawal speeds resulted in dry coating thicknesses h between 0.5 and 2.5 µm (see Table 3). In addition, wet film thicknesses, h0, were calculated according to Equation (4). Taking all withdrawal speeds into account, the average, relative decrease from wet to dry film thickness yielded 73.2 ± 7.4% (Table 3). The low deviation indicates that the coating deposition process can be adequately described by Equation (4).

3.3.2. Particle Size

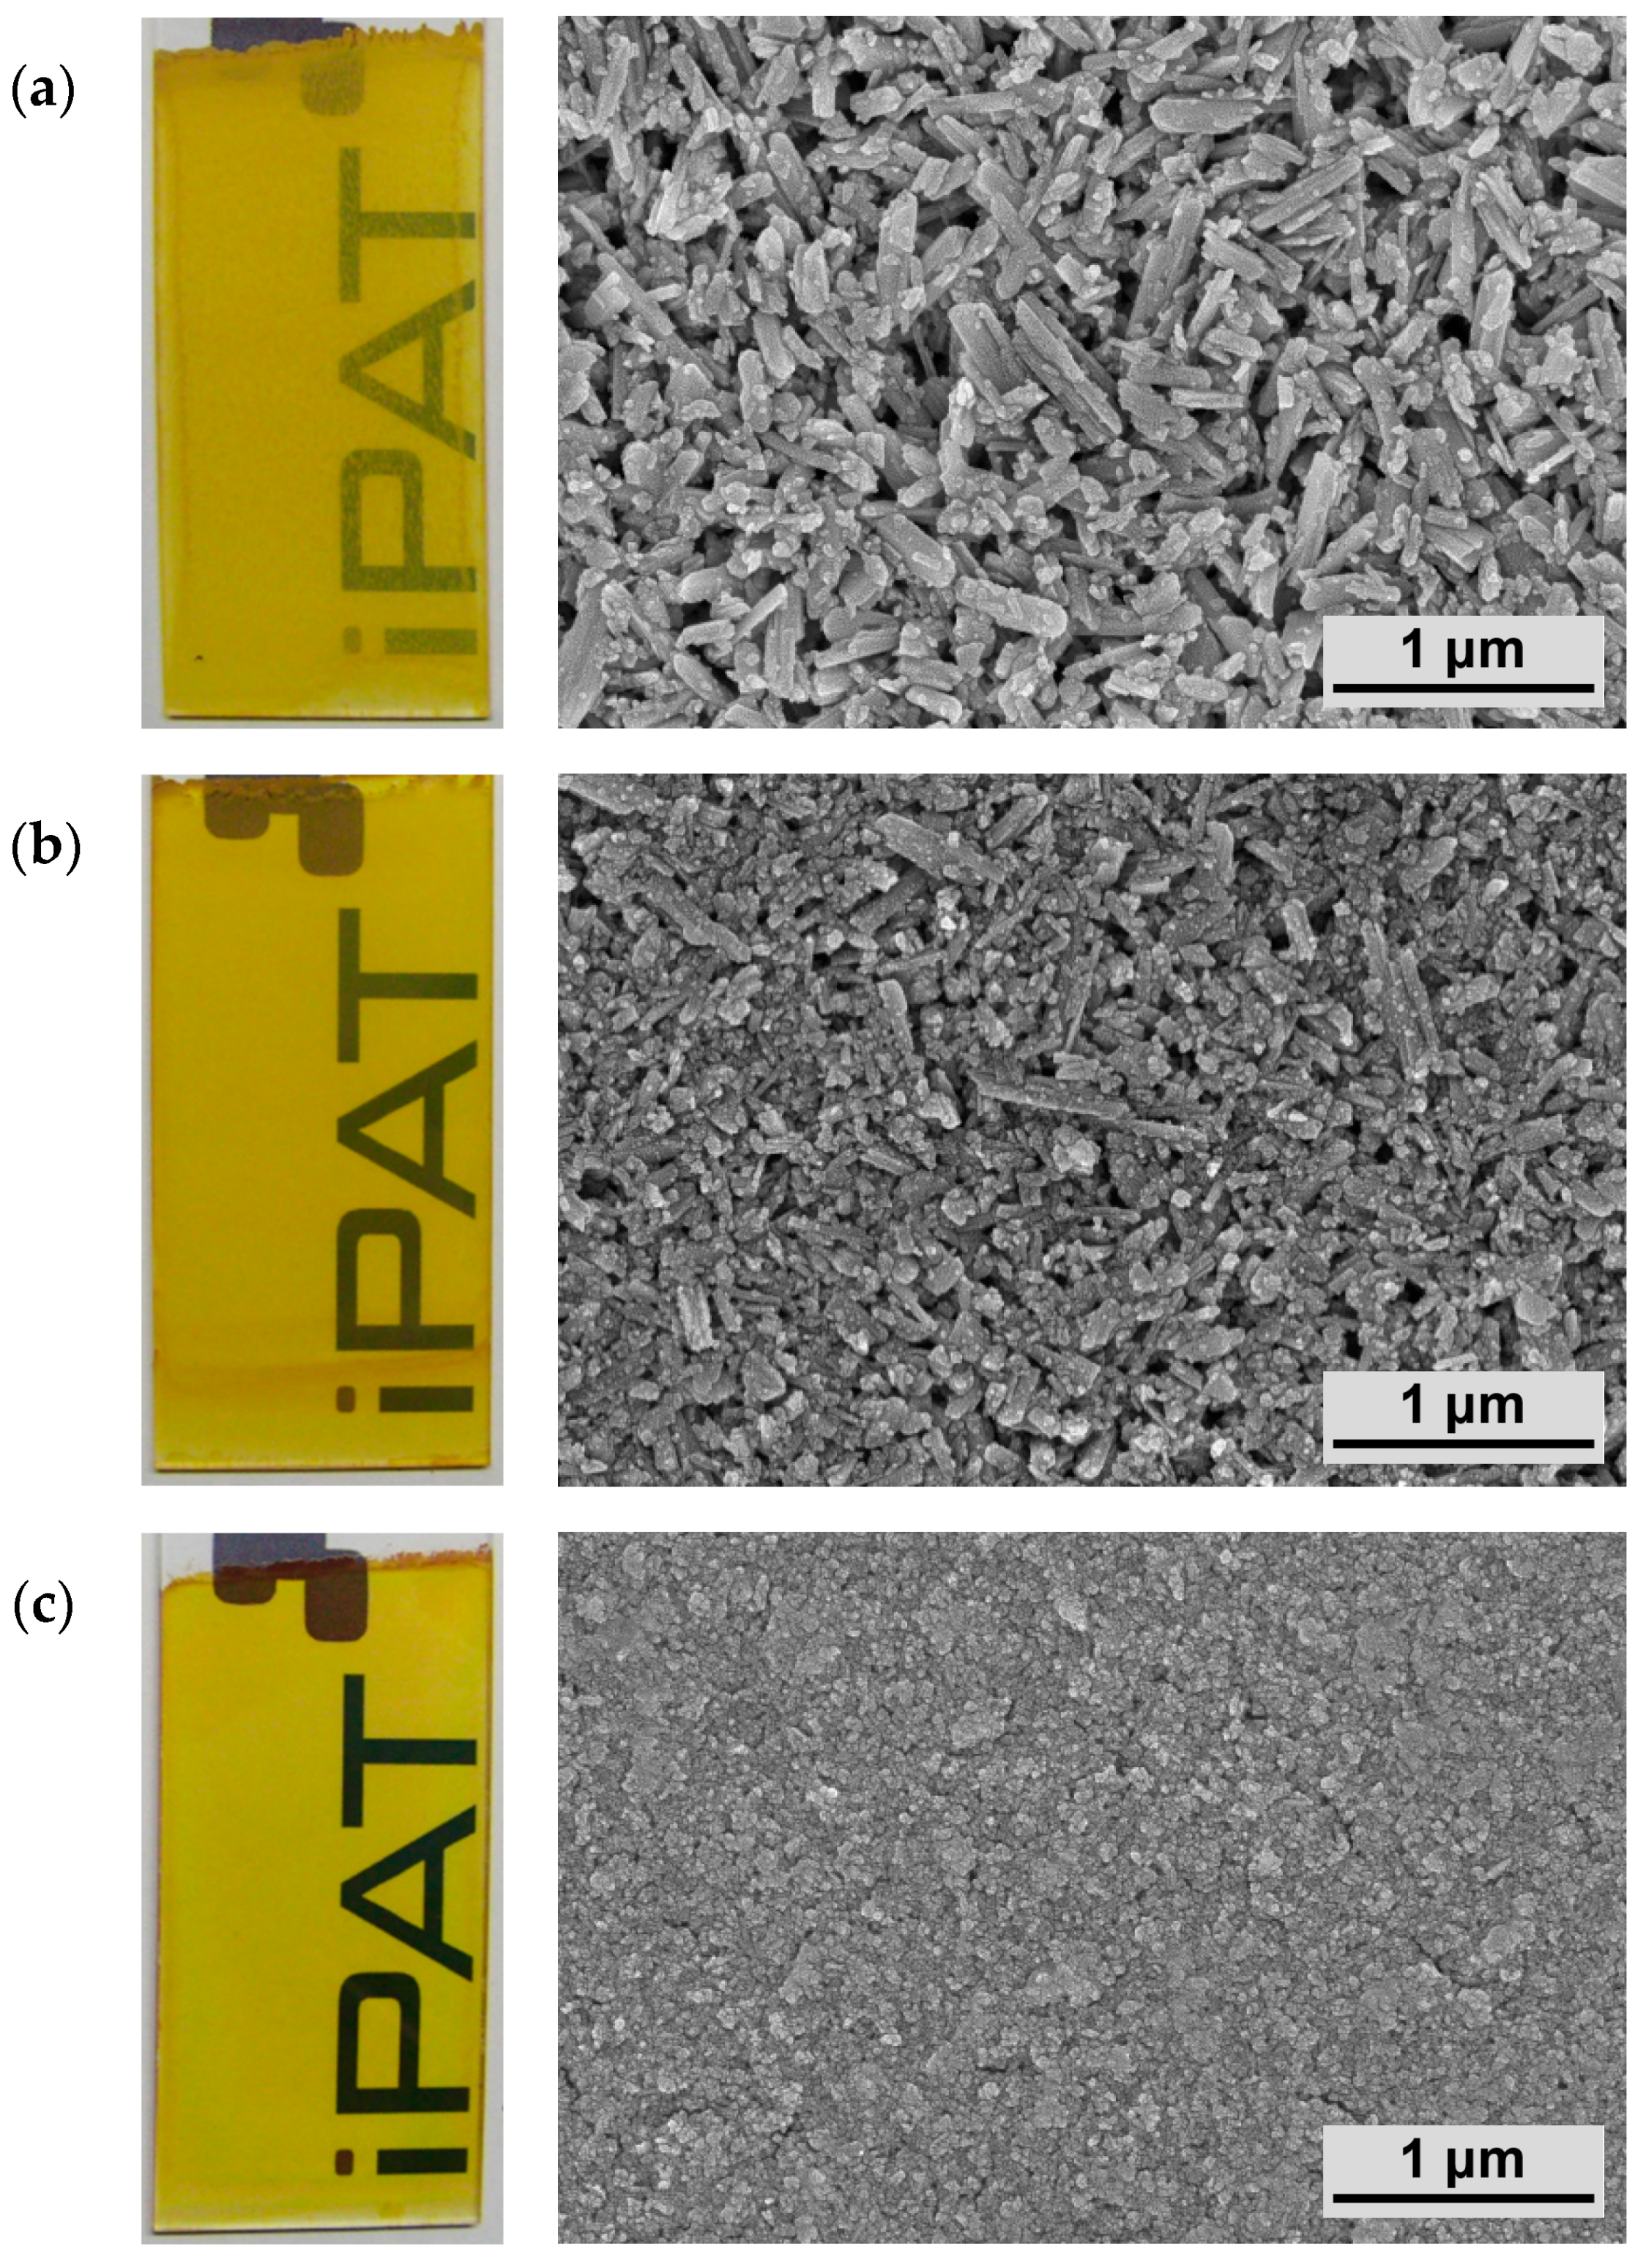
As already demonstrated above, transparency can be significantly increased by reducing particle size in a suspension. In this section, this effect is examined on quality and transparency of the resulting coatings in more detail. In order to illustrate the influence, Figure 7 shows images of coatings that were obtained by utilizing average particle sizes of approximately 300, 125 and 50 nm, respectively. Additionally, the corresponding high-resolution SEM images are presented. Suspensions with a solid content of wG = 0.25 and a withdrawal speed of vw = 10 mm·min−1 were chosen according to previous analyses.
Clearly, the addressed effect can be observed, as the turbidity of the coatings is reduced significantly with decreasing particle size, resulting in a product with high optical transparency for the smallest size of 50 nm. Furthermore, the different particle sizes can be well identified in the SEM images, showing a more densely packed structure and higher homogeneity for the finer size class.
If a translucent coating that contains small particles is subjected to electromagnetic waves, an interaction takes place, causing reflection R, transmission T, absorption A as well as scattering S of these waves. In this regard, the decisive factor for the optical impression of transparency is that the intensity of the scattered light is small due to very low particle sizes [5,6]. This requires particles to be significantly smaller than the electromagnetic wavelength of the incident light. In order to demonstrate this phenomenon on the basis of the investigated films, Figure 8 depicts the amount of light S scattered by the coated glass substrate for wavelengths between 800 nm ≤ λ ≤ 1000 nm. This range was chosen deliberately since it lies outside the visible light region (380 nm ≤ λ ≤ 780 nm) and it is, therefore, assumed that an absorption of the pigment particles can be neglected. By measuring reflection and transmission, it is thereby possible to derive the amount of scattered light S for these wavelengths according to Equation (5).
S = 1 T R
As expected, the lowest values for S of about 3% are obtained for the smallest particle size of 50 nm (Figure 8). Moreover, it can be observed that the amount of scattered light increases with decreasing wavelength, but only for coarser particle samples (e. g., 125 and 300 nm). To effectively reduce scattering effects, it is commonly proposed that a particle size should be at least 10-times smaller compared to the respective wavelength [7,8]. This is valid for the 50 nm particle size fraction, but not for median particle sizes of 125 and 300 nm. Therefore, if the wavelength-to-particle size ratio is lower for the two coarser particle fractions, scattering may occur and further increase when either smaller wavelengths or larger particles are encountered. Bearing this in mind, a higher scattering loss for lower wavelengths in Figure 8 seems plausible, since coarser particles interact more with the incident light. In contrast, such an outcome cannot be observed for the particle size of 50 nm, as it can be assumed that these structures are sufficiently small even for the lowest λ of 800 nm. However, this relationship is not quite as definite in a natural environment with wavelengths of the visible light (380 nm ≤ λ ≤ 780 nm). Especially for smaller wavelengths of around 400 nm, certain scattering effects cannot be completely excluded. Nevertheless, as shown in Figure 7, very good results could already be achieved for a particle size of 50 nm in terms of coating transparency.

3.3.3. Drying Temperature

The influence of the drying temperature TDry was investigated in order to induce a color change of the coatings. The yellow pigment goethite is known to be completely transformed into red hematite (α-Fe2O3) by a dehydration reaction in a temperature range of about 250–280 °C [40,41,42,43,44]. This step was considered in more detail, since the control of the coating color by simple adjustment of the drying temperature provides an easily achievable and highly useful process modification.
The influence of the drying temperature for coatings obtained with a suspension of 50 nm in particle size is illustrated in Figure 9. In this respect, a color change from yellow towards orange to red can be identified for the corresponding temperatures of 100, 200 and 300 °C that extends homogeneously over the entire coating (Figure 9a). The visual impression of transparency remains unaffected, which confirms that it is generally possible to adjust the coating color via TDry.
In order to support and further quantify these observations, the extinction spectra of the coated glass substrates are shown in Figure 9b for the visible light range of 350 nm ≤ λ ≤ 780 nm. Referencing Tdry = 100 °C, it can be observed from the curve that the highest extinction values are located at 380 nm ≤ λ ≤ 430 nm. According to this, the violet and blue light regions are mainly absorbed, resulting in the expected yellow color perception. If the film is dried at 200 °C, however, an additional absorption at slightly higher wavelengths within the green light range occurs that changes the color to orange. For this temperature, it can be assumed that a transformation of goethite into hematite has already begun but is incomplete. Consequently, considering an even higher drying temperature (Tdry = 300 °C), both blue and green light ranges (380 nm ≤ λ ≤ 550 nm) are almost completely absorbed. This causes the coating to appear red, suggesting that the transformation to hematite has been accomplished. As a validation of the dehydration of goethite into hematite, XRD measurements of the feed material, previously exposed to the respective temperatures, were performed. These measurements can be found in Supplementary Materials (Figure S7). Whilst thermal treatment of the goethite powder at 100 °C does not induce any change in phase composition and crystallinity of the material, after treatment at 300 °C, the goethite reflections vanished and the material has been transformed completely to hematite. Even though the conditions of dehydration are different within coatings, hence resulting in different kinetics, these results provide clear evidence of the formation of hematite leading to the observed color change. Therefore, using the drying temperature is an effective strategy to obtain transparent coatings of different colors when using goethite as the coating material.

4. Conclusions

This study presented a method that enables the production of highly transparent coatings of the yellow pigment goethite on a glass substrate. For this purpose, coating suspensions were generated by nanomilling using a stirred media mill after a suitable stabilization approach was successfully established for goethite particles. In fact, very fine particle sizes of down to 50 nm could be achieved, which already resulted in the desired property of increased transparency in the suspensions. With regard to an energetic analysis of the grinding step, low stress energies and the adjustment of higher solids contents proved to be favorable. Overall, the top-down formulation of goethite in the shown manner represents a reasonable and scalable process route for the generation of nanoparticulate suspensions, which holds great potential for achieving high production capacities.
The coatings were prepared by wet film deposition using dip coating, after which a high degree of transparency could be achieved. The comparison of different particle sizes showed that the smallest particles with a diameter of 50 nm resulted in the best optical characteristics. Such a dependence can be attributed to the fact that the scattering loss of the incoming light was effectively reduced, which could be supported by measurements of scattered light fractions. In addition, the coating process was characterized and improved with respect to coating thickness and homogeneity. The most promising results were obtained for a high solids content in the coating suspension (25 wt%) in combination with a low withdrawal speed of 10 mm·min−1, resulting in a small coating thickness on the glass substrate of approximately 500 nm. In general, it can be assumed that this process route can be transferred to a variety of other materials in the shown manner. This offers the possibility of producing transparent coatings for a wide range of applications, e.g., as conductive films for solar panels or displays as well as protective coatings. Subsequently, the possibility of inducing a color change of the coating from yellow to red was considered, based on a dehydration step as a function of the drying temperature. This mechanism relies on the conversion of goethite to hematite and was verified via UV/Vis spectroscopy as well as XRD measurements. Since the coating transparency is not affected by this chemical transformation, analyses showed promising outcomes, confirming a change of drying temperature as a useful and easily achievable process modification for goethite coatings with potential applications as optical filters or decoratives.

Supplementary Materials

The following supporting information can be downloaded at: https://www.mdpi.com/article/10.3390/coatings12030330/s1, Figure S1: Titration curves for goethite suspensions at different temperatures; Figure S2: (a) Particle size distributions of goethite feed material. (b) SEM image of goethite feed material; Figure S3: Grinding curves for different stirrer tip speeds applying a grinding media size of dGM = 530 µm; Figure S4: Grinding curves for different stirrer tip speeds applying a grinding media size of dGM = 315 µm; Figure S5: Grinding curves for different stirrer tip speeds applying a grinding media size of dGM = 243 µm; Figure S6: Log–log representation of the dependence between the specific energy and stress energy; Figure S7: X-ray powder diffraction patterns for non-treated and heat treated goethite feed material. All reflections observed for the untreated sample as well as the sample treated at 100 °C match the goethite reference pattern (ICSD No. 98-003-7156), whilst, after drying at 300 °C, all reflections except for the broad signal centered at about 15.5° 2·θ can be assigned to hematite (ICSD No. 98-001-5840). Notably, whilst most reflections are significantly broader compared to the initial material, several reflections show higher sharpness, pointing to strong anisotropy of the formed particles.

Author Contributions

Conceptualization, C.P., G.G. and S.B.-F.; methodology, C.P.; validation, A.K., G.G. and S.B.-F.; formal analysis, C.P.; investigation, C.P. and S.B.-F.; resources, K.W., A.K. and G.G.; writing—original draft preparation, C.P.; writing—review and editing, K.W., A.K., G.G. and S.B.-F.; visualization, C.P.; supervision, G.G. and S.B.-F.; project administration, K.W., G.G. and S.B.-F.; funding acquisition, K.W., G.G. and S.B.-F. All authors have read and agreed to the published version of the manuscript.

Funding

This research was funded by the “Bundesministerium für Wirtschaft und Energie (BMWi)” and the AiF Projekt GmbH within “Zentrales Innovationsprogramm Mittelstand (ZIM)” grant number ZF4375502AG6. We also acknowledge the support by the Open Access Publication Funds of the Technische Universität Braunschweig.

Institutional Review Board Statement

Not applicable.

Informed Consent Statement

Not applicable.

Data Availability Statement

Not applicable.

Acknowledgments

The authors are grateful for the funding as well as for a fruitful collaboration with Glas-Plus GmbH. Additionally, special thanks are given to Clara Sangrós Giménez and Leigh Duncan Hamilton for proofreading the manuscript.

Conflicts of Interest

The authors declare no conflict of interest.

Appendix A

Particle interaction potentials were calculated according to classical DLVO theory, taking into account the superposition of repulsive forces Vr resulting from the electrochemical double layer as well as attractive forces Va based on van der Waals interaction (Equation (A1)).
V T = V a + V r
Assuming spherical particles of equal size and a constant charge density, Vr was obtained according to Equation (A2) [27].
V r = a ν 2 · 32 · π · ε · ε 0 · ( R · T ) 2 F 2 · γ 2 · e κ · d
In this equation, γ corresponds to γ = tanh ( z / 4 ) with z = ν · F · ψ 0 / R · T . As a qualitative measure, the ζ potential was used instead of surface potential ψ 0 for the calculations. κ represents the reciprocal Debye length and was evaluated with Equation (A3).
κ = ( λ D ) 1 = ( ε · ε 0 · k B · T 2 · N A · e 2 · I ) 1
Attractive forces, Va, were derived by Equation (A4), in which A131 defines the Hamaker constant between two goethite surfaces across the liquid medium (here: water/ethanol mixture with ϕEtOH = 0.7) [45].
V a = A 131 6 · ( 2 · r 1 · r 2 ( 2 · r 1 + 2 · r 2 + d ) · d + 2 · r 1 · r 2 ( 2 · r 1 + d ) · ( 2 · r 2 + d ) + ln · ( 2 · r 1 + 2 · r 2 + d ) · d ( 2 · r 1 + d ) · ( 2 · r 2 + d ) )
In order to obtain an approximate value for A131, a combining relation consisting of Hamaker constants for goethite A11 and the liquid medium A33 was used (Equation (A5), [45]).
A 131 ( A 11 A 33 ) 2
Since the used liquid consisted of a mixture of two solvents, this must be taken into account when determining A33. As described by Vincent et al., an approach was applied, which considers the respective volume fractions of both solvents [46].
A 33 ( υ H 2 O · A H 2 O + υ E t O H · A E t O H ) 2
The Hamaker constant of goethite A11 was taken from the literature and is listed in Table A1 along with other constants.
Table A1. Hamaker constants.
AValue/JReference
A111.37 × 10−19[47]
AH2O3.7 × 10−20[45]
AEtOH4.2 × 10−20[45]
A334.05 × 10−20-
A1312.86 × 10−20-

References

  1. Mozumder, M.S.; Mourad, A.-H.I.; Pervez, H.; Surkatti, R. Recent developments in multifunctional coatings for solar panel applications: A review. Solar Energy Mater. Solar Cells 2019, 189, 75–102. [Google Scholar] [CrossRef]
  2. Zhou, L.; Yin, S.; Guo, Z.; Yang, N.; Li, J.; Zhang, M.; Zheng, Y. Multilevel nanoparticles coatings with excellent liquid repellency. Adv. Mater. Interfaces 2018, 5, 1800405. [Google Scholar] [CrossRef]
  3. Won, Y.; Schwartzenberg, K.; Gray, K.A. TiO2-based transparent coatings create self-cleaning surfaces. Chemosphere 2018, 208, 899–906. [Google Scholar] [CrossRef] [PubMed]
  4. Ray, S.C.; Karanjai, M.K.; DasGupta, D. Tin dioxide based transparent semiconducting films deposited by the dip-coating technique. Surf. Coatings Technol. 1998, 102, 73–80. [Google Scholar] [CrossRef]
  5. Althues, H.; Henle, J.; Kaskel, S. Functional inorganic nanofillers for transparent polymers. Chem. Soc. Rev. 2007, 36, 1454–1465. [Google Scholar] [CrossRef]
  6. Tsai, C.-L.; Liou, G.-S. Highly transparent and flexible polyimide/ZrO2 nanocomposite optical films with a tunable refractive index and Abbe number. Chem. Commun. 2015, 51, 13523–13526. [Google Scholar] [CrossRef]
  7. Lü, C.; Yang, B. High refractive index organic–inorganic nanocomposites: Design, synthesis and application. J. Mater. Chem. 2009, 19, 2884. [Google Scholar] [CrossRef]
  8. Xia, Y.; Zhang, C.; Wang, J.-X.; Wang, D.; Zeng, X.-F.; Chen, J.-F. Synthesis of transparent aqueous ZrO2 nanodispersion with a controllable crystalline phase without modification for a high-refractive-index nanocomposite film. Langmuir 2018, 34, 6806–6813. [Google Scholar] [CrossRef]
  9. Brinker, C.J. Dip Coating. In Chemical Solution Deposition of Functional Oxide Thin Films; Schneller, T., Waser, R., Kosec, M., Payne, D., Eds.; Springer: Vienna, Austria, 2013; pp. 233–261. ISBN 978-3-211-99310-1. [Google Scholar]
  10. Breitung-Faes, S.; Kwade, A. Nano particle production in high-power-density mills. Chem. Eng. Res. Design 2008, 86, 390–394. [Google Scholar] [CrossRef]
  11. Schilde, C.; Breitung-Faes, S.; Kampen, I.; Kwade, A. Grinding kinetics of nano-sized particles for different electrostatic stabilizing acids in a stirred media mill. Powder Technol. 2013, 235, 1008–1016. [Google Scholar] [CrossRef]
  12. Stenger, F.; Mende, S.; Schwedes, J.; Peukert, W. Nanomilling in stirred media mills. Chem. Eng. Sci. 2005, 60, 4557–4565. [Google Scholar] [CrossRef]
  13. Knieke, C.; Steinborn, C.; Romeis, S.; Peukert, W.; Breitung-Faes, S.; Kwade, A. Nanoparticle production with stirred-media mills: Opportunities and limits. Chem. Eng. Technol. 2010, 33, 1401–1411. [Google Scholar] [CrossRef]
  14. Breitung-Faes, S.; Kwade, A. Production of transparent suspensions by real grinding of fused corundum. Powder Technol. 2011, 212, 383–389. [Google Scholar] [CrossRef]
  15. Schilde, C.; Finke, J.H.; Breitung-Faes, S.; Flach, F.; Kwade, A. Production of Nanocosmetics. In Nanocosmetics; Cornier, J., Keck, C.M., van de Voorde, M., Eds.; Springer International Publishing: Cham, Switzerland, 2019; pp. 267–295. ISBN 978-3-030-16572-7. [Google Scholar]
  16. Stender, H.-H.; Kwade, A.; Schwedes, J. Stress energy distribution in different stirred media mill geometries. Int. J. Miner. Proc. 2004, 74, S103–S117. [Google Scholar] [CrossRef]
  17. Kwade, A.; Schwedes, J. (Eds.) Chapter 6 Wet Grinding in Stirred Media Mills; Elsevier: Amsterdam, The Netherlands, 2007; ISBN 9780444530806. [Google Scholar]
  18. Ding, P.; Pacek, A.W. De-agglomeration of goethite nano-particles using ultrasonic comminution device. Powder Technol. 2008, 187, 1–10. [Google Scholar] [CrossRef]
  19. Knieke, C.; Sommer, M.; Peukert, W. Identifying the apparent and true grinding limit. Powder Technol. 2009, 195, 25–30. [Google Scholar] [CrossRef]
  20. DIN ISO 8037-1:2003-05; Optik und optische Instrumente_-Mikroskope; Objektträger_-Teil_1: Maße, optische Eigenschaften und Kennzeichnung (ISO_8037-1:1986). Beuth Verlag GmbH: Berlin, Germany, 2003.
  21. Barth, N.; Schilde, C.; Kwade, A. Influence of particle size distribution on micromechanical properties of thin nanoparticulate coatings. Phys. Proc. 2013, 40, 9–18. [Google Scholar] [CrossRef] [Green Version]
  22. Barth, N.; Zimmermann, M.; Becker, A.E.; Graumann, T.; Garnweitner, G.; Kwade, A. Influence of TiO2 nanoparticle synthesis on the properties of thin coatings. Thin Solid Films 2015, 574, 20–27. [Google Scholar] [CrossRef]
  23. Hesselbach, J.; Kockmann, A.; Lüke, S.; Overbeck, A.; Garnweitner, G.; Schilde, C.; Kwade, A. Enhancement of the mechanical properties of nanoparticulate thin coatings via surface modification and cross-linking additive. Chem. Eng. Technol. 2017, 40, 1561–1568. [Google Scholar] [CrossRef]
  24. Lyklema, J. (Ed.) Solid-Liquid Interfaces; Reprint; Academic Press: London, UK, 2001; ISBN 978-0-12-460524-4. [Google Scholar]
  25. Hiemenz, P.C.; Rajagopalan, R. Principles of Colloid and Surface Chemistry; CRC Press: Boca Raton, FL, USA, 2016. [Google Scholar]
  26. Russel, W.B.; Saville, D.A.; Schowalter, W.R. Colloidal Dispersions; Cambridge University Press: Cambridge, UK, 2012; ISBN 9780521426008. [Google Scholar]
  27. Lagaly, G.; Schulz, O.; Zimehl, R. Dispersionen und Emulsionen; Springer: Berlin, Germany, 1997. [Google Scholar] [CrossRef]
  28. Hunter, R.J. Applications of the Zeta Potential. In Zeta Potential in Colloid Science; Hunter, R.J., Ed.; Elsevier: Amsterdam, The Netherlands, 1981; pp. 219–257. ISBN 978-0-12-361961-7. [Google Scholar]
  29. Fuerstenau, D.W.; Healy, T.W. Principles of Mineral Flotation; Academic Press Inc.: New York, NY, USA, 1972; pp. 91–131. [Google Scholar] [CrossRef]
  30. Xu, C.-Y.; Deng, K.-Y.; Li, J.-Y.; Xu, R.-K. Impact of environmental conditions on aggregation kinetics of hematite and goethite nanoparticles. J. Nanopart Res. 2015, 17, 244. [Google Scholar] [CrossRef]
  31. Lu, S.; Pugh, R.J.; Forssberg, K.S.E. (Eds.) Chapter 6 Coagulation, heterocoagulation and practical coagulation. In Interfacial Separation of Particles; Elsevier: Amsterdam, The Netherlands; London, UK, 2005; pp. 290–353. ISBN 9780080495453. [Google Scholar]
  32. Tarì, G.; Olhero, S.M.; Ferreira, J.M.F. Influence of temperature on stability of electrostatically stabilized alumina suspensions. J. Colloid Interface Sci. 2000, 231, 221–227. [Google Scholar] [CrossRef]
  33. Petong, P.; Pottel, R.; Kaatze, U. Water–ethanol mixtures at different compositions and temperatures. A dieletric relaxation study. J. Phys. Chem. A 2000, 104, 7420–7428. [Google Scholar] [CrossRef]
  34. Paul, J.; Romeis, S.; Mačković, M.; Marthala, V.R.R.; Herre, P.; Przybilla, T.; Hartmann, M.; Spiecker, E.; Schmidt, J.; Peukert, W. In situ cracking of silica beads in the SEM and TEM—Effect of particle size on structure–property correlations. Powder Technol. 2015, 270, 337–347. [Google Scholar] [CrossRef]
  35. Kwade, A.; Schwedes, J. Wet comminution in stirred media mills. KONA 1997, 15, 91–102. [Google Scholar] [CrossRef] [Green Version]
  36. Kwade, A. Wet comminution in stirred media mills—Research and its practical application. Powder Technol. 1999, 105, 14–20. [Google Scholar] [CrossRef]
  37. Kwade, A.; Blecher, L.; Schwedes, J. Motion and stress intensity of grinding beads in a stirred media mill. Part 2: Stress intensity and its effect on comminution. Powder Technol. 1996, 86, 69–76. [Google Scholar] [CrossRef]
  38. Kwade, A.; Schwedes, J. Breaking characteristics of different materials and their effect on stress intensity and stress number in stirred media mills. Powder Technol. 2002, 122, 109–121. [Google Scholar] [CrossRef]
  39. Landau, L.; Levich, B. Dragging of a Liquid by a Moving Plate; Elsevier: Amsterdam, The Netherlands, 1988; pp. 141–153. [Google Scholar] [CrossRef]
  40. De Faria, D.L.A.; Lopes, F.N. Heated goethite and natural hematite: Can Raman spectroscopy be used to differentiate them? Vib. Spectrosc. 2007, 45, 117–121. [Google Scholar] [CrossRef]
  41. Saito, G.; Kunisada, Y.; Nomura, T.; Sakaguchi, N.; Akiyama, T. Twin formation in hematite during dehydration of goethite. Phys. Chem. Miner. 2016, 43, 749–757. [Google Scholar] [CrossRef] [Green Version]
  42. Pomiès, M.P.; Morin, G.; Vignaud, C. XRD study of the goethite-hematite transformation: Application to the identification of heated prehistoric pigments. Eur. J. Solid State Inorg. Chem. 1998, 35, 9–25. [Google Scholar] [CrossRef]
  43. Ruan, H.D.; Frost, R.L.; Kloprogge, J.T.; Duong, L. Infrared spectroscopy of goethite dehydroxylation: III. FT-IR microscopy of in situ study of the thermal transformation of goethite to hematite. Spectrochim. Acta Part A Mol. Biomol. Spectrosc. 2002, 58, 967–981. [Google Scholar] [CrossRef]
  44. Watari, F.; van Landuyt, J.; Delavignette, P.; Amelinckx, S.; Igata, N. X-ray peak broadening as a result of twin formation in some oxides derived by dehydration. Phys. Stat. Sol. 1982, 73, 215–224. [Google Scholar] [CrossRef]
  45. Israelachvili, N.J. Intermolecular and Surface Forces; Academic Press: London, UK, 2011. [Google Scholar] [CrossRef]
  46. Vincent, B.; Király, Z.; Emmett, S.; Beaver, A. The stability of silica dispersions in ethanol/cyclohexane mixtures. Colloid Surf. 1990, 49, 121–132. [Google Scholar] [CrossRef]
  47. Golikova, E.V.; Burdina, N.M.; Vysokovskaya, N.A. Aggregation Stability of SiO2, FeOOH, ZrO2, CeO2, and natural diamond sols and their binary mixtures: 1. The photometric study of sols in KCl and BaCl2 solutions. Colloid J. 2002, 64, 135–141. [Google Scholar] [CrossRef]
Figure 1. (a) Zeta-potential curve of goethite in an ethanol/water mixture (ϕEtOH = 0.7). (b) Corresponding particle interaction potentials at different pH* values and temperatures. Measurements and calculations were conducted at a constant ionic strength of I = 0.01.
Coatings 12 00330 g001
Figure 2. Exemplary grinding experiment of goethite as grinding material.
Coatings 12 00330 g002
Figure 3. Images of diluted suspensions with different particle sizes containing a solids content of wG = 0.5 × 10⁻³ and corresponding SEM images of goethite particles.
Coatings 12 00330 g003
Figure 4. (a) Optimum curves for grinding goethite to achieve median particle sizes of 200 and 100 nm. (b) Grinding curves for different solids contents wG applying optimal process conditions.
Coatings 12 00330 g004
Figure 5. Images of coated glass substrates for different solid contents wG of the suspensions (x50,3 ≈ 50 nm; vw = 50 mm·min−1).
Coatings 12 00330 g005
Figure 6. Images of coated glass substrates for different withdrawal speeds vw (x50,3 ≈ 50 nm; wG = 0.25).
Coatings 12 00330 g006
Figure 7. Images of coated glass substrates for different particle sizes of the suspensions and corresponding SEM images of the coatings (vw = 10 mm·min−1, wG = 0.25): (a) x50,3 ≈ 300 nm; (b) x50,3 ≈ 125 nm; (c) x50,3 ≈ 50 nm.
Coatings 12 00330 g007
Figure 8. Scattered light spectra at 800 nm ≤ λ ≤ 1000 nm for coated glass substrates with different particle sizes.
Coatings 12 00330 g008
Figure 9. (a) Images of coated glass substrates for different drying temperatures Tdry (x50,3 ≈ 50 nm, wG = 0.25, vw = 10 mm·min−1). (b) Corresponding extinction spectra in the visible light.
Coatings 12 00330 g009
Table 1. Values of exponent α.
x50,3,target/nmα/-
3000.20
2000.27
1000.32
Table 2. Properties of suspensions (x50,3 ≈ 50 nm) and wet film thickness h0 (vw = 50 mm·min−1).
wG/–ηsusp/mPasσLV/mN·m−1h0/µm
0.052.74426.12.99
0.103.05226.22.98
0.153.65826.43.16
0.255.45326.773.74
Table 3. Coating thickness in dependence of the withdrawal speed (x50,3 ≈ 50 nm, wG = 0.25).
vw/mm·min−1h/µmh0/µm(1 − h/h0)·100/%
100.476 ± 0.0021.27862.8
500.745 ± 0.0033.73680.0
1001.440 ± 0.00155.93075.7
2002.437 ± 0.019.41374.1
Publisher’s Note: MDPI stays neutral with regard to jurisdictional claims in published maps and institutional affiliations.

