Article

Effect of Pre-Set Coating Thickness on the Quality of Electron Beam Cladding Forming of Aluminum Alloys

School of Electrical and Mechanical, Guilin University of Electronic Technology, Guilin 541004, China
*
Author to whom correspondence should be addressed.
Coatings 2022, 12(3), 350; https://doi.org/10.3390/coatings12030350
Submission received: 1 January 2022 / Revised: 4 February 2022 / Accepted: 1 March 2022 / Published: 7 March 2022

Abstract

:
Numerical simulations combined with electron beam melting were adopted to study the effect of the thickness of the preset coating on the quality of electron beam melting and forming of aluminum alloys. The research was carried out using ANSYS19.0 finite element analysis software to perform the numerical simulation of the temperature field and stress field during the process of electron beam melting of the Ni60 coating on 6061 aluminum alloy. The results show that the thicker the preset coating, the higher the surface temperature and the greater the melting depth and width of the melt pool, but the smaller the substrate melting depth, and the highest surface temperature obtained was 2536.05 °C. When the coating thickness reached 1.5 mm, the substrate essentially showed no change; otherwise, the thicker the preset coating, the greater the residual stress, and the maximum residual stress on the coating surface along the scanning direction appeared at the position near the boundary. Moreover, the maximum residual stress along the depth direction occurred at the interface. The electron beam cladding experiments showed that the 0.5 mm thickness of the coating resulted in a cracking phenomenon at the interface with the substrate, and the surface of the molten layer had more defects such as pores and pits; the 1 mm thickness of the coating had a good metallurgical bond with the substrate, and the surface of the molten layer was dense and flat; the 1.5 mm thickness of the aluminum alloy substrate did not melt, and the surface of the molten layer had more cracks. The numerical simulation was essentially consistent with the electron beam cladding experiment, and the forming quality was better when the preset coating thickness was 1 mm.

1. Introduction

Aluminum alloys are the premium material for aerospace and automotive manufacturing due to their low density and high strength ratio. However, the melting point, hardness and corrosion resistance of aluminum alloys are low compared to many alloy materials, which limits their application in industry [1]. At present, there is a large amount of research on the surface modification of aluminum alloys at home and abroad [2,3,4,5,6], such as chemical conversion film, electroplating, micro-arc oxidation, laser melting and electron beam melting, etc. However, compared with these, electron beam melting technology results in a thicker melting layer. In addition, electron beam processing has a high energy utilization rate (more than 90% of electrical energy is converted into heat) and large energy penetration depth, and the production is carried out in a pollution-free vacuum chamber environment, so the process is efficient, energy-saving and environmentally friendly [7]; its technical schematic is shown in Figure 1.
Electron beam cladding technology is mainly applied to improve the surface properties of the alloy substrate [8]. However, electron beam cladding is a fairly rapid heating and rapid cooling process, which will inevitably cause uneven temperature field distribution. The low melting point of aluminum alloy, which largely improves its surface properties during electron beam melting, means that the cladding layer material cannot have a high boiling point, and the two materials, with very different thermal physical parameters, make the electron beam melting process more difficult. Numerical simulation is required to regulate the whole melting process. To date, many researchers at home and abroad have simulated the electron beam cladding process of aluminum alloys. Most of them study the distribution of the temperature field under different process parameters and the magnitude of residual stress during solidification under different process parameters to reveal the causes of cracks and porosity defects during the actual processing [9,10]. The thickness of the preset coating in the melting process determines the energy that can be obtained per unit volume of powder, which has a great influence on the heat and mass transfer. The thickness of the preset coating has a large effect on the thermal stress, and an appropriate coating thickness can prevent the occurrence of cracks, so it is necessary to simulate the effect of the thickness of the molten layer on the thermomechanical properties by the finite element method. Therefore, we simulate the temperature and stress fields of Ni60 alloy powder coated by an electron beam of aluminum alloy to verify the effect of the preset coating thickness on the quality of molten clad forming; namely, a proper coating thickness can improve the forming quality of the molten clad layer, reduce the generation of cracks and increase the bonding strength of the molten clad layer.

2. Temperature Field Finite Element Simulation

2.1. Heat Transfer Equation System

The electron beam melting process is a nonlinear transient heat transfer process, and the heat transfer within it is generally characterized using the Fourier equation [11]:
q * = λ T n
where q* is heat flux density (W/m2); λ is the thermal conductivity coefficient (W/m·°C); T and N are the temperature gradients along this direction, and the positive sign represents the direction of heat flow to increase temperature.
We first set initial and boundary conditions. Since the heat transfer process did not start before electron beam melting, the initial temperature was T0 (25 °C at room temperature), which is given in expression (2). The electron beam melting experiments were performed under vacuum conditions and the boundary conditions did not take into account the effect of thermal convection. The thermal radiation during the melting process can be represented by the Stefan Boltzmann equation [12], whose expression is given in Equation (3).
T ( x , y , z , t ) | t = 0   = T 0
q = ε σ A 1 F 12 ( T 1 4 T 2 4 )
where q is the heat flow rate, ε   is the heat absorption rate (blackness),   σ is the Stephen Boltzmann constant, A 1 is the area of radiating surface 1, F 12 is the shape factor from radiating surface 1 to radiating surface 2, T 1 is the absolute temperature of radiating surface 1, and T 2 is the absolute temperature of radiating surface 2.
Numerous studies have shown that the Gaussian heat source model is more in line with the actual situation of electron beam melting. Gaussian model heat flow density [13] is shown in Equation (4).
Q ( r ) = 3 η U I π R 2 exp ( 3 r 2 R 2 )
where R is the electron beam scanning radius (mm); r is the distance from the electron beam scanning center (mm); U denotes the thermal efficiency, usually taken as η = 95 % [14]; U denotes the electron beam acceleration voltage (kV); I denotes the electron beam current (mA).

2.2. Thermal and Physical Parameters of the Material

This paper investigates the electron beam cladding of Ni60 alloy powder on a 6061 aluminum alloy substrate. The hot material parameters commonly used in temperature field simulation are density ρ (Kg/m3), specific heat capacity (J/kg·°C), and thermal conductivity λ (w/m·°C), all available in the relevant literature [15,16]. Table 1 shows the thermal property parameters of the aluminum alloy, and Table 2 shows the thermal property parameters of the Ni60 alloy powder. The density of the selected material was kept constant during the simulation, where the melting point of 6061 aluminum alloy was approximately 660 °C and density was approximately 2700 kg/m3; the melting point of the Ni60 powder was approximately 1027 °C and density was approximately 7530 kg/m3.

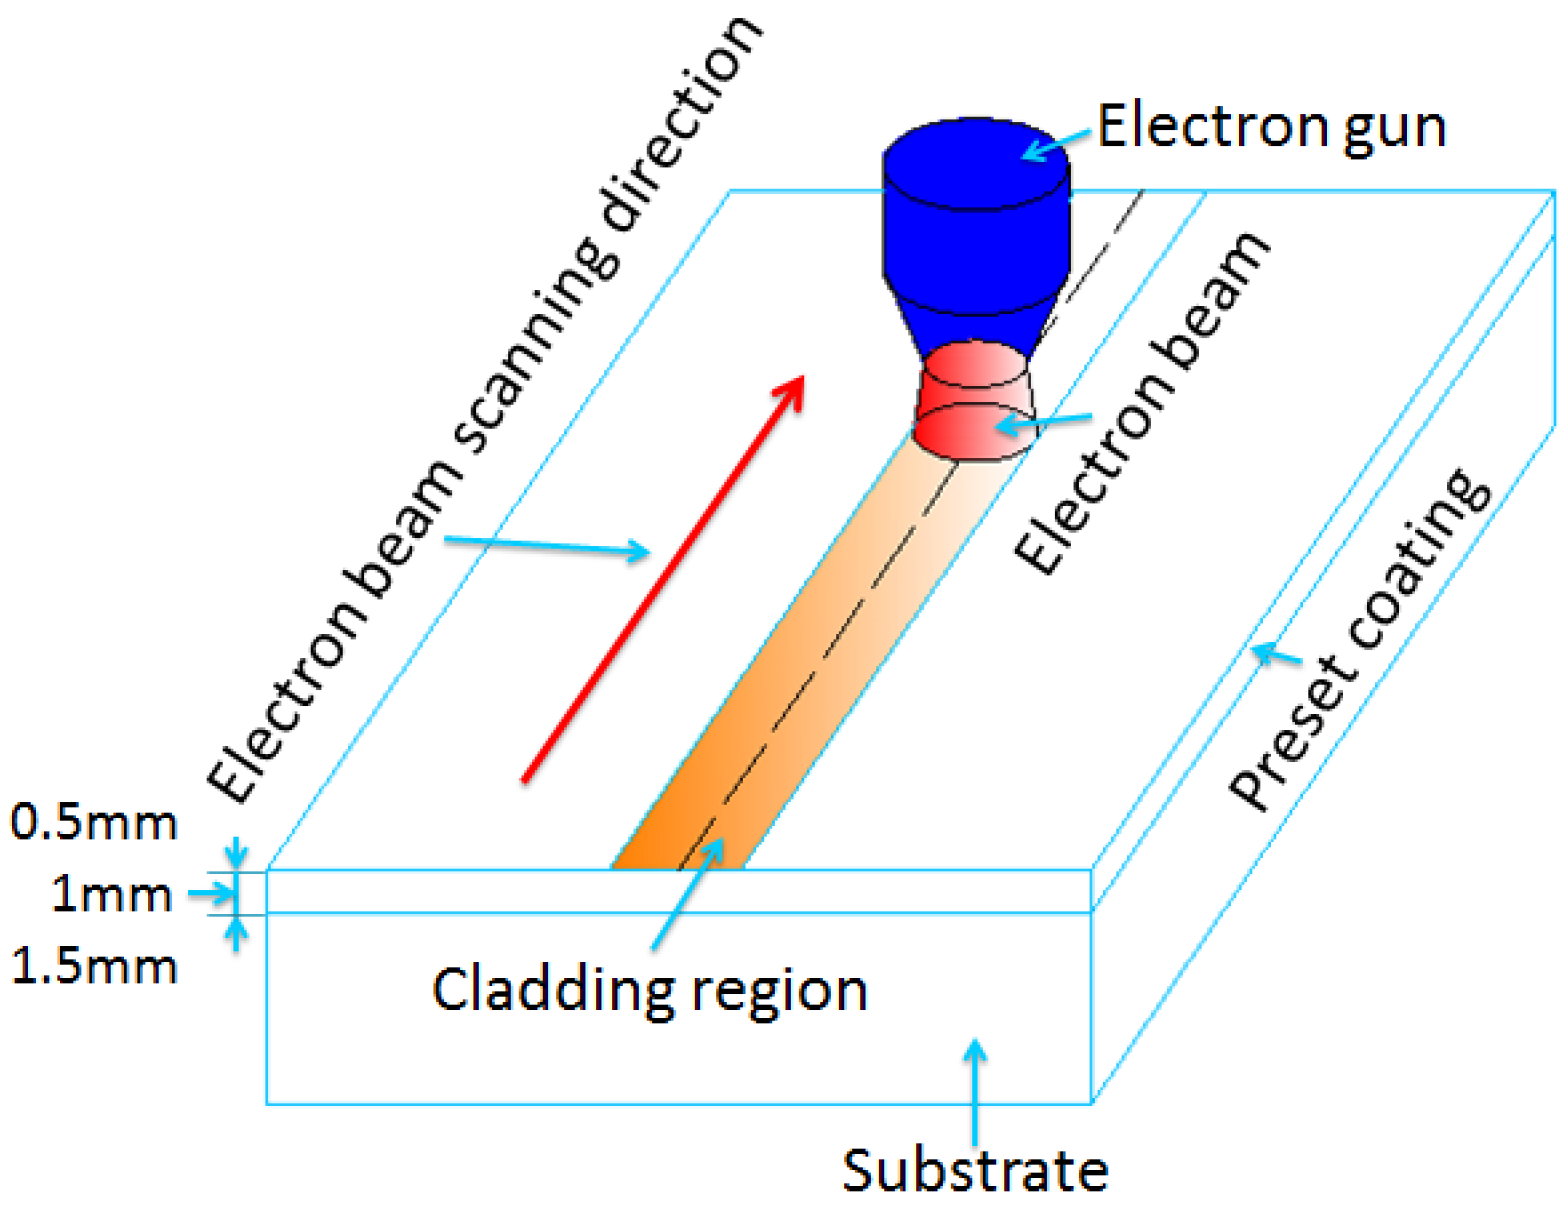
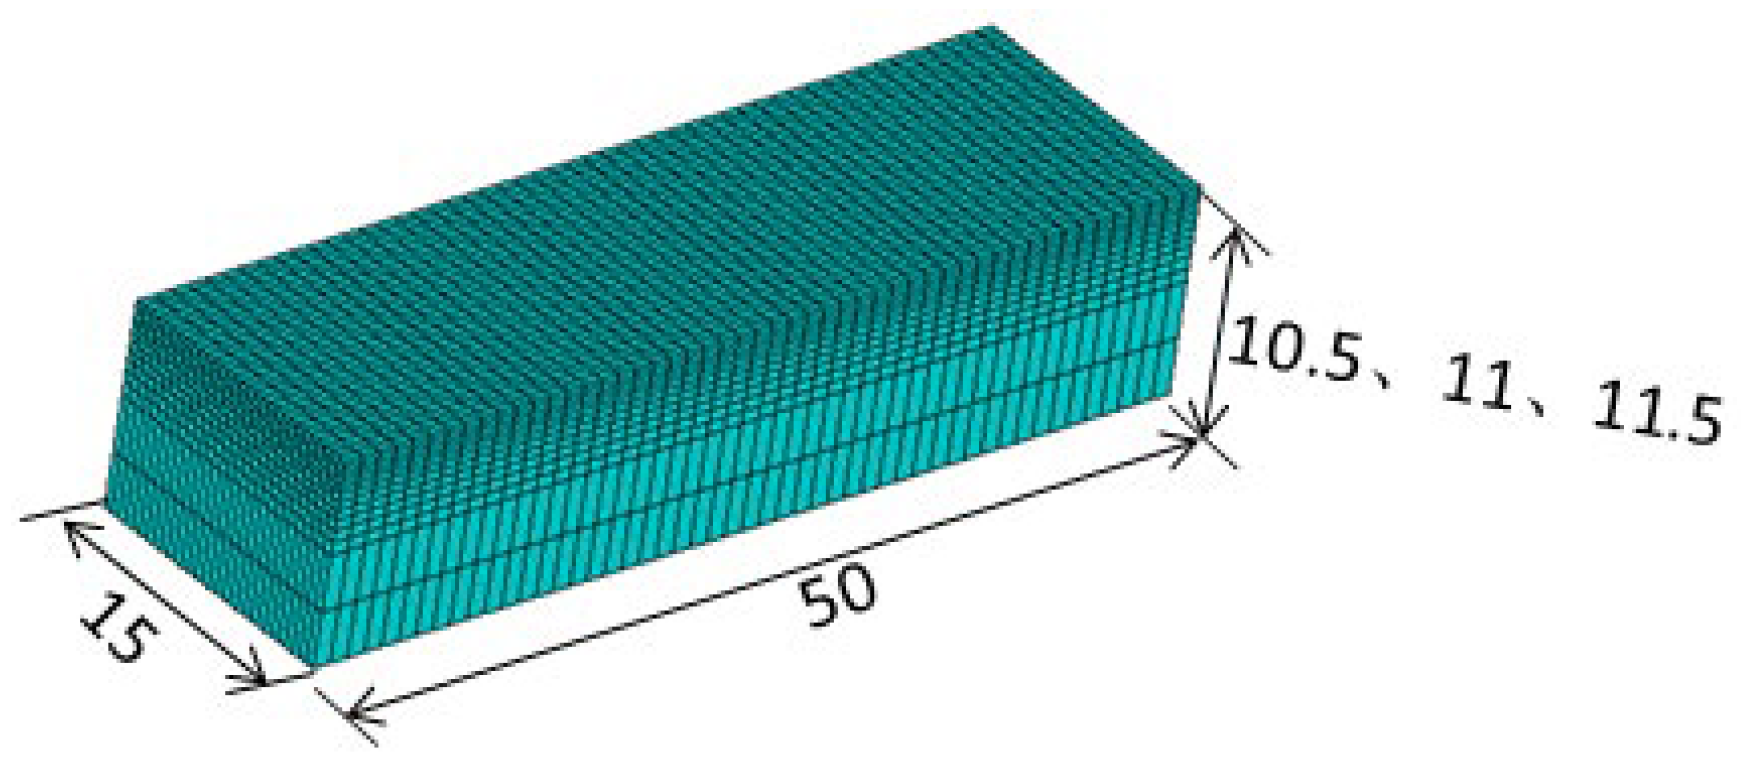
2.3. Establishment of Finite Element Model

In this study, numerical simulations of the electron beam melting of a Ni60 alloy-modified layer on the surface of 6061 aluminum alloy were carried out using finite element software, ANSYS 19.0. A finite element model of the electron beam cladding temperature field was established using the powder preconditioning method. The electron beam cladding specimen size was 50 mm × 30 mm × 10 mm. In order to reduce the amount of calculation, half of the model was taken for analysis. The 6061 aluminum alloy matrix size was 50 mm × 15 mm × 10 mm, and the thickness of the modified layer was 0.5 mm, 1 mm and 1.5 mm, respectively. Figure 2 shows the finite element model after meshing.

2.4. Selection of Electron Beam Process Parameters

Electron beam cladding is an extremely complex process and the main process parameters are electron beam flow ( I b ), scanning speed (v), focused current ( I f ), bunch spot diameter (D), etc.
When the electron beam is heated, the temperature field of the one-dimensional transient can be expressed as [17]:
T h ( x , t ) = q 0 λ [ 4 α t π e x p ( x 2 4 α t ) x e r f c ( x 2 α t ) ] + T 0
Among them, λ   is the thermal conductivity (w/m·°C), α   is the thermal diffusivity ( m 2 / s ), and x is the distance from the coating surface (mm). When the electron beam acts on the surface of the coating material, x = 0, the surface temperature expression can be derived as follows:
T s u r f ( t ) = q 0 λ 4 α t π + T 0
We can further calculate the minimum power density at which the melting of the coating material occurs under the action of the electron beam:
q m i n = 0.886 α t · λ · T m
T m is the melting point of the material Ni60, the value of which is approximately 1027 °C. The chosen power density size must cause the nickel metal on the surface of the material to melt. Combining the above equations, the material physical parameters with temperature variation and the laboratory research results are taken into account. A range of process parameters for the electron beam melting of Ni60 were developed, as shown in Table 3.

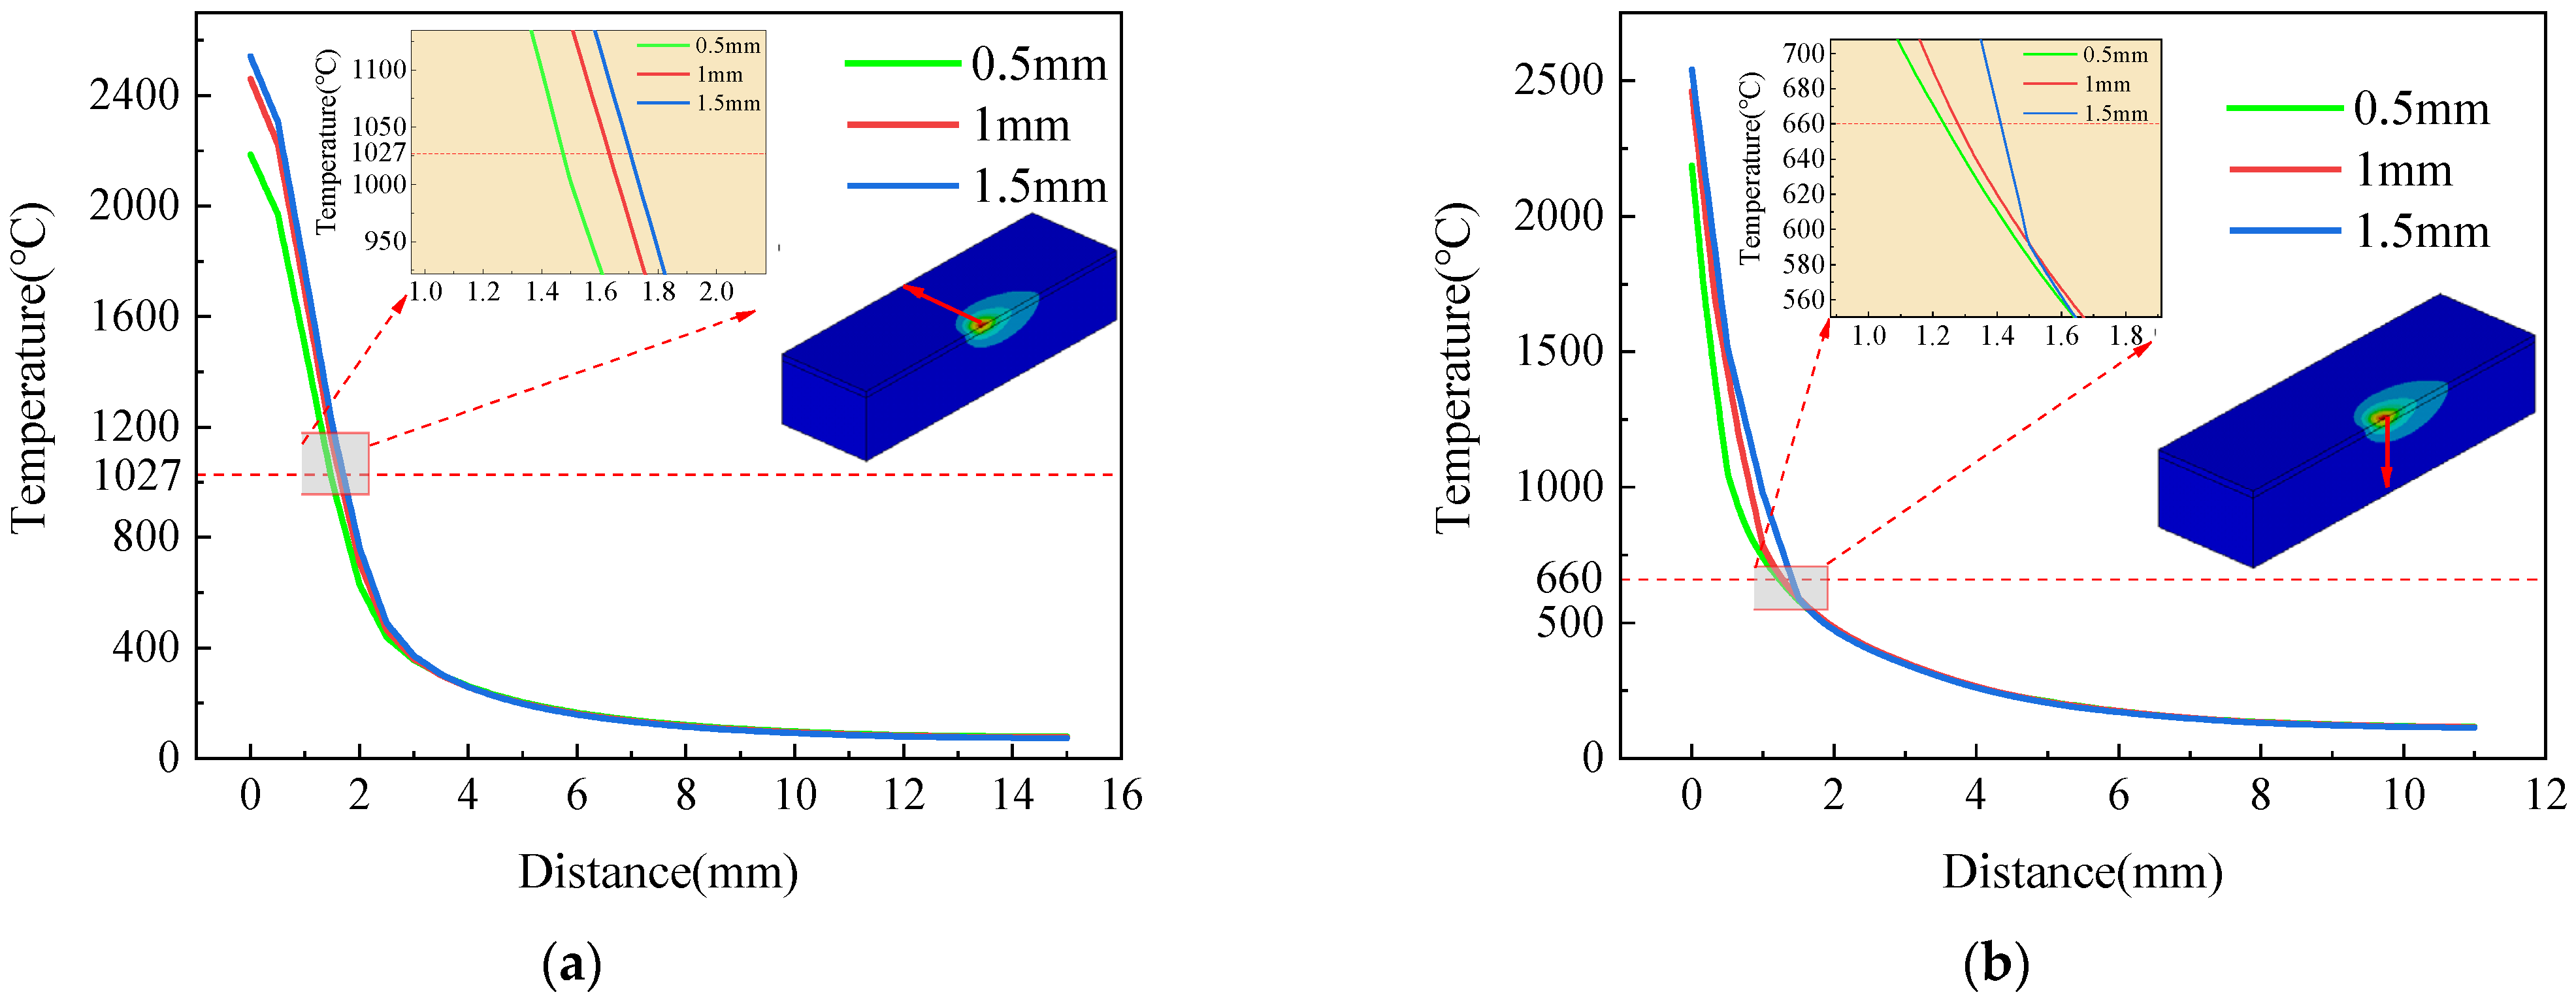
2.5. Simulation of Electron Beam Cladding Temperature Field and Analysis of Results

The electron beam melting process parameters were selected as follows: electron beam current was 25 mA, scanning speed was 8 mm/s, beam spot diameter was 4 mm and focusing current was 650 mA. On the basis of this, the material thermal property parameters, boundary conditions and heat source were all imposed on the model; according to the scanning speed and the melting length, the loading time was set as 6.1875 s, and the number of steps was set as 100 loaded in the temperature field. Figure 3a–c show the temperature field distribution at the same moment for different preset coating thicknesses. The highest temperature for different preset coating thicknesses appears at the center of the beam spot in the melting process always, and the highest temperature at this node position is 2186.63 °C when the preset coating thickness is 0.5 mm, 2458.67 °C when the preset coating thickness is 1 mm and 2458.67 °C when the preset coating thickness is 1.5 mm; the maximum temperature at this node position is 2536.05 °C. The maximum temperature at this junction increases as the thickness of the preset coating increases. The temperature field cloud of the whole melting process presents an ellipse shape with a trailing tail, which results from the time required for the cooling of the specimen melting area during the heating process of the heat source.
As shown in Figure 4, the center point A of the beam spot was selected, and the temperature field changes of the preset coating at the thicknesses of 0.5 mm, 1 mm and 1.5 mm were simulated by ANSYS APDL. It can be seen that the temperature field during the transient process presented the characteristics of rapid heating and rapid cooling; the peak temperature of the specimen surface increased with the addition of the preset coating thickness, which is due to the differences in the absorption of electron beam energy resulting from the different thicknesses of the preset coating. A thicker coating absorbs more energy, the heat gradient generated by the melt coating is larger, and the heat dissipation effect worsens, causing the increase in the temperature at the same location.
In order to produce a good metallurgical bond between the aluminum alloy and the molten cladding layer, the melting pool temperature must be controlled near the melting point of both the 6061 aluminum alloy and Ni60 coating. In addition, because the melting point of aluminum alloy is relatively low and the melting point of Ni60 is high, the absorption rate of the aluminum alloy to the electron beam is relatively low, and the beam current required for electron beam cladding is high in the electron beam cladding process, which easily causes the electron beam cladding of the aluminum alloy. The dilution rate is relatively high, which also indicates that the bonding between the molten cladding layer and the aluminum alloy base material can be considered good metallurgical bonding [18]. Figure 5a shows the temperature distribution of different preset coating thicknesses along the width direction at the moment of t = 3.125 s, with a gradual decrease in temperature on the surface of the molten layer in the direction away from the center of the heat source. The peak temperature of the preset coating thickness is 2186.63 °C for 0.5 mm, 2458.67 °C for 1 mm and 2536.05 °C for 1.5 mm. The Ni60 melting point of 1027 °C was used as a reference mark to identify the melt pool width range. The surface melt pool width is 1.475 mm when the thickness of the preset coating is 0.5 mm, 1.635 mm when the thickness is 1 mm and 1.715 mm when the thickness is 1.5 mm. Figure 5b shows the temperature distribution along the depth direction for different preset coating thicknesses at the moment of t = 3.125 s. The temperature gradually decreases along the depth direction, which is due to the material heat transfer. Moreover, the temperature gradient gradually decreases acutely as the temperature decreases. According to the formation law of solidification organization, the degree of grain refinement of the molten clad layer is determined by the temperature gradient and cooling rate together, which also determines the performance of the reinforced layer [19], so the final organization of the molten clad layer shows a gradient change law. The melting point of the aluminum alloy substrate is 660 °C; thus, it can be seen that the surface melt pool depth is 1.2356 mm and the substrate melt depth is 0.7356 mm when the thickness of the preset coating is 0.5 mm; the surface melt pool depth is 1.2757 mm and the substrate melt depth is 0.2757 mm when the thickness of the preset coating is 1 mm; the surface melt pool melt depth is 1.41 when the thickness of the preset coating is 1.5 mm. This is because, when the thickness of the preset powder increases, the energy that can be obtained per unit volume of powder under the same electron beam power is smaller and not sufficient to melt through the preset coating.

3. Numerical Simulation of Stress Field of Electron Beam Cladding
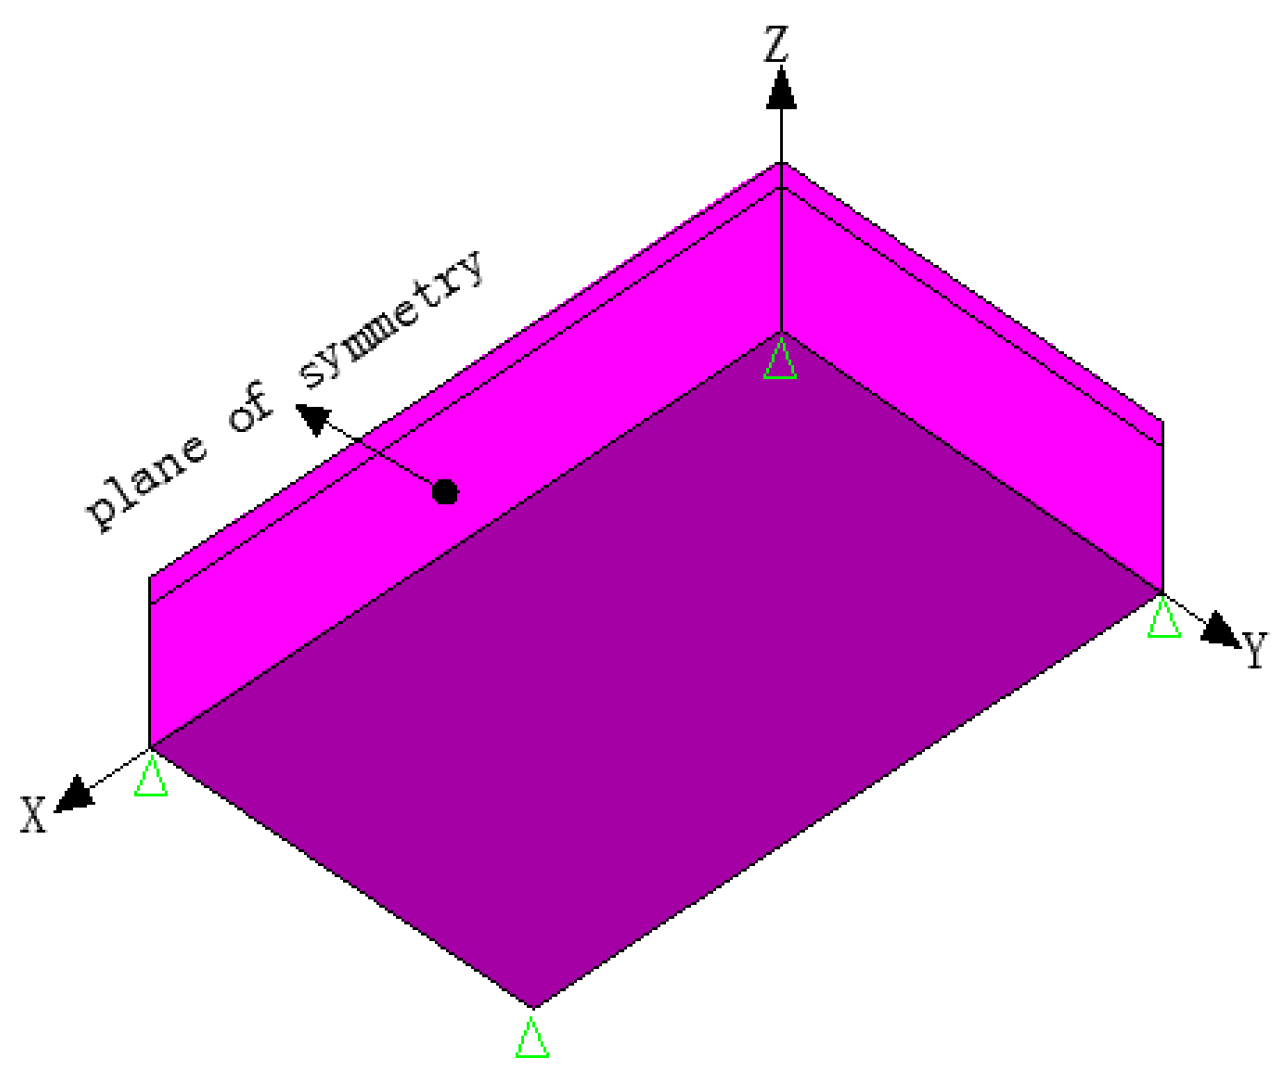
3.1. Model Building

In the finite element simulation of the electron beam cladding stress field, the results of the temperature field analysis were imposed as loads on the structural model to be solved, and this indirect thermal–force coupling method was utilized to solve the stress field. The boundary conditions when solving were mainly displacement constraints. As shown in Figure 6, the symmetry plane is constrained by SYMM and the bottom plane is constrained by UZ to mainly prevent rigid rotation in the thickness direction.
The simulation analysis of the stress field of the electron beam melting process needs to use the mechanical property parameters of the 6061 aluminum alloy base material and Ni60 coating material [16,20]. Table 4 shows the mechanical properties of the 6061 aluminum alloy, and Table 5 shows the mechanical properties of the Ni60 powder.

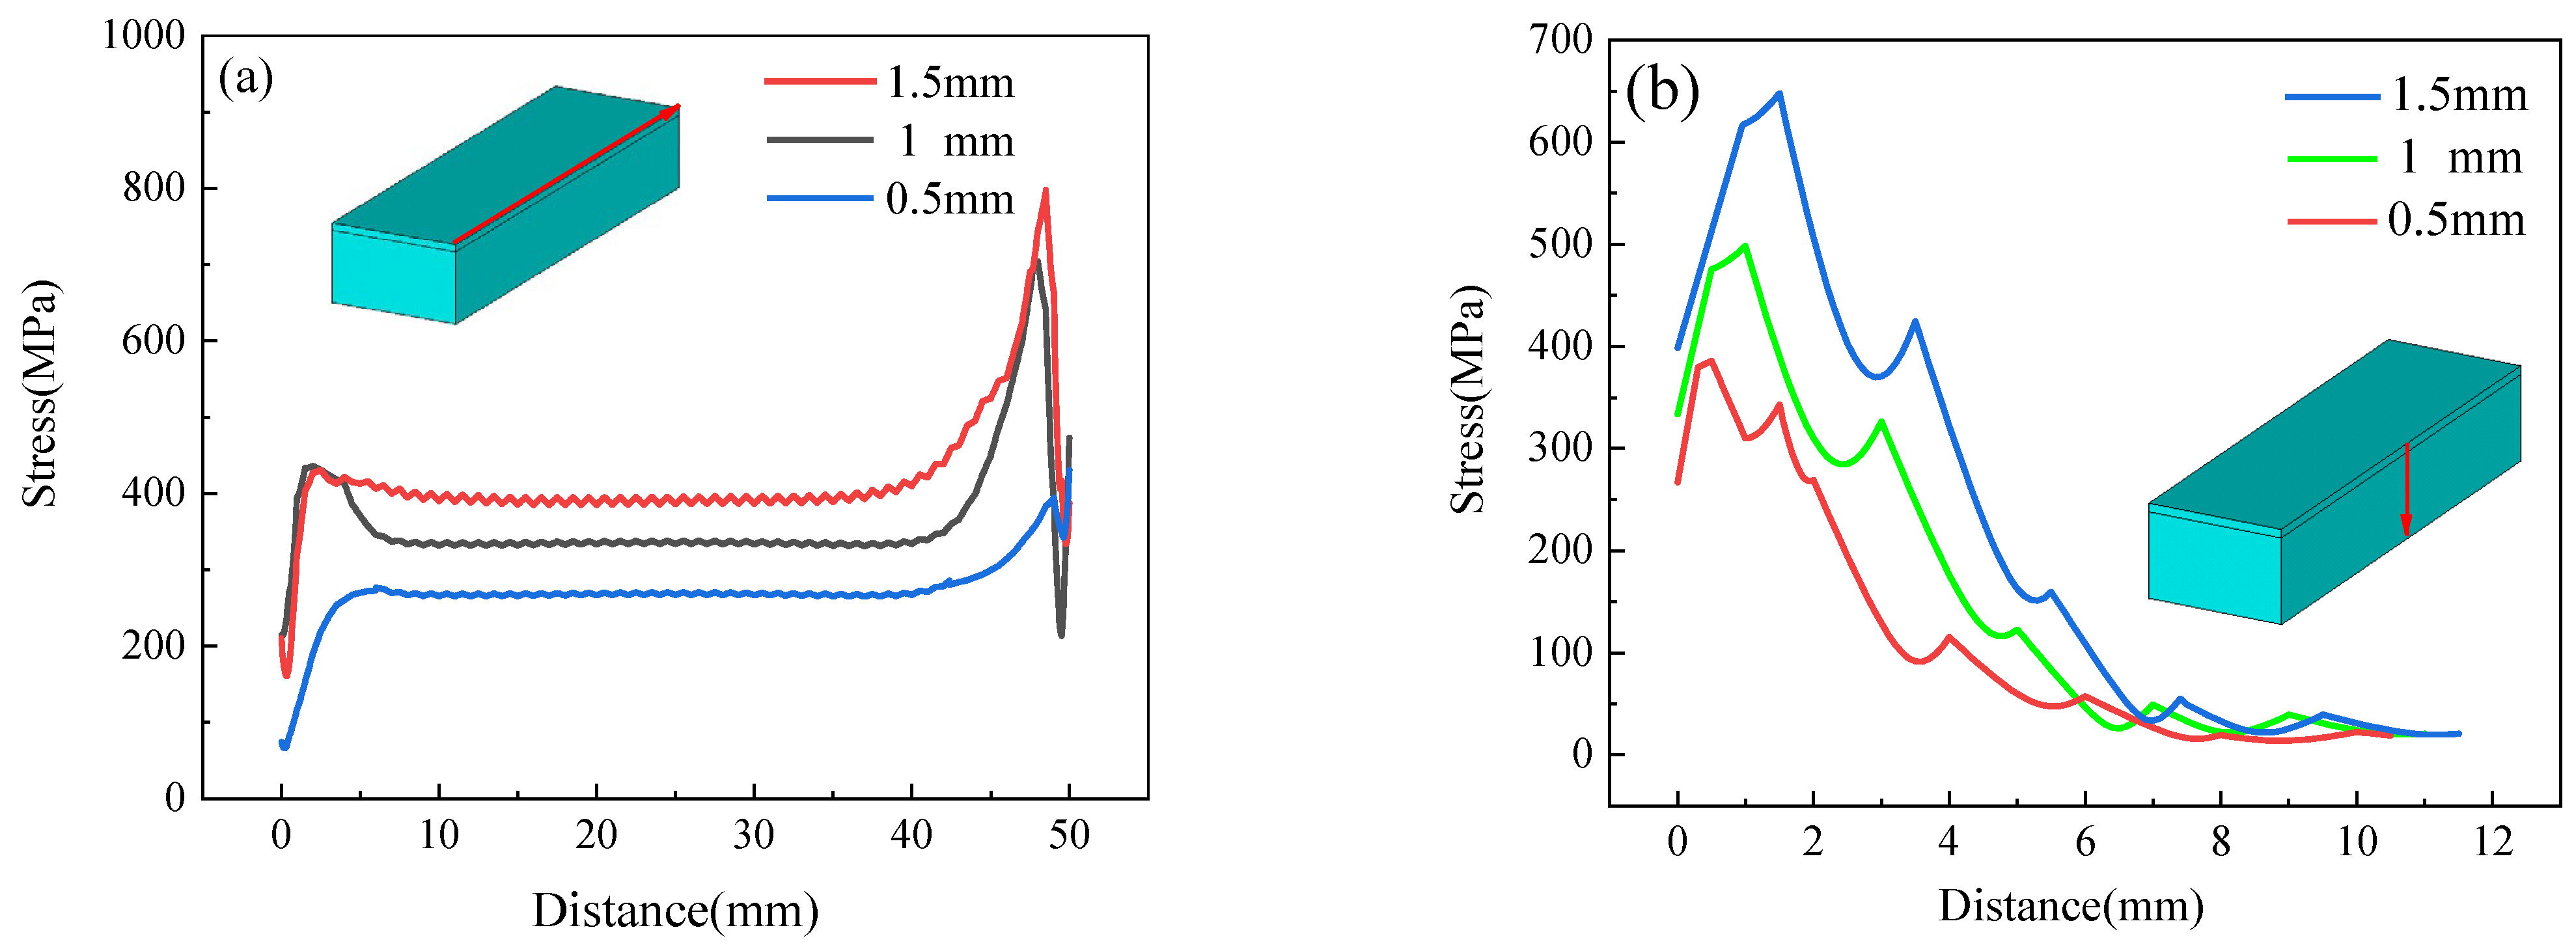
3.2. Influence of Preset Coating Thickness on Residual Stress

The temperature of the specimen was reduced to near room temperature after the cooling of the electron beam melting for 1000 s, and then its residual stress was solved. Figure 7 shows the distribution of residual stresses along different paths for different preset coating thicknesses. As shown in Figure 7a, along the direction of electron beam heat source movement, the residual stress on the coating surface shows a trend of first rising rapidly, then remaining flat, then rising again and finally decreasing. This is because the rate of coating and substrate material expansion and contraction is not synchronized during the electron beam melting process, coupled with the accumulation of heat when the melting reaches the end point and the fast cooling rate, resulting in a large temperature gradient, thus generating the highest stresses at locations near the boundary. When the thickness of the preset coating is 0.5 mm, the residual stress in the middle region is approximately 270 MPa and the maximum residual stress is 430 MPa; when the thickness of the preset coating is 1 mm, the residual stress in the middle region is approximately 340 MPa and the maximum residual stress is 705 MPa; when the thickness of the preset coating is 1.5 mm, the residual stress in the middle region is approximately 400 MPa and the maximum residual stress is 797 MPa. It can be seen that as the thickness of the preset coating increases, the heat transfer of the specimen slows down and the heat is not easily dissipated, so the residual stress increases.
As shown in Figure 7b, the residual stress along the depth direction tends to increase first and then decrease, and the residual stress reaches the maximum at the interface. This is because the thermal and mechanical property parameters of the 6061 aluminum alloy matrix and Ni60 powder are different, and the expansion and contraction of the two materials are not synchronized, resulting in larger residual stresses. With the increase in thickness, the residual stress along the depth direction also increases, and the maximum residual stress is 381 MPa when the thickness of the prepreg coating is 0.5 mm, 490 MPa when the thickness of the prepreg coating is 1 mm and 640 MPa when the thickness of the prepreg coating is 1.5 mm.

4. Experimental Verification of Electron Beam Cladding

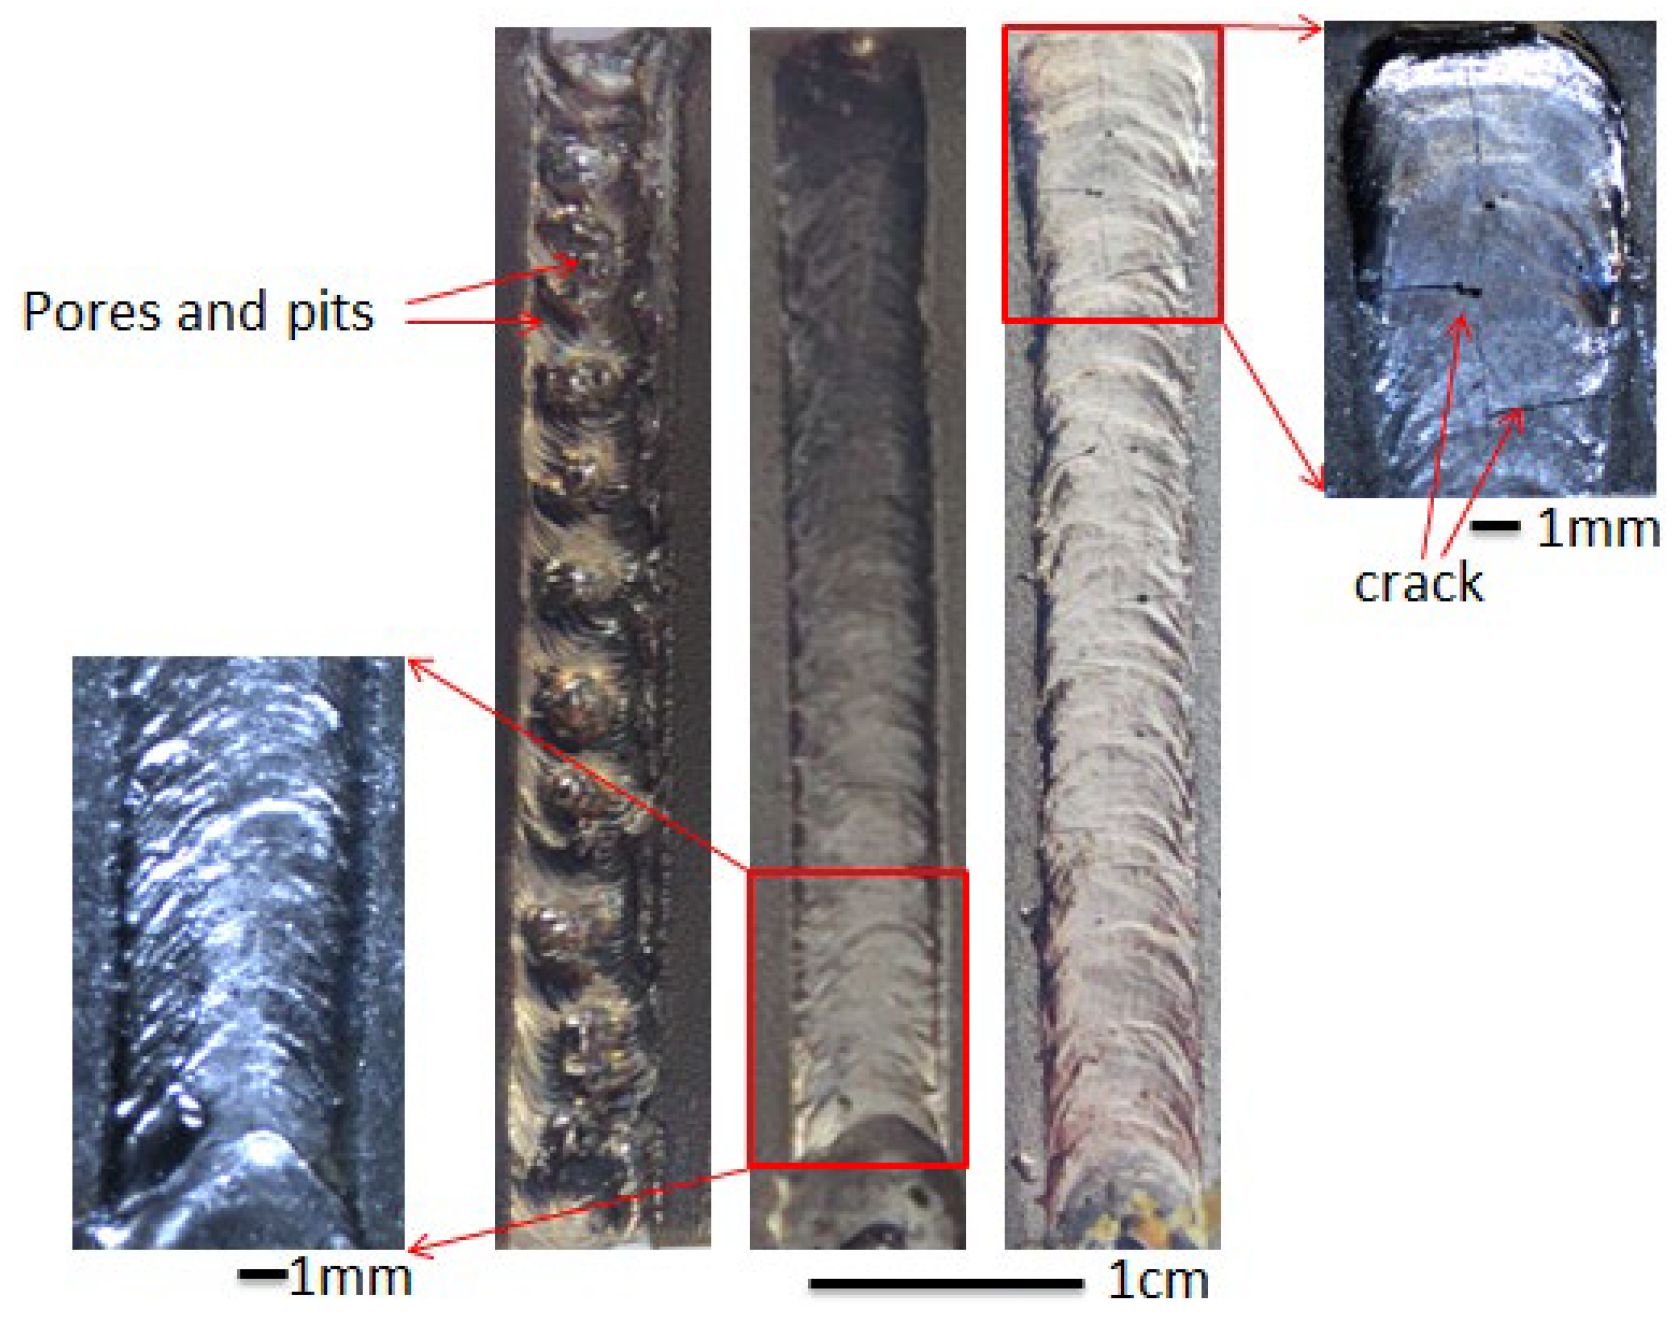
4.1. Macro Surface Morphology

The coating was preset by a thermal spraying process with a preset thickness of 0.5 mm, 1 mm and 1.5 mm. The electron beam melting experiments were carried out on the basis of the thermal effect simulation for different thicknesses of the preset coatings. There were three preset coatings of different thicknesses, as shown in Figure 8. The best melting effect was achieved for the preset coating thickness specimen of 1 mm under the same process parameters, which is because, for the specimen of 0.5 mm thickness, the coating is thinner and the melting point of the aluminum alloy is lower, so the impact resistance under the action of the high-energy electron beam is poor, and this easily leads to aluminum alloy vaporization, spattering and other phenomena. More cracks appear on the surface of the 1.5-mm-thickness specimen because the coating is thicker and the cladding layer absorbs more energy, and the thicker the cladding layer is, the worse the heat dissipation effect is. This causes excessive thermal stress in the cladding process, resulting in the emergence of cracks and collapse at the end due to excessive energy accumulation, which is consistent with the stress field simulation results shown in Figure 7a.

4.2. Section Morphology and EDS Analysis

Table 6 shows the chemical composition of the 6061 aluminum alloy, Table 7 shows the chemical composition of the Ni60 alloy powder, and Figure 9 shows the cross-sectional morphology and EDS analysis results of electron beam melting for different preset coating thicknesses. Figure 9a shows the cross-sectional morphology of the 0.5 mm preset coating thickness, and it can be seen that cracking occurs at the interface between the coating and the substrate. EDS analysis of the nearby area 1 at the interface reveals that no coating elements, such as Ni and B, are found, except for the substrate 6061 aluminum alloy elements, indicating that the substrate and coating elements do not diffuse with each other and the bond strength is not high, which is consistent with the stress field simulation results shown in Figure 7b. Figure 9b shows the cross-sectional morphology of the 1 mm preset coating thickness, and it can be seen that the fusion of the cladding layer and the substrate is good, and there are no defects, such as cracks and pores, in the bonding area. EDS analysis of the area near interface 2 shows that not only coating elements but also matrix elements such as Al, Mg, Cu and Mn appear in the fusion area, which indicates that the matrix elements and coating elements diffuse with each other during the fusion. This also shows that the matrix elements and the coating elements diffuse each other during the melting, and the melting layer and the substrate form a good metallurgical bond, which enhances their bond strength and can prevent the peeling and cracking of the coating. Figure 9c shows the cross-sectional morphology of the 1.5 mm preset coating thickness. From the melt pool morphology, it can be seen that the matrix aluminum alloy does not melt, which is essentially consistent with the temperature field simulation results in Figure 5b.
Through the cross-sectional morphology and EDS analysis mentioned above, it was found that the metallurgical bonding effect of the molten cladding layer with a preset coating thickness of 1 mm was better, which again verified the agreement with the simulation results.

5. Conclusions

(1) The simulation results of the temperature field of the cladding process show that the peak temperature of the same node on the surface of the molten layer rose with the increase in the thickness of the preset coating; the melt depth and width of the melt pool increased with the addition of the preset coating, and the melt depth of the substrate decreased with the increase in the thickness of the preset coating.
(2) The simulation results of the thermally coupled stress fields show different residual stress distributions on different paths for different preset coating thicknesses. The maximum residual stresses in the molten layer along the central axis of the scan appeared near the end edge and increased with the increase in the coating thickness. The maximum residual stresses along the depth direction appeared at the junction of the coating and the substrate and increased with increasing coating thickness in the 0–6 mm interval. It could be concluded that the thickness of the preset coating is one of the most important factors causing the variation in the residual stress.
(3) The macroscopic surface morphology of the clad layer showed that the surface of the 0.5-mm-thickness coating had more defects such as pores and pits after melting; the surface of the 1-mm-thickness coating was relatively flat after melting, and the surface of the 1.5-mm-thickness coating had more cracks after melting. Through the cross-sectional morphology and EDS analysis, it was found that the fusion effect was poor for the 0.5 mm coating thickness, and the metallurgical bonding effect was better for the 1 mm coating thickness, while the substrate did not melt with the 1.5 mm coating thickness. It could be seen that the numerical simulation and the electron beam melting experiment were in line with one another. Through the combination of numerical simulation and experiments, it was found that a 1 mm preset coating thickness results in better forming quality for the electron beam melting of a Ni60 coating on 6061 aluminum alloy.

Author Contributions

Z.Z. was responsible for experiments and data processing, and writing and revising the paper. H.L. guided the revision of the thesis and also recommended and provided funding projects. Z.P. helped to solve experimental problems and provided project and funding support. J.T. assisted in translation, formal analysis, visualization and review. Y.G. assisted in the revision of the paper. All authors have read and agreed to the published version of the manuscript.

Funding

This work was funded by the National Natural Science Foundation of China (NSFC) (No. 51965012).

Institutional Review Board Statement

Not applicable.

Informed Consent Statement

Not applicable.

Data Availability Statement

Data available in a publicly accessible repository.

Conflicts of Interest

The authors declare no conflict of interest.

References

  1. Chu, X.; Ren, X.; Hao, S.; Xu, Y. Progress State of Surface Modification Technology for Al Alloy. Hot Work. Technol. 2010, 39, 123–127. [Google Scholar]
  2. Yu, H.C.; Huang, X.Y.; Lei, F.H.; Tan, X.C.; Han, Y.Y. Preparation and electrochemical properties of Cr(III)–Ti-based coatings on 6063 Al alloy. Surf. Coat. Technol. 2013, 218, 137–141. [Google Scholar] [CrossRef]
  3. Karunakaran, M.; Vadivu, M.P. Magnetic and micro-mechanical behavior of Cu-Ni-P-W-TiO2 hybrid composite electroplating on Al alloy substrate—ScienceDirect. J. Magn. Magn. Mater. 2019, 475, 359–367. [Google Scholar] [CrossRef]
  4. Zhu, Q.; Zhang, B.; Zhao, X.; Wang, B. Binary Additives Enhance Micro Arc Oxidation Coating on 6061Al Alloy with Improved Anti-Corrosion Property. Coatings 2020, 10, 128. [Google Scholar] [CrossRef] [Green Version]
  5. Man, H.C.; Zhang, S.; Yue, T.M.; Cheng, F.T. Laser surface alloying of NiCrSiB on Al6061 aluminium alloy. Surf. Coat. Technol. 2001, 148, 136–142. [Google Scholar] [CrossRef]
  6. Wang, R.; Li, M.S.; Wei, D.Q. Microstructure and Properties of 6061 Aluminum Alloy Superficially Modified by Electron Beam Alloying with 1Cr13 Stainless Steel. Appl. Mech. Mater. 2013, 470, 48–52. [Google Scholar] [CrossRef]
  7. Zhang, F.; Wang, F.J.; Hao, J.J.; Ma, Y.J.; Ma, A.J.; Li, J.C. The application and development trend of surface modification technique induced by three beams. J. Agric. Univ. Hebei 2003, 26, 260–263+266. [Google Scholar]
  8. Durakov, V.; Gnyusov, S.; Schneider, A.; Popov, S.; Lavrinovich, V.; Batrakov, A.; Dampilon, B. Effect of substrate temperature on microstructure and properties of the CuCr25 alloys produced by electron beam cladding. In Proceedings of the International Symposium on Discharges and Electrical Insulation in Vacuum, ISDEIV, Mumbai, India, 28 September–3 October 2014; pp. 525–528. [Google Scholar]
  9. Liu, H.L.; Qi, Z.W.; Wang, B.; Zhang, G.; Wang, X.; Wang, D. Numerical simulation of temperature field during electron beam cladding for NbSi2 on the surface of Inconel617. Mater. Res. Express 2018, 5, 036528. [Google Scholar] [CrossRef]
  10. Wang, R.; Shen, G.B.; Wei, D.Q. Numerical simulation and experimental verification of temperature field for 6061 aluminum alloy surface modification by electron beam. Trans. Mater. Heat Treat. 2012, 33, 5. [Google Scholar]
  11. Jiang, Q.Y. The Temperature Field Simulation during Laser Cladding Process. Adv. Mater. Res. 2012, 450–451, 235–238. [Google Scholar] [CrossRef]
  12. Li, Y.M.; Yao, D.Z.; Fan, F.J. Numerical Simulation Study on Process Parameters Optimization of 718 Alloy induced by Laser Cladding. Appl. Laser 2018, 38, 7. [Google Scholar]
  13. Chen, B.; Pang, S.; Zhou, J.; Suo, H.; Chen, Z.; Gong, S. Numerical simulation of temperature field during scanning electron beam welding of TC4 titanium alloy. Trans. China Weld. Inst. 2013, 34, 33–37. [Google Scholar]
  14. Chen, H.; Wei, D.; Wang, R.; Shaoyuan, S. Numerical simulation of microstructure evolution on 45 steel surface during electron beam phase transformation hardening. Heat Treat. Met. 2014, 39, 130–135. [Google Scholar]
  15. Zhang, S.; Zhang, C.; Zhang, N.; Yu, L.; Liu, C.; Man, H.C. Simulation and experimental investigations of laser cladding temperature field on 6061 Al alloy. Trans. China Weld. Inst. 2007, 28, 1–4. [Google Scholar]
  16. Zheng, L.; Li, Y.; He, D.; Fu, X.; Fu, Y. Analysis on temperature field of multi-path laser claded and microstructure of coatings layer. Infrared Laser Eng. 2013, 35, 107–110. [Google Scholar]
  17. Wei, D.; Ren, X.; Wang, R. Microstructure and hardness of W alloy on 45 steel by electron beam scanning. Trans. China Weld. Inst. 2019, 40, 98–103. [Google Scholar]
  18. Cheng, J.; Sun, K.; Ma, L.F. Numerical simulation of temperature field and stress field of Fe-Al coating synthesized by laser remelting. J. Mater. Heat Treat. 2014, 35, 219–225. [Google Scholar]
  19. Huang, Y.; Wen, B.; Ming, H. Characteristics of the Temperature Field and Formation of the Microstructure for Laser Cladding Processing. Appl. Laser 2017, 37, 629–633. [Google Scholar]
  20. Li, M.; Han, B.; Cai, C.; Wang, Y.; Song, L. Numerical simulation on temperature and stress fields of laser cladded Ni-based coating. Trans. China Weld. Inst. 2015, 36, 25–28. [Google Scholar]
Figure 1. Schematic diagram of electron beam cladding.
Coatings 12 00350 g001
Figure 2. Finite element mesh model.
Coatings 12 00350 g002
Figure 3. Temperature field clouds of different thicknesses: (a) temperature field of 0.5 mm for the melting layer; (b) temperature field for a 1 mm cladding layer; (c) temperature field of 1.5 mm for the cladding layer.
Coatings 12 00350 g003
Figure 4. Temperature field variation curves for different coating thicknesses.
Coatings 12 00350 g004
Figure 5. Temperature distribution of different thicknesses along different paths: (a) temperature distribution of different thicknesses along the width direction; (b) temperature distribution of different thicknesses along the depth direction.
Coatings 12 00350 g005
Figure 6. Applying boundary conditions.
Coatings 12 00350 g006
Figure 7. Residual stress distribution on different paths for different coating thicknesses: (a) residual stress distribution on the scan centerline; (b) residual stress distribution in the depth direction.
Coatings 12 00350 g007
Figure 8. Macroscopic surface coating.
Coatings 12 00350 g008
Figure 9. Cross-sectional morphology and EDS analysis for different coating thicknesses: (a) 0.5 mm; (b) 1 mm; (c) 1.5 mm.
Coatings 12 00350 g009
Table 1. Thermal property parameters of 6061 aluminum alloy.
Temperature/°C20100200300400500600700800
λ/(J/kg·°C)113160162.8162.4168.3169.5172.5177.4179.2
c/(W/m·°C)9319621006105210911129889488941152
λ—thermal conductivity; c—specific heat.
Table 2. Thermal physical parameters of Ni60 alloy powder.
Temperature/°C20100200300400500600700800
λ/(J/kg·°C)12.712.913.113.413.714.114.515.216.0
c/(W/m·°C)410425440460470488508532558
λ—thermal conductivity; c—specific heat.
Table 3. Process parameter ranges for electron beam cladding of Ni60.
Acceleration Voltage
U/KV
Electron Beam Flow
I b / mA
Scanning Speed
mm/s
Scanning Frequency
f/Hz
Focused Current
I f = mA
Bunch Spot Diameter
D/mm
6020~306~15600400~7504~8
Table 4. Mechanical property parameters of 6061 aluminum alloy.
Temperature/°C20100200300400500600700
σ s /MPa808060484030203
E/GPa7065.459.849.438.928.518.23.8
G/GPa2726.225.122.920.718.572
α/10−6/°C22.223.824.925.826.727.628.529.4
σ s —yield strength; E—elasticity modulus; G—shear modulus; α—coefficient of thermal expansion
Table 5. Mechanical property parameters of Ni60 powder.
Temperature/°C20100200300400600100012001800
σ s /MPa40041039038035031025016090
E/GPa2212172122061941841135625
G/GPa355318305302300299268245234
α/10−6/°C11.511.611.812.212.612.913.214.015.5
σ s —yield strength; E—elasticity modulus; G—shear modulus; α—coefficient of thermal expansion.
Table 6. Chemical composition of 6061 aluminum alloy.
ElementMgSiFeCuMnZnCrTiZrAl
Wt/%0.8~1.20.4~0.80.70.2~0.40.150.250.04~0.40.150.15marginal
Table 7. Chemical composition of Ni60 alloy powder.
ElementCSiFeB CrNi
Wt/%0.84.0123.51564.7
Publisher’s Note: MDPI stays neutral with regard to jurisdictional claims in published maps and institutional affiliations.

