Article

Large Two-Magnon Raman Hysteresis Observed in a Magnetically Uncompensated Hematite Coating across the Morin Transition

by
Jesús López-Sánchez
1,2,*,
Adolfo del Campo
3,
Sara Román-Sánchez
3,
Óscar Rodríguez de la Fuente
4,5,
Noemí Carmona
4,5 and
Aída Serrano
3,*
1
Spanish CRG BM25 Beamline-SpLine, European Synchrotron Radiation Facility (ESRF), 38000 Grenoble, France
2
Instituto de Ciencia de Materiales de Madrid (ICMM), Consejo Superior de Investigaciones Científicas (CSIC), 28049 Madrid, Spain
3
Instituto de Cerámica y Vidrio (ICV), Consejo Superior de Investigaciones Científicas (CSIC), 28049 Madrid, Spain
4
Departamento de Física de Materiales, Universidad Complutense de Madrid, 28040 Madrid, Spain
5
Instituto de Magnetismo Aplicado, Universidad Complutense de Madrid-Administrador de Infraestructuras Ferroviarias (UCM-ADIF), 28230 Las Rozas, Spain
*
Authors to whom correspondence should be addressed.
Coatings 2022, 12(4), 540; https://doi.org/10.3390/coatings12040540
Submission received: 27 March 2022 / Revised: 8 April 2022 / Accepted: 12 April 2022 / Published: 17 April 2022
(This article belongs to the Section Ceramic Coatings and Engineering Technology)

Abstract

:
A temperature-dependent Raman experiment between 80 and 600 K was performed in a nanoparticulated coating of single-phase hematite grown on a silica substrate. In that range, a thermal Raman shift hysteresis was identified in the vibrational modes that accompanies the Morin transition, observing large effects in the two-magnon Raman frequency position and in its relative intensity. Interestingly, no decrease in coercivity occurs when the hematite crosses the Morin transition below 230 K. The spin-flop processes produced in the coating leads to a strong decompensation of the surface spins, generating a ferromagnetic component over the whole temperature range studied. Such unusual effects might be promoted by a certain degree of structural disorder and the stresses produced by the nanoparticulation growth approach of the hematite coating. As a result, a high stability of the two-magnon excitation is obtained over a wide temperature range and considerable advances are made for the development of spintronic devices based on semiconductor antiferromagnetic materials.

1. Introduction

The family of iron (III) oxide is one of the most interesting metal oxides both at a laboratory and industrial level due to its wide polymorphic variety, especially at the nanoscale. There are four main known polymorphs: α-Fe2O3 (hematite), γ-Fe2O3 (maghemite), β-Fe2O3, and ε-Fe2O3. They show singular biochemical, magnetic, catalytic, and electrical properties, generating a high multidisciplinary technological versatility [1,2,3,4]. Hematite and maghemite are the two most chemically stable phases under ambient conditions and they can be found naturally [5]. In contrast, β- and ε-Fe2O3 are usually synthesized at the nanoscale because they have a high bulk energy [2]. Interestingly, it has been discovered that the ε-Fe2O3 can also be formed naturally as nanominerals [6], and microparticle form in archaeological enclaves [5,7,8]. These novel findings evidence that the use of more advanced and precise characterization techniques, along with improved fabrication methods, are required, and there is still considerable work to be undertaken in the investigation of metastable and nanostructured phases based on iron III oxides [9,10,11].
Hematite is the most abundant iron oxide found in nature and probably the most investigated [12,13,14,15,16,17]. It exhibits a high chemical stability as a function of temperature and it can exist either in nanometer or bulk dimensions [2]. The study of the predominance of hematite is one of the clues towards the synthesis of single iron oxide phases, since its occurrence establishes the threshold for containing the less thermodynamically stable phases [18,19]. Regarding its applications, apart from the historical significance of its use as a reddish pigment [20], it is an excellent anode for catalytic photodecomposition of the water molecule in a thin coating form [21] and a nanorod array [22]. In addition, hematite has several advantages related to the energy conversion as part of solar cells including a suitable gap [23], and it features a high corrosion resistance and low costs [24]. It also shows a high efficiency as a gas sensor due to the change in its electrical resistance when these compounds are deposited on its surface [25,26]. In paleomagnetism, the solid solutions between hematite and ilmenite (FeTiO3) have interesting magnetic properties depending on the substituted degree of titanium in their structure, and it is used in theoretical and experimental models to explain the remanent magnetization found in magnetic rocks [27]. Furthermore, there is an enormous field of research in electronic devices since excellent spin-transport properties across the Morin transition have been detected [28], and it is integrated in novel architectures for encoding data of multiple states [29].
The magnetic properties of hematite are rather unusual with two temperature-dependent magnetic transitions: the Morin transition at around 260 K and the Néel transition at around 950 K [2,14]. The transition temperatures are strongly dependent on the particle size, being these values assigned to nanoparticle sizes larger than 30 nm [14]. Below that threshold, the Morin transition decreases drastically or even vanishes completely [15,30]. At temperatures below the Morin transition, bulk hematite behaves as an ideal antiferromagnetic material since the spins are reoriented approximately 90° and placed in the basal plane. Between the Morin and Néel temperatures, the spins belonging to the two-interpenetrating magnetic sublattices are arranged almost antiparallel with approximately 5° tilted with respect to the other sublattice [2,14].
In this work, a thermal Raman scattering study is performed between 80 and 600 K in a single-phase nanoparticulated hematite coating to investigate the vibrational and magnetic influence when crossing the Morin transition. The sample is prepared by thermal evaporation of a metallic Fe on a silica substrate with a subsequent thermal treatment at high temperatures in an air atmosphere [31]. The resulting nanostructured hematite coating displays a certain degree of structural disorder since the mode Eu is enhanced. In this line, the spins corresponding to the surface atoms could be strongly uncompensated, showing a stable coercivity with temperature. Therefore, a perfect antiferromagnetic material is not achieved when the material goes through the Morin transition. These structural and magnetic singularities cause an enormous impact on the thermal Raman response, mainly in the two-magnon collective excitation, enabling the magnonic enhancement. The large thermal hysteresis and the high stability of the spin excitation over a wide range of temperature observed by Raman represents a major technological breakthrough in spintronics. In this line, hematite is a good semiconductor antiferromagnetic material with a spin-transport over long distances [28] and can be used as part of low-power spintronic devices [32]. In addition, the spin excitation observed in the nanoparticulated hematite coating also displays a high stability to external magnetic fields due to its high coercivity and low remanence. Therefore, the present work unveils a powerful method for the fabrication of nanoparticulated magnetically hard hematite coatings with a potential spintronic applicability below and above the Morin transition.

2. Materials and Methods

2.1. Growth of Nanoparticulated Hematite Coatings

Silica glass substrates with a thickness of 1 mm from UQG Optics (Cambridge, UK) were employed for the deposition of samples. They are composed by SiO2 99.9% and Fe2O3, Na2O, K2O, and Al2O3 in ppm concentrations. Before evaporation, the substrates were cleaned with a soap, rinsed with deionized water, and dried with dry air. Fe films were grown on cleaned silica substrates in a home-made chamber by thermal evaporation [31]. During the deposition, the pressure vacuum chamber was 10−6 torr and the deposition rate was 0.02 nm/s, controlled with a Q-microbalance, previously calibrated using X-ray reflectometry. The distance between the filament with the Fe wire (Goodfellow) and substrates was around 20 cm, resulting in Fe films with a nominal thickness of 15 nm. Finally, a thermal treatment for 4 h at 1323 K was performed in an air environment in order to obtain a nanoparticulated single-phase hematite coating.

2.2. Experimental and Characterization Techniques

Composition and crystalline structure were obtained at room temperature by X-ray diffraction (XRD, Malvern Panalytical, Malvern, UK) measurements (Cu-Kα, λ = 1.5406 Å) with a Multipurpose PANalytical X’Pert PRO MRD diffractometer in grazing incidence mode using an incident angle ω = 0.3°. In turn, the morphological aspects and structural properties of the hematite coating were studied by atomic force microscopy (AFM, Team Nanotec GmbH, Villingen-Schwenningen, Germany) with a Nanotec instrument. The topographic images were acquired in a tapping mode and they were processed using the WSxM package [33].
Raman vibrational properties were studied employing a confocal Raman microscope Witec ALPHA model 300RA (Oxford Instruments, Abingdon, UK) with a Nd:YAG green laser source of 532 nm in p-polarization. The optical resolution is ~200 nm in lateral and ~500 nm in vertical dimensions. Raman spectra were acquired in the spectral range 0–3850 cm−1 using a 600 gr/mm grating with a spectral resolution of ~0.02 cm−1. The output laser power employed was 0.7 mW, previously calibrated with a Thorlabs potentiostast. The in-situ temperature Raman study was carried out on the hematite coating from 80 to 600 K and backwards with a LNP95 heating and cooling system (Limkam) using an objective with a numerical aperture (NA) of 0.4 (estimated spot size of ~810 nm). The sample chamber was purged with an Ar flux to avoid water condensation effects. Raman data were evaluated and analyzed by the Witec Plus Software (version 2.08).
The magnetic features of the hematite were measured by a quantum design MPMS-XL instrument (Quantum Design, San Diego, CA, USA). Magnetic hysteresis loops were obtained at room temperature and 50 K under a maximum applied magnetic field of 20 kOe. Substrate effects were subtracted and the hysteresis loops were normalized to the maximum magnetization. Zero field cooling (ZFC) and field cooling (FC) curves were collected from 5 to 300 K at 200 Oe with a cooling applied magnetic field of 20 kOe.

3. Results

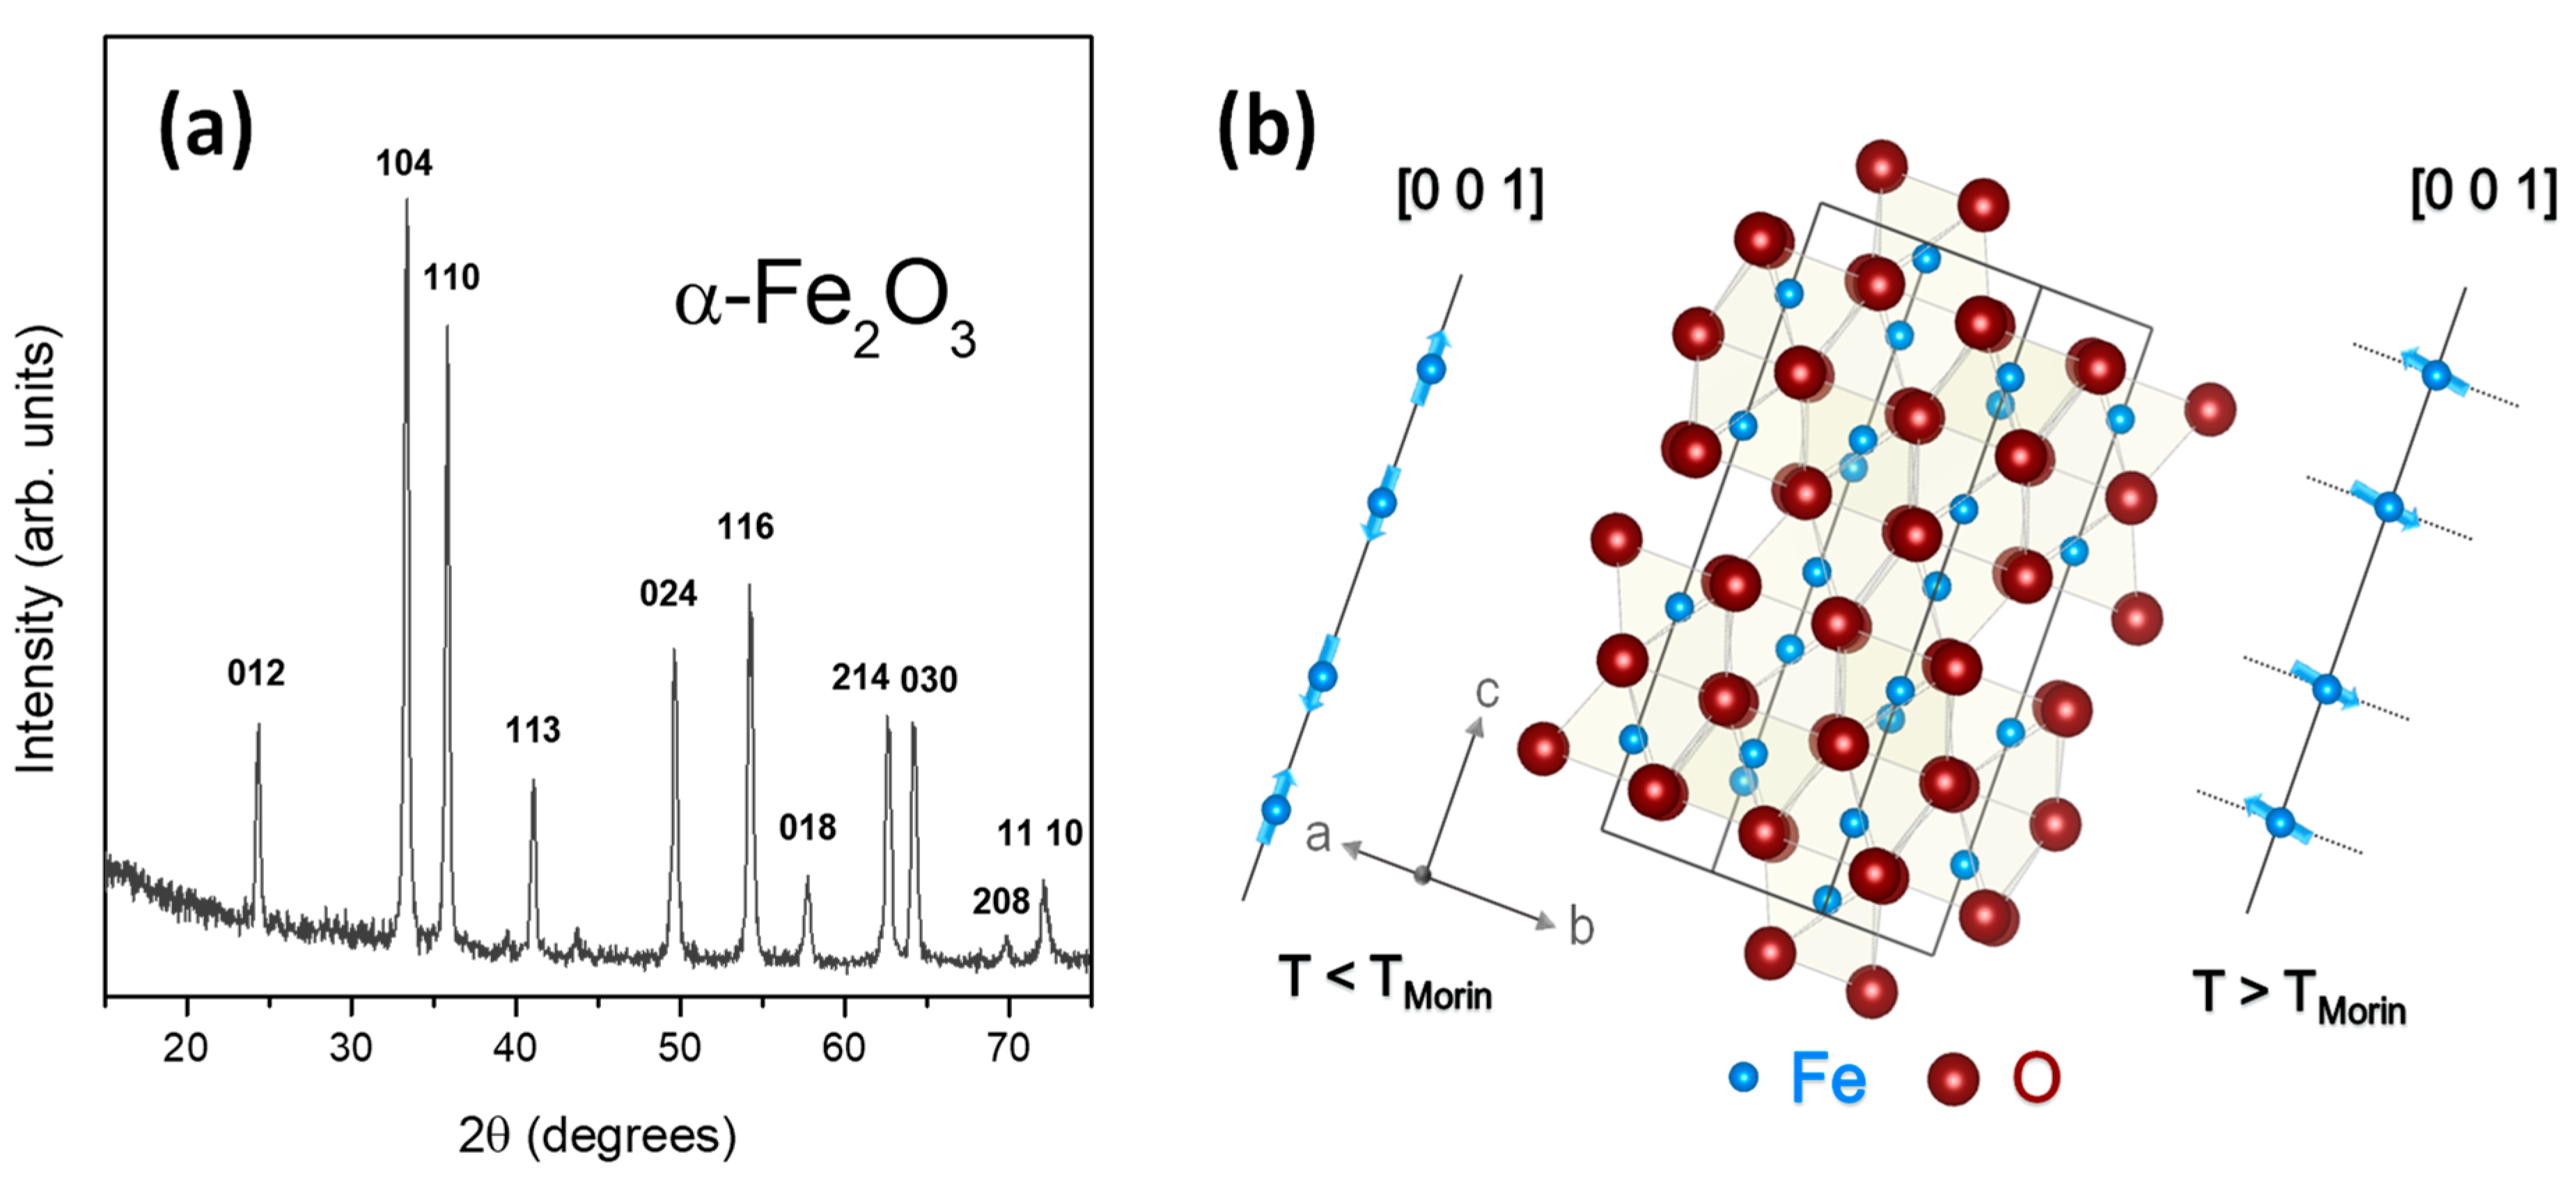
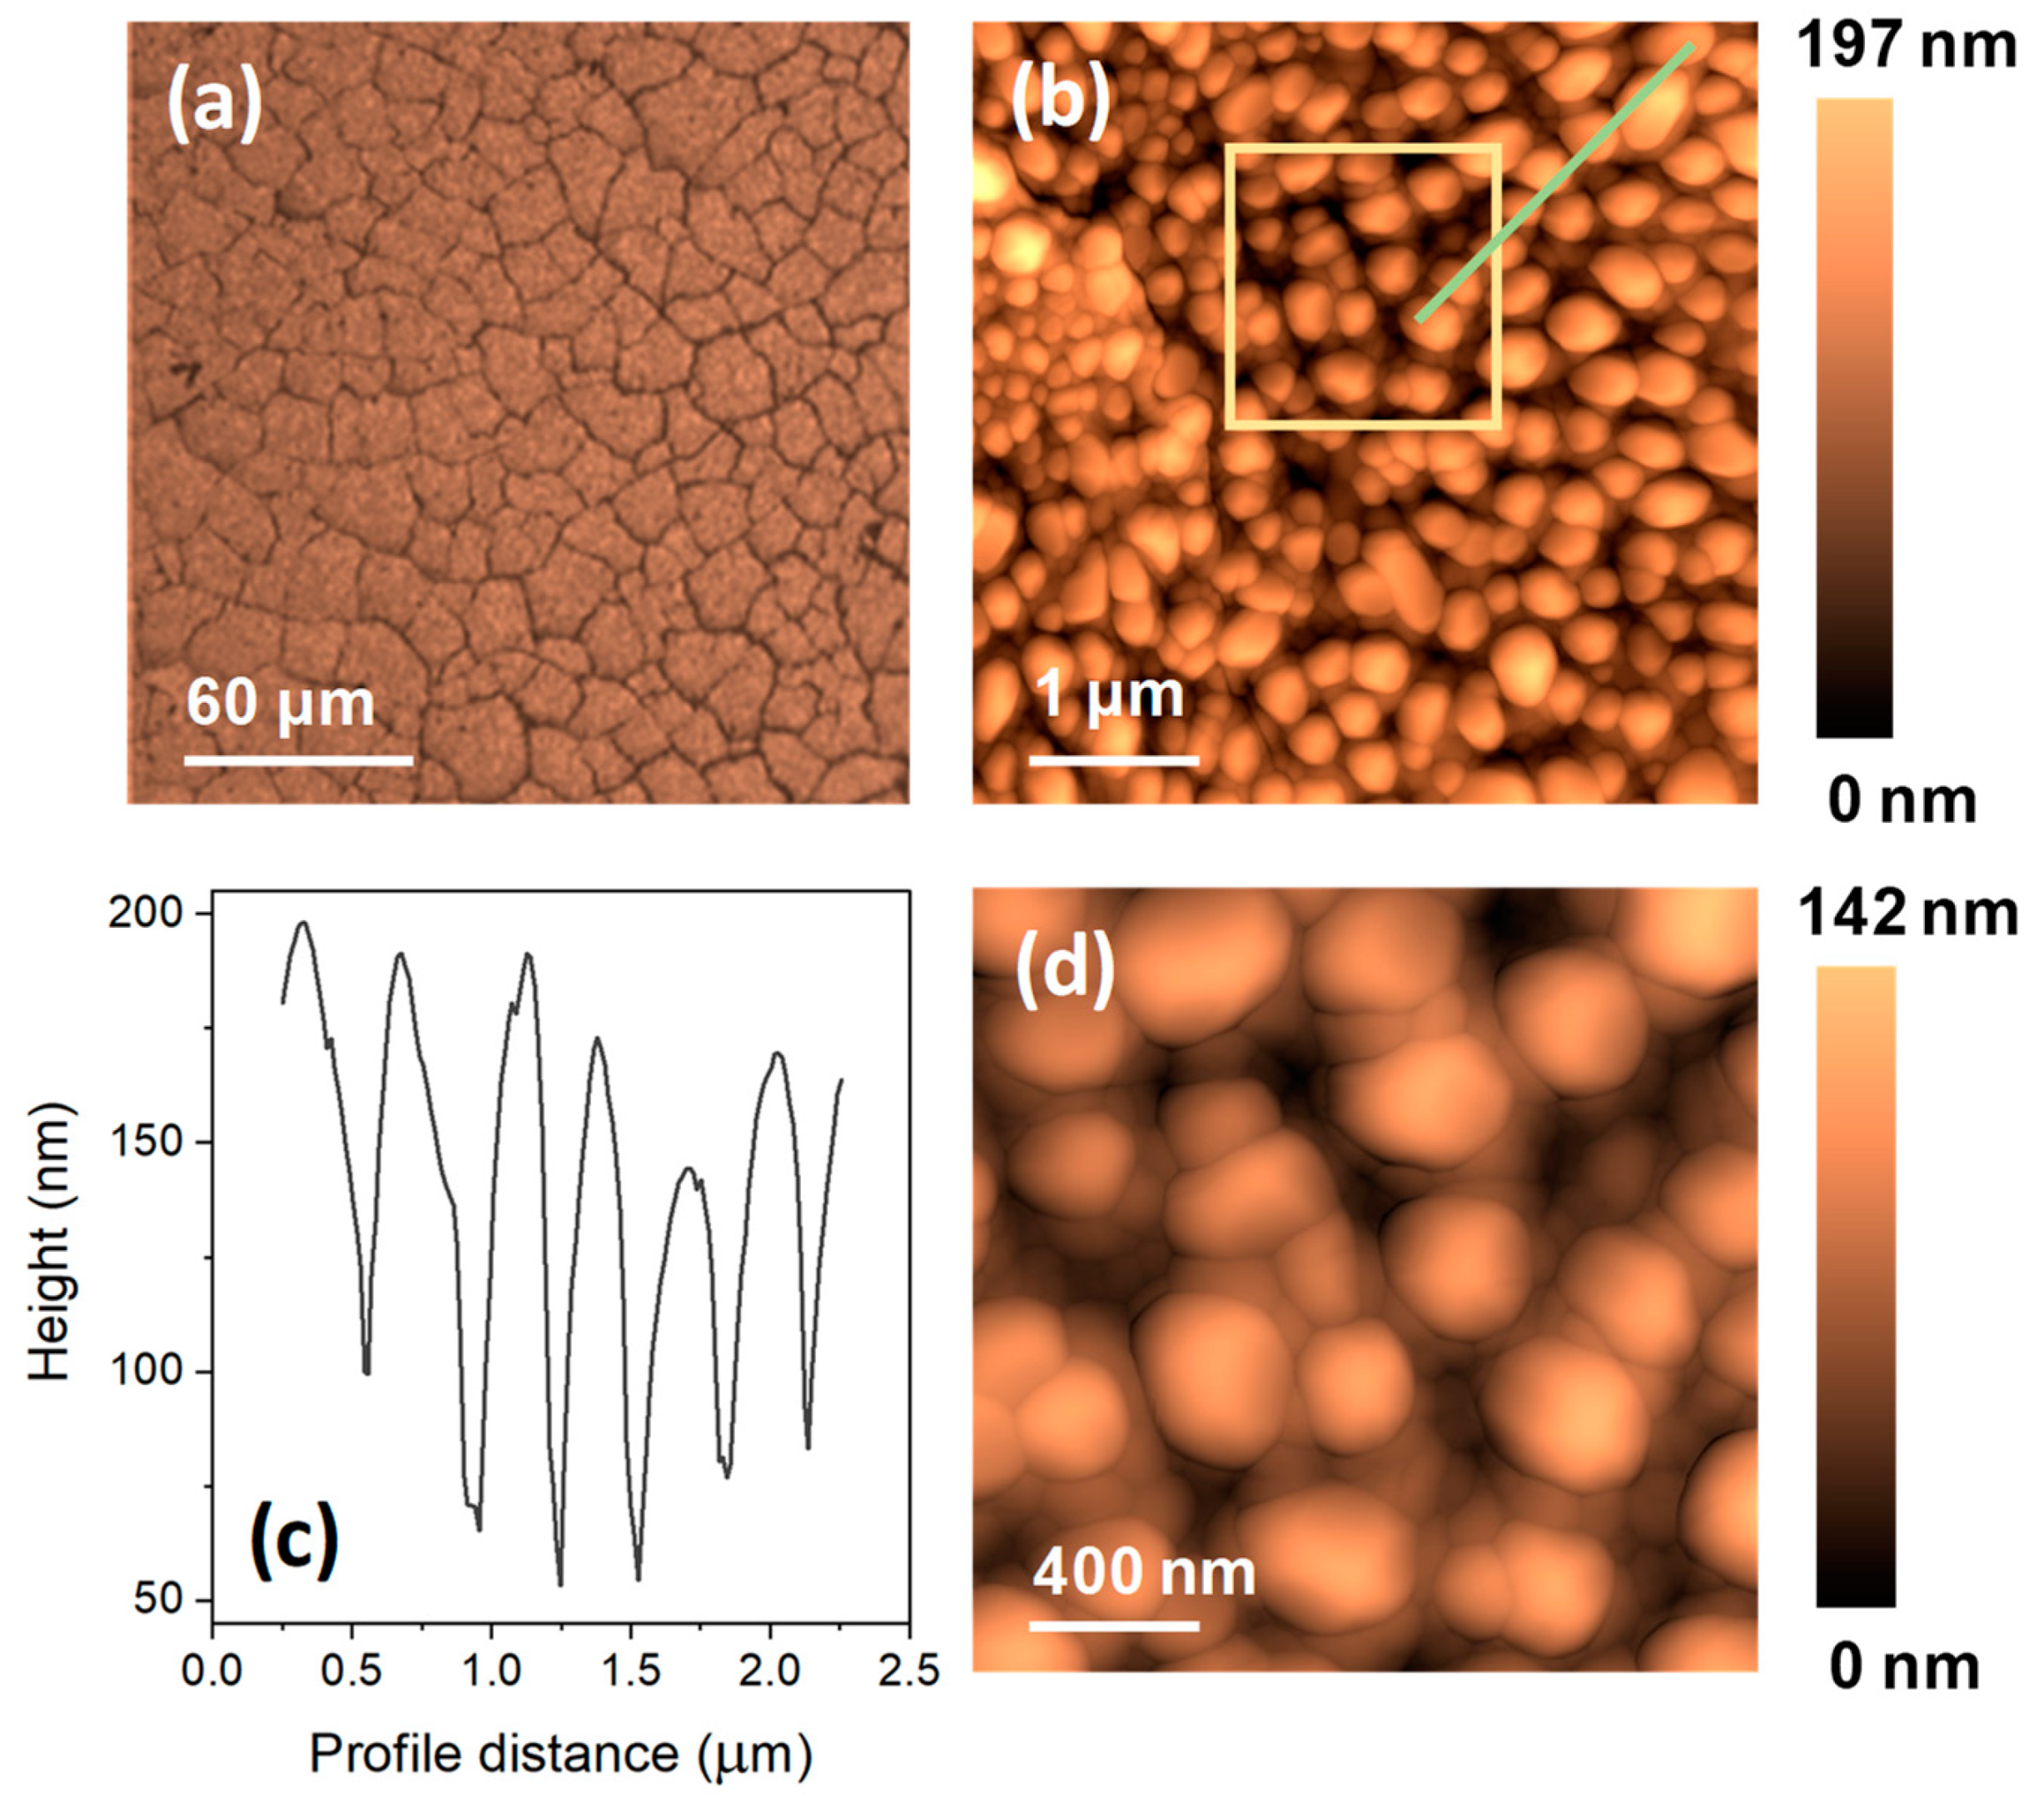
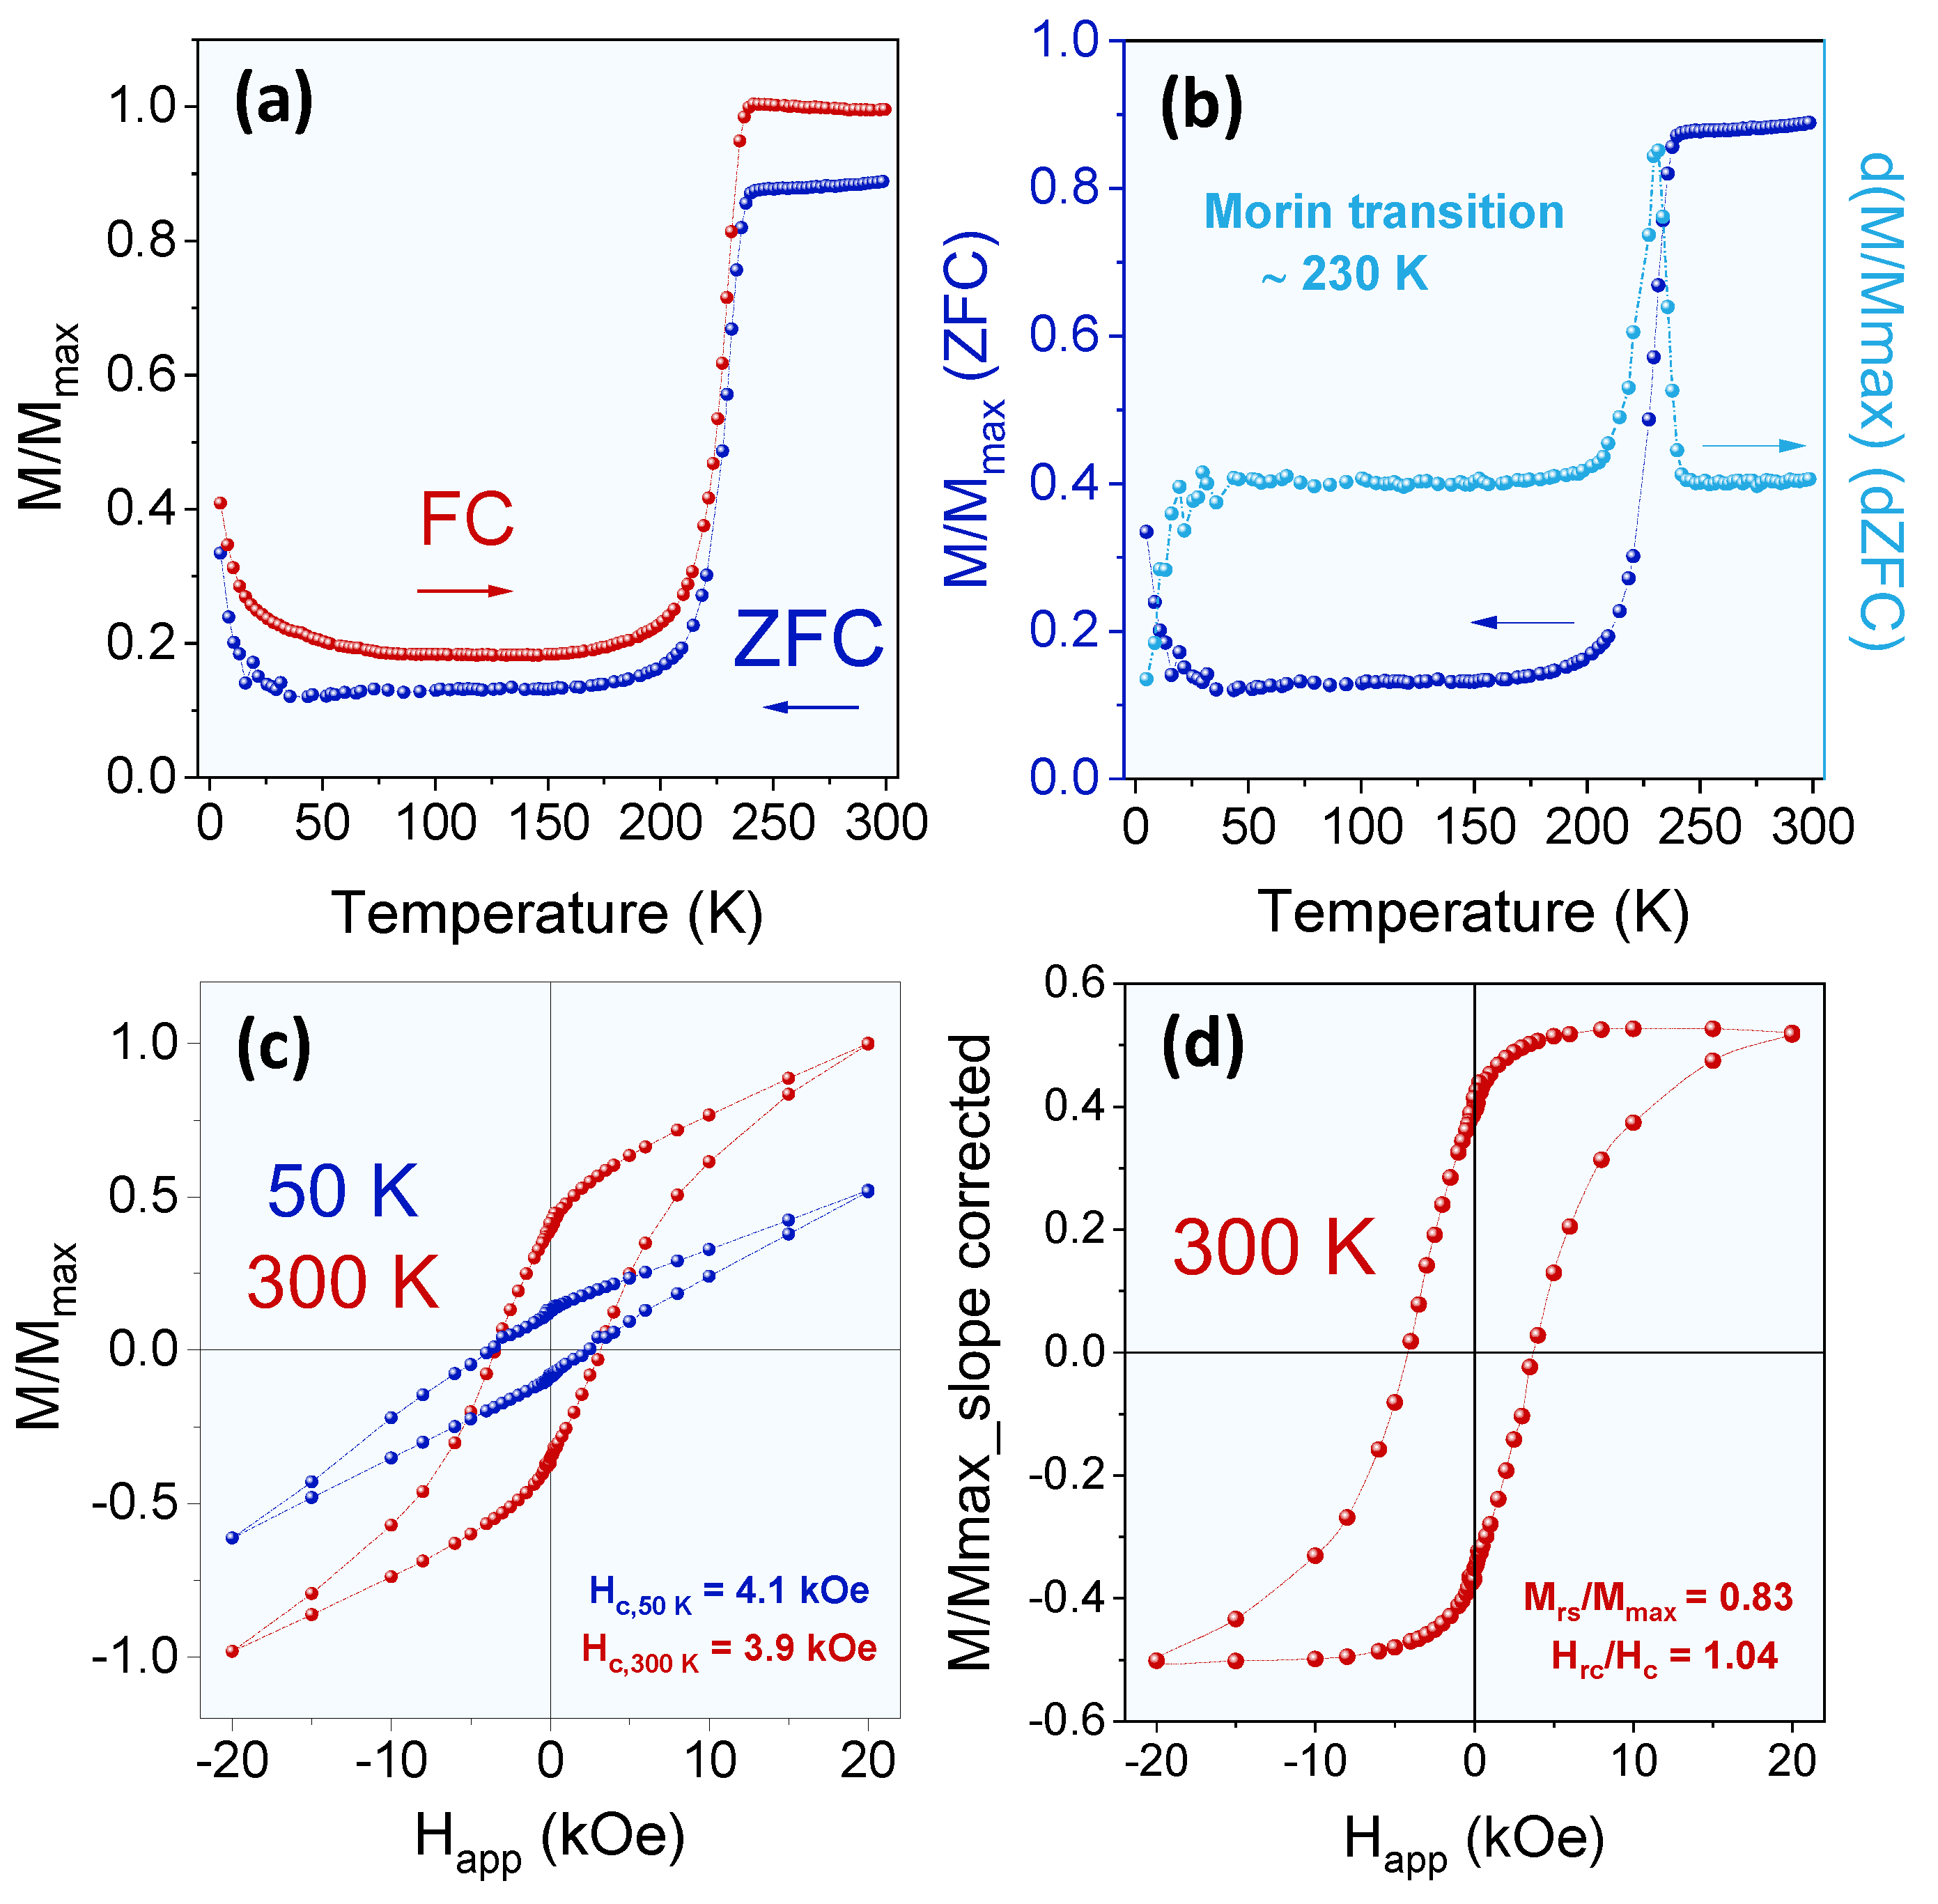
3.1. Morphological, Structural, and Magnetic Properties of the Nanoparticulated Hematite Coating

Hematite crystallizes in the corundum type structure and its unit cell is hexagonal with lattice parameters a = 5.036 Å and c = 13.749 Å, belonging to the space group R 3 ¯ c [2]. This structure consists of a hexagonal packing of O2− ions along the c direction, with two-thirds of the octahedral positions occupied in this case by Fe3+ ions (the remaining one-third of the octahedral positions are unoccupied) (see Figure 1a). In addition, Fe3+ ions are in a high spin d5 configuration with a magnetic moment of 4.6 µB per Fe3+ atom [34].
Figure 1b shows the XRD pattern of the nanoparticulated hematite film, exhibiting the characteristic reflections of a polycrystalline hematite [10]. The maxima are relatively broad and indicate that the crystalline domain sizes are located at the nanoscale. Specifically, the size of the average crystalline domain is ~34.5(6) nm. This result is calculated by the Scherrer formula assuming a spherical shape of the crystalline domains [35]. Interestingly, no reflections related to metallic Fe [36] or other iron oxides are detected [9,18]. Therefore, the deposition process of Fe metallic plus a subsequent thermal treatment performed at 1050 °C for 4 h, represents an effective method to obtain crystalline single-phase hematite at the nanoscale [31,37].
Optical and AFM measurements are performed to reveal the micro- and nanostructured morphology produced by the fabrication method. Figure 2a shows an optical micrograph (false color) acquired with the confocal Raman equipment, identifying numerous cracks and/or fractures along the coating with a certain degree of roughness. In more detail, several AFM images and depth profiles are analyzed in representative areas (see Figure 2b–d). They show a surface morphology with homogeneous nanoparticles with a rounded shape and lateral sizes ranging from approximately ~50 to ~600 nm. In addition, regarding their height, the nanoparticulated structures have an average height of 76.7(6) nm and its calculated root mean square (RMS) roughness is ~27.5(7) nm. As an example, a height profile indicated by a green straight line is shown in Figure 2b. Moreover, a magnification of the yellow square area shows the high degree of compactness and nanoparticulation.
The nanoparticulated structure of the hematite coating is attributed to the phenomena occurring during the annealing process. The thermal treatments of the Fe film deposited on a silica substrate in an air environment at high temperatures induce its oxidation to hematite, which breaks into nanoparticles due the nucleation and percolation of oxide islands [38,39,40]. In addition, during the oxidation process, the volume increases heterogeneously about 30%–40%, inducing large stresses that are relieved upon breaking the continuous Fe film in a nanostructured hematite coating [41]. Therefore, the structural stresses could have an effect on the magnetic properties of hematite with temperature.
The crystalline domain size value (~34.5(6) nm) is much smaller than the sizes obtained by AFM analyses. Therefore, it is concluded that the nanoparticulated structures are polycrystalline and they are constituted by subgrains of different sizes produced by the thermal treatment at high temperatures.
The magnetic properties of the hematite coating are investigated between 5 and 300 K by ZFC–FC curves, as Figure 3a,b displays. They show a drastic jump around ~230 K characteristic of the Morin transition of hematite and a small increase in the magnetization below 25 K. The position of the Morin transition differs slightly from its bulk value (268 K) and it is probably due to its nanometer nature as observed in size-dependent studies [14]. Regarding the small increase below 25 K, interesting studies have established that smaller hematite particles than approximately 30 nm can exhibit superparamagnetic behavior [13,14,19,42]. Below that value, small structural deviations caused by low structural symmetry and uncompensated surface spins result in a misalignment of the antiferromagnetically coupled lattices [43]. Therefore, there might exist a small superparamagnetic contribution of hematite with domains of a few nanometers, representing a residual contribution and undetectable by the structural characterization techniques used [13,15].
Hysteresis loops are measured at 300 and 50 K to evaluate the coercivity and the effects of the Morin transition at low temperatures (see Figure 3c). Considering the hysteresis loop collected at 300 K (red color), it features a characteristic form of an antiferromagnetic canted material with a coercivity of ~3.9 kOe, and it is not fully saturated at 20 kOe. Since the loop is open, the coercivity is probably higher. Likewise, the coercivity corresponds to hematite values at the submicrometric scale as reflected in other works [30,42,44] and agrees with the sizes observed in Figure 2. In addition, the non-saturation slope is corrected and the relationship between the saturation remanence ratio MRS/MS and coercivity remanence ratio HRC/HC is calculated (Figure 3d). Those ratios are 0.83 and 1.07, respectively, and they coincide with typical values of hematite with magnetic multidomains whose origin of coercivity is probably dominated by both magnetocrystalline and magnetoelastic effects [42], excluding shape anisotropy effects as their globular morphology is considered. Moreover, domain wall interactions [45] and structural defects [42], such as grain boundaries and pile-ups, also play an important role since they can pin the domain wall motions [46]. In fact, such long-range defects might occur because of the high degree of compactness of the nanoparticulated hematite structures obtained in this work (see Figure 2).
Remarkably, these factors might explain the pronounced uncompensated magnetization of the hysteresis loop obtained at 50 K with a coercivity of ~4.1 kOe (blue color in Figure 3c). Specifically, a strong evidence of non-compensated antiferromagnetism is observed. The height of the hysteresis loop is lower, decreasing the sample remanence considerably. However, there is a stable ferromagnetic component at low temperature with a similar coercivity as compared to one displayed at 300 K. In turn, the hysteresis loop is not symmetrical and a significant uncompensated magnetization between the magnetic sublattices is revealed, which promotes the complete breakup of an ideal antiferromagnetic material. The shift in the horizontal axis of the low temperature hysteresis loop could be a clear sign of exchange bias (EB). This would in turn support the idea that, below the Morin transition, there are regions in the hematite crystal that have not gone through the spin flop transition, remaining in the non-compensated state (i.e., ferromagnetic FiM). The interaction between both phases of hematite (the AFM phase fixing the orientation of the FiM regions) would give rise to the EB effect [47]. The result is particularly attractive because a generalized spin-flop process involving an enriched coercivity below and above the Morin transition might have major implications in spintronics [28]. Related to other reported works, high coercive hematite is observed with no superparamagnetic contributions in natural samples [48] and, in synthetic samples, with rhombohedron and plate shapes [49]. Instead, this work provides a method to obtain hematite with a high coercivity in a wide temperature range from 5 to 300 K on a silica substrate. One approach to reveal the existence of a certain degree of structural disorder in the crystal structure of hematite is the Raman spectroscopy. Hematite could present a localized band around 670–680 cm−1 that corresponds to a forbidden mode in Raman and is magnified by structural disorder or lattice stresses [50,51]. In addition, the effect on the magnon modes located at around 800–850 cm−1 (one-magnon) and 1580–1600 cm−1 (two-magnon) can also be investigated through the Morin transition by a thermal Raman study as well as its implications.

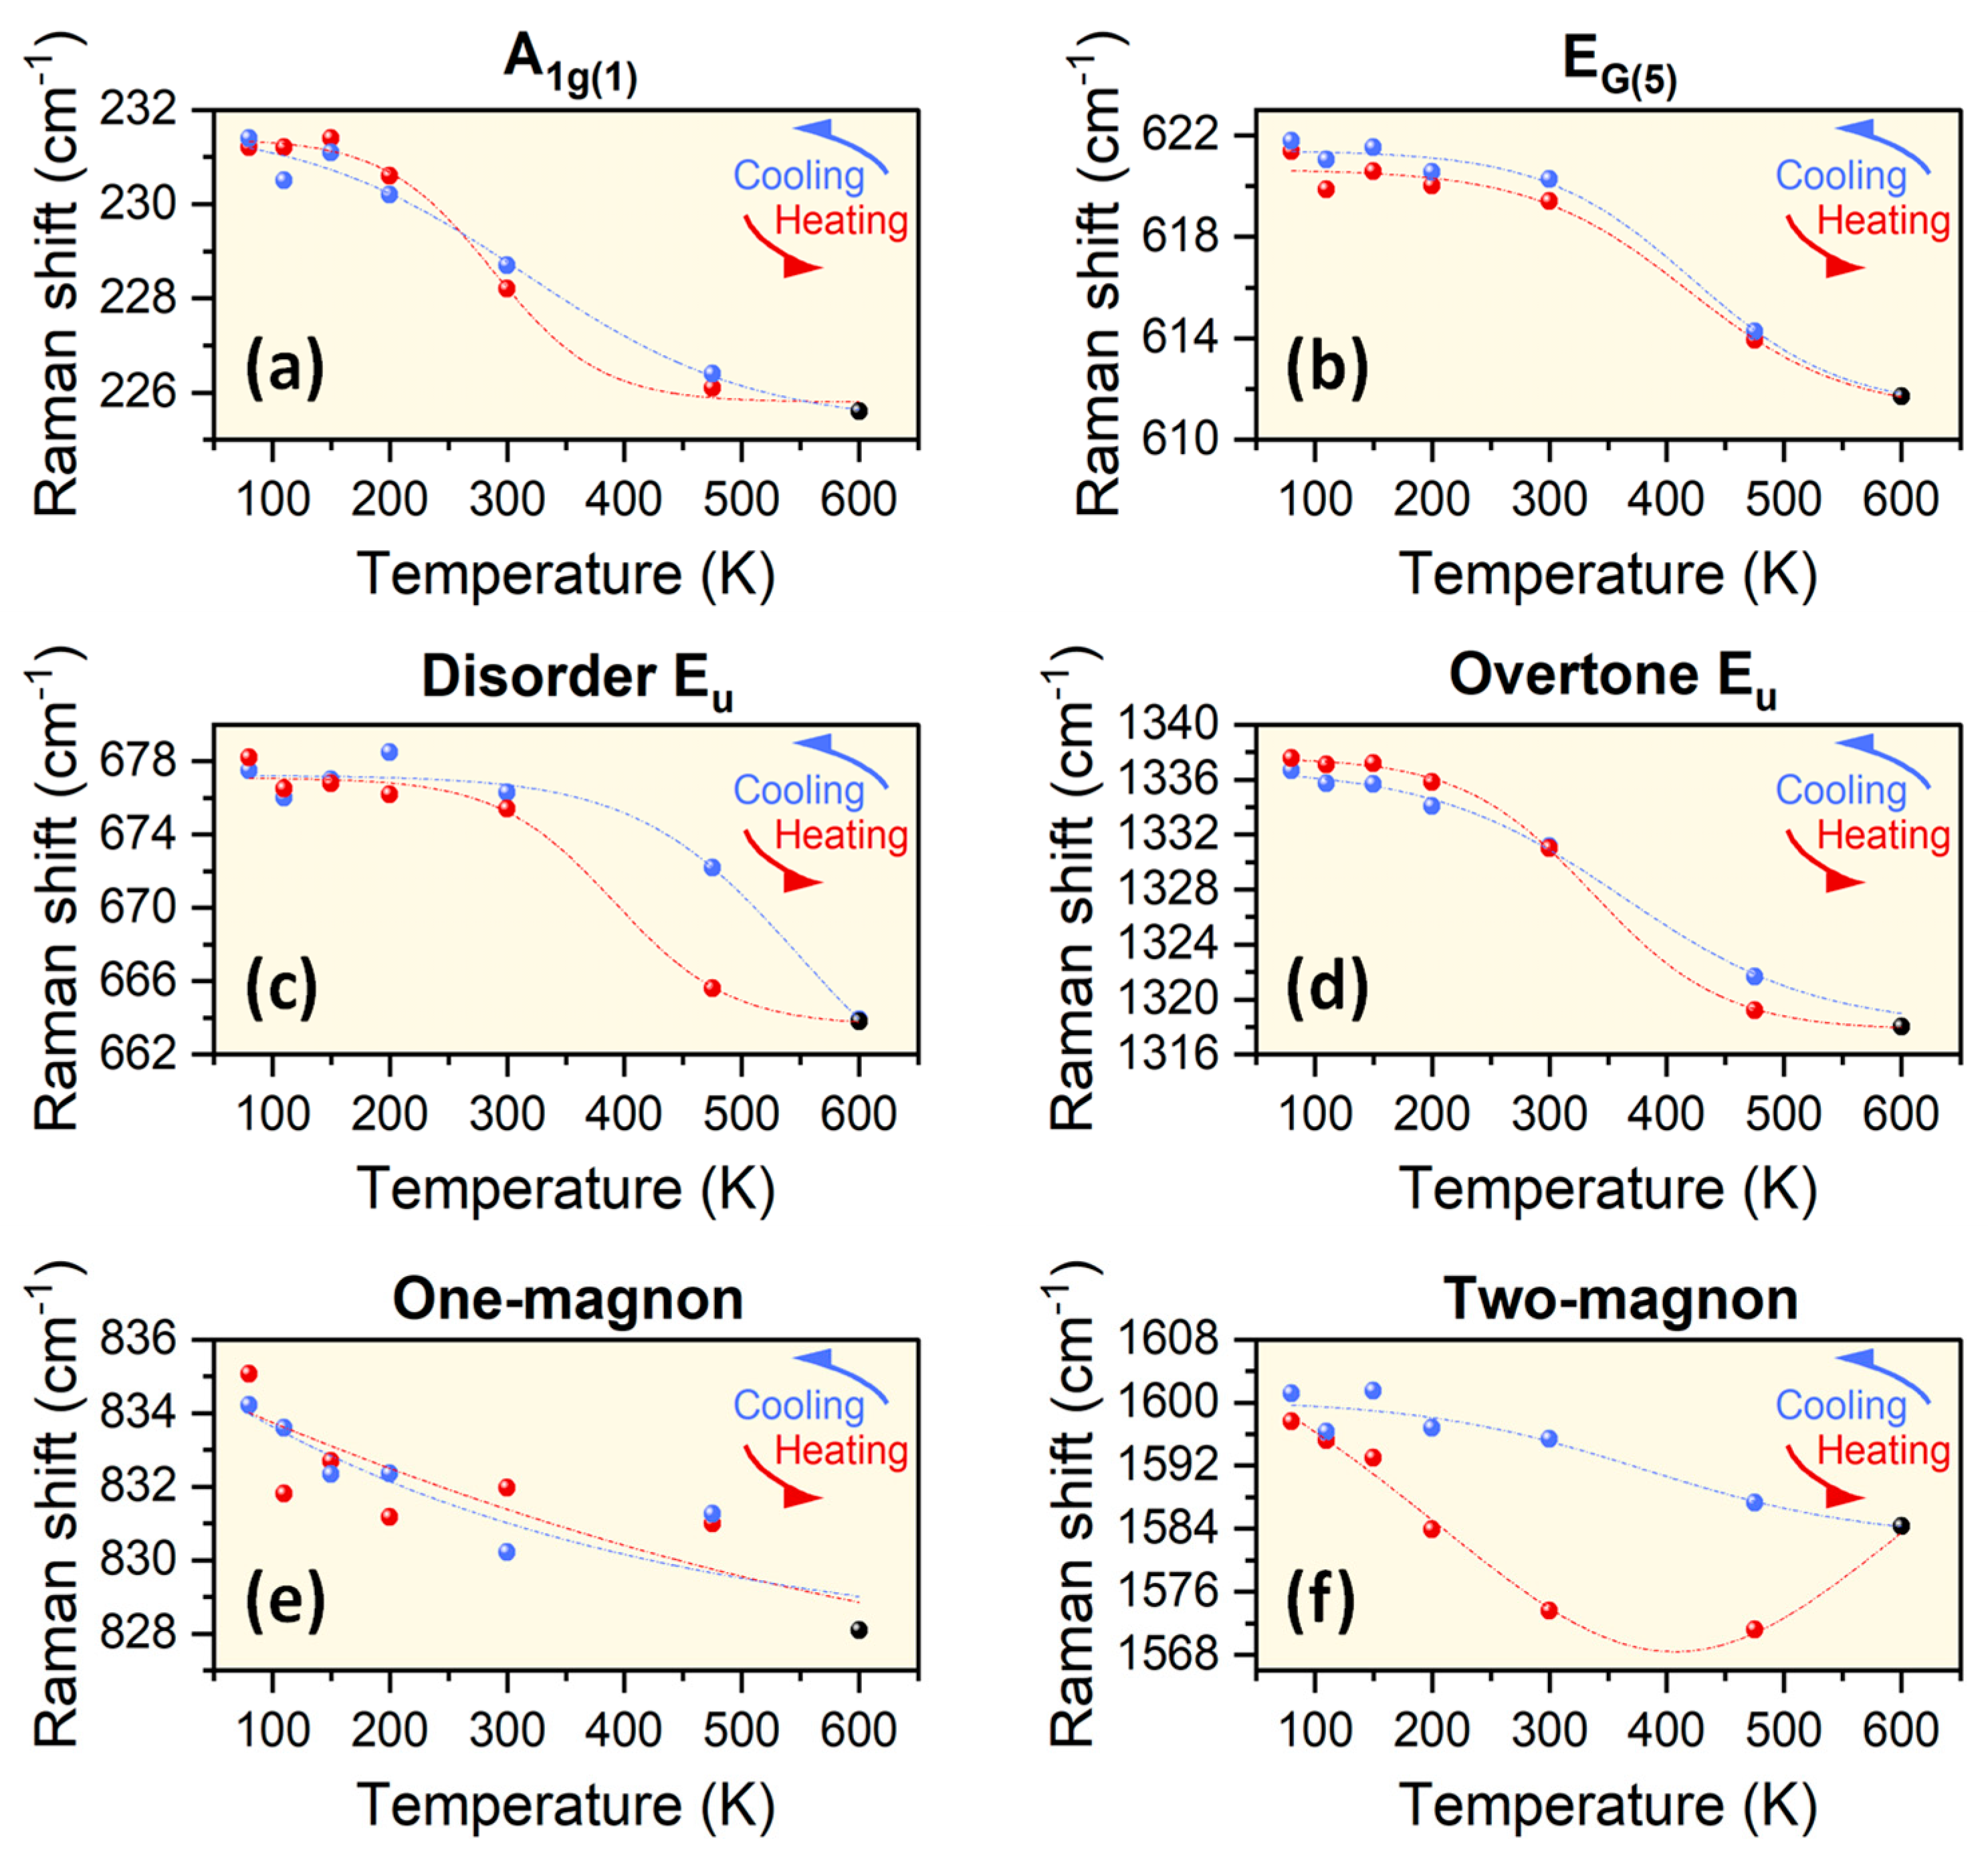
3.2. Thermal Study of the Raman Signal for the Nanoparticulated Hematite Coating across the Morin Transition

Figure 4a,b shows the Raman spectra during the heating and cooling process acquired in the 80–600 K range, respectively, normalized to the intensity of the mode A1g(1). The sample is first cooled to 80 K and then heated to 600 K (heating process). Subsequently, the sample is cooled again to 80 K (cooling process). In turn, the nature of the observed modes is detailed, taking as reference the spectrum of the heating curve measured at 80 K. The Lorentzian fits of the modes corresponding to the Raman spectrum of nanoparticulated hematite film measured in the heating curve (Figure 4a) are illustrated in Table 1.
The Raman spectrum collected at 80 K of hematite coating exhibits seven active phonon modes allowed in Raman (2A1g + 5Eg) [50,52]. In addition, other vibrational bands located approximately at ~679, ~835, ~1338 cm−1, and ~1597 cm−1 (Table 1) are identified. The band located at ~679 cm−1 is forbidden in Raman but allowed in the infrared as a longitudinal optical (LO) active mode Eu. The occurrence of the mode Eu is due to the inherent crystalline disorder in the crystal lattice of hematite [53,54]. In contrast, the mode located at ~835 cm−1 features a different nature, arising from the interaction of collective spin oscillations with the crystal phonons, and it is known as a one-magnon interaction [55]. In the case of hematite, the vibrational modes that appear above 850 cm−1 are overtones. These modes are linear combinations of the modes located at the first order of Raman scattering (100–850 cm−1). It is worth mentioning the intensity of the band with a maximum located at ~1338 cm−1, which represents the overtone of the mode located at ~678 cm−1 (around 2Eu). The high intensity detected is because the coincidence of the incident laser wavelength (532 nm) with an electronic transition of hematite, becoming more intense than the other modes [31]. At the highest wavenumbers of the Raman spectrum, the mode attributed to the two-magnon interaction at ~1597 cm−1 is also observed (a magnification is displayed in the right part of the Figure 4a,b) [56]. In this line, spin waves have a significant effect when magnetic materials undergo a magnetic transition that involves a reorientation of the spins. Using Raman spectroscopy, one-magnon and two-magnon interactions can be traced [50,57,58,59]. The one-magnon interaction involves magnons with propagation vectors ~k = 0, i.e., nearby the center of the Brillouin zone. On the contrary, the interaction of the two-magnon possesses different polarizability characteristics and happens at an energy about twice the magnon energy at the edge of the Brillouin zone [60].
The light scattering on magnetic crystals is studied by quantum perturbation theory, considering as perturbation, the interaction of the incident light with the electron, the Zeeman energy, the spin-orbit coupling, and the interatomic Coulomb interaction [61]. The development of this theory establishes that the one-magnon scattering process can be observed in a wide variety of magnetic crystals, considering the selection rules calculated from their magnetic structure. The terms that contribute most to the polarizability are linear functions, and their intensity is calculated as a function of temperature considering approximations for a certain spin system. When the theory is applied to the two-magnon, the intensity depends on the magnetic order and the polarization tensor term with a substantial contribution in ferrimagnetic and antiferromagnetic materials, but not in ferromagnetic materials [60,61,62]. If the two-magnon comes from the interaction of the spins of a magnetic sublattice with the spins oriented in parallel, it has a contribution determined by a quadratic function. However, the term with the highest weight in the polarizability is a bilinear function, when the interaction is given by magnons coming from different magnetic sublattices with the spins coupled in an antiparallel way. The contribution of the two-magnon interaction in ferromagnetic materials is noticeable only when the energy of magnetic anisotropy is comparable to the exchange energy [62]. Bearing this in mind, the interaction of the two-magnon is detected to be related to antiferromagnetic materials such as α-Fe2O3 [57] and ferrimagnetic materials as AlFeO3 [58], BiFeO3 [59], and ε-Fe2O3 [50]. Therefore, large changes could occur in the Raman frequency with temperature in the two-magnon mode compared to the rest of the vibrational modes. In addition, the Morin transition exhibits a thermal hysteresis [14,63], which could be measured by Raman experiments and the two-magnon interaction could be significantly influenced.
In the following, the evolution of the Raman modes with temperature is studied from 80 to 600 K, both during the heating (Figure 4a) and cooling process (Figure 4b), examining possible hysteretic effects when the material passes through the Morin transition. Likewise, a Lorentzian fit is performed to obtain the position of vibrational modes and their evolution with temperature being adjusted according to anharmonic and Lorentzian fittings to identify trends (Figure 5) [64,65,66]. In general, large effects are observed in all modes due to lattice compression and phonon–phonon interactions as the temperature decreases (cooling curve in Figure 4b). The effects are shifts in the bands toward higher wavenumbers (blue curves in Figure 5a–f) and an enhancement of the intensity ratio of the bands to the background. On the contrary, opposite signs are observed in the Raman spectra with increasing temperature (red curves in Figure 5a–f), accompanied by a loss of spectral resolution (brown curve in Figure 4a,b) [50].
The cooling and heating behaviors of the Raman-active vibrational modes A1g(1) and Eg(5) follow approximately the same Raman shift positions on cooling and heating except for the region between 200 and 300 K, where a deviation with a certain degree of hysteresis is observed (Figure 5a,b). Thermal hysteresis in Raman modes has been observed in several materials; for example, a hysteric behavior in the intensity of Raman modes across the metal-insulator transition of single vanadium dioxide nanoparticles [67] and in-phase transitions observed in single crystals of type-II Weyl semimetal MoTe2 [68]. However, those hysteretic effects come from changes in the crystal structure of those materials and, in the present work, they are promoted by a magnetic transition. For the case of the mode Eu related to the structural disorder of hematite, a large Raman shift hysteretic difference above the Morin transition is exhibited (Figure 5c), which almost vanishes for its overtone (Figure 5d). Therefore, the structural defects, which are related to the enriched coercivity displayed by the sample, could be more influenced by the Morin transition as identified by Raman results. They exhibit a higher magnetic dependence compared to the rest of the Raman vibrational modes analyzed where less noticeable transition effects are observed (Figure 5a,b). Interestingly, the thermal behavior of the one-magnon (Figure 5e) and two-magnon mode (Figure 5f), purely active from collective magnetic oscillations, are examined. The results indicate a large thermal hysteresis detected in the two-magnon mode, becoming noticeable from 200 K onwards, and the interaction between two magnons when crossing the Morin transition is evidenced. On the contrary, the one-magnon interaction exhibits poor hysteretic features when is compared to the two-magnon mode, probably due the different polarizability characteristics [60]. To conclude, the relative intensities between the disorder Eu, one-magnon, and two-magnon mode related to the A1g(1) mode are calculated to investigate whether there are changes in the intensity resulting from thermal and magnetic effects (Figure 6a–c, respectively).
As a general remark, the relative intensity increases considerably with decreasing temperature, showing that the modes related to structural disorder and magnetic collective oscillations are magnified with respect to the purely vibrational mode A1g(1). Concerning the mode Eu, an increase in the structural disorder is detected at low temperatures and small hysteretic effects are noted below 110 K. In contrast, abrupt slope changes around 200 K and large hysteresis effects are observed in the two-magnon mode and in the one-magnon mode in smaller proportions. Therefore, magnetic effects are noticeable in both the relative intensity and Raman shift across the Morin transition. These results can be explained according the magnetic properties of the nanoparticulated hematite, showing the high stability of the spin excitation in the whole temperature range studied and might provide new implications in spintronics based on semiconducting antiferromagnetic materials.

4. Conclusions

In this work, a temperature-dependent Raman experiment on a nanoparticulated hematite coating across the Morin transition has revealed the behavior of the Raman modes, the thermal hysteretic effects, and their influence on the vibrational and magnonic modes. Specifically, a high coercivity of hematite is maintained across the Morin transition, observing a strong stable quenched ferromagnetic component at low temperature. The close interaction, at the interfaces, between the quenched ferromagnetic and antiferromagnetic phases, and the possible existence of an exchange bias effect, could justify the shift observed in the hysteresis loop at low temperature. The origin of the coercivity observed in this loop may come from the multidomain character and its influence on the structural defects and the high degree of compactness of the particulated hematite nanostructures. In this line, noticeable hysteretic effects are detected in the vibrational mode Eu associated with the structural disorder of hematite and more pronounced in the two-magnon interaction, showing a high thermal stability of the excitation between 80 and 600 K.

Author Contributions

Conceptualization, methodology, investigation, supervision, formal analysis, data curation, writing—original draft and funding acquisition, J.L.-S. and A.S. Investigation, formal analysis, and review—editing, A.d.C., S.R.-S., Ó.R.d.l.F. and N.C. All authors have read and agreed to the published version of the manuscript.

Funding

The present work has been supported by the Ministerio Español de Ciencia e Innovación (MICINN) and the Consejo Superior de Investigaciones Cientificas (CSIC) through the projects PIE-2010-OE-013-200014, PIE 2021-60-E-030, and RTI2018-095303-A-C52. A.S. acknowledges financial support from the program “Atracción de Talento Investigador” Contract (2017-t2/IND5395, Comunidad de Madrid).

Institutional Review Board Statement

Not applicable.

Informed Consent Statement

Not applicable.

Data Availability Statement

Not applicable.

Conflicts of Interest

The authors declare no conflict of interest.

References

  1. Suturin, S.M.; Korovin, A.M.; Gastev, S.V.; Volkov, M.P.; Sitnikova, A.A.; Kirilenko, D.A.; Tabuchi, M.; Sokolov, N.S. Tunable polymorphism of epitaxial iron oxides in the four-in-one ferroic-on-GaN system with magnetically ordered α-, γ-, ɛ-Fe2O3, and Fe3O4 layers. Phys. Rev. Mater. 2018, 2, 073403. [Google Scholar] [CrossRef] [Green Version]
  2. MacHala, L.; Tuček, J.; Zbořil, R. Polymorphous transformations of nanometric iron(III) oxide: A review. Chem. Mater. 2011, 23, 3255–3272. [Google Scholar] [CrossRef]
  3. Tran, H.V.; Ngo, N.M.; Medhi, R.; Srinoi, P.; Liu, T.; Rittikulsittichai, S.; Lee, T.R. Multifunctional iron oxide magnetic nanoparticles for biomedical applications: A review. Materials 2022, 15, 503. [Google Scholar] [CrossRef] [PubMed]
  4. Creţu, B.E.B.; Dodi, G.; Shavandi, A.; Gardikiotis, I.; Şerban, I.L.; Balan, V. Imaging Constructs: The rise of iron oxide nanoparticles. Molecules 2021, 26, 3437. [Google Scholar] [CrossRef]
  5. López-Sánchez, J.; Palencia-Ortas, A.; del Campo, A.; McIntosh, G.; Kovacheva, M.; Martín-Hernández, F.; Carmona, N.; Rodríguez de la Fuente, O.; Marín, P.; Molina-Cardín, A.; et al. Further progress in the study of epsilon iron oxide in archaeological baked clays. Phys. Earth Planet. Inter. 2020, 307, 106554. [Google Scholar] [CrossRef]
  6. Xu, H.; Lee, S.; Xu, H. Luogufengite: A new nano-mineral of Fe2O3 polymorph with giant coercive field. Am. Mineral. 2017, 102, 711–719. [Google Scholar] [CrossRef]
  7. McIntosh, G.; Kovacheva, M.; Catanzariti, G.; Donadini, F.; Osete, M.L. High coercivity remanence in baked clay materials used in archeomagnetism. Geochem. Geophys. Geosyst. 2011, 12, Q02003. [Google Scholar] [CrossRef]
  8. López-Sánchez, J.; McIntosh, G.; Osete, M.L.; del Campo, A.; Villalaín, J.J.; Pérez, L.; Kovacheva, M.; Rodríguez de la Fuente, O. Epsilon iron oxide: Origin of the high coercivity stable low curie temperature magnetic phase found in heated archeological materials. Geochem. Geophys. Geosyst. 2017, 18, 2646–2656. [Google Scholar] [CrossRef]
  9. López-Sánchez, J.; Serrano, A.; del Campo, A.; Muñoz-Noval, Á.; Salas-Colera, E.; Cabero, M.; Varela, M.; Abuín, M.; Castro, G.R.; Rubio-Zuazo, J.; et al. A combined micro-raman, x-ray absorption and magnetic study to follow the glycerol-assisted growth of epsilon-iron oxide sol-gel coatings. J. Alloys Compd. 2022, 892, 162061. [Google Scholar] [CrossRef]
  10. Lee, S.; Xu, H. Size-dependent phase map and phase transformation kinetics for nanometric iron(III) oxides (γ → ϵ → α pathway). J. Phys. Chem. C 2016, 120, 13316–13322. [Google Scholar] [CrossRef]
  11. Tadic, M.; Milosevic, I.; Kralj, S.; Hanzel, D.; Barudzija, T.; Motte, L.; Makovec, D. Surface-induced reversal of a phase transformation for the synthesis of ε-Fe2O3 nanoparticles with high coercivity. Acta Mater. 2020, 188, 16–22. [Google Scholar] [CrossRef]
  12. Morrish, A.H. Canted Antiferromagnetism: Hematite; WORLD SCIENTIFIC: Singapore, 1995; ISBN 978-981-02-2007-5. [Google Scholar]
  13. Bødker, F.; Mørup, S. Size dependence of the properties of hematite nanoparticles. Europhys. Lett. 2007, 52, 217–223. [Google Scholar] [CrossRef]
  14. Özdemir, Ö.; Dunlop, D.J.; Berquó, T.S. Morin transition in hematite: Size dependence and thermal hysteresis. Geochem. Geophys. Geosyst. 2008, 9, Q10Z01. [Google Scholar] [CrossRef]
  15. Bødker, F.; Hansen, M.; Koch, C.; Lefmann, K.; Mørup, S. Magnetic properties of hematite nanoparticles. Phys. Rev. B 2000, 61, 6826–6838. [Google Scholar] [CrossRef] [Green Version]
  16. Serrano, A.; Rubio-Zuazo, J.; López-Sánchez, J.; Arnay, I.; Salas-Colera, E.; Castro, G.R. Stabilization of epitaxial α-Fe2O3 thin films grown by pulsed laser deposition on oxide substrates. J. Phys. Chem. C 2018, 122, 16042–16047. [Google Scholar] [CrossRef]
  17. Guerrero-Suarez, S.; Martín-Hernández, F. Haematite natural crystals: Non-linear initial susceptibility at low temperature. Geophys. J. Int. 2016, 205, 1886–1899. [Google Scholar] [CrossRef] [Green Version]
  18. López-Sánchez, J.; Serrano, A.; del Campo, A.; Abuín, M.; Salas-Colera, E.; Muñoz-Noval, A.; Castro, G.R.; de la Figuera, J.; Marco, J.F.; Marín, P.; et al. Self-assembly of iron oxide precursor micelles driven by magnetic stirring time in sol–gel coatings. RSC Adv. 2019, 9, 17571–17580. [Google Scholar] [CrossRef] [Green Version]
  19. López-Sánchez, J.; Muñoz-Noval, A.; Serrano, A.; Abuín, M.; de la Figuera, J.; Marco, J.F.; Pérez, L.; Carmona, N.; Rodríguez de la Fuente, O. Growth, structure and magnetism of ε-Fe2O3 in nanoparticle form. RSC Adv. 2016, 6, 46380. [Google Scholar] [CrossRef]
  20. Colomban, P.; Kirmizi, B.; Zhao, B.; Clais, J.B.; Yang, Y.; Droguet, V. Non-invasive on-site Raman study of pigments and glassy matrix of 17th–18th century painted enamelled chinese metalwares: Comparison with french enamelling technology. Coatings 2020, 10, 471. [Google Scholar] [CrossRef]
  21. Nyarige, J.S.; Paradzah, A.T.; Krüger, T.P.J.; Diale, M. Mono-doped and Co-doped nanostructured hematite for improved photoelectrochemical water splitting. Nanomaterials 2022, 12, 366. [Google Scholar] [CrossRef]
  22. Baldovi, H.G. Optimization of α-Fe2O3 nanopillars diameters for photoelectrochemical enhancement of α-Fe2O3-TiO2 Heterojunction. Nanomaterials 2021, 11, 2019. [Google Scholar] [CrossRef] [PubMed]
  23. Roy, S.; Botte, G.G. Perovskite solar cell for photocatalytic water splitting with a TiO2/Co-doped hematite electron transport bilayer. RSC Adv. 2018, 8, 5388–5394. [Google Scholar] [CrossRef] [Green Version]
  24. Katikaneani, P.; Vaddepally, A.K.; Reddy Tippana, N.; Banavath, R.; Kommu, S. Phase transformation of iron oxide nanoparticles from hematite to maghemite in presence of polyethylene glycol: Application as corrosion resistant nanoparticle paints. J. Nanosci. 2016, 2016, 1328463. [Google Scholar] [CrossRef] [Green Version]
  25. Ma, T.; Zheng, L.; Zhao, Y.; Xu, Y.; Zhang, J.; Liu, X. Highly porous double-shelled hollow hematite nanoparticles for gas sensing. ACS Appl. Nano Mater. 2019, 2, 2347–2357. [Google Scholar] [CrossRef]
  26. Serrano, A.; López-Sánchez, J.; Arnay, I.; Cid, R.; Vila, M.; Salas-Cólera, E.; Castro, G.R.; Rubio-Zuazo, J. Improving the CO and CH4 gas sensor response at room temperature of α-Fe2O3(0001) epitaxial thin films grown on SrTiO3(111) incorporating Au(111) islands. Coatings 2021, 11, 848. [Google Scholar] [CrossRef]
  27. Sprain, C.J.; Feinberg, J.M.; Renne, P.R.; Jackson, M. Importance of titanohematite in dentrial remanent magnetizations of strata spanning the cretaceous-paleogene boundary, Hell Creek region, Montana. Geochem. Geophys. Geosyst. 2016, 17, 660–678. [Google Scholar] [CrossRef] [Green Version]
  28. Lebrun, R.; Ross, A.; Gomonay, O.; Baltz, V.; Ebels, U.; Barra, A.L.; Qaiumzadeh, A.; Brataas, A.; Sinova, J.; Kläui, M. Long-distance spin-transport across the morin phase transition up to room temperature in ultra-low damping single crystals of the antiferromagnet α-Fe2O3. Nat. Commun. 2020, 11, 6332. [Google Scholar] [CrossRef]
  29. Baca-Arroyo, R. Iron oxide-coupled graphite/fe–si steel structure for analog computing from recycling principle. Coatings 2021, 11, 607. [Google Scholar] [CrossRef]
  30. Pattanayak, N.; Bhattacharyya, A.; Chakravarty, S.; Bajpai, A. Weak ferromagnetism and time-stable remanence in hematite: Effect of shape, size and morphology. J. Phys. Condens. Matter 2019, 31, 365802. [Google Scholar] [CrossRef] [Green Version]
  31. Serrano, A. Modified Au-Based Nanomaterials Studied by Surface Plasmon Resonance Spectroscopy; Springer: Berlin/Heidelberg, Germany, 2015; ISBN 331919402X. [Google Scholar] [CrossRef] [Green Version]
  32. Ross, A.; Lebrun, R.; Evers, M.; Deák, A.; Szunyogh, L.; Nowak, U.; Kläui, M. Exceptional sign changes of the nonlocal spin seebeck effect in antiferromagnetic hematite. Phys. Rev. B 2021, 103, 224433. [Google Scholar] [CrossRef]
  33. Horcas, I.; Fernández, R.; Gómez-Rodríguez, J.M.; Colchero, J.; Gómez-Herrero, J.; Baro, A.M. WSXM: A software for scanning probe microscopy and a tool for nanotechnology. Rev. Sci. Instrum. 2007, 78, 013705. [Google Scholar] [CrossRef] [PubMed]
  34. Coey, J.M.D.; Sawatzky, G.A. A study of hyperfine interactions in the system (Fe1-xRhx)2O3, using the Mössbauer effect. J. Phys. C Solid State Phys. 1971, 4, 2386–2407. [Google Scholar] [CrossRef]
  35. Patterson, A.L. The Scherrer formula for X-ray particle size determination. Phys. Rev. 1939, 56, 978–982. [Google Scholar] [CrossRef]
  36. López Sánchez, J.; Navarro, E.; Serrano, A.; Granados-Miralles, C.; del Campo, A.; Quesada, A.; Marín, P. Ultrafast particle size reduction of Fe73.9Si15.5Cu1Nb3B6.6 by high-energy milling: Nb2O5 as a marker of permeability enhancement and magnetic hardening. ACS Appl. Electron. Mater. 2020, 2, 1484–1496. [Google Scholar] [CrossRef]
  37. Serrano, A.; Rodríguez de la Fuente, O.; García, M.A. Extended and localized surface plasmons in annealed au films on glass substrates. J. Appl. Phys. 2010, 108, 074303. [Google Scholar] [CrossRef] [Green Version]
  38. Zhou, G. Nucleation-induced kinetic hindrance to the oxide formation during the initial oxidation of metals. Phys. Rev. B Condens. Matter Mater. Phys. 2010, 81, 195440. [Google Scholar] [CrossRef] [Green Version]
  39. Serrano, A.; Fernández, J.F.; Rodríguez de la Fuente, O.; García, M.A. A novel route to obtain metal and oxide nanoparticles co-existing on a substrate. Mater. Today Chem. 2017, 4, 64–72. [Google Scholar] [CrossRef]
  40. Aggarwal, S.; Ogale, S.B.; Ganpule, C.S.; Shinde, S.R.; Novikov, V.A.; Monga, A.P.; Burr, M.R.; Ramesh, R.; Ballarotto, V.; Williams, E.D. Oxide nanostructures through self-assembly. Appl. Phys. Lett. 2001, 78, 1442–1444. [Google Scholar] [CrossRef]
  41. Ogale, A.S. Self-Organized Pattern Formation in the Oxidation of Supported Iron Thin Films. II. A Simulation Study. Phys. Rev. B Condens. Matter Mater. Phys. 2001, 64, 035409. [Google Scholar] [CrossRef]
  42. Özdemir, Ö.; Dunlop, D.J. Hysteresis and coercivity of hematite. J. Geophys. Res. Solid Earth 2014, 119, 2582–2594. [Google Scholar] [CrossRef]
  43. Theil Kuhn, L.; Lefmann, K.; Bahl, C.R.H.; Nyborg Ancona, S.; Lindgard, P.-A.; Frandsen, C.; Madsen, D.E.; Mørup, S. Neutron study of magnetic excitations in 8-nm α-Fe2O3 nanoparticles. Phys. Rev. B 2006, 74, 184406. [Google Scholar] [CrossRef] [Green Version]
  44. Bercoff, P.G.; Bertorello, H.R. Magnetic properties of hematite with large coercivity. Appl. Phys. A Mater. Sci. Process. 2010, 100, 1019–1027. [Google Scholar] [CrossRef]
  45. Hayward, T.J.; Bryan, M.T.; Fry, P.W.; Fundi, P.M.; Gibbs, M.R.J.; Im, M.Y.; Fischer, P.; Allwood, D.A. Pinning induced by inter-domain wall interactions in planar magnetic nanowires. Appl. Phys. Lett. 2010, 96, 052502. [Google Scholar] [CrossRef] [Green Version]
  46. López-Sánchez, J.; Navarro, E.; Rodríguez-Granado, F.; Serrano, A.; Marín, P. Multiphase materials based on the Fe73.9Si15.5Cu1Nb3B6.6 alloy obtained by dry and wet high-energy ball milling processes. J. Alloys Compd. 2020, 864, 158136. [Google Scholar] [CrossRef]
  47. Perzanowski, M.; Zarzycki, A.; Gregor-Pawlowski, J.; Marszalek, M. Magnetization reversal mechanism in exchange-biased spring-like thin-film composite. ACS Appl. Mater. Interfaces 2020, 12, 39926–39934. [Google Scholar] [CrossRef]
  48. Liu, Q.; Barrón, V.; Torrent, J.; Qin, H.; Yu, Y. The magnetism of micro-sized hematite explained. Phys. Earth Planet. Inter. 2010, 183, 387–397. [Google Scholar] [CrossRef]
  49. Tadic, M.; Kopanja, L.; Panjan, M.; Lazovic, J.; Tadic, B.V.; Stanojevic, B.; Motte, L. Rhombohedron and plate-like hematite (α-Fe2O3) nanoparticles: Synthesis, structure, morphology, magnetic properties and potential biomedical applications for MRI. Mater. Res. Bull. 2021, 133, 111055. [Google Scholar] [CrossRef]
  50. López-Sánchez, J.; Serrano, A.; el Campo, A.; Abuín, M.; Rodríguez de la Fuente, O.; Carmona, N. Sol−gel synthesis and micro-raman characterization of ε-Fe2O3 micro- and nanoparticles. Chem. Mater. 2016, 28, 511–518. [Google Scholar] [CrossRef]
  51. Jubb, A.M.; Allen, H.C. Vibrational spectroscopic characterization of hematite, maghemite, and magnetite thin films produced by vapor deposition. ACS Appl. Mater. Interfaces 2010, 2, 2804–2812. [Google Scholar] [CrossRef]
  52. Kroumova, E.; Aroyo, M.I.; Perez-Mato, J.M.; Kirov, A.; Capillas, C.; Ivantchev, S.; Wondratschek, H. Bilbao Crystallographic Server: Useful databases and tools for phase-transition studies. Phase Transit. 2003, 76, 155–170. [Google Scholar] [CrossRef]
  53. Bersani, D.; Lottici, P.P.; Montenero, A. A micro-Raman investigation of iron oxide films and powders produced by sol–gel syntheses. J. Raman Spectrosc. 1999, 30, 355–360. [Google Scholar] [CrossRef]
  54. Cao, H.; Wang, G.; Zhang, L.; Liang, Y.; Zhang, S.; Zhang, X. Shape and magnetic properties of single-crystalline hematite (α-Fe2O3) nanocrystals. Chem. Phys. Chem. 2006, 7, 1897–1901. [Google Scholar] [CrossRef] [PubMed]
  55. Martin, T.P.; Merlin, R.; Huffman, D.R.; Cardona, M. Resonant two magnon Raman scattering in α-Fe2O3. Solid State Commun. 1977, 22, 565–567. [Google Scholar] [CrossRef]
  56. Owens, F.J.; Orosz, J. Effect of nanosizing on lattice and magnon modes of hematite. Solid State Commun. 2006, 138, 95–98. [Google Scholar] [CrossRef]
  57. Massey, M.J.; Baier, U.; Merlin, R.; Weber, W.H. Effects of pressure and isotopic substitution on the Raman spectrum of α-Fe2O3: Identification of two-magnon scattering. Phys. Rev. B 1990, 41, 7822–7827. [Google Scholar] [CrossRef]
  58. Kumar, P.; Bera, A.; Muthu, D.V.S.; Shirodkar, S.N.; Saha, R.; Shireen, A.; Sundaresan, A.; Waghmare, U.V.; Sood, A.K.; Rao, C.N.R. Coupled phonons, magnetic excitations, and ferroelectricity in AlFeO3: Raman and first-principles studies. Phys. Rev. B Condens. Matter Mater. Phys. 2012, 85, 134449. [Google Scholar] [CrossRef] [Green Version]
  59. Ramírez, M.O.; Kumar, A.; Denev, S.A.; Chu, Y.H.; Seidel, J.; Martin, L.W.; Yang, S.Y.; Rai, R.C.; Xue, X.S.; Ihlefeld, J.F.; et al. Spin-charge-lattice coupling through resonant multimagnon excitations in multiferroic BiFeO3. Appl. Phys. Lett. 2009, 94, 92–95. [Google Scholar] [CrossRef]
  60. Fleury, P.A.; Loudon, R. Scattering of light by one- and two-magnon excitations. Phys. Rev. 1968, 166, 514–530. [Google Scholar] [CrossRef]
  61. Moriya, T. Theory of light scattering by magnetic crystals. J. Phys. Soc. Jpn. 1967, 23, 490–500. [Google Scholar] [CrossRef]
  62. Willes, H.; Weber, R.M. Raman Scattering in Materials Science; Springer Science & Business Media: Berlin/Heidelberg, Germany, 2013. [Google Scholar] [CrossRef]
  63. Suber, L.; Imperatori, P.; Mari, A.; Marchegiani, G.; Mansilla, M.V.; Fiorani, D.; Plunkett, W.R.; Rinaldi, D.; Cannas, C.; Ennas, G.; et al. Thermal hysteresis of Morin transition in hematite particles. Phys. Chem. Chem. Phys. 2010, 12, 6984–6989. [Google Scholar] [CrossRef]
  64. Mukherjee, S.; Garg, A.; Gupta, R. Probing magnetoelastic coupling and structural changes in magnetoelectric gallium ferrite. J. Phys. Condens. Matter 2011, 23, 445403. [Google Scholar] [CrossRef] [PubMed] [Green Version]
  65. Postmus, C.; Ferraro, J.R.; Mitra, S.S. Pressure dependence of infrared eigenfrequencies of KC1 and KBr. Phys. Rev. 1968, 174, 983–987. [Google Scholar] [CrossRef]
  66. Pattanayak, N.; Kumar, J.; Pratim Patra, P.; Kumar, G.V.P.; Bajpai, A. Signatures of spin-phonon coupling in hematite crystallites through dielectric and Raman spectroscopy. EPL (Europhys. Lett.) 2021, 134, 47003. [Google Scholar] [CrossRef]
  67. Donev, E.U.; Lopez, R.; Feldman, L.C.; Haglund, R.F. Confocal Raman microscopy across the metal insulator transition of single vanadium dioxide nanoparticles. Nano Lett. 2009, 9, 702–706. [Google Scholar] [CrossRef] [PubMed]
  68. Zhang, K.; Bao, C.; Gu, Q.; Ren, X.; Zhang, H.; Deng, K.; Wu, Y.; Li, Y.; Feng, J.; Zhou, S. Raman signatures of inversion symmetry breaking and structural phase transition in Type-II Weyl semimetal MoTe2. Nat. Commun. 2016, 7, 3552. [Google Scholar] [CrossRef] [PubMed] [Green Version]
Figure 1. (a) Crystal structure representation of hematite employing the VESTA software. A schematic spin moment visualization of the atoms along [0 0 1] are shown below and above the Morin transition for inspection. (b) XRD pattern of single-phase nanoparticulated hematite coating obtained from a Fe film annealed at 1050 °C on a silica substrate. Main reflection planes are indicated at the maxima accordingly [10].
Coatings 12 00540 g001
Figure 2. (a) Optical micrograph and (b) AFM image acquired from the surface of the nanoparticulated hematite coating. (c) Topographic profile distance of the green straight line in subfigure b. (d) Magnification of the yellow square area indicated in subfigure b. The optical image is displayed in false color. Color scales represent the height differences of the AFM images.
Coatings 12 00540 g002
Figure 3. (a) ZFC–FC curves recorded between 5 and 300 K and (b) ZFC and derivative of ZFC (d(ZFC)) indicating the position of the Morin transition for a nanoparticulated hematite coating. (c) Magnetic hysteresis loops acquired at 50 and 300 K under a maximum applied field of 20 kOe. (d) Slope corrected magnetic hysteresis loop collected at 300 K.
Coatings 12 00540 g003
Figure 4. (a) Heating and (b) cooling thermal evolution of the Raman spectra between 80 and 600 K related to the nanoparticulated hematite coating grown on a silica substrate. Dashed vertical lines are added for clarity and the indexation of the respective modes. In addition, a magnification of the two-magnon region is shown at the right of the Figure a and b, respectively. The Raman spectrum recorded at 600 K is the same for the heating and cooling evolutions.
Coatings 12 00540 g004
Figure 5. Heating (red color) and cooling (blue color) curves of the Raman shift positions between 80 and 600 K related to the modes: (a) A1g(1), (b) Eg(5), (c) disorder Eu, (d) overtone Eu, (e) one-magnon, and (f) two-magnon mode of the nanoparticulated hematite coating. The black symbol represents the returning temperature (600 K).
Coatings 12 00540 g005
Figure 6. Heating (red color) and cooling (blue color) curves of the relative intensity between 80 and 600 K related to the modes (a) disorder Eu, (b) one-magnon, and (c) two-magnon mode, with respect to the mode A1g(1). The black symbol represents the returning temperature (600 K).
Coatings 12 00540 g006
Table 1. Hematite Raman modes calculated from Lorentzian fits corresponding to the Raman spectrum acquired at 80 K (in the heating process, Figure 4a) for the nanoparticulated hematite coating.
ModesRaman Shift (cm−1)ModesRaman Shift (cm−1)
A1g(1)231.64(4)Eg(5)621.69(2)
Eg(1)250.66(2)Disorder Eu678.62(1)
Eg(2) + Eg(3)299.04(3)One-magnon835.06(9)
Eg(4)420.04(1)Overtone Eu1337.62(1)
A1g(2)508.13(2)Two-magnon1597.23(9)
Publisher’s Note: MDPI stays neutral with regard to jurisdictional claims in published maps and institutional affiliations.

