Article

Layer by Layer Optimization of Langmuir–Blodgett Films for Surface Acoustic Wave (SAW) Based Sensors for Volatile Organic Compounds (VOC) Detection

by
Ivan D. Avramov
1,† and
George R. Ivanov
2,*
1
Georgi Nadjakov Institute of Solid State Physics, Bulgarian Academy of Sciences, 1072 Sofia, Bulgaria
2
University Lab “Nanoscience and Nanotechnology”, Civil Engineering and Geodesy, University of Architecture, 1046 Sofia, Bulgaria
*
Author to whom correspondence should be addressed.
Deceased.
Coatings 2022, 12(5), 669; https://doi.org/10.3390/coatings12050669
Submission received: 3 April 2022 / Revised: 6 May 2022 / Accepted: 12 May 2022 / Published: 13 May 2022
(This article belongs to the Special Issue Thick and Thin Films for Functional Device Applications)

Abstract

:
Rayleigh surface acoustic wave (RSAW)-based resonant sensors, functionalized with single and multiple monomolecular layers of Langmuir–Blodgett (LB) films, were thickness and density optimized for the detection of volatile organic compounds (VOC), which could impose a serious threat on the environment and human health. Single layers of a phospholipid (SLP), hexane dissolved arachidic acid (HDAA), and chloroform dissolved arachidic acid (CDAA) were used for the LB film preparation. Several layers of these compounds were deposited on top of each other onto the active surface of high-Q 434 MHz two-port RSAW resonators in a LB trough to prepare a highly sensitive vapor detection quartz surface microbalance (QSM). Frequency shift was measured with a vector network analyzer (VNA). These devices were probed with saturated vapors of hexane, chloroform, methanol, acetone, ethanol, and water after each deposited layer to test the behavior of the QSM’s insertion loss, loaded Q, vapor sensitivity, and to find the optimum trade-off between these parameters for the best real-life sensor performance. With 2200 ppm and 3700 ppm sensitivity to chloroform, HDAA and CDAA coated QSM devices reached the optimum sensor performance at 15 and 11–15 monolayers, respectively. Surface pressure optimized single monolayers of phospholipid LB films were found to provide up to 530 ppm sensitivity to chloroform vapors with a negligible reduction in loss and loaded Q. This vapor sensitivity is higher than the mass of the sensing layer itself, making SLP films an excellent choice for QSM functionalization.

1. Introduction

Many volatile organic compounds (VOCs) are human-made liquid chemicals used in the manufacturing process of paints, pharmaceuticals, and refrigerants [1]. They have extensive applications as industrial solvents, fuel oxygenates, cleaning agents, hydraulic fluids, paint thinners, and often appear as by-products from the chlorination of drinking water. When released in the environment, VOCs can cause serious damage to human health, animals, insects, and plants, and often contaminate drinking water reservoirs [1,2]. Their indoor concentration is significantly higher than outdoors, which makes their monitoring important, especially in hospitals and industrial facilities. With regard to this, the category “very volatile organic compounds” has also been highlighted [3]. These chemicals have a boiling point range from <0 to 50–100 °C, and among them are methanol, ethanol, and n-hexane, which were also tested in this paper. VOCs are often present in human breath and can be used as biomarkers to diagnose several diseases including lung cancer [4,5]. Other applications requiring low-concentration VOC measurements are fruit freshness tests [6] and the detection of warfare gases and explosives [7]. All of these factors require the development of accurate, fast, sensitive, and selective systems for the detection, monitoring, and measurements of VOCs.
According to [1], any organic compound that has a boiling point less than or equal to 250 deg. C at room temperature and standard atmospheric pressure of 101.3 kPa is considered as a VOC. Furthermore, VOCs are inert, highly dilute and volatile, and their sticking affinity to various types of surfaces is low, which makes their detection quite problematic. Currently, the most precise and commonly used VOC detection methods are gas chromatography [8], frequently used in combination with mass spectroscopy (MS) [9]. Some modifications of these techniques such as the addition of a time-of-flight analyzer, selected ion flow tube-MS, proton transfer reaction, and ion-molecule reaction-MS further enhance their performance [5]. These techniques are very reliable and provide highly accurate data. However, they use very expensive equipment, need trained personnel, feature a long processing time, and are mainly limited to laboratory conditions. An alternative approach that can be utilized for field measurements and real-time monitoring is the electronic nose (e-nose) approach, which uses an array of sensors, each specific to a given gas [5,10,11]. These sensors typically use optical, electric [11], and gravimetric transduction techniques [12]. The gravimetric method, also the subject of this paper, is typically realized with acoustic wave based transducers using various bulk acoustic wave (BAW) and surface acoustic wave (SAW) modes as well as mechanical vibration modes. Typical representatives of these three types of gravimetric sensors are the BAW-based quartz crystal microbalance (QCM), the film-bulk acoustic resonator (FBAR), SAW-based delay lines, filters and resonators, and micro electro-mechanical system (MEMS) devices such as cantilevers [12]. All of these transducers are mass sensitive. Any mass attached to their active surface results in a change in the acoustic or mechanical wave propagation velocity, causing a measurable group delay and phase change, accordingly. These mass proportional phase changes can be precisely measured either directly, by means of a vector network analyzer (VNA), or using a simple feedback loop oscillator circuit stabilized with an acoustic or mechanical transducer where a phase shift results in a mass proportional frequency change that can be easily measured at a high resolution using a simple frequency counter [13].
An integral part of the mass sensor is the sensing layer, which is firmly attached to the transducer and is responsible for capturing a certain amount of mass of the chemical or biological substance of interest. On one hand, the sensing layer determines the affinity of the measured substance to the sensor’s surface, thus providing the desired mass sensitivity and selectivity. On the other hand, it also determines the sensor’s limit of detection (LOD) [13]. Commonly used sensing layer materials are metal oxide nanostructures; carbon nanotubes and nanohybrids; pristine polymers and molecularly imprinted polymers as well as supramolecular structures [14,15]. The sensitivity and reproducibility of the sensor parameters rely on a well-controlled monolayer deposition and a smooth and uniform sensor layer surface. Usually, the more uniform the surface layer, the higher its sensitivity [14,15]. Dip or sputter-coating and evaporation methods do not provide sensing layers of sufficiently high quality. Alternatively, self-assembly and layer-by-layer deposition techniques do produce quality films. In this respect, the degree of control provided by the Langmuir–Blodgett (LB) deposition method is unmatched [16], which is why we also used it in the current study.
In this work, the well-known and easily accessible arachidic acid (AA) was used for the first time in combination with a QSM as a sensing LB layer for the detection of VOCs. The solvent influence on the layer selectivity and sensitivity was tested by using chloroform or n-hexane for the AA solution. We called these solutions the hexane dissolved arachidic acid (HDAA) and chloroform dissolved arachidic acid (CDAA). We also tested single monolayers of a fluorescently labeled phospholipid (SLP) DPPE-NBD that forms 3D aggregates [17] and thus a surface with a high surface-to-volume ratio, high sensitivity, and fast response time is created [18]. We present the optimization and performance of a VOC detection sensor using a SAW-based two-port resonator as a highly sensitive QSM whose active sensing area had been functionalized with the above CDAA, HDAA, or SLP materials using the LB deposition method. We show that after careful density and thickness optimization, these LB layers demonstrated a high affinity to certain VOCs and were much less sensitive to others including water. This suggests a certain degree of selectivity. Finally, we show that the suggested sensors can respond to a larger vapor mass than the mass of the functionalizing films themselves.

2. Materials and Methods

2.1. Preparation of the SLP, HDAA, and CDAA LB Films

All substances used here for the LB film preparation have long hydrophobic, hydrocarbon tails (C20 or C16). When chloroform and n-hexane are used as solvents, these tails keep the LB film well-confined to the water surface. They are known to create some of the most sensitive surfaces for VOC detection and testing to date [19]. Earlier work suggests that AA LB films for VOC detection are stabilized with double valent counter ions. This allows for the deposition of up to 200-layer thick LB films [20,21,22]. In our case, we deposited the AA from pure water and in the liquid phase, below the phase transition to solid phase. This provides a higher mobility and flexibility of the molecules and is necessary if the layers are to be used as matrix molecule films. Additionally, pure AA LB films are more stable over time [23].
The fluorescently labeled phospholipid for the SLP was dipalmitoyl phosphatidyl ethanolamine head labeled with nitrobenzoxadiazole (DPPE-NBD) purchased from Avanti Polar Lipids (USA) in a 1 mg/mL chloroform solution. For the AA films, we used the fatty acid compound arachidic acid (C19-COOH), (Sigma-Aldrich, Germany). Both chemicals were of more than 99% purity. AA was dissolved in n-hexane or chloroform for the HDAA and CDAA films, respectively. All solvents used in this work were also of pro analysis quality with over 99% purity. The LB film deposition was carried out in a HEPA air-filtered laboratory at a room temperature of 22 °C. Ultra-pure Type I water used as a subphase in the experiments was filtered with 11 filters connected in series including two activated charcoal filters, three reverse osmosis columns (Aquachim, Bulgaria), a deionizing column (Boeco, Germany), and a 0.1 µm end filter. The water resistance was measured as 18.2 MΩ and no noticeable surface-active contamination was observed. After spreading of the LB solution on the air–water interface, at least 25 min was allowed for the solvent to evaporate, as shown by Brewster angle microscopy [17].

2.2. Deposition of the LB Films

In the LB film deposition process, a single monolayer of biphylic water insoluble molecules is spread at the air–water interface of a LB trough [16]. After the solvent evaporation is complete, a compression of the monolayers starts and the 2D phase diagram of the substance is recorded. At every point of the phase diagram, compression can be terminated and the hydrophilic substrate to be coated (the QSM in this case) is withdrawn vertically at a constant speed until a quality monolayer of the LB substance builds up onto its surface (Figure 1). Each layer has the same thickness if the deposition conditions are kept constant, as was our case [16]. The process can also be repeated with substrate insertion and withdrawal from the air–water interface. In this case, a bilayer is deposited. For the SLP device, this process is performed only once. The reason for this is the well-known fact that quality phospholipid LB films can be deposited only as single layers. Subsequent coating of the same SLP layer on top of the first one is no longer stable and peels off [24]. After each monolayer (or bilayer) deposition, the coated device is evaluated by recording its frequency and the group delay responses using a VNA and its sensitivity to saturated vapors of chloroform, hexane, methanol, acetone, ethanol, and water is measured.
Finally, for the HDAA and CDAA devices, the coating and testing process is repeated until the desired number of bilayers is deposited onto the QSM.
A symmetrical compression barrier trough made of a single piece of polytetrafluorethylene (Advanced Technologies Ltd., Sofia, Bulgaria) was used in our LB deposition experiments [25]. In order to avoid leaks, the hydrophilic polyoxymethylene material was used for the barrier fabrication. Monolayer compression was performed at a very slow speed of 0.04 cm2/s. In all cases, hydrophilic substrates were used and the first layer was deposited on the upstroke. Substrate withdrawal for the SLP film was performed at velocities of 0.02 mm/s. For the AA LB films, a withdrawal velocity between 0.02 and 0.1 mm/s was used as it produces the highest quality films [20].
The SAW resonators used as QSM devices were mounted and wire bonded to a surface mount device (SMD) package with the lid left open for the coating, as shown in Figure 2a. The structure of the SAW resonator device and connection to the VNA is shown in Figure 2b. The isotherm of the DPPE-NBD at room temperature is characterized by an almost horizontal region of the liquid–solid phase coexistence starting at 6.1 mN/m at 22 °C [26]. For the SLP film deposition on the SAW resonators, two surface pressures were used: Π = 3.8 mN/m and mean area per molecule A = 0.593 nm2/molecule in the liquid phase region; and Π = 35 mN/m and A = 0.371 nm2/molecule in the solid phase region. These pressures were chosen because they were around the middle of the liquid or solid phase region and provided us with information on the properties of the LB molecule in both phases. A liquid to solid phase transition at 25.6 mN/m characterized the AA isotherm on pure water at room temperatures [27]. We tried deposition at 35 mN/m, but the film was not stable and collapsed over time. HDAA and CDAA LB films were deposited in the liquid phase at Π = 22 mN/m, just below the phase transition, and A = 0.21 nm2/molecule. At this surface pressure, the film stability at the air–water interface was very good. Lower deposition pressure will produce even more stable films but with lower sensitivity to VOCs (data not shown) due to the lower density of the molecules. The substrates were cleaned just before deposition by rinsing with ethanol and chloroform or with a plasma cleaner model PDC-32G-2 (Harrick Plasma, USA). The QSM devices were also exposed to air plasma treatment for 15 min at 18 W not only for cleaning, but also to make their surface more hydrophilic.

2.3. VOC Vapor Test Setup

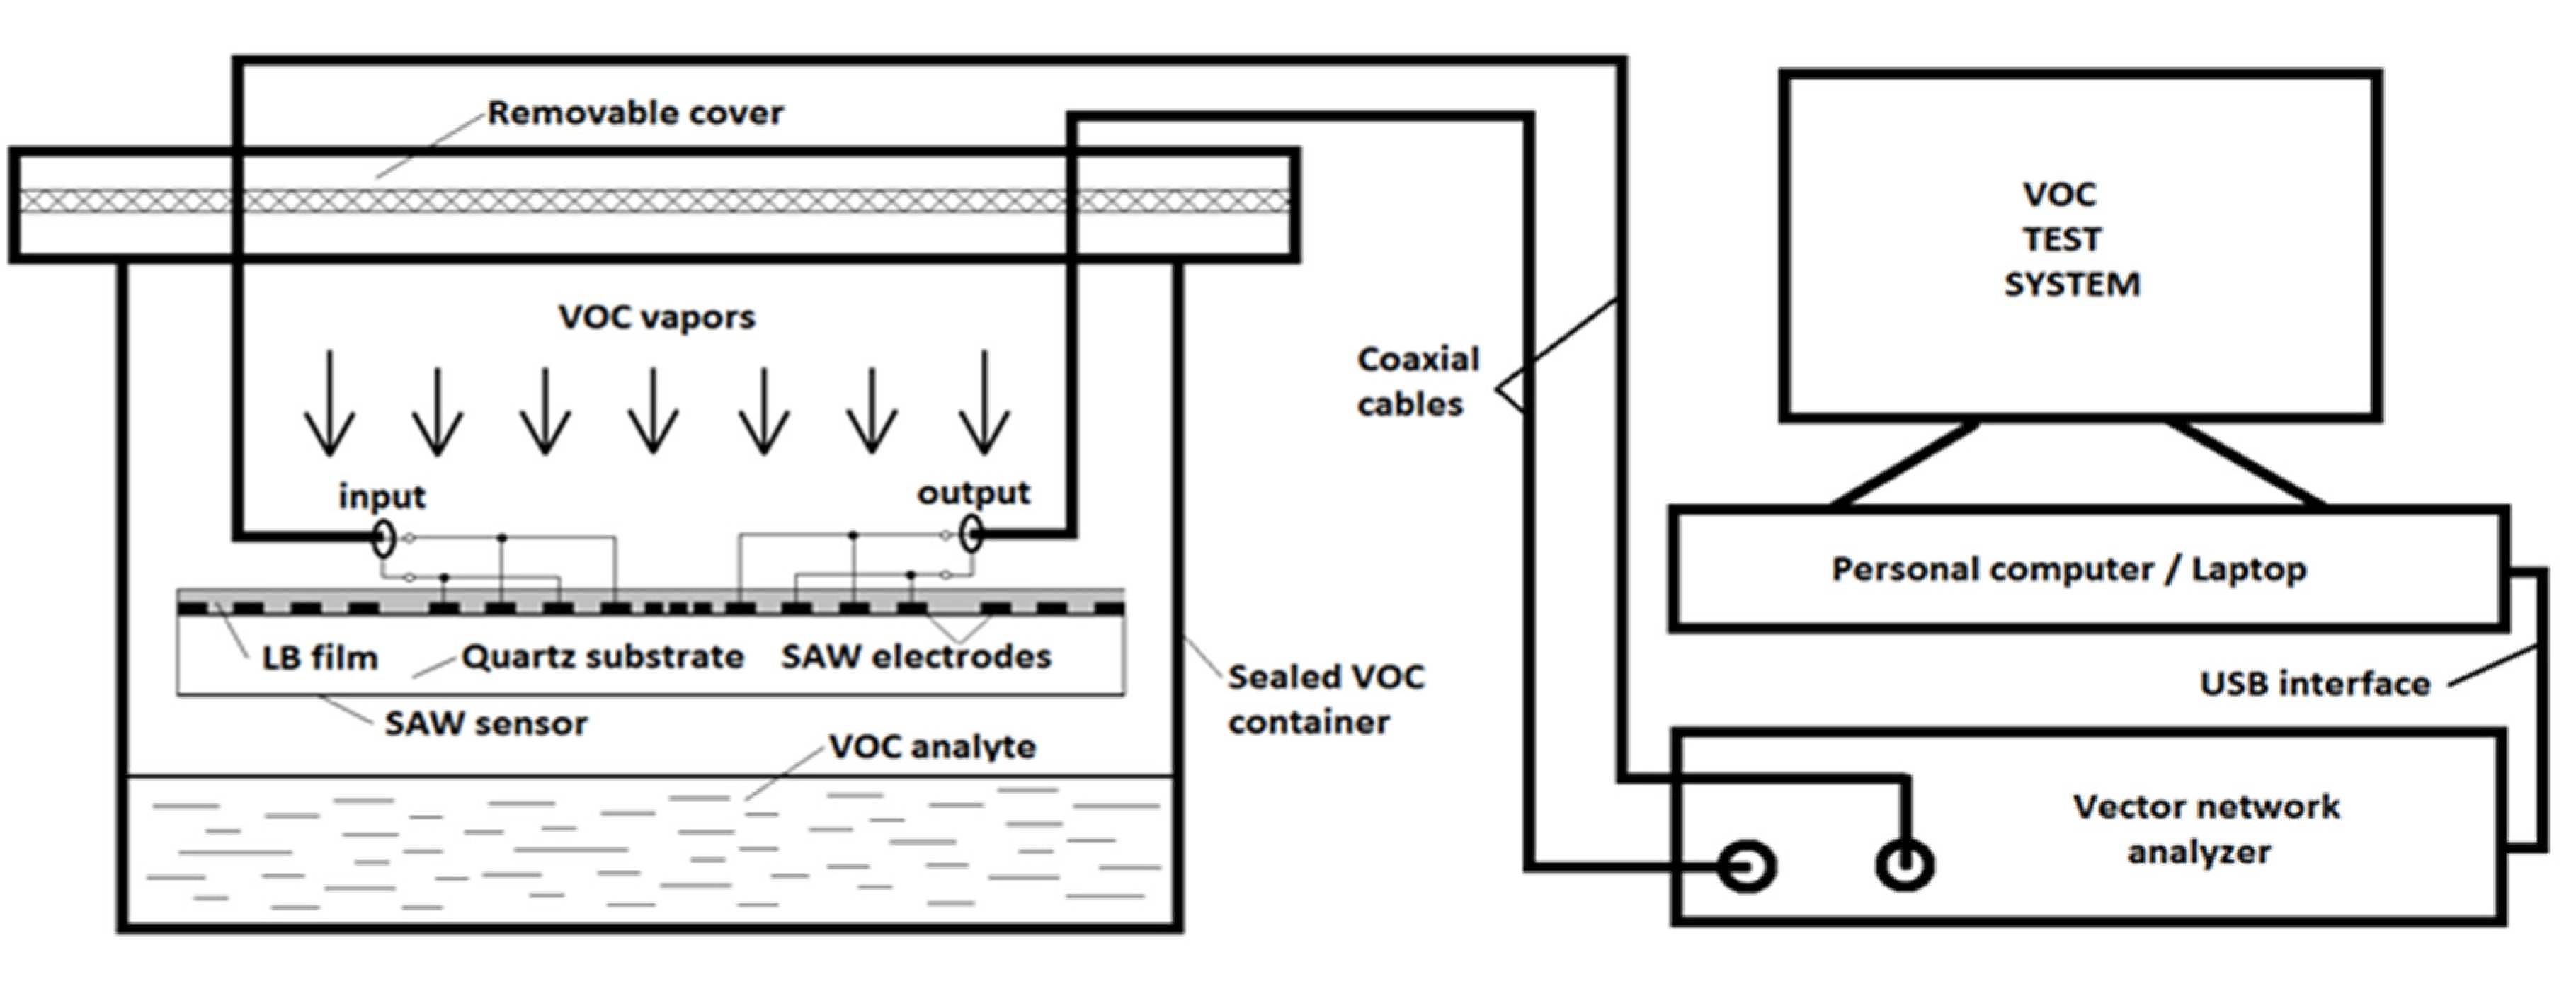
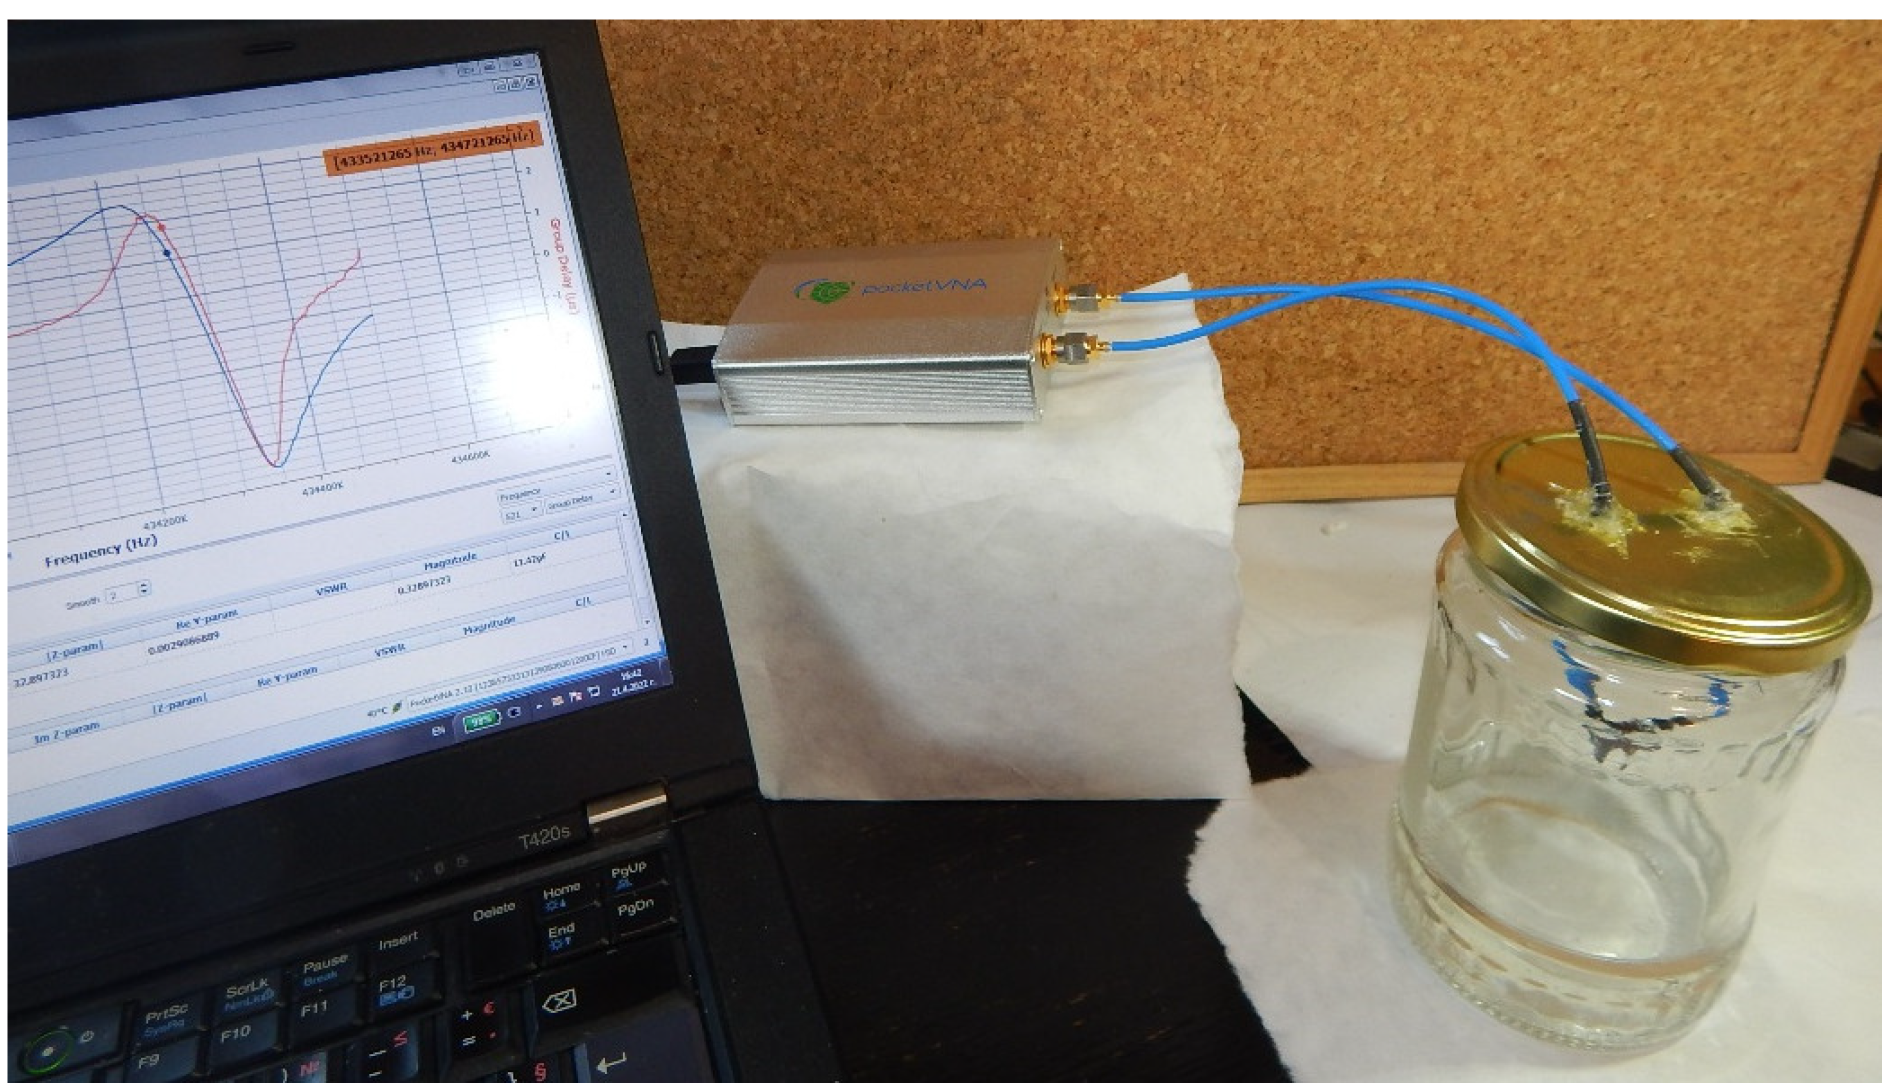
The gas probing setup schematic is shown in Figure 3 and an image is shown in Figure 4. The coated QSM was placed in a hermetically sealed container with some liquid-phase VOCs inside. Typically less than 1 min of time is enough for the saturated vapor pressure to settle down until the thermodynamic equilibrium of the saturated VOC vapors is reached inside the container. The return to the baseline frequency can also be achieved within seconds with some exceptions (chloroform) where several percent from the frequency shift required a longer time for recovery. From the VOC exposure to subsequent VOC exposure to the same gas, the results were very reproducible. Some aging over time (months scale) for the AA LB films was noticed, as previously described [23]. The QSM’s frequency and group delay responses were recorded prior to and after placing the sensor inside the container. The difference in resonance frequency between these two readings was the VOC vapor mass sensitivity and the difference in loaded Q, and the insertion loss showed how the vapor load affected the electrical QSM performance. A laptop controlled VNA (PocketVNA, Rohrdorf, Germany) connected to the QSM via semi-rigid coaxial cables through the container lid was used to record the measurement data.

2.4. The Quartz Surface Microbalance (QSM) Device

Several years ago, a Rayleigh SAW mode (RSAW) device was developed that has established itself as a highly mass-sensitive gravimetric sensor suitable for various types of gas phase sensors [28]. Since this device is the high-frequency equivalent of the classical quartz crystal microbalance (QCM) invented by Sauerbrey back in 1959 [29], we called it the quartz surface microbalance (QSM). Both microbalances use the resonance principle on thermally compensated rotated Y-cuts of quartz, which provides strong interaction of the acoustic wave with the sensed media; however, they feature a few basic differences. The QCM can operate in water-based solutions while with the QSM, this is problematic. On the other hand, the QSM provides more than a 4000 times higher relative (independent of device frequency) mass sensitivity, and a 3000 times lower limit of detection (LOD) and is much better suited for applications in which the QCM does not provide sufficient sensitivity [30]. Thus, the QCM and QSM perfectly complement each other in a variety of sensor systems.
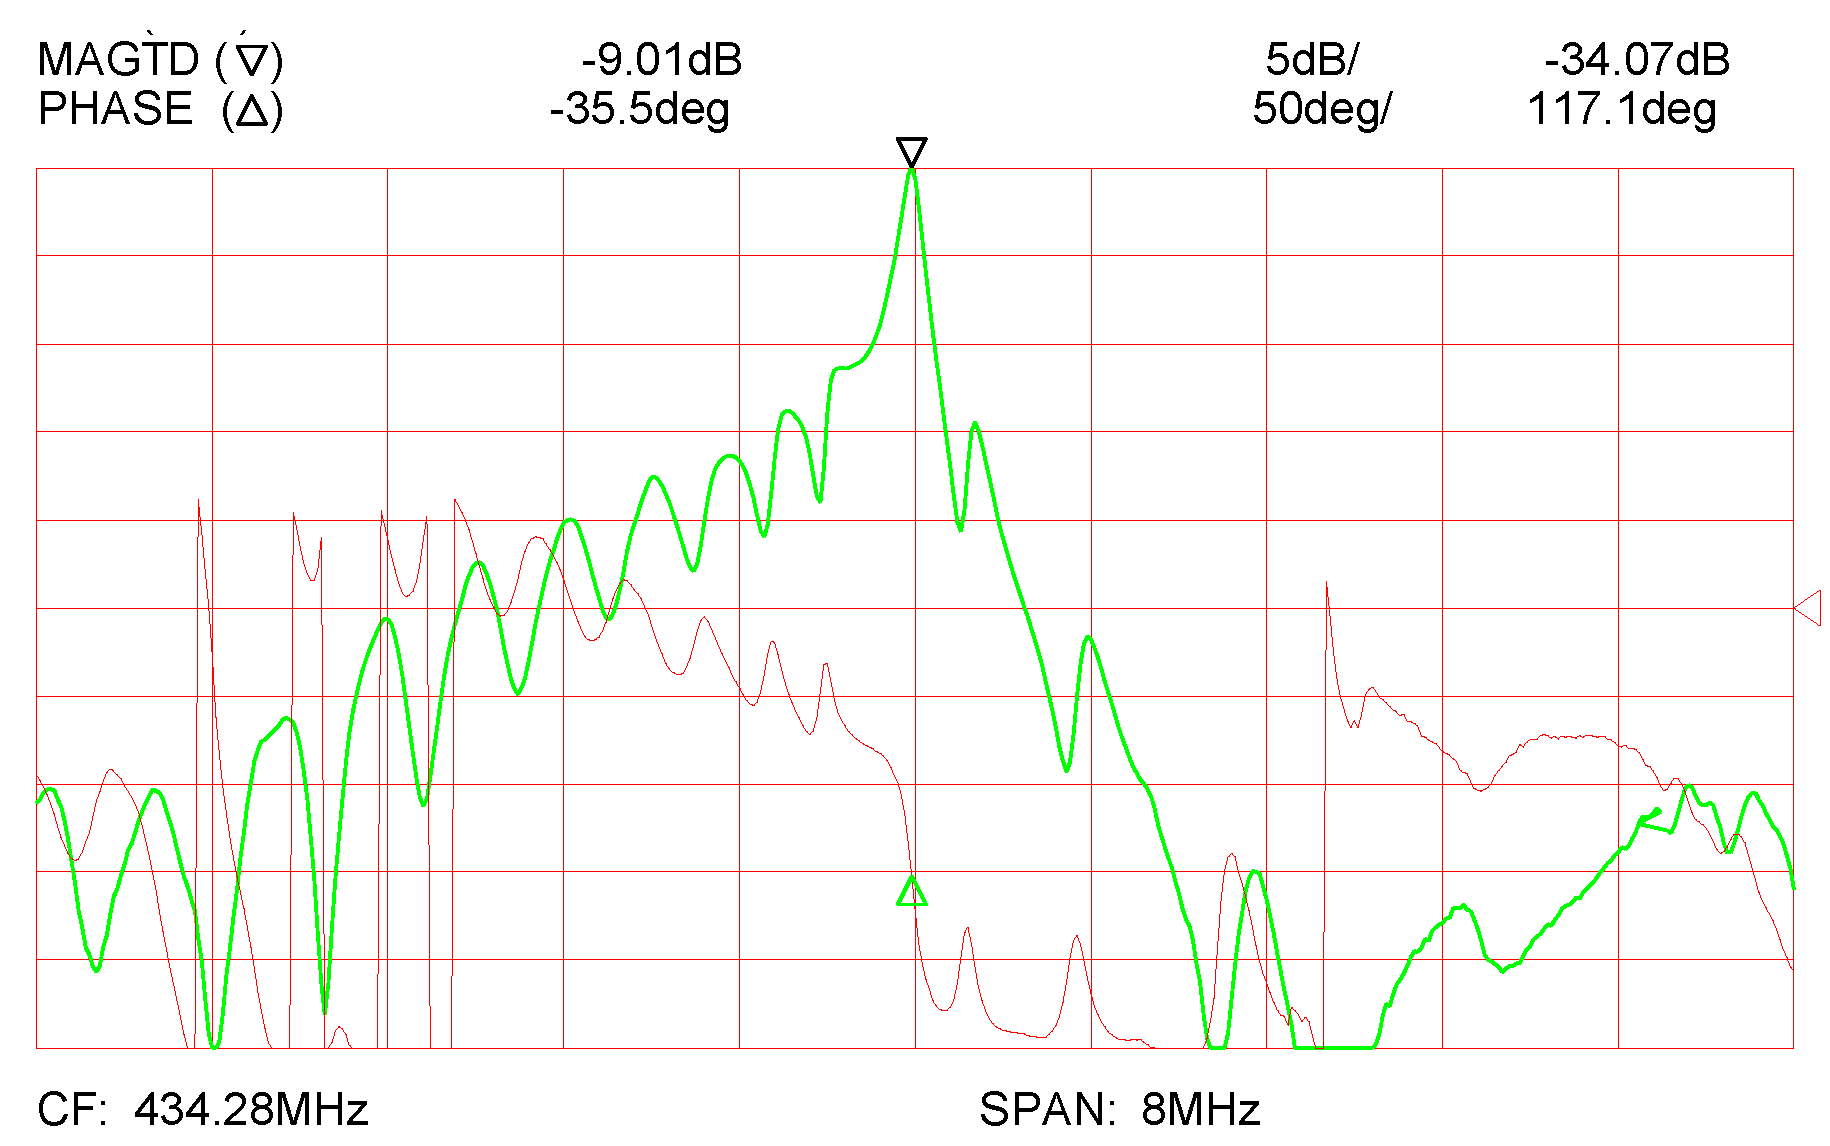
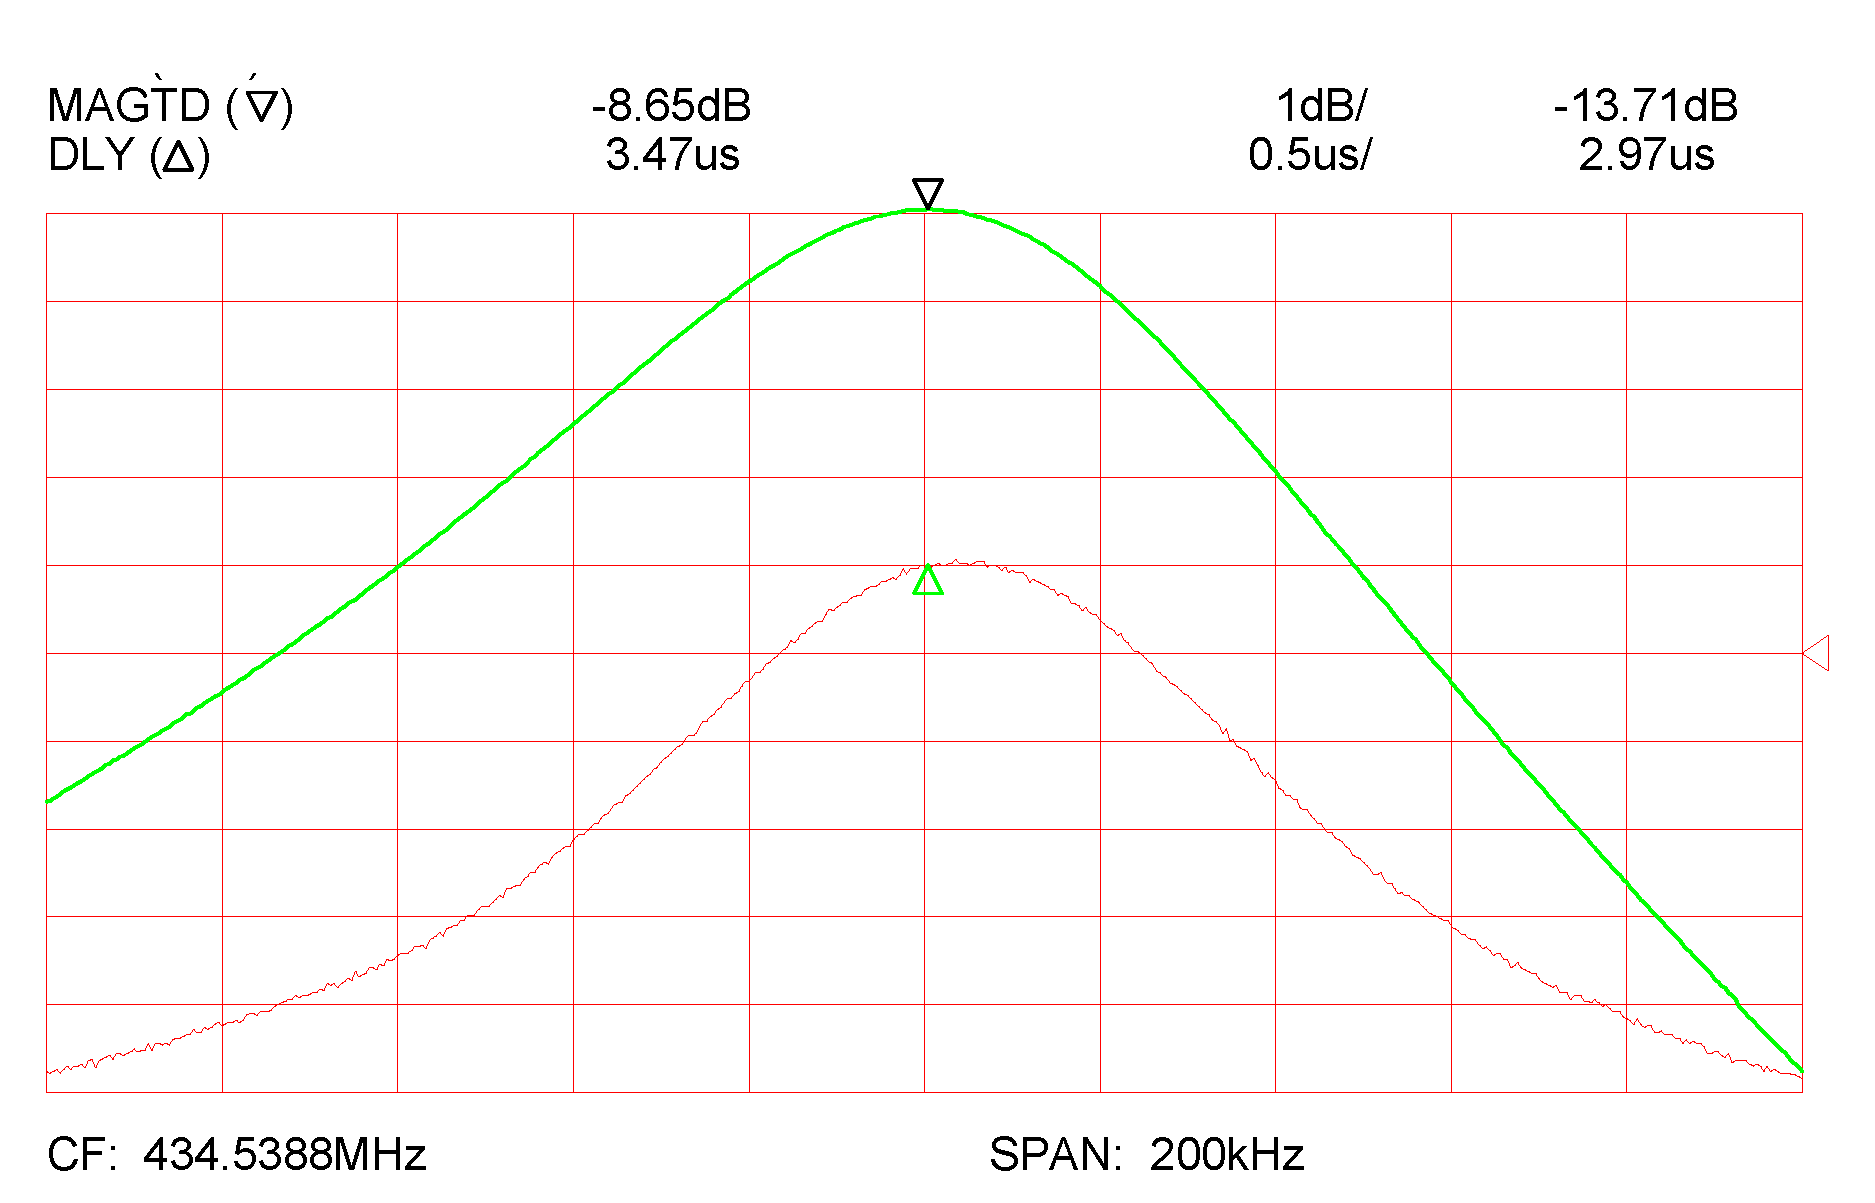
The QSM used in this study was a 434 MHz two-port resonator (TPR) with a gold electrode structure, which makes it corrosion proof when submerged in water such as in LB troughs as well as aggressive chemical mixtures that can attack the electrode structure [28]. Its broadband frequency and phase responses are shown in Figure 5 while Figure 6 shows the narrowband frequency and group delay responses.
The main reasons as to why we decided to use the TPR from Figure 5 and Figure 6 in this study is because of its low insertion loss (less than 9 dB, see Figure 6), its excellent thermal stability, which is within 10 ppm over a thermal span of ±20 K at room temperature (not shown here), and its very high loaded Q-factor, which is the key to obtaining a low LOD. As shown in [31], when connected to a sensor oscillator circuit, such a TPR can provide a short-term stability of a few parts in 10exp(−10)/s, which results in LOD levels in the pg and even fg range [32]. According to [33], the loaded Q of the device from Figure 5 can be calculated from its narrowband group delay reading τg, measured with a VNA (Anritsu MS 620J, Japan), as shown in Figure 5. With τg = 3.47 µs at the resonance frequency fo = 434.539 MHz and using the formula [33]:
QL = π fo τg
we calculate QL as 4737.

2.5. Mass Calibration of the QSM Device

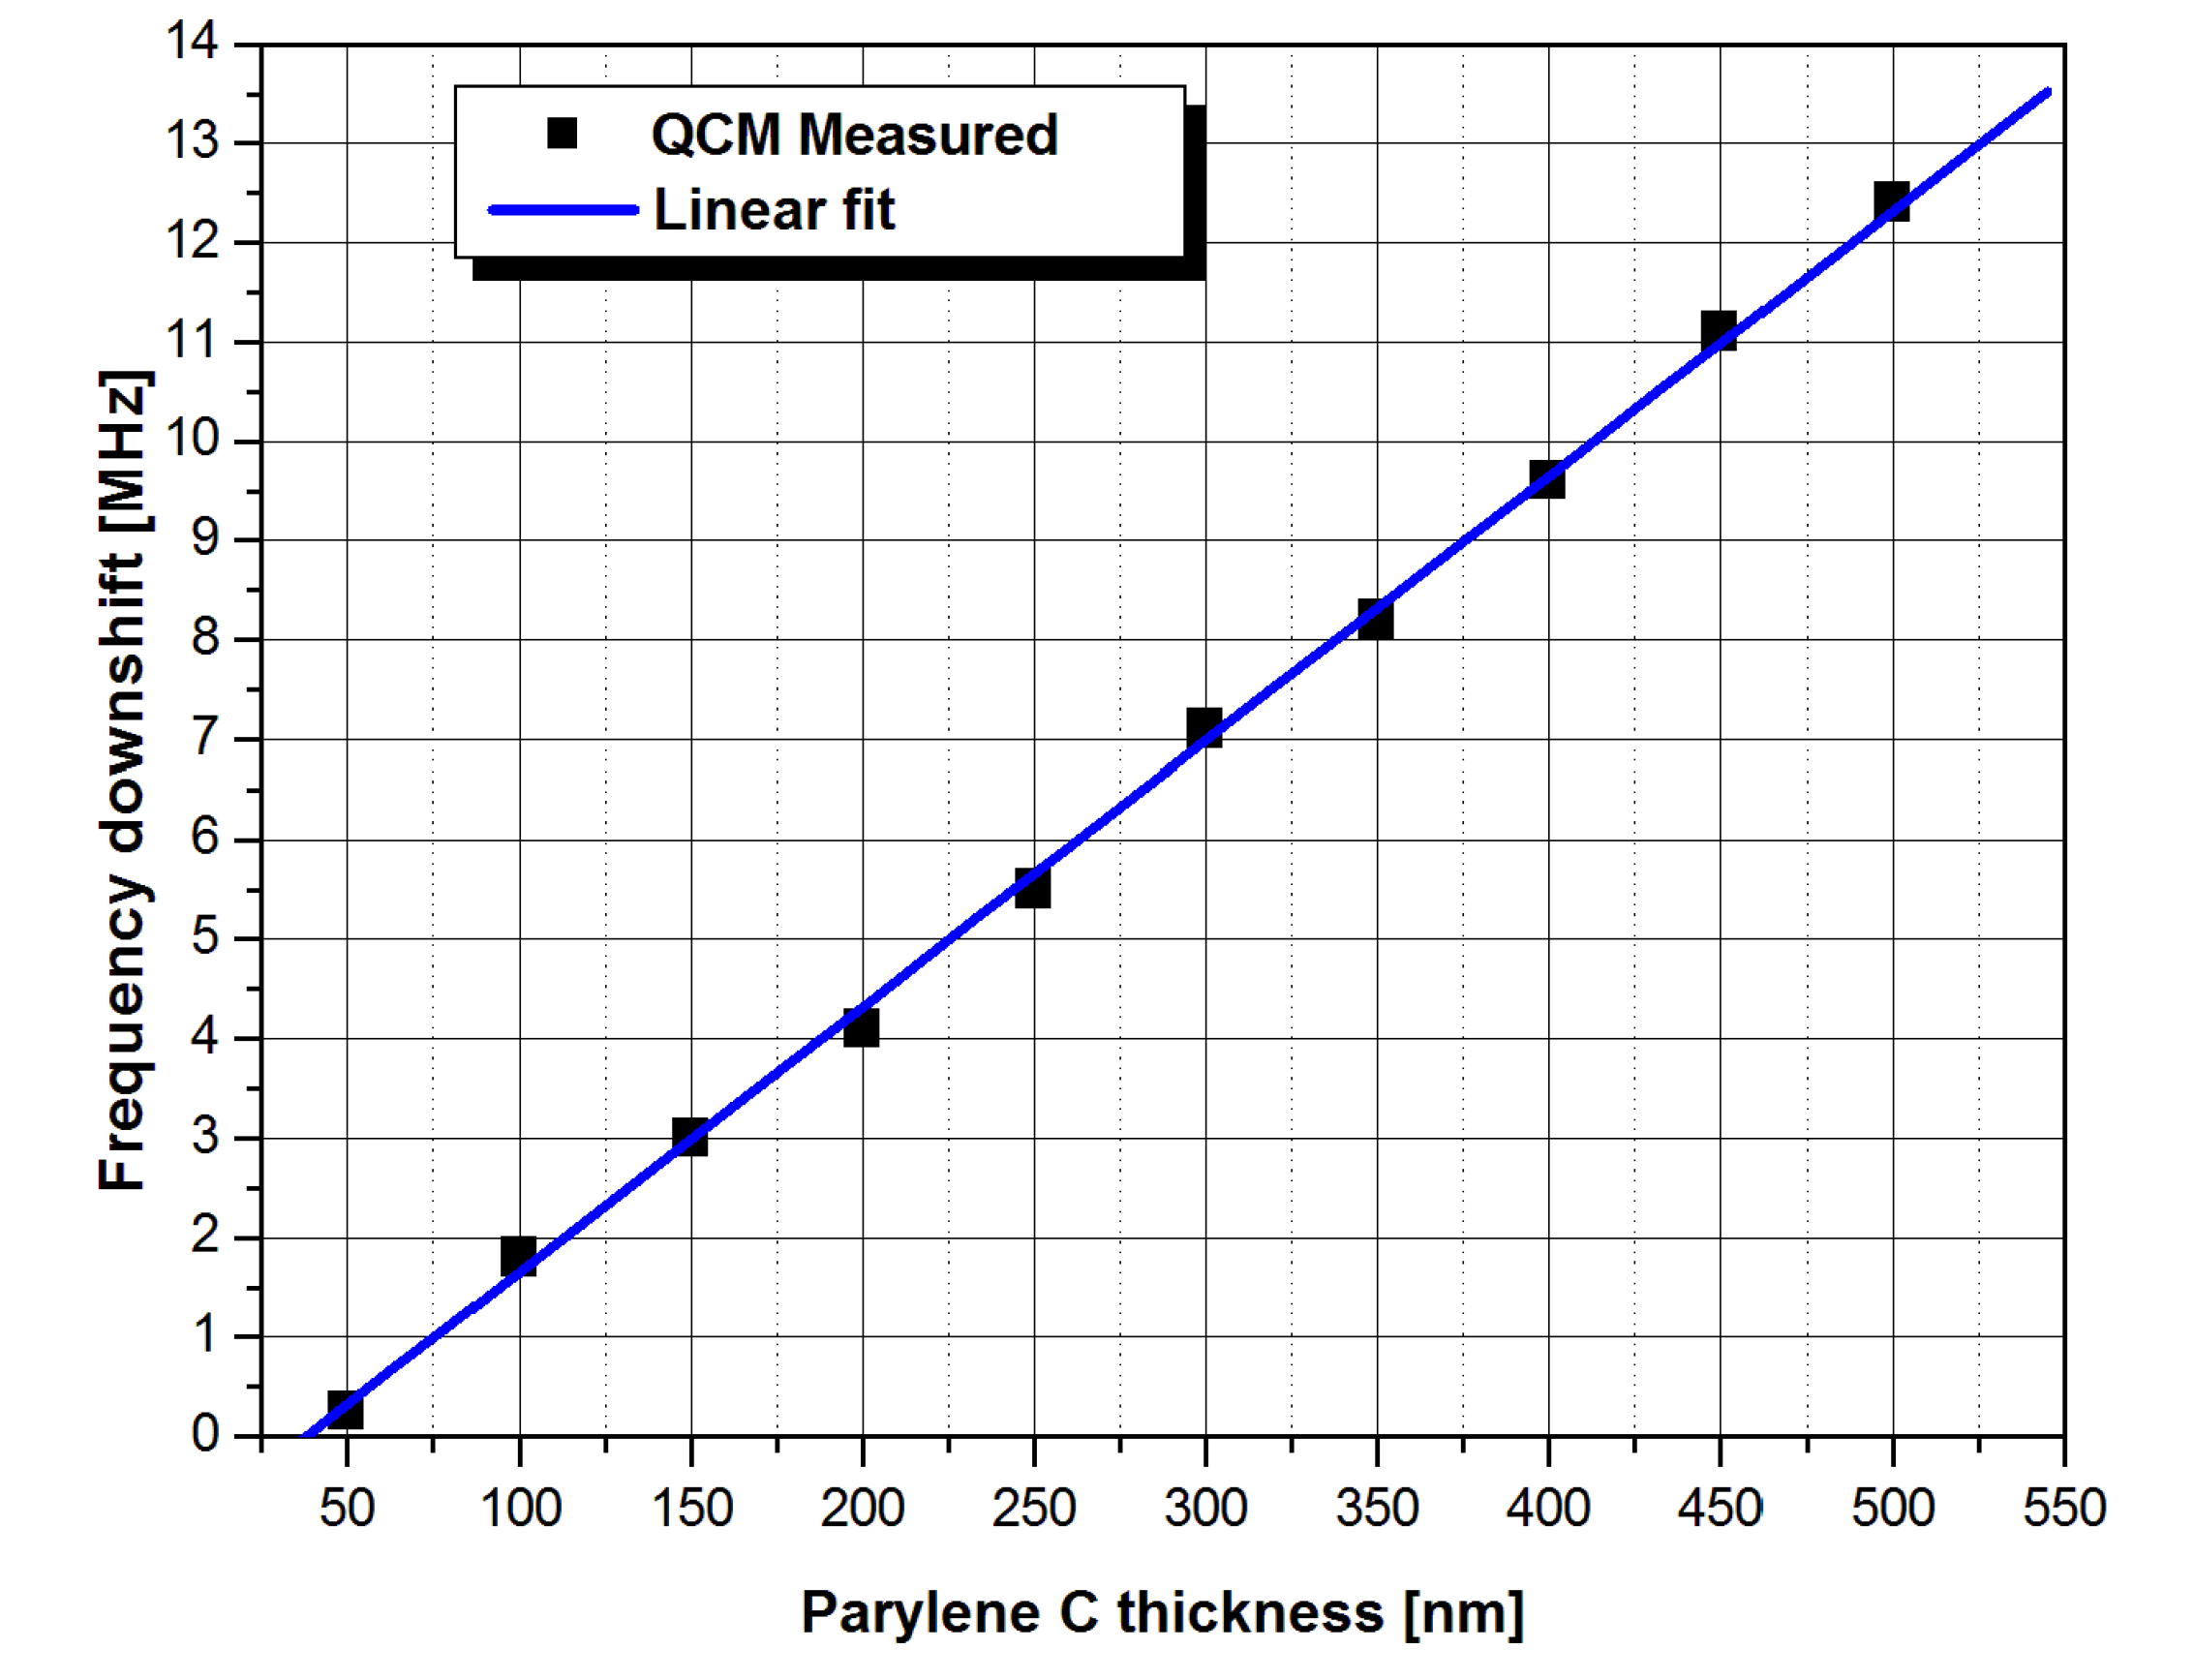
In order to obtain accurate readings for the mass deposited on the surface of the QSM, it first needs to be mass calibrated. This is conducted by depositing a thin uniform layer of a substance with a known density ρ whose thickness was precisely measured by a classical QCM used as a thickness meter in the process of deposition. In this case, we used a polymer called Parylene C with ρ = 1.289 g/cm3 deposited at room temperature in a well-controlled coating process using a plasma enhanced chemical vapor deposition (PECVD) reactor [30]. The mass calibration curve obtained in this way is shown in Figure 7. It is linear and its slope is the thickness sensitivity factor Ts = 25 kHz/nm. From this value, the mass sensitivity Ms of the QSM is derived by using the following relationship [30]:
Ms = Ts (ρ D W h)
Here, D = (fo)(λ/2) is the penetration depth of the acoustic wave into the reflectors, equal to the distance between the left and right effective centers of reflection. These two centers confine the entire amount of the SAW energy in the QSM’s center area where the maximum surface deformation and interaction with the measurand occurs. As shown in [30], Δ is measured as the frequency distance between the resonance and the first longitudinal mode on the left of it and λ = 7 µm is the acoustic wavelength for the QSM device from Figure 5. After coating this device with several layers of CDAA to produce a real-life sensor, we measured Δ as 0.667 MHz. With W = 595 µm being the acoustic aperture and h = 1 nm being the unity film thickness according to Equation (2), we calculated Ms = 43.5 kHz/ng.

2.6. Performance Degradation of the QSM Device with LB Film Coating

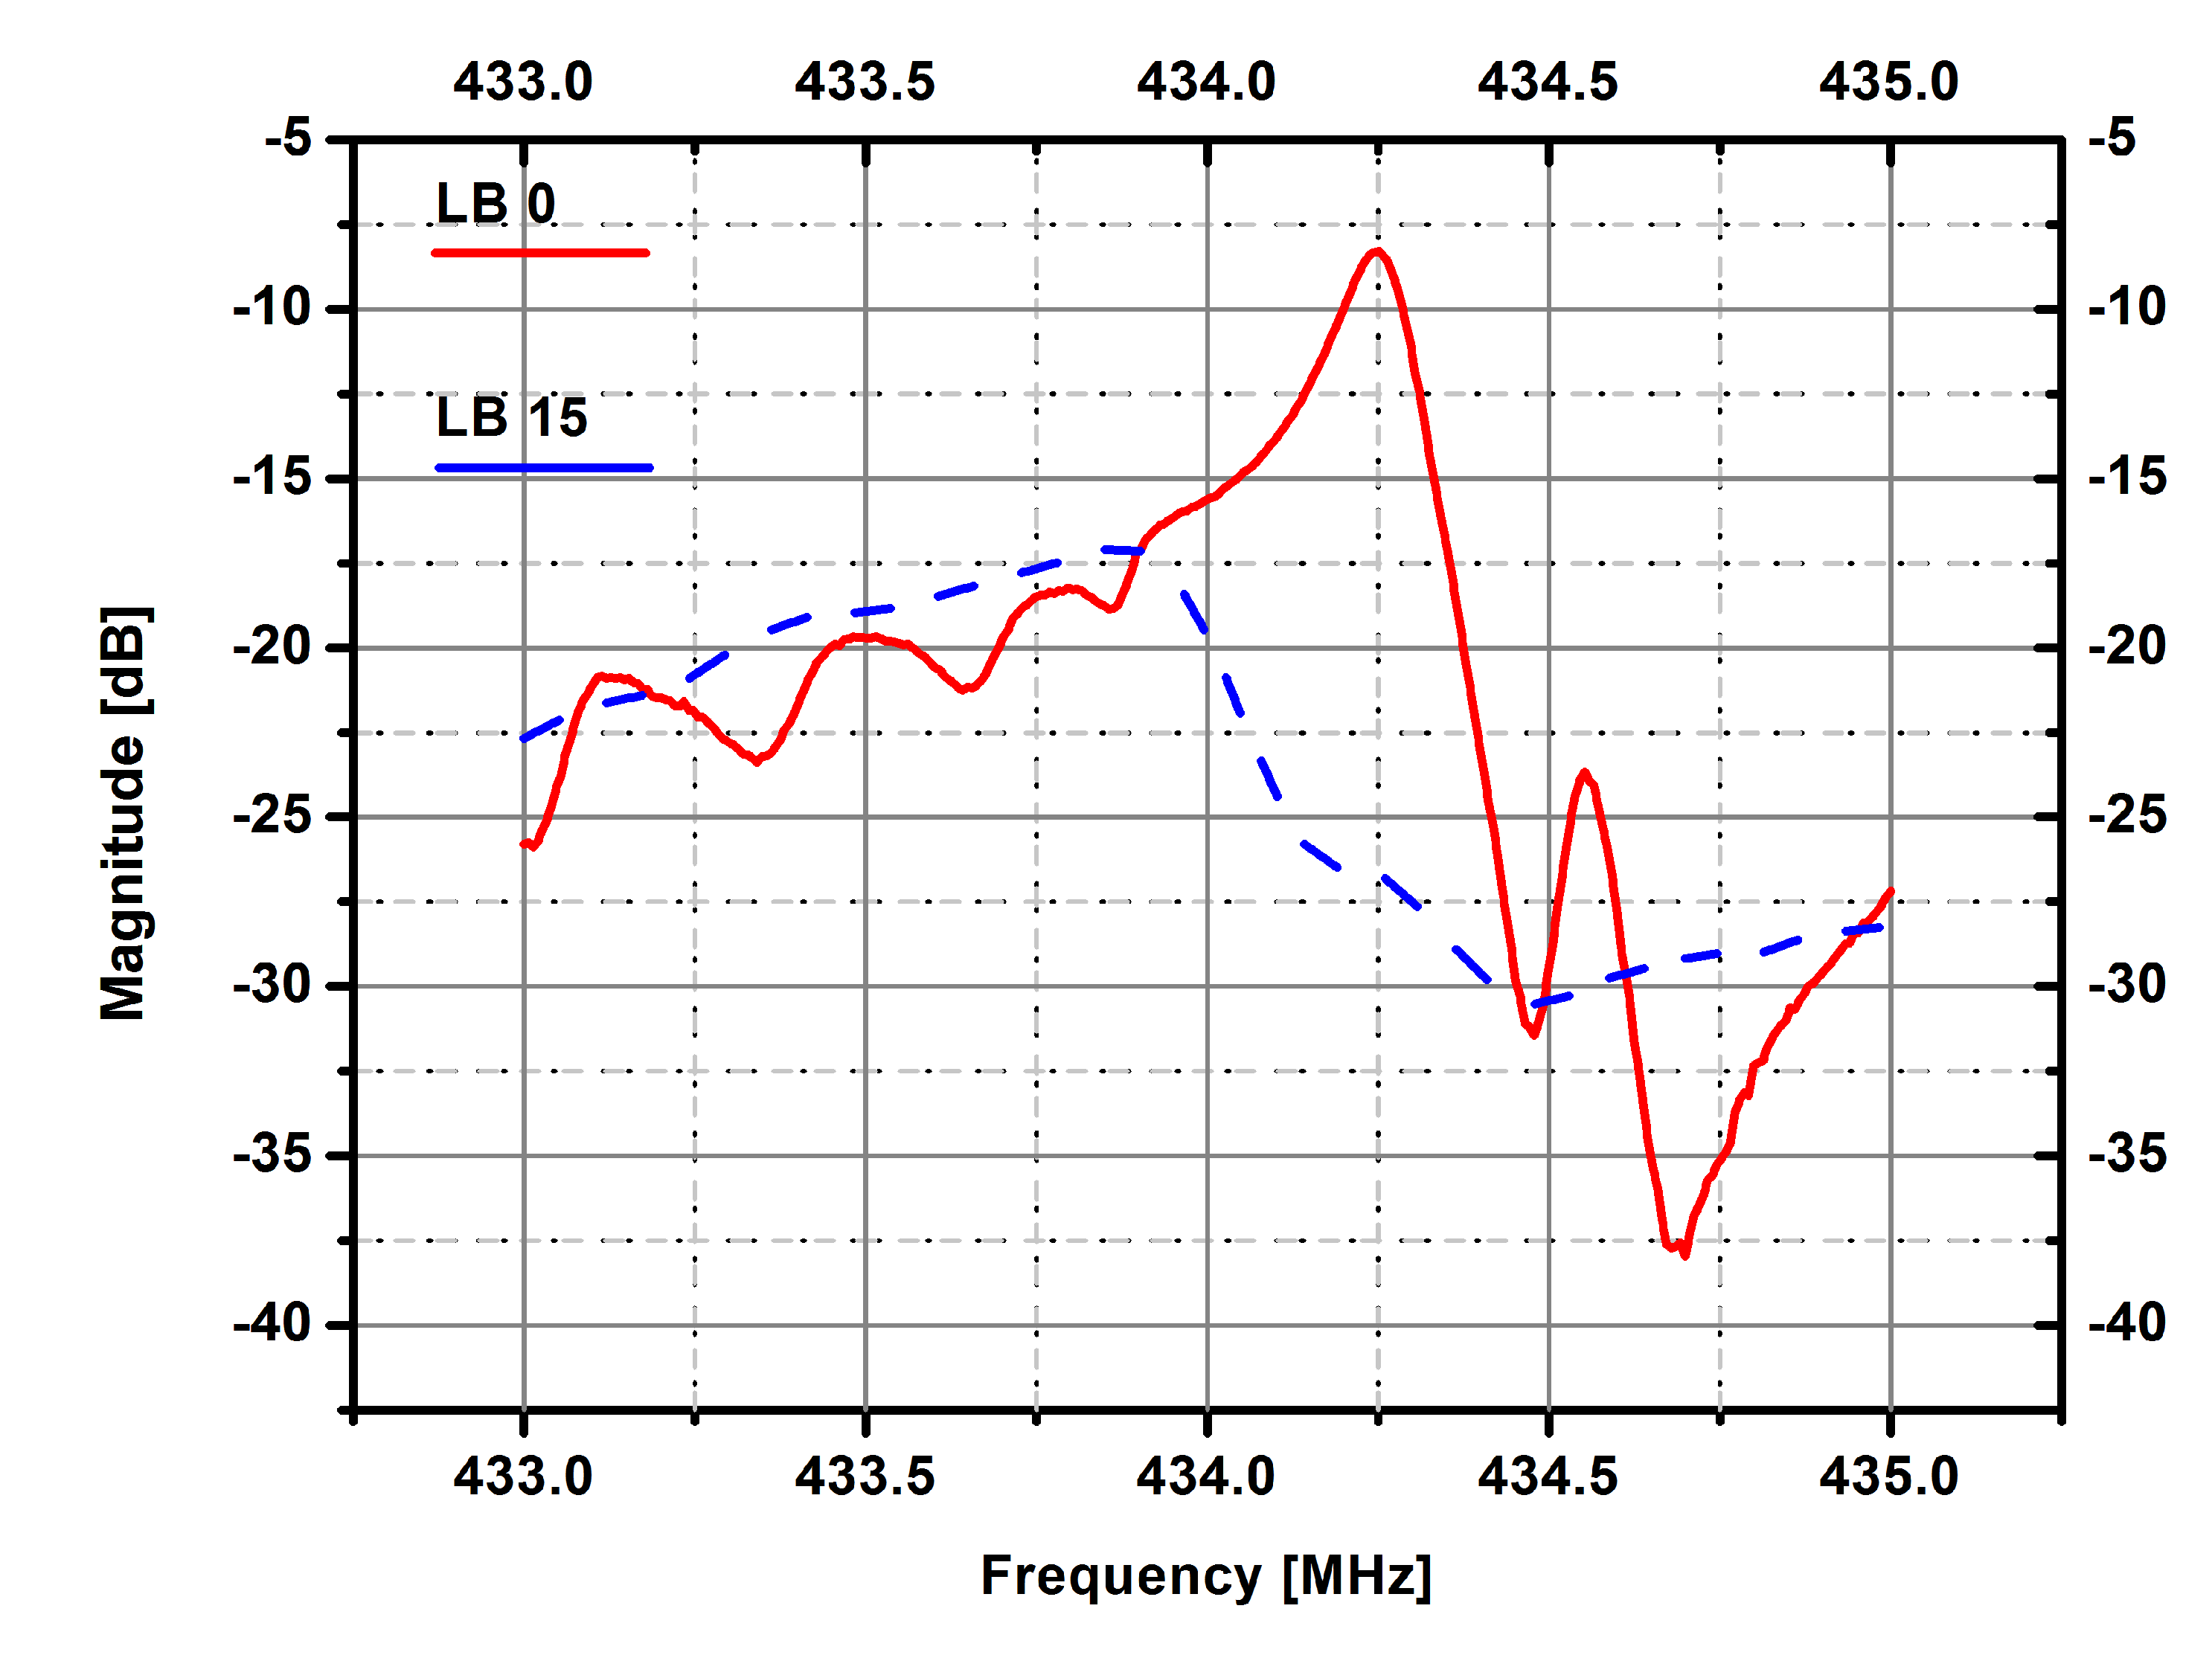
Every mass load deposited onto the surface of a QSM device affects not only the SAW propagation velocity but also degrades the device loaded Q and increases its insertion loss. This effect is illustrated in Figure 8 by comparing the electrical characteristics of an uncoated device with the same one after coating with 15 layers of CDAA. As a result of the coating, the insertion loss increased by about 9 dB—from 8.7 dB uncoated to 18 dB coated. The loaded Q also decreased by a factor of 4—from 4700 to less than 1200. Since the close-to-carrier phase noise of a SAW oscillator depends on (QL)3 [34], if the coated with 15-layers device from Figure 8 is used to stabilize a sensor SAW oscillator, we will have to accept a noise and LOD degradation by a factor of 64 (18 dB), which is quite significant for practical sensor systems. Another effect of the CDAA coating is that the layers seem to increase the reflection coefficient along the reflectors, which results in a reduced penetration depth and smaller active surface area (see Section 2.5). This effect is not very significant, but it may affect the mass sensitivity as shown by Equation (2). Finally, if the LB-film load becomes too heavy, the QSM may stop working as a resonant device, which will turn it into a very mediocre sensor with unpredictable performance. All these circumstances raise the question: what is the maximum number of LB monolayers that a QSM device can accept before seriously degrading its electrical and sensor performance? For the single monolayer SLP device, this question is not relevant. In our experience, this device was found to tolerate single LB monolayers so well that a loss and Q degradation were barely measurable with the VNA available, while its mass sensitivity to VOC vapors was excellent. In our opinion, the SLP coated QSM device performance is close to the perfect gas sensor that is ideally suited for the detection and measurement of very low concentrations of VOC because of its very high Q. As far as layer-by-layer coated CDAA and HDAA QSMs are concerned, we will try to find the answer to the above question in the Results section. Based on the above considerations, however, we assumed that a LB coated QSM device retains its usability as a gas sensor if its loaded Q-factor stays above or is equal to 1000, regardless of its mass sensitivity.

3. Results and Discussion

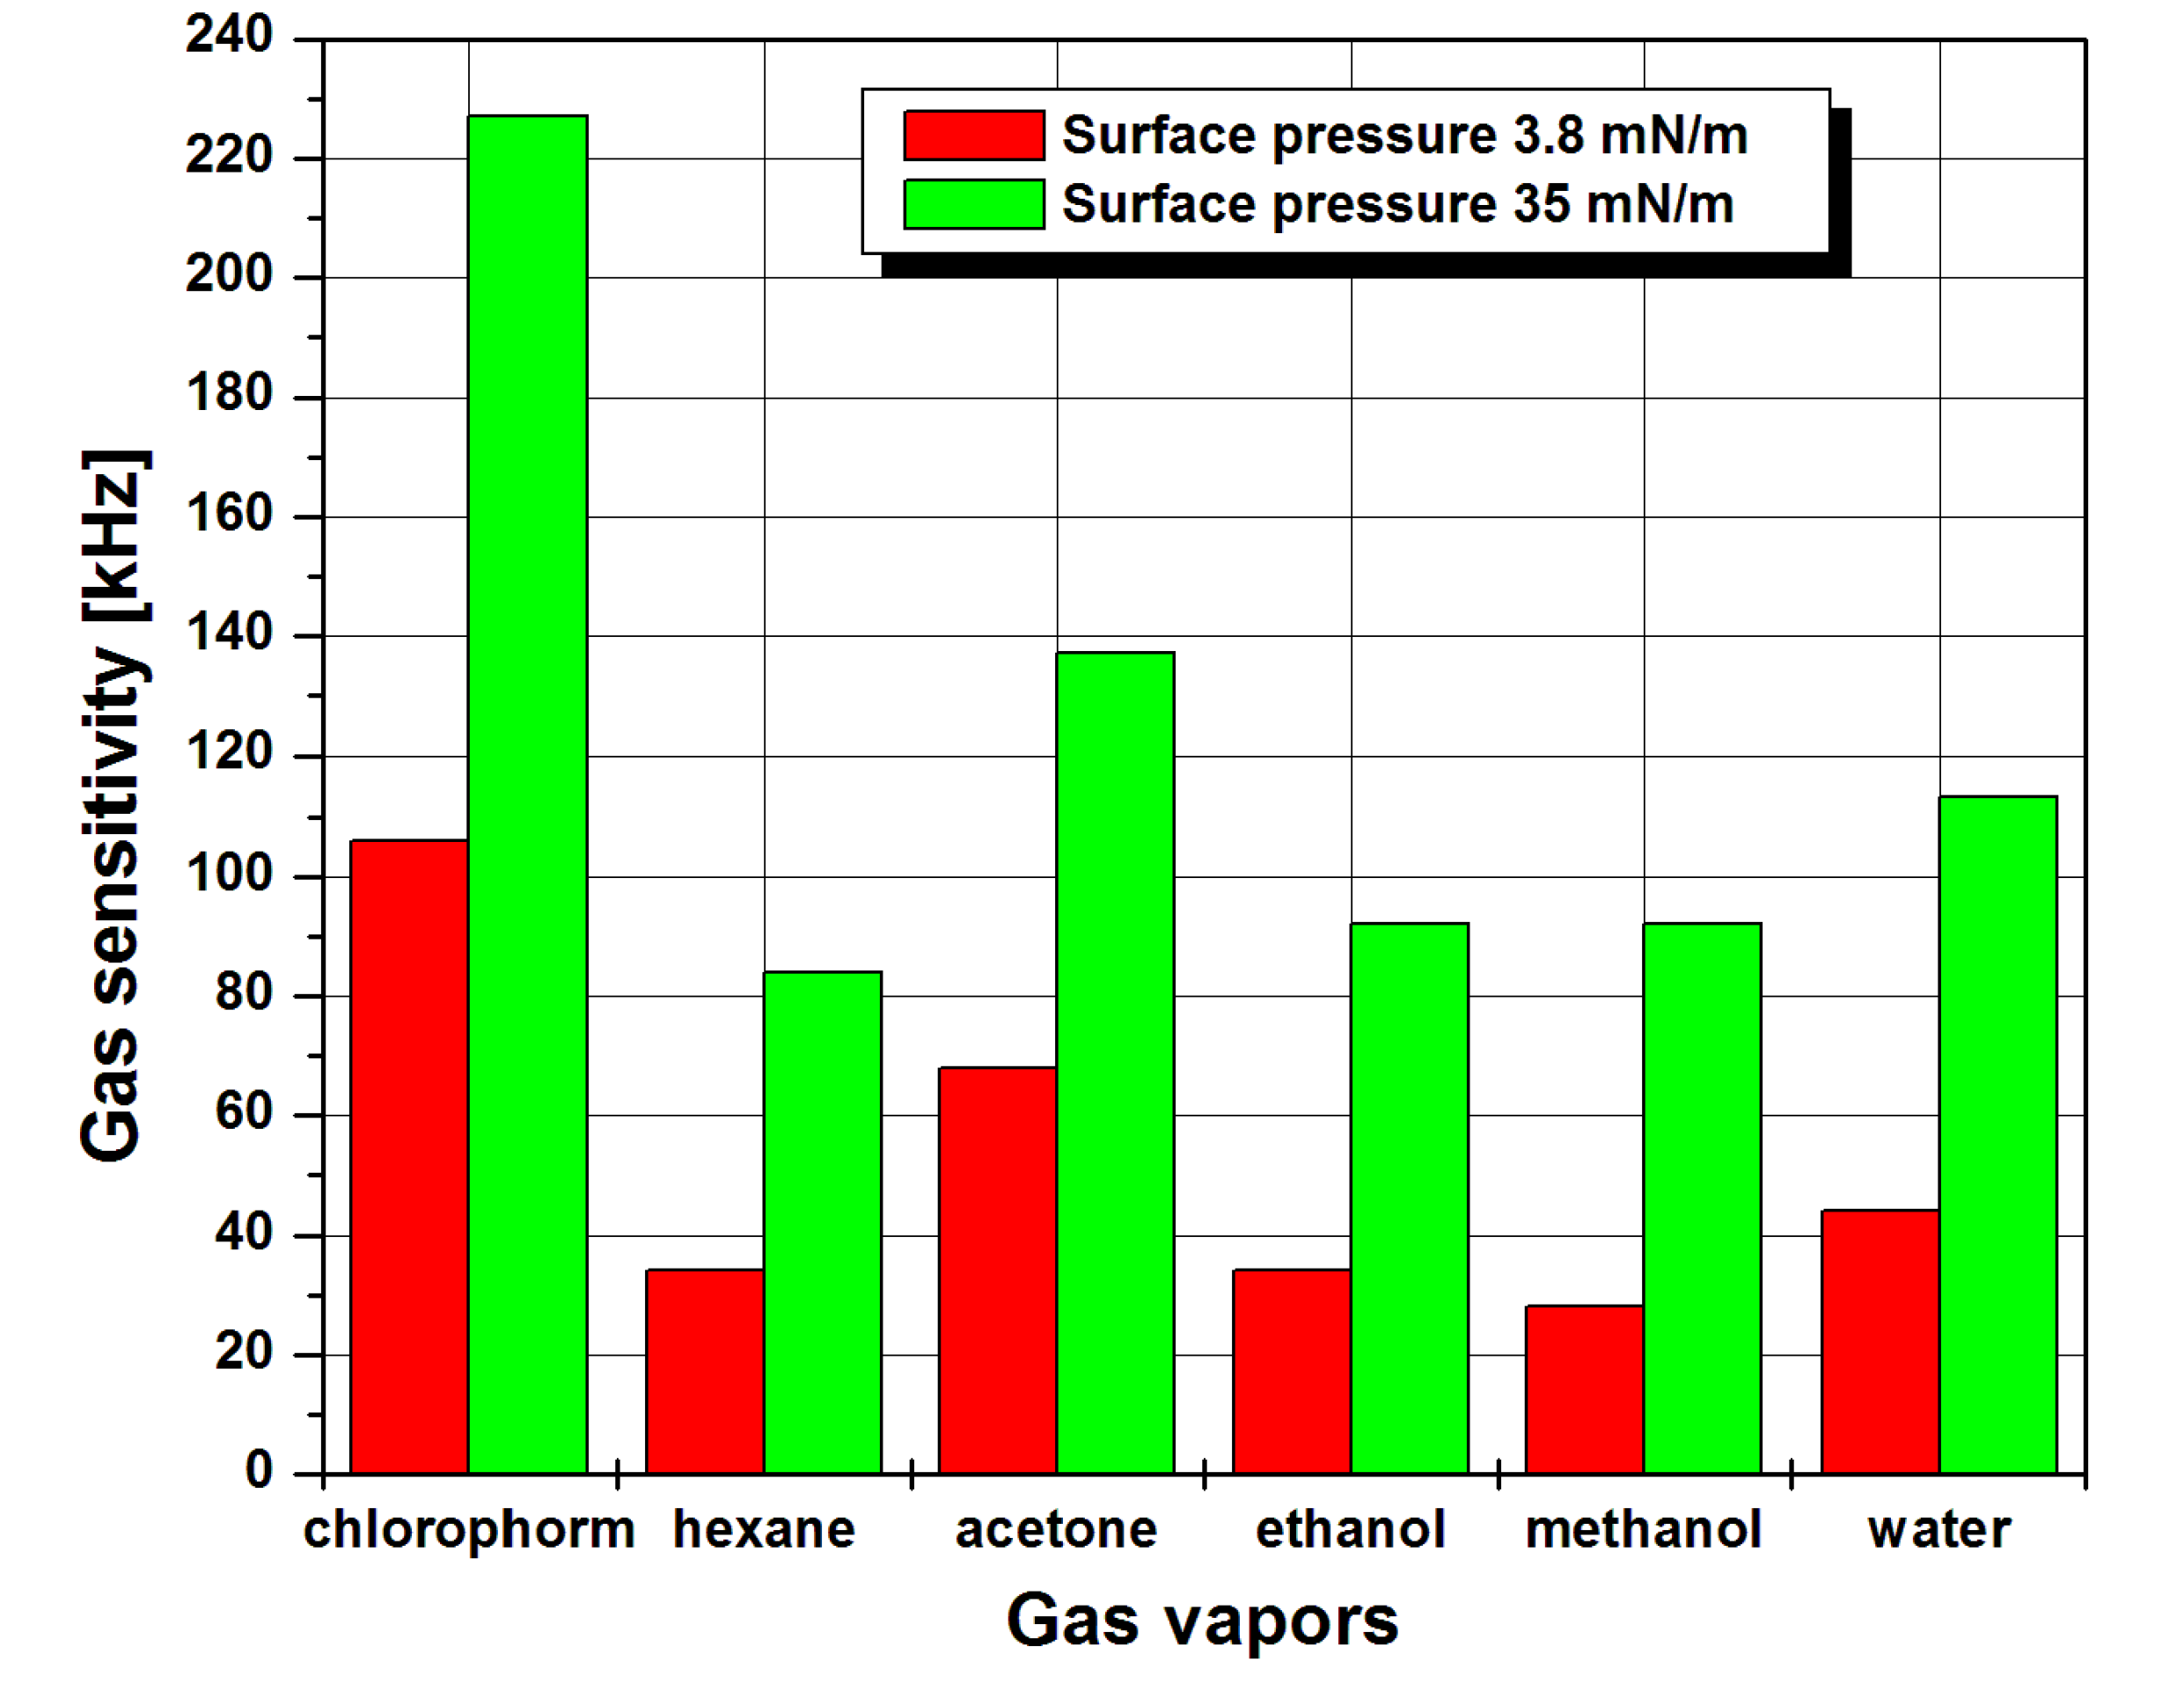
The influence of the DPPE-NBD LB-film surface pressure on the mass sensitivity of the SLP device to the 5 VOCs tested is shown in Figure 9. It is clearly evident that the surface pressure, responsible for the density of the LB molecules and the film quality on the QSM, provides up to twice as high a mass sensitivity at 35 mN/m compared to the much lower 3.8 mN/m value. This suggests that careful surface pressure optimization is required for the maximum mass sensitivity, which reached 230 kHz (530 ppm) for chloroform with this surface pressure optimized device. We found that the frequency downshift after the monolayer deposition was less than 200 kHz, suggesting that the mass of the sensing DPPE-NBD monolayer was less than the amount of chloroform mass it could absorb. Such a phenomenon is rarely observed with gravimetric gas sensors and is further proof of the potential of SLP coated QSM devices for sensor applications. For comparison, classical 10 MHz QCM devices had around only a 40 Hz shift (4 ppm) for a 40 layer AA LB film for VOCs of similar concentration [20].
The mass loading sensitivities of the layer-by-layer LB film coated CDAA and HDAA sensors versus the number of monolayers is shown in Figure 10. The CDAA coated devices seemed to be twice as mass sensitive as the HDAA ones. We expected the data plots in Figure 10 to follow a linear dependence, as implied by Figure 7. However, we found that a second-order polynomial fit was closer to the reality. An even stronger nonlinearity is also evident in Figure 11, demonstrating an exponential behavior of the frequency shift and loaded Q with the CDAA coated device. We explained this nonlinear behavior with the fact that LB layers do not just cause regular linear mass loading such as Parylene C does, but they also decrease the penetration depth and active surface area, as explained in Section 2.6. Both effects, the second of which is nonlinear, oppose each other and cause the observed nonlinearity.
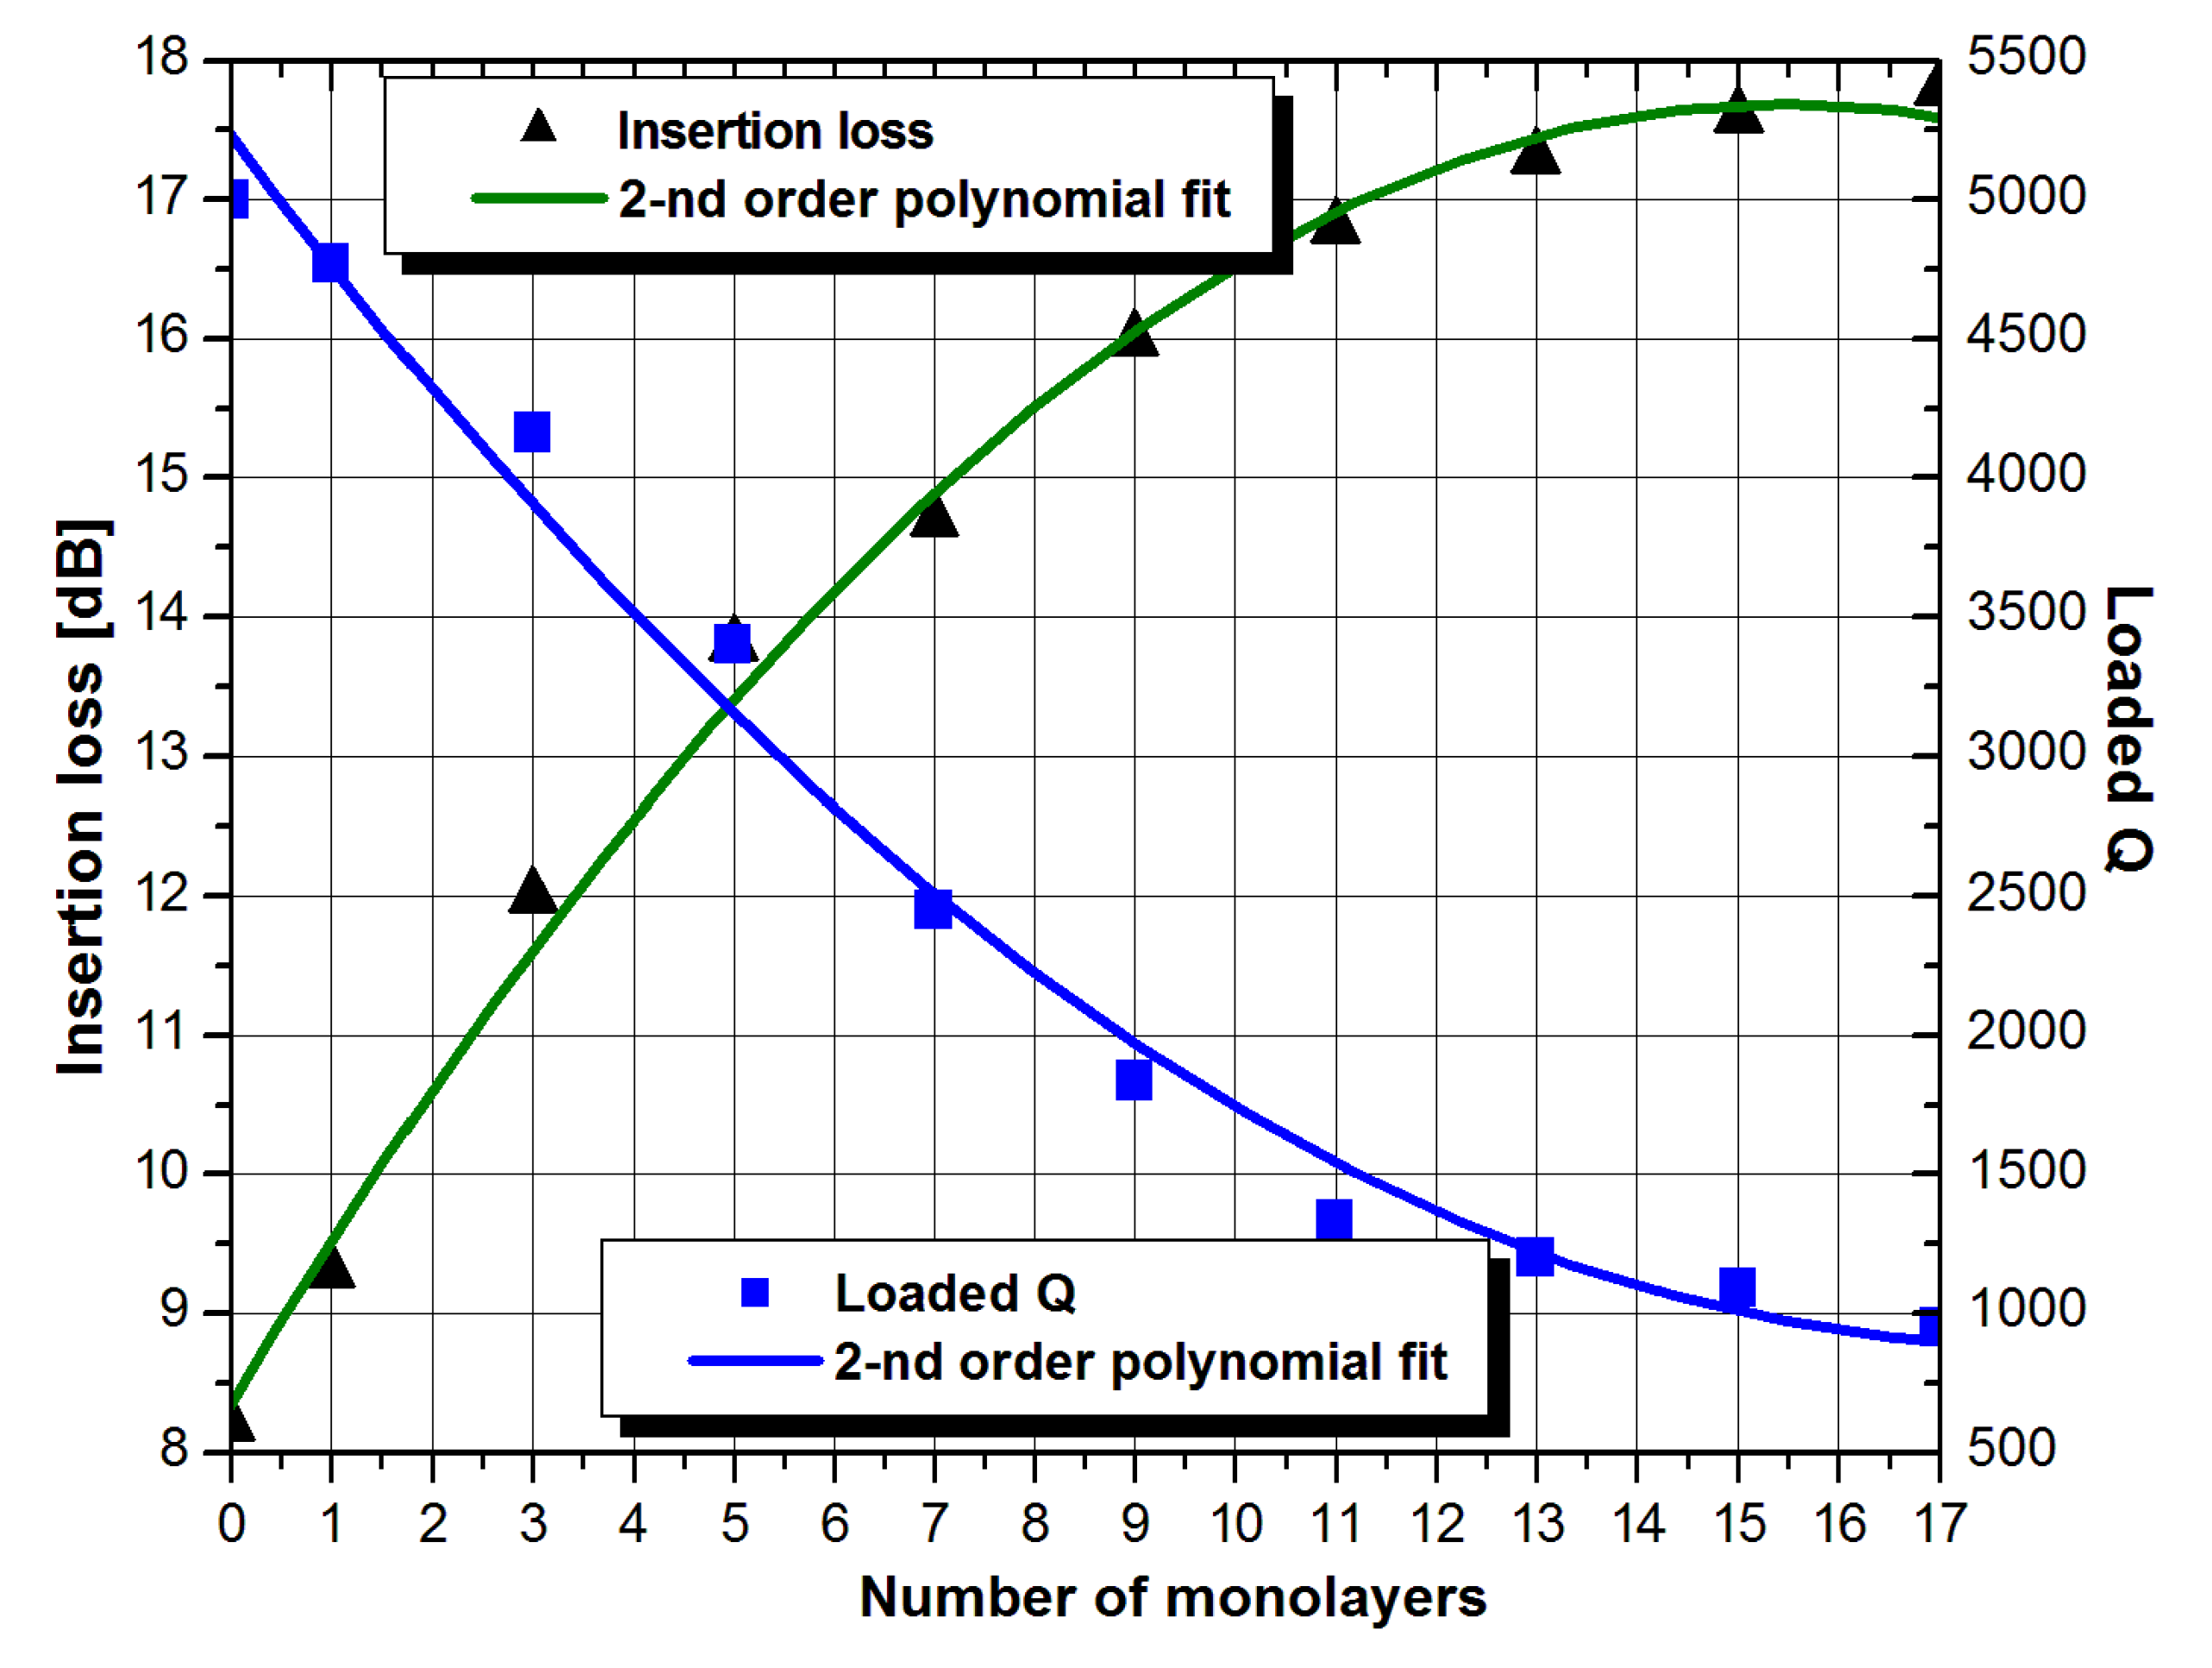
The insertion loss of the CDAA device also increased gradually with the number of monolayers, following the gradual decrease in loaded Q, as shown in Figure 12. Here, we can see that the loaded Q reached the value of 1000 when the 15th layer was deposited while the insertion loss barely reached 17.5 dB. Very similar results for the loaded Q and insertion loss were also obtained with the HDAA devices. This means that the solvent used for the AA solution preparation itself has little influence on the QSMs’ electrical behavior. However, it does affect the sensitivity to different VOCs, as will be later shown in this section.
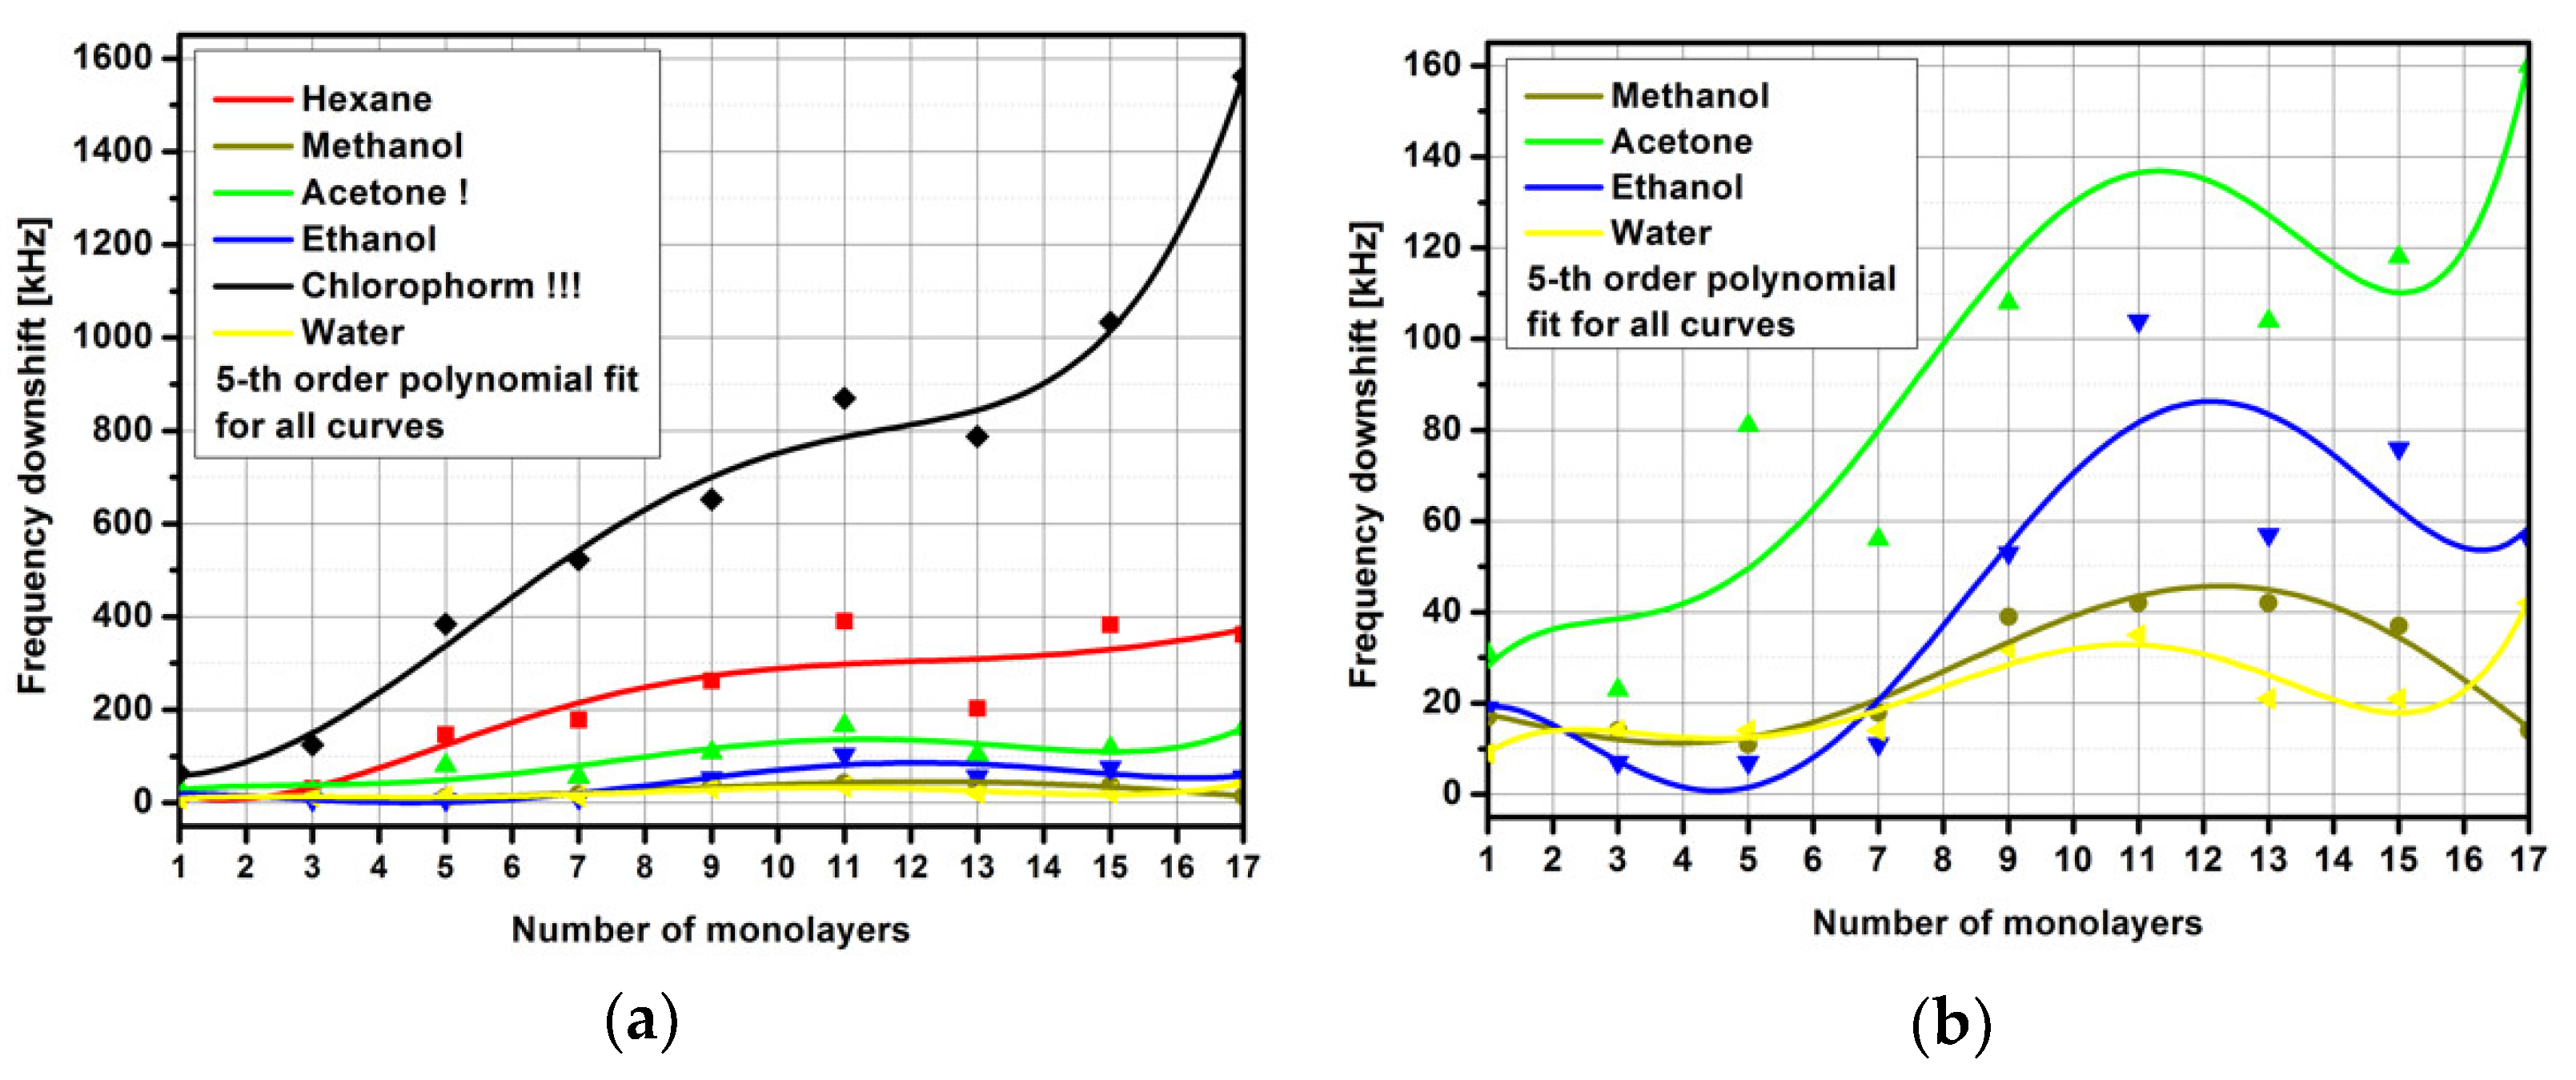
From the results in Figure 10, Figure 11 and Figure 12, we can conclude that there seems to be a quite a significant difference in the overall behavior of LB-functionalized QSMs versus the Parylene C-coated ones. According to the classification of the mass sensitive films for the SAW sensors provided in [13], Parylene C behaves much more like a semisolid or solid glassy film. It provides very linear and well-behaved mass loading responses, but unfortunately zero affinity to any gas-phase compound and is therefore usable only for mass calibration purposes. LB films such as the ones we used here, behave much more like soft highly sensitive films [13]. They are not so well-tolerated by the QSM devices since they quickly degrade their electrical performance, but, on the other hand, they provide high sensitivities to various gases including VOCs. This is evident from the sensitivity data for the HDAA coated devices in Figure 13. The mass sensitivity to chloroform increased with the number of monolayers and reached the value of 950 kHz (2200 ppm) at the 17th layer. This resulted in a total adsorbed chloroform mass of 21.8 ng at 43.5 kHz/ng sensitivity (see Section 2.5). A lower sensitivity of about 160 kHz (370 ppm) to hexane was observed at the 15th layer while for the other three VOCs including water, the sensitivity was much lower (see Figure 11). We found that all curves demonstrated an oscillating behavior best described with a 5th-order polynomial fit. As evident from Figure 13b, the oscillations were more pronounced for the polar VOCs tested—water, methanol, and ethanol. We believe that this oscillating behavior occurs as a result of defect formation in the LB films in the process of deposition—a phenomenon that we cannot control in our coating process. As shown in [35], defects in AA LB films are usually one layer or less thick and then they average over the film thickness with every subsequent layer. A different density of defects in each layer may also be the reason for the observed sensitivity oscillations from layer-to-layer in Figure 13b. This also explains the fairly large deviation of the measured data points from the fitted lines in Figure 13b and Figure 14b. Please note that defect formation in the LB films is not necessarily a bad thing since they increase the active surface area of the sensor and therefore its gas sensitivity. Artificially created defects either by the skeletonization of fatty acid LB films [21] or by using a mixture of fatty acids with different chain lengths [22] increased the sorption of both polar and nonpolar VOCs several times.
According to Figure 13b, there was a sensitivity maximum at the 15th layer while the loaded Q was still higher than 1000 (see Figure 12). From here, we can conclude that the optimum number of LB layers for the HDAA devices was around 15 for this HDAA device.
As shown in Figure 14, the VOC sensing behavior obtained with the CDAA-coated devices was very similar to the HDAA device in Figure 13. These films provided higher sensitivities by 68% to chloroform (36.7 ng adsorbed mass) and about the same sensitivity to the other 5 VOCs compared to the HDAA, however, the curves seemed to be somewhat better behaved with an optimum number of layers ranging from 11 to 15. Again, a very similar oscillating behavior was also observed here but in this case, the data plots in Figure 14b were quasi parallel, assuming that defect formation occurred during the first layer deposition, which was followed by all subsequent layers. Due to the higher VOC sensitivity and wider optimum layer range, CDAA offers more flexibility in practical sensor design. Another interesting feature, evident from Figure 13b and Figure 14b, is the very low sensitivity of both AA-based LB films to water vapors. This fact is of great importance in practical gas sensor design since water vapor is always dominant over other chemical compounds of interest. A comparison of sensitivities to chloroform and hexane for LB films prepared from the AA molecule dissolved in chloroform or hexane partially confirms our previous observation that the used solvent can increase the sensitivity to that gas [36].

4. Summary and Conclusions

In this work, we used SAW-based two-port resonators functionalized with single and multiple LB monolayers with never before used for this purpose materials or their configurations to build highly sensitive QSM sensor devices for the detection of VOC. We found that the surface pressure optimized DPPE-NBD-coated SLP devices provided more than 500 ppm sensitivity to saturated vapors of chloroform with only one single sensor layer. At the same time, the QSM device retained a loaded Q value in excess of 3500 while its insertion loss remained below 9 dB. A gravimetric sensor with such a remarkable performance is perfectly suited for the detection of very low VOC concentrations. With sensitivity levels to chloroform in excess of 3500 ppm and 2000 ppm for the CDAA- and HDAA-coated QSMs, respectively, these sensors are better suited for VOC measurements at high concentrations. To achieve such high sensitivities, they were surface pressure and film thickness optimized. Optimum film thicknesses were achieved with layer by layer coating of the HDAA- and CDAA-monolayers in a well-controlled LB deposition process. Optimum thickness values for the highest VOC sensitivity while keeping the QSMs loaded Q above 1000 for low noise levels were 15 and 11 to 15 monolayers for the HDAA- and CDAA-coated devices, respectively. High-quality films and the best VOC vapor sensitivities were obtained at 35 mN/m and 22 mN/m surface pressures for the SLP and CDAA/HDAA devices, respectively. All devices demonstrated excellent sensitivities to nonpolar VOC such as chloroform and hexane and much lower sensitivities to polar ones such as ethanol, methanol, acetone, and especially water vapors. We also observed a thickness dependent oscillating behavior of the sensitivity curves with the CDAA- and HDAA-coated devices. We assumed that this phenomenon was attributed to the defect formation in the LB monolayer deposition process. This effect, however, is positive since it is known to increase the overall VOC affinity to the LB films. Measurement times were in the seconds range and the sensing was reversible. It is our belief that the suggested LB functionalized QSM devices may be very competitive as VOC and chemical gas detectors in the near future.

Author Contributions

Conceptualization, I.D.A. and G.R.I.; Methodology, I.D.A. and G.R.I.; Software, G.R.I.; Validation, I.D.A. and G.R.I., Formal analysis, I.D.A.; Investigation, I.D.A.; Resources, G.R.I.; Data curation, G.R.I.; Writing—original draft preparation, I.D.A.; Writing—review and editing, I.D.A. and G.R.I.; Visualization, I.D.A. and G.R.I.; Funding acquisition, G.R.I. All authors have read and agreed to the published version of the manuscript.

Funding

This research was funded by the Bulgarian National Science Foundation (grant numbers: KP-06-OPR 03/9 and KP-06-Russia/8).

Institutional Review Board Statement

Not applicable.

Informed Consent Statement

Not applicable.

Data Availability Statement

Not applicable.

Conflicts of Interest

The authors declare no conflict of interest.

References

  1. What Are Volatile Organic Compounds ()? Available online: https://www.epa.gov/indoor-air-quality-iaq/what-are-volatile-organic-compounds-vocs (accessed on 2 April 2022).
  2. Koppmann, R. (Ed.) Volatile Organic Compounds in the Atmosphere; Blackwell Publishing Ltd.: Hoboken, NJ, USA, 2007; ISBN 9780470988657. [Google Scholar] [CrossRef] [Green Version]
  3. Salthammer, T. Very volatile organic compounds: An understudied class of indoor air pollutants. Indoor Air 2016, 26, 25–38. [Google Scholar] [CrossRef] [PubMed]
  4. Ahmed, W.M.; Lawal, O.; Nijsen, T.M.; Goodacre, R.; Fowler, S.J. Exhaled Volatile Organic Compounds of Infection: A Systematic Review. ACS Infect. Dis. 2017, 3, 695–710. [Google Scholar] [CrossRef] [PubMed]
  5. Buszewski, B.; Grzywinski, D.; Ligor, T.; Stacewicz, T.; Bielecki, Z.; Wojtas, J. Detection of volatile organic compounds as biomarkers in breath analysis by different analytical techniques. Bioanalysis 2013, 5, 2287–2306. [Google Scholar] [CrossRef] [PubMed]
  6. Liu, K.; Zhang, C. Volatile organic compounds gas sensor based on quartz crystal microbalance for fruit freshness detection: A review. Food Chem. 2021, 334, 127615. [Google Scholar] [CrossRef] [PubMed]
  7. Harris, C.M. Seeing SAW Potential. Anal. Chem. 2003, 75, 355–358. [Google Scholar] [CrossRef] [Green Version]
  8. Dewulf, J.; Langenhove, H.V. Analysis of volatile organic compounds using gas chromatography. Trends Anal. Chem. 2002, 21, 637–646. [Google Scholar] [CrossRef]
  9. Randon, J.; Maret, M.; Ferronato, C. Gas chromatography–mass spectroscopy optimization by computer simulation, application to the analysis of 93 volatile organic compounds in workplace ambient air. Anal. Chim. Acta 2014, 812, 258–264. [Google Scholar] [CrossRef]
  10. Natale, C.D.; Paolesse, R.; Macagnano, A.; Troitsky, V.I.; Berzina, T.S.; D’Amico, A. Pattern recognition approach to the study of the interactions between metalloporphyrin Langmuir-Blodgett films and volatile organic compounds. Anal. Chim. Acta 1999, 384, 249–259. [Google Scholar] [CrossRef]
  11. Andre, R.S.; Sanfelice, R.C.; Pavinatto, A.; Mattoso, L.H.C.; Correa, D.S. Hybrid nanomaterials designed for volatile organic compounds sensors: A review. Mater. Des. 2018, 156, 154–166. [Google Scholar] [CrossRef]
  12. McGinn, C.K.; Lamport, Z.A.; Kymissis, I. Review of Gravimetric Sensing of Volatile Organic Compounds. ACS Sens. 2020, 5, 1514–1534. [Google Scholar] [CrossRef]
  13. Avramov, I.D. Polymer Coated Rayleigh SAW and STW Resonators for Gas Sensor Applications. In Acoustic Waves—From Microdevices to Helioseismology; Beghi, M.G., Ed.; InTech International: London, UK, 2011; ISBN 978-953-307-572-3. [Google Scholar] [CrossRef]
  14. Afzal, A.; Iqbal, N.; Mujahid, A.; Schirhagl, R. Advanced vapor recognition materials for selective and fast responsive surface acoustic wave sensors: A review. Anal. Chim. Acta 2013, 787, 36–49. [Google Scholar] [CrossRef] [PubMed]
  15. Oliveira, V.J.R.; Borro, M.S.; Jesus, L.R.M.; Braunger, M.L.; Olivati, C.A. Using Langmuir-Schaefer deposition technique to improve the gas sensing performance of regiorandom polythiophene films. Sens. Actuators Rep. 2022, 4, 100094. [Google Scholar] [CrossRef]
  16. Roberts, G.G. (Ed.) Langmuir-Blodgett Films; Springer: Boston, MA, USA, 1990. [Google Scholar] [CrossRef]
  17. Ivanov, G.R.; Polevska, Z. First observation of 3D aggregates in a single-component Langmuir film below the equilibrium spreading pressure. MATEC Web Conf. 2017, 98, 01003. [Google Scholar] [CrossRef] [Green Version]
  18. Ivanov, G.R.; Kostadinov, K.G.; Song, Z. Formation of Nanosized Needle Structures in Ultra-Thin Organic Film for Biosensor Application. In Proceedings of the 2019 IEEE International Conference on Manipulation, Manufacturing and Measurement on the Nanoscale (3M-NANO), Zhenjiang, China, 4–8 August 2019; pp. 350–353. [Google Scholar] [CrossRef]
  19. Chang, Y.; Tang, N.; Qu, H.; Liu, J.; Zhang, D.; Zhang, H.; Pang, W.; Duan, X. Detection of Volatile Organic Compounds by Self-assembled Monolayer Coated Sensor Array with Concentration-independent Fingerprints. Sci. Rep. 2016, 6, 23970. [Google Scholar] [CrossRef]
  20. Hanley, C.M.; Quinn, J.A.; Vanderlick, T.K. Transport properties of water and pentane in Langmuir–Blodgett films. AlChE J. 1996, 42, 1234–1243. [Google Scholar] [CrossRef]
  21. Girard, K.P.; Hanley, C.M.; Vanderlick, T.K.; Quinn, J.A. Effect of the Skeletonization Process on Vapor Sorption into Langmuir−Blodgett Multilayers. Ind. Eng. Chem. Res. 2001, 40, 4283–4287. [Google Scholar] [CrossRef]
  22. Girard, K.P.; Quinn, J.A.; Vanderlick, T.K. Vapor Sorption into Pure and Mixed Fatty Acid Multilayers. Langmuir 2002, 18, 5830–5834. [Google Scholar] [CrossRef]
  23. Chi, L.F.; Eng, L.M.; Graf, K.; Fuchs, H. Structure and Stability of Langmuir-Blodgett Films Investigated by Scanning Force Microscopy. Langmuir 1992, 8, 2255–2261. [Google Scholar] [CrossRef]
  24. Ivanov, G.R.; Avramov, I.D. Langmuir-Blodgett Films from Fluorescently Labelled Phospholipids Deposited on Surface Acoustic Wave Devices. J. Phys. Conf. Ser. 2019, 1186, 012007. [Google Scholar] [CrossRef]
  25. Ivanov, G.R.; Polevska, Z. Computerized System for Investigation of Organic Monolayers at the Air-water Interface and for Deposition of Nano Thin Layers Following the Langmuir and Blodgett Method. In Proceedings of the 27th International Scientific Symposium Metrology and Metrology Assurance, Sozopol, Bulgaria, 7–11 September 2017; pp. 260–265. Available online: http://metrology-bg.org/fulltextpapers/370.pdf (accessed on 2 April 2022).
  26. Ivanov, G.R.; Georgiev, G.; Lalchev, Z. Fluorescently Labeled Phospholipids—New Class of Materials for Chemical Sensors for Environmental Monitoring. In Relevant Perspectives in Global Environmental Change; Agboola, J.A., Ed.; InTech International: London, UK, 2011; Chapter 6; pp. 89–112. [Google Scholar] [CrossRef] [Green Version]
  27. Claesson, P.M.; Berg, J.M. The Stability of Carboxylic Acid Langmuir-Blodgett Films as Studied by the Surface Force Technique. Thin Solid Films 1989, 176, 157–164. [Google Scholar] [CrossRef]
  28. Avramov, I.D.; Voigt, A.; Rapp, M. Rayleigh SAW resonators using gold electrode structure for gas sensor applications in chemically reactive environments. Electron. Lett. 2005, 41, 450–452. [Google Scholar] [CrossRef]
  29. Sauerbrey, G. Verwendung von Schwingquarzen zur Wägung Dünner Schichten und zur Mikrowägung. Z. Phys. 1959, 155, 206–222. [Google Scholar] [CrossRef]
  30. Avramov, I.D.; Stahl, U. On the Mass Sensitivity of Rayleigh Surface Acoustic Wave (RSAW) Resonators. In Proceedings of the 2017 40th International Spring Seminar on Electronics Technology, Sofia, Bulgaria, 10–14 May 2017. [Google Scholar] [CrossRef]
  31. Avramov, I.D.; Länge, K.; Rupp, S.; Rapp, B.; Rapp, M. Polymer coating behavior of Rayleigh-SAW resonators with gold electrode structure for gas sensor applications. IEEE Trans. Ultrason. Ferroelectr. Freq. Control 2006, 54, 157–166. [Google Scholar] [CrossRef] [PubMed]
  32. Avramov, I.D. The Quartz Surface Microbalance—A Possible Candidate for Rapid Respiratory Virus Detection. In Proceedings of the 2021 IEEE International Symposium on Applications of Ferroelectrics (ISAF), Sydney, Australia, 16–21 May 2021. [Google Scholar] [CrossRef]
  33. Group and Phase Delay Measurements with Vector Network Analyzer ZVR. Available online: https://scdn.rohde-schwarz.com/ur/pws/dl_downloads/dl_application/application_notes/1ez35/1ez35_1e.pdf (accessed on 2 April 2022).
  34. Parker, T.E.; Montress, G.K. Precision surface-acoustic-wave (SAW) oscillators. IEEE Trans. Ultrason. Ferroelectr. Freq. Control 1988, 35, 342–364. [Google Scholar] [CrossRef]
  35. Garnaes, J.; Schwartz, D.K.; Visvanathan, R.; Zasadzinski, J.A.N. Nano Scale Defects in Langmuir-Blodgett Film Observed by Atomic Force Microscopy. Synth. Met. 1993, 55–57, 3795–3800. [Google Scholar] [CrossRef]
  36. Avramov, I.D.; Radeva, E.; Lazarov, Y.; Grakov, T.; Vergov, L. Sensitivity Enhancement in Plasma Polymer Films for Surface AcousticWave Based Sensor Applications. Coatings 2021, 11, 1193. [Google Scholar] [CrossRef]
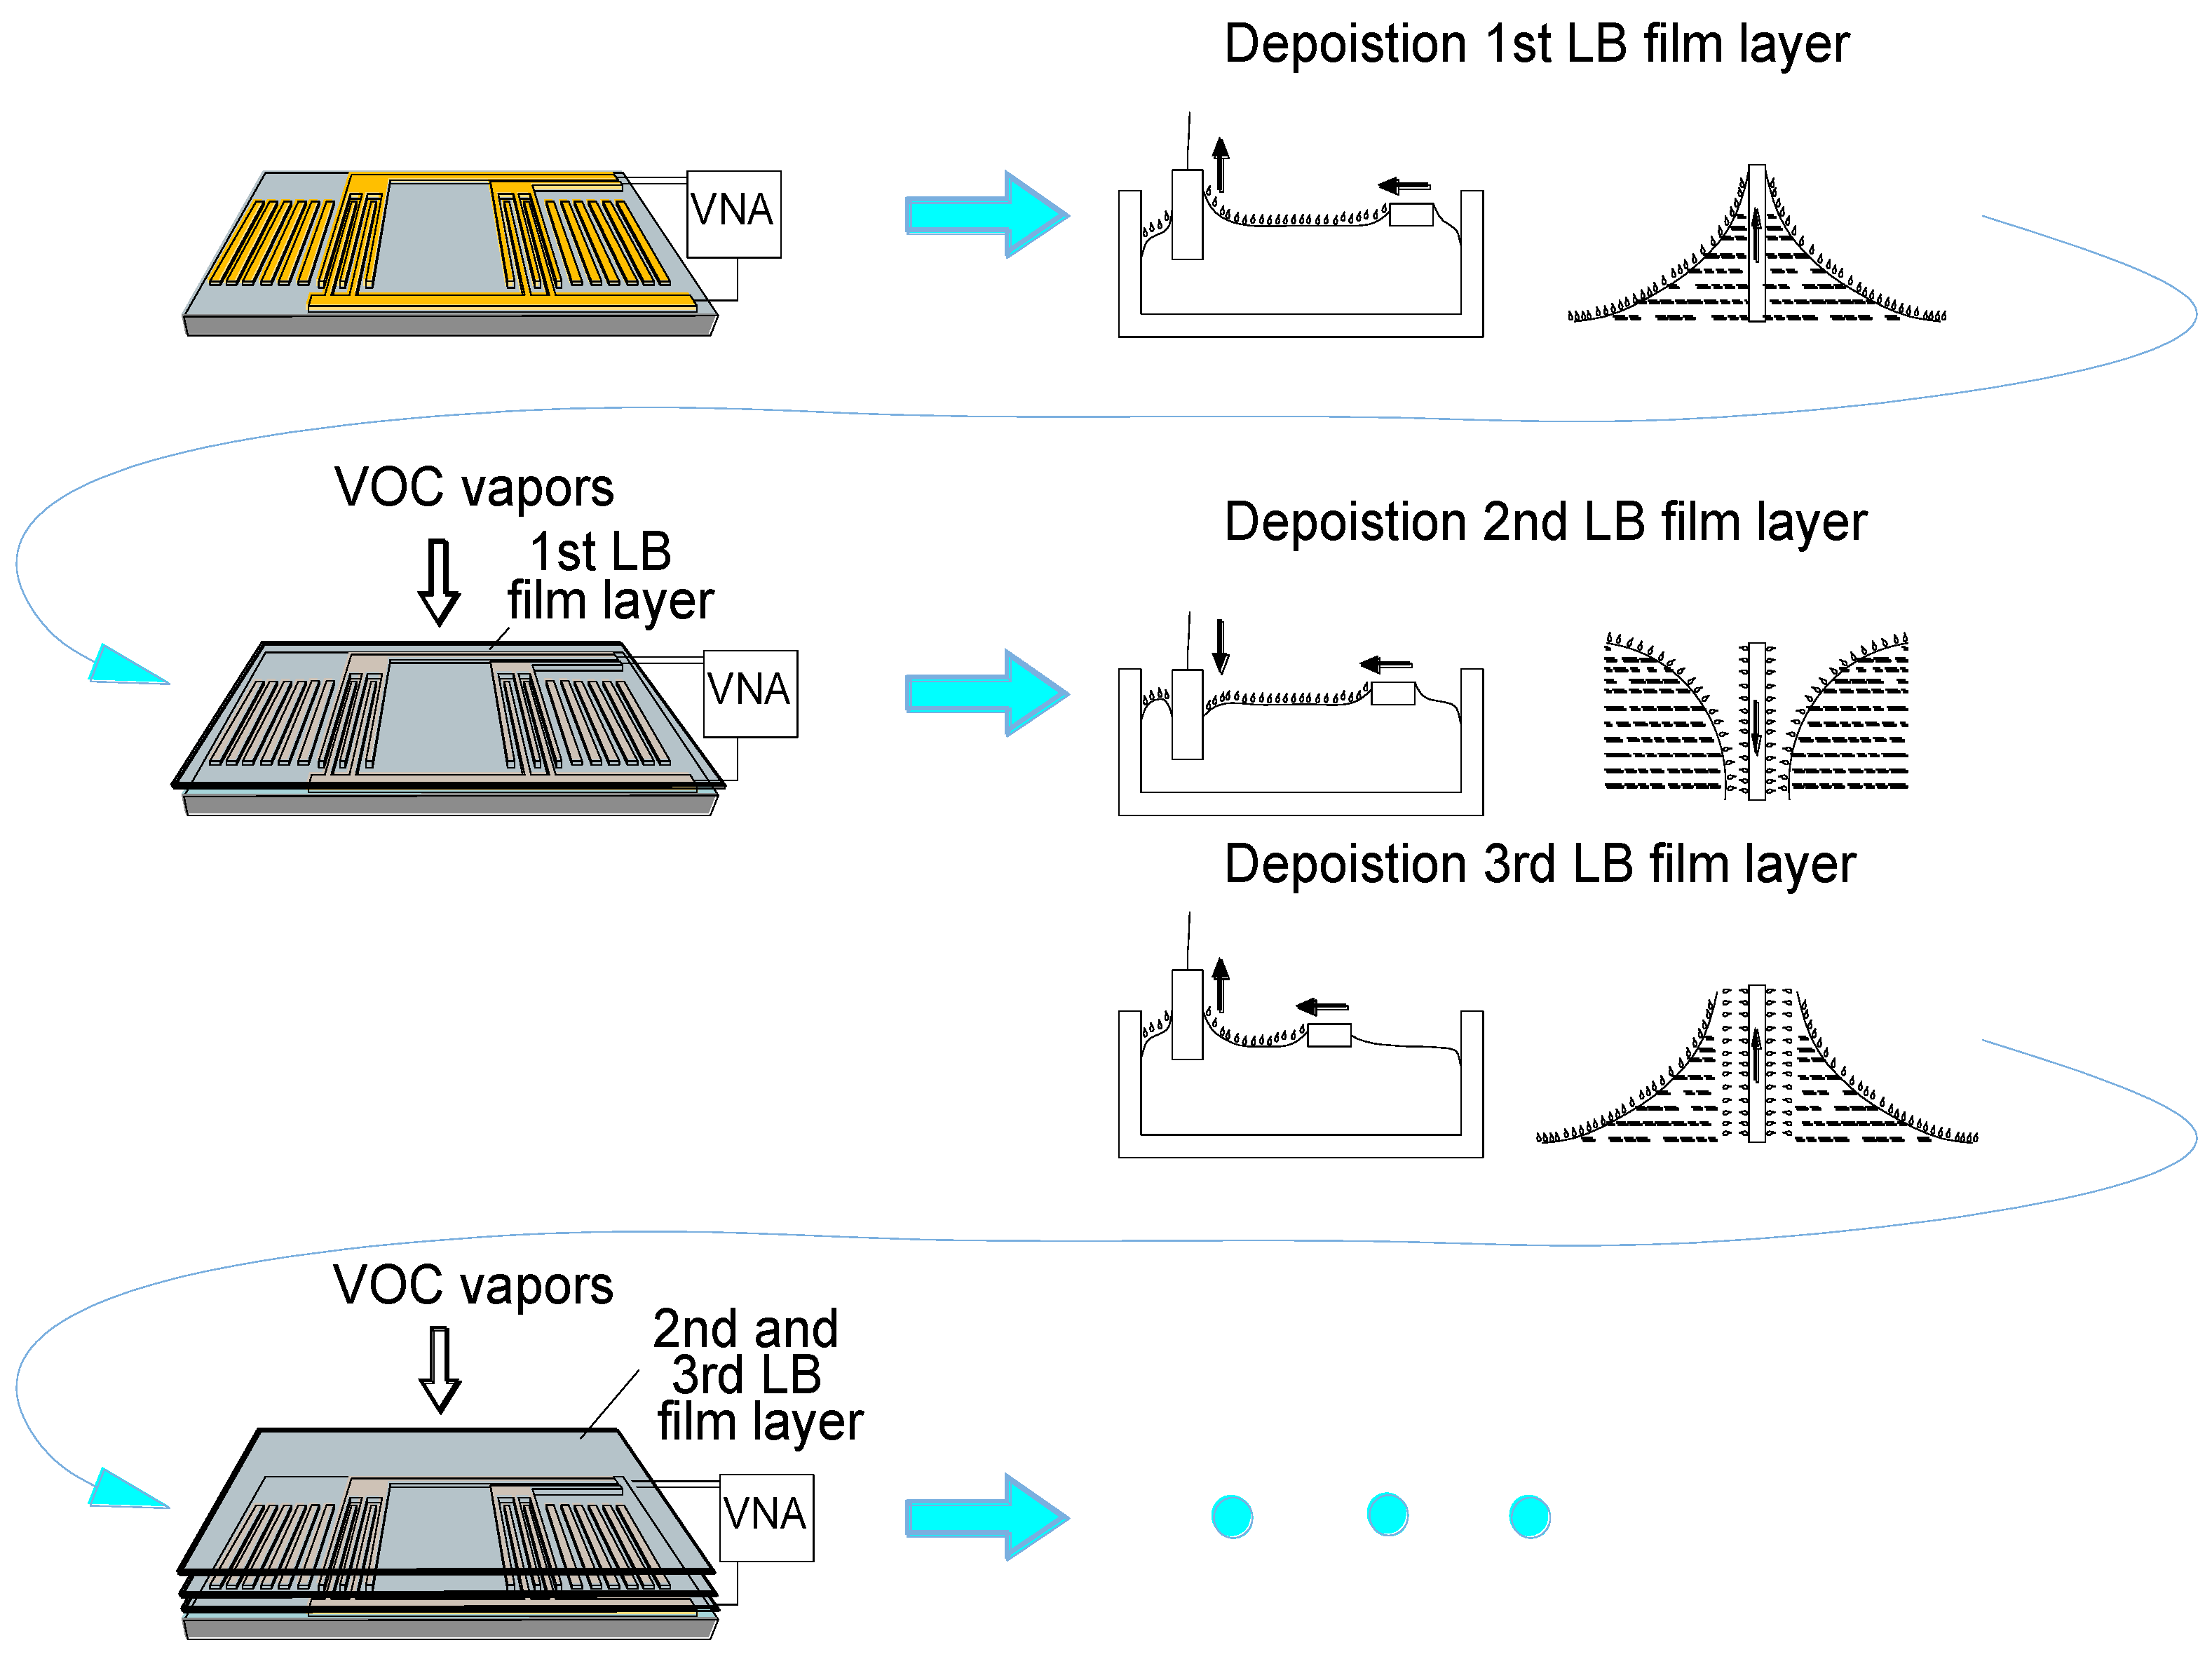
Figure 1. Schematic of the LB film deposition process and the VOC gas testing.
Coatings 12 00669 g001
Figure 2. (a) A picture of the SAW resonators positioned in a SMD package with an open lid. (b) Schematic of the SAW resonator and its connection to a VNA.
Coatings 12 00669 g002
Figure 3. Schematic of the VOC vapor sensing setup.
Coatings 12 00669 g003
Figure 4. A picture of the VOC testing setup.
Coatings 12 00669 g004
Figure 5. Broadband frequency response (upper curve) and phase response (lower curve) of the uncoated RSAW two-port resonator used in this study. Central frequency was 434.28 MHz, the horizontal axis is frequency with a l0.8 MHz per division. On the vertical axis is the insertion loss with 5 dB per division (green curve) or phase with 50 deg per division (red curve). The values of the pointers are above the graph.
Coatings 12 00669 g005
Figure 6. Narrowband frequency response (upper curve) and group delay response (lower curve) of the uncoated RSAW two-port resonator used in this study. Central frequency was 434.5388 MHz, the horizontal axis is frequency with 20 kHz per division. On the vertical axis is the insertion loss with 1 dB per division (green curve) or group delay with 0.5 µs per division (red curve). The values of the pointers are above the graph.
Coatings 12 00669 g006
Figure 7. The mass calibration curve for the SAW sensor coated with a calibration layer of Parylene C with a known density of 1.289 g/cm3 [30]. The thickness is precisely measured with a QCM-based thickness meter in the process of deposition.
Coatings 12 00669 g007
Figure 8. Frequency response of a QSM prior to (red curve) and after deposition of the 15 LB monolayers of AA on its surface (blue curve).
Coatings 12 00669 g008
Figure 9. Influence of the surface pressure on the sensor sensitivity of a SAW sensor coated with a single monolayer of a functionalizing fluorescently labeled phospholipid DPPE-NBD LB film (SLP).
Coatings 12 00669 g009
Figure 10. Mass loading sensitivity of the CDAA- and HDAA-coated RSAW sensor devices. Both LB films have been surface pressure optimized for stability and maximum mass sensitivity.
Coatings 12 00669 g010
Figure 11. Resonance frequency shift and loaded Q of the SAW sensor with the number of deposited CDAA monolayers.
Coatings 12 00669 g011
Figure 12. Loaded Q and insertion loss behavior with mass loading (number of deposited monolayers of CDAA).
Coatings 12 00669 g012
Figure 13. The VOC sensitivity of the HDAA coated devices: (a) overall performance including chloroform, the highest-sensitivity VOC, and (b) detailed performance of the lowest-sensitivity VOC.
Coatings 12 00669 g013
Figure 14. VOC sensitivity of the CDAA coated devices: (a) overall performance including chloroform, the highest sensitivity VOC and (b) detailed performance of the lowest sensitivity VOC.
Coatings 12 00669 g014
Publisher’s Note: MDPI stays neutral with regard to jurisdictional claims in published maps and institutional affiliations.