Article

Synthesis and Electron-Beam Evaporation of Gadolinium-Doped Ceria Thin Films

by
Fariza Kalyk
1,2,*,
Artūras Žalga
3,
Andrius Vasiliauskas
2,
Tomas Tamulevičius
1,2,
Sigitas Tamulevičius
1,2 and
Brigita Abakevičienė
1,2
1
Department of Physics, Kaunas University of Technology, Studentų St. 50, 51368 Kaunas, Lithuania
2
Institute of Materials Science, Kaunas University of Technology, K. Baršausko St. 59, 51423 Kaunas, Lithuania
3
Department of Applied Chemistry, Faculty of Chemistry and Geosciences, Vilnius University, Naugarduko St. 24, 03225 Vilnius, Lithuania
*
Author to whom correspondence should be addressed.
Coatings 2022, 12(6), 747; https://doi.org/10.3390/coatings12060747
Submission received: 8 April 2022 / Revised: 24 May 2022 / Accepted: 27 May 2022 / Published: 29 May 2022
(This article belongs to the Special Issue Recent Advances in the Growth and Characterizations of Thin Films)

Abstract

:
Gadolinium-doped ceria (GDC) nanopowders, prepared using the co-precipitation synthesis method, were applied as a starting material to form ceria-based thin films using the electron-beam technique. The scanning electron microscopy (SEM )analysis of the pressed ceramic pellets’ cross-sectional views showed a dense structure with no visible defects, pores, or cracks. The AC impedance spectroscopy showed an increase in the total ionic conductivity of the ceramic pellets with an increase in the concentration of Gd2O3 in GDC. The highest total ionic conductivity was obtained for Gd0.1Ce0.9O2-δtotal is 11 × 10−3 S∙cm−1 at 600 °C), with activation energies of 0.85 and 0.67 eV in both the low- and high-temperature ranges, respectively. The results of the X-ray photoelectron spectroscopy (XPS) and inductively coupled plasma optical emission spectrometer (ICP-OES) measurements revealed that the stoichiometry for the evaporated thin films differs, on average, by ~28% compared to the target material. The heat-treatment of the GDC thin films at 600 °C, 700 °C, 800 °C, and 900 °C for 1 h in the air had a minor effect on the surface roughness and the morphology. The results of Raman spectroscopy confirmed the improvement of the crystallinity for the corresponding thin films. The optimum heat-treating temperature for thin films does not exceed 800 °C.

1. Introduction

Miniaturized solid-oxide fuel cells (µ-SOFCs), constructed using thin-film technologies, can achieve high specific energy and energy density and may, one day, partially replace Li batteries in portable devices [1,2,3,4,5]. However, the initial materials used in the fabrication of the µ-SOFC process should fully satisfy their requirements. Recently, the thickness of the µ-SOFC three-layered structure (anode-electrolyte-cathode) has been reduced to a one-micron size. Thus, the thickness of the electrolyte thin film in µ-SOFC becomes thinner, e.g., ~600 nm, compared to conventional SOFC (~1 µm) [6,7,8]. This reduced thickness can minimize the ionic transport path and significantly reduce the ohmic resistance [9]. The development of thin-film ceramic electrolytes over the past several decades has led to reduced operating temperatures for SOFCs [10]. Conventional materials, such as ceria or zirconia-based ceramics, are still widely used as electrolytes [2,11]. Due to their superior properties, such as high ionic conductivity and low activation energy [12], gadolinium-doped ceria (GDC) ceramics are widely applied in the production of µ-SOFC as an electrolyte [4], interlayer [9], or in the composition of an anode [13]. GDC is one of the most promising electrolytes for µ-SOFC, with only one condition: that the operating temperature should be below 650 °C [12], due to the reduction of Ce4+ to a Ce3+, resulting in the failure of the electrolyte material at temperatures higher than 750 °C [14].
The properties of µ-SOFC electrolyte thin films primarily depend on the initial materials and their characteristics; therefore, the choice of synthesis method, processing stages, and conditions are particularly important. The synthesis of ceria-based electrolytes with the desired properties can be carried out using wet chemical synthesis routes, such as the sol-gel process [15], combustion synthesis [16], hydrothermal synthesis [17], polyol [12,18], the acetic acrylic method [19], and the co-precipitation method using nitrates [20,21,22,23], oxalates [24,25], and acetates [26,27]. Compared to other techniques, the co-precipitation (CP) method has the advantages of good control of the starting material and the processing parameters, the low temperature of the process, and the high purity and homogeneity of the product due to the possibility of controlling the starting solution [28]. The control of the initial material synthesis process is essential for the preparation of electrolyte materials with the required properties: crystalline structure, crystallite size, and even distribution of grains. This can be achieved by changing the synthesis parameters, such as the deposition rate and duration, precipitation, material, concentration, stirring speed, residue solubility, ambient pH, temperature, etc. [28].
Many studies have been carried out employing vacuum deposition techniques for the preparation of the electrolyte thin films used in µ-SOFC [29,30,31,32,33,34,35]. Although physical vapor deposition (PVD) techniques present some challenges, such as complexity and relatively high cost, they enable the production of very thin and dense films on either porous or dense substrates [34]. PVD processes can be used to deposit films of elements and alloys, as well as compounds employing reactive deposition processes. Moreover, films can be formed at temperatures that are much lower than those required in traditional ceramic processing [31]. Unfortunately, the film’s stoichiometry is found to be difficult to control, due to the deposition behavior of the composite material [4].
The most common techniques for the formation of µ-SOFC electrolytes are ion beam sputtering and pulsed laser deposition (PLD) [4]. However, compared to the other PVD methods, the e-beam evaporation technique has the advantages of a high deposition rate and large deposition area [34,36].
The electrolyte of µ-SOFC should have a high density and demonstrate good ionic conductivity [1,4,29,37,38]. These requirements can be achieved by controlling the concentration of impurities in the sample, e.g., mol% of gadolinia in GDC thin films [14], and selecting the appropriate method for the deposition of the thin film—in all cases the optimal chemical composition of elements in the films has to be ensured. Saporiti F. et al. [39] showed that the pulsed laser deposition technique is well suited for the formation of thin films that have adhered well to the electrolyte substrate, enabling the production of thin films with the same stoichiometry as the target. However, in this method, it is difficult to control the surface morphology as well as the porosity of the film. Uhlenbruck S. et al. [40] employed magnetron sputtering and the e-beam evaporation technique (EB-PVD) for the fabrication of GDC electrolyte thin films. The authors summarized that irrespective of deposition temperatures, the measured ratio of Ce and Gd of the GDC thin film corresponds almost exactly to the theoretical value of the target composition. While Sanghoon Ji et al. [38] showed that the chemical composition of the deposited thin film depends on the target material and substrate temperature during the deposition process. In addition, Wibowo R.A. et al. [41] explained that the deviation of the chemical composition is due to the different sputtering yield or evaporation process during the sputtering and EB-PVD deposition processes, respectively. However, the stoichiometry of electrolyte thin films produced by the EB-PVD technique has not been sufficiently studied.
This research aimed to synthesize and characterize the initial/target material, form dense ceria-based thin films using the EB-PVD technique, determine the stoichiometric deviation in the evaporated thin films compared to the target/initial material, and investigate the influence of additional heat treatment on the formed thin films. Thus, a co-precipitation synthesis route was employed for the preparation of GDC ceramic powders with different concentrations of Gd (10, 15, and 20 mol%), which were further used as target materials in the EB-PVD process. Since the target may influence the chemical composition of the film, the chemical composition of the evaporated thin films was estimated using XPS measurement. GDC thin films were annealed at various temperatures to study the effect on the structural properties of the films and to find the optimal annealing temperature. The obtained experimental results will help to select the optimal conditions for the formation of thin films with the desired properties, using the electron-beam evaporation technique, which can be used as an electrolyte for SOFC.

2. Materials and Methods

2.1. Synthesis of the Target Material and the Formation of Thin Films

Gadolinium (III) (Gd(NO3)3·6H2O, 99.9%, Sigma Aldrich, St. Louis, MO, USA) and cerium (III) nitrate hexahydrates (Ce(NO3)3·6H2O, 99.0%, Fluka, Charlotte, NC, USA) were used as metal precursors for the preparation of gadolinium-doped ceria (GDC) Ce1-xGdxO2-δ (where x = 0.1, 0.15, and 0.2 mol%) ceramic powders using the co-precipitation (CP) synthesis method. According to the concentration of Gd, the ceramic powders and pellets were denoted as 10-GDC, 15-GDC, and 20-GDC, respectively. A stoichiometric amount of gadolinium and cerium nitrate hexahydrates were dissolved in distilled water. The obtained solution of Gd and Ce salts was poured dropwise into an aqueous solution of oxalic acid under active stirring at 50 °C for 30 min, resulting in the formation of a white opaque colloidal solution. Ammonium hydroxide (NH4OH, 25%, Sigma Aldrich, St. Louis, MO, USA) was used to adjust the pH ratio to ~8–9 and to promote sedimentation. The precipitate was filtered by vacuum filtration using a Büchner funnel, washed, and dried for 24 h at room temperature in air. Finally, the synthesized powders were ground, milled in an agate mortar, and calcined at different temperatures (200, 400, 600, 800, 900, 1000, 1100, and 1200 °C) for 5 h (5 °C/min) in air. These calcination temperatures were chosen to study the crystalline phases and the changes in crystallinity, and to verify at which temperature the oxides are completely formed.
The GDC powders, synthesized and calcinated at 900 °C for 5 h, were pressed into pellets with a diameter of 10 mm and a thickness of ~1.5 mm (for impedance measurements) and ~3.7 mm (for electron-beam evaporation) using uniaxial compression at 200 MPa. Subsequently, the pellets were annealed at 1200 °C for 5 h in the air (5 °C/min). The density of the pellets was measured by a weight-volume method, using the theoretical density of 7.235 g/cm3 [41]. For impedance spectroscopy measurements, platinum paste (conductive paste Lot No. 13032810, Mateck, Jülich, Germany) was applied on both parallel sides of the polished GDC pellets and then dried at 300 °C for 2 h.
GDC ceramics with a thickness of ~3.7 mm were used as the target material for evaporation on Si (thickness of the films: ~800 nm) using a UVN-71P3 electron-beam evaporation system. The evaporation process was carried out at a pressure of 0.7 Pa, with an evaporation rate of ~2 nm/s; the distance between the electron gun (power: 10 kW) and the substrate was 250 mm. The temperature of the substrate was kept at 200 °C during the evaporation process. The evaporated thin films are denoted as 10-GDC, 15-GDC, and 20-GDC, respectively.

2.2. Characterization Techniques

The thermal decomposition of the synthesized powders was analyzed using thermogravimetric (TGA) and differential thermal (DTA) analyses (PerkinElmer STA 6000, Shelton, CT, USA ). Dried but not calcined synthesized GDC powders (5–10 mg) were heated from 25 to 950 °C (heating rate 10 °C/min) in dry flowing air (20 mL/min). To define the elemental compositions, 100 mg of powders were dissolved in concentrated sulfuric acid, and the diluted solutions were analyzed with an inductively coupled plasma optical emission spectrometer (ICP-OES, Vista-Pro, Varian, Mulgrave, Victoria, Australia ). The Brunauer–Emmett–Teller (BET) surface area analyzer (Sorptometer KELVIN 1042, Ithaca, NY, USA ) was used to determine the bulk surface area of the powders calcined at 900 °C. The BET surface area and the equivalent particle size (DBET) were calculated using the following equation [42]:
D B E T = 6 × 10 3 d t h S B E T
where SBET is the specific surface area (m2/g) and dth is the theoretical density of the solid solution oxide (g/cm3), calculated according to the following equation:
d t h = 4 [ ( 1 x ) M C e + x M G d + ( 2 x / 2 ) M O ] a 3 N A
where x is the dopant concentration, NA is the Avogadro constant, M is the atomic weight, and a represents the lattice parameters of the solid solution.
The crystal structure of the synthesized GDC powders was determined using a D8 Discover X-ray diffractometer (Bruker AXS GmbH, Karlsruhe, Germany ) with a Cu Kα (λ = 1.5418 Å) radiation source and parallel beam geometry with a 60 mm Göbel mirror. A Soller slit with an axial divergence of 2.5° was utilized on the primary side. The diffraction patterns were recorded using a fast-counting LynxEye (0D mode) silicon strip detector with a 2.475° opening angle and a 6 mm slit opening. The peak intensities were scanned over the range of 20–90° (coupled 2θ-θ scans), with a 0.02° step size and time per step of 0.2 s.
The microstructure and elemental composition of the samples were estimated using scanning electron microscopy (SEM) (FEI Quanta 200 FEG, Hillsboro, Oregon, USA) in a low-vacuum mode, equipped with an energy-dispersive X-ray spectrometer (EDS). To obtain the EDS spectra, the accelerating voltage was 5 kV.
The electrical properties of GDC pellets were investigated via impedance measurements, using an impedance analyzer Alpha-AK (Novocontrol Technologies, Montabaur, Germany ) in the temperature range of 200–800 °C, and from 1 Hz to 1 MHz of the frequency range. The obtained impedance spectra were fitted using the equivalent circuits by the Zview2 software. The plots of σ vs. 1000/T were analyzed and the activation energy was obtained using the Arrhenius plot, according to the following equation:
σ b ,   g b = σ 0 e x p Δ E b ,   g b k T
where σ0 is the pre-exponential factor, k is the Boltzmann constant (0.86 × 10⁻⁴ eV K−1), T is the temperature, and ΔEb,gb represents the activation energies of bulk and grain boundary conductivity.
X-ray photoelectron spectroscopy (XPS) was used to study the atomic composition of the as-deposited GDC electrolyte thin films. A Thermo Scientific ESCALAB 250Xi spectrometer (Thermo Fisher, 2013, Waltham, MA, USA). with monochromatized AlKα radiation ( = 1486.6 eV) was used for the surface analysis. The base pressure in the analytical chamber was 2 × 10⁻⁷ Pa, the x-ray spot size was 0.3 mm, and 40 eV pass energy was used during the spectra acquisition. The energy scale of the system was calibrated according to the peak positions of Au 4f7/2, Ag 3d5/2, and Cu 2p3/2. The GDC thin films were analyzed without a surface-cleaning procedure, and the calculations of atomic concentration were performed using the original ESCALAB 250Xi Avantage software.
For the characterization of the bonding structure of GDC thin films on a Si (100) substrate, a Renishaw inVia Raman spectrometer (Renishaw, Wotton-under-Edge, UK)) equipped with a wavelength of 532 nm, a 45 mW excitation laser power, a 50× objective (NA = 0.75, Leica Microsystems, Wetzlar, Germany ), and an integration time of 10 s was used. The measurements were performed in the 100–800 cm−1 spectral range, with an exposure time of 10 s and 1% of the laser power. The background was subtracted from the obtained Raman spectra and was fitted by Lorentzian-shaped lines in the spectral range of 440–490 cm−1.
The morphology, topography, and surface roughness parameters (Rq, Rsk, Zmean, and Rku) of GDC and SDC thin films on different substrates were analyzed using an NT-206 (Microtestmachines Co., Gomel, Belarus) atomic force microscope and the SPM-data processing software, SurfaceXplorer (Ultrafast Systems, Sarasota, FL, USA). The measurements were performed at room temperature in the air. A silicon cantilever with a tip curvature radius of 10 nm, spring constant of 3 N/m, and cone angle of 20° was operating in a contact scanning mode, with a 12 μm × 12 μm field of view.

3. Results

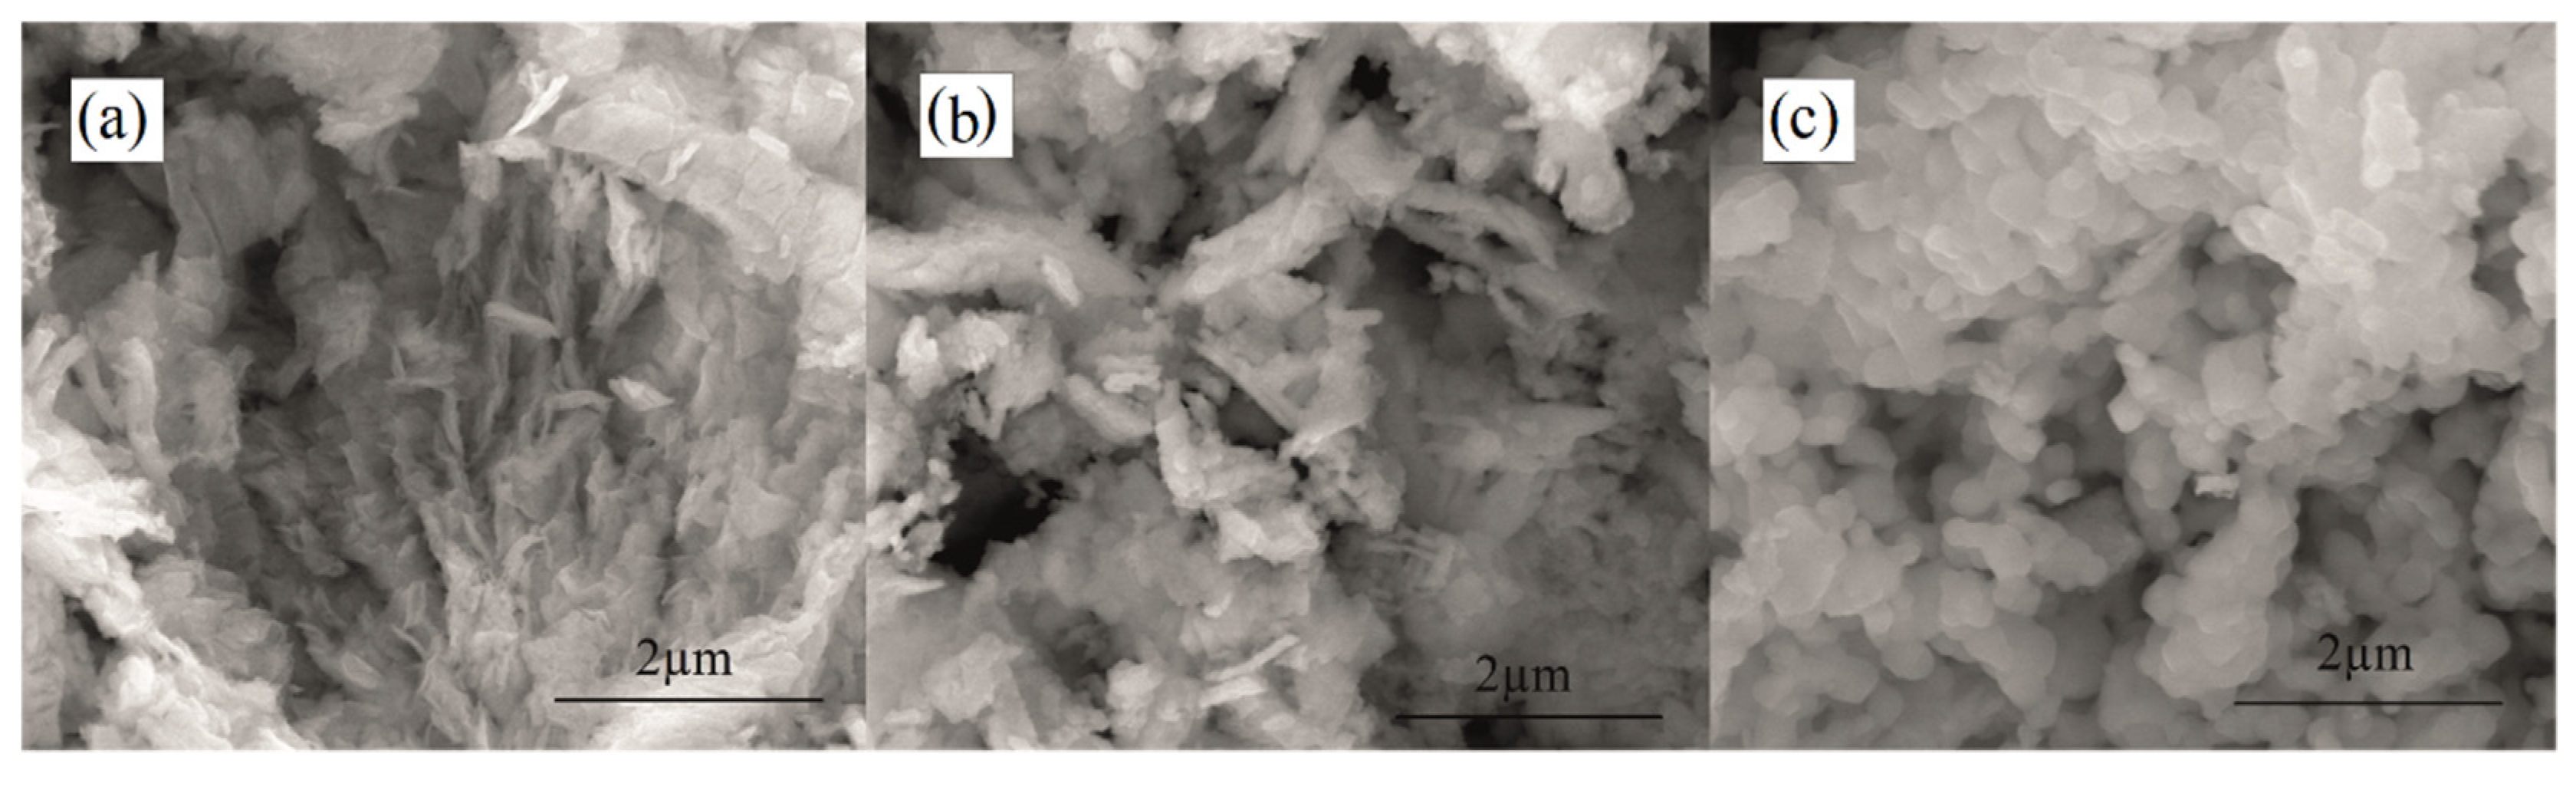
3.1. Characterization of the Powders

In this work, thermal analysis was applied to show the most important differentiating features of the thermal decomposition of intermediate products. The thermal decomposition process revealed and characterized the individual peculiarities of each sample, which was prepared according to the co-precipitation synthesis method. The analysis was carried out for all concentrations of GDC nanopowders. However, the obtained results showed the same trend regardless of the concentration; thus, only the 10-GDC results are presented (Figure 1a).
The decomposition of CP precursor is closely related to the degradation behavior of hydrated oxalic acid. In the first temperature range from 30 °C to 100 °C, the evaporation of water molecules and a corresponding mass change of about 12–13% were identified. This effect was confirmed by a strong endothermic peak in the DTA curve. During the further increase in temperature to 190 °C, a bright endothermic effect was observed on the DTA curve that corresponds to the melting and partial decomposition of oxalic acid, and a mass change in the sample of about 4–5%. The last mass change in the range from 310 °C to 370 °C was attributed to the final decomposition of the initial metal oxalate precursor. The mass change of about 38% and the strong exothermic peak on the DTA curve suggest the release of carbon dioxide, the formation of which was promoted by the redox properties of ceria. There was also a slight increase in mass (0.16%) above 800 °C. This effect reflects an endothermic peak on the DTA curve at temperatures from 850 °C to 950 °C. In conclusion, the final tendency of the crystallization of double oxide at elevated temperatures depended only on the initial sizes of the crystallites, which were formed at a temperature of about 400 °C.
The X-ray diffraction patterns of 10-, 15-, and 20-GDC powders, calcined at 900 and 1200 °C for 5 h, are presented in Figure 1b. The obtained results show that GDC powders have a cubic fluorite crystal structure with an F m 3 ¯ m space group and with the dominating (111) crystallographic plane; all positions of the diffraction peaks match the standard XRD data (PDF- 4 database: 011-7336, 006-3415, 013-6571). The crystallite size, D, was calculated from the X-ray broadening, using Scherrer’s equation [12]. With increasing calcining temperature, the crystallite size increased and was in the range of from 5 nm to 42–48 nm for the different concentrations of GDC. According to the obtained results, the tendency of the growth of crystallite sizes for different concentrations of GDC powders, annealed at the same temperatures, was the same. The equivalent crystallite size, DBET, was calculated from the BET analysis, according to Equation (1). Comparing the results of the crystallite size, D, and the equivalent size of the GDC ceramic powders calcined at 900 °C, the DBET was higher within the range of 70–108 nm (Table 1). The difference between D and DBET could be caused by the occurrence of crystalline nanodomains within the individual nanocrystals in the calcined powders. The XRD technique registered these nanodomains as individual crystals, while the BET technique measured only the surface area of the parent nanocrystal. Moreover, the nanocrystals could be clustered together to form agglomerates of the crystalline nanoparticles. To probe the agglomeration extent of the particles, the factor ϕ was defined using:
ϕ = D B E T / D
where DBET is the specific surface area determined by BET analysis, and D is calculated according to Scherrer’s equation, using the X-ray diffraction peak broadening data [42]. This ratio is well known as a factor that reflects the agglomeration extent of the primary crystallites and is an indicator of their porous agglomerate nature; a value of 1.0 specifies their complete dispersion [42]. The related results are presented in Table 1, where the ϕ factor increased with the increase in the molar concentration of Gd2O3 in GDC. The obtained results are in good agreement with the SEM results; those synthesized using co-precipitation synthesis and calcined at 900 °C have agglomerated features (Figure 2).
The lattice parameter (a) was calculated according to Bragg’s Law:
a = λ 2 s i n θ h k l h 2 + k 2 + l 2
where h, k, l are the Miller indices of the crystallographic plane (in the calculations, the (111) plane was used), θ h k l is the Bragg’s angle, and λ is the wavelength of X-ray radiation.
The changes in GDC lattice parameters depend on both the concentration of Gd2O3 and the calcination temperature. The lattice parameter increases with increases in the molar concentration of Gd2O3 since the ionic radius of the gadolinium cation, Gd3+, is larger than the ionic radius of the cerium cation, Ce4+ (rGd3+ = 0.1053 nm and rCe4+ = 0.097 nm) [42]. Moreover, the growth of the lattice parameter with the addition of Gd confirms the incorporation of gadolinium ions into the lattice.
The morphology of GDC ceramic powders calcined at 800 °C, 900 °C, and 1200 °C for 5 h was investigated using scanning electron microscopy (Figure 2). It can be seen that the structure of nanopowders changes with the increase in the calcination temperature. For example, as the temperature rose from 800 °C to 900 °C, the formation of a structure with fragments and protrusions (~400 nm in width) was observed, which is typical for the co-precipitation synthesis method (Figure 2b). Therefore, further powder treatment was necessary, as pellets pressed from such uncrushed powders have a relatively low density. At a maximum calcination temperature of 1200 °C (Figure 2c), the formation of grains was observed; that is, the structure had acquired its final form. The same tendency was observed for other concentrations of GDC. Similar results were obtained by Zha S. et al. [43], who determined the coarse structure of the GDC powders, synthesized using oxalic acid co-precipitation synthesis and sintering at 750 °C for 1 h.
When summarizing the TG-DTA, SEM, and XRD results, the calcination of GDC ceramic powders at 900 °C ensures the full formation of a cubic fluorite crystal structure with an F m 3 ¯ m space group and helps to achieve thermal stability in the material.
The elemental analysis of the synthesized GDC powders (concentration of gadolinium) was measured using two different methods: ICP-OES and SEM/EDS analyses (Table 1). The obtained results indicate that the chemical composition of the material is controlled by the composition of the synthesis solution. Furthermore, the properties of the ceramics can be influenced by the compaction of the powders during the calcination process.

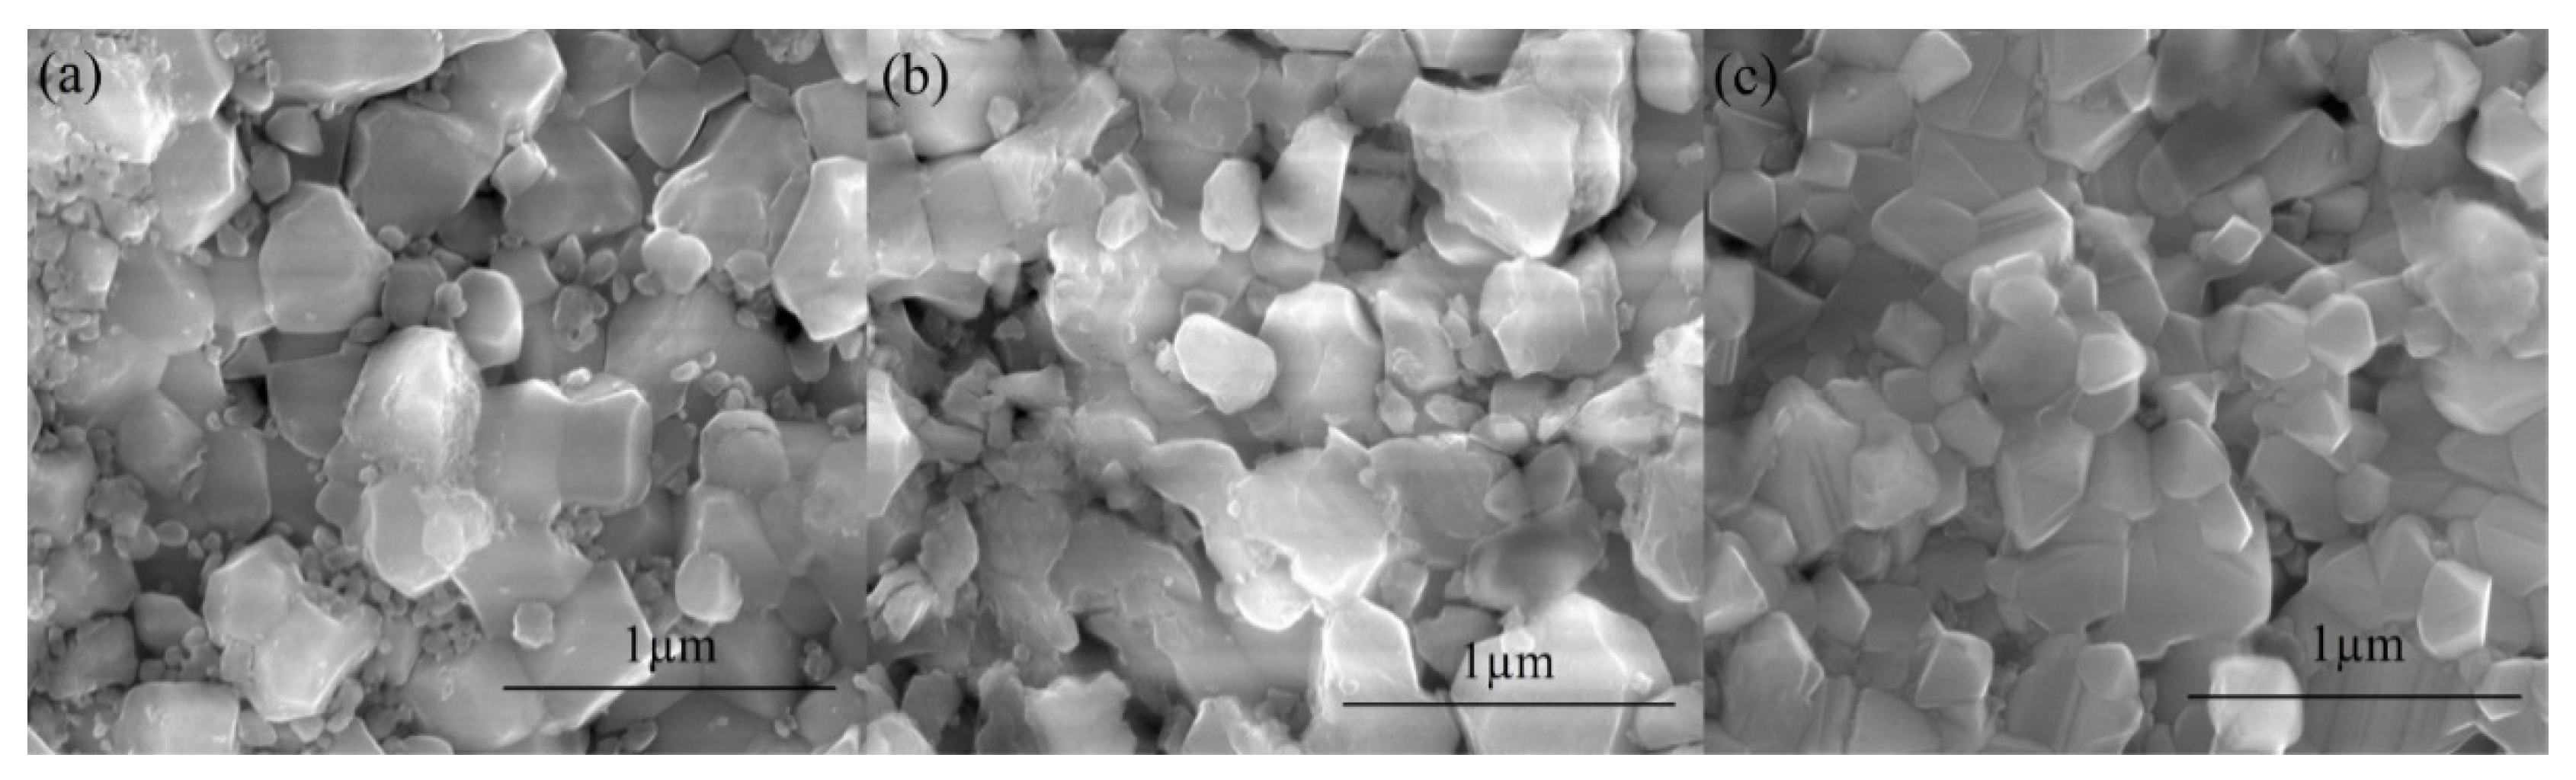
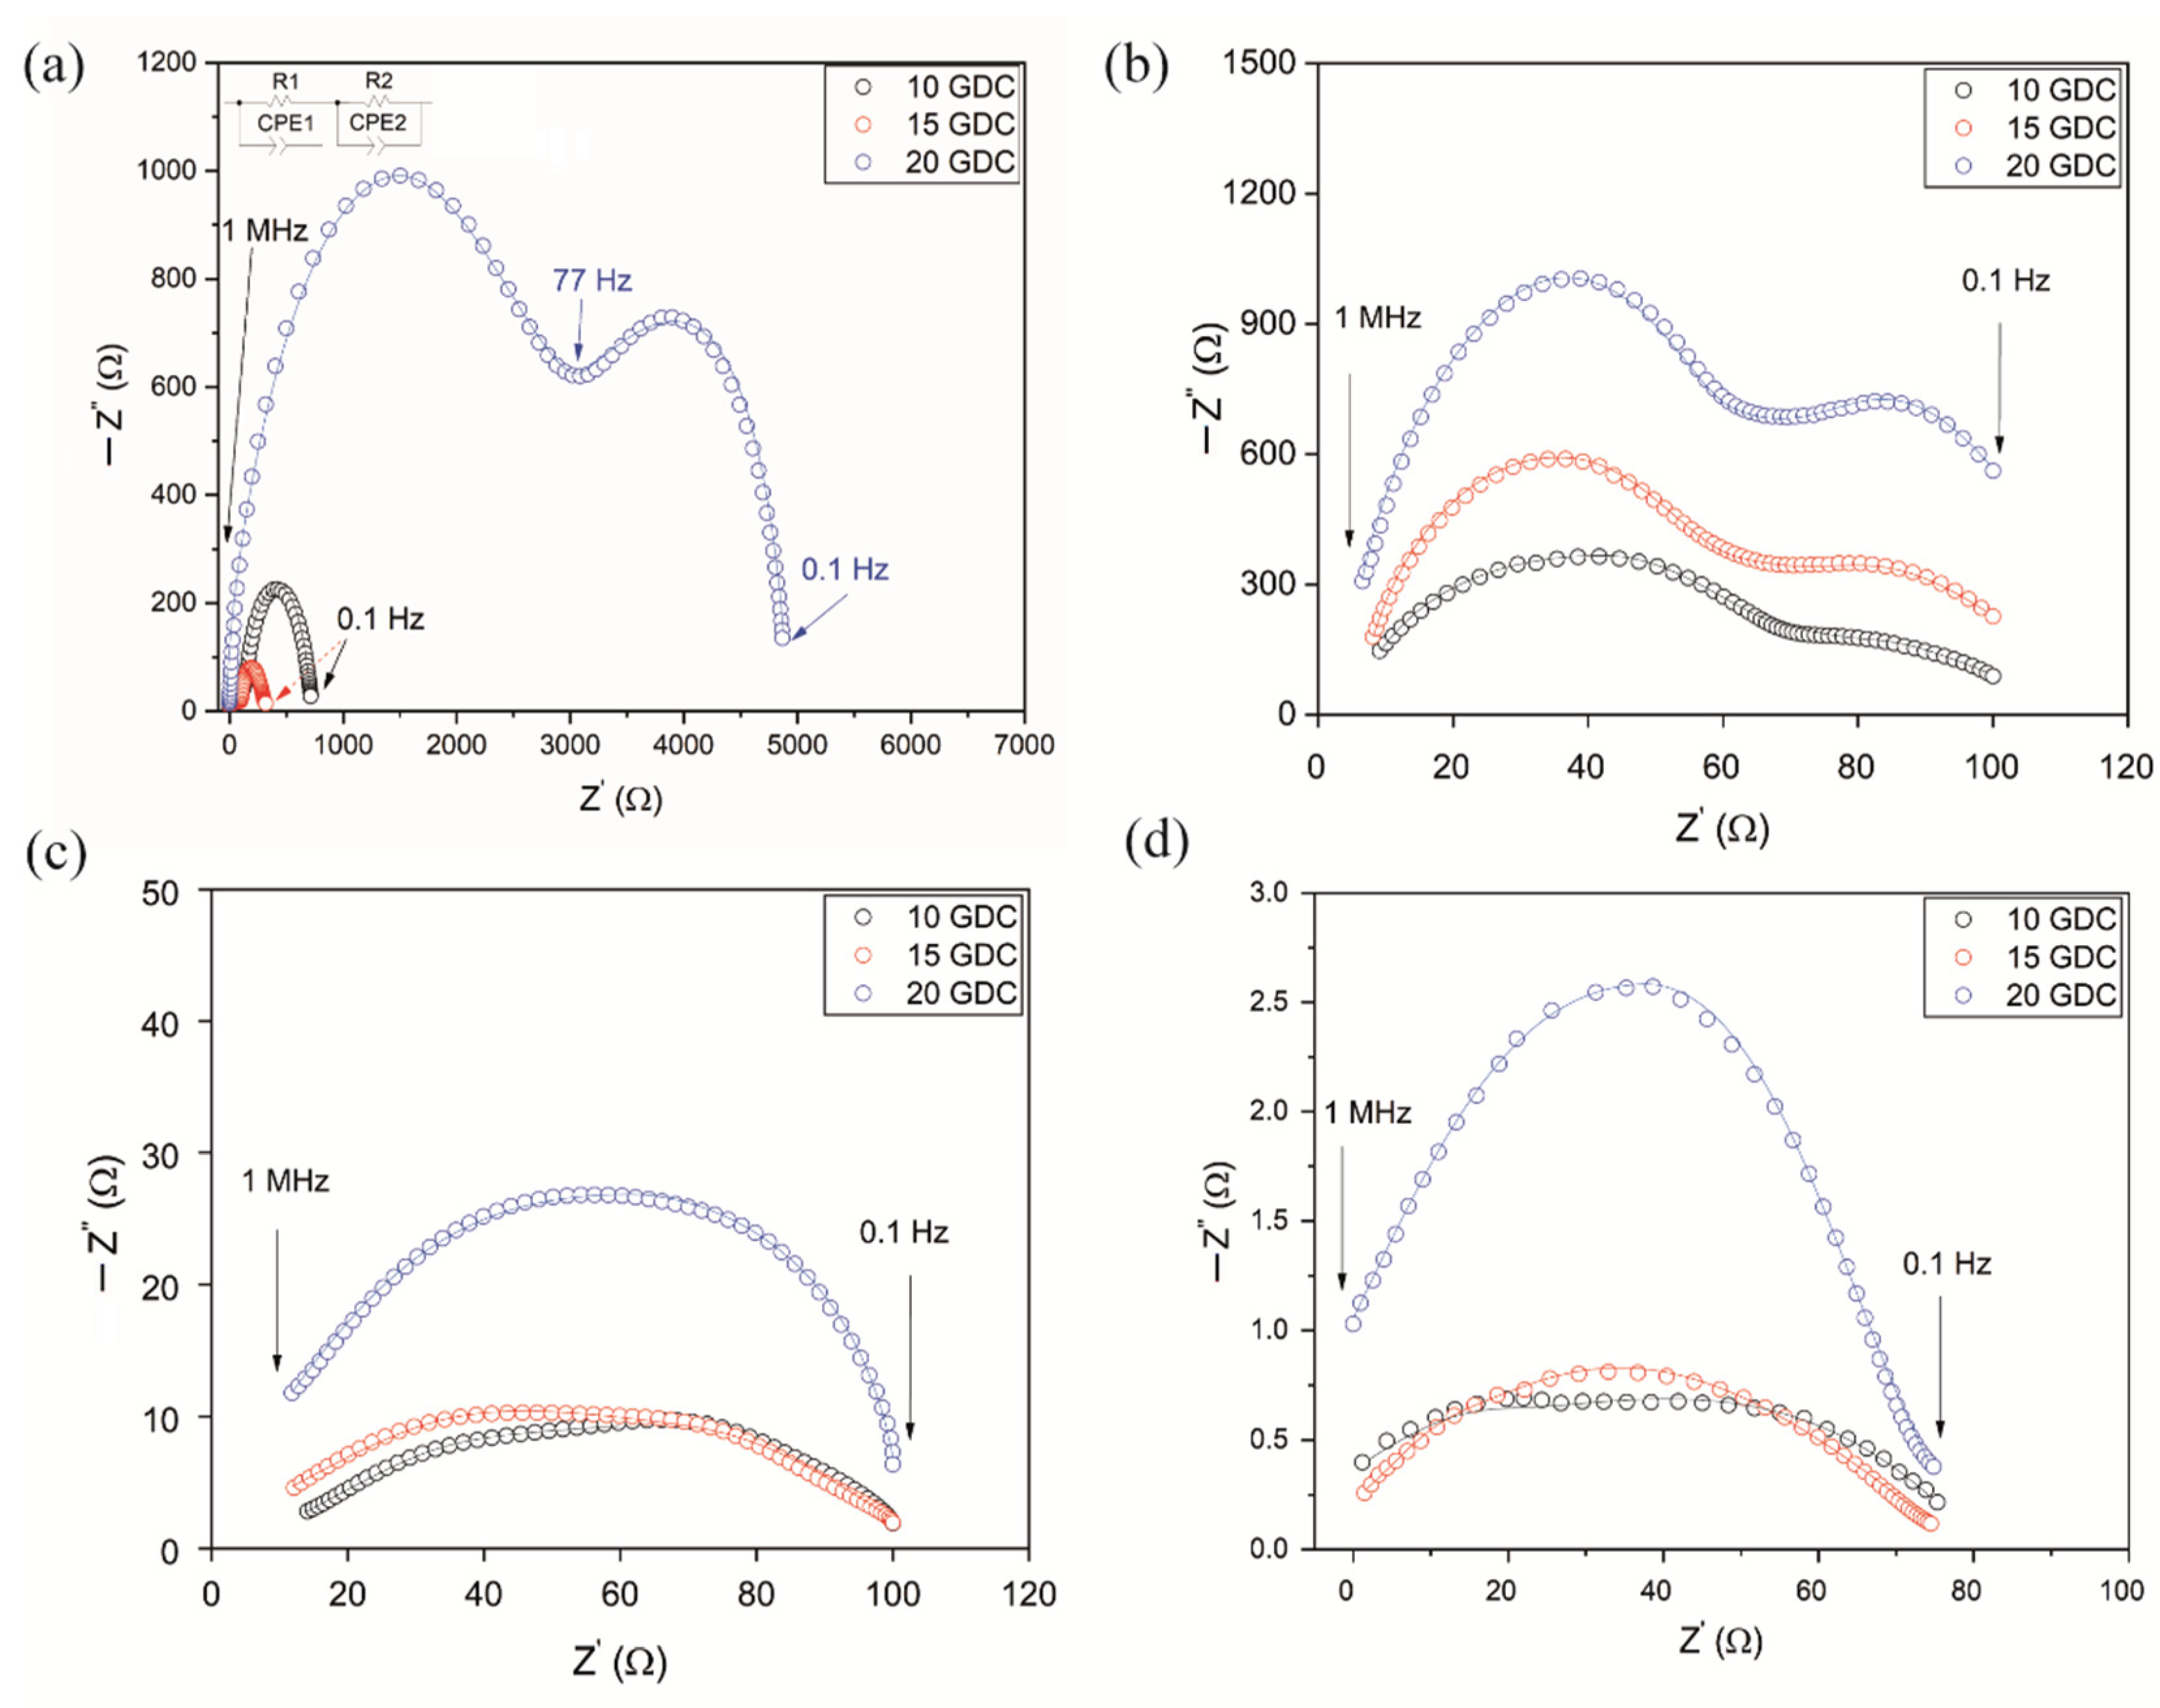
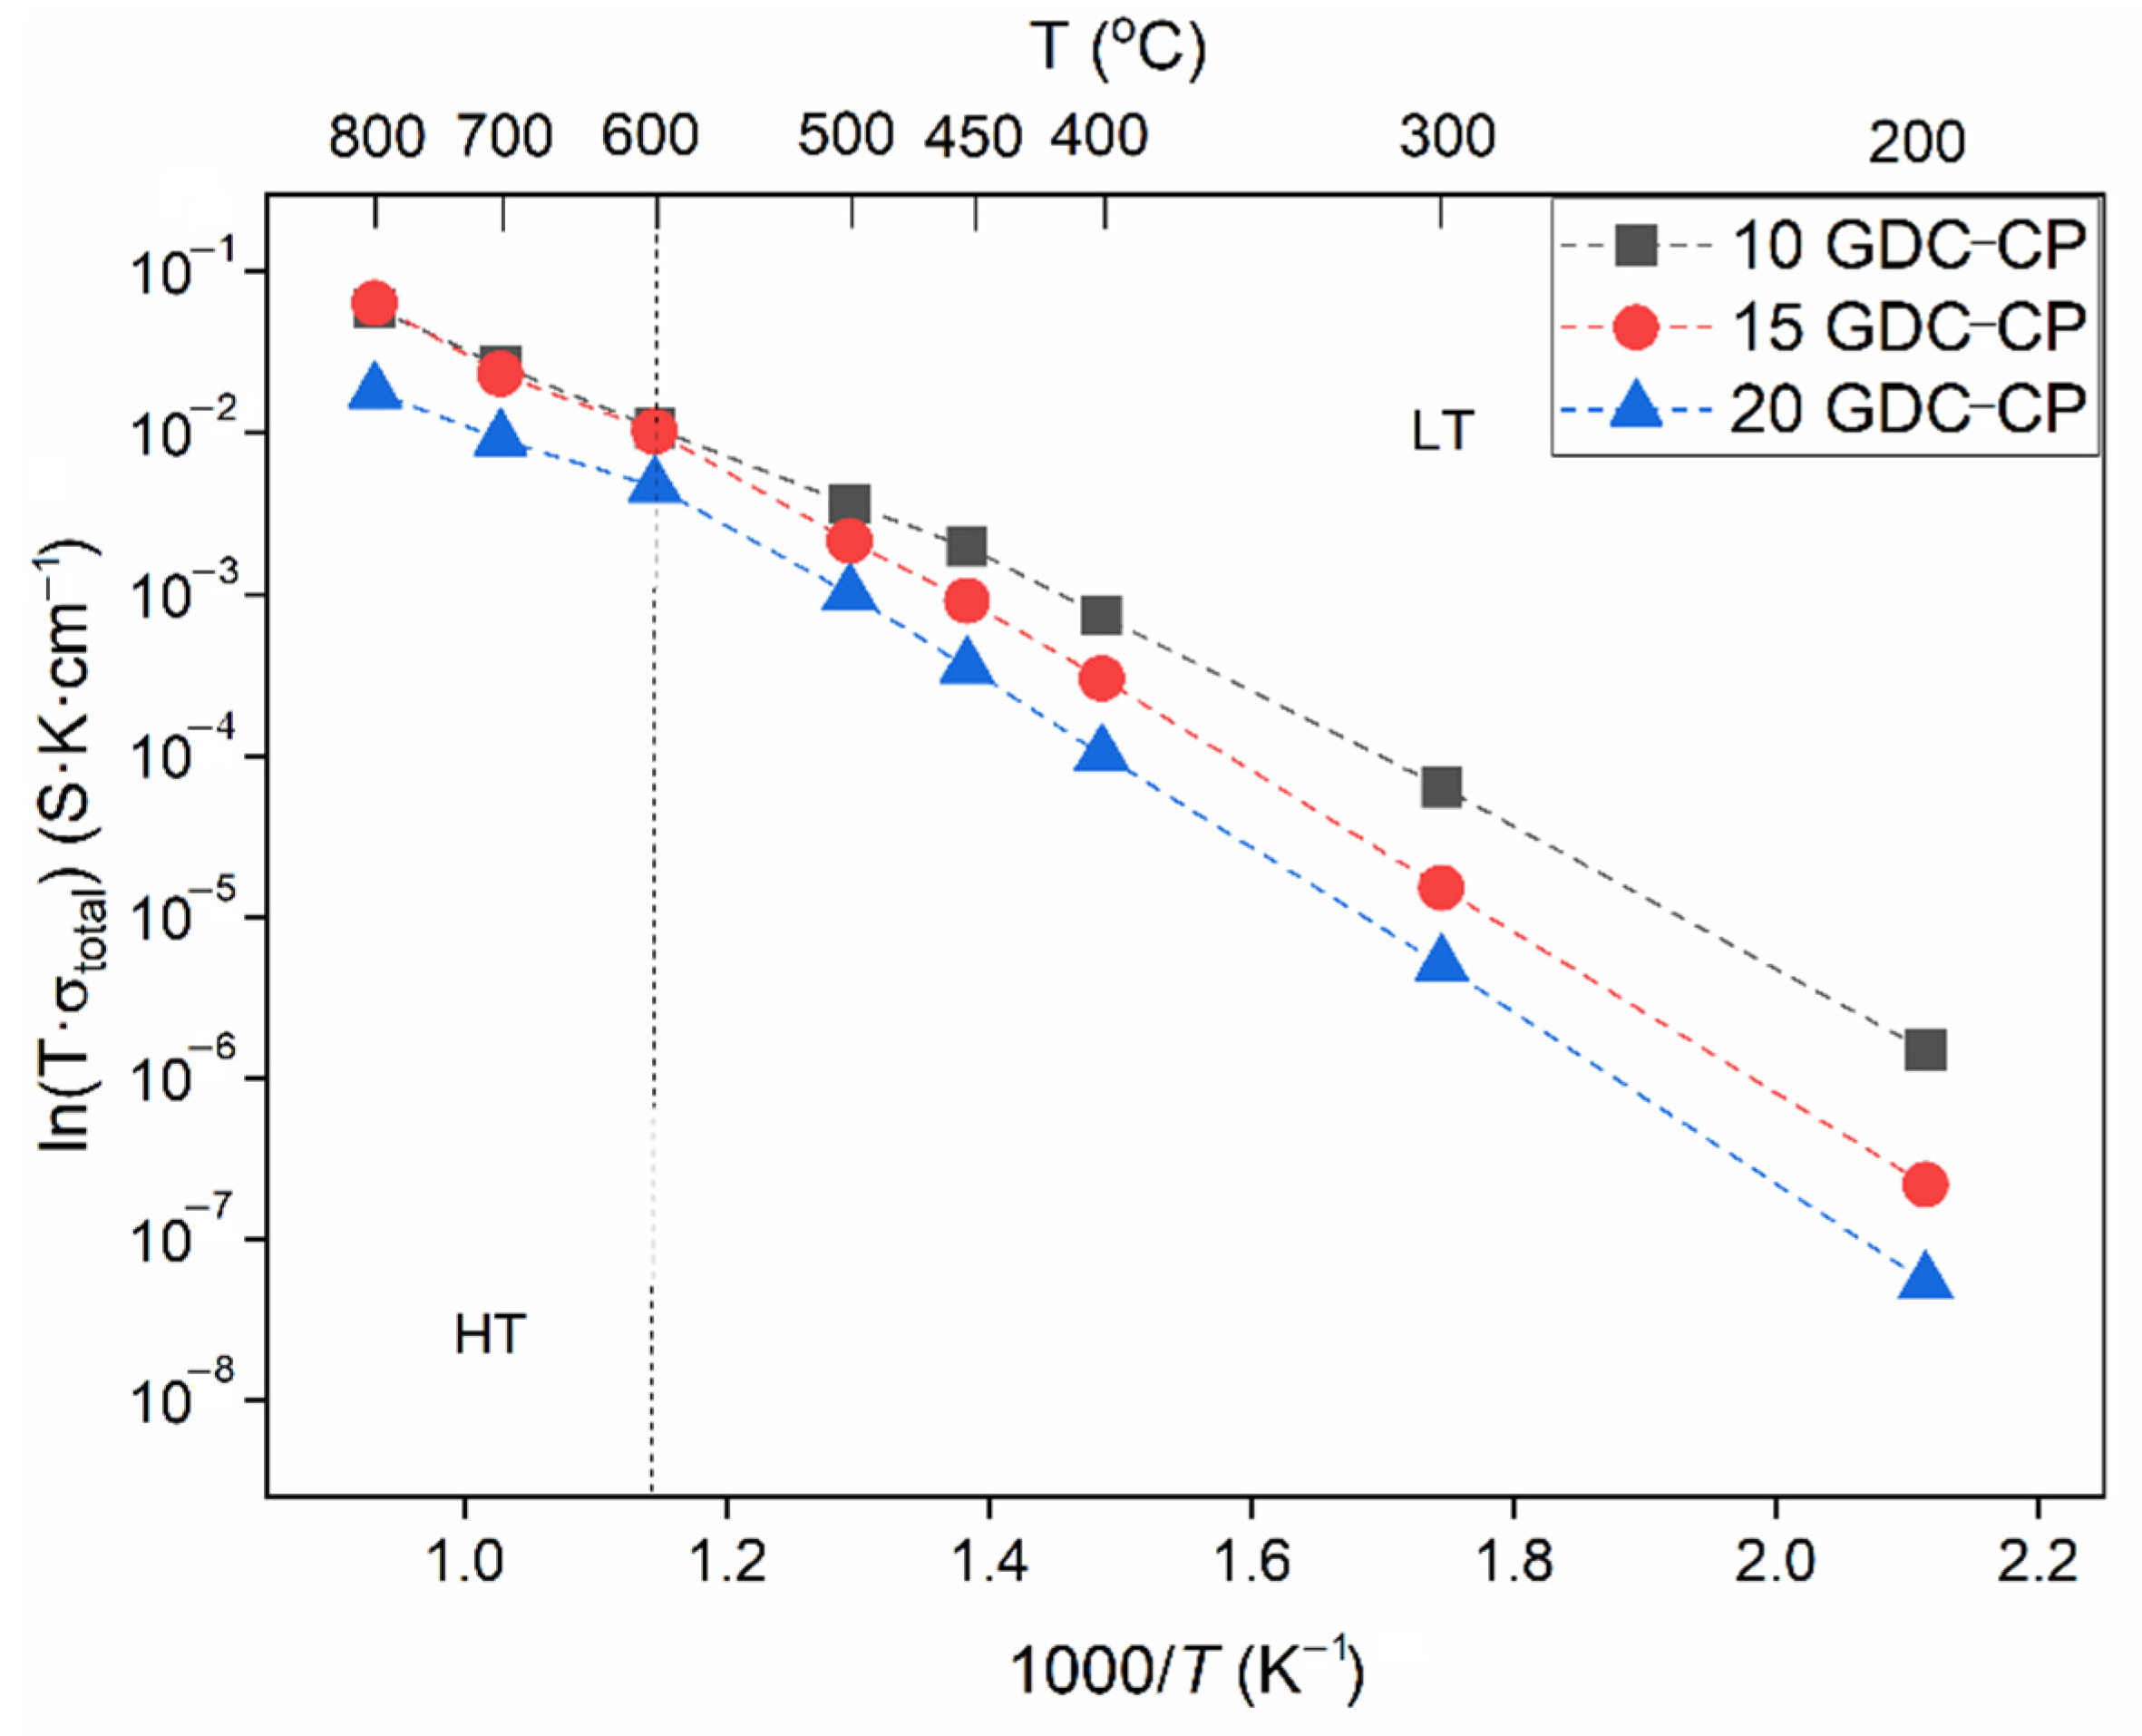
3.2. Characterization of the Pellets

To characterize the ionic conductivity of Ce1-xGdxO2-δ ceramics, the distribution of grains and the density of the pellets were calculated. The sintering quality of the ceramics and their microstructure are important factors for the analysis of ionic conductivity using impedance spectroscopy. Burcu et al. [44] found that the grain boundary resistance increased due to low sinterability and the increment of porosity in samarium-doped ceria electrolytes synthesized by the electrospinning method. The sinterability depends on the sintering temperature and time period, the diffusion coefficient of the atoms, and the dispersivity of the particles. Calcination of the fine-dispersive powders, with individual grains growing together, helps to reduce the porosity of the pellets from 30–50% to a few percent. Figure 3 presents SEM images of the cross-section of GDC pellets annealed at 1200 °C for 5 h. To perform SEM measurement, the pellets were broken in half. Due to the roughness of the surface after breaking the pellets, the sides were polished, cleaned with ethanol, and thermally etched at 1100 °C for 1 h.
The SEM results of the GDC pellets showed that they consisted of grains of different sizes, without visible defects or cracks. The ceramics were dense and with no porosity; the average grain sizes of the pellets were about 320 nm (10-GDC), 310 nm (15-GDC), and 302 nm (20-GDC). All synthesized GDC ceramics were investigated using AC impedance spectroscopy; the obtained complex impedance plots at different temperature and frequency ranges are presented in Figure 4. After measuring the complex resistance over a wide frequency range of electric field, it was possible to separate the different conductivity processes, such as the bulk, grain boundary, and total ionic conductivity.
The semicircle in the high-frequency range is related to the oxygen ion relaxation in the grain interior, while the semicircle in the medium-frequency range can be attributed to the ionic migration in the grain boundaries, and the semicircle in the low-frequency range corresponds to the electrode polarization (the frequency increase from right to left in the impedance spectra) [45,46,47]. From Figure 4, it can be seen that with the increase in the concentration of gadolinium, the resistance of the GDC pellets increased. The 20-GDC pellets showed the highest resistance at all temperature ranges, resulting in the lowest ionic conductivity, while the 10-GDC pellets had the lowest resistance and the highest conductivity. With the increasing temperature, we observed a decrease in the resistance, thus increasing the conductivity. Such results allow us to conclude that the conductivity of GDC ceramics depends on the concentration of Gd2O3. Koettgen et al. [48] showed the bulk and grain boundary conductivity values of Sm- and Gd-doped ceria, synthesized by the sol-gel method as a function of the dopant fraction. Comparing the different dopant concentrations of Gd-doped ceria with Sm-doped ceria, the largest bulk conductivity was reported for Ce0.93Sm0.07O1.965, leading to maximum total conductivity. The authors of an earlier study stated that the conductivity gained in value with increasing dopant and, subsequently, decreased with the further increment of dopant fraction [48]. In our own previous work, we compared the different concentrations (x = 0.1, 0.2, and 0.3) of SDC (samarium-doped ceria) synthesized using different synthesis methods and obtained the highest conductivity values for SDC synthesized by the combustion method, with x = 0.2 [49]. However, Wattanathana et al. [50] synthesized SDC (x = 0.1, 0.15, and 0.2) via the thermal decomposition of metal-organic complexes and reported the highest conductivity for 15 SDC, determining that the Sm3+ ions were replaced at the Ce4+ sites within the ceria structure. The authors stated that due to the formation of the amorphous Sm2O3 phase, increasing the doping concentration led to a lower conductivity value.
The temperature dependencies of the total ionic conductivity obey Arrhenius’ law [51] and its plot is presented in Figure 5.
Different temperature ranges (low- (LT) and high-temperature (HT) ranges), separated by the dashed line in Figure 5, occur due to the thermodynamics between defect species and their interactions, as well as the redox reactions, followed by the formation of polarons in the ceria lattice [51]. From the obtained results (Figure 5 and Table 2), we can observe the decrease in the activation energy in the high-temperature range for all concentrations of GDC. In the high-temperature range, the charge-carrying defects are dictated by intrinsic defects and no association enthalpy is present; thus, the activation energy decreases [52]. The activation energies determined from the Arrhenius plots, as a function of the molar concentration in GDC ceramic pellets, and the values of bulk, grain boundary, and total conductivity at 600 °C are presented in Table 2.
With an increase in the molar concentration, the total conductivity decreases, and the activation energy increases (Table 2). A similar tendency was sustained for the bulk and grain boundary conductivity. Thus, the highest total ionic conductivity of 11 × 10−3 S∙cm−1 at 600 °C, with the lowest activation energies at both LT and HT (0.85 and 0.67 eV, respectively), was found for 10-GDC. Similar results were obtained by Fuentes and Baker [53], who synthesized Gd0.1Ce0.9O1.95 by the sol-gel technique and reported a conductivity value of 11 × 10−3 S∙cm−1 (at 600 °C) for the samples sintered at 1300 °C for 8 h. Öksüzömer M.A.F. et al. [12] synthesized Gd0.1Ce0.9O1.95 and Gd0.2Ce0.8O1.9 powders through the polyol process and obtained higher conductivity values at 800 °C, with low activation energies for 10-GDC compared to 20-GDC (2.11 × 10⁻² and 2.01 × 10⁻² S∙cm−1, respectively). Jaiswal N. et.al. [54] reported values of ionic conductivity of 0.01 S cm−1 for Ce 0.9Gd0.1O1.95 and 3.02 × 10⁻³ S cm−1 for Ce0.85Gd0.15O1.925 at 500 °C. Murutoglu M. et al. [55] used the cold sintering-assisted densification of GDC and reported activation energy of 0.69 eV at a high temperature range. Zhang J. et. al. [56] compared the electrolytes for SOFC and found that, compared to ScSZ and YSZ at 500 °C, GDC had the highest ionic conductivity at 5.8 × 10⁻³ S cm−1.

3.3. Characterization of Thin Films

The synthesized Ce1-xGdxO2-δ pellets were evaporated on Si substrates using the electron beam evaporation (EB-PVD) technique. To study the effect of additional heat treatment on the properties of the formed GDC thin films, the samples were annealed at 600, 700, 800, and 900 °C for 1 h. The results determining the concentration of Gd2O3 in GDC thin films are summarized in Table 3.
From the chemical composition results, we can see that the molar content of Gd2O3 in all GDC thin films is lower by an average of 28% (31% for 10-GDC, 24.7% for 15-GDC, and 28% for 20-GDC) than the target material used in the EB-PVD process (Table 3). As we can see, thin films prepared using the 15-GDC ceramic pellets as a target material ensured the formation of 10-GDC thin films, the target of which (10-GDC ceramic pellet) had the highest ionic conductivity [14]. It should be noted that the evaporation process of the solid solution is complex, and many factors may influence the change in the chemical composition of thin films compared to the target material [57]. The changes occur due to the different evaporation temperatures and evaporation rates of the individual components, which experience the same process temperature. Metals evaporate as a function of temperature and vacuum level; high vacuum conditions lead to a greater evaporation rate. As a result, different elements evaporate at different evaporation rates, and the resultant chemical composition of the condensed material may vary, compared to the target material. Therefore, the composition of the deposited thin films using the evaporation technique may vary, compared to the target material.
The surface roughness and morphology of GDC thin films were studied by SEM and AFM and are presented in Figure 6. Annealing the films had an insignificant effect on the morphology and surface roughness of the films. GDC thin films at all temperatures were dense and quite rough, containing nanoscale grains. The thickness values fluctuated slightly (~800 nm), depending on the annealing temperature.
The roughness parameters were calculated from AFM images and the results are shown in Figure 7a. The roughness kurtosis (Rku) value showed that all films had a spiky surface (above 3 nm) and the highest values of 6.23 nm (10-GDC) and 7.48 nm (15-GDC) were in the films annealed at 800 °C, while the smallest values were obtained for the as-evaporated samples and the films annealed at 900 °C of all concentrations.
The root mean square values of the surface roughness (Rq) of 10-GDC fluctuated with the annealing temperature and had a maximum value of 18.08 nm at 600 °C, with the lowest value of 11.32 nm for as-evaporated films. The Rq values of 15-GDC showed a different tendency and increased with the increase in annealing temperature, reaching the maximum value of 15.29 nm at 800 °C. The calculated average height (Rz) gradually increased for 10-GDC and had a maximum of 48.44 nm at 900 °C, while for 15-GDC, the rapid increase in Rz had a maximum of 112.61 nm at 800 °C (Figure 7a). All recorded roughness parameters increased with the annealing temperature, since the mobility of atoms increased, which led to the agglomeration of particles and an increase in their size [58,59].
The results from the Raman spectroscopy measurements showed that all GDC thin films had a major band at 463 cm−1 (Figure 7b,c). Considering the fact that CeO2, annealed at 600 °C, shows a band at 475 cm−1 due to the F2g symmetric vibration of the cubic phase, while Gd2O3 shows a peak at ~360–370 cm−1, the absence of these features confirms the formation of a single phase [60,61,62,63]. According to Prasad D.H. et al. [22] the formation of a single cubic phase of GDC happens when Gd+3 ions partially occupy the interstitial spaces of the ceria lattice, which leads to a shift in the F2g symmetry. The obtained GDC peak at 463 cm−1 (Figure 7b,c) can be related to the symmetric vibration of Ce-O, with a shift of ~12 cm−1 toward a lower wavenumber. As can be seen from the obtained results, the intensity of the peaks increased with the increase in the annealing temperature of the films. This can be attributed to the improvement in the crystallinity of GDC thin films [64,65,66]. Moreover, with an increase in the doping concentration, the peaks became wider (from 17.8 cm−1 to 28.4 cm−1), which might be associated with the crystal size [64]. Regardless of the concentration of GDC films, the Raman peak shifted to lower frequencies with the increase in the annealing temperature. This behavior is a size-induced phenomenon observed in nanoscale systems, explained by the combined effects of lattice strain and associated with defect species and phonon confinement [64,65,66,67]. Kosacki et al. [66] and Weber et al. [67] stated that the width of the Raman peak has a linear dependence on the reciprocal of the crystal size. Similar behavior was reported by other authors [64,65,66,67]. El-Habib A. et. al. [68] presented Gd-doped CeO2 nanocrystalline thin films using spray pyrolysis and reported that the peak asymmetry and broadening of Raman spectra could be attributed to the existence of an oxygen vacancy and Ce3+, which changed with the addition of Gd3+. With a gradual increase in crystal size, there may be a simultaneous enhancement of defects in the thin film and the growth of other crystalline phases [67]. For the 10-GDC film, the peak intensities increased and showed their maximum position when annealed at 800 °C. However, the intensity dropped in the samples annealed at 900 °C. Different results were obtained for 15-GDC thin films, where the intensity had its maximum at 900 °C. This difference in results was associated with different growth rates depending on the concentration, and, at higher temperatures, these growths were more intense. Moreover, the changes in the Raman spectrum, depending on the concentration of gadolinium happen due to a reduction in the number of Ce–O8 vibrational units. The symmetrical stretching mode of the Ce–O8 is sensitive to the substitution of Ce4+ by Gd3+, and the changes in Raman spectrum shape and position are related to the lattice expansion induced by the substitution of Ce4+ (97 pm) by Gd3+ (105.3 pm) and the presence of oxygen vacancies [64,67]. Thus, the optimal annealing temperature for GDC thin films is up to 800 ° C since, at this temperature, the overall crystallinity and roughness of the films are improved.

4. Conclusions

Gadolinium-doped ceria ceramics, synthesized using a co-precipitation synthesis method at different Gd2O3 concentrations (10, 15, and 20 mol%), were used as a target material for the formation of ceria-based thin films by the EB-PVD technique. From the impedance spectroscopy measurements, we observed an increase in activation energy (Ea) and a decrease in total ionic conductivity (σtotal) with the increasing molar concentration of the material. Of the pellets, the 10 mol% Gd2O3-containing GDC ceramic pellet had the highest conductivity (where σtotal was 11 × 10−3 S∙cm−1 at 600 °C) and the lowest activation energy (where Ea was 0.85 eV (low-temperature region) and 0.67 eV (high-temperature region)). During the evaporation, a deviation in the individual component in the stoichiometry of the evaporated thin films occurred, while the decrease in the molar content of Gd2O3 in ~28% was lower than in the target material used for the process. Thus, to produce thin films by e-beam evaporation, one should have a target material with a higher concentration of gadolinium than is required for the desired concentration of the final material. This additional heat treatment resulted only in insignificant changes in the morphology of the films; the thickness and roughness values fluctuated, depending on the temperature. The Raman spectroscopy confirmed the improvement in the crystallinity of GDC thin films and the decrease in the grain boundary phase volume during the thermal annealing. The optimal annealing temperature for GDC thin films was found to be up to 800 °C as, at this temperature, the overall crystallinity and roughness of the films were improved.

Author Contributions

F.K.: Conceptualization, investigation, formal analysis, data curation, writing—original draft. A.Ž.: Visualization, investigation. A.V.: investigation. T.T.: Review, investigation. S.T.: Review and editing. B.A.: Writing—original draft, investigation, methodology, supervision. All authors have read and agreed to the published version of the manuscript.

Funding

The research was funded by project No P-LL-21-124 of a bilateral research funding program by the Research Council of Lithuania (LMT) and Narodowe Centrum Nauki (NCN) DAINA-2.

Institutional Review Board Statement

Not applicable.

Informed Consent Statement

Not applicable.

Data Availability Statement

Not applicable.

Conflicts of Interest

The authors declare no conflict of interest.

References

  1. Evans, A.; Bieberle-Hütter, A.; Rupp, J.L.M.; Gauckler, L.J. Review on microfabricated micro-solid oxide fuel cell membranes. J. Power Sources 2009, 194, 119–129. [Google Scholar] [CrossRef]
  2. Kim, K.J.; Park, B.H.; Kim, S.J.; Lee, Y.; Bae, H.; Choi, G.M. Micro solid oxide fuel cell fabricated on porous stainless steel: A new strategy for enhanced thermal cycling ability. Sci. Rep. 2016, 6, 22443. [Google Scholar] [CrossRef] [PubMed]
  3. Rupp, J.L.M.; Gauckler, L.J. Microstructures and electrical conductivity of nanocrystalline ceria-based thin films. Solid State Ion. 2006, 177, 2513–2518. [Google Scholar] [CrossRef]
  4. Beckel, D.; Bieberle-Hütter, A.; Harvey, A.; Infortuna, A.; Muecke, U.P.; Prestat, M.; Rupp, J.L.M.; Gauckler, L.J. Thin films for micro solid oxide fuel cells. J. Power Sources 2007, 173, 325–345. [Google Scholar] [CrossRef]
  5. Bieberle-Hütter, A.; Beckel, D.; Infortuna, A.; Muecke, U.P.; Rupp, J.L.M.; Gauckler, L.J.; Rey-Mermet, S.; Muralt, P.; Bieri, N.R.; Hotz, N.; et al. A micro-solid oxide fuel cell system as battery replacement. J. Power Sources 2008, 177, 123–130. [Google Scholar] [CrossRef]
  6. Yamamoto, O. Solid oxide fuel cells: Fundamental aspects and prospects. Electrochim. Acta 2000, 45, 2423–2435. [Google Scholar] [CrossRef]
  7. Wachsman, E.D.; Singhal, S.C. Solid oxide fuel cell commercialization, research, and challenges. Electrochem. Soc. Interface 2009, 18, 38–43. [Google Scholar] [CrossRef]
  8. van Gestel, T.; Sebold, D.; Buchkremer, P.H. Processing of 8YSZ and CGO thin film electrolyte layers for intermediate- and low-temperature SOFCs. J. Eur. Ceram. Soc. 2015, 35, 1505–1515. [Google Scholar] [CrossRef]
  9. Bae, J.; Lee, D.; Hong, S.; Yang, H.; Kim, Y.B. Three-dimensional hexagonal GDC interlayer for area enhancement of low-temperature solid oxide fuel cells. Surf. Coat. Technol. 2015, 279, 54–59. [Google Scholar] [CrossRef]
  10. Ji, S.; An, J.; Jang, D.Y.; Jee, Y.; Shim, J.H.; Cha, S.W. On the reduced electrical conductivity of radio-frequency sputtered doped ceria thin film by elevating the substrate temperature. Curr. Appl. Phys. 2016, 16, 324–328. [Google Scholar] [CrossRef]
  11. Jiang, S.P. Thermally and Electrochemically Induced Electrode/Electrolyte Interfaces in Solid Oxide Fuel Cells: An AFM and EIS Study. J. Electrochem. Soc. 2015, 162, F1119–F1128. [Google Scholar] [CrossRef] [Green Version]
  12. Öksüzömer, M.A.F.; Dönmez, G.; Sariboǧa, V.; Altinçekiç, T.G. Microstructure and ionic conductivity properties of gadolinia doped ceria (GdxCe1-xO2-x/2) electrolytes for intermediate temperature SOFCs prepared by the polyol method. Ceram. Int. 2013, 39, 7305–7315. [Google Scholar] [CrossRef]
  13. Wang, Y.; Mori, T.; Li, J.G.; Yajima, Y. Low-temperature fabrication and electrical property of 10 mol% Sm 2O3-doped CeO2 ceramics. Sci. Technol. Adv. Mater. 2003, 4, 229–238. [Google Scholar] [CrossRef] [Green Version]
  14. Chourashiya, M.G.; Jadhav, L.D. Synthesis and characterization of 10%Gd doped ceria (GDC) deposited on NiO-GDC anode-grade-ceramic substrate as half cell for IT-SOFC. Int. J. Hydrogen Energy 2011, 36, 14984–14995. [Google Scholar] [CrossRef]
  15. Fuentes, R.O.; Baker, R.T. Synthesis and properties of Gadolinium-doped ceria solid solutions for IT-SOFC electrolytes. Int. J. Hydrog. Energy 2008, 33, 3480–3484. [Google Scholar] [CrossRef]
  16. Zarkov, A.; Stanulis, A.; Salkus, T.; Kezionis, A.; Jasulaitiene, V.; Ramanauskas, R.; Tautkus, S.; Kareiva, A. Synthesis of nanocrystalline gadolinium doped ceria via sol-gel combustion and sol-gel synthesis routes. Ceram. Int. 2016, 42, 3972–3988. [Google Scholar] [CrossRef]
  17. Dell’Agli, G.; Spiridigliozzi, L.; Marocco, A.; Accardo, G.; Ferone, C.; Cioffi, R. Effect of the mineralizer solution in the hydrothermal synthesis of gadolinium-doped (10% mol Gd) ceria nanopowders. J. Appl. Biomater. Funct. Mater. 2016, 14, e189–e196. [Google Scholar] [CrossRef] [Green Version]
  18. Dönmez, G.; Sariboʇa, V.; Altinçekiç, T.G.; Öksüzömer, M.A.F. Polyol synthesis and investigation of Ce1-535 xRExO2-x/2 (RE = Sm, Gd, Nd, La, 0 ≤ x ≤ 0.25) electrolytes for IT-SOFCs. J. Am. Ceram. Soc. 2014, 98, 501–509. [Google Scholar] [CrossRef]
  19. Liu, A.Z.; Wang, J.X.; He, C.R.; Miao, H.; Zhang, Y.; Wang, G.W. Synthesis and characterization of Gd0.1Ce0.9O 1.95 nanopowder via an acetic-acrylicmethod. Ceram. Int. 2013, 39, 6229–6235. [Google Scholar] [CrossRef]
  20. Biesuz, M.; Dell’Agli, G.; Spiridigliozzi, L.; Ferone, C.; Sglavo, V.M. Conventional and field-assisted sintering of nanosized Gd-doped ceria synthesized by co-precipitation. Ceram. Int. 2016, 42, 11766–11771. [Google Scholar] [CrossRef]
  21. Hsieh, T.H.; Ray, D.T.; Fu, Y.P. Co-precipitation synthesis and AC conductivity behavior of gadolinium-doped ceria. Ceram. Int. 2013, 39, 7967–7973. [Google Scholar] [CrossRef]
  22. Prasad, D.H.; Kim, H.R.; Park, J.S.; Son, J.W.; Kim, B.K.; Lee, H.W.; Lee, J.H. Superior sinterability of nano-crystalline gadolinium doped ceria powders synthesized by co-precipitation method. J. Alloys Compd. 2010, 495, 238–241. [Google Scholar] [CrossRef]
  23. Ikuma, Y.; Takao, K.; Kamiya, M.; Shimada, E. X-ray study of cerium oxide doped with gadolinium oxide fired at low temperatures. Mater. Sci. Eng. B Solid-State Mater. Adv. Technol. 2003, 99, 48–51. [Google Scholar] [CrossRef]
  24. Zha, S.; Xia, C.; Meng, G. Effect of Gd (Sm) doping on properties of ceria electrolyte for solid oxide fuel cells. J. Power Sources 2003, 115, 44–48. [Google Scholar] [CrossRef]
  25. Tianshu, Z.; Hing, P.; Huang, H.; Kilner, J. Ionic conductivity in the CeO2-Gd2O3 system (0.05 ≤ Gd/Ce ≤ 0.4) prepared by oxlate coprecipitation. Solid State Ion. 2002, 148, 567–573. [Google Scholar] [CrossRef]
  26. Arabaci, A.; Solak, N. High Temperature—FTIR Characterization of Gadolinia Doped Ceria. Adv. Sci. Technol. 2010, 72, 249–254. [Google Scholar] [CrossRef]
  27. Arabac, A.; Öksüzömer, M.F. Preparation and characterization of 10 mol% Gd doped CeO 2 (GDC) electrolyte for SOFC applications. Ceram. Int. 2012, 38, 6509–6515. [Google Scholar] [CrossRef]
  28. Shao, Z.; Zhou, W.; Zhu, Z. Advanced synthesis of materials for intermediate-temperature solid oxide fuel cells. Prog. Mater. Sci. 2012, 57, 804–874. [Google Scholar] [CrossRef]
  29. Paek, J.Y.; Chang, I.; Park, J.H.; Ji, S.; Cha, S.W. A study on properties of yttrium-stabilized zirconia thin films fabricated by different deposition techniques. Renew. Energy 2014, 65, 202–206. [Google Scholar] [CrossRef]
  30. Huang, H.H.; Diao, C.C.; Yang, C.F.; Huang, C.J. Effects of substrate temperatures on the crystallizations and microstructures of electron beam evaporation YSZ thin films. J. Alloys Compd. 2010, 500, 82–86. [Google Scholar] [CrossRef]
  31. Laukaitis, G.; Dudonis, J. Microstructure of gadolinium doped ceria oxide thin films formed by electron beam deposition. J. Alloys Compd. 2008, 459, 320–327. [Google Scholar] [CrossRef]
  32. Galdikas, A.; Čerapaite-Trušinskiene, R.; Laukaitis, G.; Dudonis, J. Real-time kinetic modeling of YSZ thin film roughness deposited by e-beam evaporation technique. Appl. Surf. Sci. 2008, 62, 941–946. [Google Scholar] [CrossRef]
  33. Sakaliuniene, J.; Čyviene, J.; Abakevičiene, B.; Dudonis, J. Investigation of structural and optical properties of GDC thin films deposited by reactive magnetron sputtering. Acta Phys. Pol. A 2011, 120, 63–65. [Google Scholar] [CrossRef]
  34. Hong, Y.S.; Kim, S.H.; Kim, W.J.; Yoon, H.H. Fabrication and characterization GDC electrolyte thin films by e-beam technique for IT-SOFC. Curr. Appl. Phys. 2011, 11, S163–S168. [Google Scholar] [CrossRef]
  35. Hartmanová, M.; Jergel, M.; Thurzo, I.; Kundracik, F.; Gmucová, K.; Chromik, S.; Ortega, L. Thin Film Electrolytes: Yttria Stabilized Zirconia and Ceria. Russ. J. Electrochem. 2003, 39, 478–486. [Google Scholar] [CrossRef]
  36. Laukaitis, G.; Virbukas, D. The structural and electrical properties of GDC10 thin films formed by e-beam technique. Solid State Ion. 2013, 247–248, 41–47. [Google Scholar] [CrossRef]
  37. Chandran, P.R.; Arjunan, T.V. A review of materials used for solid oxide fuel cell. Int. J. ChemTech Res. 2015, 7, 488. [Google Scholar]
  38. Ji, S.; Chang, I.; Lee, Y.H.; Park, J.; Paek, J.Y.; Lee, M.H.; Cha, S.W. Fabrication of low-temperature solid oxide fuel cells with a nanothin protective layer by atomic layer deposition. Nanoscale Res. Lett. 2013, 8, 48. [Google Scholar] [CrossRef] [Green Version]
  39. Saporiti, F.; Juarez, R.E.; Audebert, F.; Boudard, M. Yttria and ceria doped zirconia thin films grown by pulsed laser deposition. Mater. Res. 2013, 16, 655–660. [Google Scholar] [CrossRef] [Green Version]
  40. Uhlenbruck, S.; Jordan, N.; Sebold, D.; Buchkremer, H.P.; Haanappel, V.A.C.; Stöver, D. Thin film coating technologies of (Ce,Gd)O2-δ interlayers for application in ceramic high-temperature fuel cells. Thin Solid Film. 2007, 515, 4053–4060. [Google Scholar] [CrossRef]
  41. Wibowo, R.A.; Kim, W.S.; Lee, E.S.; Munir, B.; Kim, K.H. Single step preparation of quaternary Cu2 ZnSnSe4 thin films by RF magnetron sputtering from binary chalcogenide targets. J. Phys. Chem. Solids 2007, 68, 1908–1913. [Google Scholar] [CrossRef]
  42. Li, J.G.; Wang, Y.; Ikegami, T.; Mori, T.; Ishigaki, T. Reactive 10 mol% RE2O3 (RE = Gd and Sm) doped CeO2 nanopowders: Synthesis, characterization, and low-temperature sintering into dense ceramics. Mater. Sci. Eng. B Solid-State Mater. Adv. Technol. 2005, 121, 54–59. [Google Scholar] [CrossRef]
  43. Zha, S.; Moore, A.; Abernathy, H.; Liu, M. GDC-Based Low-Temperature SOFCs Powered by Hydrocarbon Fuels. J. Electrochem. Soc. 2004, 151, A1128–A1133. [Google Scholar] [CrossRef]
  44. Aygün, B.; Özdemir, H.; Öksüzömer, M.A.F. Structural, morphological and conductivity properties of samaria doped ceria (SmxCe1-xO2-x/2) electrolytes synthesized by electrospinning method. Mater. Chem. Phys. 2019, 232, 82–87. [Google Scholar] [CrossRef]
  45. Zhan, Z.; Wen, T.-L.; Tu, H.; Lu, Z.-Y. AC Impedance Investigation of Samarium-Doped Ceria. J. Electrochem. Soc. 2001, 148, A427–A432. [Google Scholar] [CrossRef]
  46. Toor, S.Y.; Croiset, E. Reducing sintering temperature while maintaining high conductivity for SOFC electrolyte: Copper as sintering aid for Samarium Doped Ceria. Ceram. Int. 2020, 46, 1148–1157. [Google Scholar] [CrossRef]
  47. Huang, Q.A.; Liu, M.; Liu, M. Impedance Spectroscopy Study of an SDC-based SOFC with High Open Circuit Voltage. Electrochim. Acta 2015, 177, 227–236. [Google Scholar] [CrossRef] [Green Version]
  48. Koettgen, J.; Martin, M. The ionic conductivity of Sm-doped ceria. J. Am. Ceram. Soc. 2020, 103, 3776–3787. [Google Scholar] [CrossRef] [Green Version]
  49. Kalyk, F.; Stankevičiūtė, A.; Budrytė, G.; Gaidamavičienė, G.; Žalga, A.; Kriūkienė, R.; Kavaliauskas, Ž.; Leszczyńska, M.; Abakevičienė, B. Comparative study of samarium-doped ceria nanopowders synthesized by various chemical synthesis routes. Ceram. Int. 2020, 46, 24385–24394. [Google Scholar] [CrossRef]
  50. Wattanathana, W.; Veranitisagul, C.; Wannapaiboon, S.; Klysubun, W.; Koonsaeng, N.; Laobuthee, A. Samarium doped ceria (SDC) synthesized by a metal triethanolamine complex decomposition method: Characterization and an ionic conductivity study. Ceram. Int. 2017, 43, 9823–9830. [Google Scholar] [CrossRef]
  51. Anantharaman, S.B.; Bauri, R. Effect of sintering atmosphere on densification, redox chemistry and conduction behavior of nanocrystalline Gd-doped CeO2 electrolytes. Ceram. Int. 2013, 39, 9421–9428. [Google Scholar] [CrossRef]
  52. Mokkelbost, T.; Kaus, I.; Grande, T.; Einarsrud, M.A. Combustion synthesis and characterization of nanocrystalline CeO2-based powders. Chem. Mater. 2004, 16, 5489–5494. [Google Scholar] [CrossRef]
  53. Fuentes, R.O.; Baker, R.T. Structural, morphological and electrical properties of Gd0.1Ce0.9O1.95 prepared by a citrate complexation method. J. Power Sources 2009, 186, 268–277. [Google Scholar] [CrossRef]
  54. Murutoglu, M.; Ucun, T.; Ulasan, O.; Buyukaksoy, A.; Tur, Y.K.; Yilmaz, H. Cold sintering-assisted densification of GDC electrolytes for SOFC applications. Int. J. Hydrog. Energy 2022, 47, 19772–19779. [Google Scholar] [CrossRef]
  55. Zhang, J.; Lenser, C.; Menzler, N.H.; Guillon, O. Comparison of solid oxide fuel cell (SOFC) electrolyte materials for operation at 500 °C. Solid State Ion. 2020, 344, 115138. [Google Scholar] [CrossRef]
  56. Jaiswal, N.; Tanwar, K.; Suman, R.; Kumar, D.; Upadhyay, S.; Parkash, O. A brief review on ceria based solid electrolytes for solid oxide fuel cells. J. Alloys Compd. 2019, 781, 984–1005. [Google Scholar] [CrossRef]
  57. Mackay, D.; van Wesenbeeck, I. Correlation of chemical evaporation rate with vapor pressure. Environ. Sci. Technol. 2014, 48, 10259–10263. [Google Scholar] [CrossRef]
  58. Hajakbari, F.; Ensandoust, M. Study of thermal annealing effect on the properties of silver thin films prepared by DC magnetron sputtering. Acta Phys. Pol. A 2016, 129, 680–682. [Google Scholar] [CrossRef]
  59. Otieno, F.; Airo, M.; Erasmus, R.M.; Quandt, A.; Billing, D.G.; Wamwangi, D. Annealing effect on the structural and optical behavior of ZnO:Eu3+ thin film grown using RF magnetron sputtering technique and application to dye sensitized solar cells. Sci. Rep. 2020, 10, 8557. [Google Scholar] [CrossRef]
  60. Medisetti, S.; Ahn, J.; Patil, S.; Goel, A.; Bangaru, Y.; Sabhahit, G.V.; Babu, G.U.B.; Lee, J.H.; Dasari, H.P. Synthesis of GDC electrolyte material for IT-SOFCs using glucose & fructose and its characterization. Nano-Struct. Nano-Objects 2017, 11, 7–12. [Google Scholar] [CrossRef]
  61. Khalipova, O.S.; Lair, V.; Ringuedé, A. Electrochemical synthesis and characterization of Gadolinia-Doped Ceria thin films. Electrochim. Acta 2014, 116, 183–187. [Google Scholar] [CrossRef]
  62. Matta, J.; Courcot, D.; Abi-Aad, E.; Aboukaïs, A. Identification of vanadium oxide species and trapped single electrons in interaction with the CeVO4 phase in vanadium-cerium oxide systems. 51V MAS NMR, EPR, Raman, and thermal analysis studies. Chem. Mater. 2002, 14, 4118–4125. [Google Scholar] [CrossRef]
  63. Jadhav, L.D.; Patil, S.P.; Jamale, A.P.; Chavan, A.U. Solution combustion synthesis: Role of oxidant to fuel ratio on powder properties. Mater. Sci. Forum 2013, 757, 85–98. [Google Scholar] [CrossRef]
  64. Zarkov, A.; Stanulis, A.; Mikoliunaite, L.; Katelnikovas, A.; Jasulaitiene, V.; Ramanauskas, R.; Tautkus, S.; Kareiva, A. Chemical solution deposition of pure and Gd-doped ceria thin films: Structural, morphological and optical properties. Ceram. Int. 2017, 43, 4280–4287. [Google Scholar] [CrossRef]
  65. Saitzek, S.; Blach, J.F.; Villain, S.; Gavarri, J.R. Nanostructured ceria: A comparative study from X-ray diffraction, Raman spectroscopy and BET specific surface measurements. Phys. Status Solidi Appl. Mater. Sci. 2008, 205, 1534–1539. [Google Scholar] [CrossRef]
  66. Taniguchi, T.; Watanabe, T.; Sugiyama, N.; Subramani, A.K.; Wagata, H.; Matsushita, N.; Yoshimura, M. Identifying defects in ceria-based nanocrystals by UV resonance Raman spectroscopy. J. Phys. Chem. C 2009, 113, 19789–19793. [Google Scholar] [CrossRef]
  67. Chin, H.S.; Chao, L.S. The effect of thermal annealing processes on structural and photoluminescence of zinc oxide thin film. J. Nanomater. 2013, 2013, 424953. [Google Scholar] [CrossRef]
  68. El-Habib, A.; Addou, M.; Aouni, A.; Diani, M.; Zimou, J.; Bouachri, M.; Brioual, B.; Allah, R.F.; Rossi, Z.; Jbilou, M. Oxygen vacancies and defects tailored microstructural, optical and electrochemical properties of Gd doped CeO2 nanocrystalline thin films. Mater. Sci. Semicond. Process. 2022, 145, 106631. [Google Scholar] [CrossRef]
Figure 1. Thermal analysis curves (a) for 10-GDC ceramic powders and (b) the X-ray diffraction patterns of GDC nanopowders, calcined at 900 °C and 1200 °C.
Coatings 12 00747 g001
Figure 2. SEM images of 10-GDC ceramic powders calcined at (a) 800 °C, (b) 900 °C, and (c) 1200 °C for 5 h.
Coatings 12 00747 g002
Figure 3. SEM images of the cross-section view of (a) 10-GDC, (b) 15-GDC, and (c) 20-GDC ceramic pellets at 100 k magnification.
Coatings 12 00747 g003
Figure 4. Complex impedance plots at: (a) 250 °C, (b) 400 °C, (c) 600 °C, and (d) 800 °C of the different compositions of GDC pellets annealed at 1200 °C. An example of an equivalent circuit, where CPE is the constant phase element, and R is the resistance for bulk, grain boundary, and electrode has been inserted in the top left-hand corner of (a).
Coatings 12 00747 g004
Figure 5. Temperature dependence of total conductivity of GDC ceramic pellets. The dashed line shows the separation of high- (HT) and low-temperature (LT) ranges.
Coatings 12 00747 g005
Figure 6. Photo, SEM cross-section view, and 3D AFM images of (a) 10-GDC and (b) 15-GDC thin films: as-evaporated (left) and annealed at 800 °C (right).
Coatings 12 00747 g006
Figure 7. (a) Surface roughness parameters calculated from the AFM images of 10-GDC and 15-GDC thin films: as-evaporated, and after additional thermal treatment, where Rq is the root mean square and Rz is the average height. Raman spectra of (b) 10-GDC and (c) 15-GDC thin films: unheated, and after additional thermal treatment at 600, 700, 800, and 900 °C for 1 h.
Coatings 12 00747 g007
Table 1. The summary of the elemental analysis results and the physical properties of the GDC ceramic powders, calcined at 900 °C.
SampleExpected Molar Ratio of Gd to Ce in GDCGd Content in GDC from
ICP-OES (r.u.)
Gd Content in
GDC from EDS (r.u.)
SBET (m2/g)D
(nm)
dth (g/cm3)DBET (nm)ϕ (r.u.)
10-GDC0.18: 0.820.180.1611.732.67.23570.32.156
15-GDC0.26: 0.740.260.2510.1932.77.24481.42.489
20-GDC0.33: 0.670.330.327.731.17.251108.03.472
Table 2. Values of the bulk (ΔEb), grain boundary (ΔEgb), and total (ΔEtotal) conductivity and activation energy of GDC ceramic pellets at low- (LT) and high-temperature (HT) ranges.
SampleΔEa (eV)Total Conductivity (S∙cm−1)
LTHT400 °C600 °C800 °C
10-GDC0.850.670.7 × 10−311 × 10−35.9 × 10−2
15-GDC0.950.800.3 × 10−310 × 10−36.3 × 10−2
20-GDC0.990.850.1 × 10−34.7 × 10−31.8 × 10−2
Table 3. The chemical composition of evaporated 10-, 15-, and 20-GDC thin films, obtained from XPS and ICP-OES measurements.
NotationGd Content in GDC from
ICP-OES (r.u.)
Gd Content in Thin Film from XPS (r.u.)Molar Content of Gd2O3 in Thin Film (mol%)Decrease in the Molar Content of Gd2O3 in Thin Film (%)
10-GDC0.130.136.9031.0
15-GDC0.210.2011.324.7
20-GDC0.270.2614.428.0
Publisher’s Note: MDPI stays neutral with regard to jurisdictional claims in published maps and institutional affiliations.

