Article

Numerical Simulation and Experimental Investigation of SiC/Ti-6Al-4V Metal Matrix Composites Produced by Laser Melt Injection

1
State Key Lab of Advanced Technology for Materials Synthesis and Processing, Wuhan University of Technology, Wuhan 430070, China
2
Wuhan Second Ship Design and Research Institute, Wuhan 430205, China
*
Author to whom correspondence should be addressed.
Coatings 2022, 12(6), 808; https://doi.org/10.3390/coatings12060808
Submission received: 17 May 2022 / Revised: 30 May 2022 / Accepted: 7 June 2022 / Published: 9 June 2022

Abstract

:
In this work, a 3D transient finite element (F.E.) model was established to investigate the temperature field distribution in laser processing of the Ti-6Al-4V substrate. The influences of laser power and scanning velocity on the molten pool state were analyzed. In an integrated model considering the length, temperature, and lifetime of the tail area of the molten pool, a laser power of 2.5 kW and a scanning velocity of 60 mm/s are thought to be suitable for laser melt injection. Particle reinforced metal matrix composite coating with a thickness of about 250 μm was prepared on the Ti-6Al-4V surface under the above process. It was found that the microstructure and hardness of the coating gradient varied along the depth direction. The maximum hardness of the coating can reach 1729.5 HV, which is much higher than that of the Ti-6Al-4V substrate.

1. Introduction

Titanium alloys are extensively used in aerospace, marine, medical, chemical, and other fields owing to their excellent low density, high strength, and good corrosion resistance. However, its poor wear resistance limits its potential applications [1,2,3]. The preparation of particle reinforced metal matrix composite coating on the Ti-6Al-4V surface by surface engineering technology is an effective way to improve its surface friction properties [4,5,6]. Ayers et al. proposed an advanced surface engineering technology, laser melt injection (LMI), which directly injects ceramic particles into the molten pool on the surface of the substrate. During the solidification of the molten pool, particles are trapped and finally form a reinforced metal matrix composite coating on the metal surface [7].
Various ceramic particles have been utilized to enhance metal alloys by the LMI process [8,9,10,11]. With stable chemical properties, high thermal conductivity, and high hardness, SiC is the most commonly used strengthening material for strengthening Ti-6Al-4V. However, SiC is often burned and melted during LMI processing for its high thermal absorption of laser [12]. Kloosterman et al. showed that positioning the powder stream out of the laser beam is a desirable way to reduce the reaction between SiC and molten Ti [13]. Pei et al. further confirmed this view. In their study, SiC particles were injected into the tail of the molten pool, which is outside the laser beam irradiation range. They prepared SiC/Ti-6Al-4V functionally graded material (FGM) layer and found that increasing beam velocity can increase the tail part of the molten pool by numerical calculation [14]. The effect of powder injection at the tail of the molten pool is closely related to the size of the molten pool. Although scholars have performed the research and achieved good experimental results, it cannot be measured precisely by experimental methods due to the small size of the melt pool and the short existence time. Many exploratory experiments are often needed to explore the parameter. Introducing numerical simulation into LMI helps quickly and efficiently predict the influence law of laser regularity on molten pool morphology and can complete process optimization at the least cost [15].
Current numerical simulation reports in the field of LMI mainly focus on particle movement [16,17]. Nevertheless, finite element analysis of temperature field distribution in laser processing is mature in other related regions. Liu et al. set up a single channel laser melting model of AISI H13 under wide beam mode. The influence of laser power, absorption rate, laser power efficiency, preheating temperature, and scanning velocity on the peak temperature of the molten pool was investigated [18]. Sun et al. simulated the laser melting cladding process of Ni60A. The numerical simulation results matched well with the experiment, and the FEM model could predict the differences of coatings with the developed laser power attenuation model [19]. Akbari et al. developed a three-dimensional transient finite element model for numerically simulating the TC4 laser welding process. According to the research results, the variation of weld geometry (width and depth) could be estimated by considering the temperature change around the molten pool [20].
In this paper, the three-dimensional transient model of the Ti-6Al-4V laser single-channel scanning process was established by the finite element method. The influence of laser power and scanning velocity on the temperature field distribution of the molten pool, especially the tail of the molten pool, was studied. Numerical simulations were carried out to optimize the LMI experimental process parameters, and the experiments verified the results of the numerical simulations. It was found that SiC was successfully injected into the surface of the substrate and significantly improved its surface hardness. The research provides a useful reference for the LMI process.

2. Finite Element Model

2.1. Governing Equation

The laser melt injection process is a typical nonlinear transient heat conduction problem. The governing equation of the temperature field can be described as follows [21].
ρ C T τ = x ( λ x T x ) + y ( λ y T y ) + z ( λ z T z ) + q v
where ρ is density (kg m−3), C is temperature-dependent specific heat capacity (J kg−1 °C−1), T is the temperature (°C), qv is the laser input heat (W m−2), and λx, λy, λz represent the thermal conductivity along x, y, z (W m1 K1).
The heat transfer process is shown in Figure 1. Considering the heat exchange between materials and the surrounding environment, part of the heat is dissipated on the surface of the material by convection and radiation [22]:
λ T n = q v h 1 ( T T 0 ) δ ε ( T 4 T 0 4 )
where n is the normal vector of the surface; h1 is the convective coefficient (W m−2 °C−1); T0 is room temperature (°C); δ is the Stefan Boltzmann constant (5.67 × 10⁻⁸ W/m2 K4).

2.2. Assumptions

  • Material is isotropic, continuous, and uniform.
  • The fluid flow of the molten pool is ignored.
  • Vaporization of materials is ignored.
  • The effect of adding particles to the molten pool is ignored.
  • The thermal properties of the experimental platform do not vary with temperature.

2.3. Material Properties

Material properties are given in Table 1 [23]. The material of the experimental platform is stainless steel, whose thermo-physical properties are set to constants. Thermal conductivity is 49 W m−1 K−1, density is 7 kg m−3, and specific heat is 0.49 J K−1 g−1 [23].
In this work, the phase transformation of the material in the laser melt injection process is considered. The enthalpy can be calculated by the Formula (3), and it is defined as the material property changing with temperature [24].
H = ρ C ( T ) d T
where H is the enthalpy of material (J); T is the material temperature (°C). Solid-state and solid–liquid phase transformation of Ti-6Al-4V occur at 995 and 1650 °C, separately.

2.4. The Meshing of 3D Finite Element Model

Due to symmetry, half of the workpiece is calculated, where the green surface is the symmetric plane. As shown in Figure 2, The model is divided into two parts: substrate and platform. In the case of meshing using solid 70 elements, the laser-irradiated and its adjacent region meshes into cubes with a side length of 0.1 mm, and the platform meshes into cubes with a side length of 1 mm. The transition region meshes into tetrahedral units by free meshing.

2.5. Initial and Boundary Conditions

The initial temperature is 25 °C. Convection and radiation boundary conditions are added to all outer surfaces of the model except the bottom and symmetry surfaces. A combined heat transfer coefficient for the radiation and convection boundary conditions is calculated as formula (3) [25,26].
h c = 24.1 × 10 4 × ε × T
where hc is the combined heat transfer coefficient, and T is the material temperature.
In this study, the Gaussian heat source model is used, and the heat flux expression of the Gaussian heat source is as follows [27]:
q = 2 η p π r 2 exp ( 2 ω 2 r 2 )
where p is the laser power (w), η is the absorptivity of laser power, generally assumed constant. In this model, η is set to 0.25 [28]. r is the spot radius (mm), and ω is the distance from the heat source center (mm).

3. Experiment Condition

The experimental system is composed of Raycus RFL-C6000 fiber laser operating, KR-60HA KUKA six-axis linkage robot, DPSF-2 powder feeder, and a self-developed side-axis powder feeder in the laboratory. The experimental materials are 75 μm SiC ceramic particles with 99% purity and Ti-6Al-4V alloy with 66 mm × 33 mm × 5 mm size. The surface oxide scale was removed by the grinding wheel before the experiment. The experimental process parameters are shown in Table 2. Among them, the values of laser power and scanning velocity were determined by numerical simulation results. The feeding position can be determined by adjusting the feeding tube angle in the experiment.
After the treatment, the transverse section of the processed layer was cut and polished. The samples were etched with Kroll (HF: HNO3: H2O = 1:3:30) reagent. The composite layer was investigated on the polished surface of the laser track by a X-ray diffractometer (Malvern Panalytical, Almelo, Netherlands), in which CuKα was used as the radiation source. The hardness of the coating was measured by a Wilson Tukon 1202 Vickers (Wilson Hardness, Norwood, MA, USA). The load used was 300 g and the loading time was 30 s. The microstructure of the composite layer was observed by Zeiss Ultra Plus field emission scanning electron microscope with X-Max 50 X-ray spectrometer (Zeiss, Oberkochen, Germany) and JSM-IT300 scanning electron microscope with X-MaxN20 spectrometer (FEI Company, Hillsboro, OR, USA).

4. Numerical Simulation Results and Discussion

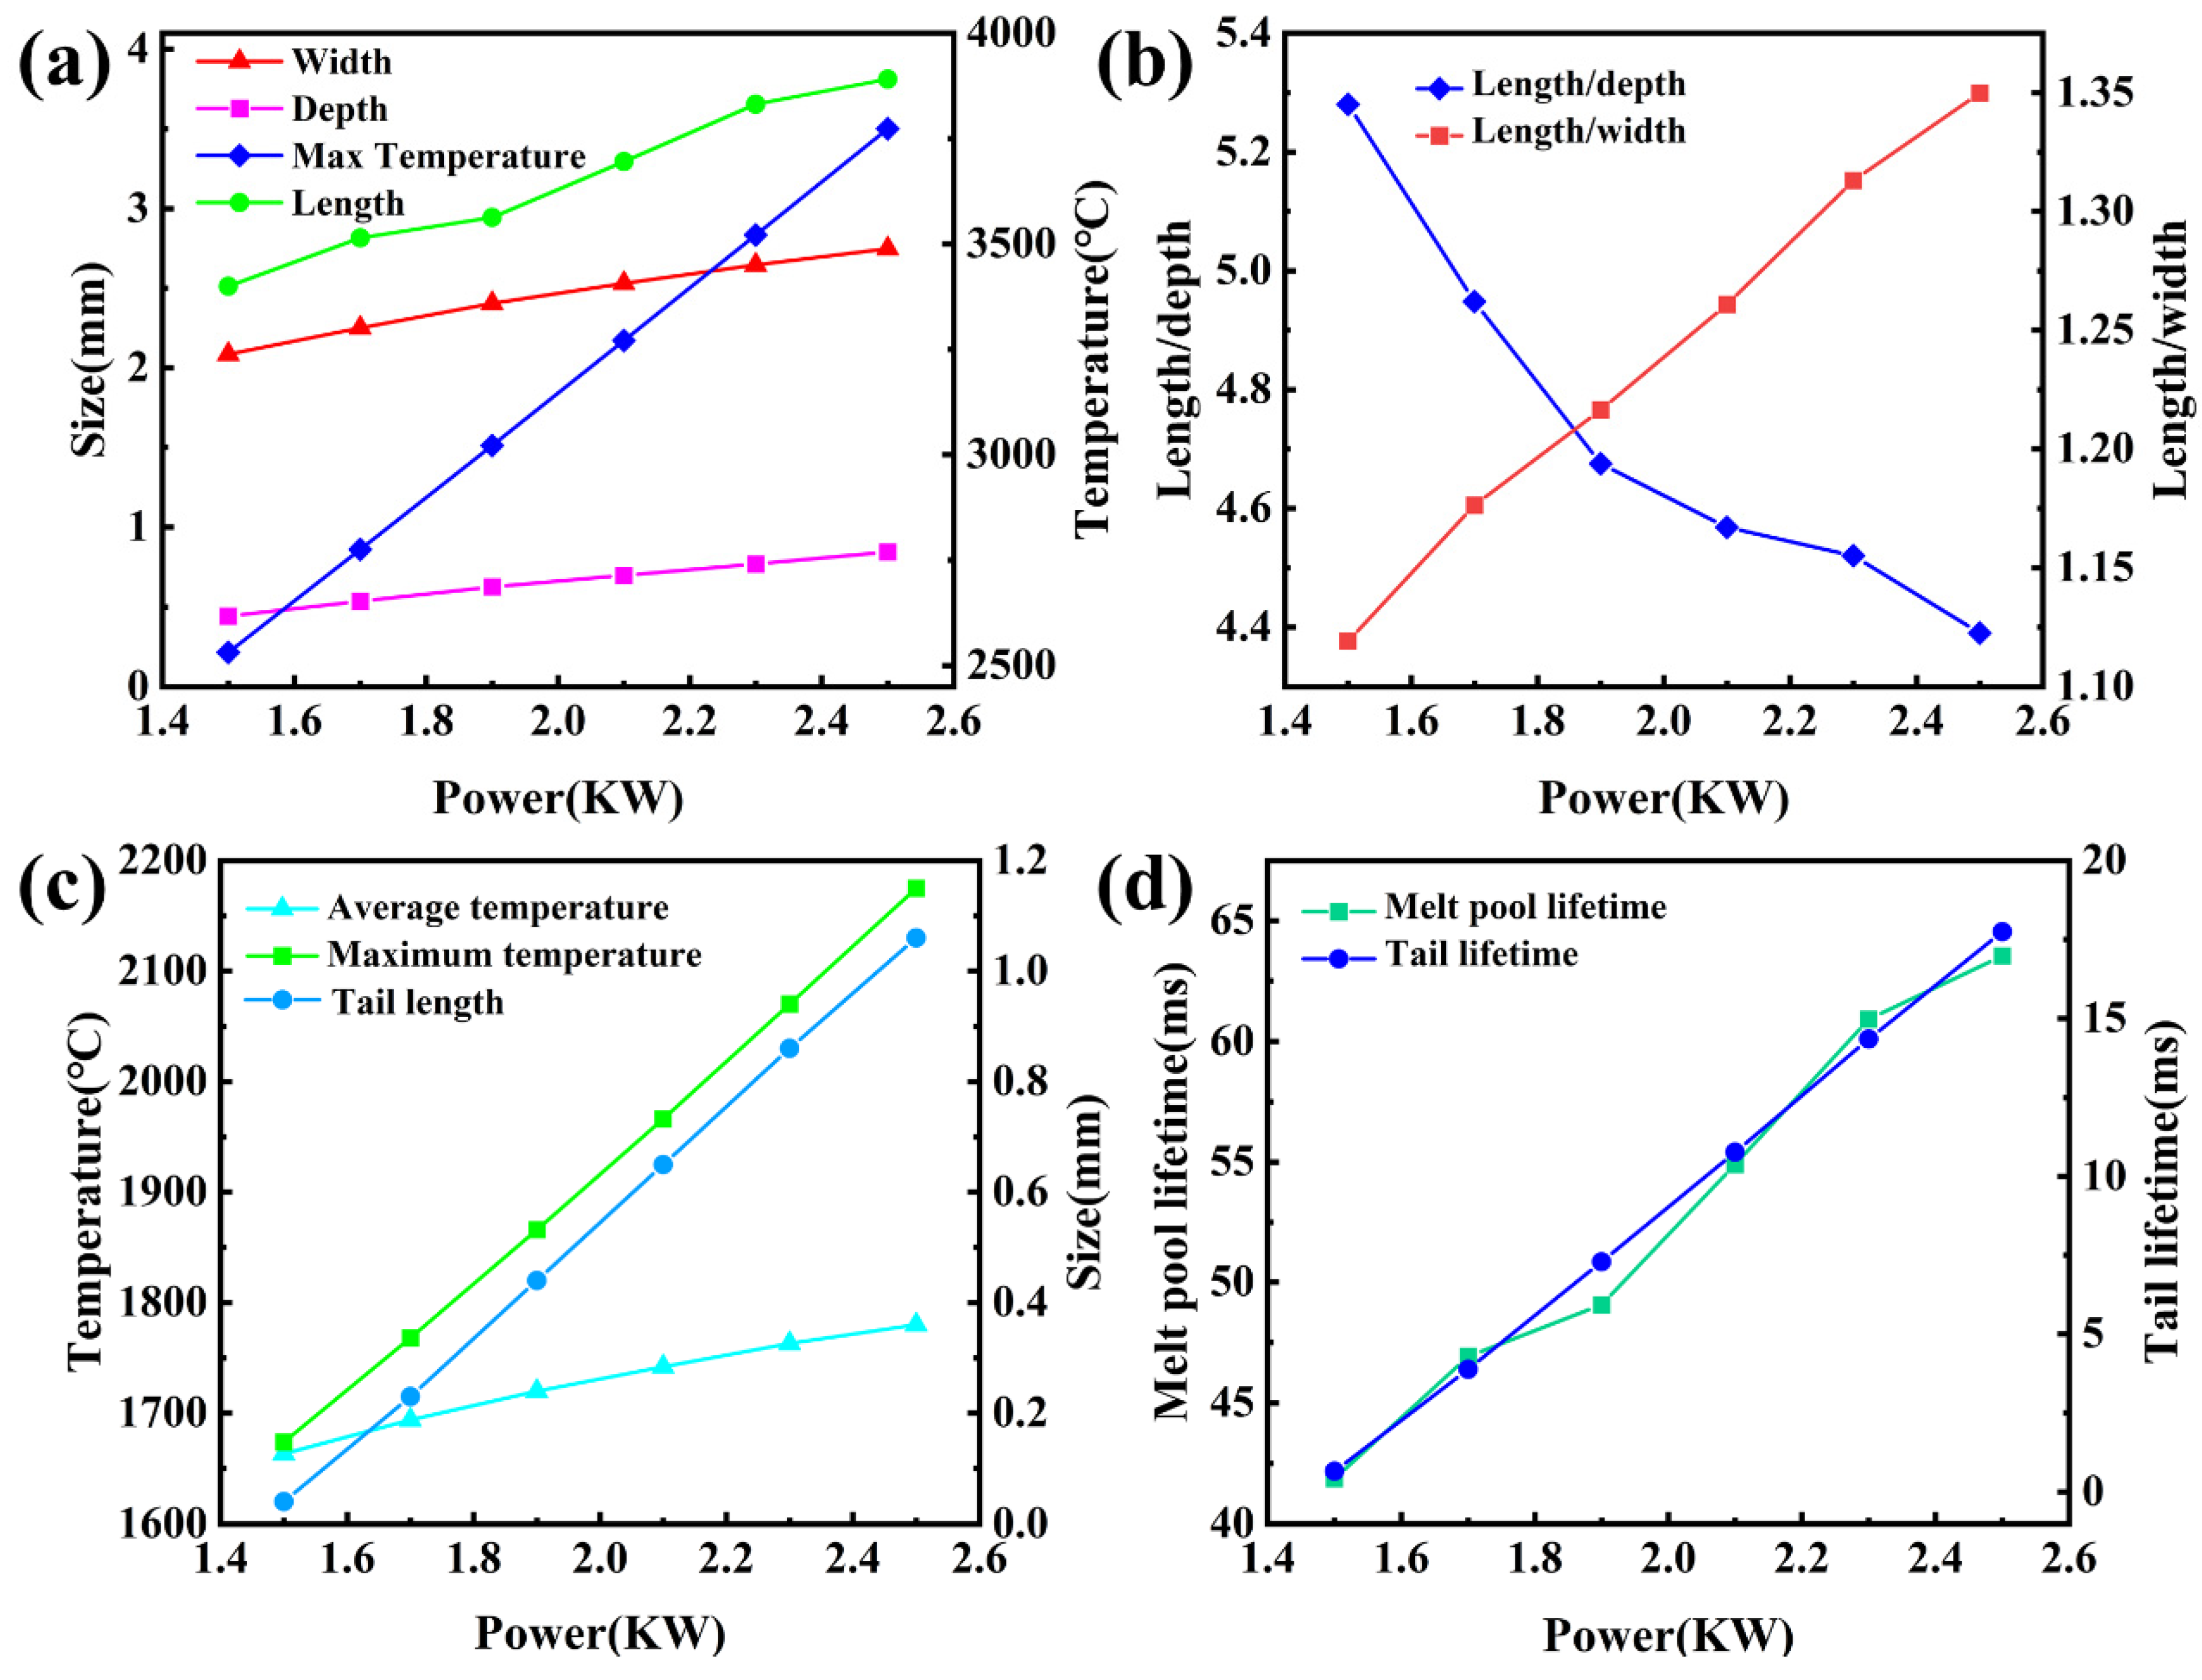
4.1. Effect of Laser Power on Molten Pool

Figure 3a shows the variation of molten pool morphology with the increase in laser power. It can be seen that with the increase in the laser power, the peak temperature, depth, length, and width of the molten pool increase. In the case of more abundant energy, the molten pool will have sufficient ability to extend and grow in size. However, the priority of molten pool expansion in a three-dimensional direction differs. When the laser power increases, the ratio of length to depth of the molten pool decreases while the length to width increases. This shows that increasing the laser power is conducive to obtaining a more profound and longer molten pool. So, we can see in Figure 3b that the tail of the molten pool appears and grows as the laser power increases. The tail length increases from 0.04 to 1.06 mm. The average temperature and peak temperature in the tailing area also increase. Still, the growth rate of peak temperature is significantly greater than that of average temperature, indicating that the low-temperature area occupies more area in the tailing region. In addition, the molten pool life can be increased due to the increase in heat contained in the molten pool. It means particles will have more time to move in the molten pool to produce thicker composite layers. Therefore, for the purpose of reducing powder burning loss, a long tail is needed. So, the laser power is finally selected as 2.5 kW.

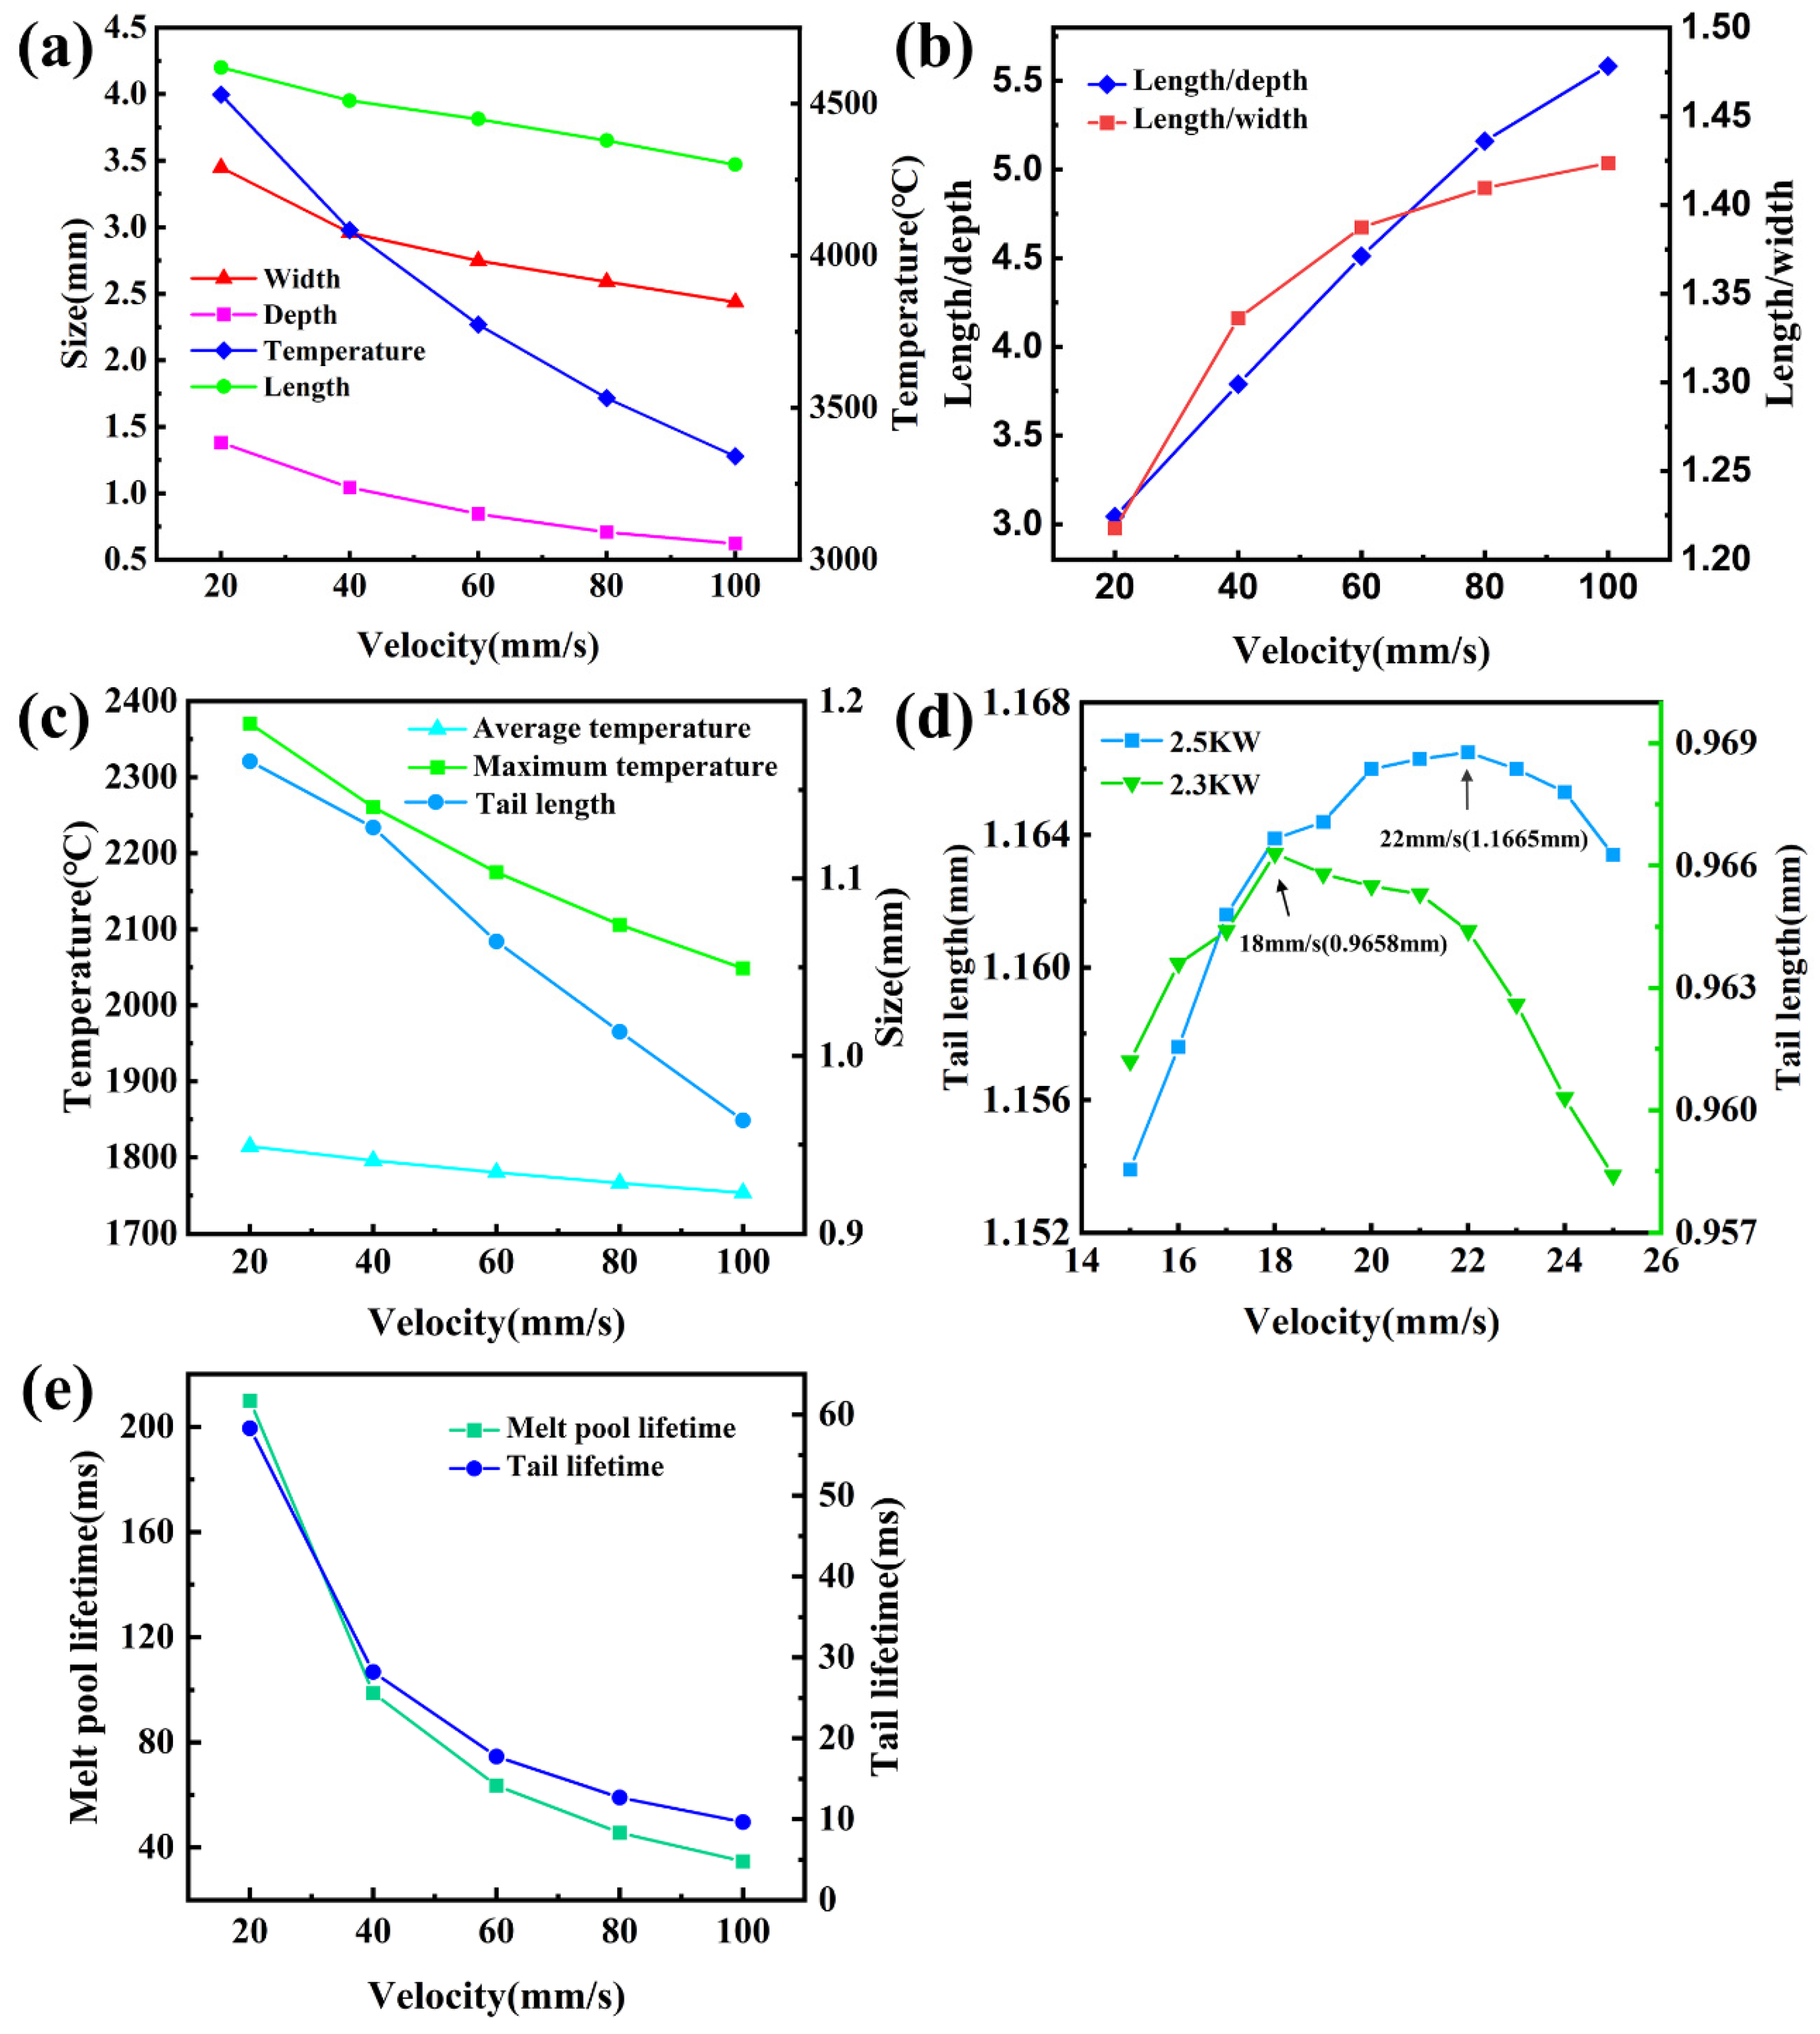
4.2. Effect of Scanning Velocity on Molten Pool

The effect of the scanning velocity on the molten pool is discussed when laser power is 2.5 kW. It can be seen from Figure 4a that the peak temperature, width, length, and depth of the molten pool continue to decrease with the increase in scanning velocity. As shown in Figure 4b, with the increase in scanning velocity, the ratio of length to depth and the ratio of length to width of the molten pool are increasing. That is to say, the decreasing trend of length is the smallest. In the change process, the energy density decreases, and the molten pool temperature drops significantly. Still, the tail length can always decrease slowly and be maintained at a certain level. Therefore, changing the scanning velocity is an effective way to adjust the tail temperature of the molten pool. In addition, from Figure 4e, it is found that the tail lifetime is significantly reduced after the scanning velocity increases. This is the reason why the heat-retaining time of the laser beam decreases.
It is worth mentioning that increasing the scanning velocity does lengthen the molten pool to increase the tail region. As Pei found in his study, tail length increases with scanning velocity [14]. In this paper, the same phenomenon occurs at low scan velocity. It can be seen from Figure 4d that the tail length has a maximum value, and with the decrease in laser power, the corresponding scanning velocity decreases when the maximum value is taken. Due to the Gaussian distribution of laser heat source energy and the reduction in Ti-6Al-4V thermal conductivity with the decrease in temperature, the heat is concentrated in the center of the molten pool. Increasing the scanning velocity does disperse the heat in the center of the molten pool. As scanning velocity increases, energy density decreases until the energy accumulated in the center is insufficient to support the expansion of the molten pool, and the tail length begins to reduce. With the reduction in laser power, the central energy of the molten pool is depleted in advance. The tail length takes its extreme value at a smaller velocity.
However, it is not worth pursuing a slight increase in the tail length of the molten pool and sacrificing the molten pool temperature, thereby increasing the melting of the reinforcement. Therefore, the optimal strategy is to adjust the tail length by laser power and the molten pool temperature by scanning velocity. Thus, to reduce the temperature of the tail region but avoid the short lifetime of the tail region, the scanning velocity of 60 mm/s is considered appropriate when the laser power is 2.5 kW.

5. Simulation Validation

Figure 5 shows the temperature field cloud chart under the process parameter combination, and the virtual line represents the boundary of the molten pool. Under this process, the molten pool length is 3.81 mm, the tail length is 1.06 mm, the penetration depth is 0.84 mm, and the width is 2.74 mm. The tail center is used as the powder injection center and is 2 mm from the laser center.
The cross-sectional morphology of the composite layer after single-pass processing is shown in Figure 6a. SiC particles exist in the upper part of the molten pool, and about 250 μm particle reinforced metal matrix composite layer is prepared. Priority is given to the length and temperature of the tail, while the selection of process parameters discards part of the tail lifetime. Numerical simulation shows that the tail lifetime is only 17.74 ms under this condition. Therefore, the particles quickly encounter the solidification front after entering the molten pool and are frozen in the upper part of the molten pool. A remelting zone with a thickness of about 920 μm was formed on the surface of the substrate. This value of thickness is slightly larger than the simulation result of 840 μm. The addition of SiC particles resulted in a slight increase in the molten pool volume, thus obtaining a larger pool [29]. Under the guidance of numerical simulation, the expected experimental results verify the model’s accuracy.
S i C S i * + C * ( T > 1650   °C )
T i * + C * T i C ( 1650   °C < T < 3067   °C )
5 T i * + 3 S i * T i 5 S i 3 ( 1650   °C < T < 2130   °C )
The temperature gradually decreases in the depth direction, so the melting and reaction of SiC in the molten pool are different. SiC is melted after entering the molten pool, and the brittle ceramic phase formed in the matrix following the reactions (13)–(15) [13,14]. Combined with XRD and EDS analysis results (Figure 7 and Table 3), the phase composition of the composite coating can be ascertained. In Figure 6, A is Ti5Si3, B and G are TiC particles, C and E are TiC dendrites, D is Ti-Si eutectic, and F is the substrate. It is worth noting that the test of C content in EDS is not accurate. In the top region, the matrix consists of TiC particles, dendritic TiC, Ti-Si eutectic structure, and bulk Ti5Si3. With increasing depth, TiC dendrites become slender, while the eutectic composition decreases, and the matrix α-Ti is exposed. However, the Ti5Si3 microstructure is rarely found in the central region of the composite layer. At the bottom, the eutectic structure is further reduced, the content of α-Ti is increased, and many nano-TiC particles appear. The microstructure of the matrix changes gradient along the depth direction.
Figure 8 shows the curve of the hardness of the Ti-6Al-4V with depth. The material surface to the internal extension can be divided into the coating, remelting zone, and matrix. Owing to the formation of the hard ceramic phases TiC and Ti5Si3, the hardness of the substrate is significantly improved. However, as the depth increases, the number of reactants gradually decreases, so the hardness gradually decreases. The hardness of the melting zone is also enhanced. It is caused by grain refinement strengthening and the formation of acicular martensite [30]. Hardness can reflect a material’s wear resistance, and generally speaking, the higher the hardness, the better the wear resistance. The hardness of the composite layer can reach up to 1729.5 HV, which is much greater than the substrate hardness of 310.3 HV.

6. Conclusions

In this work, the temperature field distribution of Ti-6Al-4V during laser scanning was studied by the finite element method. The LMI experiment was carried out under the guidance of numerical simulation. The results show that:
(1)
The laser power significantly affects the size of the tail length; tail length increases with laser power. The scanning velocity has a considerable impact on the lifetime of the tail area; the lifetime of the tail decreases with increasing scanning velocity.
(2)
The length of the tail is adjusted by laser power, and the temperature of the tail area is changed by scanning velocity. Considering the tail’s length, temperature, and lifetime, the process parameters are determined as a laser power of 2.5 kW and a scanning velocity of 60 mm/s.
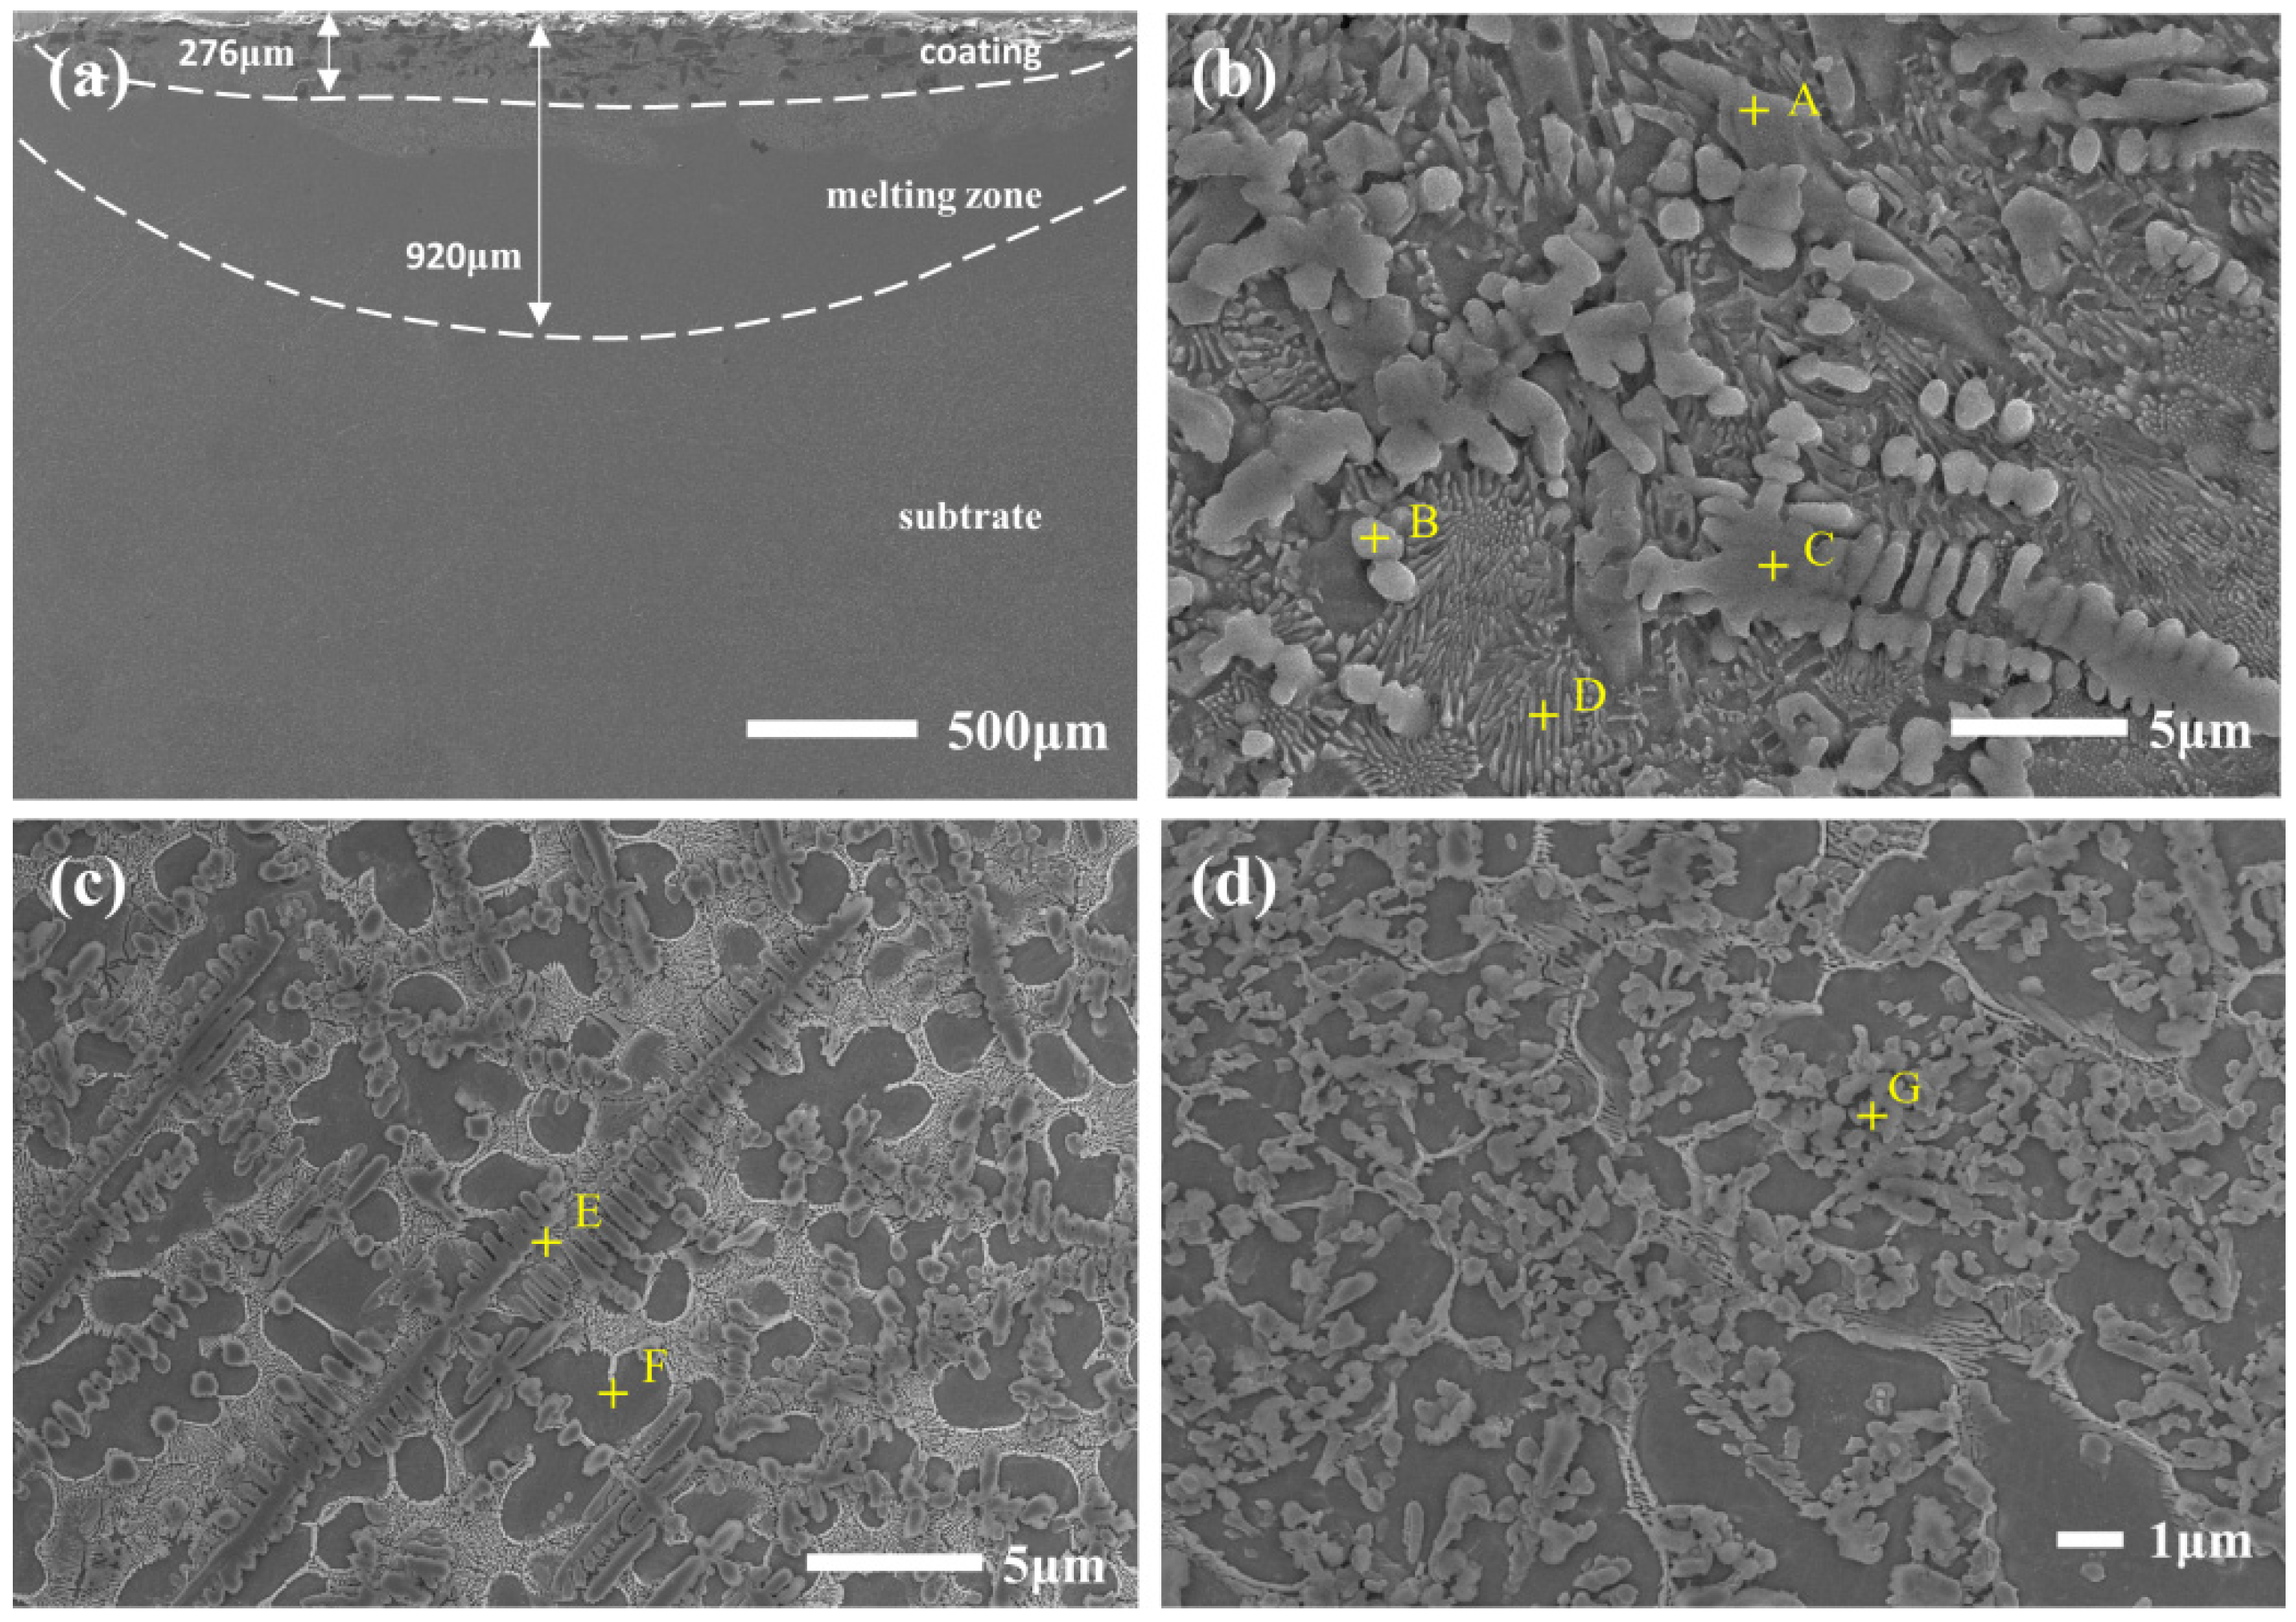
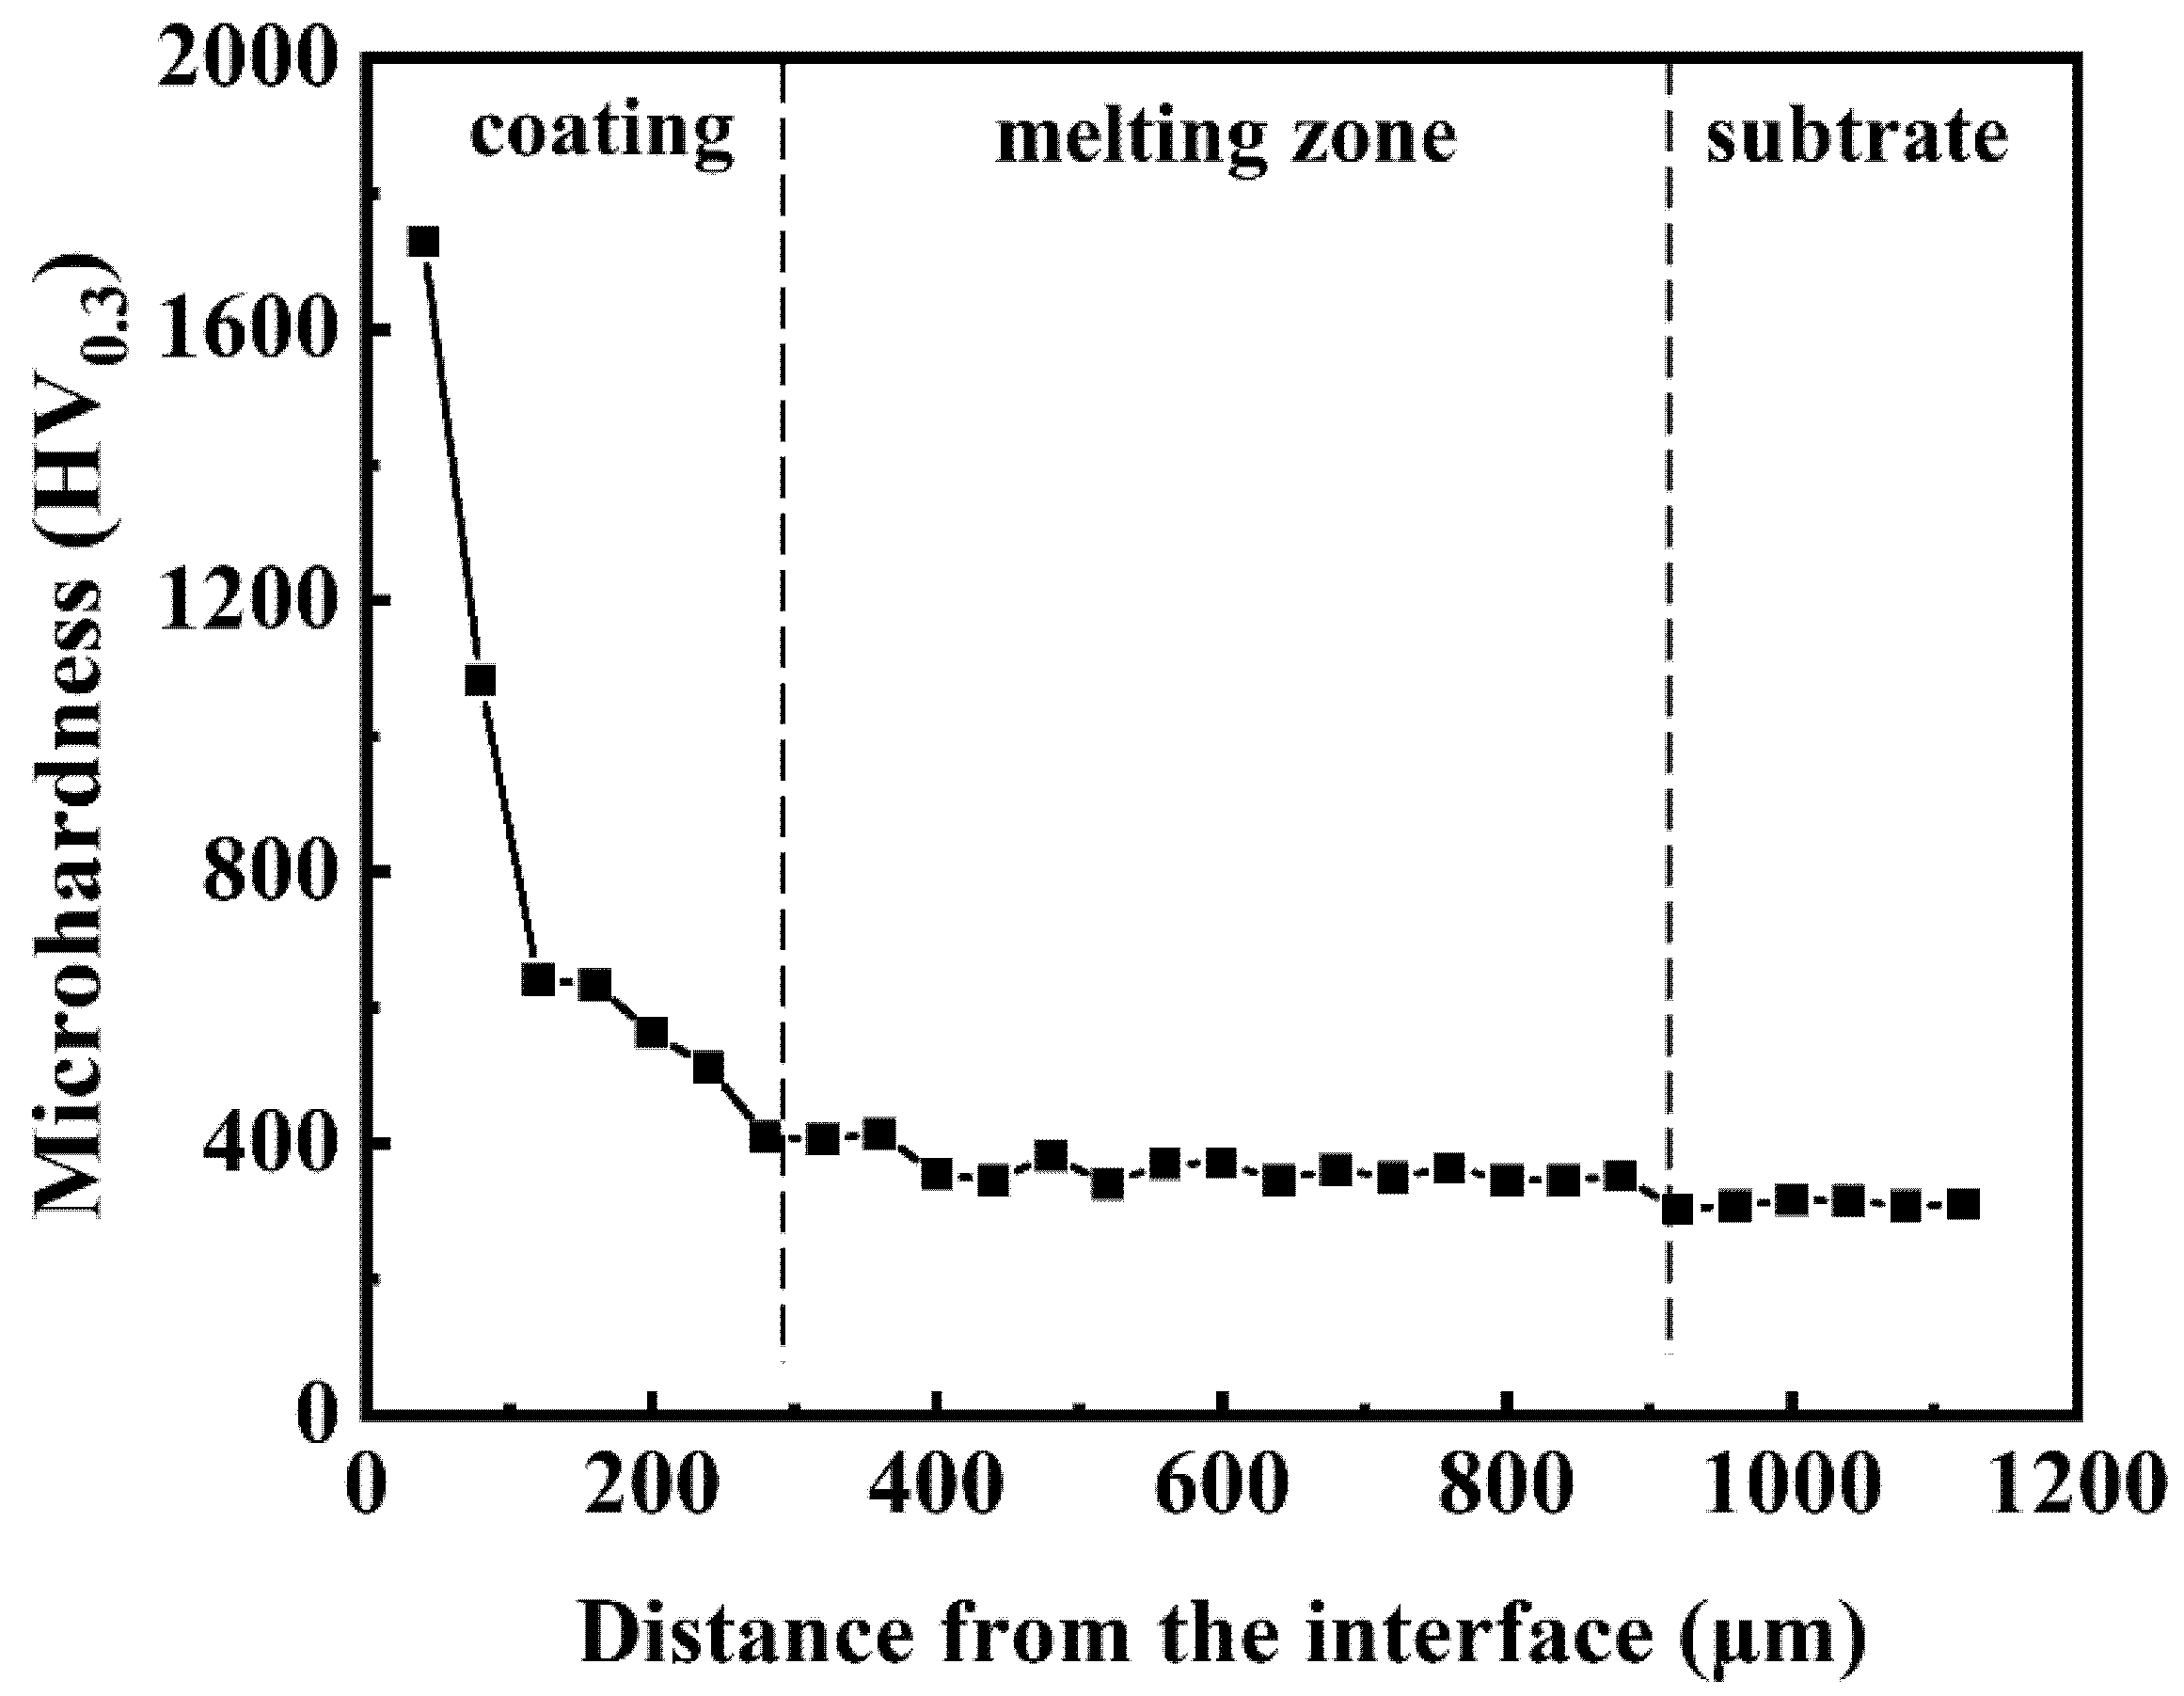
(3)
Metal matrix composites coatings with a thickness of about 250 μm were prepared. The microstructure and the hardness of the coating vary in gradients along the depth direction. the maximum hardness can reach 1729.5 HV, much higher than the Ti-6Al-4V substrate (310.3 HV).

Author Contributions

Conceptualization, methodology, Z.Z., P.H., J.Z.; data curation, formal analysis, software, writing—original draft preparation, Z.Z.; investigation, Z.Z., J.Z., G.L., Q.S., P.H. resources, J.Z., P.H., G.L., Q.S.; funding acquisition, J.Z., G.L., Q.S.; project administration, supervision, J.Z.; writing—review and editing, Z.Z., J.Z., G.L., Q.S., P.H. All authors have read and agreed to the published version of the manuscript.

Funding

This work was supported by the Guangdong Major Project of Basic and Applied Basic Research (Grant No. 2021B0301030001), the National Natural Science Foundation of China (Grant No. 52171045), the major program of the specialized technological innovation of Hubei Province, China (Grant No. 2019AFA176).

Institutional Review Board Statement

Not applicable.

Informed Consent Statement

Not applicable.

Data Availability Statement

Not applicable.

Conflicts of Interest

The authors declare no conflict of interest.

References

  1. Farotade, G.A.; Adesina, O.S.; Popoola, A.; Pityana, S.L. Laser Cladding and Characterization of Ni-SiC-ZrB2 Cermet Coatings on TC4 for High-Temperature Applications. Metallogr. Microstruct. Anal. 2019, 23, 53–63. [Google Scholar]
  2. Sun, Y.; Luo, G.; Zhang, J.; Chen, J.; Wang, G.; Shen, Q.; Zhang, L. Microstructure, Mechanical Properties and Reinforcement Mechanism of Dual-scale TC4 titanium Alloy prepared by Cryomilling and Plasma Activated Sintering. Mater. Sci. Eng. A 2018, 736, 120–129. [Google Scholar] [CrossRef]
  3. Li, N.; Xiong, Y.; Xiong, H.; Shi, G.; Blackburn, J.; Liu, W.; Qin, R. Microstructure, formation mechanism and property characterization of Ti + SiC laser cladded coatings on Ti6Al4V alloy. Mater. Charact. 2019, 148, 43–51. [Google Scholar] [CrossRef]
  4. Ganesh, B.K.C.; Sha, W.; Ramanaiah, N.; Krishnaiah, A. Effect of shot peening on sliding wear and tensile behavior of titanium implant alloys. Mater. Des. 2014, 56, 480–486. [Google Scholar]
  5. Lei, J.; Shi, C.; Zhou, S.; Gu, Z.; Zhang, L.C. Enhanced corrosion and wear resistance properties of carbon fiber reinforced Ni-based composite coating by laser cladding. Surf. Coat. Technol. 2018, 334, 274–285. [Google Scholar] [CrossRef] [Green Version]
  6. Wang, C.; Li, J.; Wang, T.; Chai, L.; Deng, C.; Wang, Y.; Huang, Y. Microstructure and properties of pure titanium coating on TC4 alloy by laser cladding. Surf. Coat. Technol. 2021, 416, 127137. [Google Scholar] [CrossRef]
  7. Ayers, J.D.; Schaefer, R.J. A Laser Processing Technique for Improving the Wear Resistance of Metals. JOM 1981, 33, 19–23. [Google Scholar] [CrossRef]
  8. Gilev, V.G.; Evgenii, M. Laser Melt Injection of Austenitic Cast Iron Ch16D7GKh with Titanium. Russ. J. Non-Ferr. Met. 2016, 57, 625–632. [Google Scholar]
  9. Xu, B.N.; Ping, J.; Geng, S.N.; Wang, Y.L.; Zhao, J.T.; Mi, G.Y. In-Situ Reactions and Mechanical Properties of 6061 Aluminum Alloy Weld Joint with Sicp by Laser Melting Injection. Mater. Des. 2021, 203, 109538. [Google Scholar] [CrossRef]
  10. Li, L.; Wang, D.; Song, W.; Gong, J.; Hu, Q.; Zeng, X. Microstructures and mechanical properties of WCP/TC4 composite coatings by laser melt injection and laser-induction hybrid melt injection. Surf. Coat. Technol. 2020, 205, 4366–4373. [Google Scholar]
  11. Li, L.; Liu, D.; Chen, Y. Electron microscopy study of reaction layers between single-crystal W.C. particle and TC4 after laser melt injection. Acta Mater. 2009, 57, 3606–3614. [Google Scholar] [CrossRef]
  12. Chen, Y.; Liu, D.; Li, F.; Li, L. WCp/Ti-6Al-4V graded metal matrix composites layer produced by laser melt injection. Surf. Coat. Technol. 2008, 202, 4780–4787. [Google Scholar] [CrossRef]
  13. Kloosterman, A.B.; Kooi, B.J.; Hosson, J.T. Electron microscopy of reaction layers between SiC and Ti–6Al–4V after laser embedding. Acta Mater. 1998, 46, 6205–6217. [Google Scholar] [CrossRef] [Green Version]
  14. Pei, Y.T.; Ocelik, V.; Hosson, J.T. SiCp/TC4 Functionally Graded Materials Produced by Laser Melt Injection. Acta Mater. 2002, 50, 2035–2051. [Google Scholar] [CrossRef]
  15. Weng, F.; Chen, C.; Yu, H. Research status of laser cladding on titanium and its alloys: A review. Mater. Des. 2014, 58, 412–425. [Google Scholar] [CrossRef]
  16. Liang, W.; Yao, J.H.; Hu, Y.; Zhang, Q.L.; Sun, Z.; Liu, R. Influence of Electric-Magnetic Compound Field on the Wc Particles Distribution in Laser Melt Injection. Surf. Coat. Technol. 2017, 315, 32–43. [Google Scholar]
  17. Xu, B.A.; Jiang, P.; Wang, Y.L.; Zhao, J.T.; Geng, S.N. Multi-Physics Simulation of Wobbling Laser Melting Injection of Aluminum Alloy with Sic Particles: Sic Particles Gradient Distribution in Fusion Zone. Int. J. Heat Mass Transf. 2022, 182, 121960. [Google Scholar] [CrossRef]
  18. Liu, H.; Li, M.; Qin, X.; Huang, S.; Hong, F. Numerical Simulation and experimental analysis of wide-beam laser cladding. Int. J. Adv. Manuf. Technol. 2019, 100, 237–249. [Google Scholar] [CrossRef]
  19. Sun, S.; Fu, H.; Chen, S.; Ping, X.; Wang, K.; Guo, X.; Lin, J.; Lei, Y. A numerical-experimental investigation of heat distribution, stress field and crack susceptibility in Ni60A coatings. Opt. Laser Technol. 2019, 117, 175–185. [Google Scholar] [CrossRef]
  20. Akbari, M.; Saedodin, S.; Toghraie, D.; Shoja-Razavi, R.; Kowsari, F. Experimental and numerical investigation of temperature distribution and melt pool geometry during pulsed laser welding of Ti6Al4V alloy. Opt. Laser Technol. 2014, 59, 52–59. [Google Scholar] [CrossRef]
  21. Gao, J.; Wu, C.; Hao, Y.; Xu, X.; Guo, L. Numerical Simulation and experimental investigation on three-dimensional modelling of single-track geometry and temperature evollution by laser cladding. Opt. Laser Technol. 2020, 129, 106287. [Google Scholar] [CrossRef]
  22. Gan, Y.; Wang, W.; Cui, Z.; Yan, X.; Guan, Z.; Xu, B. Numerical and experimental study of the temperature fifield evolution of Mg alloy during high power diode laser surface melting. Optik 2015, 126, 739–743. [Google Scholar] [CrossRef]
  23. Mills, K.C. Recommended Values of Thermophysical Properties for Selected Commercial Alloys; Antony Rowe Ltd.: Chippenham, UK, 2002. [Google Scholar]
  24. Du, Y.; You, X.; Qiao, F.; Guo, L.; Liu, Z. A model for predicting the temperature field during selective laser melting. Results Phys. 2019, 12, 52–60. [Google Scholar] [CrossRef]
  25. Kumara, C.; Dasa, M.; Paulb, C.P.; Singh, B. Experimental investigation and metallographic characterization of fiber laser beam welding of Ti-6Al-4V alloy using response surface method. Opt. Laser Eng. 2017, 95, 52–68. [Google Scholar] [CrossRef]
  26. Yang, L.X.; Peng, X.F.; Wang, B.X. Numerical modeling and experimental investigation on the characteristics of molten pool during laser processing. Int. J. Heat Mass Transf. 2001, 44, 4465–4473. [Google Scholar] [CrossRef]
  27. Yin, J.; Zhu, H.; Ke, L.; Lei, W.; Dai, C.; Zuo, D. Simulation of temperature distribution in single metallic powder layer for laser micro-sintering. Comp. Mater. Sci. 2012, 53, 333–339. [Google Scholar] [CrossRef]
  28. Hao, M.; Sun, Y. A FEM model for simulating temperature field in coaxial laser cladding of TI6AL4V alloy using an inverse modeling approach. Int. J. Heat Mass Transf. 2013, 64, 352–360. [Google Scholar] [CrossRef]
  29. Freisse, H.; Annika, B.; Thomas, S. Determination of the particle contentin laser melt injected tracks. J. Mater. Process. Technol. 2019, 267, 167–185. [Google Scholar] [CrossRef]
  30. Yang, J.H.; Sun, S.J.; Brandt, M.; Yan, W.Y. Experimental investigation and 3D finite element prediction of the heat affected zone during laser assisted machining of Ti6Al4V alloy. J. Mater. Process. Technol. 2010, 210, 2215–2222. [Google Scholar] [CrossRef]
Figure 1. Heat transfer diagram.
Coatings 12 00808 g001
Figure 2. Finite element mesh.
Coatings 12 00808 g002
Figure 3. When the laser power varies in the range of 1.5–2.5 kW, (a) molten pool morphology; (b) characteristics of the molten pool; (c) tail morphology; (d) molten pool lifetime.
Coatings 12 00808 g003
Figure 4. When the scanning velocity is in the range of 20–100 mm/s, (a) molten pool morphology; (b) characteristics of the molten pool; (c) tail morphology; (d) relationship between the tail and low scanning velocity; (e) the lifetime of the molten pool.
Coatings 12 00808 g004
Figure 5. Morphology of molten pool (a) Three-dimensional morphology; (b) the main view; (c) the prone view.
Coatings 12 00808 g005
Figure 6. (a) Cross-sectional morphology of composite layer; microstructure of composite layer (b) top area; (c) central area; (d) bottom area.
Coatings 12 00808 g006
Figure 7. X-ray diffraction (XRD) spectrum of the composite layer.
Coatings 12 00808 g007
Figure 8. The curve of hardness with depth.
Coatings 12 00808 g008
Table 1. The thermo-physical properties of Ti-6Al-4V [23].
T/℃100400800995 a995 b13001650 a1650 b18001900
ρ/Kg1m−34420436643094282428242404189392038183750
C/JK−1g-0.5620.6290.7140.7530.6410.6960.7590.8310.8310.831
λ/Wm−1K−17.4511.3517.822.719.323.728.433.4--
a,b are used to distinguish different properties at the same temperature.
Table 2. Adopted parameters of the LMI process.
ParametersValues
Laser power2.5 kW
Scanning velocity60 mm/s
Spot diameter3 mm
Powder feeding rate10.8 g/min
Carrier gas2 L/min
Shielding gas5 L/min
Table 3. Results of Energy Dispersive Spectrometer (EDS) in different regions of composite layer (at.%).
PositionTiAlCSiV
A30.292.5655.9111.24-
B35.832.6957.323.700.46
C45.123.1846.453.331.92
D43.145.5839.969.401.91
E30.631.7666.111.50-
F71.6211.3310.073.933.05
G34.542.3460.941.330.85
Publisher’s Note: MDPI stays neutral with regard to jurisdictional claims in published maps and institutional affiliations.

