Abstract
To explore the interactions and mechanisms of Thermoplastic polyurethane (TPU)-modified asphalt with different kinds of mineral fillers, a micro-mechanical model for TPU-modified asphalt mastic was established, which considered the interaction between asphalt and mineral powder to effectively analyze the internal mechanisms affecting the rheological properties of TPU-modified asphalt mastic. In this study, according to the micro-mechanics of composites’ principles, the dynamic shear modulus (|G*|) of asphalt mastic with different mass ratios of filler/asphalt (F/A) was calculated by the homogenize morphologically representative pattern (H-MRP) model. The key ratio of F/A, which is close to the test result, can be determined, and a four-phase H-MRP model of the TPU modified asphalt mastic was established after considering the structure of asphalt layer thickness. The results were interpreted based on the known reactions of TPU with asphalt model compounds. The |G*| of TPU-modified asphalt mastic was predicted by using this model. Furthermore, the effects of the complex shear modulus, Poisson’s ratio of TPU-modified asphalt, Poisson’s ratio, particle size of mineral powder, and thickness of the structural asphalt layer in the |G*| of TPU-modified asphalt mastic were analyzed in the whole-model construction, as well as the internal mechanism of the |G*| of TPU modified asphalt mastic. In addition, can also be found the predicted value of |G*| calculated by the four-phase H-MRP model is close to the experimental value after choosing a structural asphalt layer of appropriate thickness.
1. Introduction
Thermoplastic Polyurethane Elastomer (TPU) is a new polymer material, which has been widely used in many fields due to its flexible formulation and wide range of adjustable properties [1,2,3,4,5]. However, the research into and application of TPU as an asphalt modifier in the field of road engineering are rarely reported [6]. The ability of TPU-modified asphalt to interact with the mineral powder determines the road engineering properties of the TPU-modified asphalt mix based on the results of extensive experimental trials.
In recent years, with the introduction of the micro-mechanical model for composite materials to the field of asphalt mix research, road researchers have gained insight into the influence of microscopic components of asphalt mixes on macroscopic properties. To this end, the micro-mechanical model of TPU-modified asphalt mastic is predicted using the micro-mechanics of composites’ principles, which helps to build a relationship between the macro-mechanical properties and the micro-fine structural properties of TPU-modified asphalt mastic, thus fully revealing the intrinsic mechanism of TPU-modified asphalt mastic [7]. In addition, it is important to investigate the interaction between TPU-modified asphalt and mineral powder to understand and regulate the interaction process and improve the mechanical properties of TPU-modified asphalt mastic.
Pichler et al. [8] divided asphalt mixes into asphalt mastic grade, asphalt mastic grade and asphalt mixture grade, order them from smallest to largest based on Mori–Tanaka (M-T) [9] and generalized self-consistent (GSC) models [10] using the micro-mechanics of composites principles. A step-by-step mechanical prediction model prediction method is proposed for asphalt mixtures, as the M-T and GSC models struggle to objectively reflect the true internal structure of asphalt mastic due to the neglect of factors such as aggregate voids and the physical and chemical effects of the binder. Hence, it cannot be denied that the concept of the mechanical prediction model has played a role in the rapid development of a micro-mechanical prediction model for asphalt mixtures.
At present, domestic and foreign asphalt binders are classified according to the step-by-step mechanical prediction model, which mainly includes asphalt mixture grade and asphalt mastic grade. The asphalt mastic grade prediction model research is widely used. Buttlar et al. [11] proposed that mineral powders play a major role in asphalt mastic in terms of volume filling and interaction through a GSC model with some physical and chemical reactions. It was confirmed that the modulus of asphalt mastic with a low-volume fraction of mineral powder could be accurately predicted using the GSC model. Shashidhar et al. [12] simplified the GSC model and constructed a simplified GSC prediction model based on the dynamic shear modulus of asphalt mastic after a comparative analysis of the order of magnitude. By comparing the measured and predicted test values, they found that the predicted value was low, the interaction between asphalt and mineral powder is not considered. The modified, simplified GSC model based on percolation theory can improve the accuracy of predicted values. Kim et al. [13] used both CS and GSC models to predict the viscoelastic properties of asphalt mastic, and found that the lower the volume fraction of mineral powder, the closer the predicted values were to the experimental values, while the higher the volume fraction of mineral powder, the more the predicted values deviated from the measured values by comparison with the experimental values of the relaxation modulus. Yin et al. [14] used the Dilute model (DM), self-consistent (SC), M-T and GSC models to predict the dynamic shear modulus of asphalt mastic, and compared the experimental values with the predicted values of each model, finding that the SC prediction model was the most accurate [15,16]. Underwood et al. [17] proposed a micro-mechanical prediction model of four-phase asphalt mastic based on the composition of absorbed asphalt, unabsorbed asphalt, mineral powder and equivalent materials by comparing the accuracy of micro-mechanical prediction models in terms of the predicted and measured dynamic shear modulus values of asphalt mastic. Pei et al. [18,19,20] found that a mechanics prediction model for the dynamic shear modulus of asphalt mastic could be constructed using the Ju–Chen model (J-C) and that the predicted values of the dynamic shear modulus of asphalt mastic were in good agreement with the measured values when the volume fraction of mineral powder was less than 50%. Wang et al. [21] constructed a mechanics prediction model for the dynamic modulus master curve of asphalt mastic by simplifying the GSC and viscoelastic Prony series expressions, and found that the accuracy of the predicted value can be improved by modifying the volume fraction according to percolation theory.
In summary, asphalt is a viscoelastic material with rheological properties, and an accurate prediction of its dynamic modulus can be achieved by modelling the micro-mechanics of asphalt mastic. In order to simulate the internal structure of asphalt mastic, researchers are constantly trying to introduce more influencing factors into the prediction model. At present, the factors affecting the micro-mechanical model of asphalt mastic are mainly considered using speculation and empirical judgment, and there is a lack of data support based on macro- and micro-tests. Therefore, the research on TPU-modified asphalt mastic needs to build a micro-mechanical prediction model that can truly reflect the internal action mechanisms of its components. However, the widely used micro-mechanical models, such as the DM model, M-T model and GSC model, generally have the problem that the predicted value is lower than the experimental value, and cannot reveal the strengthening mechanism of asphalt using mineral powder. Therefore, the micro-mechanical model of asphalt mastic still needs to be improved. This study considered the asphalt interactions, and the use of mineral powder in the H-MRP model was improved by using the improved model of matrix asphalt mastic. By analyzing the influence of model parameters, the TPU-modified dynamic shear modulus of asphalt mastic was forecast, and the dynamic shear modulus (|G*|) of the asphalt mastic strengthening mechanism was also discussed.
2. Experiment
2.1. Materials
2.1.1. Thermoplastic Polyurethane (TPU)
The TPU used in this study was self-made in an indoor lab with a 40% hard segment content; the isocyanate radical index was 1.05. The chemical structure formula of TPU used in this study is shown in Figure 1 and its main technical properties are shown in Table 1.
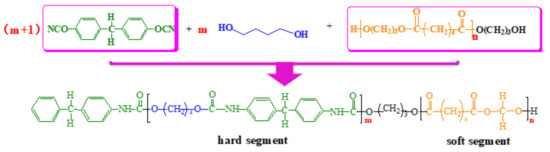
Figure 1.
Chemical structure formula of TPU [22,23].

Table 1.
Mechanical properties of TPU.
2.1.2. Base Asphalt
In this study, the grade of base asphalt produced at Pan-jin in China, was used as the base asphalt to prepare TPU-modified asphalt mastic, and the technical properties of the base asphalt were determined according to JTG E20-2011 [31] and are presented in Table 2.
Table 2.
Physical properties of base asphalt.
2.1.3. Fillers
Limestone, granite, fly-ash and coal gangue were selected to prepare the asphalt mastics in this paper. The selected limestone and granite are traditional fillers, used in the construction of asphalt pavement, which is produced in Zhengzhou, Henan province. Fly-ash and coal gangue are the main solid waste from Zhengzhou coal-fired thermal power plant. The performance parameters of the four fillers can be seen in Table 3.
Table 3.
Summary of measured filler properties.
2.2. Methods
2.2.1. Mix Design
The filler/asphalt (F/A) ratio in the composition design of asphalt mixture generally ranged from 0.6 to 1.4 in terms of mass. However, the F/A ratio of asphalt mixture production is often slightly larger than the design value due to incomplete and uneven dust removal. Therefore, five F/A ratios were set for the four types of mineral fillers presented above: 0.4, 0.8, 1.2, 1.6 and 2.0, respectively.
As shown in Figure 2, the filler was dried for 2 h in an oven at 165 °C, and the TPU-modified asphalt was heated to 150 °C. The TPU-modified asphalt and filler were mixed in a preheated iron basin and placed on a heating plate at 155 °C for constant temperature mixing. Electric stirrer was used in mixing with a stirring time of 15 min. When there were no bubbles on the surface of TPU-modified asphalt mastic, this indicating that the asphalt and filler had been fully and evenly mixed, and they were sealed and preserved in aluminum box after mixing.
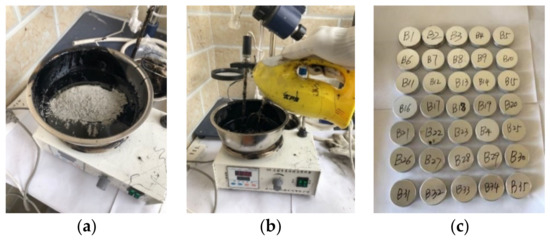
Figure 2.
Preparation process of asphalt mastic. (a) Asphalt mixed with filler. (b) Thermostatic mixing. (c) Sealing preservation.
2.2.2. SEM Test
SEM (ZEISS Ltd., ZEISSSUPRA 55 SAPPHIRE, Heidenheim, Germany) was used to characterize the mineral fillers and obtain microscopic images of filler surface, which were magnified 2000 times. Since the asphalt material is not conductive, all samples were sputtered with gold under vacuum conditions (Nippon Electronics Co., JFC-1100, Tokyo, Japan). Then, the microstructure characteristics of the samples were observed by using SEM.
2.2.3. Particle Size Analysis Test
The Malvern 2000 laser particle size analyzer (Malvern Instruments Ltd., Malvern, UK) was used in this study to test the particle size of different fillers. Distilled water was used as a dispersant for wet test. The particle size range was 0.02–2000 μm, and the refractive index of mineral particles was 1.520. Each group of particle size was measured 3 times, and the average value was taken to draw the particle size distribution curve.
2.2.4. XRD Test
XRD (X’ Pert PRO MPD, PANalytical Co., Rigaku Ultima IVX, Almelo, The Netherlands) was employed to investigate the physical phase of the filles with Cu-K radiation (λ = 0.15406 nm), and analyze the chemical element composition of mineral fillers. The accelerating voltage and applied current were 40 kV and 40 mA, respectively. The XRD pattern was recorded in the 2 h range from 5 to 80, at a rate of 2 °/min, in the step scanning mode.
2.2.5. DSR Tests
The temperature-frequency scanning of asphalt mastic was carried out by Bohlin Gemini rotary rheometer (Malvern Instruments Co., Ltd., TM, Melvin, UK). An 8-mm diameter disk was selected and the sample thickness was 2 mm. The loading rates ranged from 0.628 to 125.7 rad/s, the corresponding frequencies were 0.1 to 20 Hz, the test temperatures were 28 °C, 40 °C, 52 °C, 64 °C and 76 °C, and the loading strain was 0.1%.
3. Predicting Dynamic Shear Modulus of Asphalt Mastics Based on H-MRP Model
3.1. Model Building
Marcadon et al. [32] proposed a morphologically representative pattern (MRP) model and obtained the equivalent modulus solution formula for this model, characterized by nonlinear equations. Although mathematical software such as Mathematica can be used for auxiliary calculation, some negative solutions frequently appear, which makes it difficult to apply. Wang et al. [33] simplified the MRP using the generalized self-consistent method and proposed a homogenized MRP model (H-MRP), which can be applied to TPU-modified asphalt mastic, as shown in Figure 3.

Figure 3.
H-MRP model of TPU-modified asphalt mastic.
In the H-MRP model, the equivalent bulk modulus and shear modulus of the homogenized material H are expressed as:
In the formula, the subscripts 1 and 2 represent mineral filler and TPU-modified asphalt, respectively, and A’, B’, and C’ are expressed as:
where c1 is the filler particle volume fraction, calculated as:
where is the average minimum distance between the mineral powder particles; is the average radius of the filler particles; is the distribution coefficient of mineral powder.
The equivalent bulk modulus and shear modulus of TPU-modified asphalt mastic are expressed as:
where is the volume fraction of homogenized material, H, which is obtained from the volume fraction of mineral powder particles , and the distribution coefficient .
3.2. Selection of Model Parameters
According to the relevant literature [34], the rock elastic modulus ranges from 50 to 100 GPa; Poisson’s ratio ranges from 0.2 to 0.35. Zhou et al. [35] tested the elastic modulus of limestone and found it to be 56 GPa. Therefore, in the H-MRP model of this study, Young’s modulus of the mineral powder E1 is 56 GPa, and Poisson’s ratio is 0.25. The complex shear modulus of asphalt will be obtained through experiments to form the basic parameter. The classic relationship between bulk modulus, shear modulus, and Poisson’s ratio in the complex range is expressed as:
where is the complex Poisson’s ratio.
Di Benedetto et al. [36] experimentally measured that the complex of Poisson’s ratio for slightly varies in frequency, ranging from 0.48 to 0.5 at 0 °C, with a phase angle of −0.18 to −1.29°. For ease of computation, the complex Poisson’s ratio is neglected in this paper, assuming = 0.49, δ2 = 0°.
The distribution mode of the face center Cubic (FCC) in crystallography was selected as the uniform distribution form of mineral powder, and the relationship between distribution coefficient . and particle volume fraction is:
4. Results and Discussions
4.1. Physicochemical Mechanism between Asphalt Binder and Fillers
4.1.1. SEM
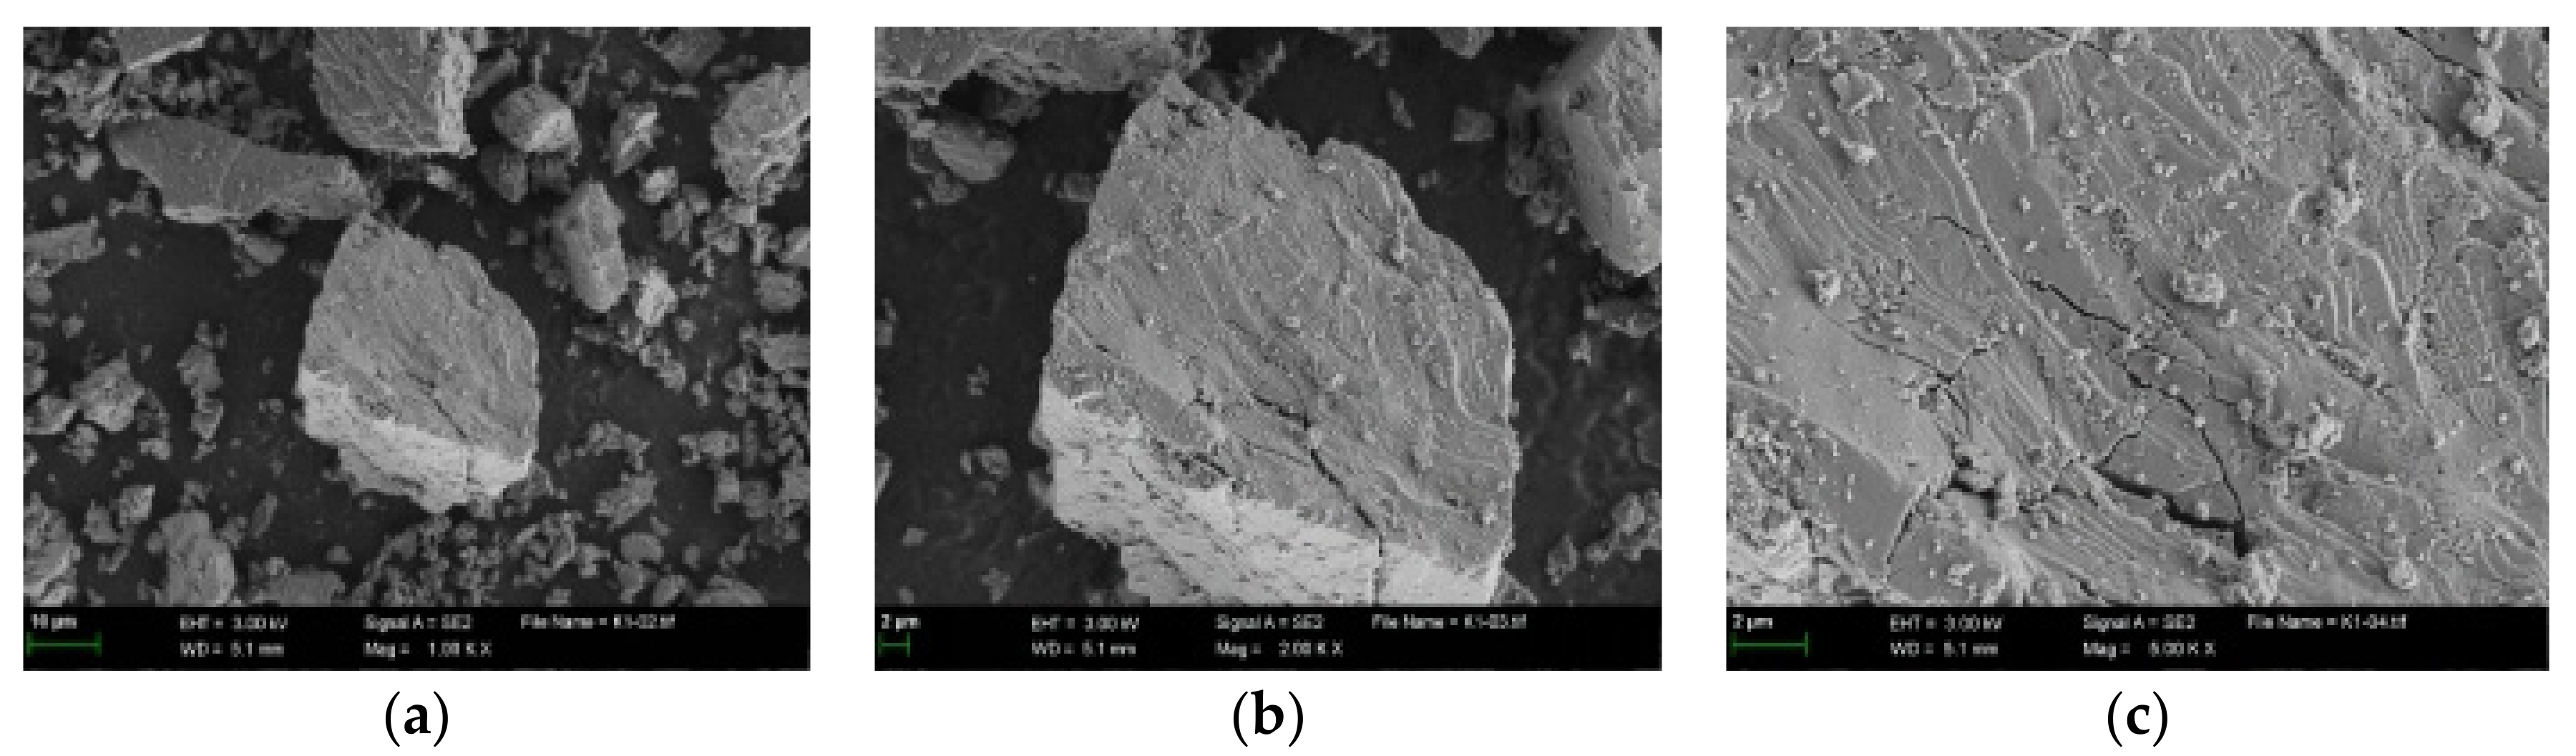
In this paper, scanning electron microscopy (SEM) was used to conduct micromorphology tests on four kinds of fillers, and the results are shown in Figure 4, Figure 5, Figure 6 and Figure 7.
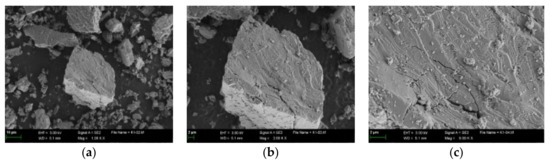
Figure 4.
SEM image of limestone. (a) 1000 times. (b) 2000 times. (c) 5000 times.

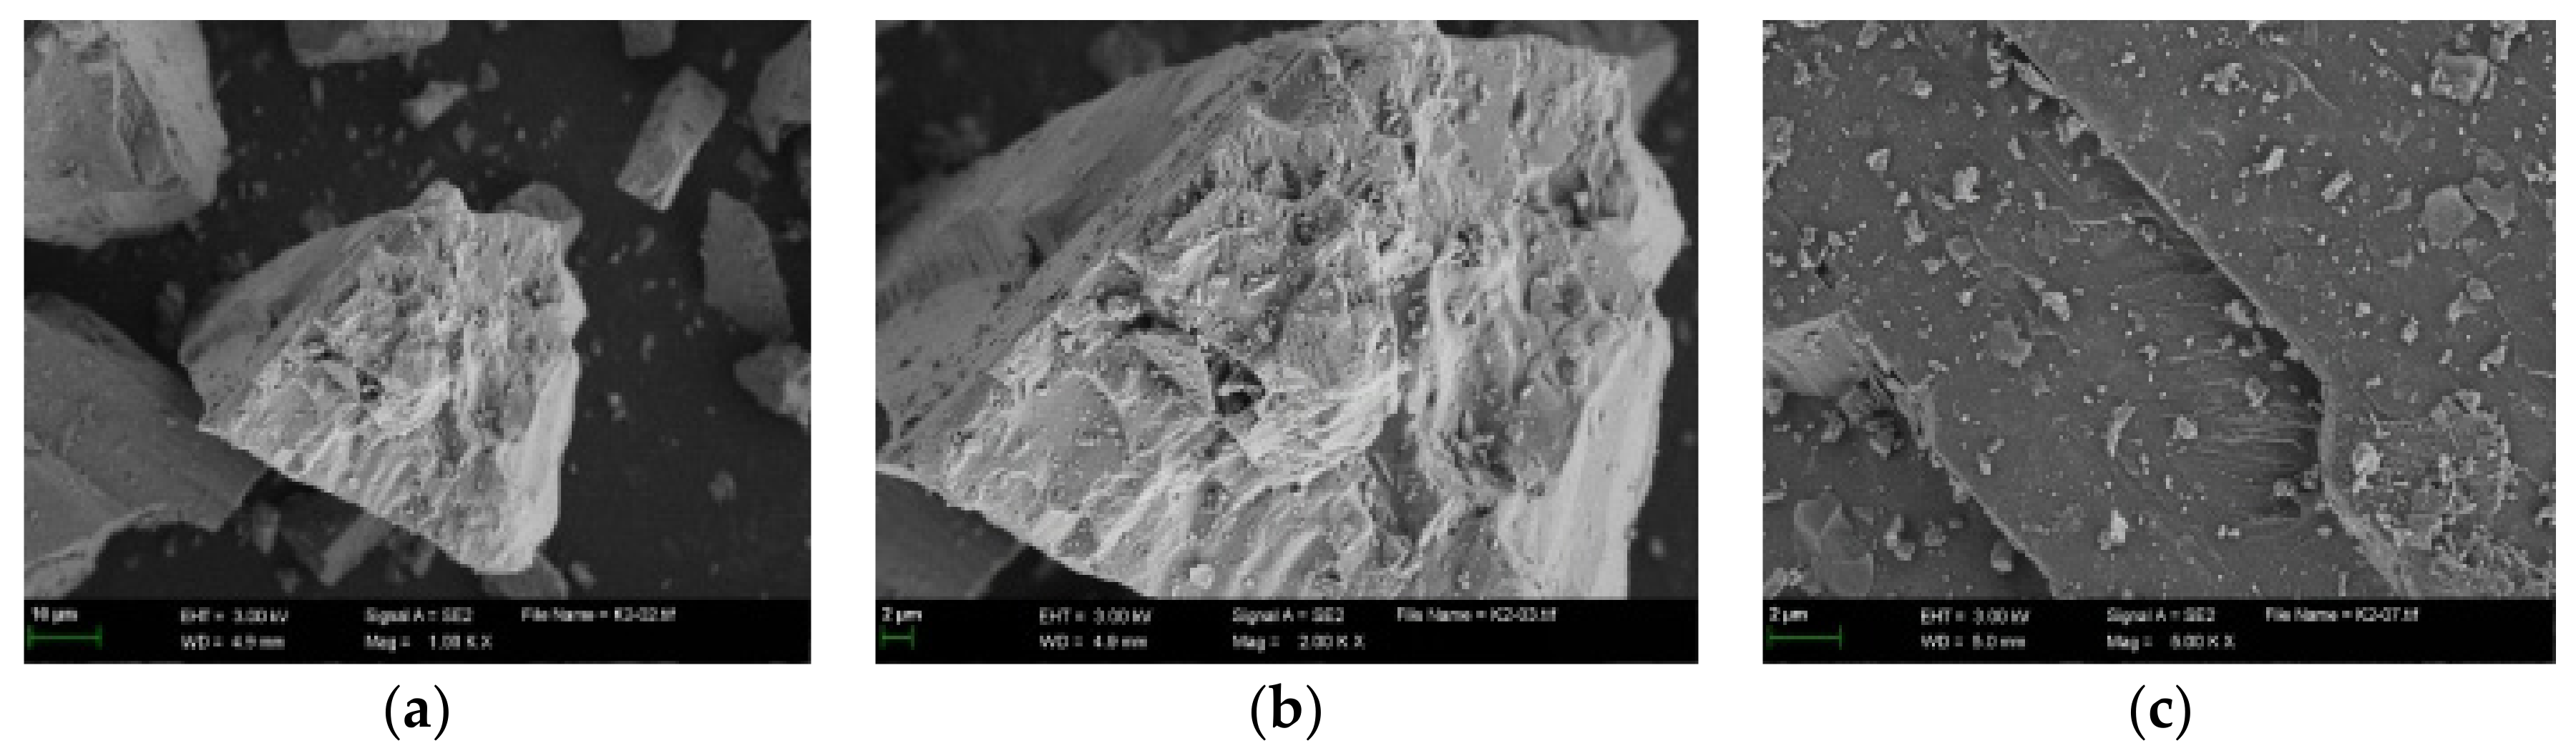
Figure 5.
SEM image of granite. (a) 1000 times. (b) 2000 times. (c) 5000 times.

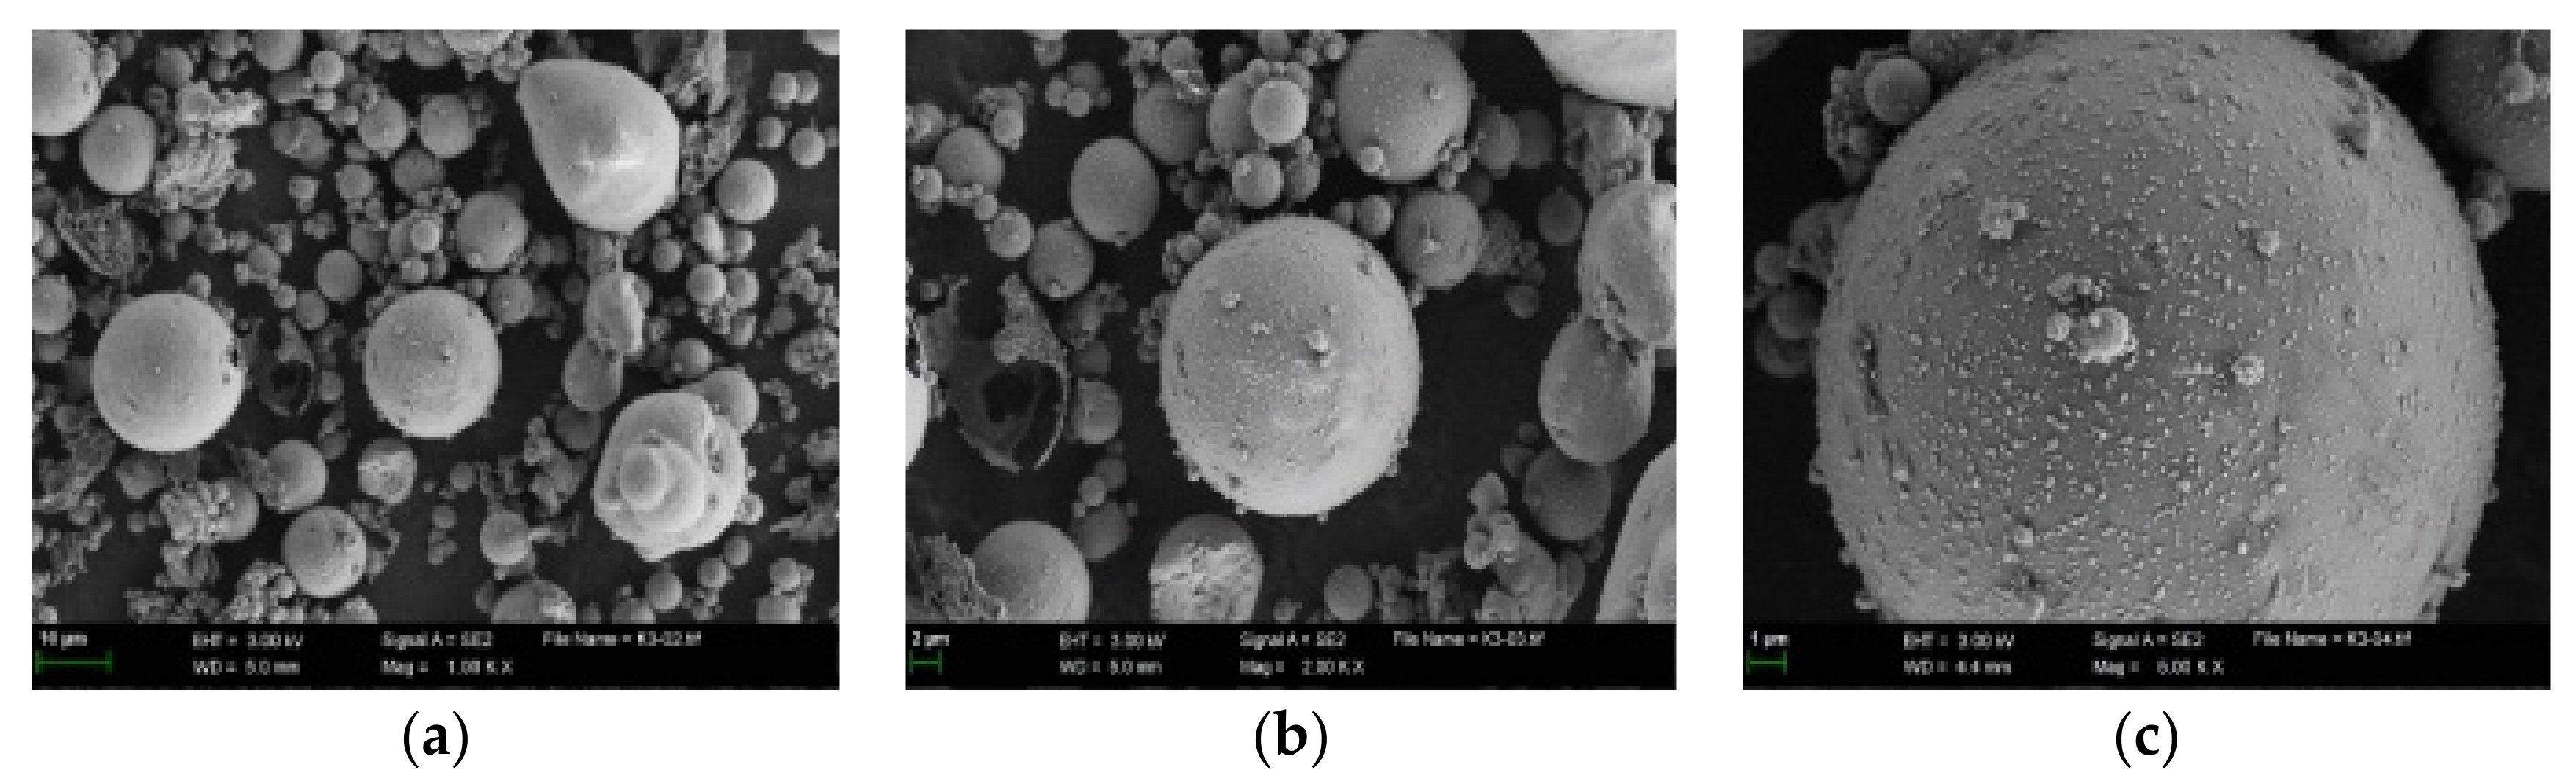
Figure 6.
SEM image of fly-ash. (a) 1000 times. (b) 2000 times. (c) 5000 times.
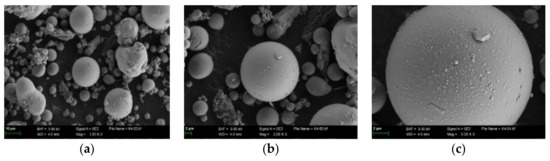
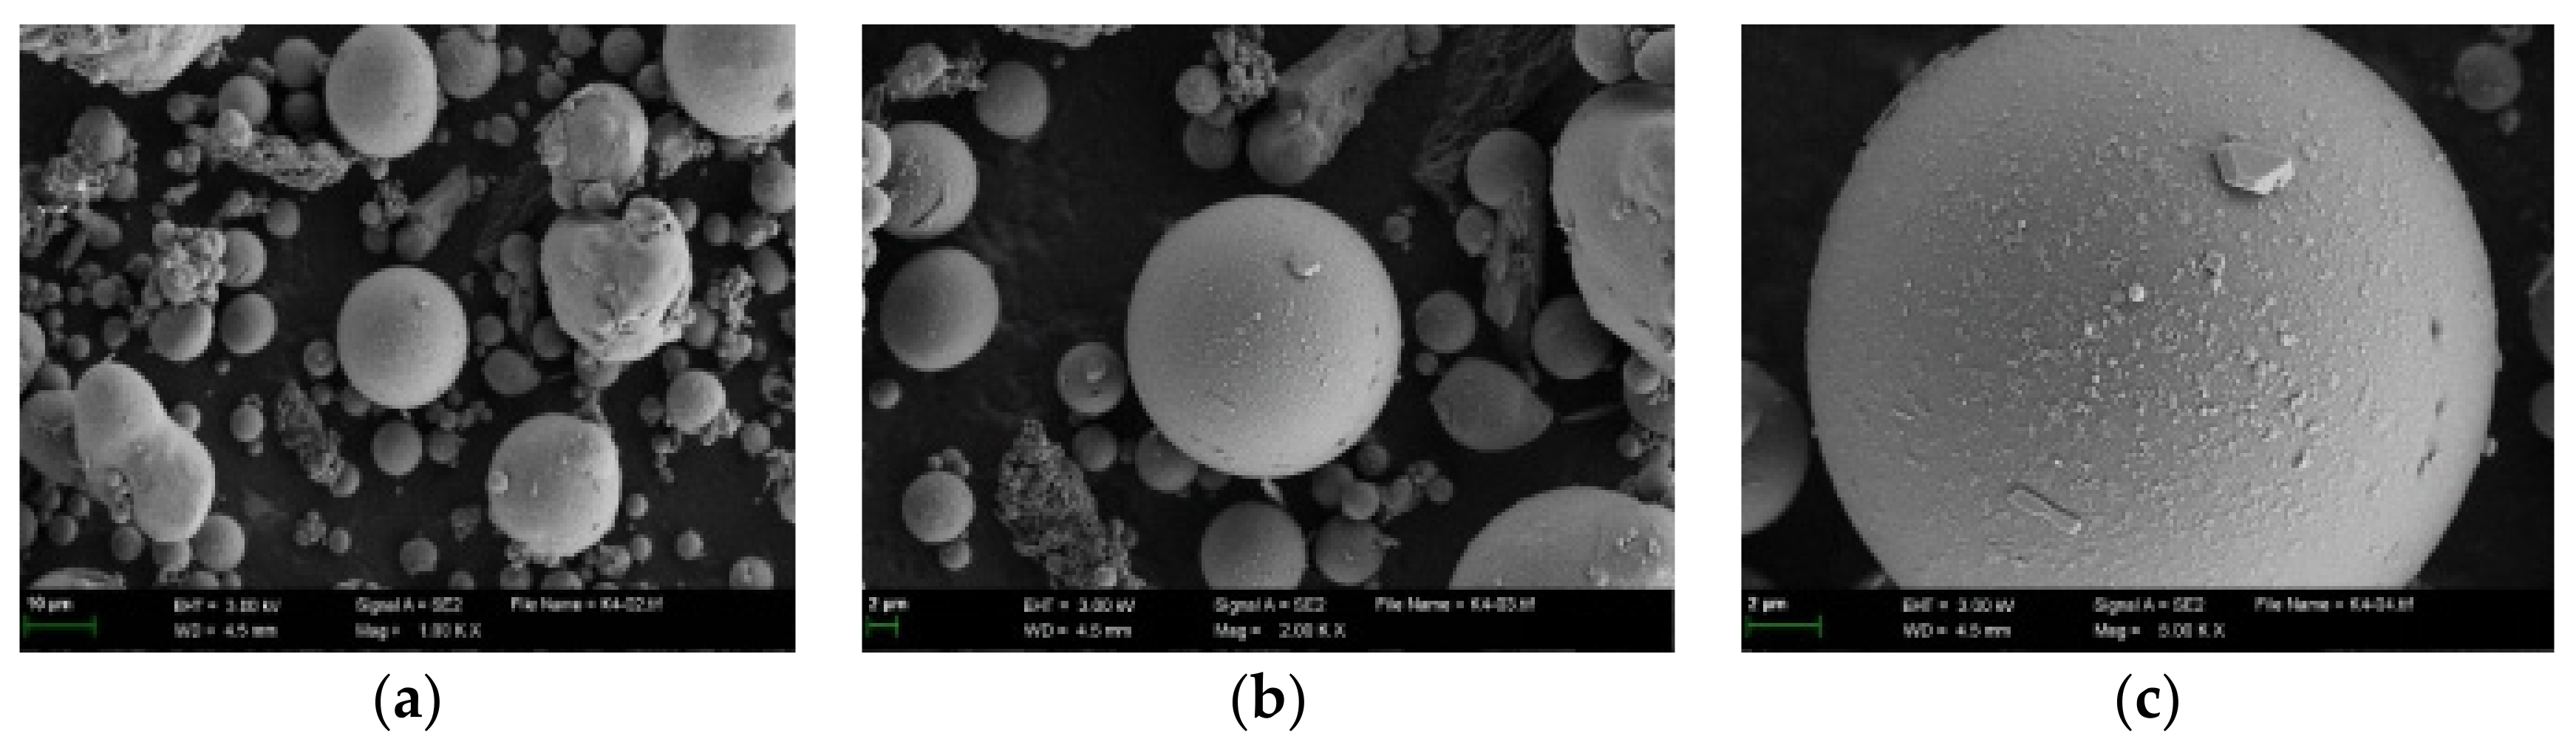
Figure 7.
SEM image of coal gangue. (a) 1000 times. (b) 2000 times. (c) 5000 times.
As can be seen from Figure 4, Figure 5, Figure 6 and Figure 7, the particles of limestone and granite are similar, and the surface of massive particles is relatively smooth. The roughness of limestone is low, and the raised and open porosity on the particle surface is lower, while the filler particles of fly-ash and coal gangue are spherical, relatively rough, and have more raised structures on the surface. Compared with limestone and granite, the raised or depressed structure on the surface of fly-ash and coal gangue will lead to the particles of a specific surface area increasing, which will also increase the contact area of asphalt and fillers, so that the raised or depressed structure of fillers can play a larger role when in contact with asphalt, and the molecular interaction force of asphalt and filler is greatly enhanced, to improve the interaction capacity of asphalt and fillers.
The open pore structure on the surface of fly-ash and coal gangue is equivalent to the capillary force generated when the microcapillary is in full contact with asphalt. Rhis will be conducive to the absorption of more asphalt, so that the filler–asphalt interface force will increase, and the high-temperature performance of asphalt mastic will further improve. The comparison between fly-ash and coal gangue shows that the surface roughness of most coal gangue powder is greater than that of fly-ash, which makes coal gangue contact asphalt more fully. These special structures on the surface of coal gangue will help it to absorb the light components of asphalt, so that the coal gangue asphalt mastic can produce more structural asphalt, improving the high-temperature stability of the mastic.
4.1.2. Particle Size Analysis
The laser particle size-tester was used to test limestone, granite, fly-ash and coal gangue in succession. The particle size distribution data are shown in Table 4, the average of the three measurements was used as the particle size distribution curve, and the results are shown in Figure 8.
Table 4.
Particle size data of different kinds of fillers.
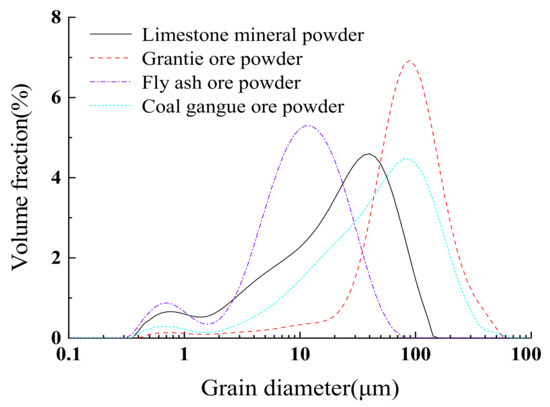
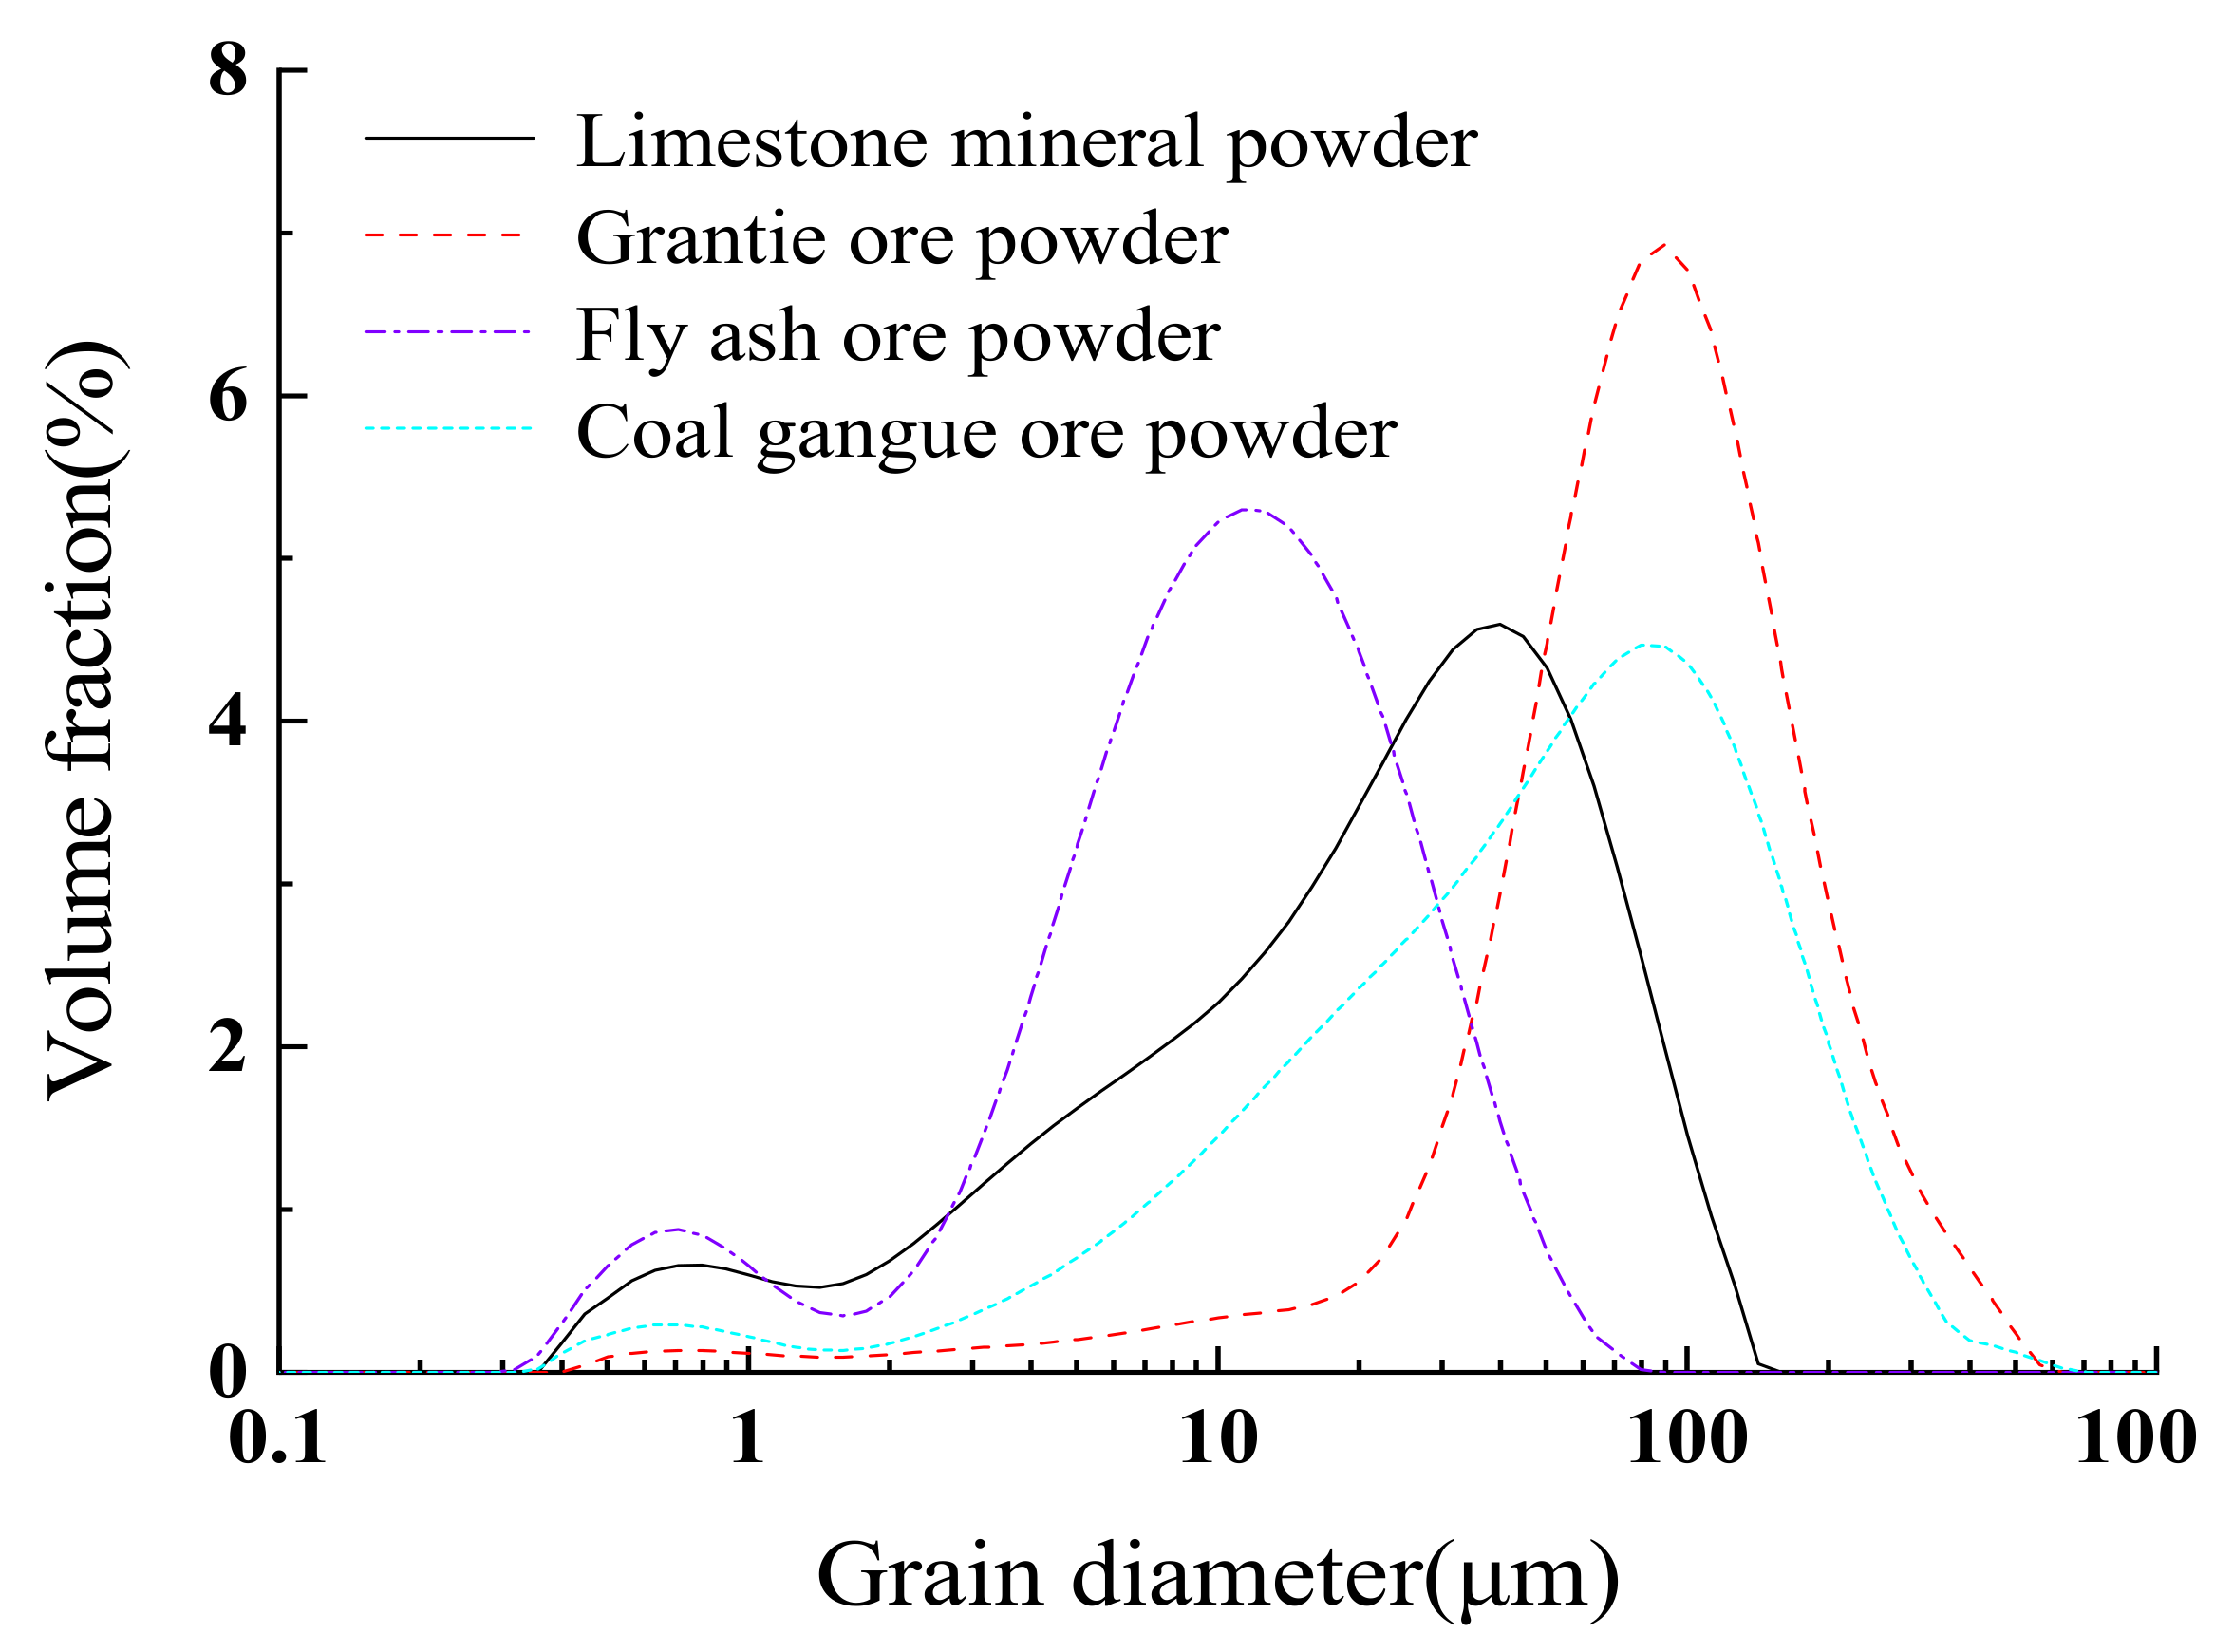
Figure 8.
Particle size distribution of different kinds of mineral filler.
Figure 8 shows that, among the four kinds of fillers, the particle size of fly-ash was below 26.942 μm, which is the finest about 90%. The particle size of the fillers ranged from fine to coarse: fly-ash < limestone < coal gangue < granite. Table 4 shows the main particle size parameters of the four fillers. In Table 4, dv10 represents the particle size of a filler with a volume below 10%, dv50 represents the particle size of a filler with a volume below 50%, and dv90 represents the particle size of a filler with a volume below 90%. Looking at the size of a hypothetical cluster of homogeneous particles, d[3,2] shows the average particle size of the surface area, which means that the particle shape of the particle group is the same, the total volume (weight) is the same, and the total surface area is the same. d[4,3] is the average volume particle size, which refers to the particle size of an imaginary particle group with the same particle shape, the same total volume and the uniform particle size of the same particles.
4.1.3. XRD Analysis
To analyze the lithological characteristics of fillers, XRD spectrum technology was used to test four kinds of fillers, and the results of this analysis are shown in Figure 9.

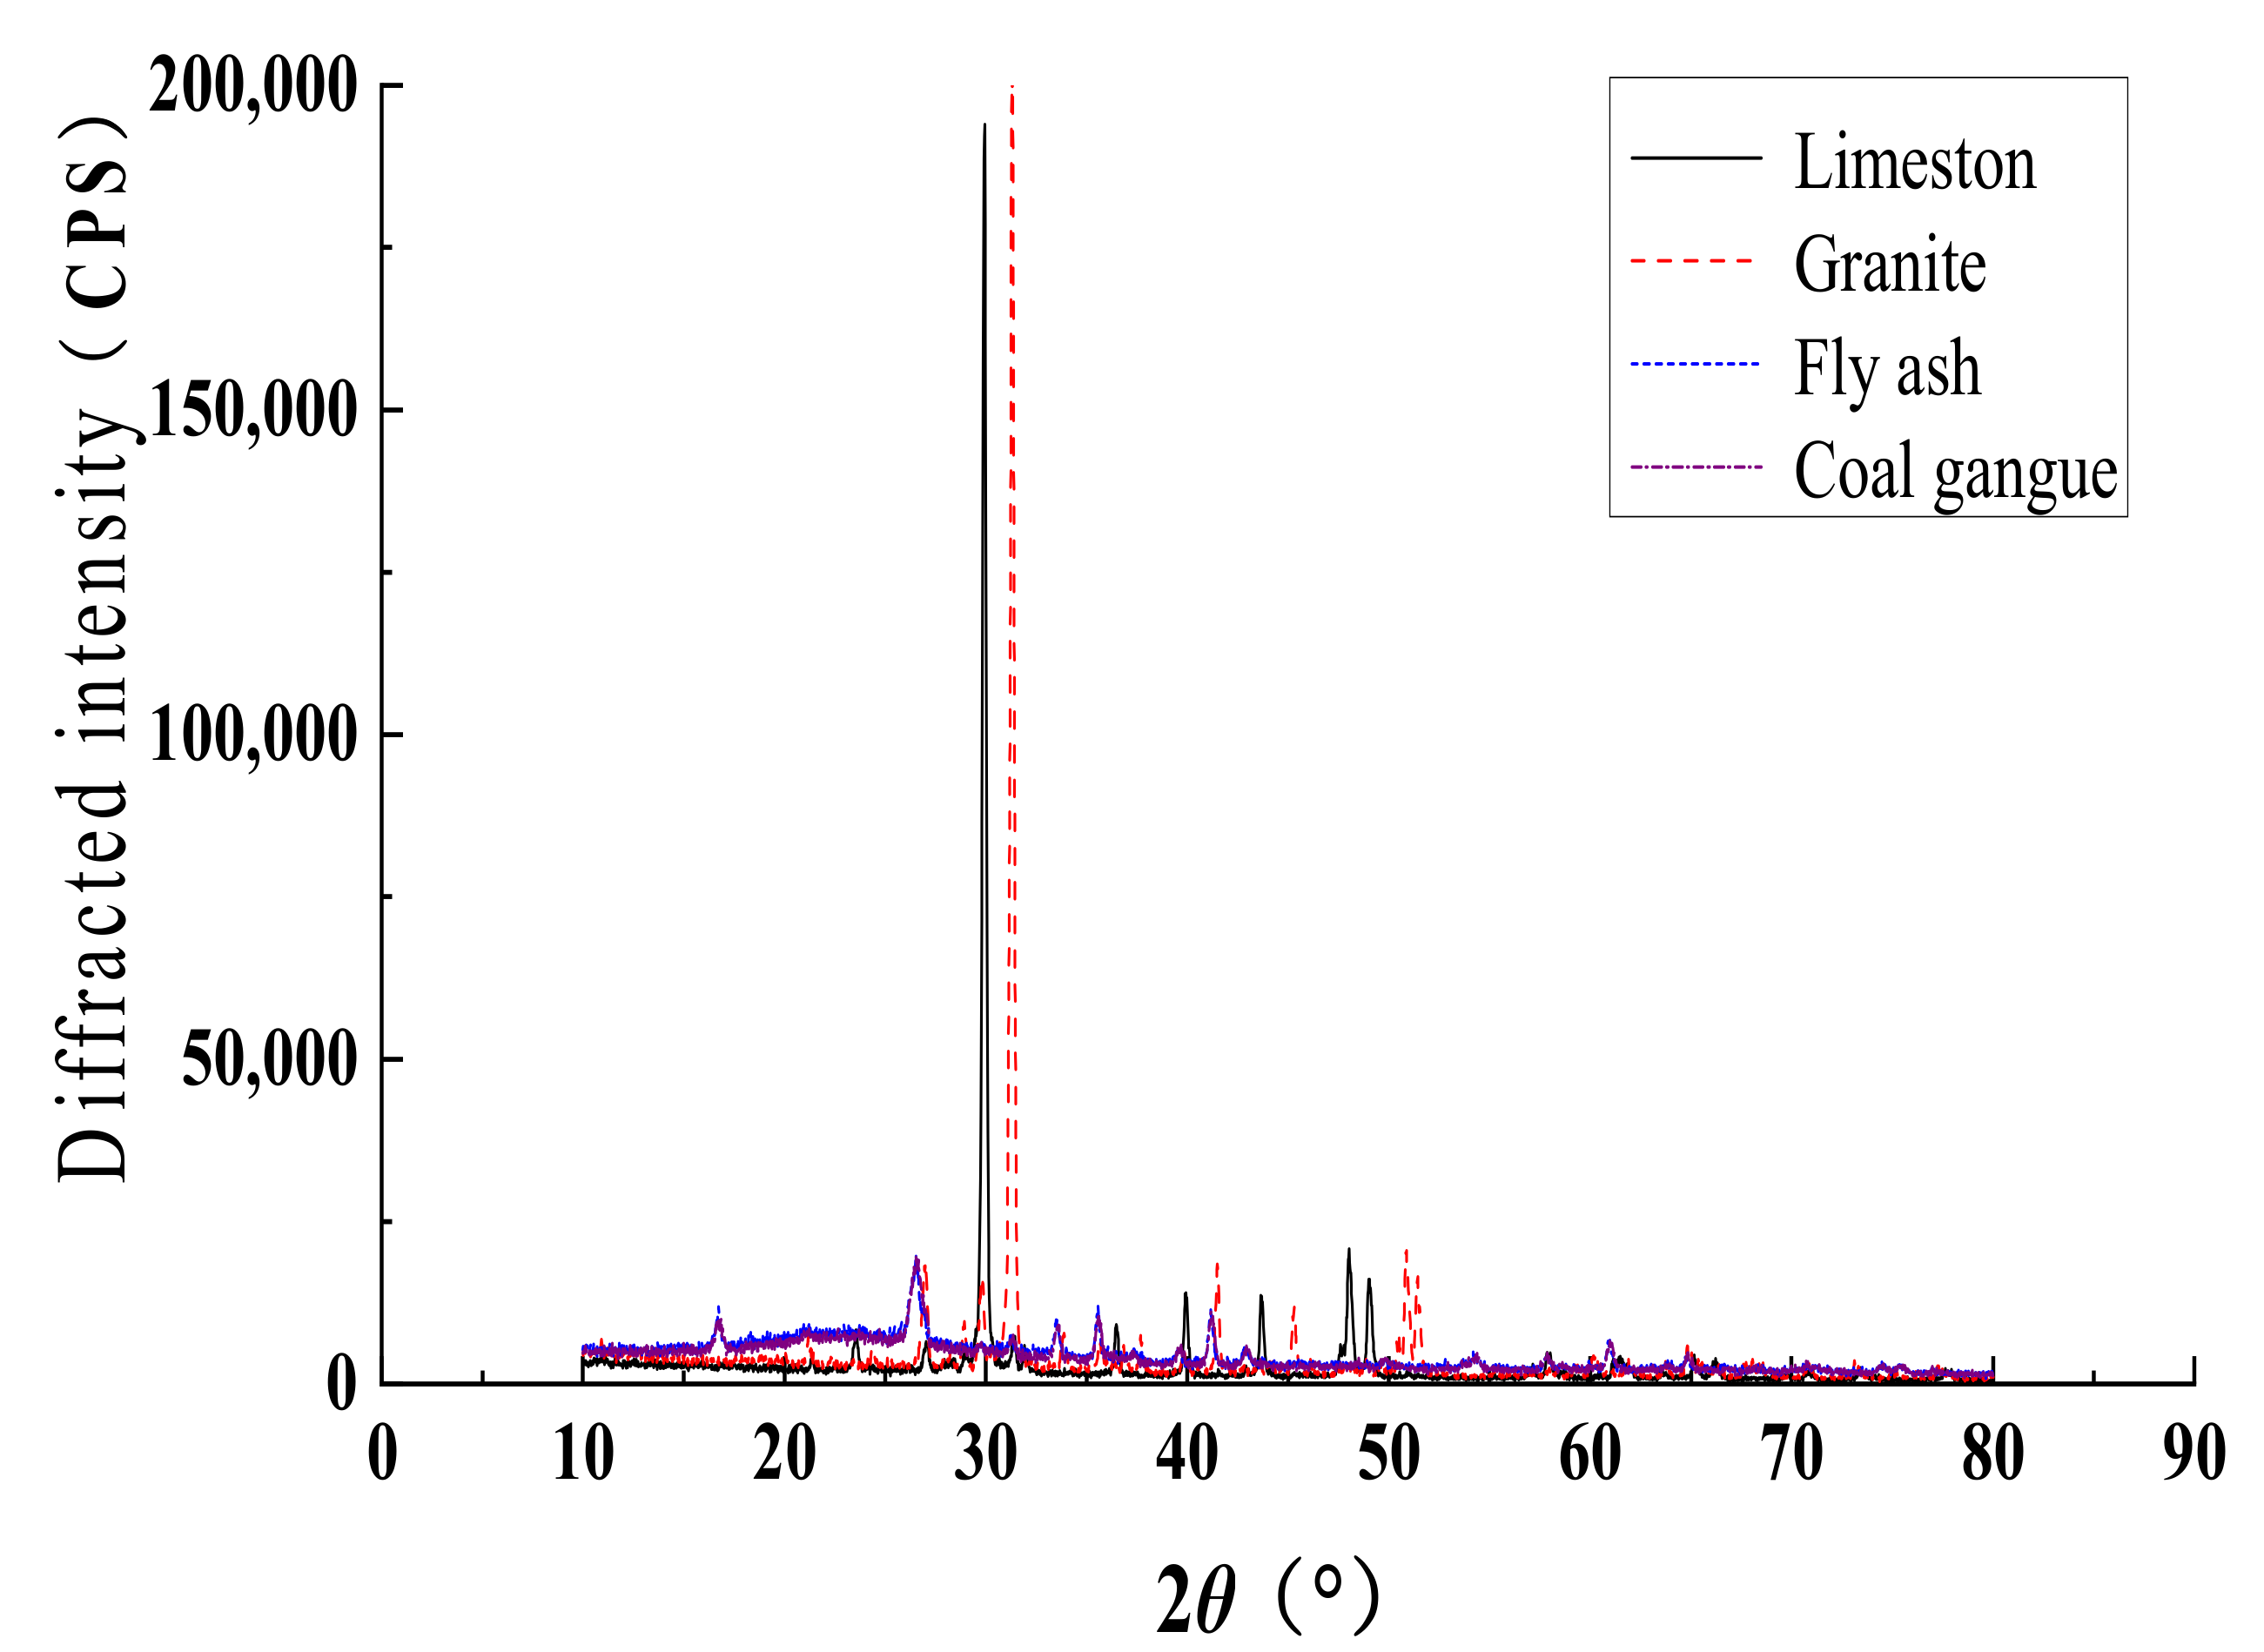
Figure 9.
XRD patterns of fillers.
Figure 9 can be seen that the main mineral composition of limestone is calcite, and the main chemical compositions are CaCO3 and CaMg (CO3). The main mineral composition of granite is quartz and plagioclase, whose main chemical compositions are SiO2 and [Ca0.38Na0.62] [Al1.38Si2.62O8]. The main mineral composition of fly-ash is quartz and calcite, with the main chemical composition of SiO2 and Fe2O. The main minerals of gangue are α-quartz, kaolinite, anorthite, muscovite and siderite, with the main chemical composition of SiO2 and [CaAl2Si2O4][4H2O]. Among the four kinds of fillers presented above, only granite was shown to have acidic crystallization, while asphalt contains a large amount of anhydride, which will adversely affect the bonding of granite and asphalt. The main mineral composition of limestone is calcite, which contains less active mineral composition. The XRD patterns of fly-ash and coal gangue are similar; hence, the diffraction peak in quartz, 2θ near 18°, is obviously enhanced, while the diffraction peak of 2θ near 27° mainly reflects the chemical composition of Fe2O3. Therefore, it can be seen from the XRD spectrum that fly-ash and coal gangue have more active mineral components.
To quantitatively analyze the active mineral composition of the four kinds of fillers, Origin software was used to integrate the XRD diffraction peak pattern. The sum areas of the corresponding peaks in each compound were divided by the total area of all peaks, and the relative content of each compound was finally obtained by calculating the total area of the peaks and the area of individual peaks in the diffraction pattern. The chemical composition analysis results obtained using the above methods are shown in Table 5.
Table 5.
Relative contents of four mineral filler chemical components.
It can be seen from Table 5 that the SiO2 content of limestone, granite and fly-ash are all under 45%, and all three belong to ultra-basic rock fillers. Limestone has the highest content of CaO, and is more likely to react with acidic asphalt. Therefore, limestone has a good interaction with asphalt, while the main component of fly-ash is acidic SiO2, which is difficult to combine with asphalt, making its interaction with asphalt is relatively weak. The content of Al2O3 in coal gangue is as high as 25.93%, and the content of CaO is 19.01%. The active mineral component Al2O3 is a typical amphoteric alkaline compound, which help to improve its interaction with asphalt. Therefore, in addition to its physical properties, the chemical composition of coal gangue also plays a role in promoting interactions with asphalt.
4.2. Rheological Properties
4.2.1. Rutting Factor (G*/sinδ)
Rutting factor (G*/sinδ) represents the asphalt’s ability to resist permanent deformation under repeated loads. The higher the G*/sinδ, the stronger the high-temperature rutting resistance and fatigue cracking resistance of the asphalt mastic. The change in the G*/sinδ of TPU-modified asphalt mastic with the different F/A and temperature is shown in Figure 10.
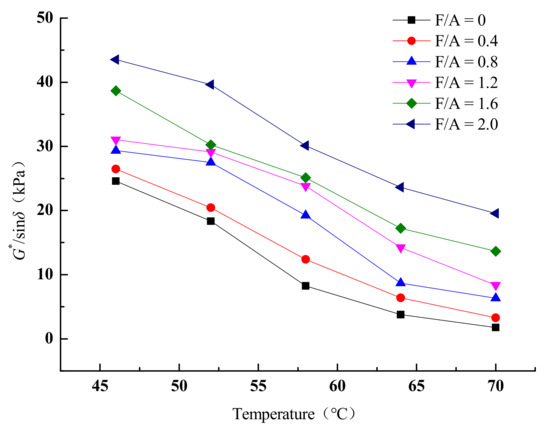
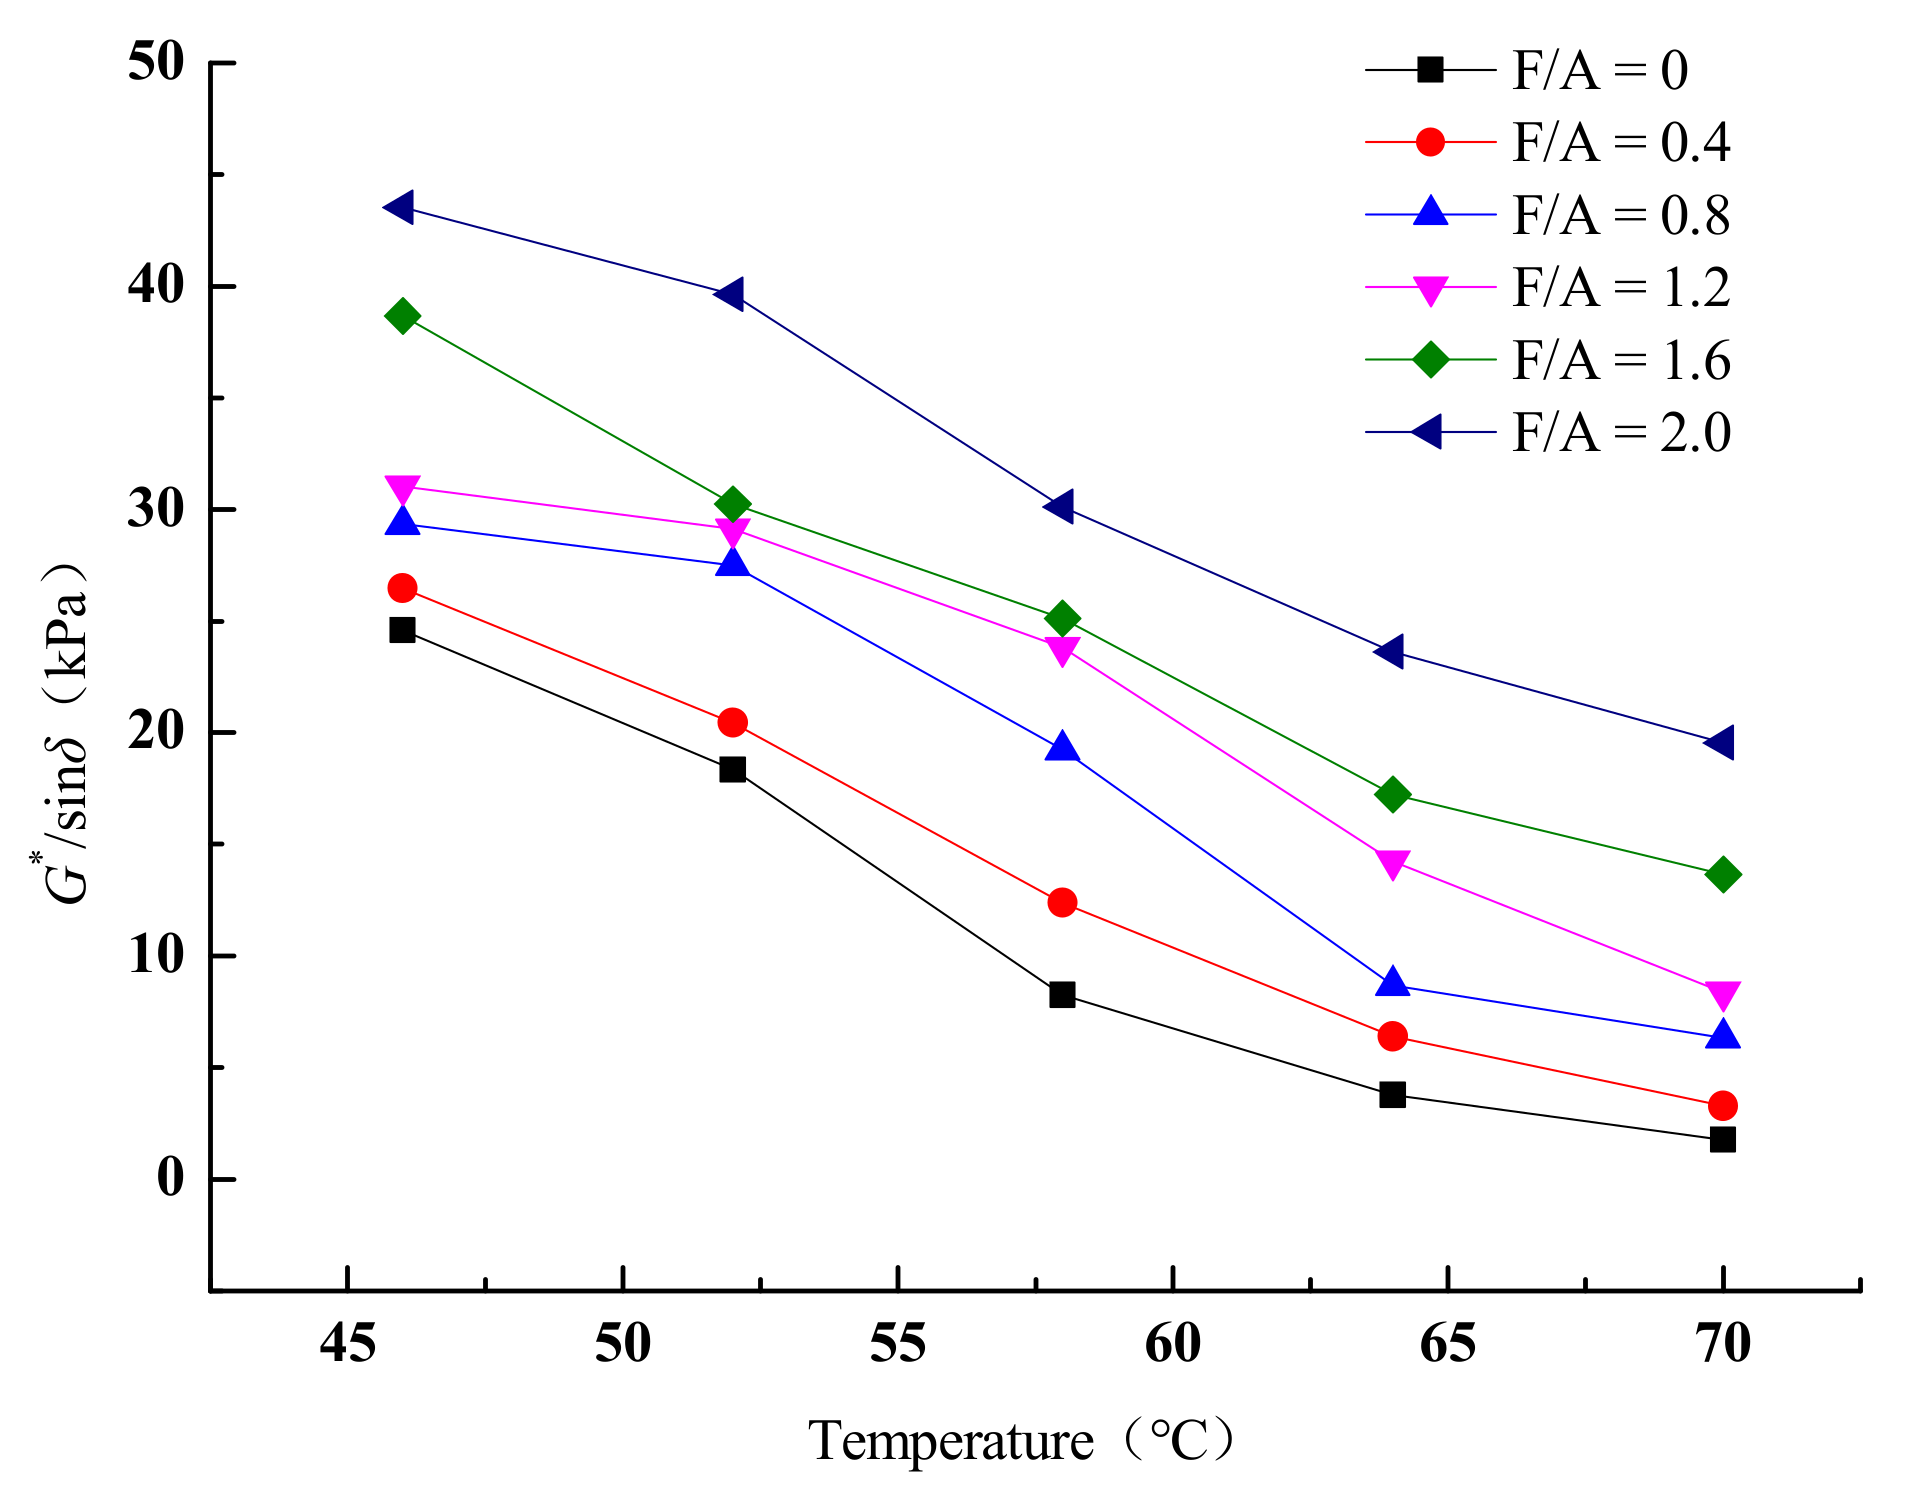
Figure 10.
G*/sinδ of TPU-modified asphalt mastic with a different F/A and temperature.
The addition of TPU can greatly improve the thermoplasticity of base asphalt. In addition, the G*/sinδ of asphalt mastic increases with the increase in F/A at the same temperature; this trend gradually decreases with the increase in temperature. The results indicate that increasing the ratio of F/A can significantly improve the high-temperature rutting resistance of TPU-modified asphalt mastic at low temperatures.
The high-temperature performance of TPU-modified asphalt mastic changes with the F/A at different temperatures. When F/A = 0–0.4, the high-temperature performance of TPU-modified asphalt mastic steadily rises, which shows a linear relationship; when F/A = 0.8–1.2, the high-temperature performance slowly increases, and the TPU-modified asphalt mastic system reaches a stable stage. When F/A is greater than 1.6, the high-temperature performance obviously increases.
4.2.2. Master Curve of TPU-Modified Asphalt Mastic
|G*| tends to be the lower limit of the modulus as the loading frequency is close to zero according to the basic characteristics of viscoelastic materials, and when the loading frequency increases to infinity, |G*| is close to the upper limit of the modulus. The Sigmoidal function can better characterize the mechanical behavior. The standard Sigmoidal functions and generalized Sigmoidal functions are the two typical forms of Sigmoidal functions, which can be obtained from the following Equations:
where f is the loading frequency, Hz, δ1 is the lower limit of |G*|, α1 is the difference-value between the upper and lower limits of |G*|, λ1, β1 and γ1 are the shape factor of |G*|.
The displacement factors in Equation (12) should be exactly the same under the same parameters; however, the Williams–Landel–Ferry (WLF) equation can provide an accurate prediction in a wide frequency range, and will prove the most suitable displacement factor equation when constructing the master curve of asphalt materials. Therefore, the WLF equation was adopted in the construction of viscoelastic master curve of asphalt and asphalt mastic in this study, which is expressed as follows:
where T is the testing temperature, °C, Tr is the target temperature, and °C; C1 and C2 are the fitting parameters, respectively.
According to Equations (12) and (13), there are seven unknown parameters in the process of determining the principal viscoelastic curve in asphalt and asphalt mastic, which are δ1, α1, λ1, β1, γ1, C1 and C2, respectively. By substituting Equation (13) into Equation (12), the target temperature Tr can be selected as 20 °C, based on Equations (12) and (13), to calculate the error in the |G*| predicted value and the measured values as the control parameter fitting, as follows:
where N is the number of measuring points, |G*|m,i is the measured dynamic shear modulus of the i th datapoint, and |G*|p,i is the predicted dynamic shear modulus-value of the i th datapoint.
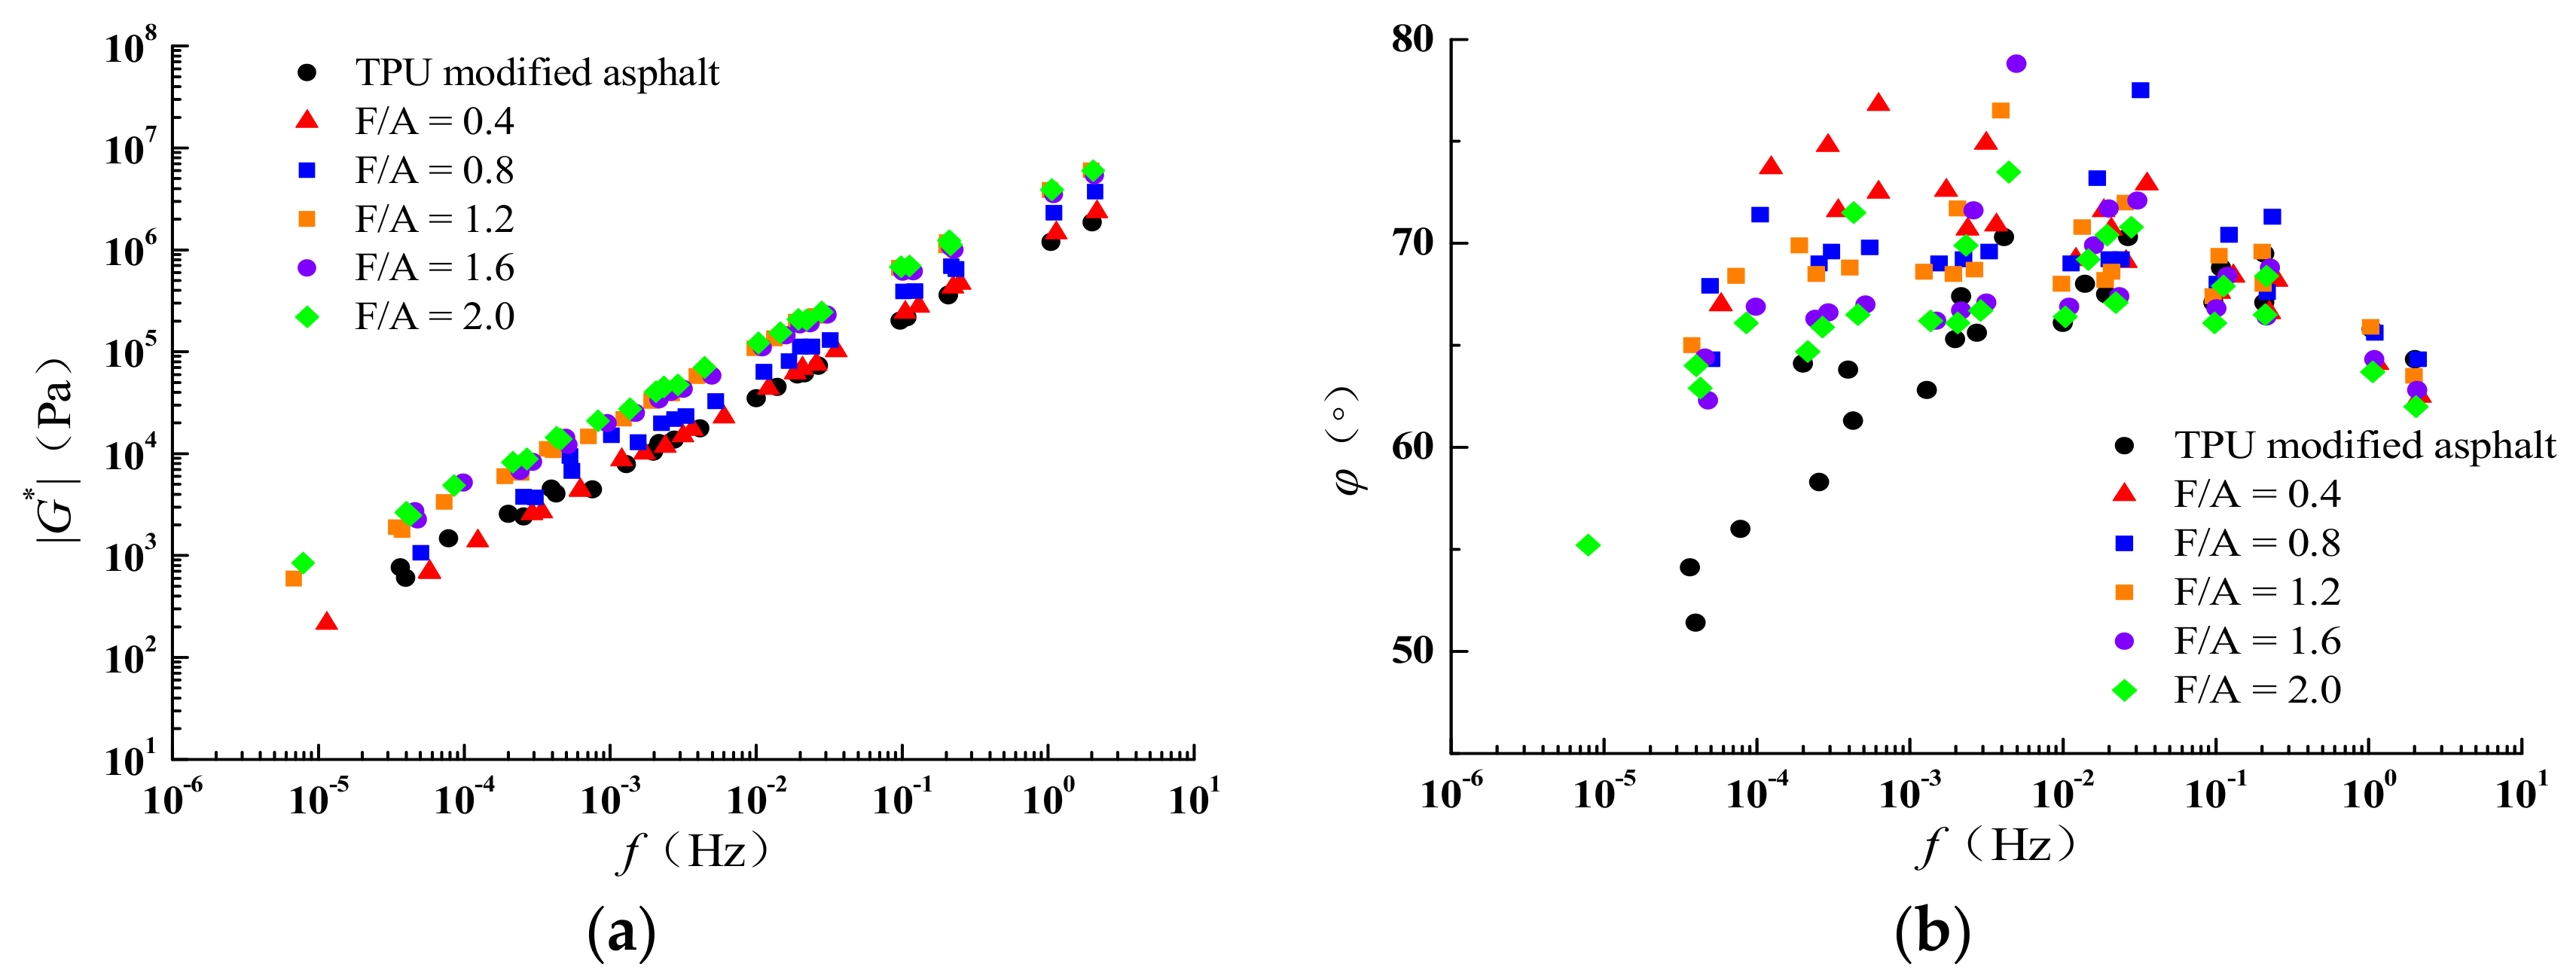
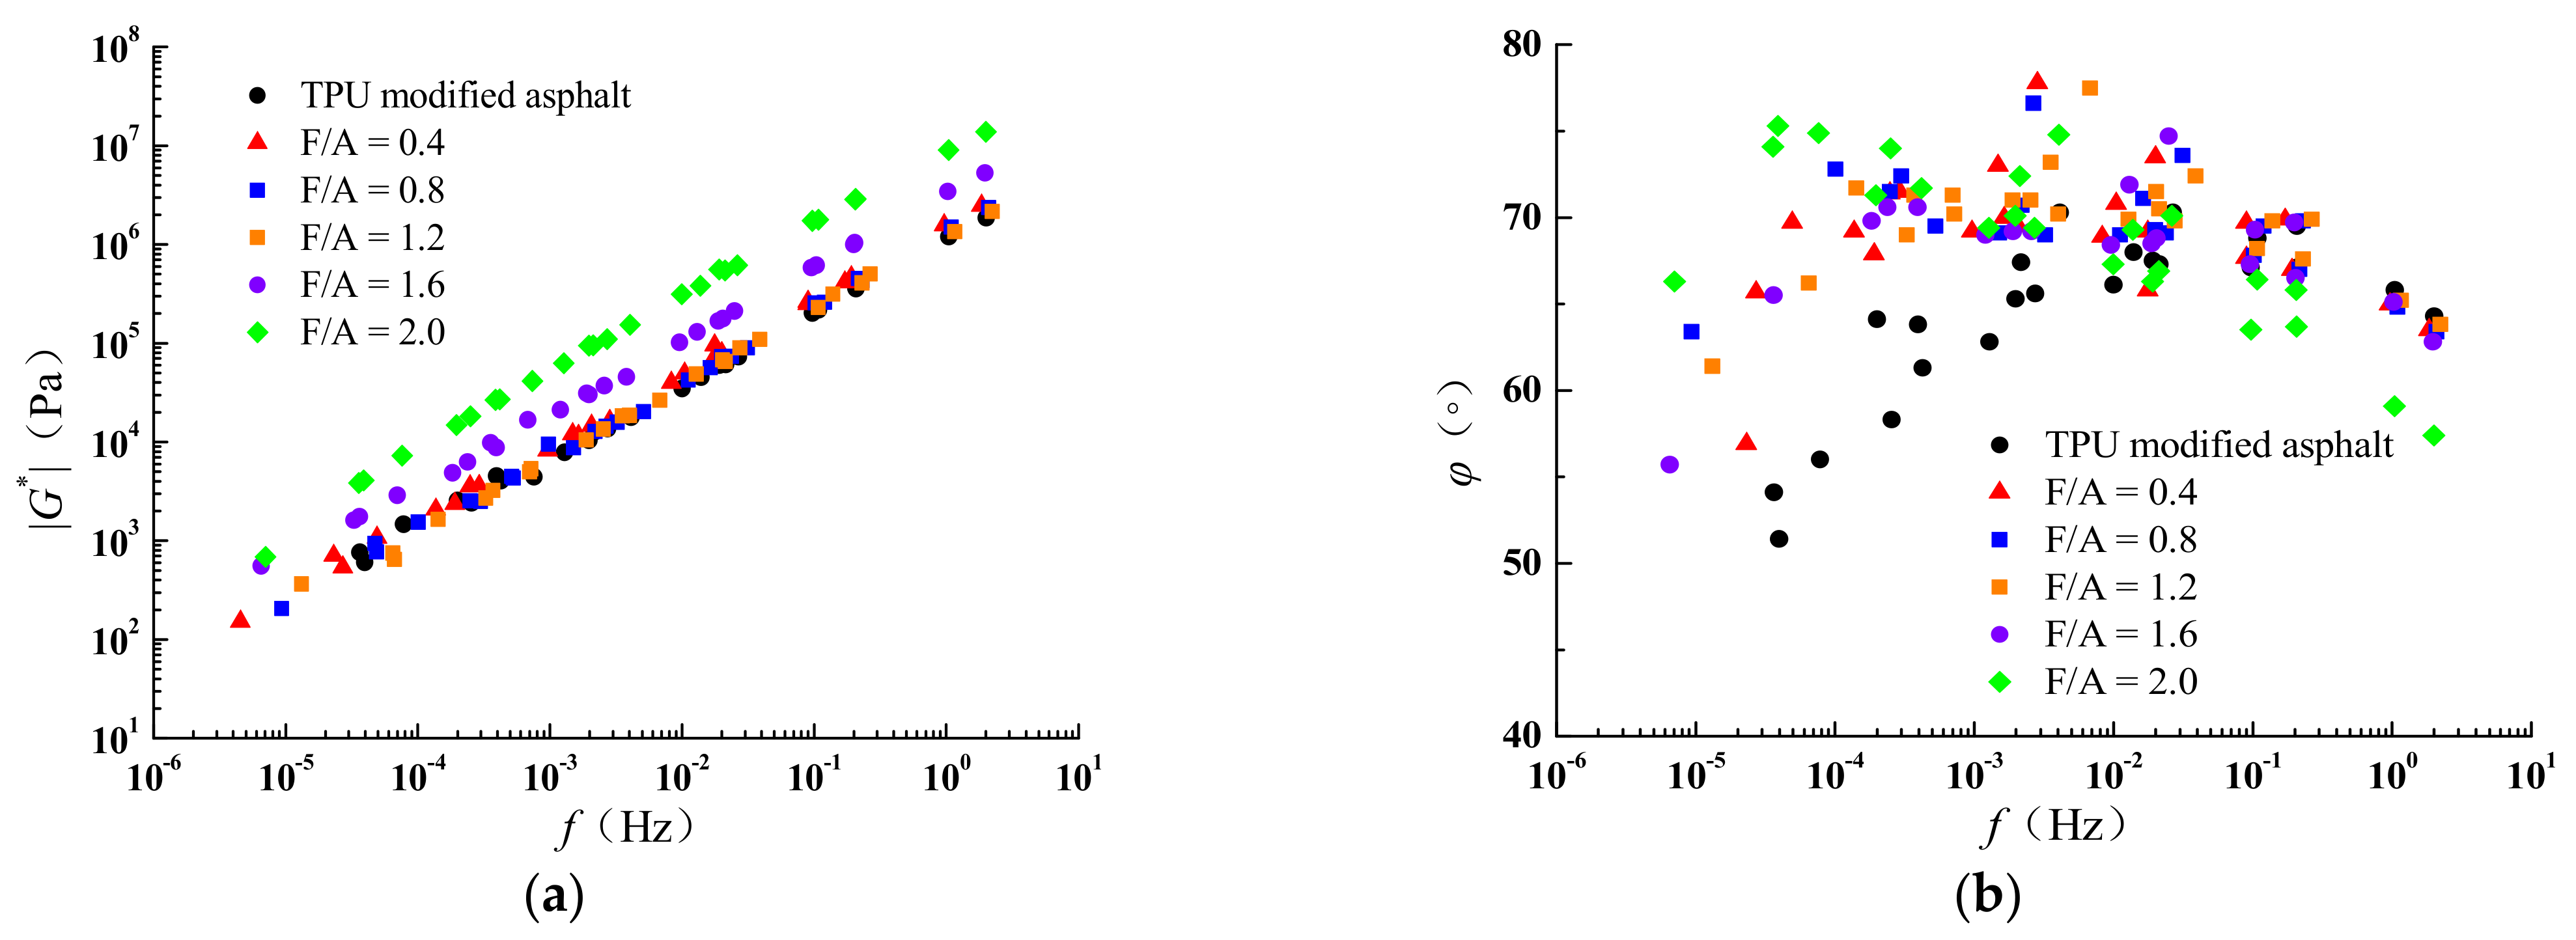
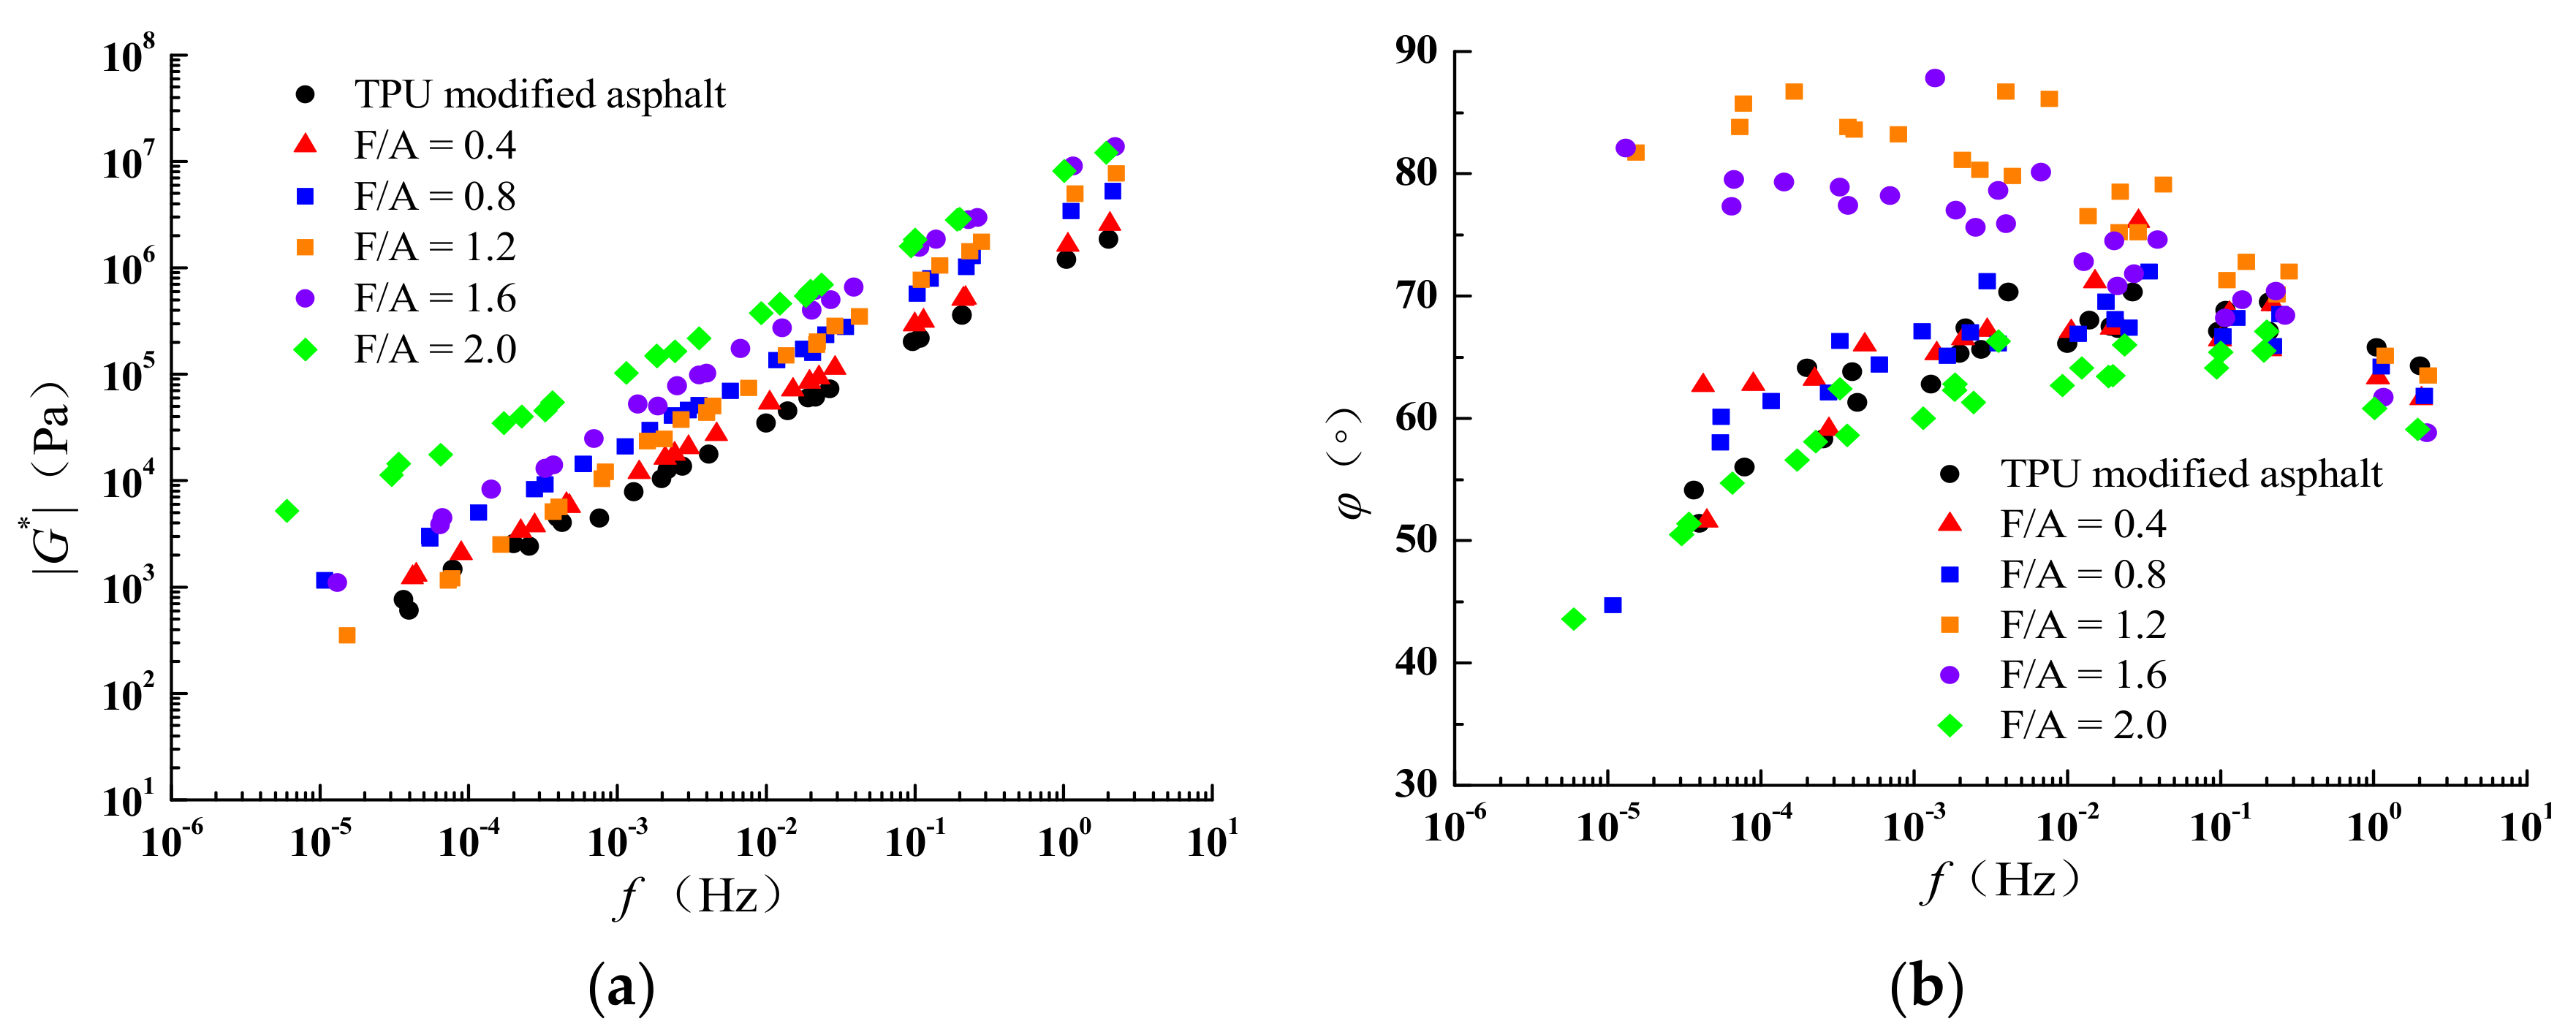
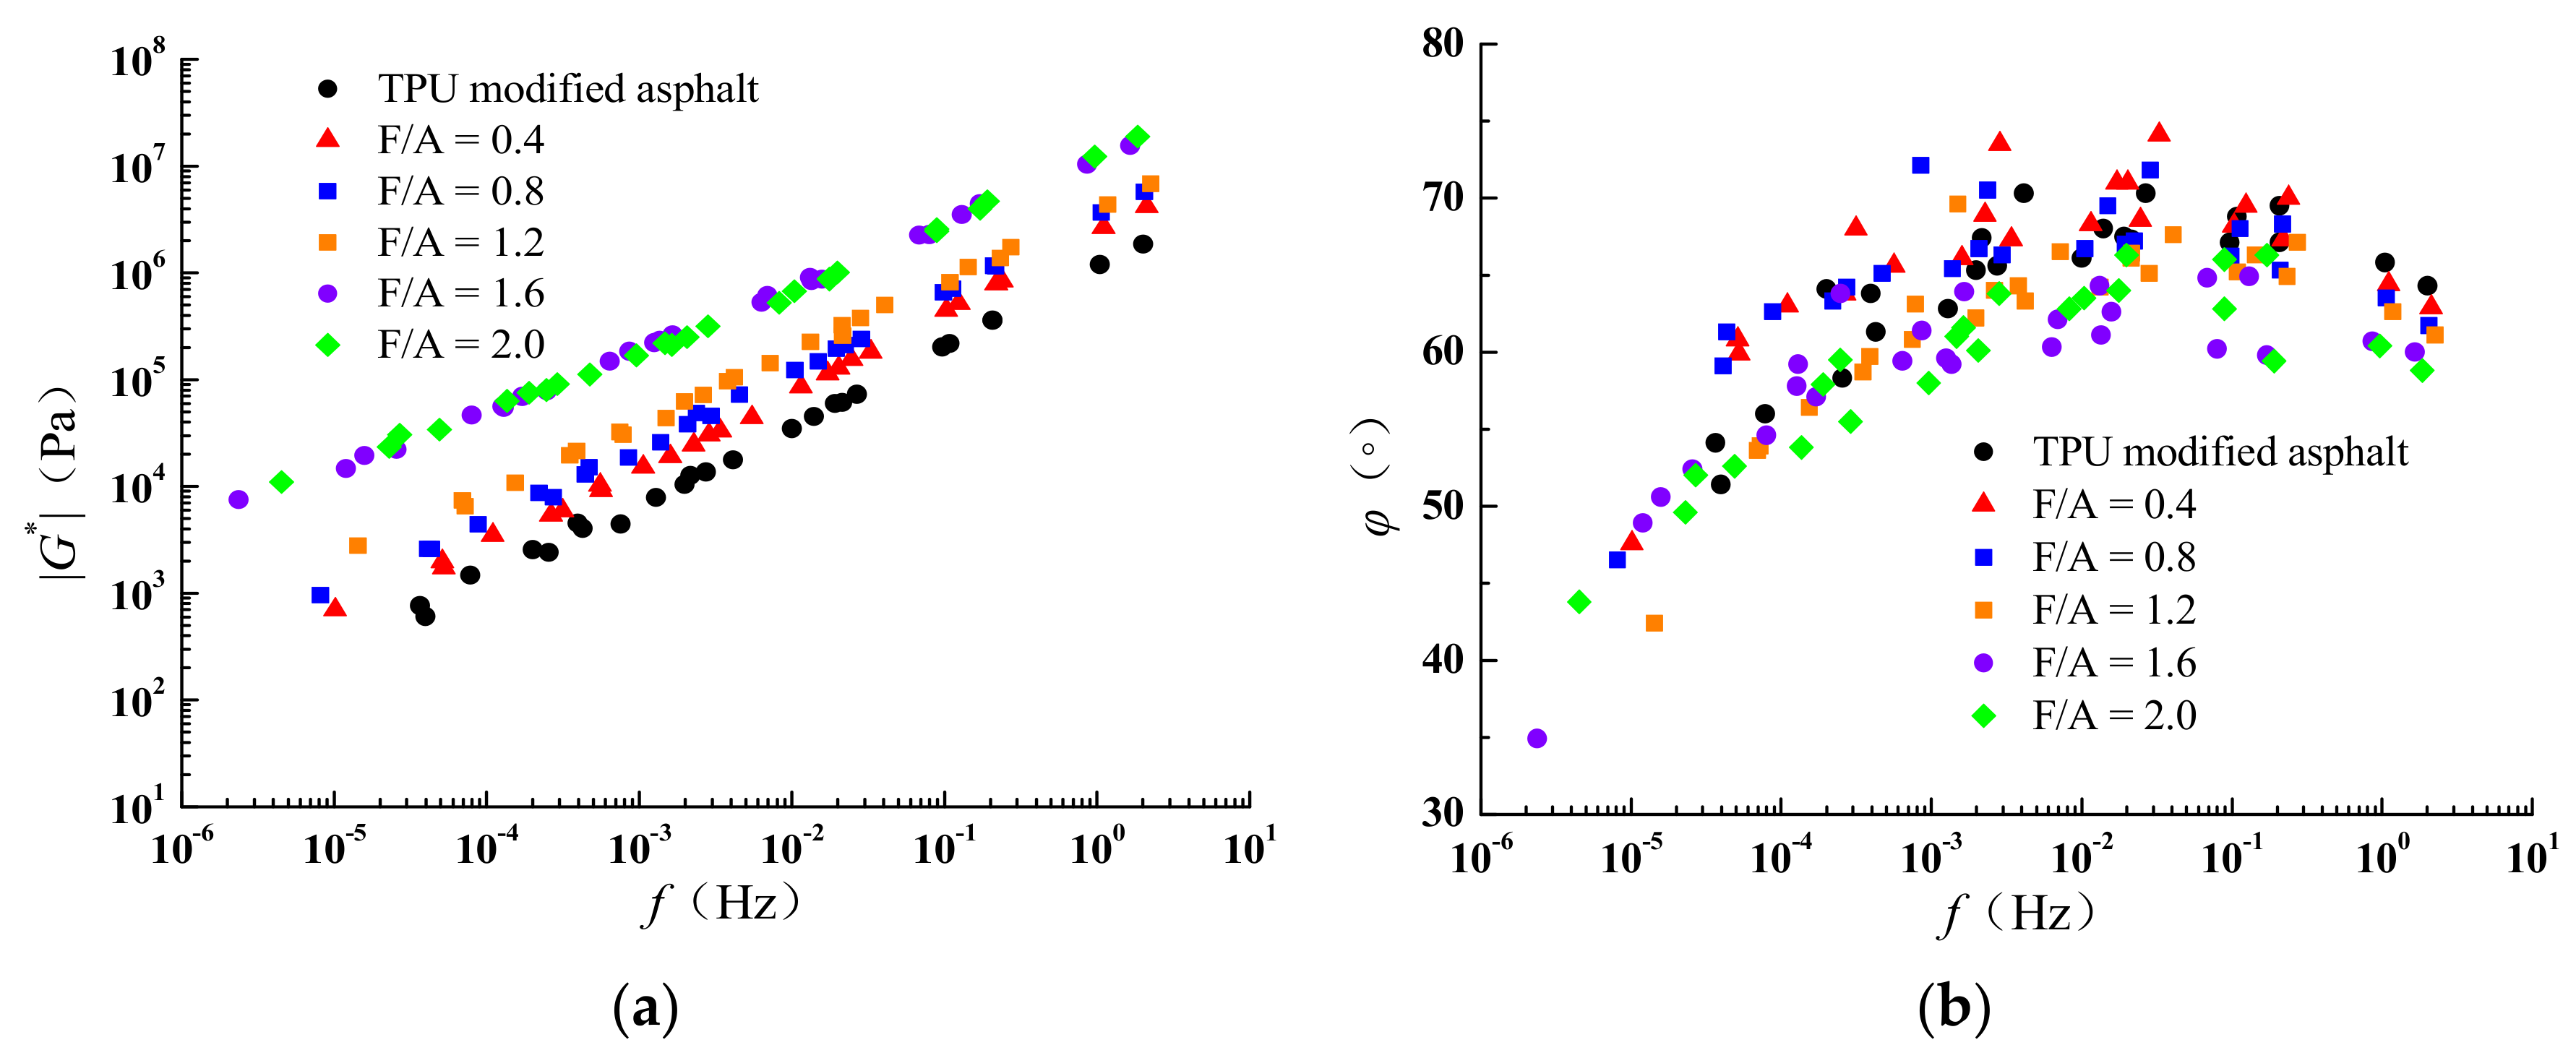
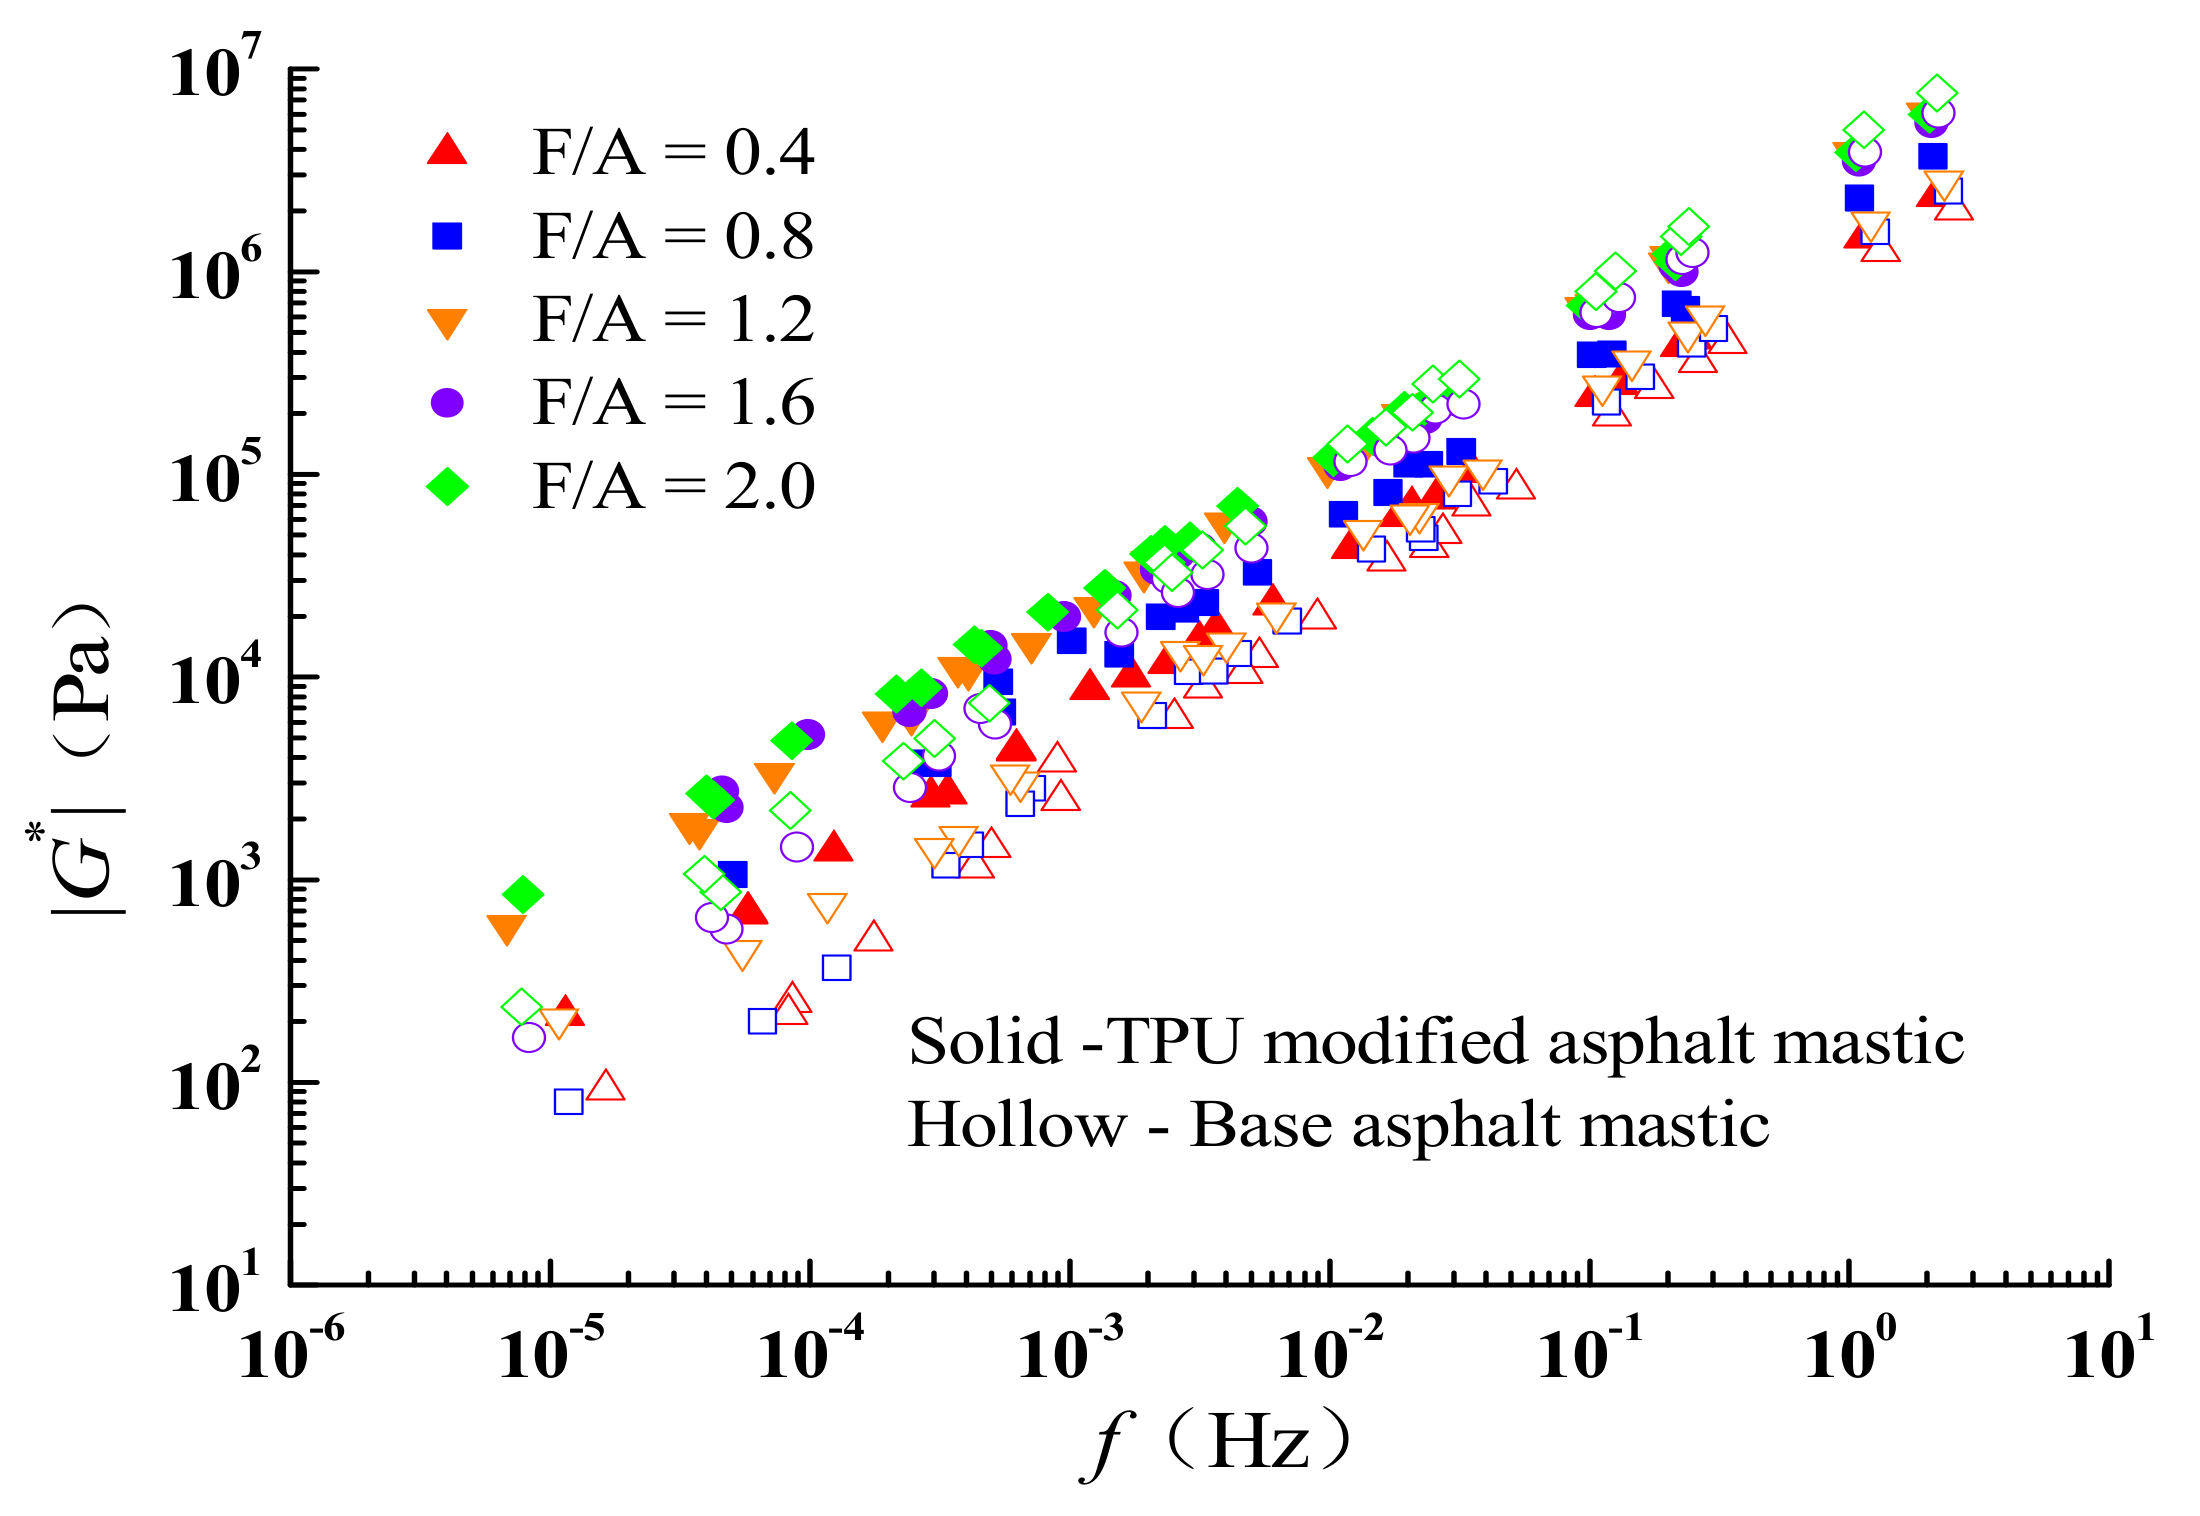
The Generalized Sigmoidal function and WLF were used to establish the |G*| master curve in TPU-modified asphalt mastic. As can be seen from Figure 11, Figure 12, Figure 13 and Figure 14, the complex shear modulus (|G*|) master curves of TPU-modified asphalt mastic were gradually increased with the increase in F/A. The master curve of phase angle (δ) was relatively scattered; the δ of asphalt mastic decreased with the increase in F/A.
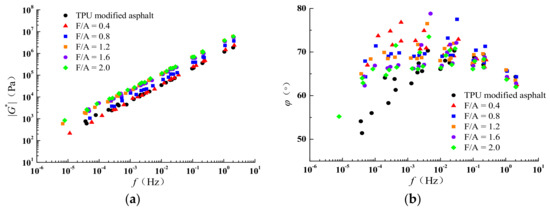
Figure 11.
Master curve of limestone TPU-modified asphalt mastic (LTAM). (a) Master curve of |G*|. (b) Master curve of δ.
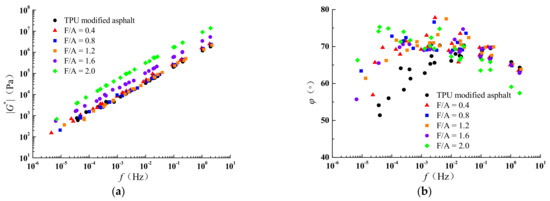
Figure 12.
Master curve of granite TPU-modified asphalt mastic (GTAM). (a) Master curve of |G*|. (b) Master curve of δ.
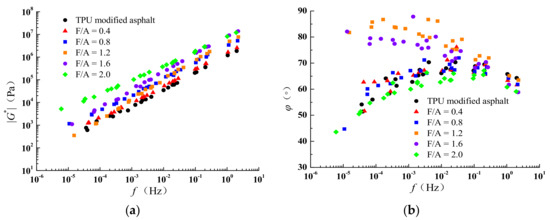
Figure 13.
Master curve of flyash TPU-modified asphalt mastic (FTAM). (a) Master curve of |G*|. (b) Master curve of δ.
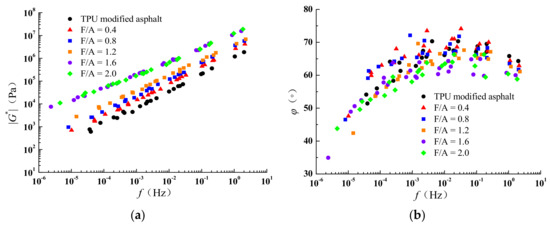
Figure 14.
Master curve of coal gangue TPU-modified asphalt mastic (LTAM). (a) Master curve of |G*| (b) Master curve of δ.
The master curve fitting results of TPU-modified asphalt mastic with different kinds of filler are shown in Table 6. As can be seen from Table 6, the fitting error was within 3%, and the accuracy could better meet the construction requirements of the master curve.
Table 6.
|G*| main curve model parameter.
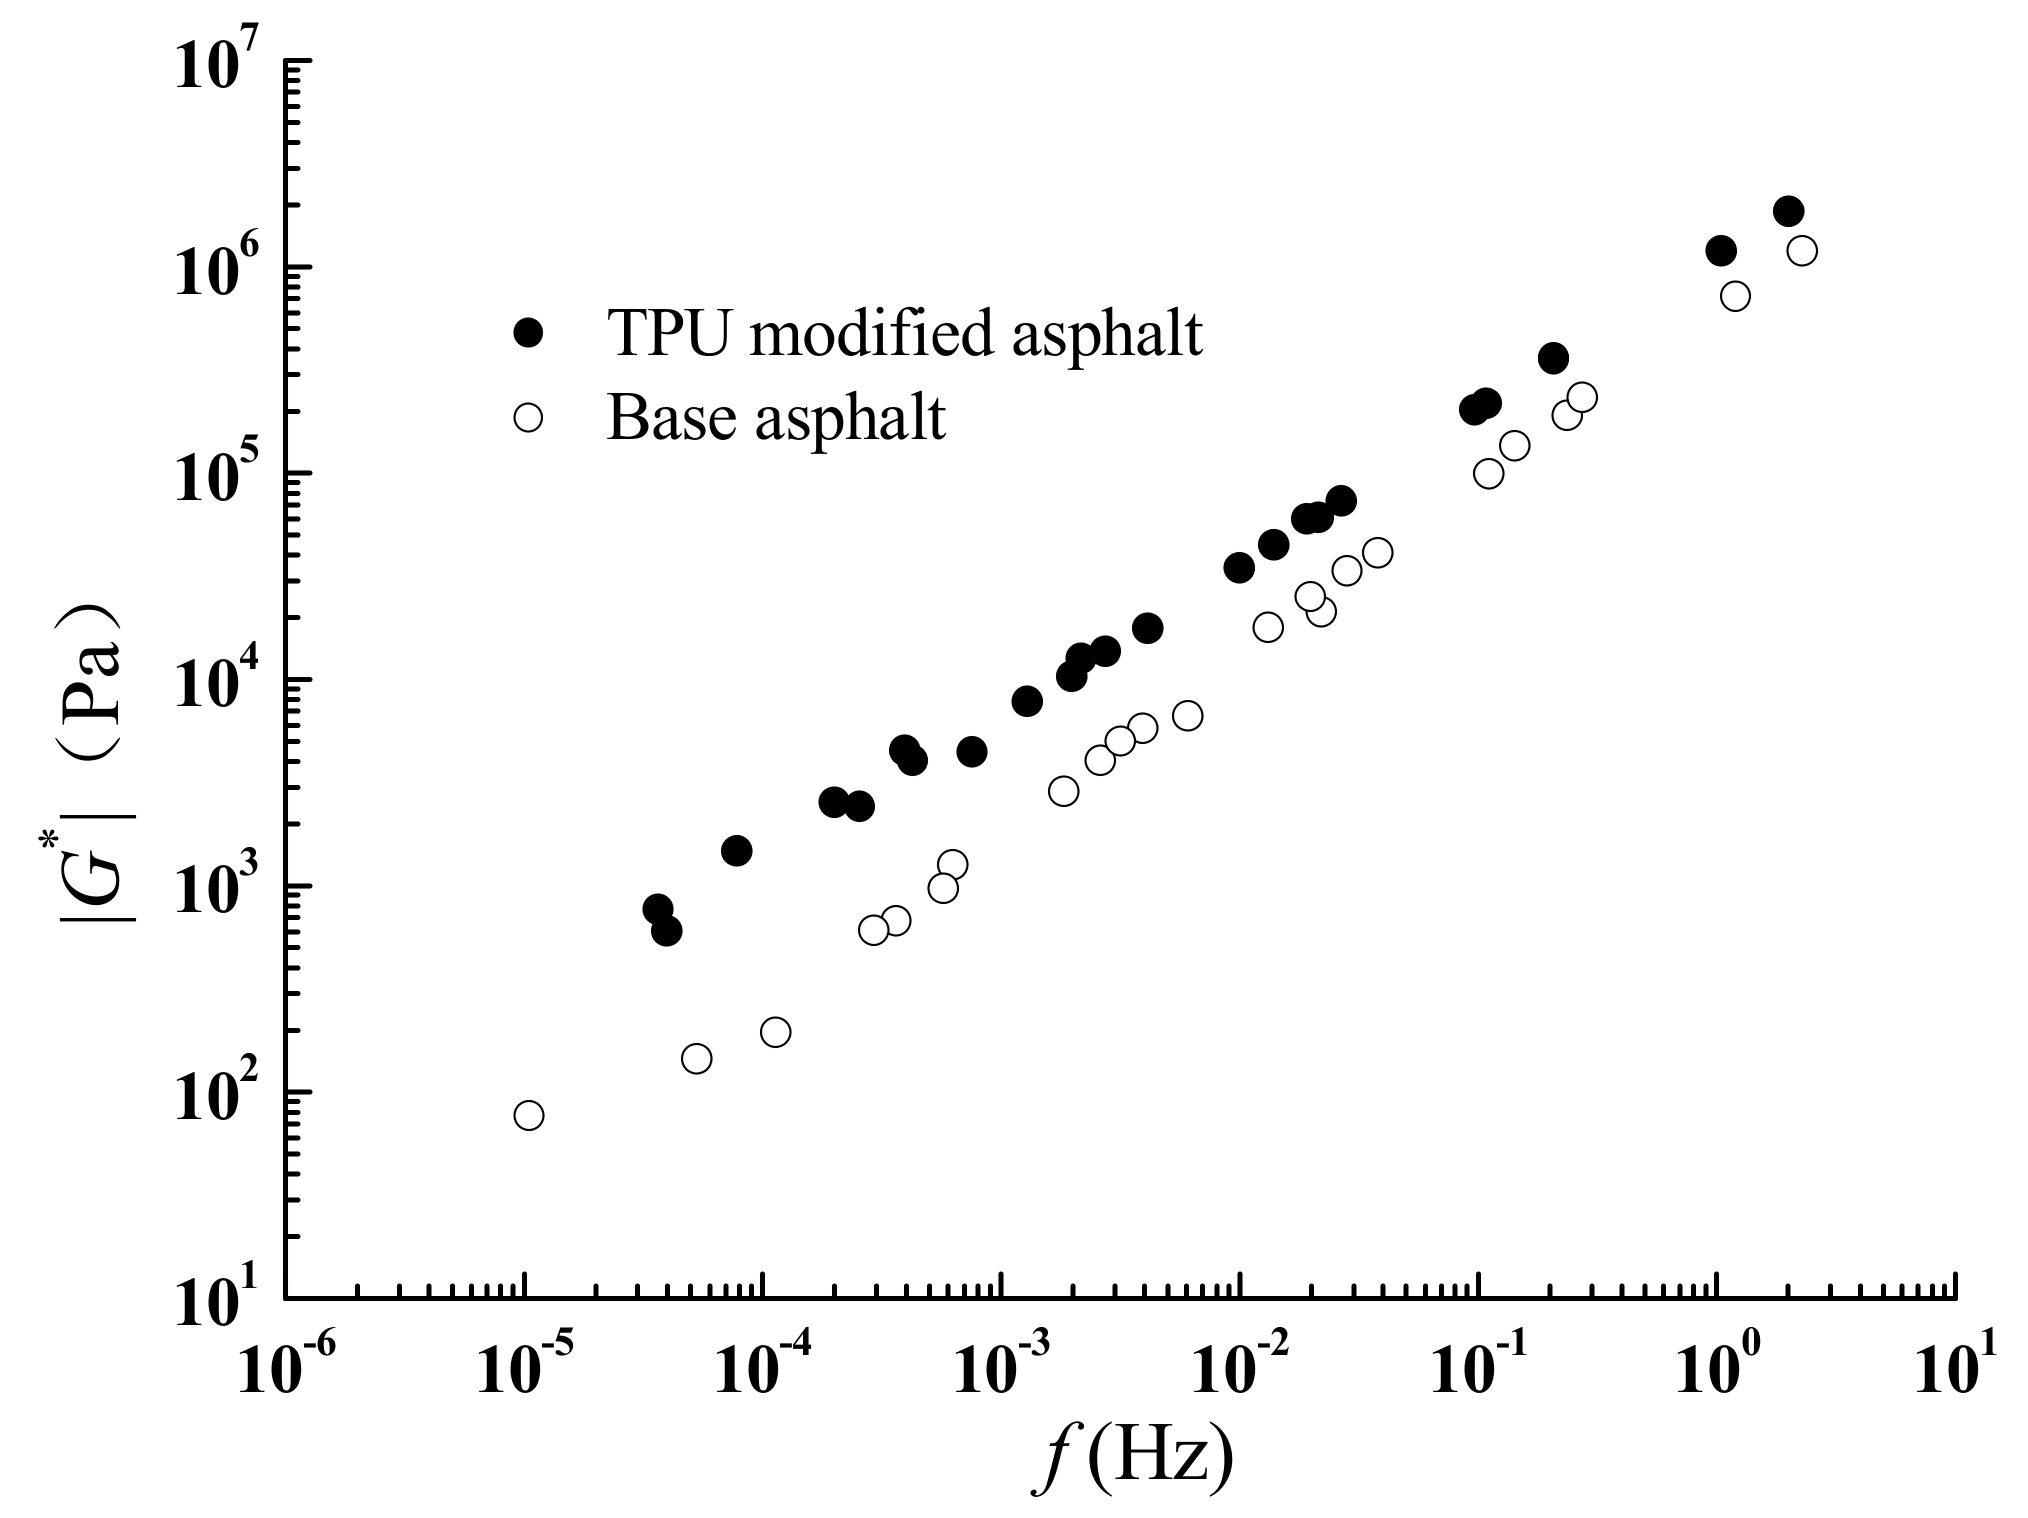
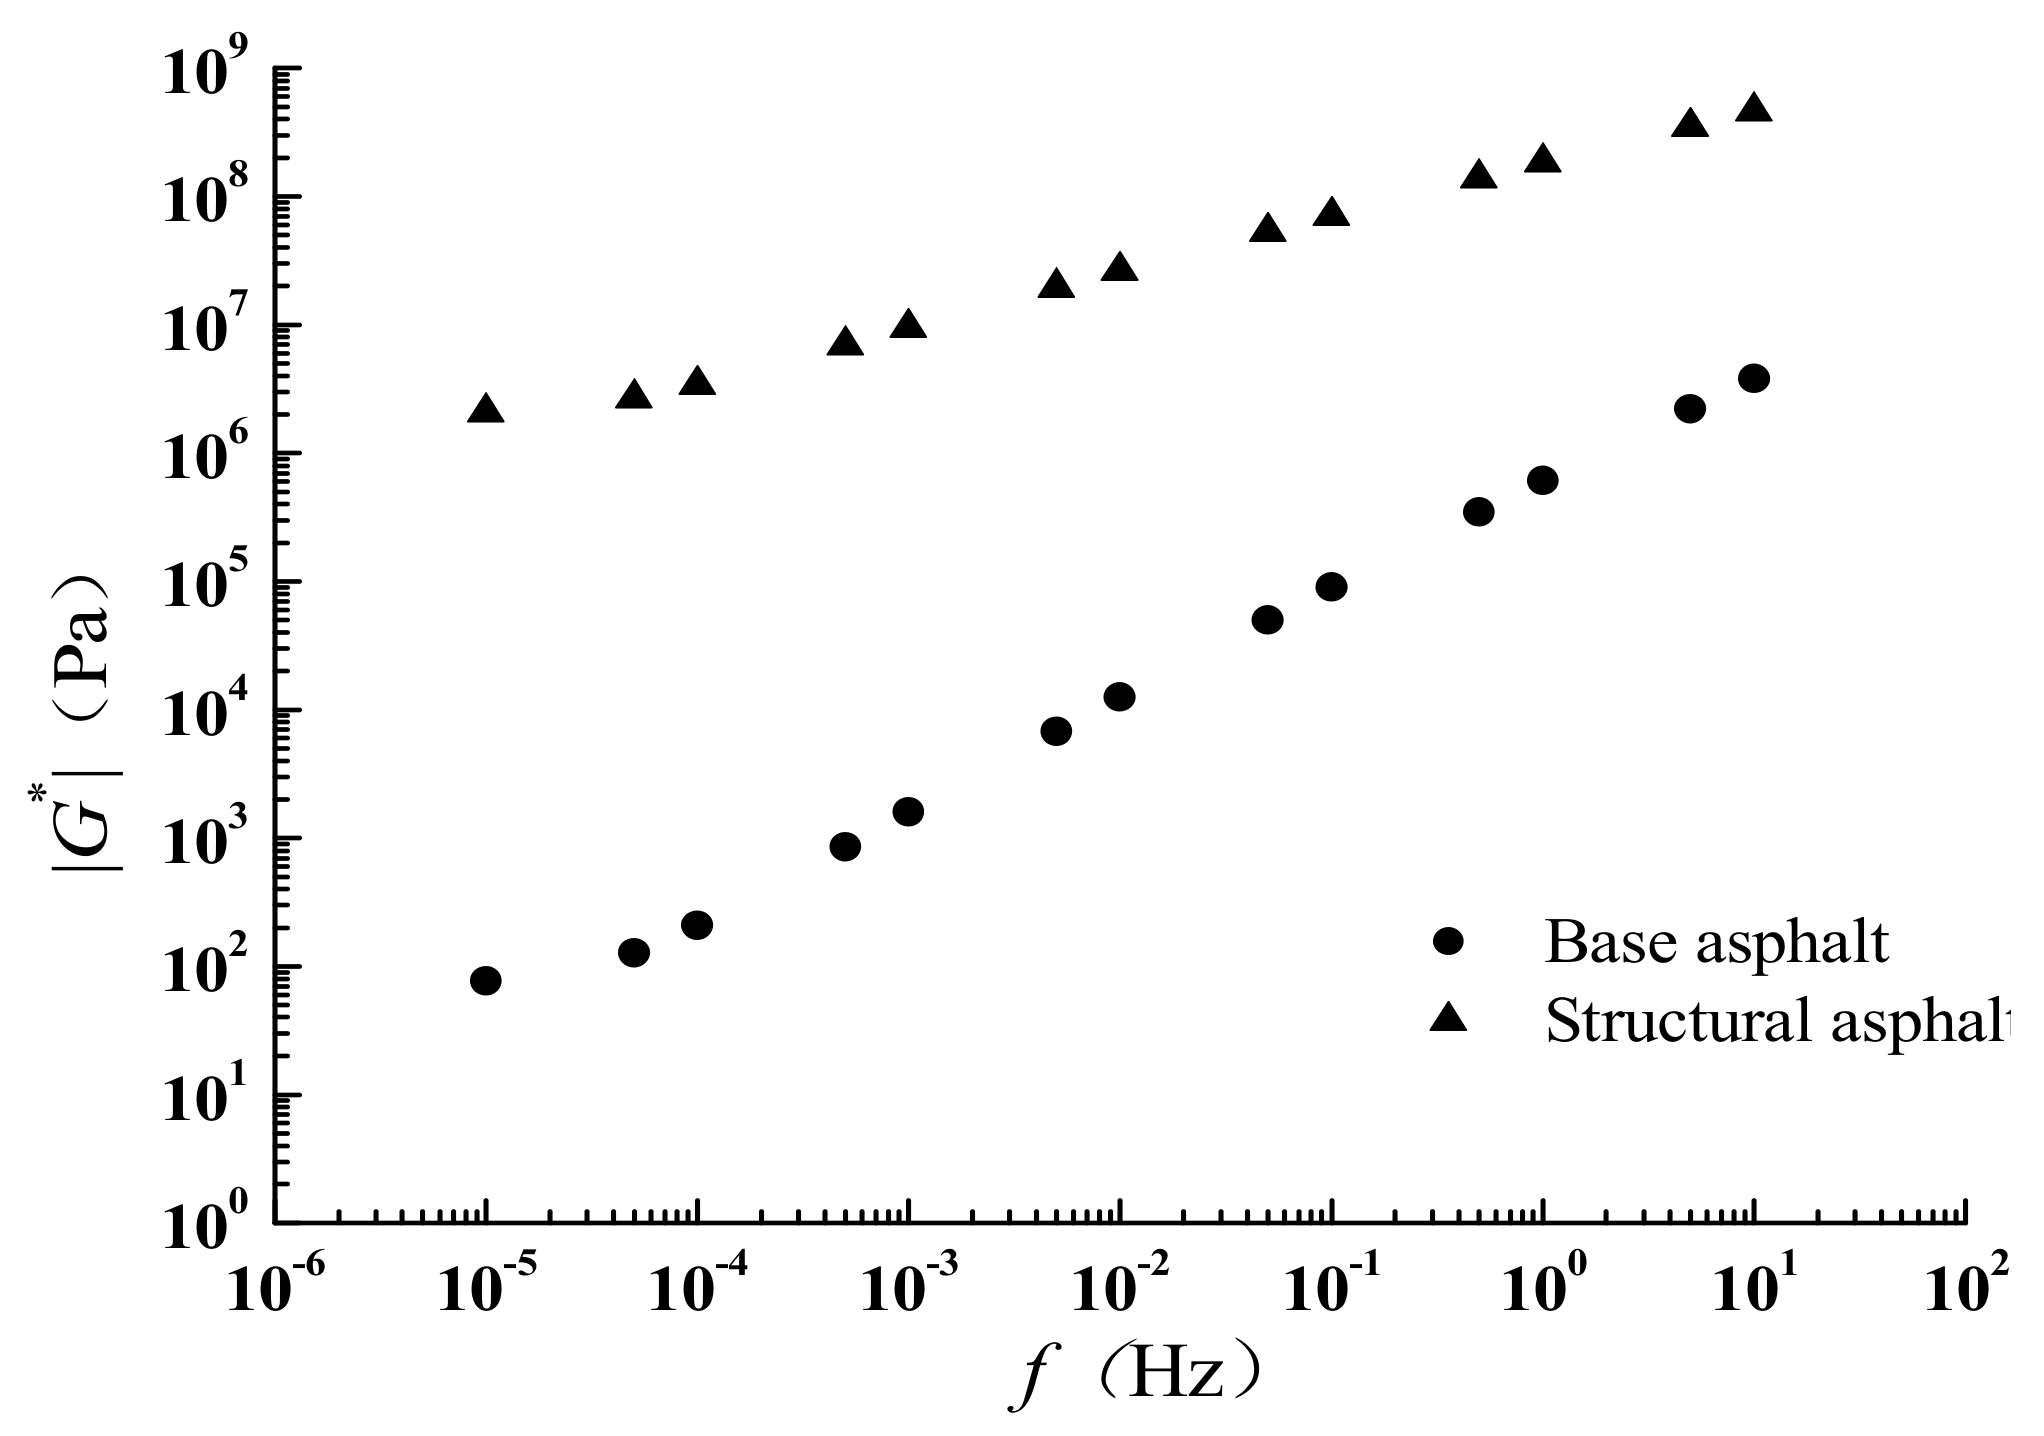
Figure 15 is the |G*| master curve in base asphalt and TPU-modified asphalt. As can be seen, the addition of TPU can change the viscosity of asphalt, and also increase the modulus of asphalt at higher temperatures. In addition, the |G*| master curve comparison results of LTMA- and limestone-modified base asphalt mastic (LMA) can be seen from Figure 16; the |G*| master curve of LTMA was higher than that of LMA as LTMA has a better high-temperature stability and the |G*| master curve of LTMA is higher.
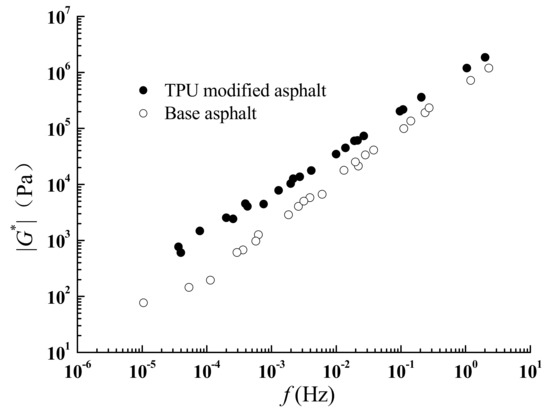
Figure 15.
Comparison of |G*| between TPU-modified asphalt and BA.
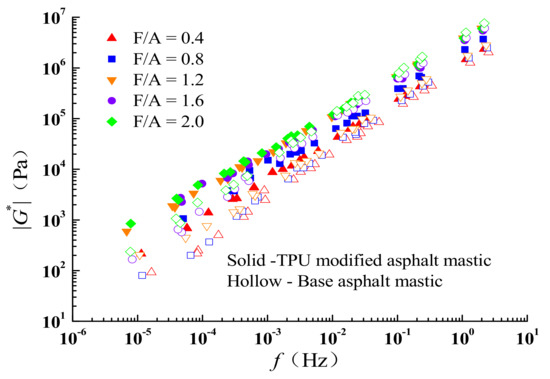
Figure 16.
Comparison of |G*| between LTAM and LAM.
4.3. Model Validation on Base Asphalt
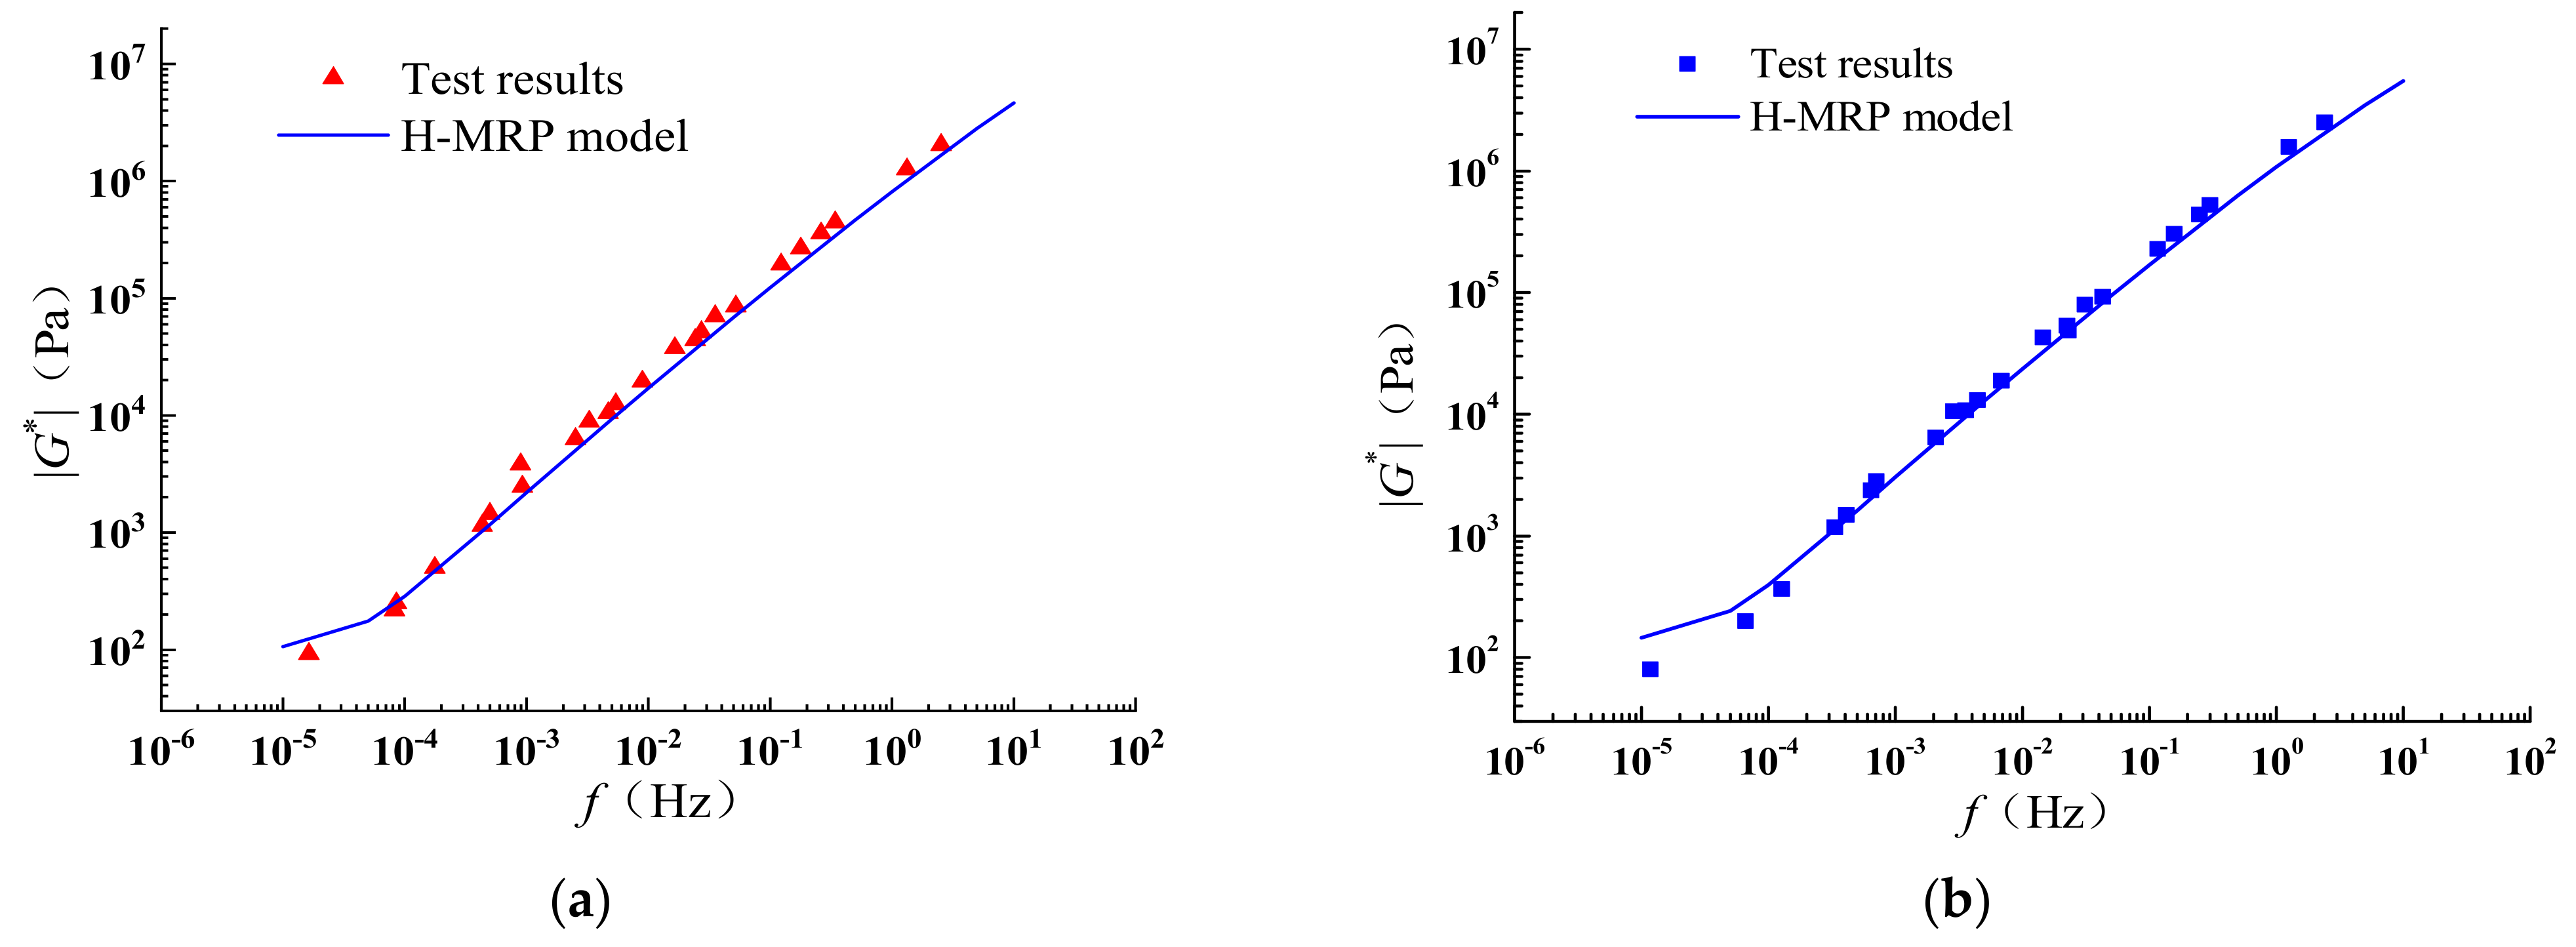
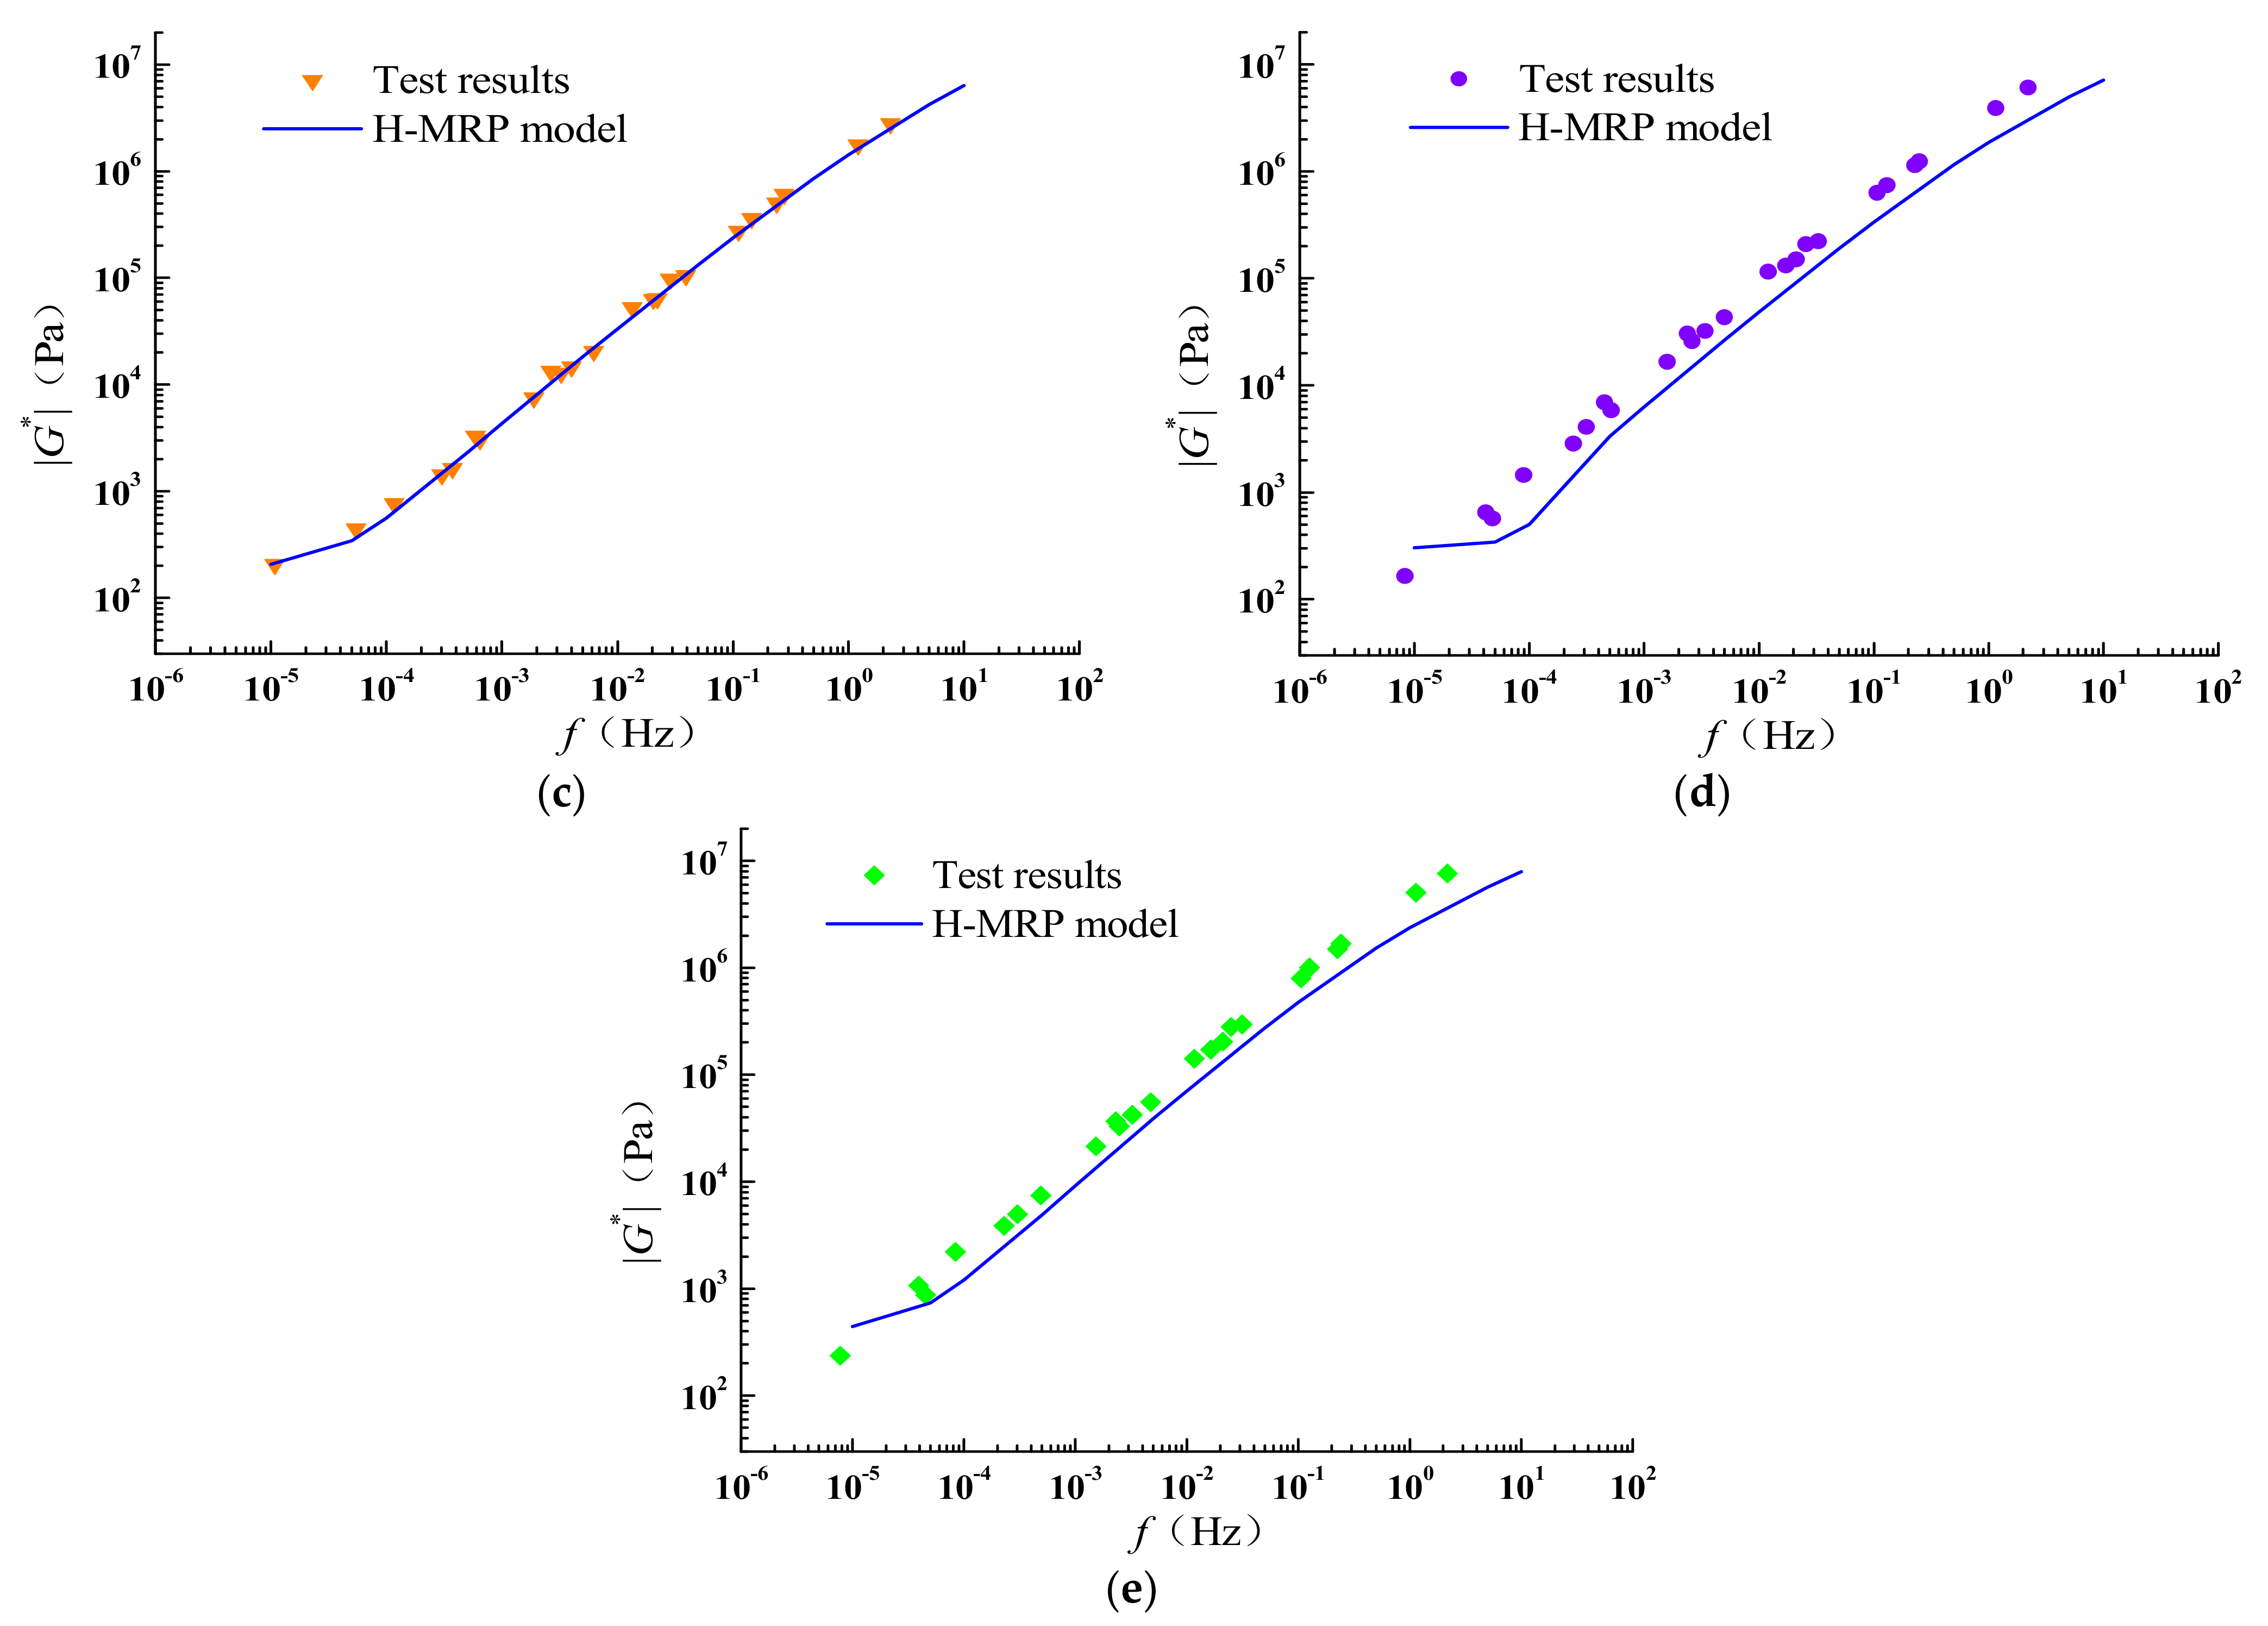
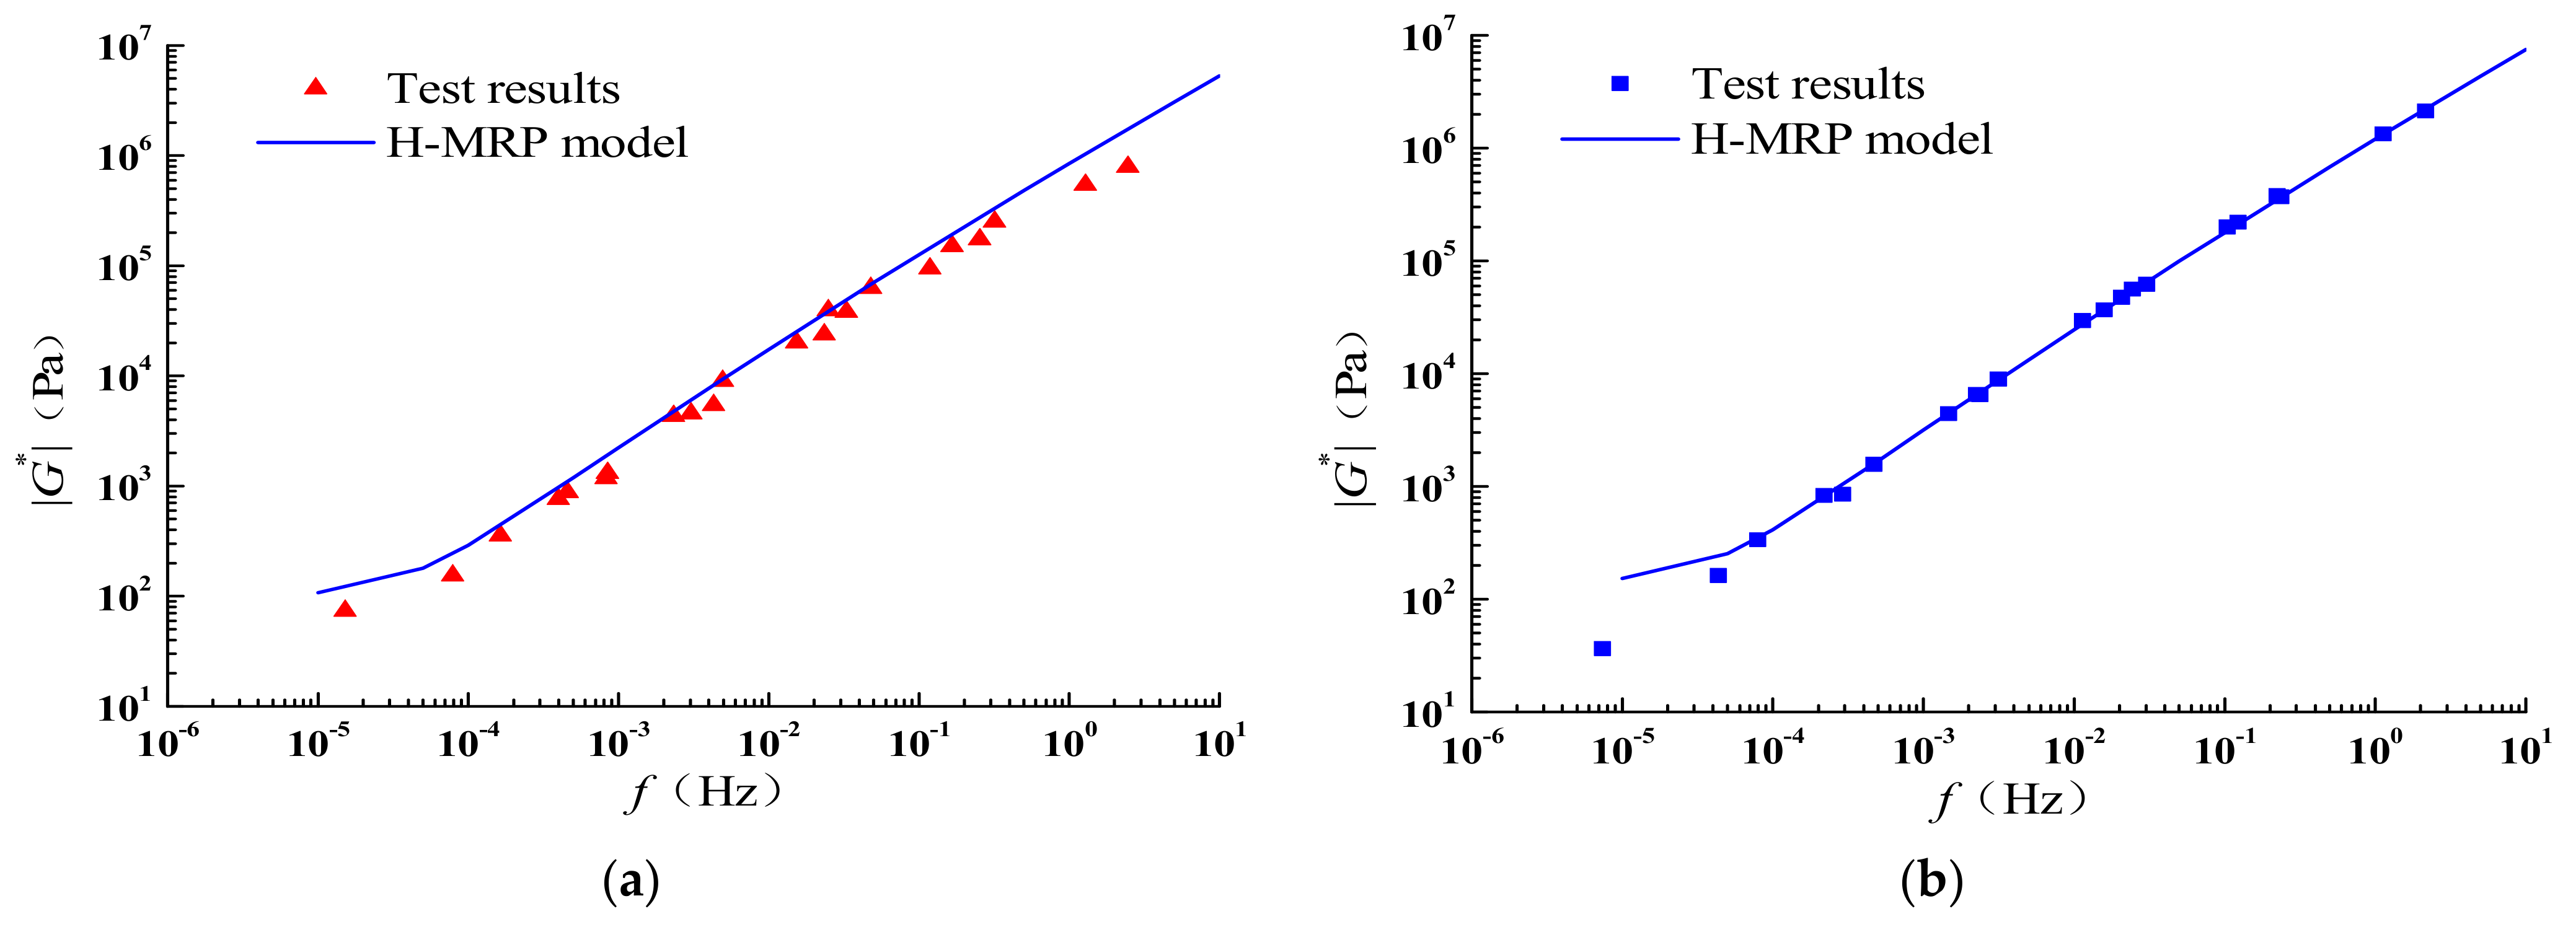
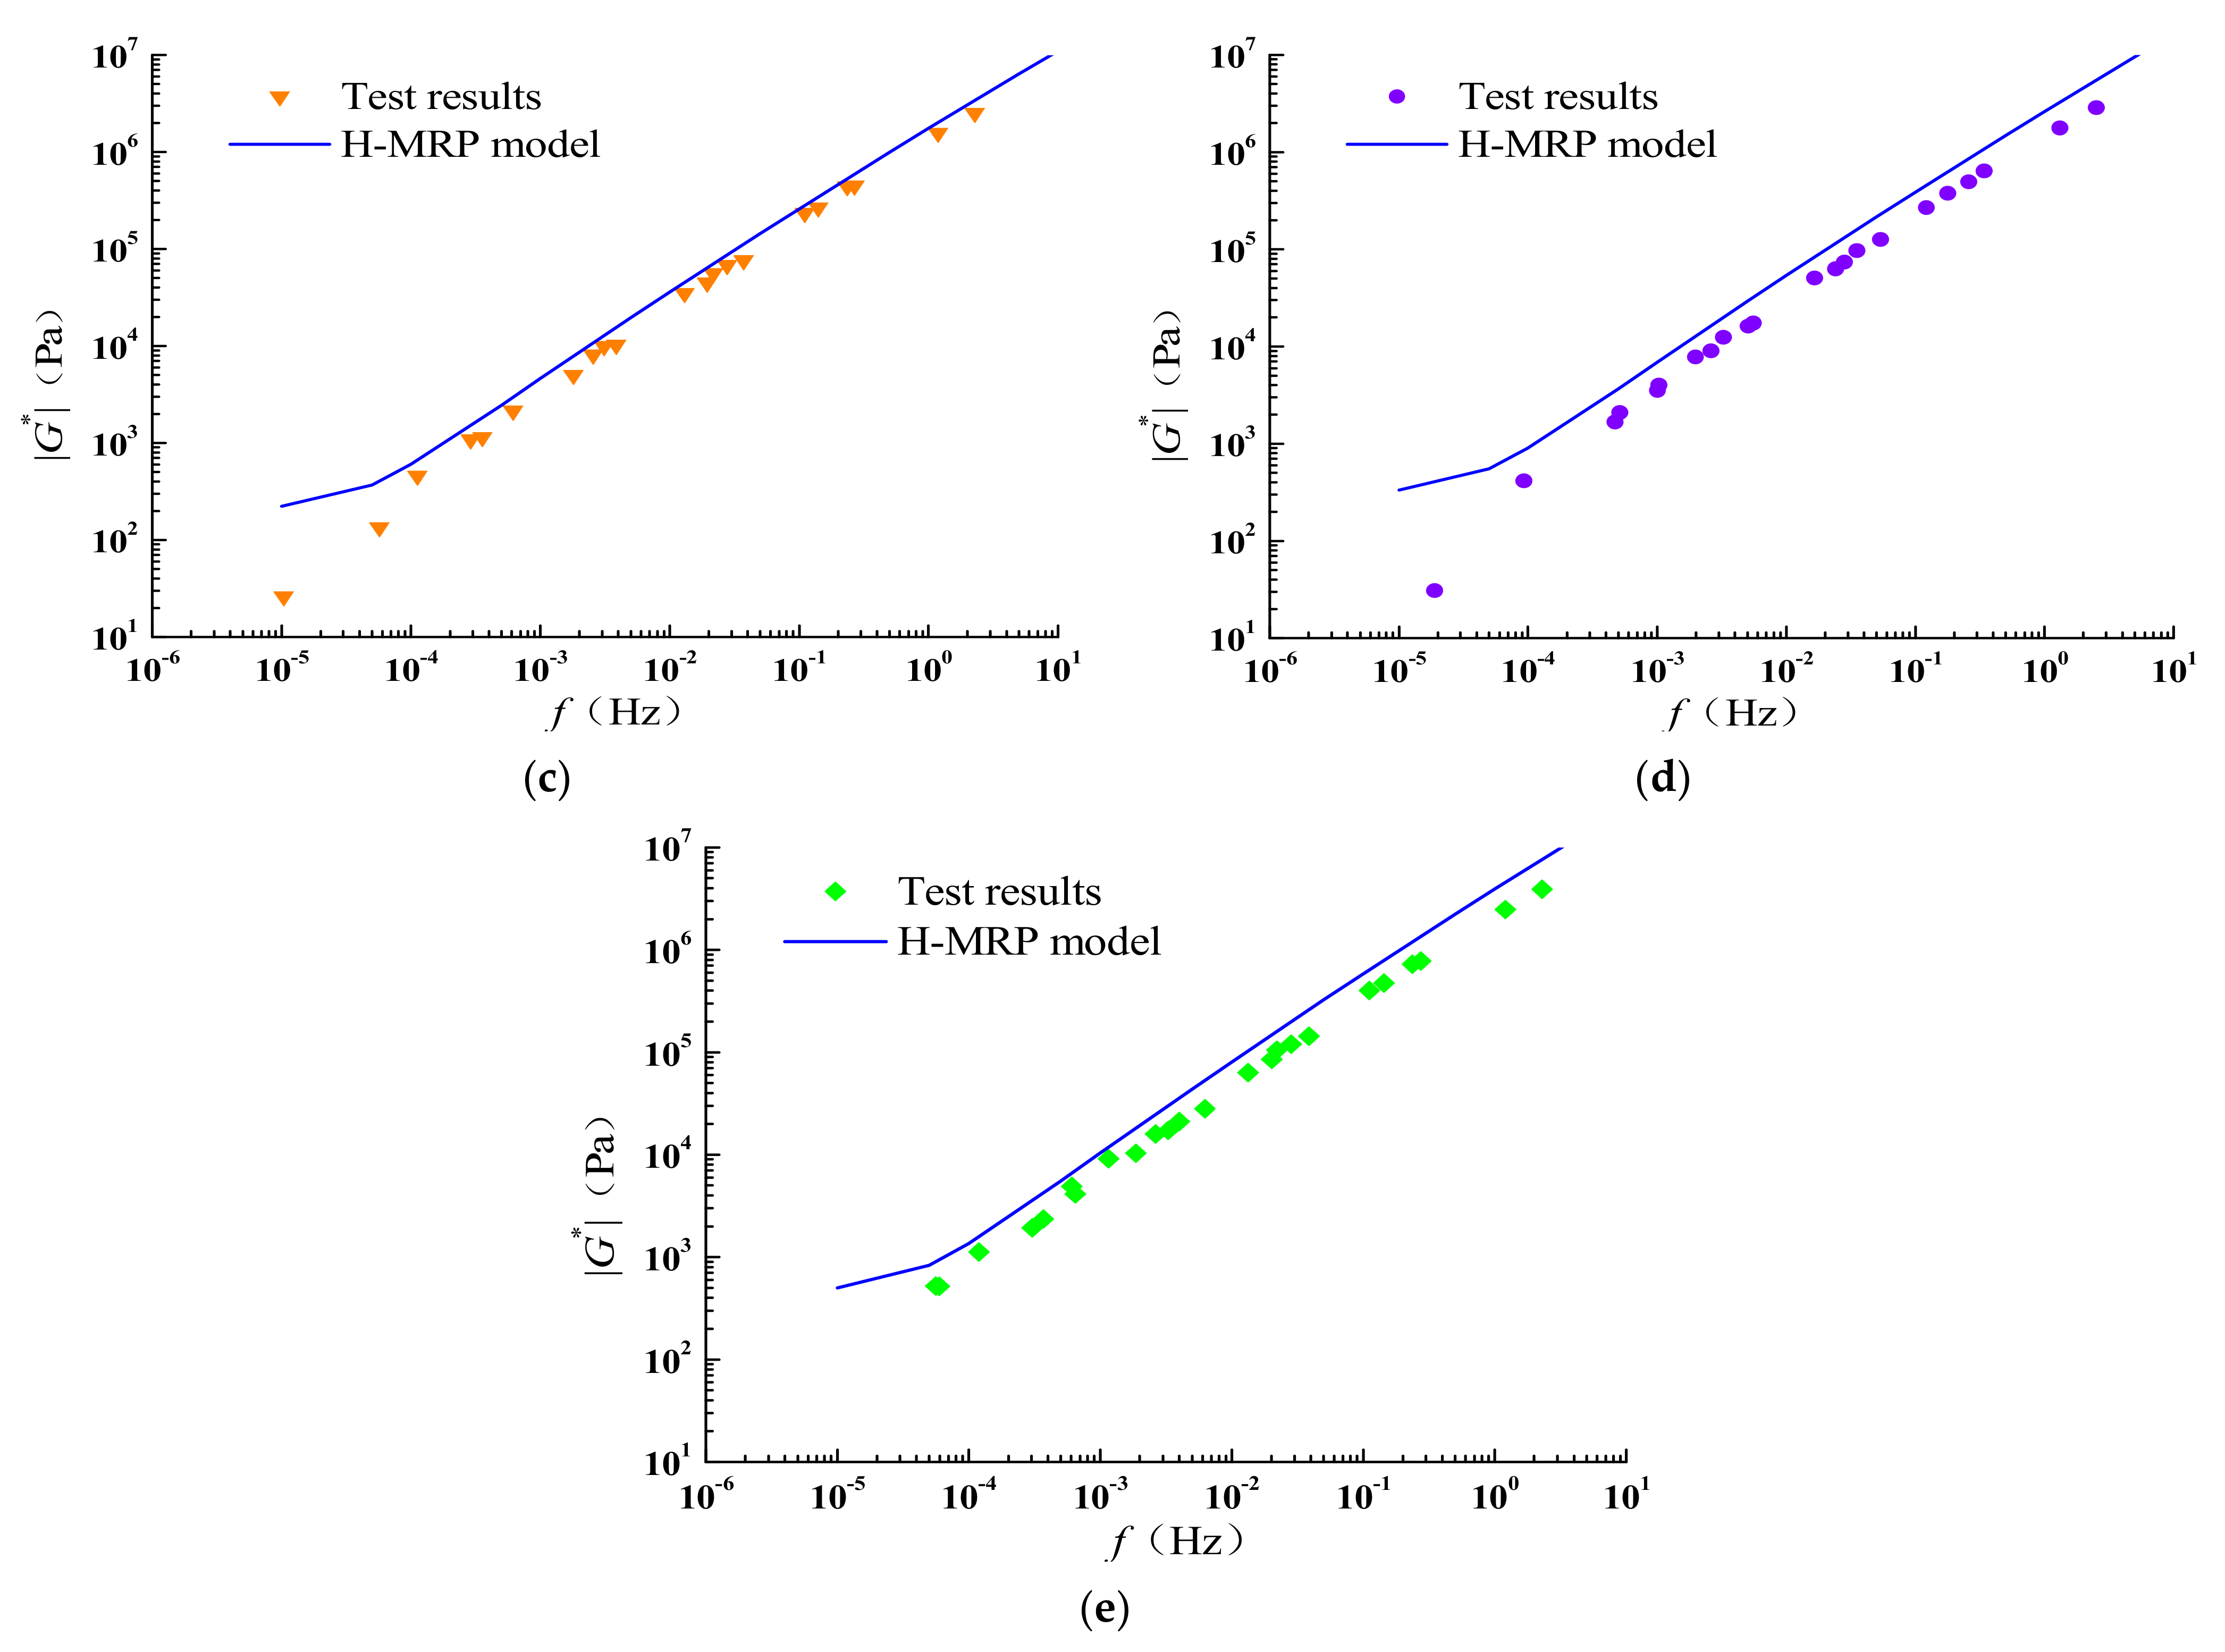
Limestone asphalt mastic (LAM), granite asphalt mastic (GAM), fly ash asphalt mastic (FAM), and coal gangue asphalt mastic (CAM) were used to verify the accuracy of the H-MRP model. The asphalt mastics with different F/A were compared, as shown in Figure 17, Figure 18, Figure 19 and Figure 20.
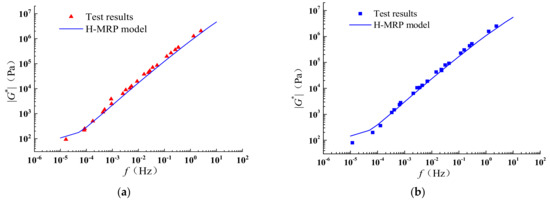

Figure 17.
Comparison of H-MRP model and test results for the LAM. (a) F/A = 0.4. (b) F/A = 0.8. (c) F/A = 1.2. (d) F/A = 1.6. (e) F/A = 2.0.
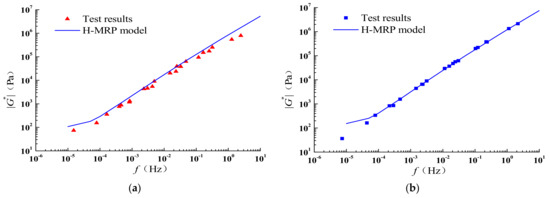
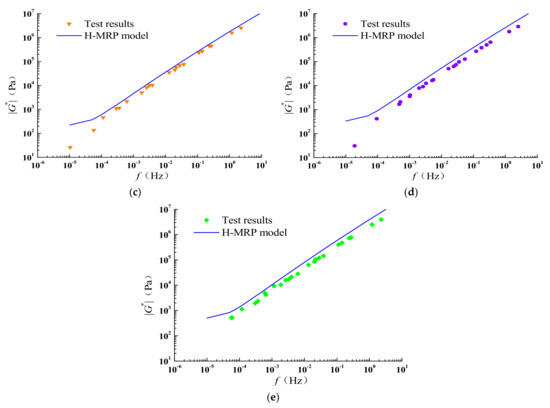
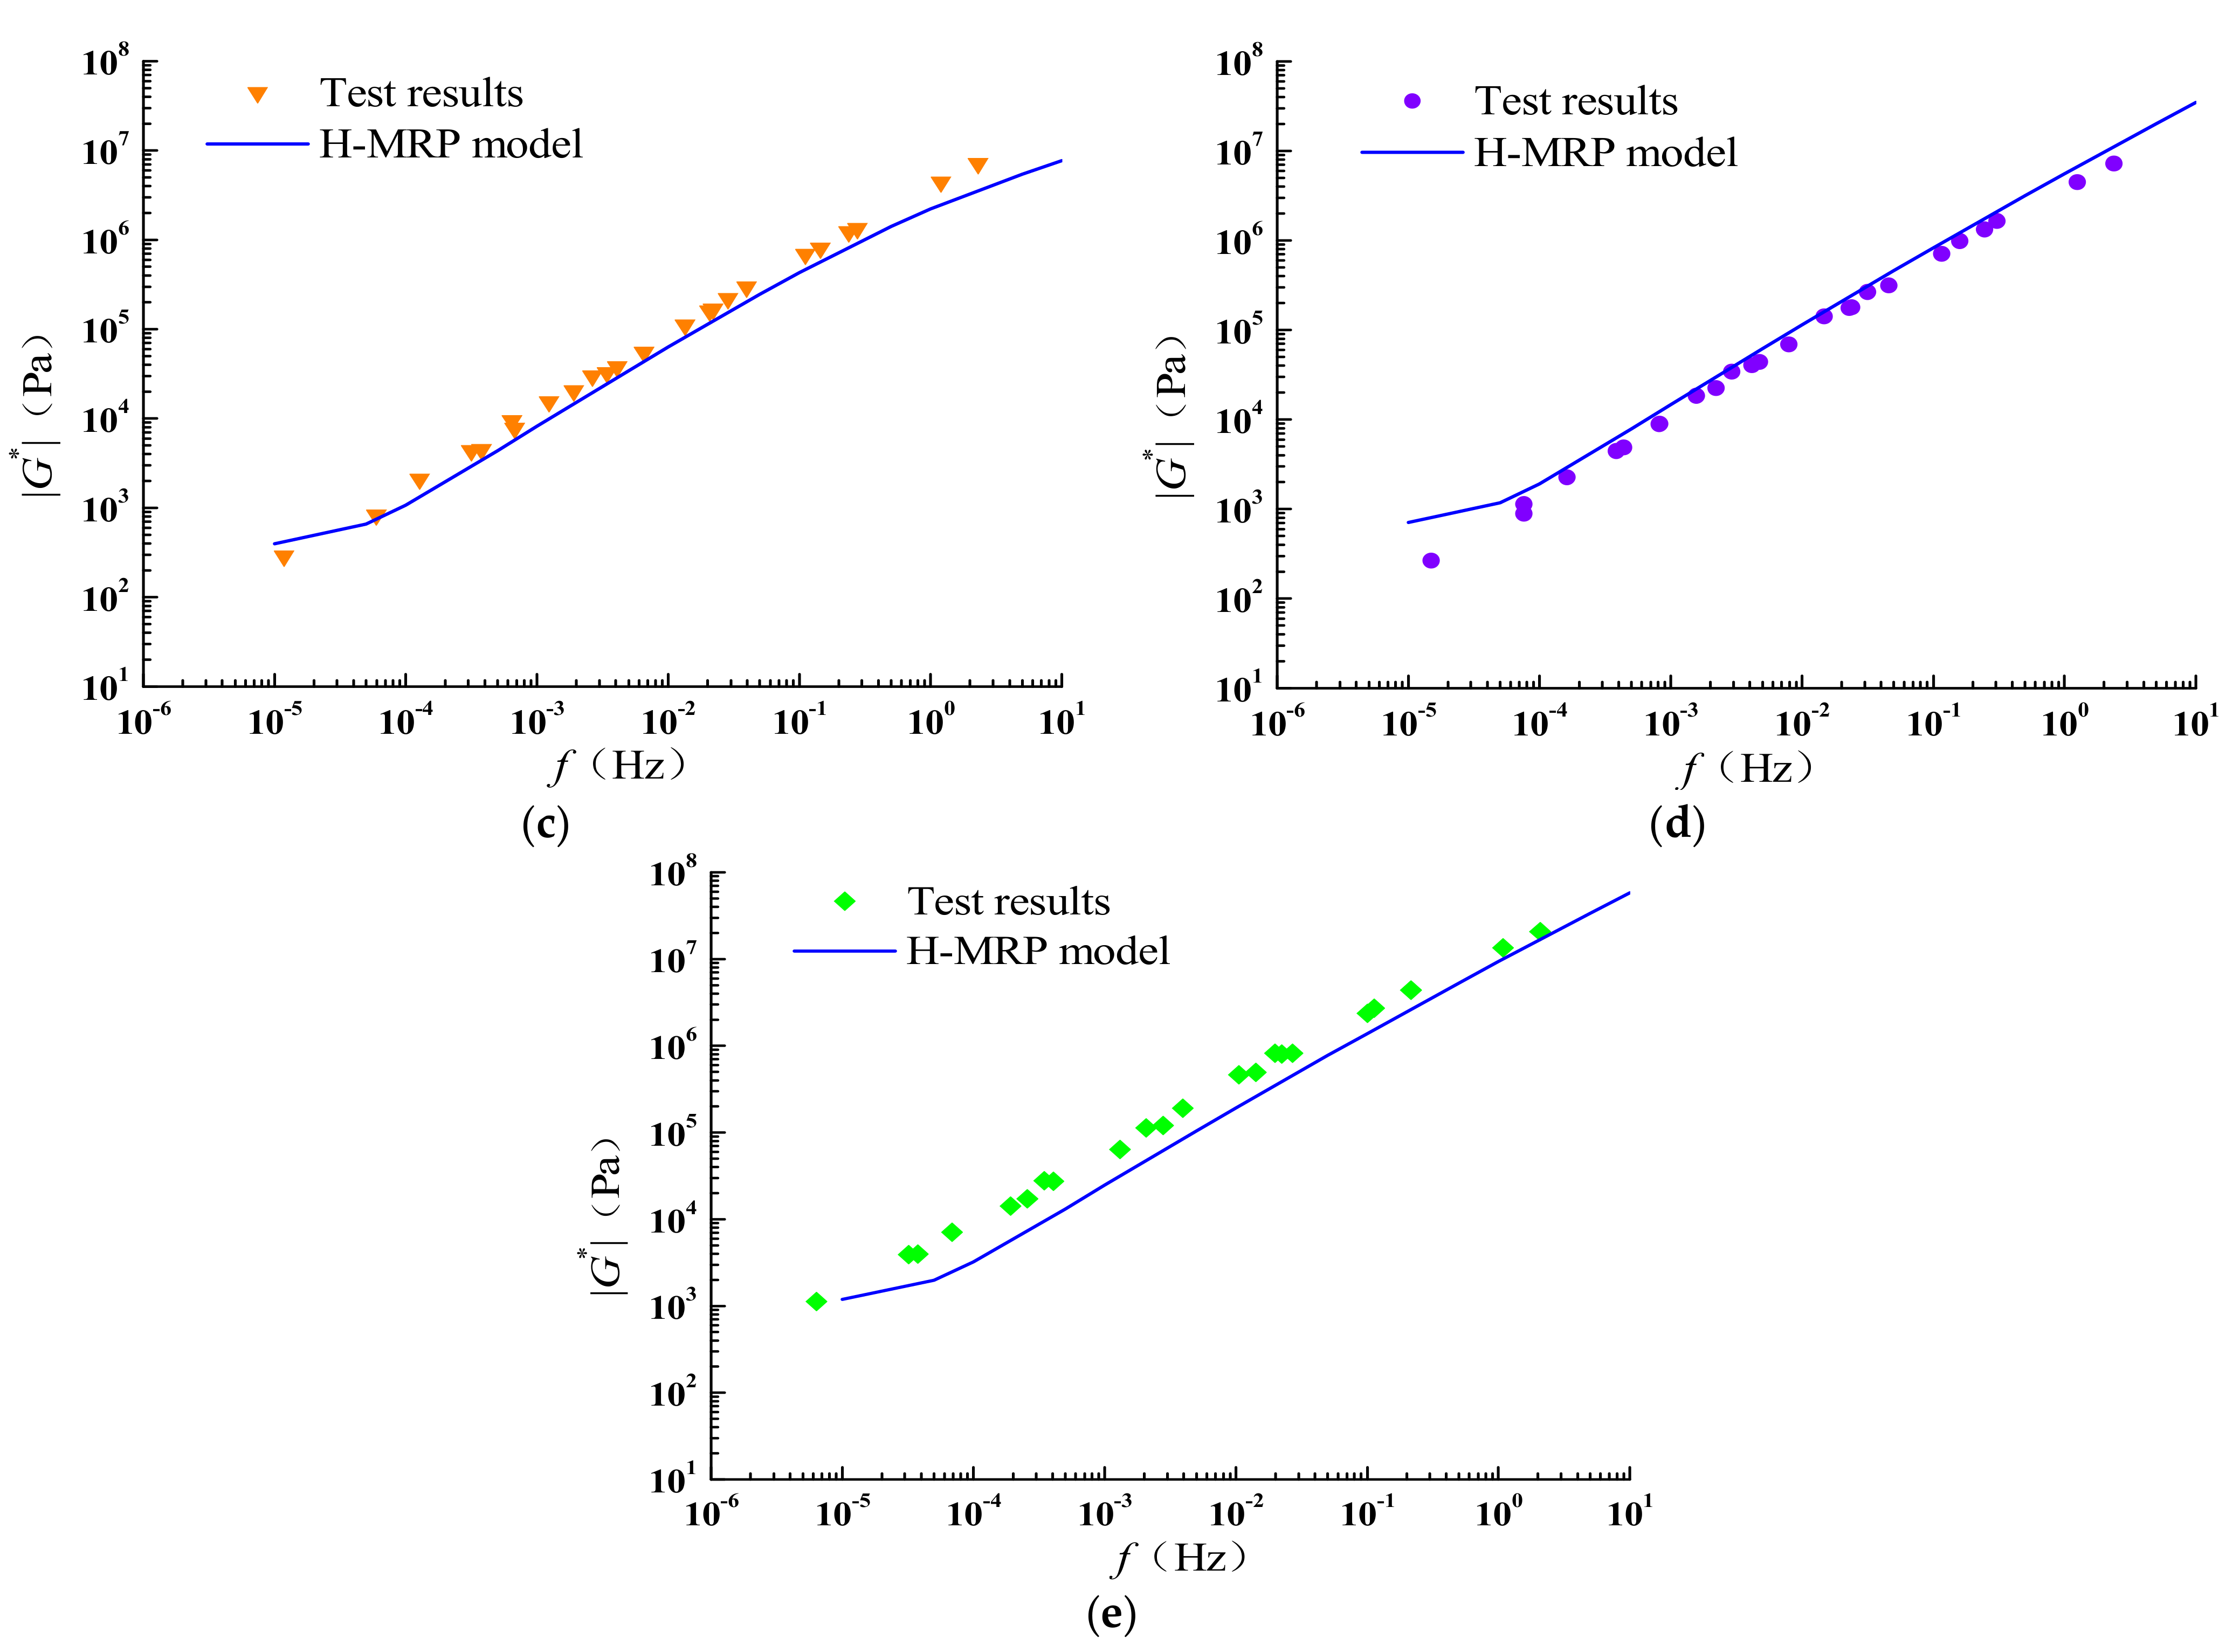
Figure 18.
Comparison of H-MRP model and test results for the GAM. (a) F/A = 0.4. (b) F/A = 0.8. (c) F/A = 1.2. (d) F/A = 1.6. (e) F/A = 2.0.
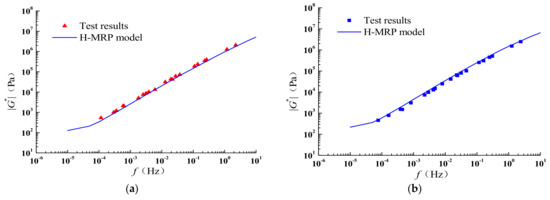
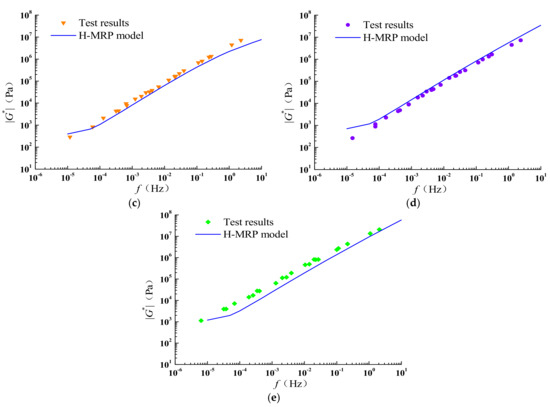
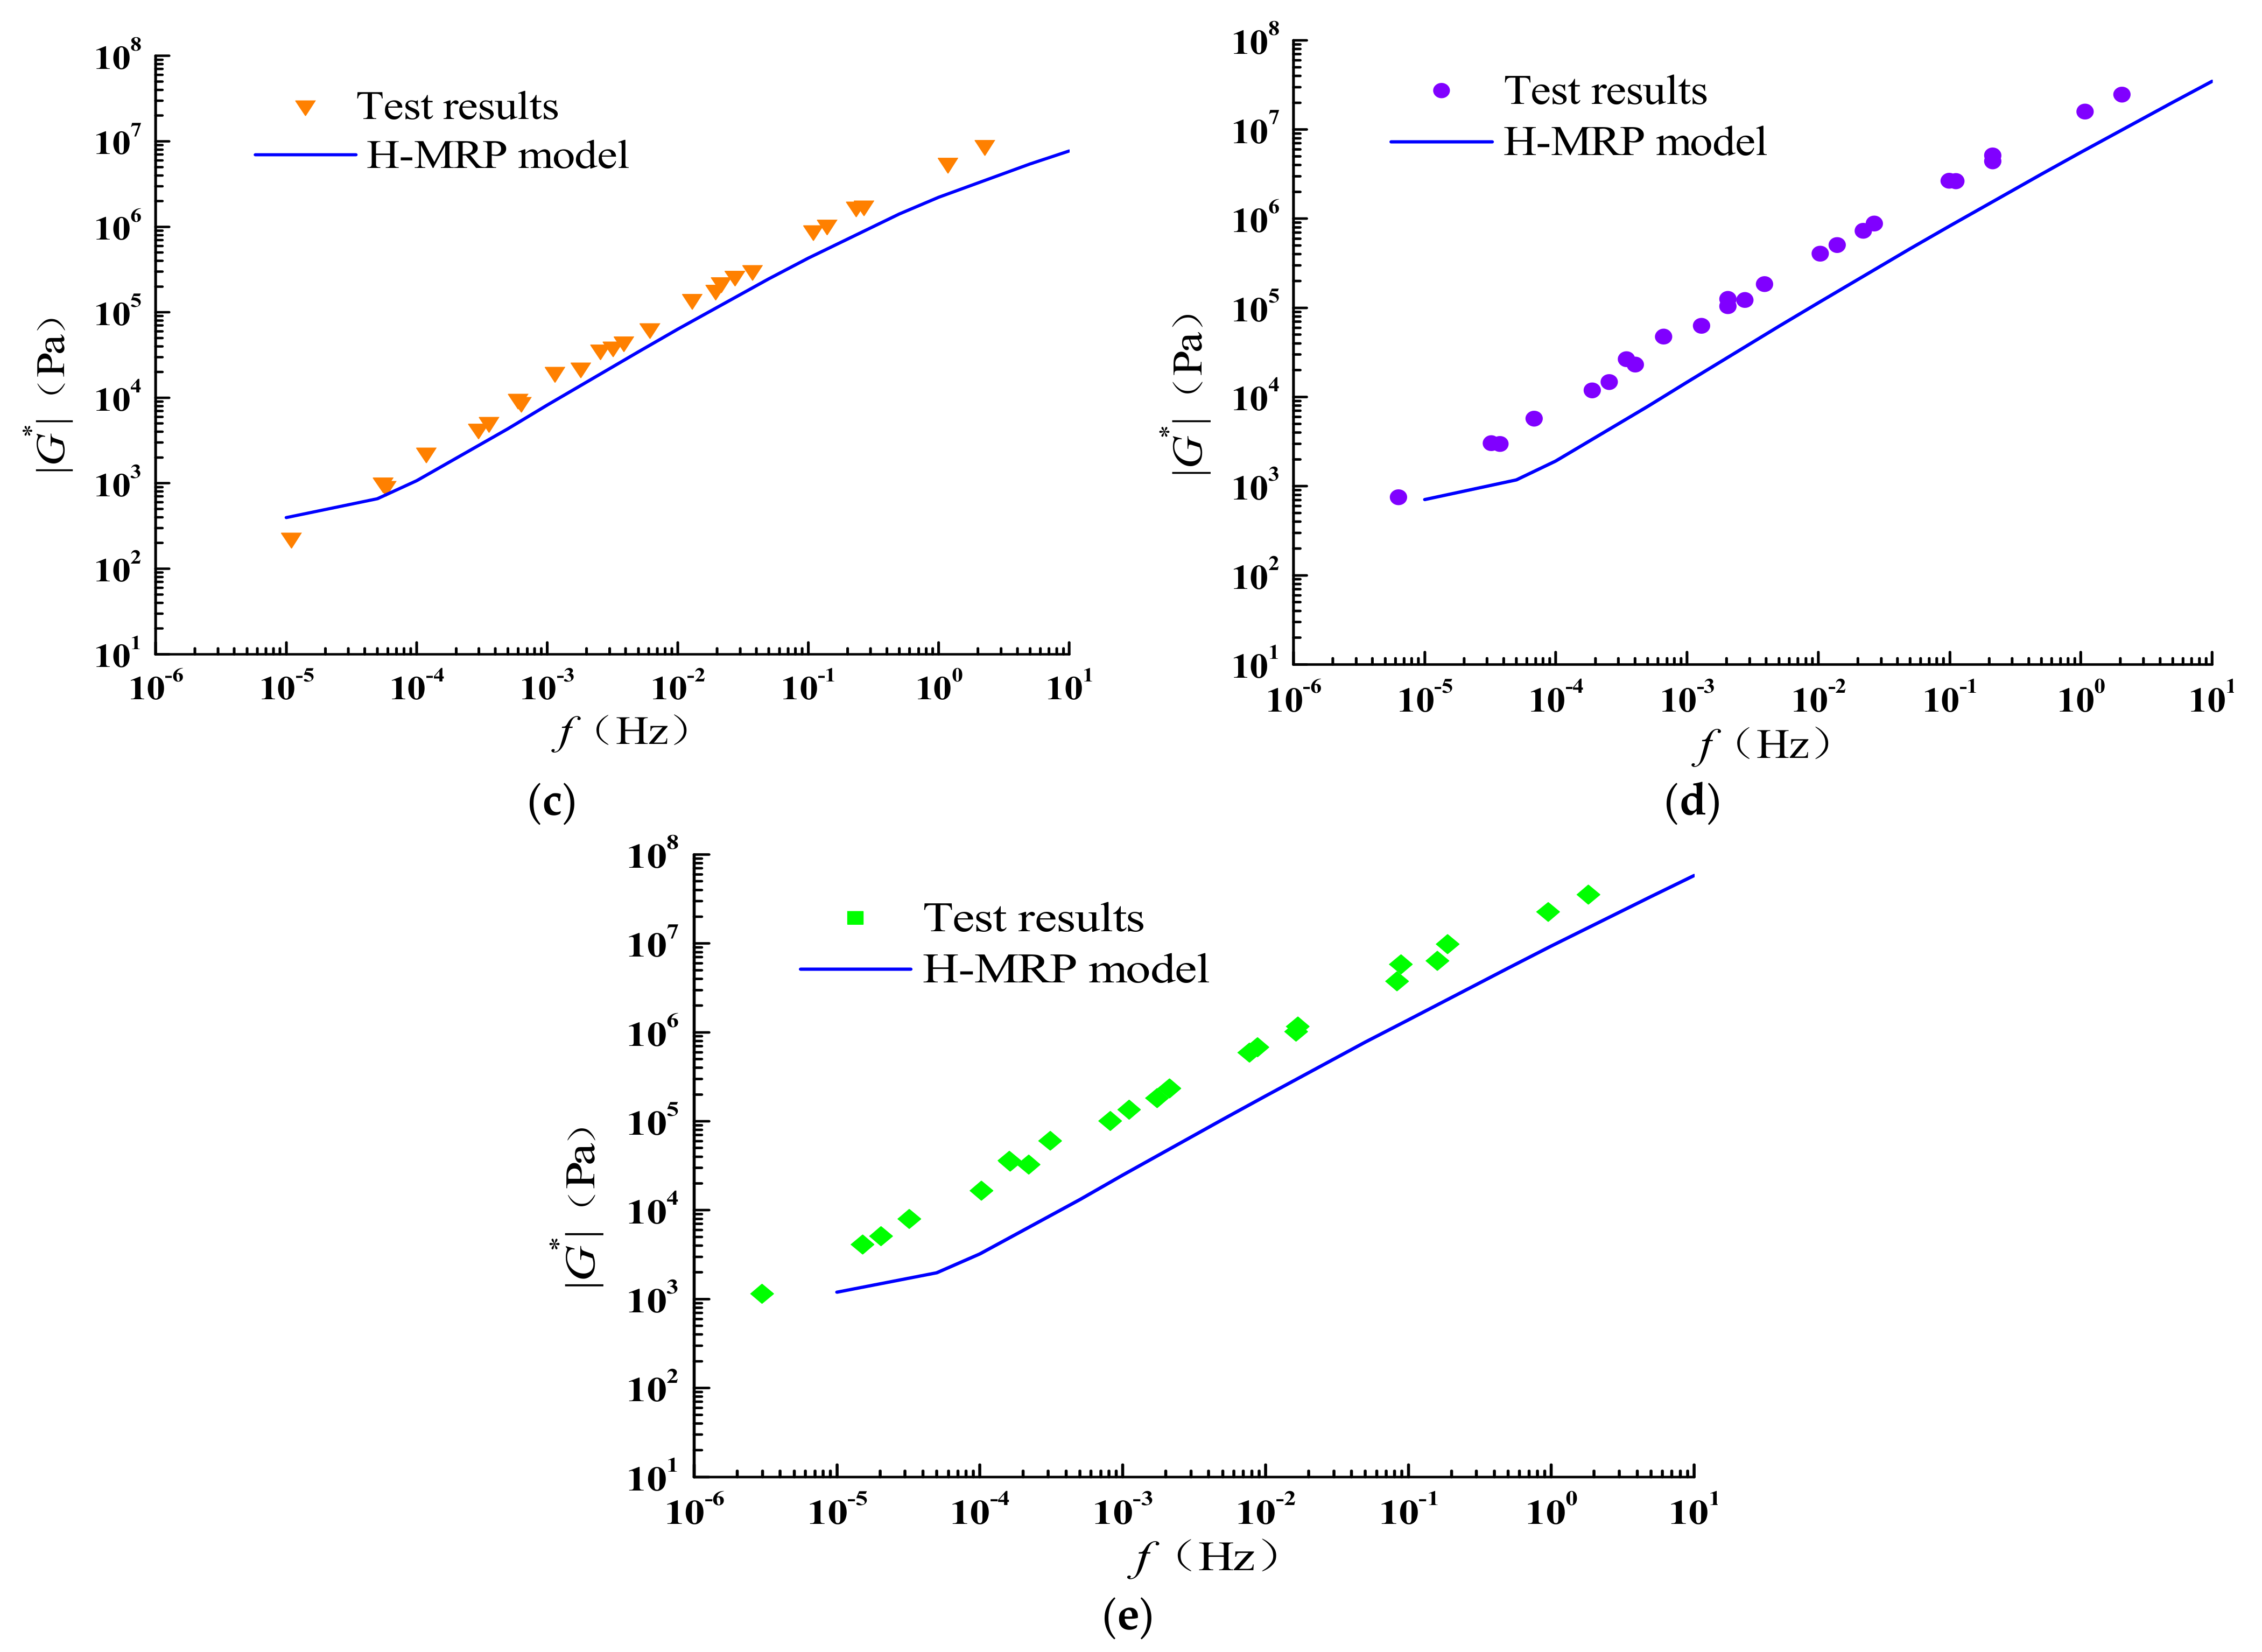
Figure 19.
Comparison of H-MRP model and test results for the FAM. (a) F/A = 0.4. (b) F/A = 0.8. (c) F/A = 1.2. (d) F/A = 1.6. (e) F/A = 2.0.
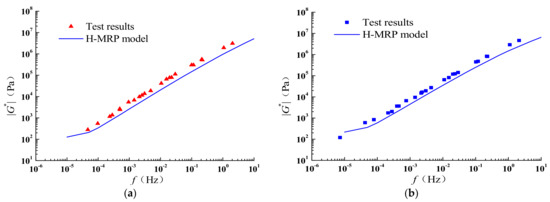
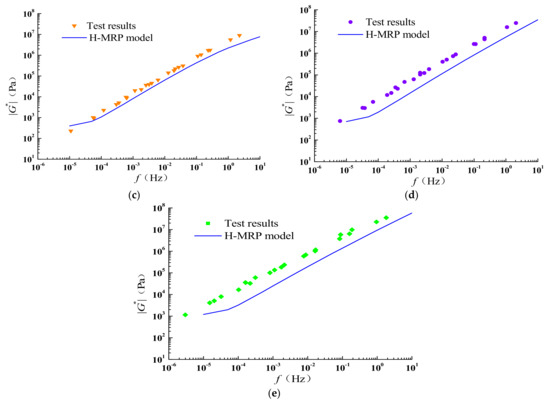
Figure 20.
Comparison of H-MRP model and test results for the CAM. (a) F/A = 0.4. (b) F/A = 0.8. (c) F/A = 1.2. (d) F/A = 1.6. (e) F/A = 2.0.
It can be seen from Figure 17 that the |G*|-predicted value of LAM is in good agreement with the test results when F/A = 0.4, 0.8 and 1.2. The model value is significantly lower than the test results, which, due to the H-MRP model, assumes that the mineral powder is evenly dispersed in the asphalt mastic, and does not consider the contact between the mineral powder.
Figure 18 shows that when the F/A = 0.4 and 0.8, the |G*|-predicted value of GAM is close to the test results. Since the H-MRP model does not consider the influence of the interaction between mineral powder and asphalt, and the interaction between filler and asphalt is strong, the predicted value is higher than the test result when the F/A = 1.2, 1.6, and 2.0.
In Figure 19, it is obvious that the |G*|-predicted value of FAM is nearly consistent with the test value, except the F/A = 2.0. The reason that the predicted value is lower than the test value is the same as that of LAM.
From Figure 20 can be seen that the predicted |G*| value of CAM is lower than the test results when the F/A ranges from 0.4 to 2.0, which is the same as LAM.
When F/A ranged from 0.4 to 1.2, the predicted values of the other three asphalt mastic were lower than the experimental values, except for the predicted values of |G*| for GAM, which were higher than the experimental values, showing that the predicted results of the H-MRP model were influenced by the type of mineral powder. As a typical rigid, particle-filled, viscoelastic matrix composite, the mechanical properties of asphalt mastic are not only affected by asphalt but also by the volume fraction of mineral powder and the interaction between asphalt and mineral powder, which mainly shows that the dynamic shear modulus of asphalt mastic changes with the increase in the filler volume fraction and the change in the thickness of the asphalt layer that is adsorbed on the surface of the filler, so the interaction between asphalt and mineral powder needs to be considered to improve the H-MRP model.
4.4. Improvement of H-MRP Model
The thickness of the adsorbed asphalt layer on the surface of mineral powder in asphalt mastic is closely related to the volume fraction of mineral powder and the interaction between asphalt and mineral powder. When the volume fraction of the filler is small, the thickness of the adsorbed asphalt layer is larger, and as the volume fraction of the filler increases, the thickness of the adsorbed asphalt film on the surface of the filler becomes smaller and smaller. The stronger the interaction ability between asphalt and filler, the greater the thickness of the asphalt layer that is adsorbed on the surface of the filler. Therefore, the interaction between asphalt and mineral powder needs to be considered in the prediction model, and the interaction between different types of mineral powder and asphalt needs to be analyzed.
4.4.1. Model Improvement Based on Palierne C
The interaction coefficient of asphalt and mineral powder represents the relative content of structural asphalt that is adsorbed on the surface of mineral powder: the stronger the interaction ability between asphalt and mineral powder, the larger the relative content of structural asphalt. According to the analysis of the interaction C index, it is known that, when considering dissipated energy, the volume fraction φ of mineral powder can be replaced by φFC, where C represents the physicochemical interaction between mineral powder and asphalt, φF represents the volume fraction calculated from the mass density of mineral powder, and φFC contains the actual volume fraction of mineral powder and the interface between mineral powder and asphalt. Therefore, when the H-MRP model is used to predict the dynamic shear modulus of asphalt mastic, φFC is used instead of the volume fraction φ of mineral powder to consider the effect of the interaction between asphalt and mineral powder.
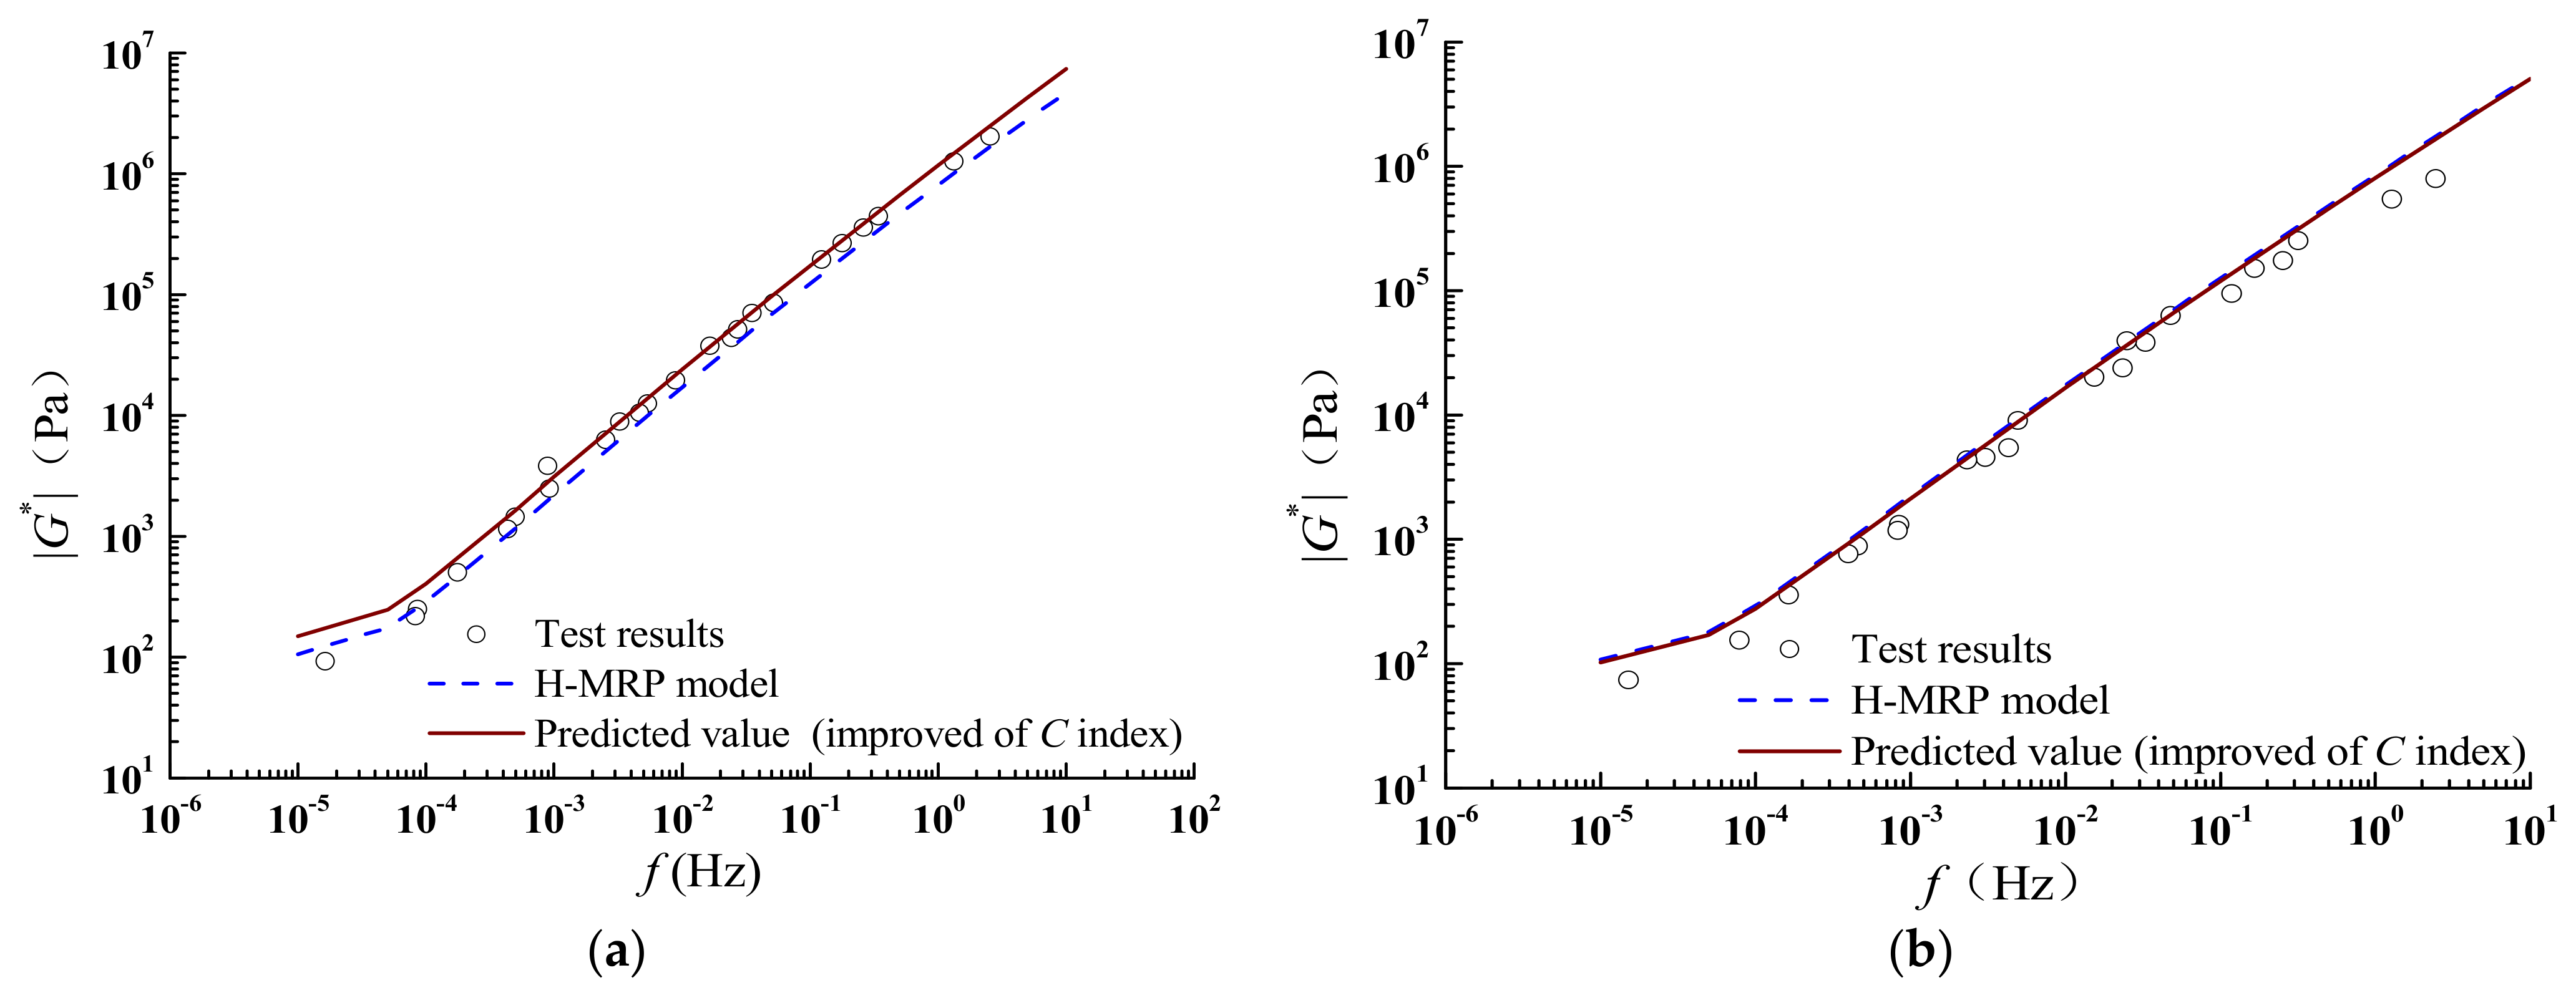
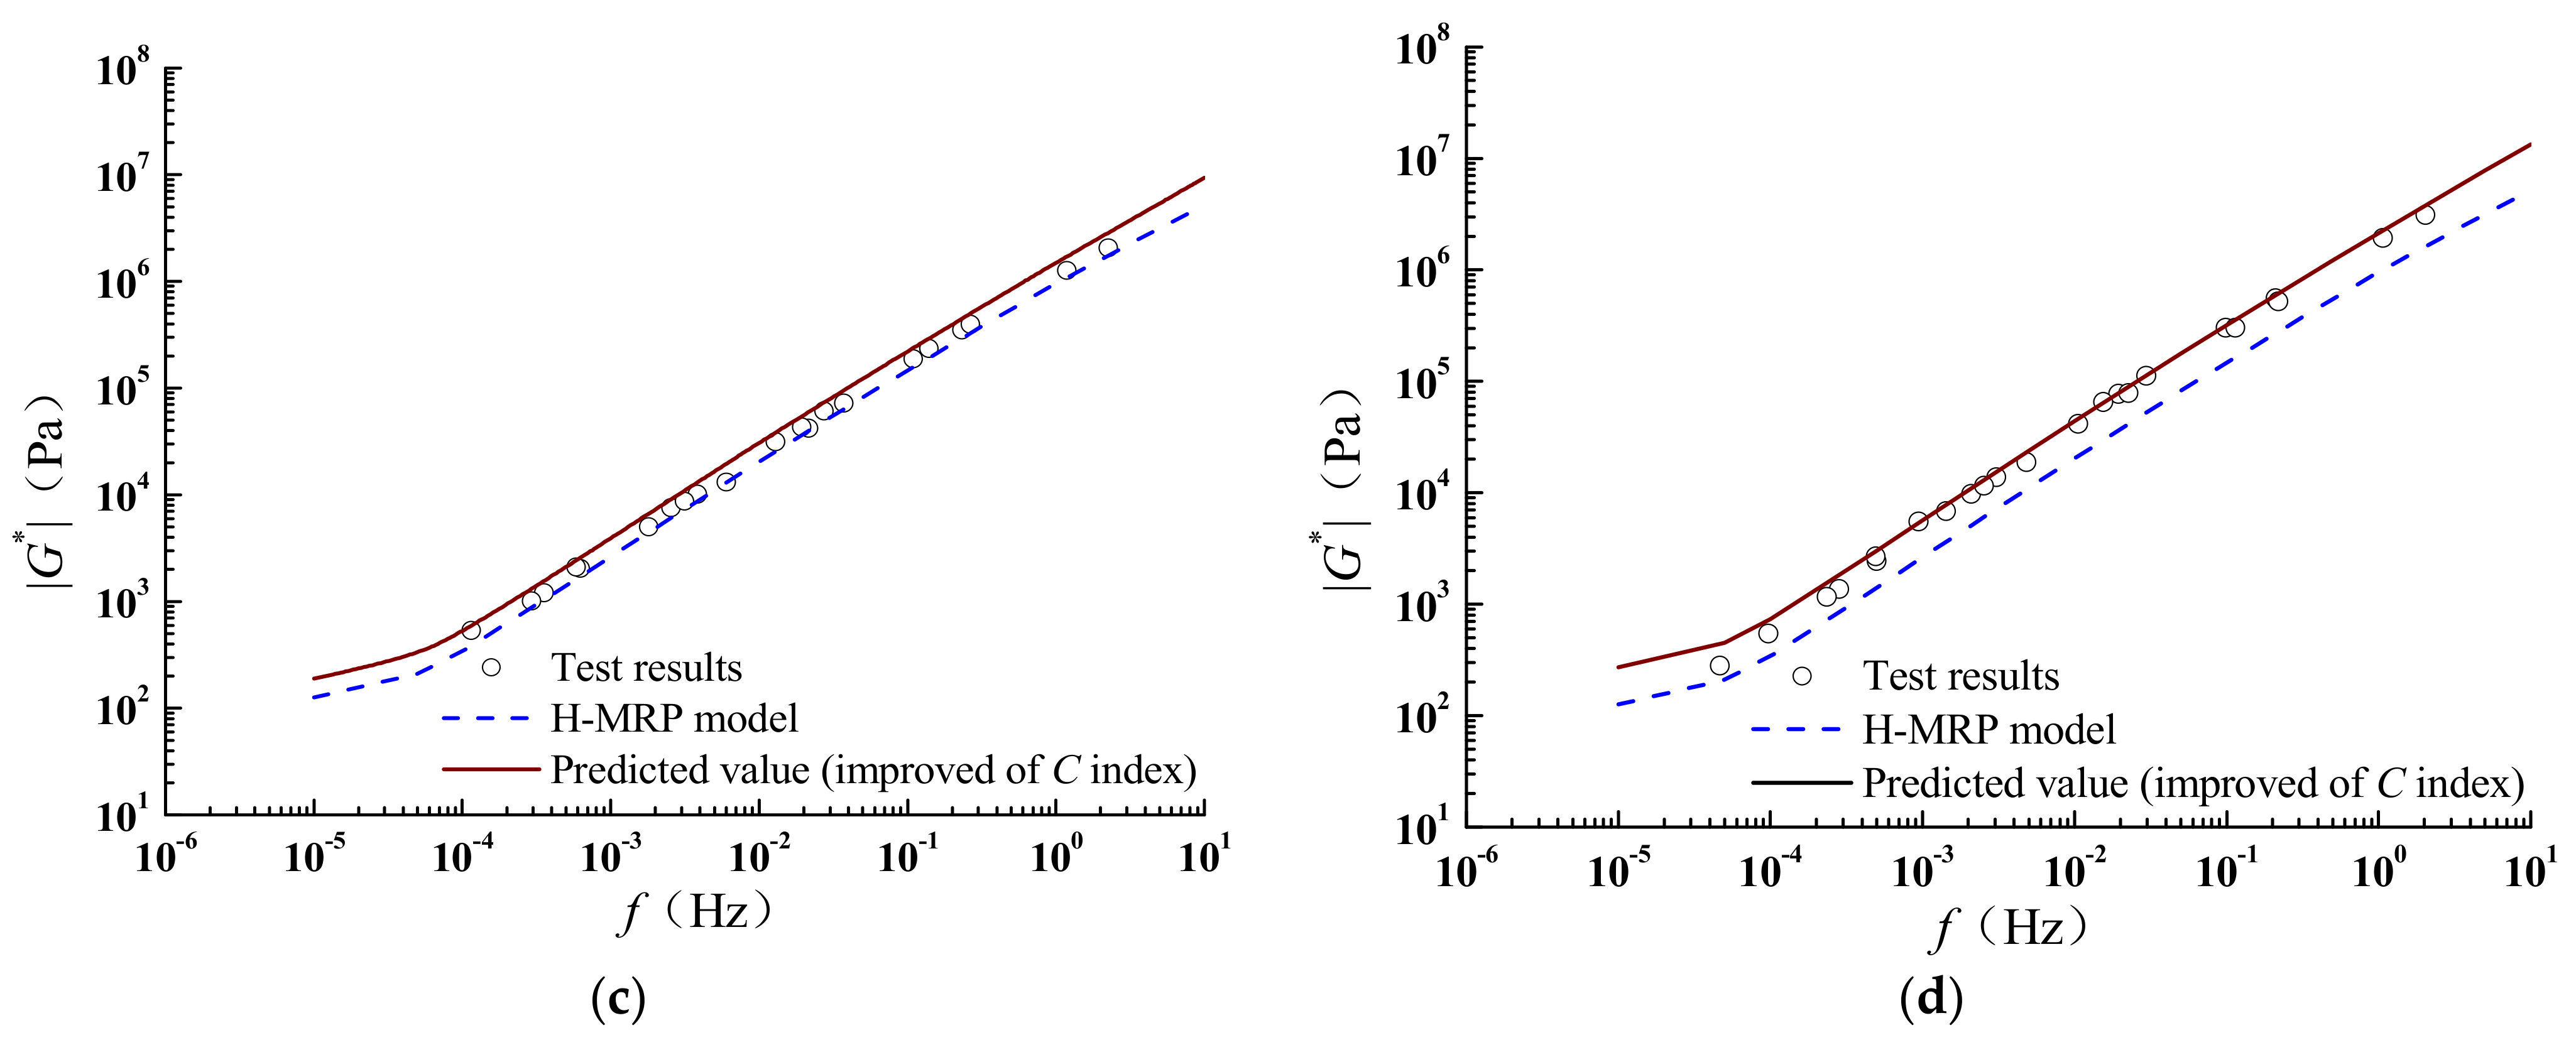
After considering the interaction between mineral powder and asphalt, the H-MRP model improved by the C index is used to predict the |G*| of different types of asphalt mastic, and the prediction |G*| results of asphalt mastics with F/A = 0.4 are shown in Figure 21. Figure 22 shows that when the F/A = 0.4, the predicted value of the improved model using the C index is closer to the experimental value than the H-MRP model.
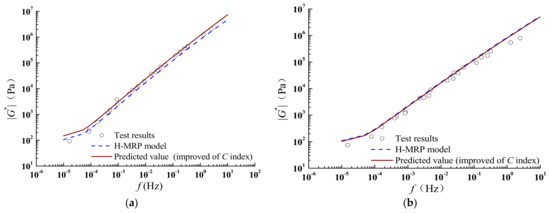
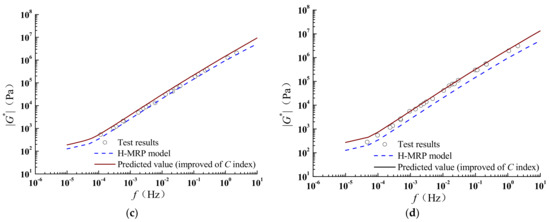
Figure 21.
Prediction results of |G*| for different types of asphalt mastic (F/A = 0.4). (a) LAM. (b) GAM. (c) FAM. (d) CAM.
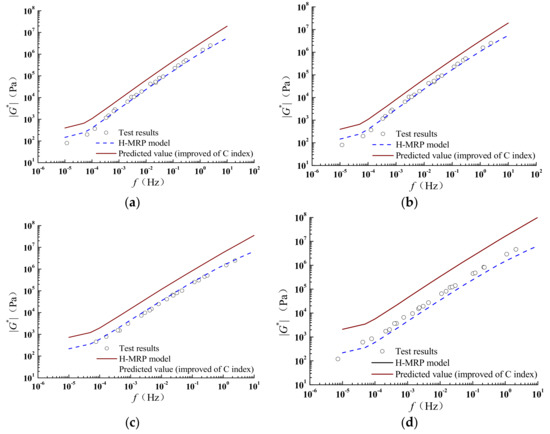
Figure 22.
Prediction results of |G*| for different types of asphalt mastic (F/A = 0.8). (a) LAM. (b) GAM. (c) FAM. (d) CAM.
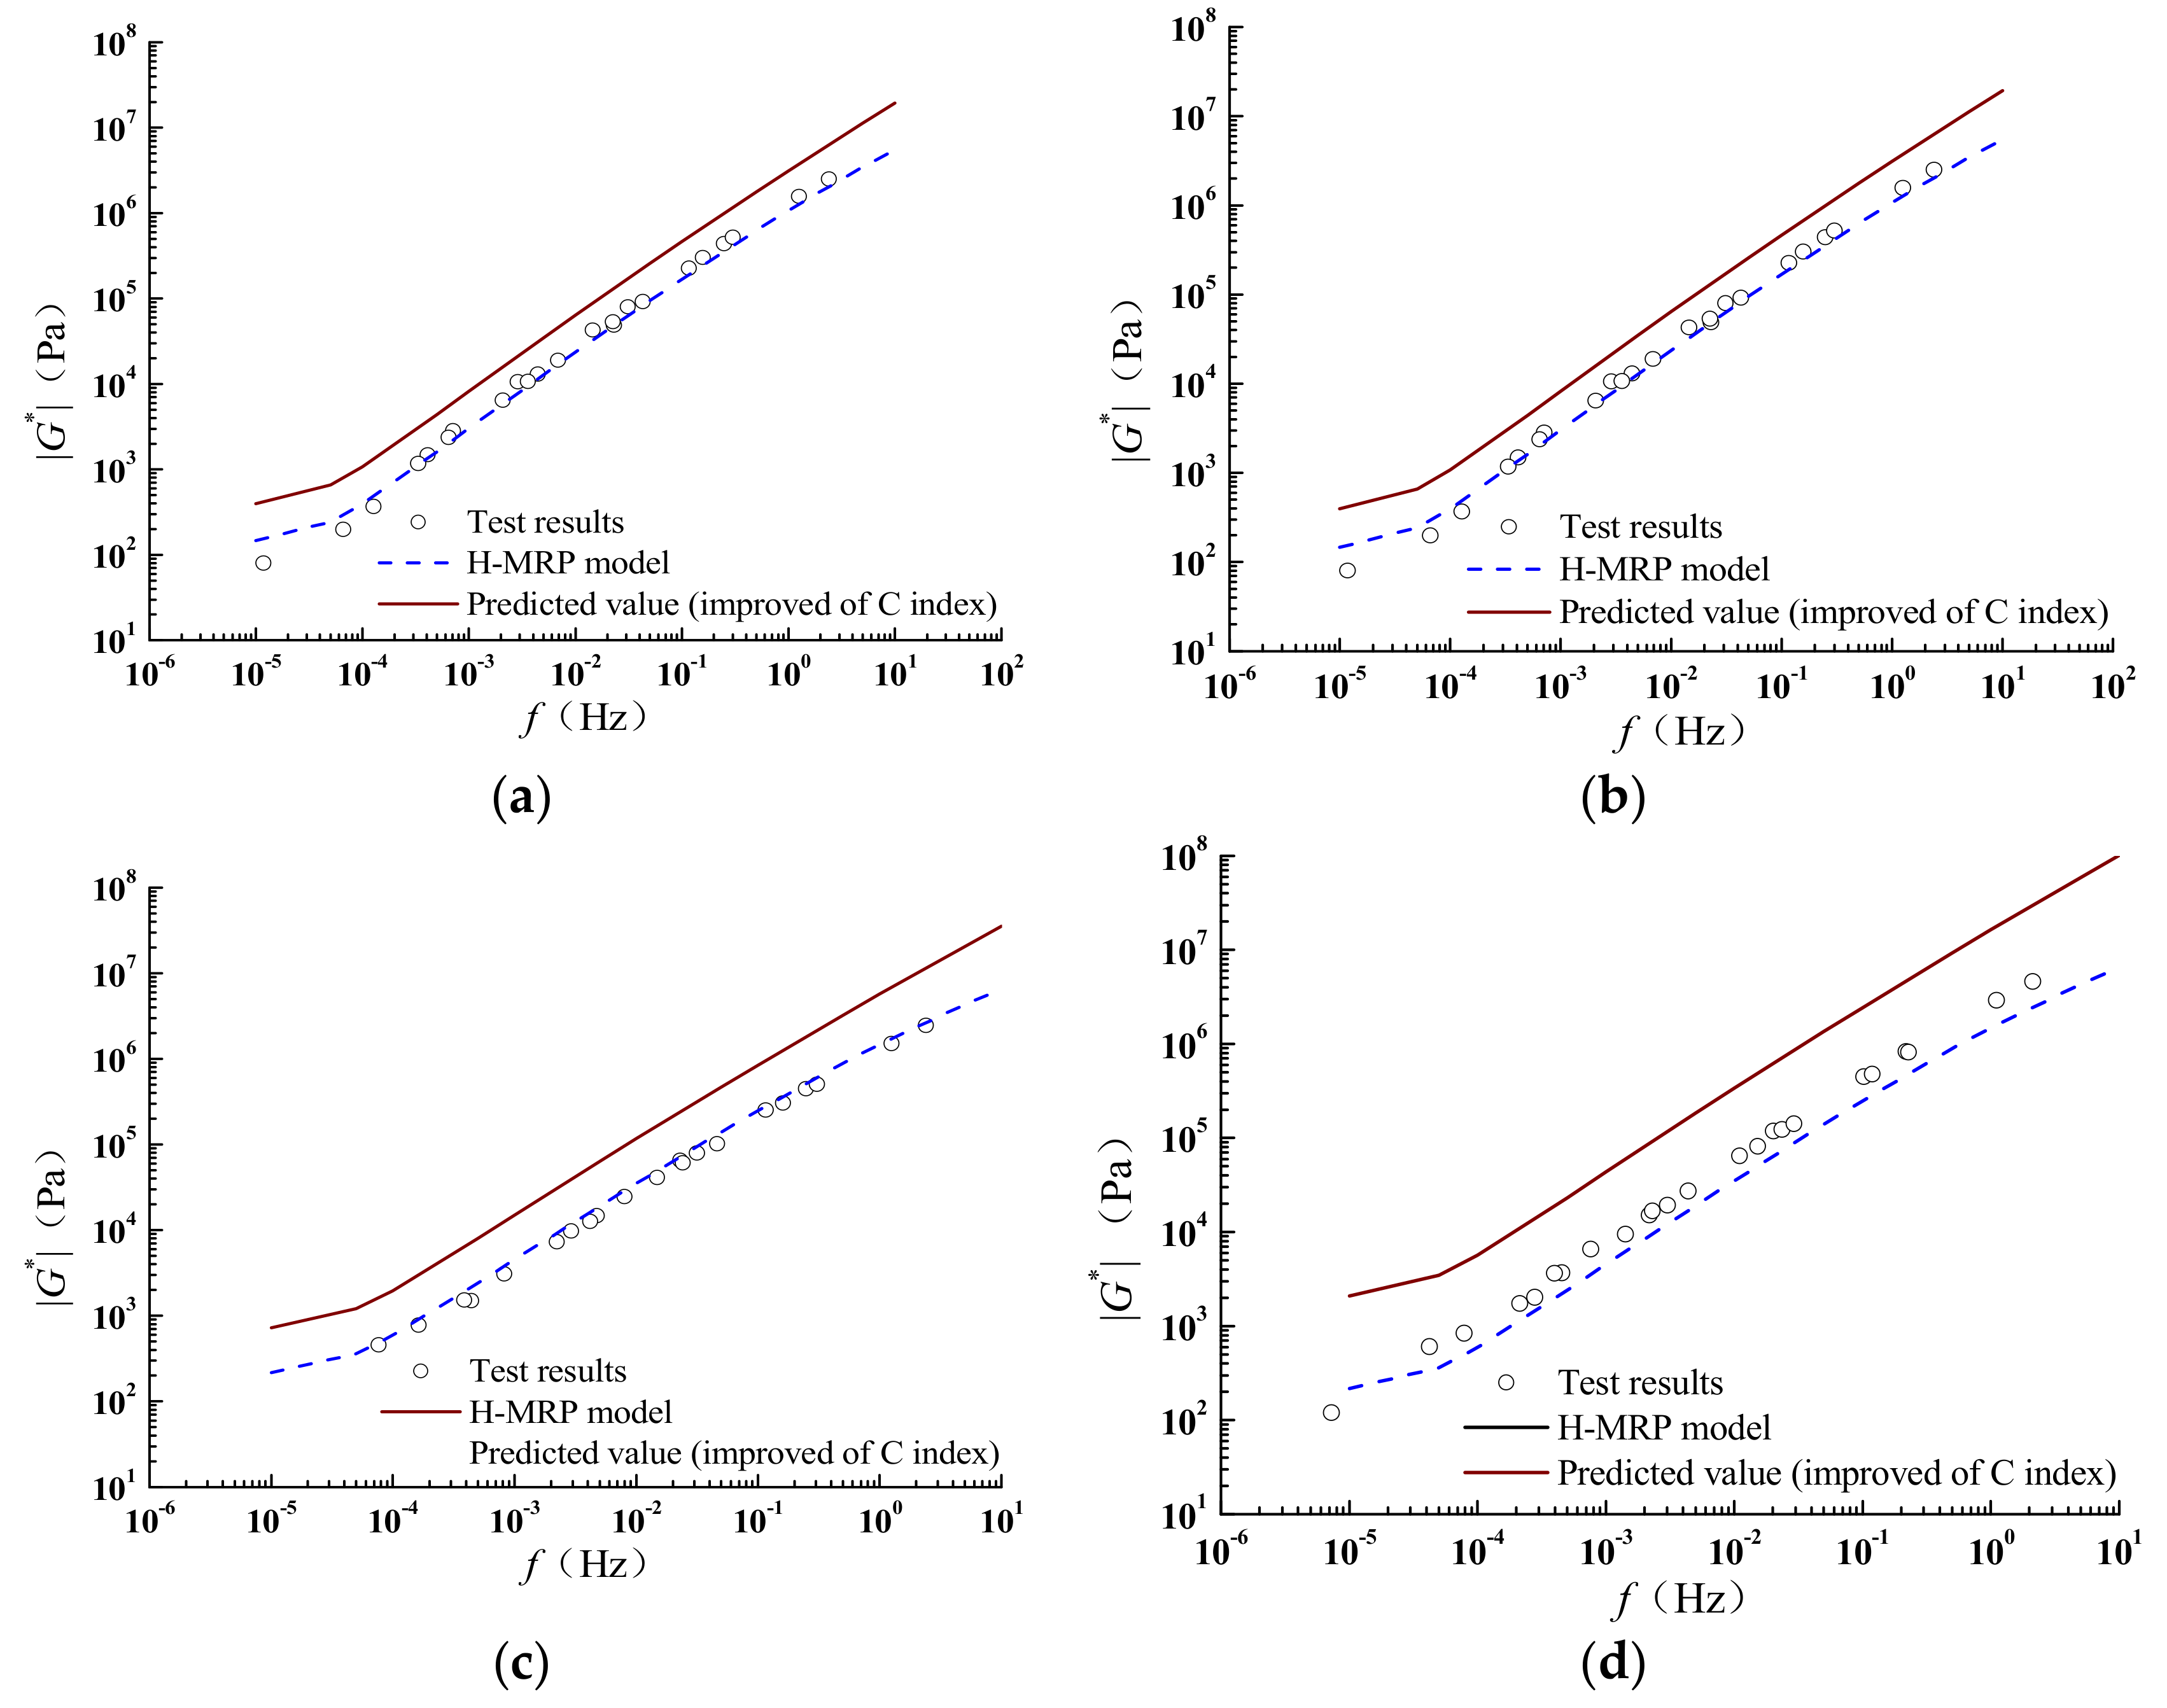
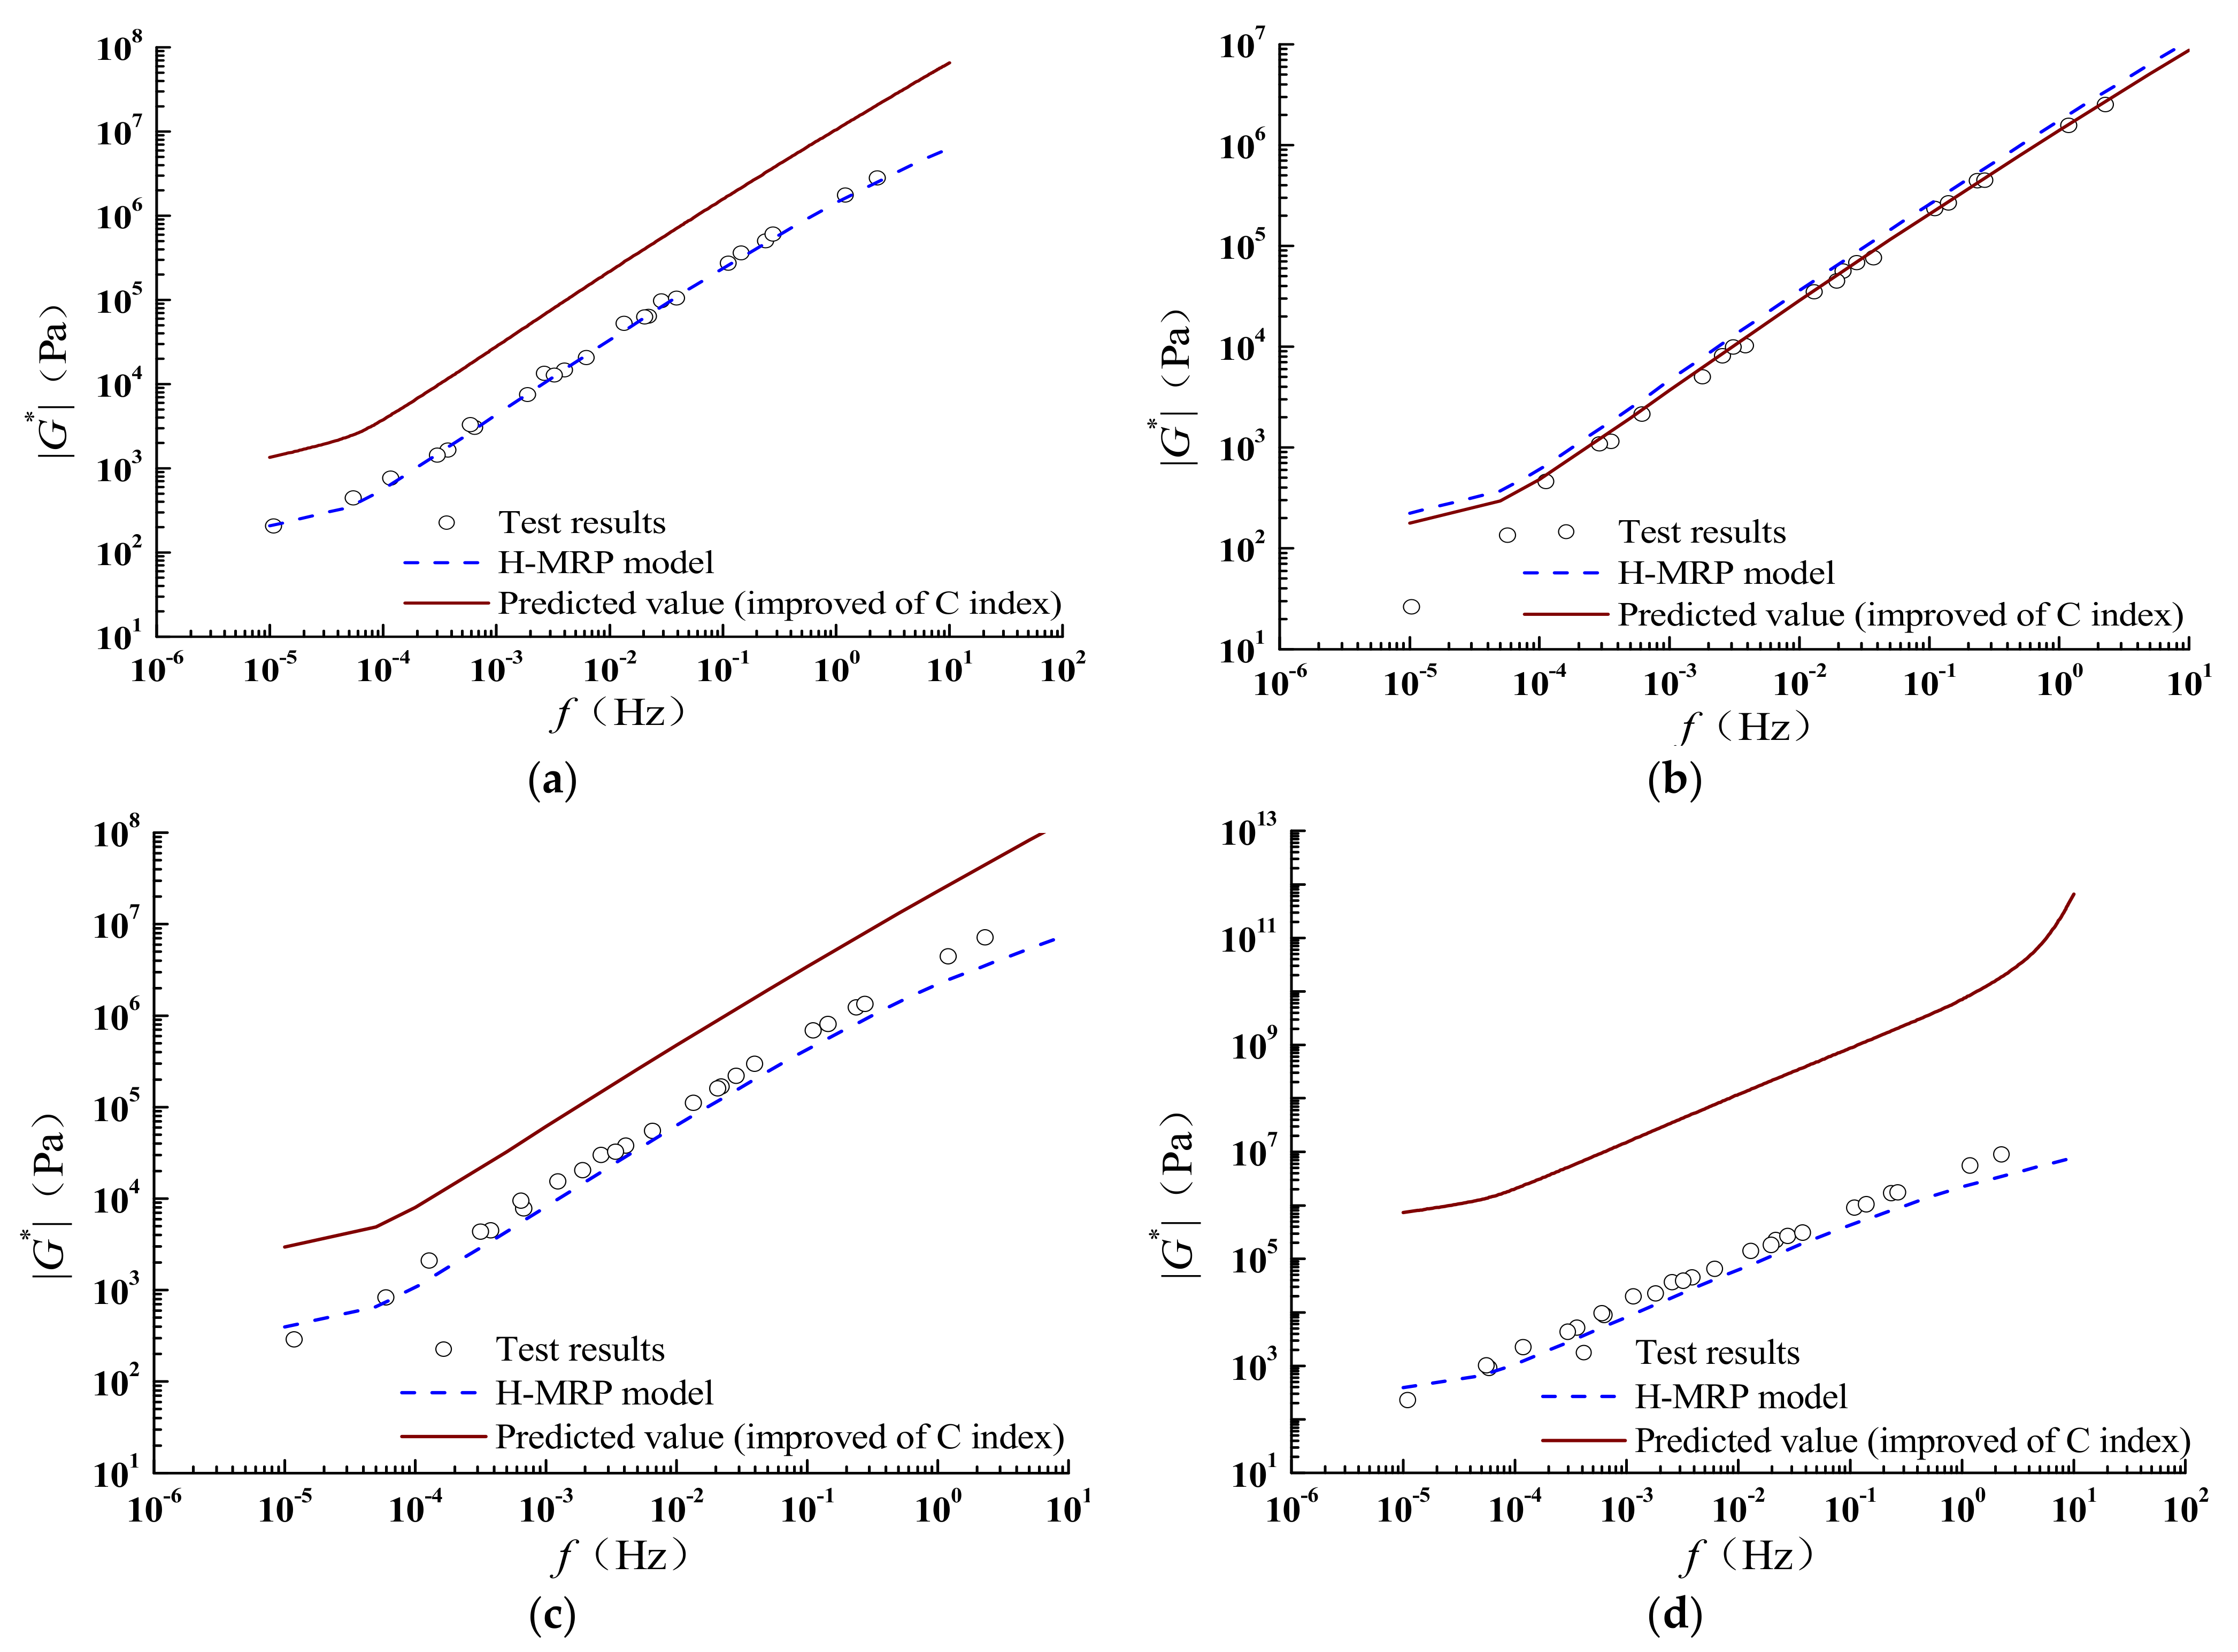
The prediction |G*| of different kinds of asphalt mastics with F/A = 0.8 was used to improve the H-MRP model with the C index, as shown in Figure 23, which shows that the predicted values of all asphalt mastic except GAM are significantly higher than the experimental values. This indicates that the use of φFC instead of the volume fraction φ of mineral powder overestimates the interaction between mineral powder and asphalt when the F/A = 0.8.
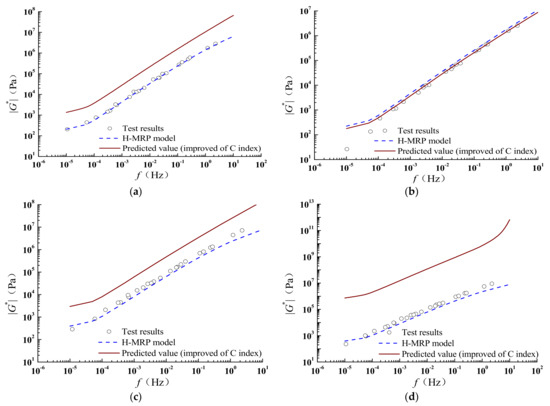
Figure 23.
Prediction results of |G*| for different types of asphalt mastic (F/A = 1.2). (a) LAM. (b) GAM. (c) FAM. (d) CAM.
Figure 23 shows the prediction |G*| results of the improved H-MRP model when the F/A=1.2 shows that the predicted values of other three species of asphalt mastic are significantly higher than the test values, except for GAM. The larger the key ratio of F/A, the larger the prediction error of the improved model based on the C index.
From the above analysis, it can be concluded that the predicted value of the improved H-MRP model with the C index is close to the experimental value when the F/A = 0.4. However, when the ratio of F/A ranges from 0.8 to 1.2, model correction using the C index is not applicable. The C index is an interaction index based on the Palierne model, which can be used to analyze the strength of the interaction ability between asphalt and mineral powder; hence, this index is not related to the H-MRP meso-mechanical model proposed in this study and cannot be used to directly modify the meso-mechanical model. This requires consideration of the interaction between mineral powder and asphalt in the meso-mechanical model. According to the Rehbinder theory, after the interaction between asphalt and filler, the polar components of asphalt will produce a structural reorganization on the surface of the filler, forming a structural asphalt layer of thickness d. The interaction’s ability to produce a structural asphalt layer should be considered in the meso-mechanical model. Considering the interaction between asphalt and mineral powder, this study adds the structural asphalt layer to the meso-mechanical model and proposes a four-phase H-MRP model.
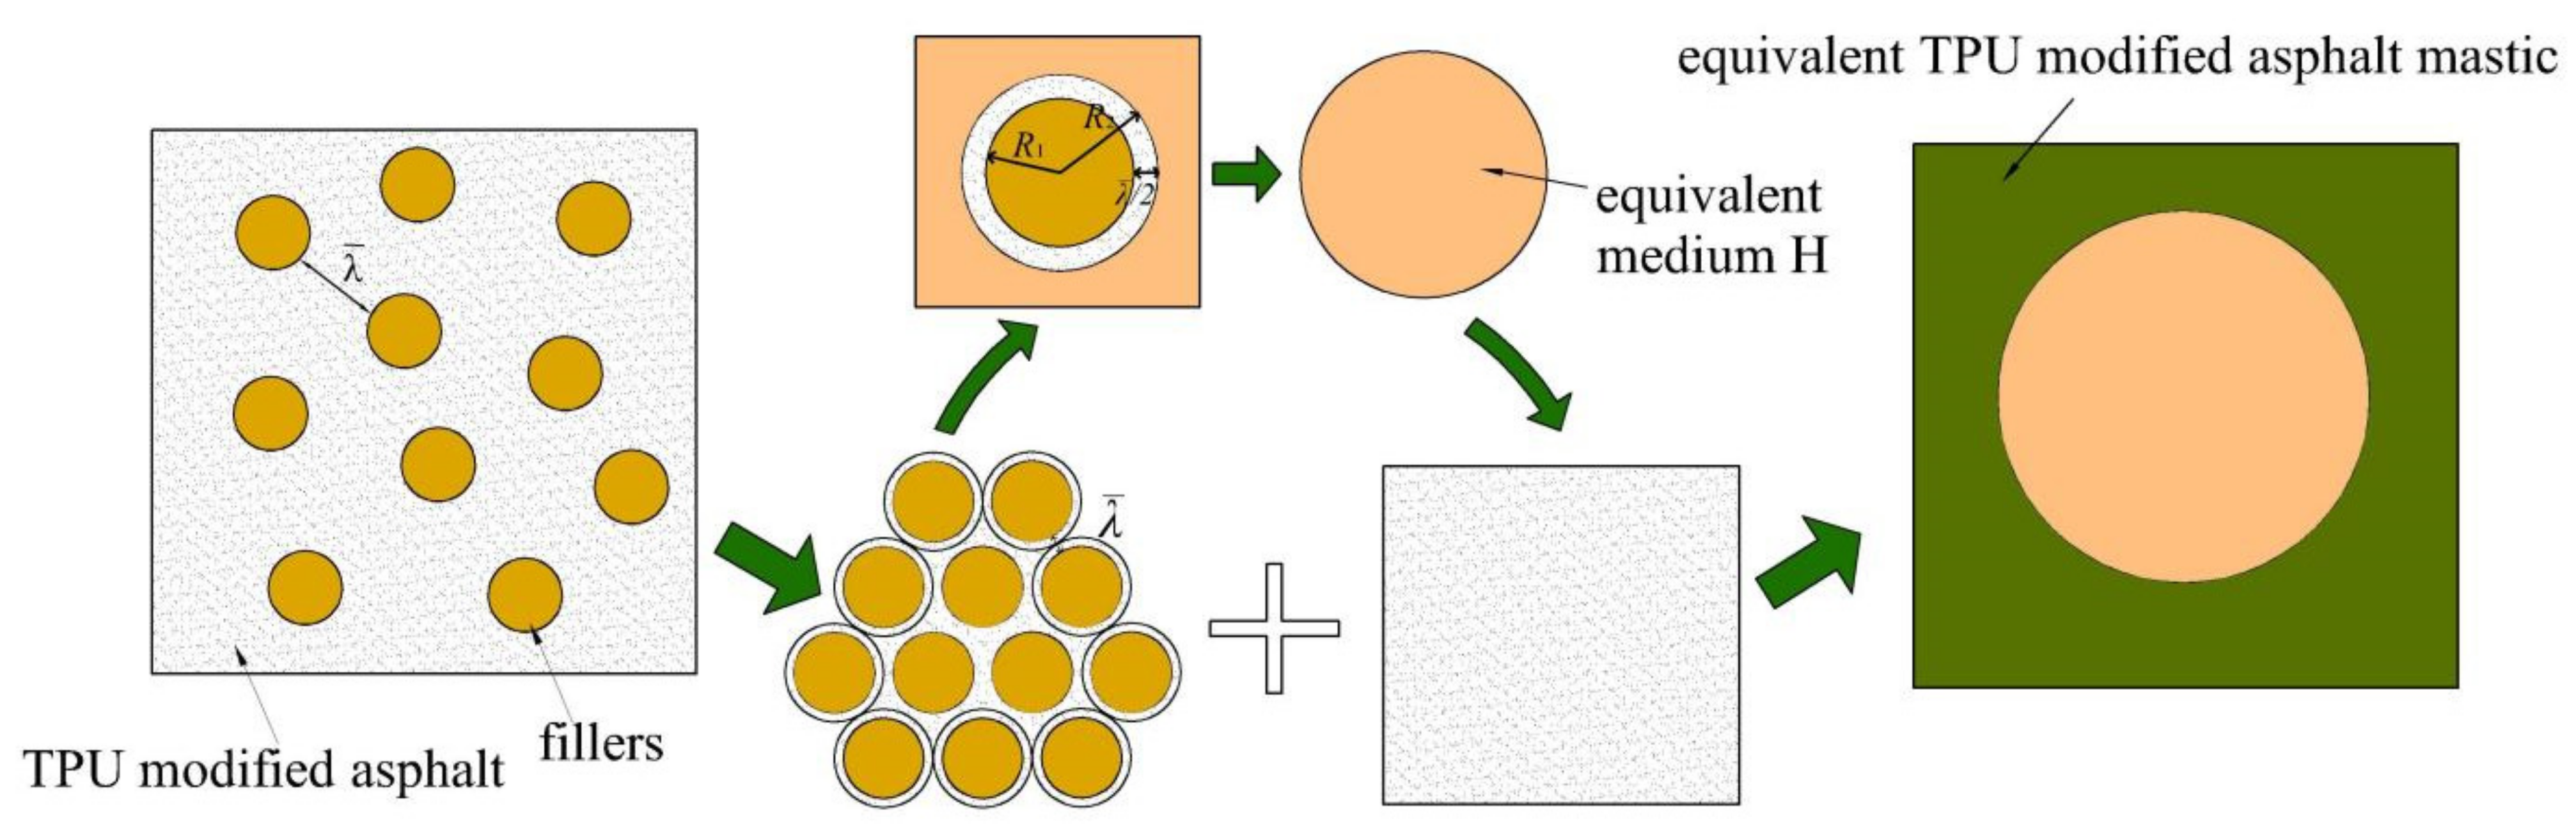
4.4.2. Establishment of Four-Phase H-MRP Model
To improve the H-MRP model based on the interaction between asphalt and mineral powder, the interaction between asphalt and mineral powder will be adsorbed on the surface of mineral powder particles to form a structural asphalt layer, and the asphalt not adsorbed by the mineral powder will become free asphalt, outside the structural layer. At this time, the asphalt mastic should be regarded as a three-phase composite consisting of mineral powder, structural asphalt layer, and a free asphalt layer.
In this paper, the asphalt coating in the composite sphere form of the H-MRP model is divided into mineral powder particles, the structural asphalt layer near the surface of the mineral powder particles and distal free asphalt layer, to form a three-layer composite ball form. One of the three-layer composite spheres in the composite sphere form is removed and the rest are used as homogenizing material Q to form a four-phase sphere model; therefore, the improved H-MRP model is referred to as the four-phase H-MRP model in this paper, as can be seen in Figure 24.
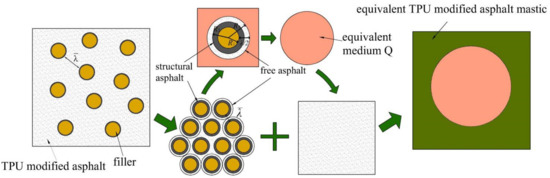
Figure 24.
Four-phase H-MRP model of TUP-modified asphalt mastic.
The equivalent modulus of homogenized material can be obtained from the equivalent modulus formula of the four-phase sphere model. Based on the generalized self-consistent model, Herve [37] provides the equivalent modulus formula of the n-layer sphere model, which can predict the equivalent bulk modulus and the shear modulus of n-layer (n ≥ 2) composites. Mineral powder, structural asphalt, and free asphalt are denoted as subscripts 1, 2, and 3, respectively. According to the viscoelastic correspondence principle, the equivalent complex bulk modulus and the shear modulus of the homogenized material, when n = 3, are expressed as follows:
where ,, are the expressions of n = 3 in the N-layer sphere model.
After the homogenization of the four-phase sphere model is completed, the pitch outside the four-phase sphere model shape is the matrix. According to the self-consistent theory, the homogenized material is regarded as single and spherical, embedded in the equivalent material of asphalt mastic, and the equivalent bulk modulus and shear modulus of the asphalt mastics are obtained by using the SC model as follows:
Considering the distribution state of mineral powder particles, with used for representation. Furthermore, the relationship between the total thickness d of structural and free asphalt layers, and the average minimum distance between mineral powders, is . The volume fraction of homogenized material can be obtained as follows:
where is the volume fraction of mineral powder in asphalt mastic; is the volume fraction of mineral powder in the four-phase sphere model.
Considering the effect of mineral powder particle size in the four-phase H-MRP model, is calculated as:
The thickness of the mineral powder adsorption structural layer depends on the interaction between the asphalt and the mineral powder. Therefore, for a specific mineral powder and asphalt, the relationship between the thickness of the structural asphalt layer ds and the radius of the mineral powder is:
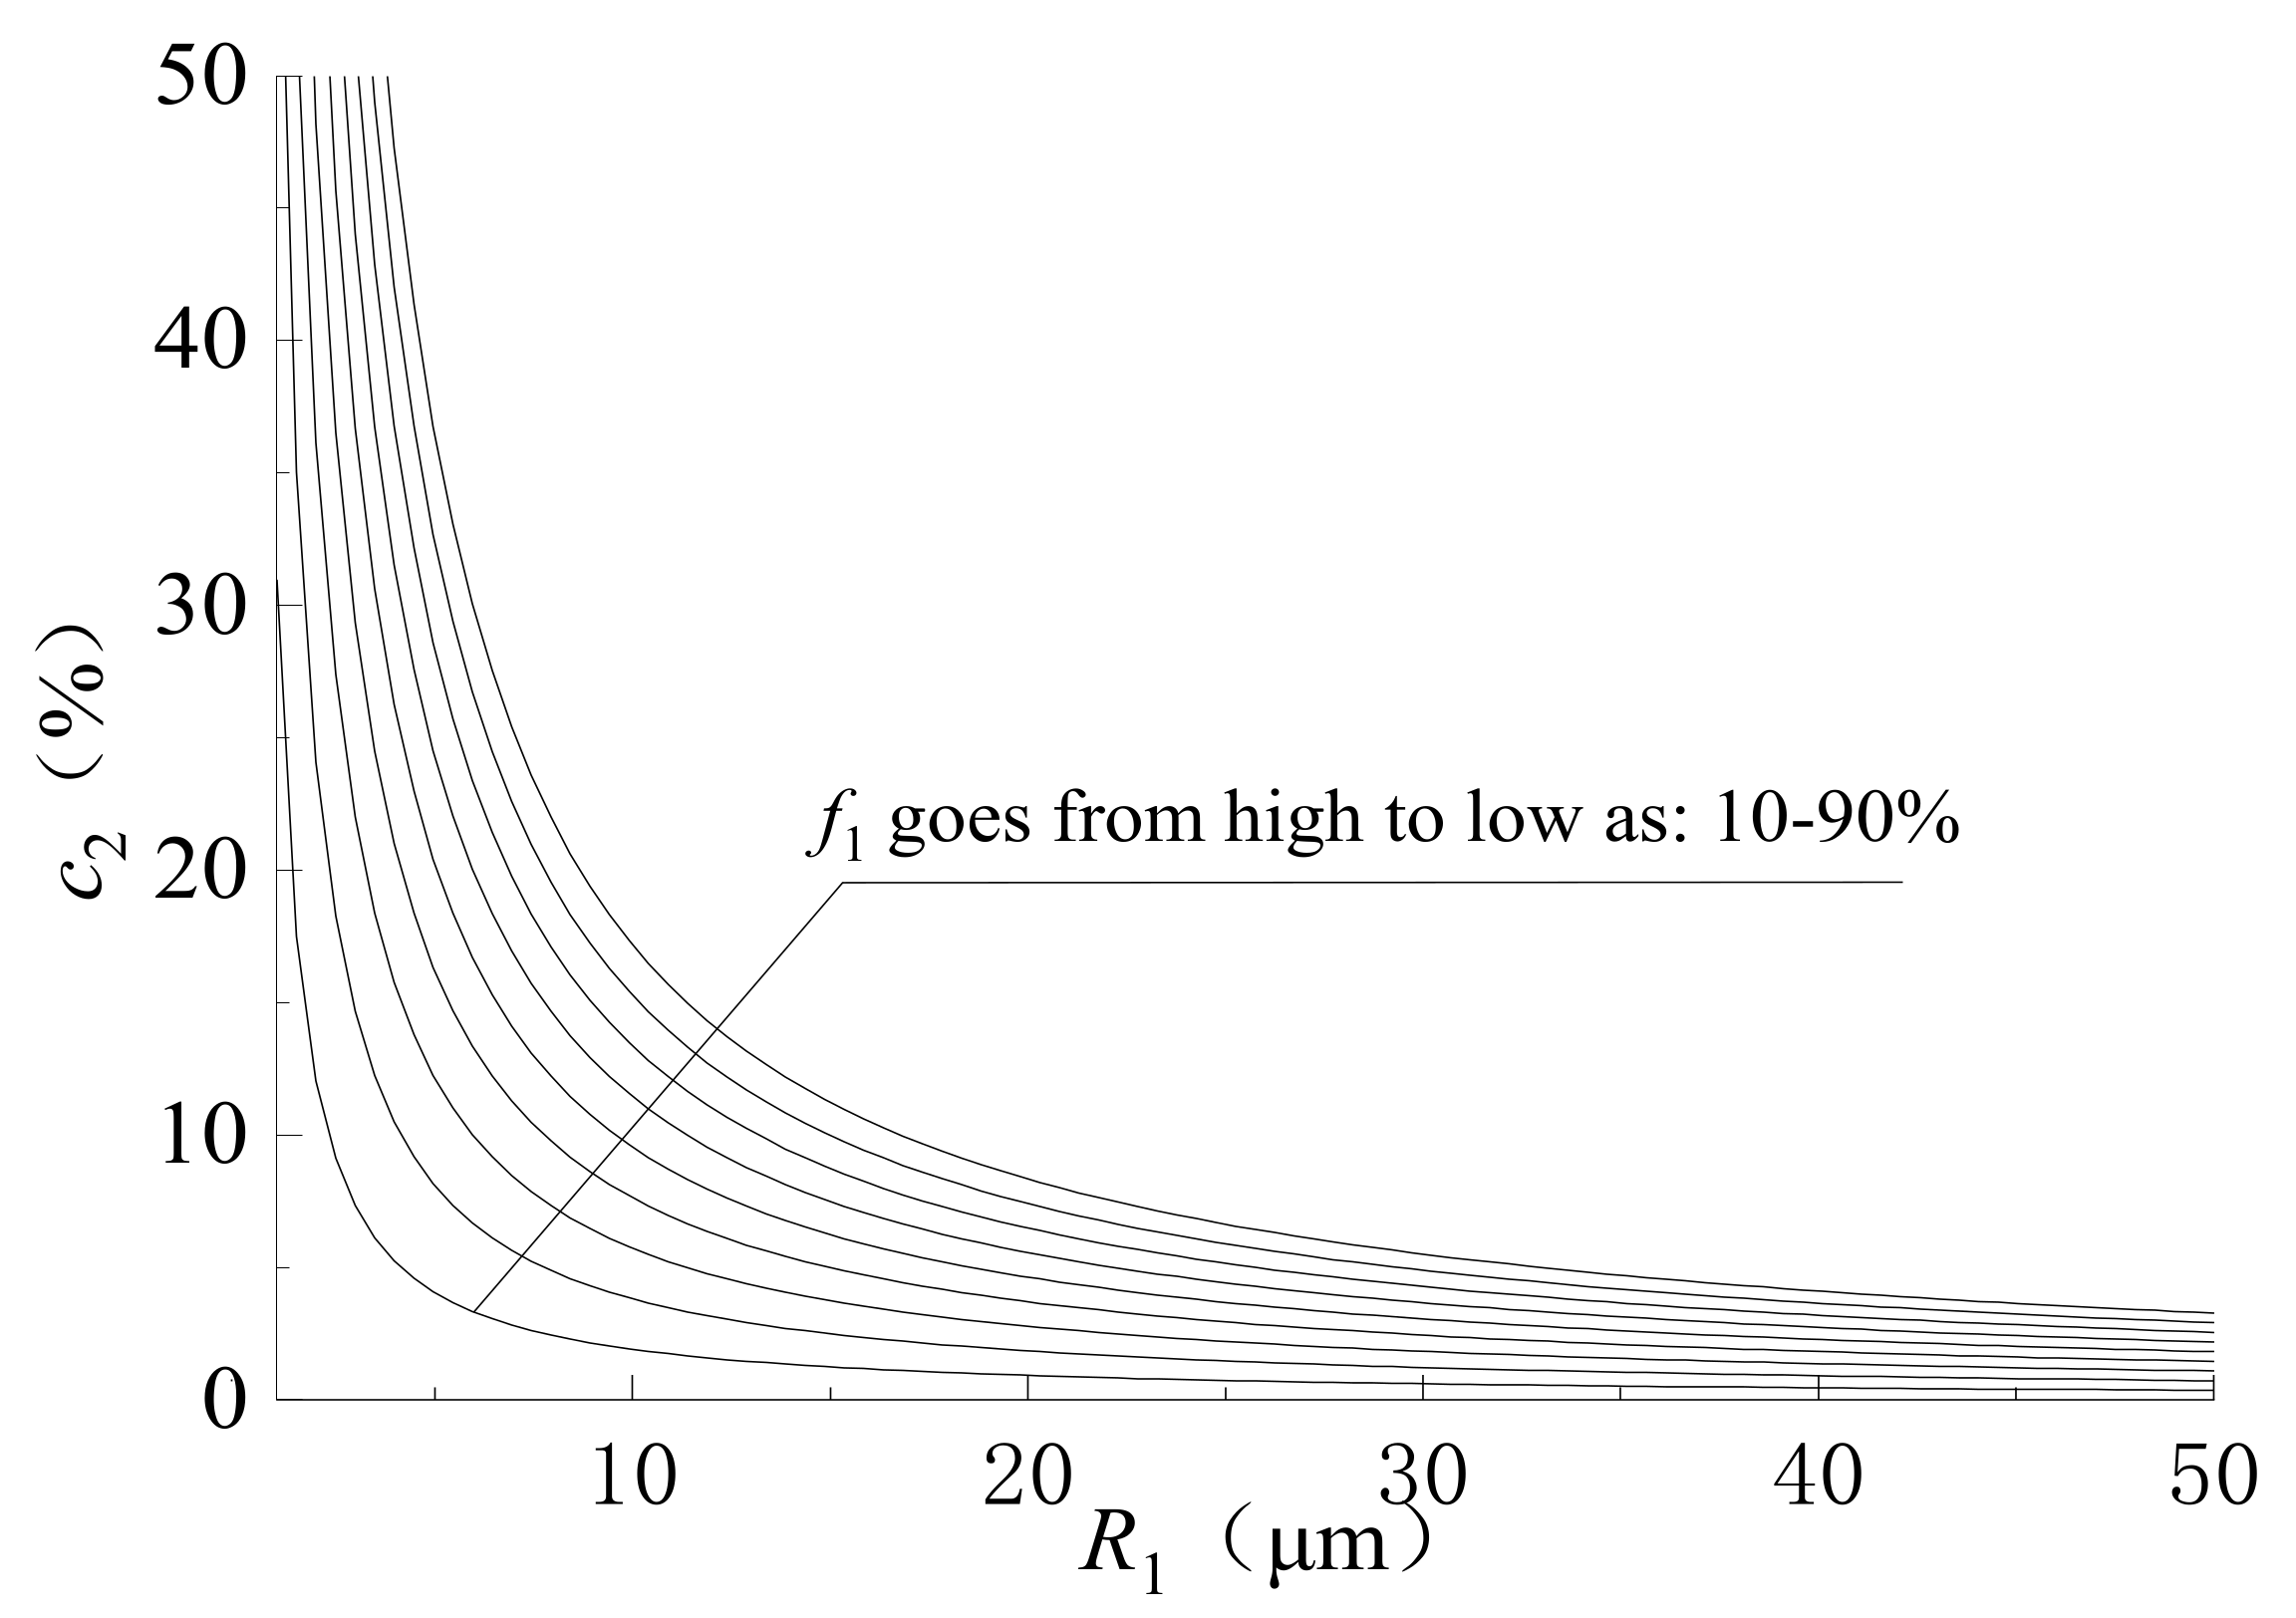
From Equations (20) and (21), it can be seen that both R2 and R3 are related to the particle radius R1. Therefore, the effect of the particle gradation of mineral powder should be carefully considered in the four-phase H-MRP model. Under the same distribution state, is a constant, the volume fraction of particles in the model can be obtained from Equation (21) () is a fixed value, and the volume fraction c2 of the structural asphalt layer is expressed as:
The thickness of the structural asphalt layer in the asphalt mastic is 0.49~0.59 μm. In this paper, it is assumed to be 0.6 μm, as represented by ds. Figure 25 shows the relationship between the volume fraction of the structural asphalt layer c2 and the particle radius R1. It can be seen that the volume fraction of the structural asphalt layer c2 decreases with the increase in the particle size of the mineral powder at the same volume fraction of the mineral powder. When R1 is less than 20 μm, the effect of particle size variation on c2 is significant when , .
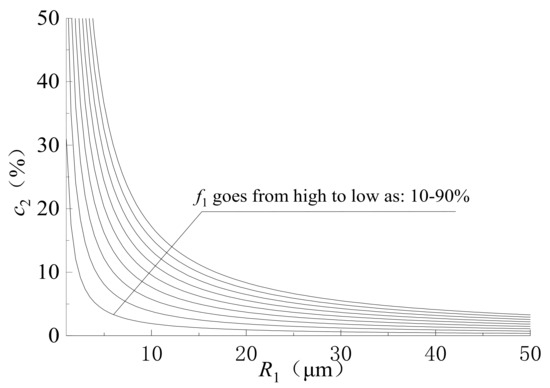
Figure 25.
Variation of c2 with R1 in the four-phase sphere model.
In summary, the four-phase H-MRP model proposed in this paper uses the distribution coefficient to characterize the effect of the distribution state of mineral powder particles on the equivalent modulus of asphalt mastic. It is assumed that the thickness of the structural asphalt layer formed by specific asphalt and mineral powder is of a definite value. In the four-phase H-MRP model, the dynamic shear modulus of asphalt mastic, which considers the influence of mineral powder particle distribution and particle size gradation, is consistent with the results of laboratory tests.
4.4.3. Parameters of the Four-Phase H-MRP Model for Asphalt Mastic
When the volume fraction of mineral powder particles is small, it can completely adsorb the polar components in asphalt to form structural asphalt. However, the polar components in asphalt are limited: when the volume fraction increases to a certain degree, the mineral powder will not be able to achieve maximum adsorption. These polar components include asphaltene and soft asphalt with a large molecular weight, accounting for from 25% to 60% of the total volume of asphalt.
It is assumed that the mineral powder is a monodisperse spherical particle of 10 μm diameter, the maximum adsorbed structural asphalt film thickness is 0.60 μm, and the polar components of the asphalt that can be adsorbed accounts for 30% of its volume. Figure 26 shows the relationship between the thickness of structural asphalt layer, the volume fraction of particle and the volume fraction of structural asphalt. When the particle volume fraction reaches about 40%, complete adsorption is achieved, and the thickness of the adsorbed structural asphalt layer remains constant. However, when the particle concentration exceeds 40%, the thickness of the structural asphalt layer is 0.60 micrometers, which consumes more than 30% of the total asphalt volume; therefore, the thickness must be reduced. At a volume fraction of 80% of mineral powder, the thickness of the structural asphalt layer decreases to 0.1 μm.
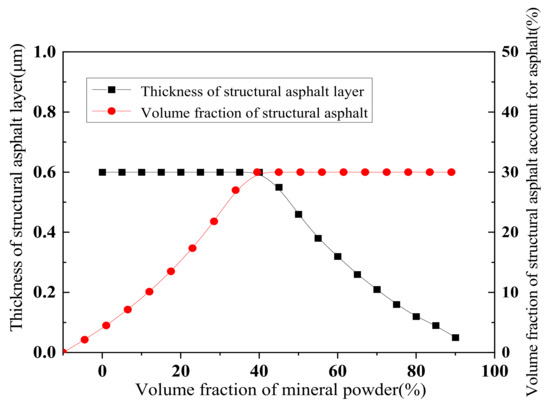
Figure 26.
Relationship between the thickness of structural asphalt layer and the volume fraction of structural asphalt.
In this study, the surface area average particle size d[3,2] is used as the average particle size of mineral powders, in which dL of limestone is 5.770 μm, dG of granite is 25.525 μm, dF of fly ash is 4.294 μm, and dC of coal gangue is 11.859 μm. Thus, the model parameter R can be obtained. The thickness of the structural asphalt layer ds is a variable, and ds is related to the degree of asphalt adsorption by the mineral powder, and changes with the increase in the volume fraction of the mineral powder, making R2 a non-constant value in the model. From Equation (20), the model parameter R3 can be calculated when the mineral powder distribution coefficient is determined.
The structural asphalt layer is similar to the ultra-thin coating wrapped around the outside of the mineral powder particles. Therefore, the layer should have both a strong hardness close to the mineral powder particles and viscoelastic characteristics close to the asphalt. The mechanical properties are between the mineral powder and asphalt. Hence, this paper assumes that the mechanical properties of structural asphalt meet the logarithmic mean of mineral powder and asphalt, and the dynamic shear modulus of the structural asphalt layer is calculated as:
where is the shear modulus of mineral powder, and is the dynamic shear modulus of ordinary asphalt before the physical and chemical effects.
Based on the results of the matrix asphalt test, Equation (23) was applied to calculate the dynamic shear modulus of the structural asphalt between asphalt and mineral powder, as shown in Figure 27.
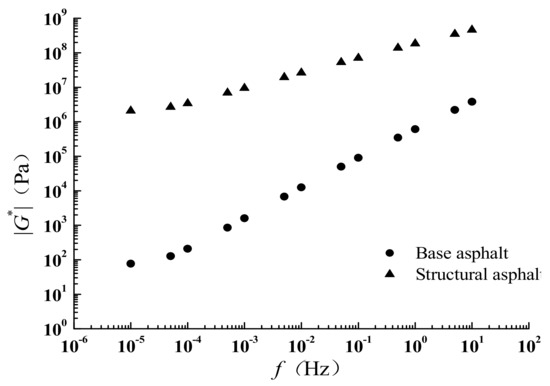
Figure 27.
Calculation results of dynamic shear modulus of structural asphalt.
To simplify the calculation, in this paper, the small variation in the complex ratio of Poisson with frequency is ignored, assuming that , . The modulus of Young (E1) of the mineral powder is 56 GPa and Poisson’s ratio () is 0.25.
4.4.4. Validation of the Four-Phase H-MRP Model for Asphalt Mastic
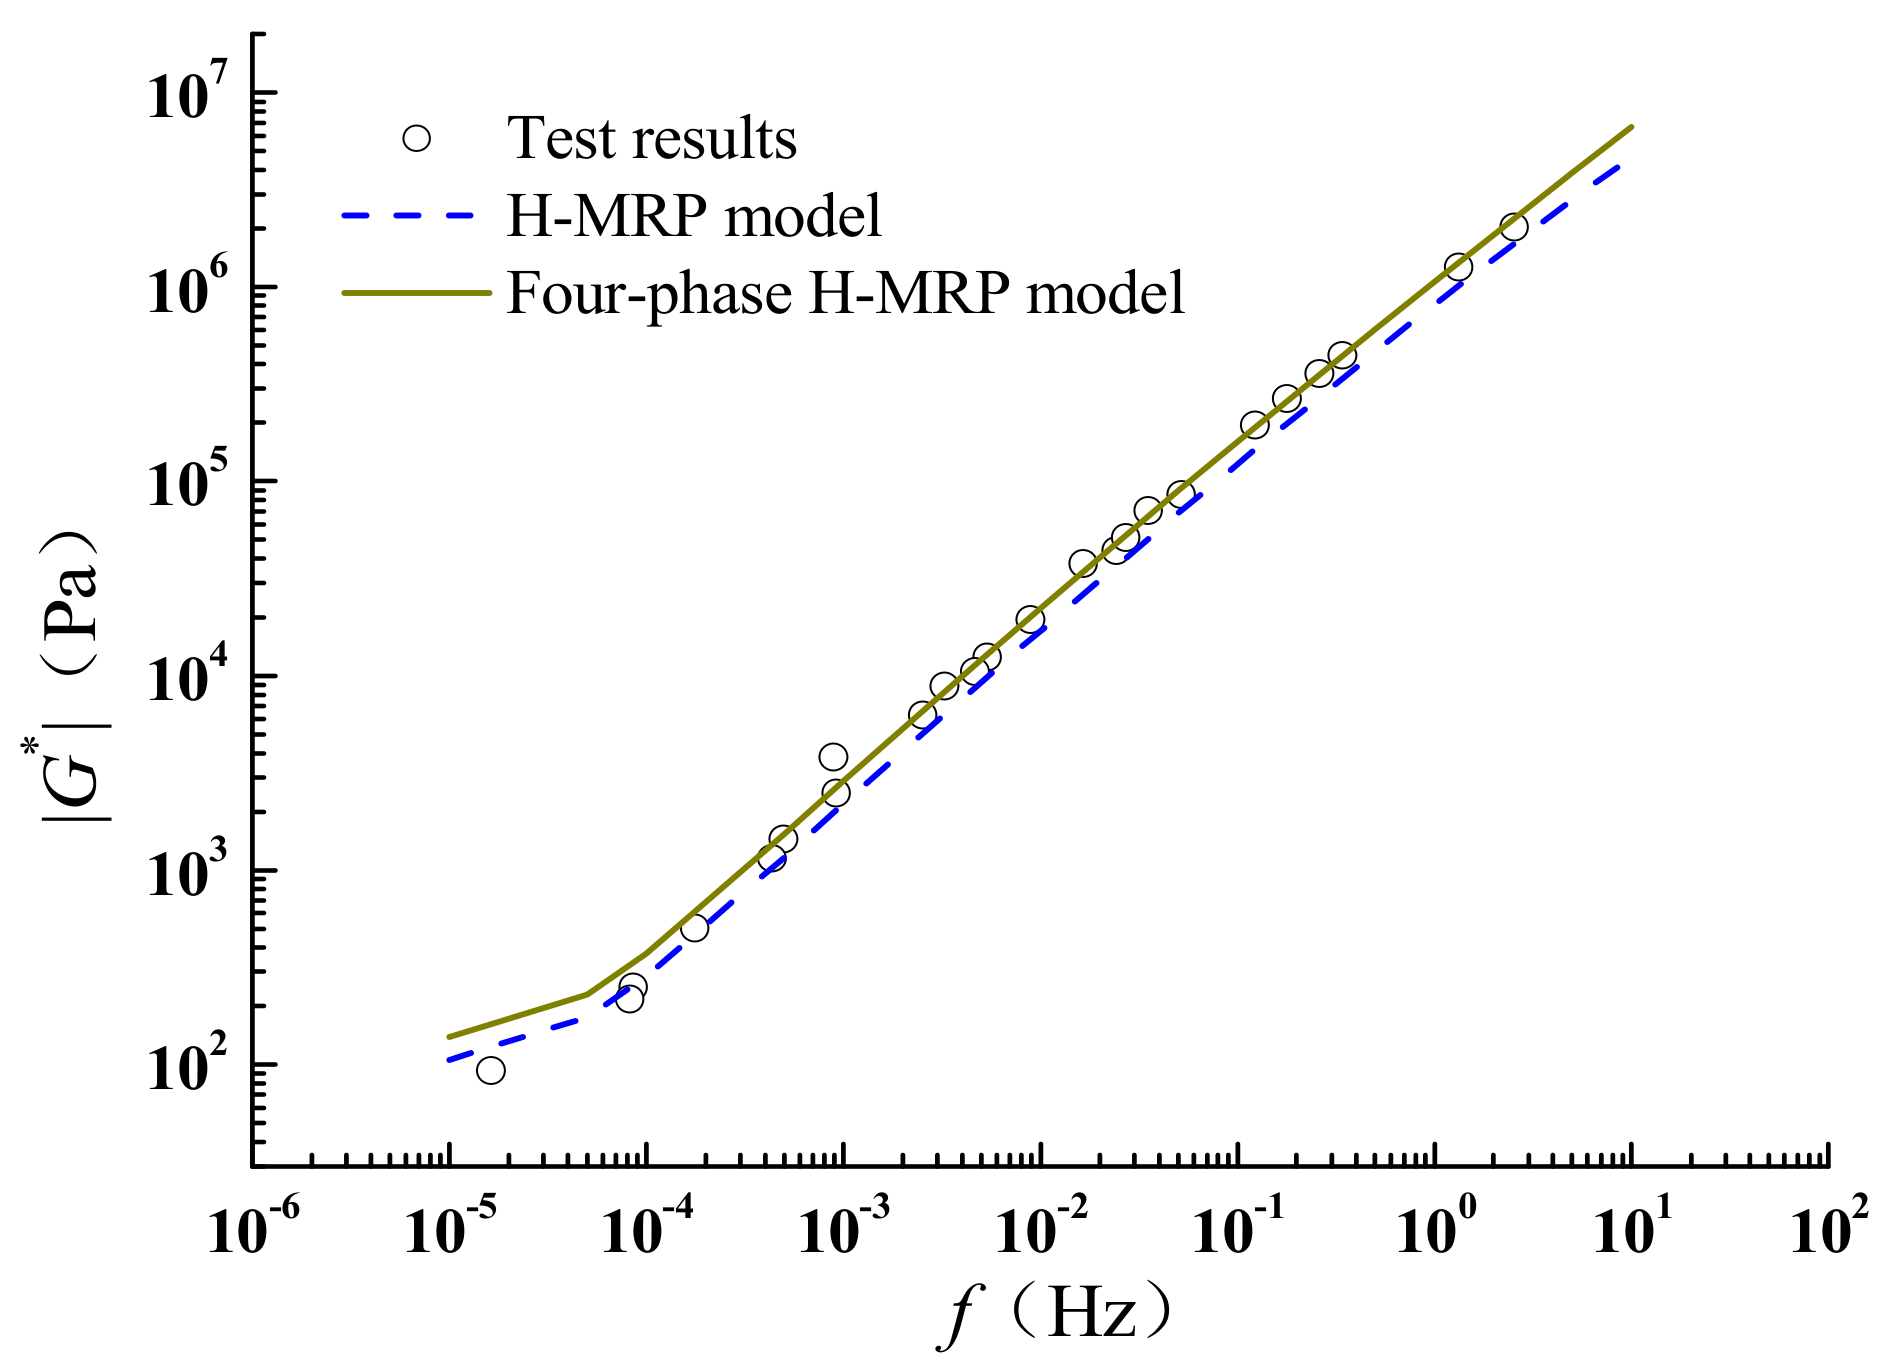
The mineral powder particles obey the uniform distribution of FCC, the structural asphalt layer thickness of LAM at a lower volume fraction is taken as the average value of ds = 0.54 μm obtained from the test, and the F/A = 0.4. The predicted values of the four-phase H-MRP model, the predicted values of the H-MRP model and the test values of LAM are compared in Figure 28. This shows that the predicted value of the four-phase H-MRP model is larger than that of the H-MRP model when considering the structural asphalt layer formed by the interaction. The predicted value of the four-phase H-MRP model is closer to the experimental value when the thickness of the structural asphalt layer is ds = 0.54 μm.
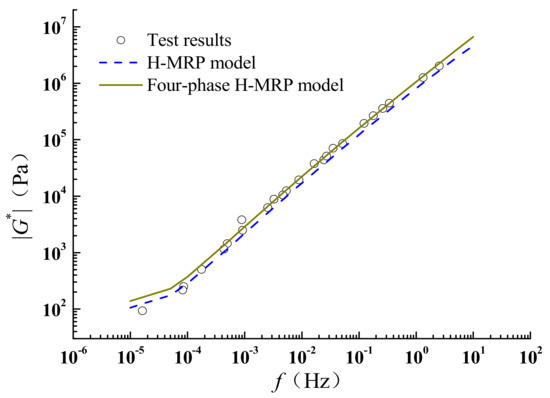
Figure 28.
Predicted results and test results of LAM (F/A = 0.4).
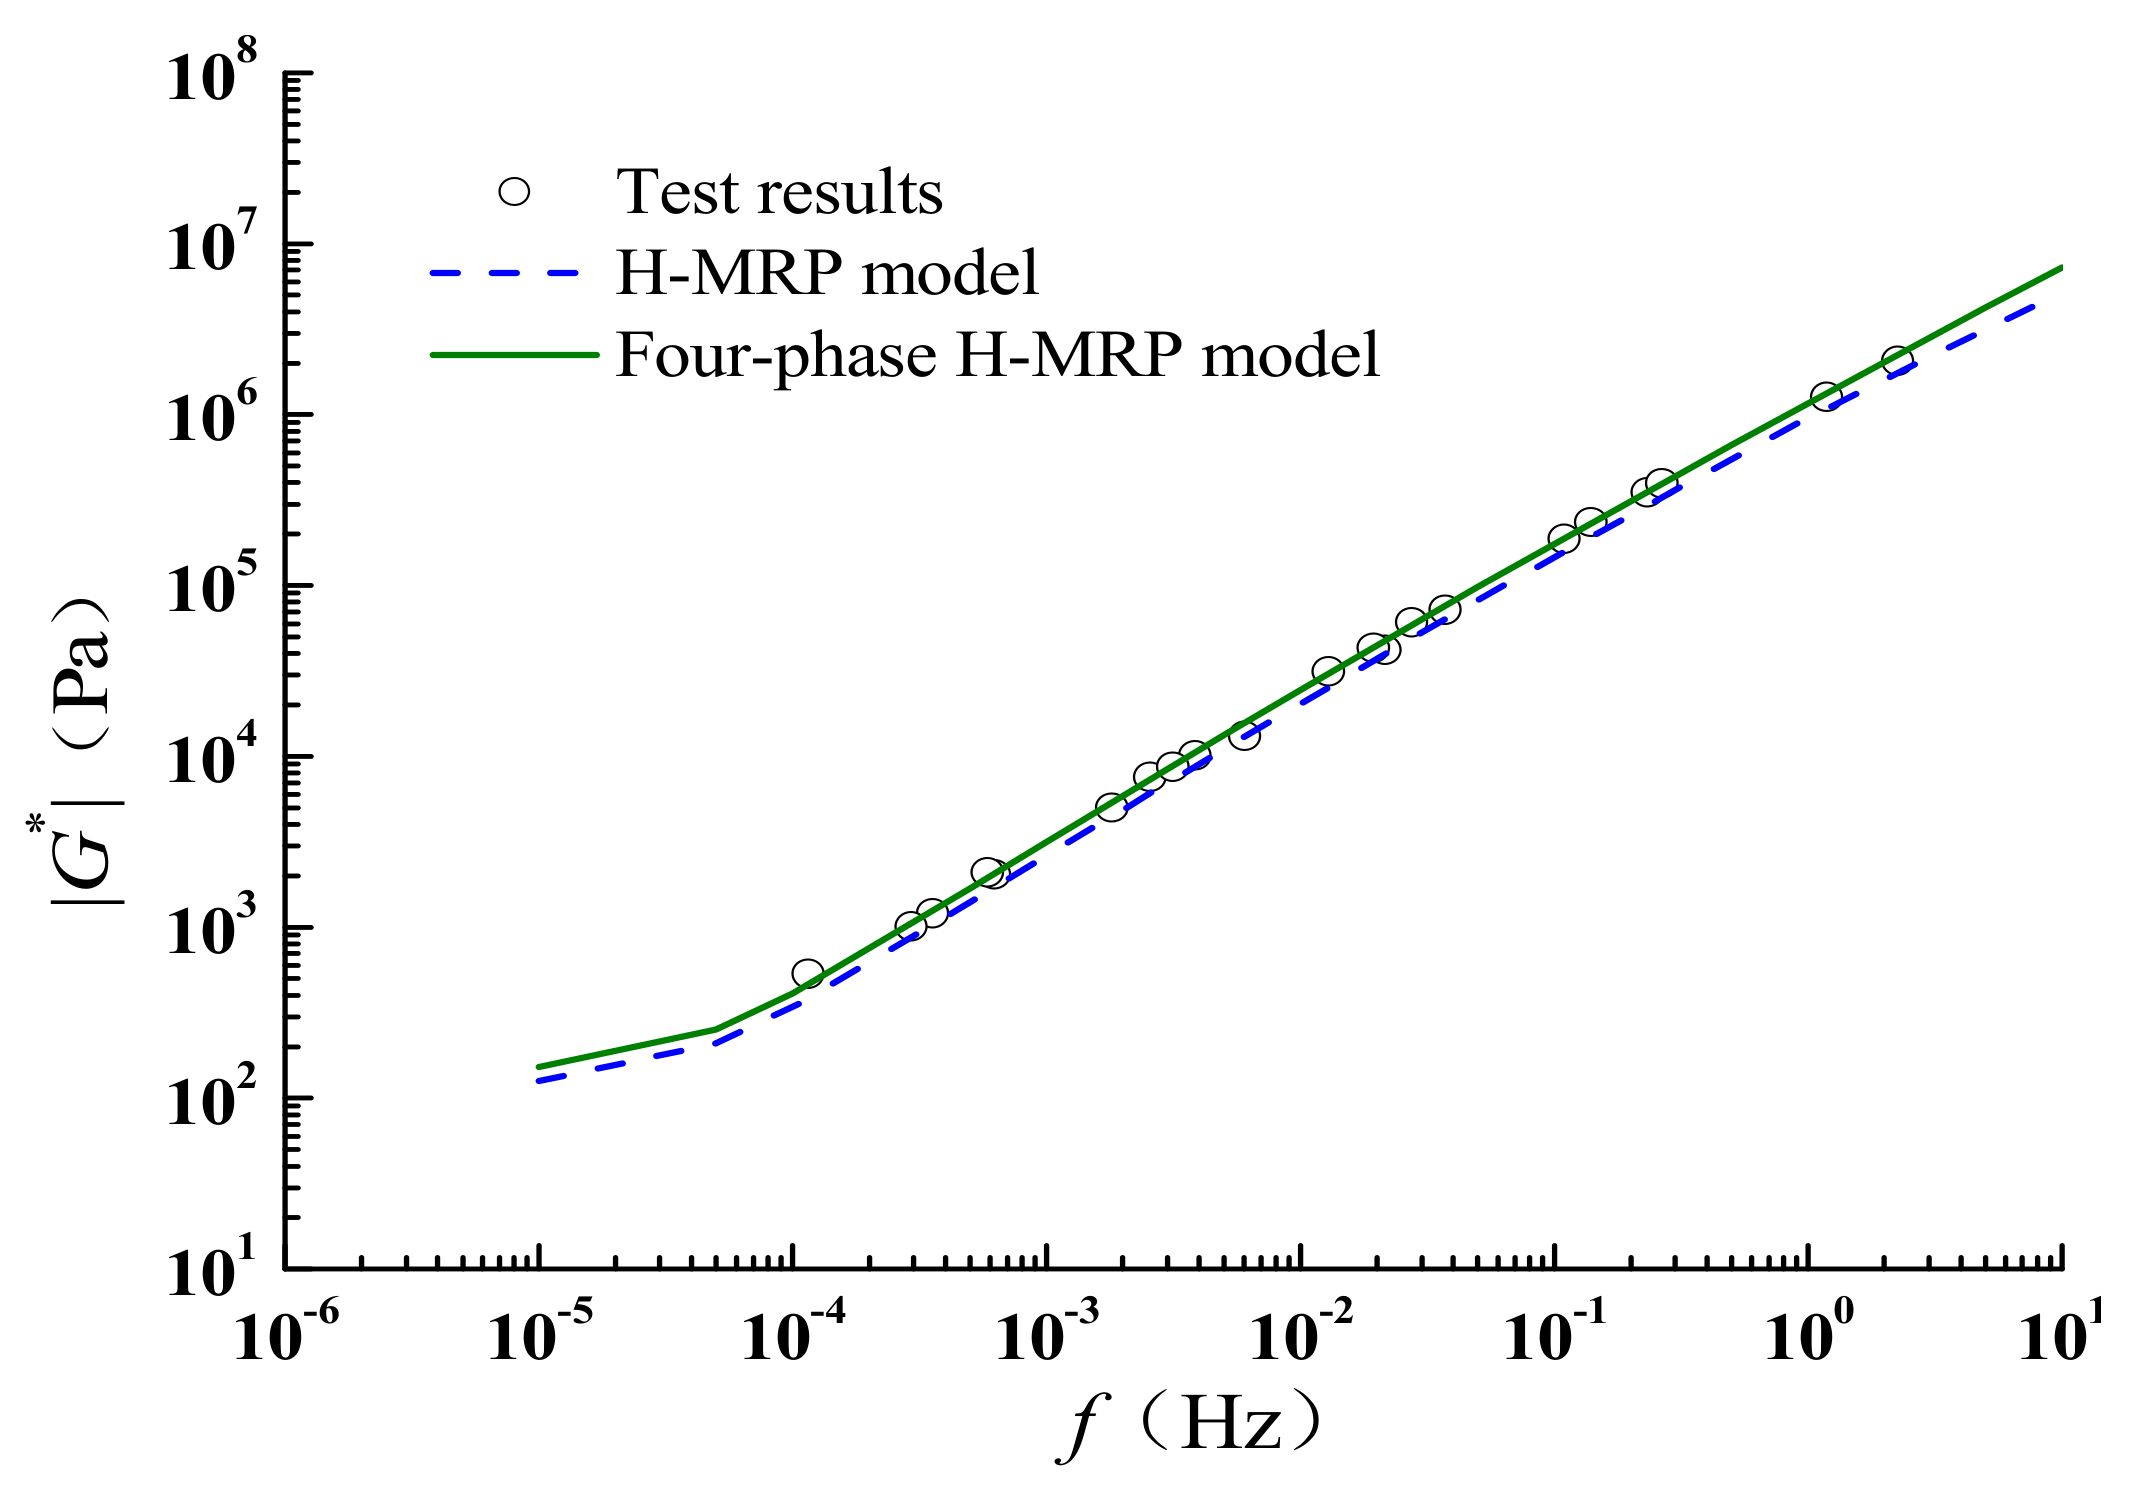
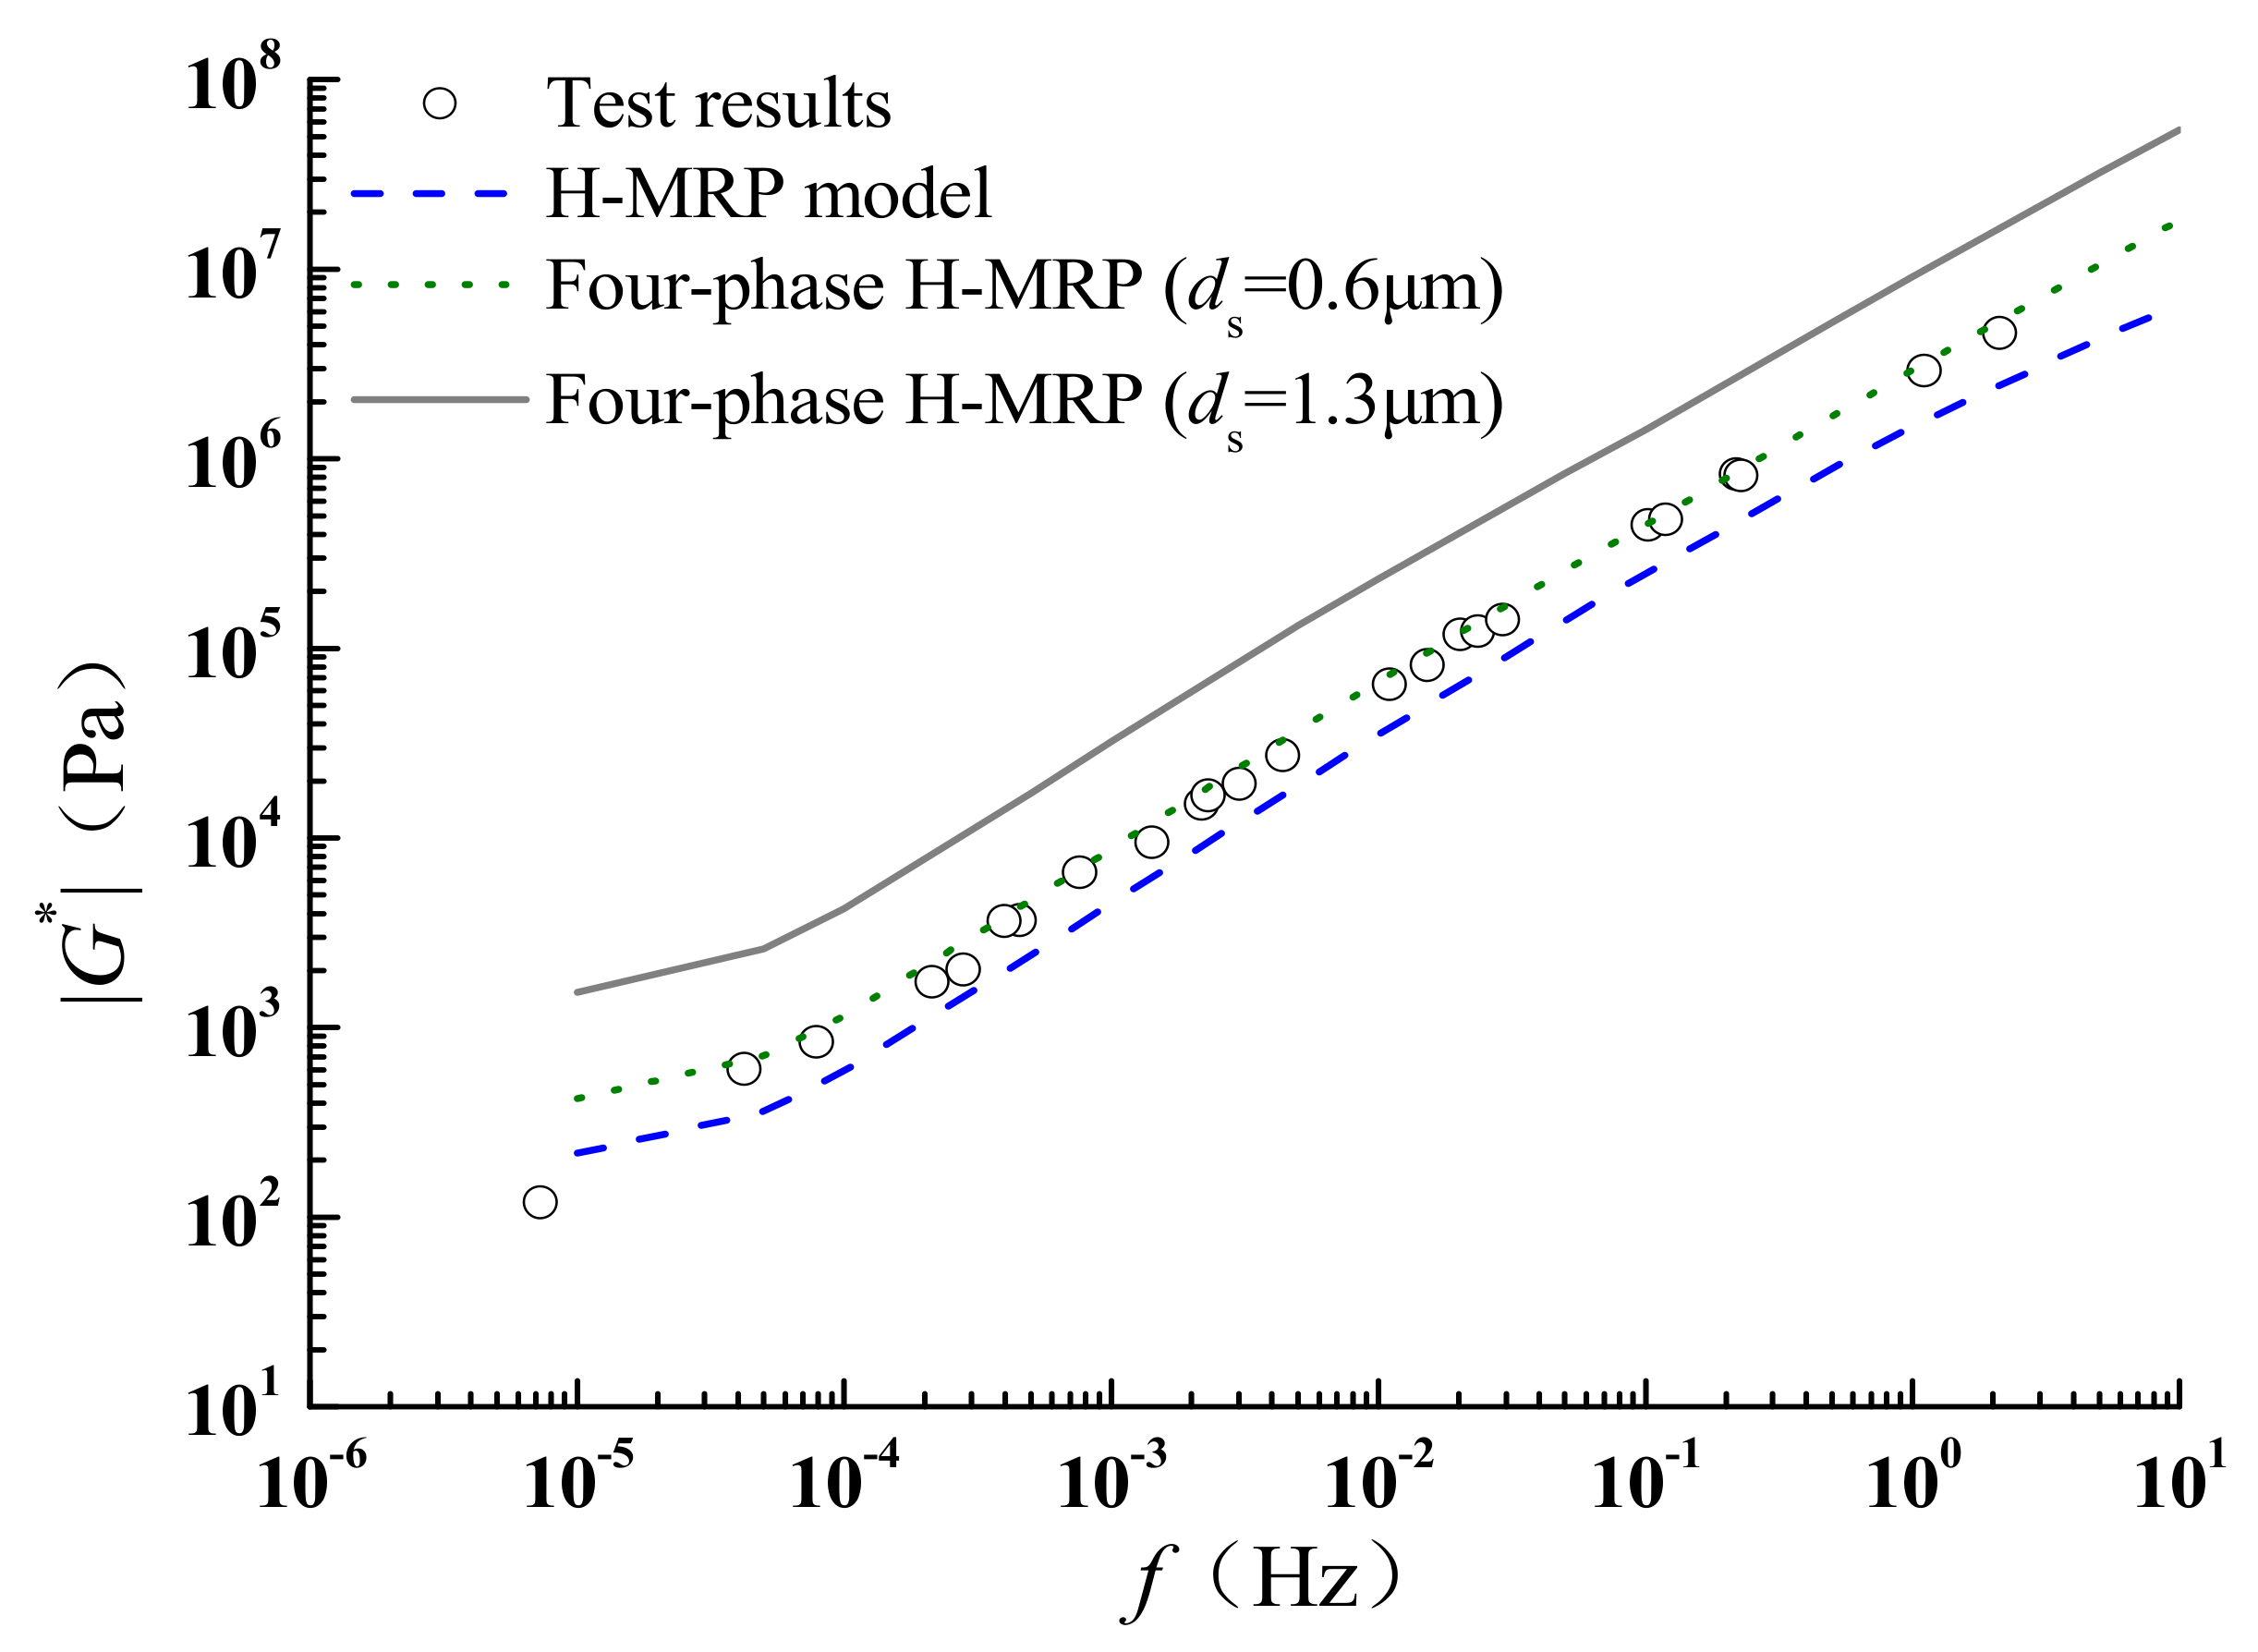
To verify the applicability of the four-phase H-MRP model in predicting the |G*| values of different types of asphalt mastics, the model was used to predict the |G*| values of FAM. The previous analysis shows that the interaction between fly ash and asphalt is weaker than that of limestone; namely, the thickness of the structural asphalt layer formed by fly ash and asphalt should be smaller than that of limestone, the thickness of the structural asphalt layer between fly ash and asphalt is ds = 0.18 μm.
The comparison results for the predicted values of four-phase H-MRP model and the predicted and experimental values of H-MRP model are shown in Figure 29. From Figure 29, it can be seen that the predicted value |G*| of FAM is close to the test value when ds = 0.18 μm. As the thickness of the structural asphalt layer increases, the predicted value of asphalt mastic |G*| should also increase, and if the structural asphalt layer and limestone asphalt mastic are taken to the same thickness value of ds = 0.54 μm, the predicted value will be higher than the test value. This verifies that, due to the difference in the ability of different types of mineral powders to interact with asphalt, different structural asphalt layer thicknesses will be produced.
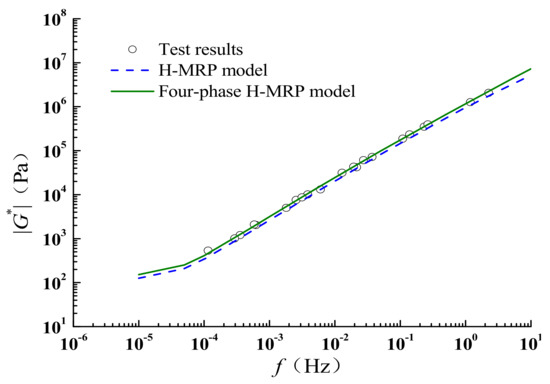
Figure 29.
Predicted results and test results of FAM (F/A = 0.4).
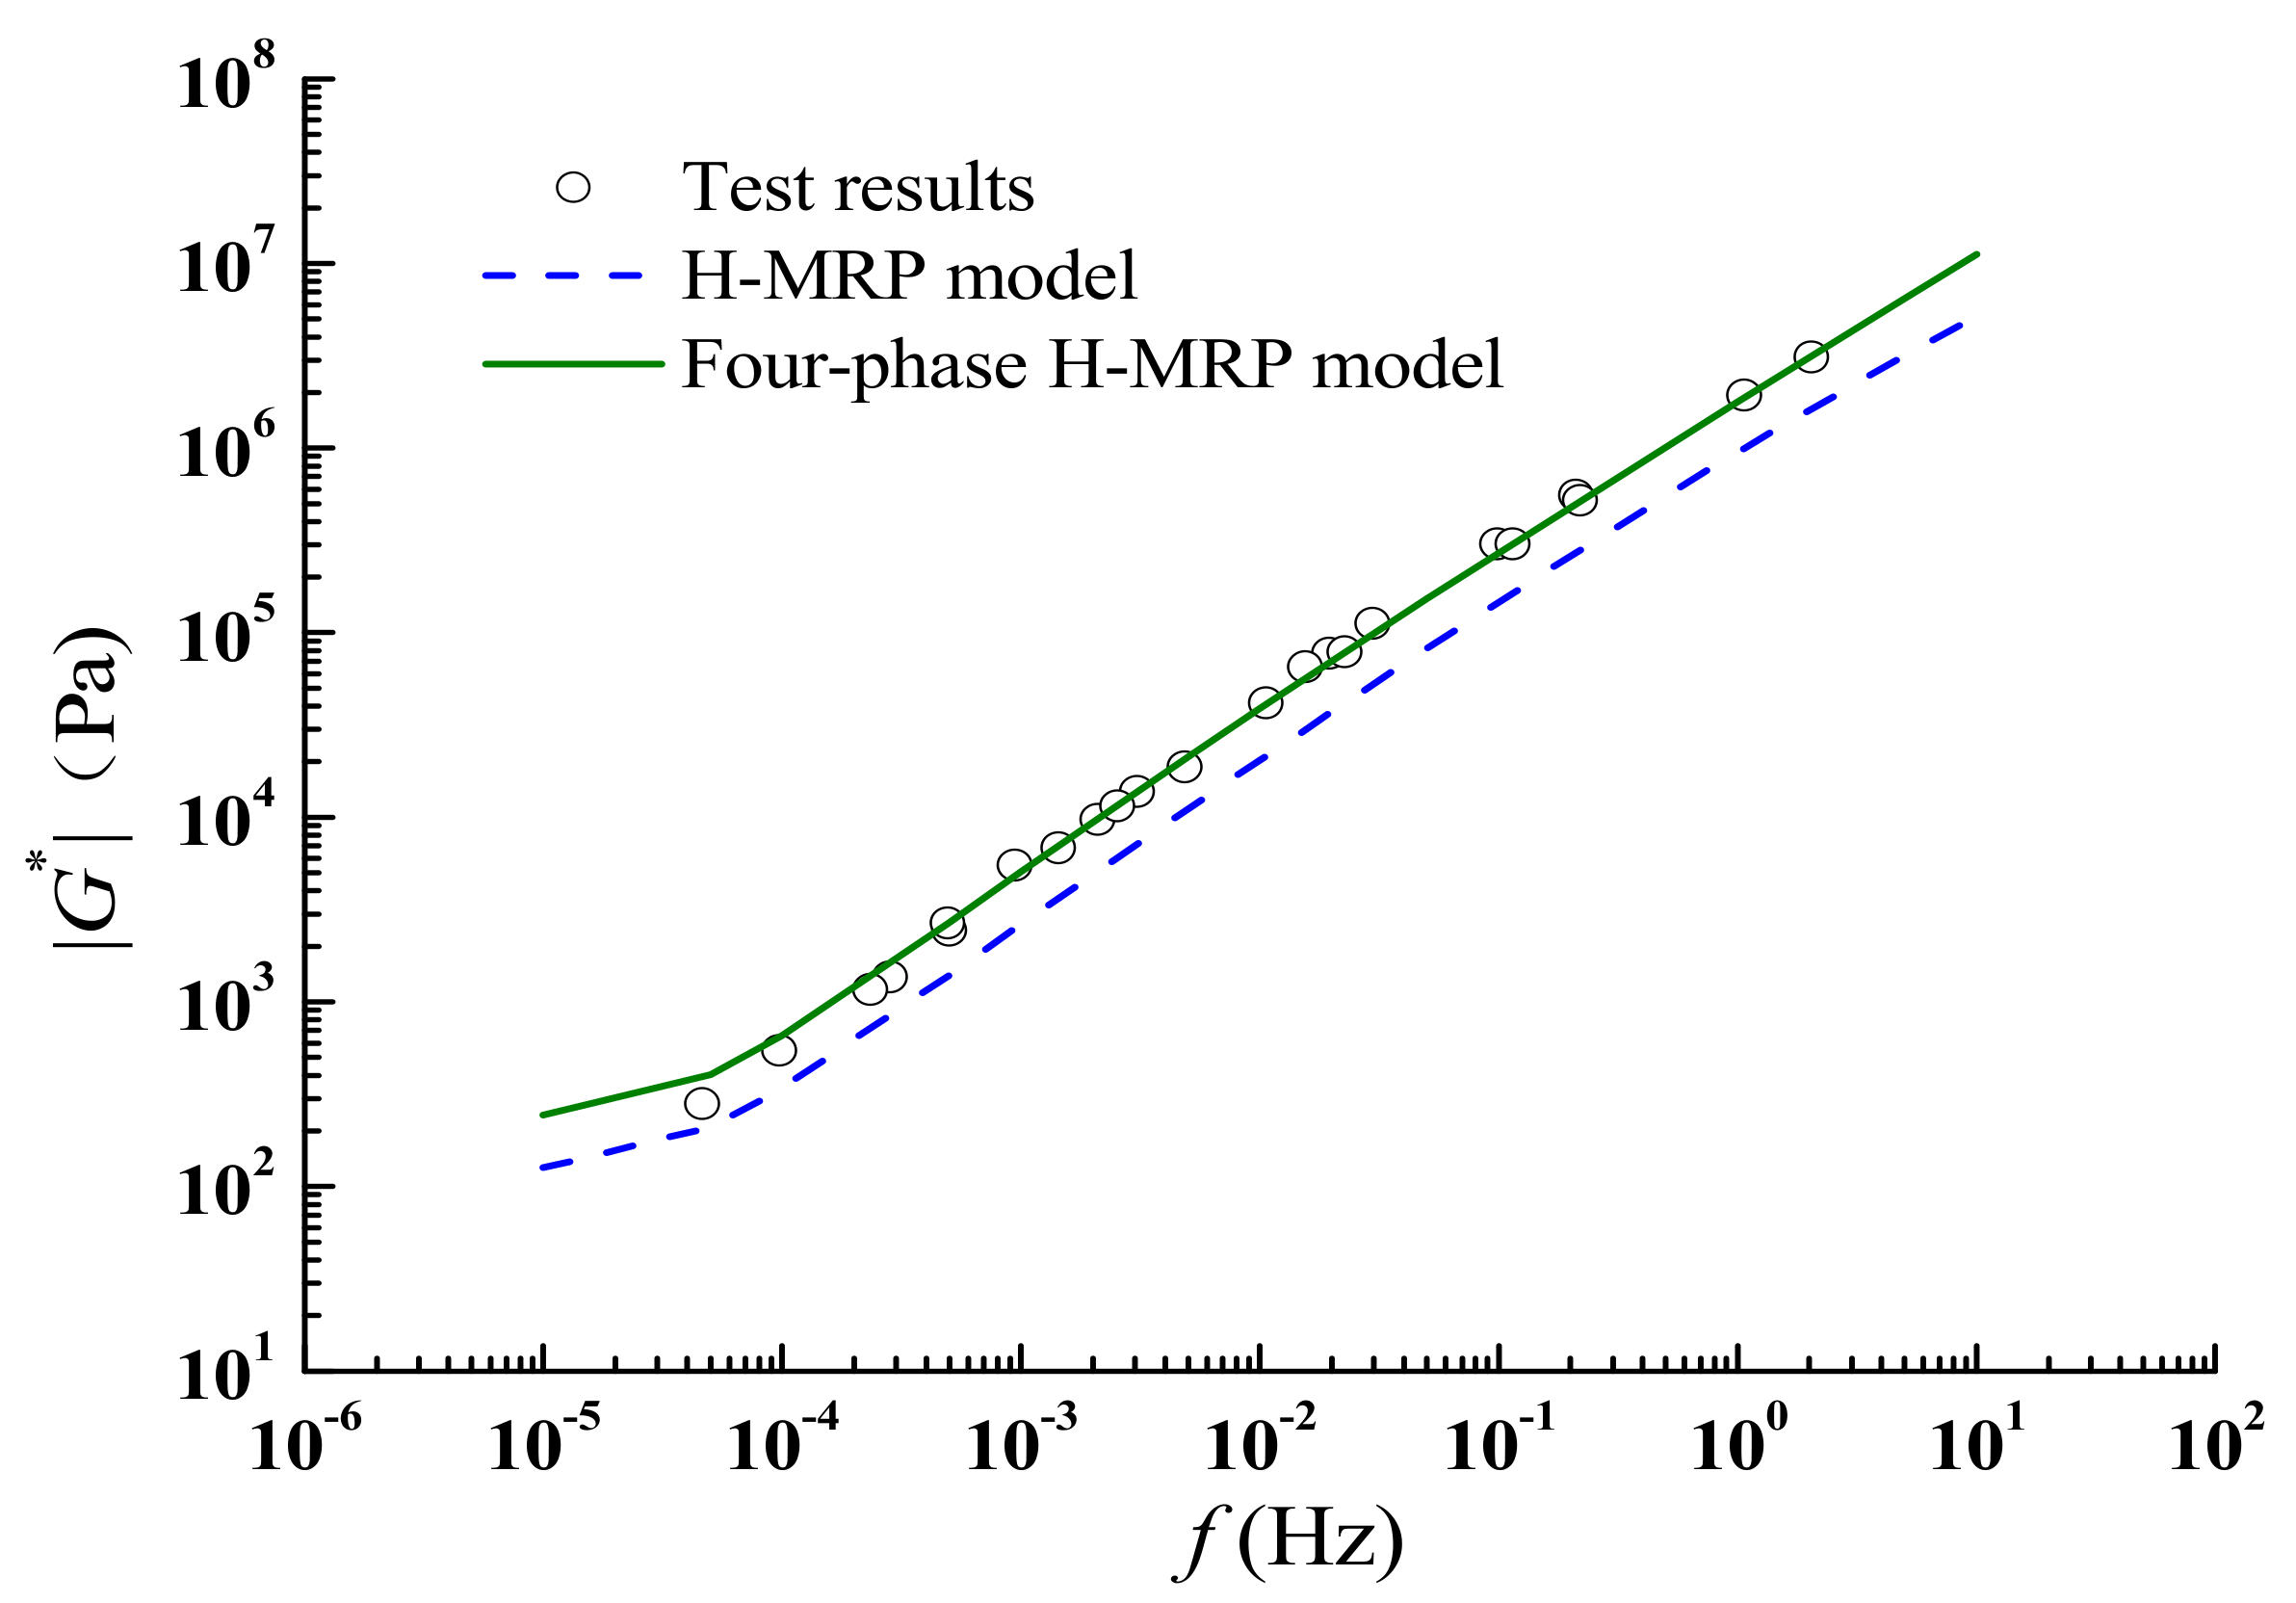
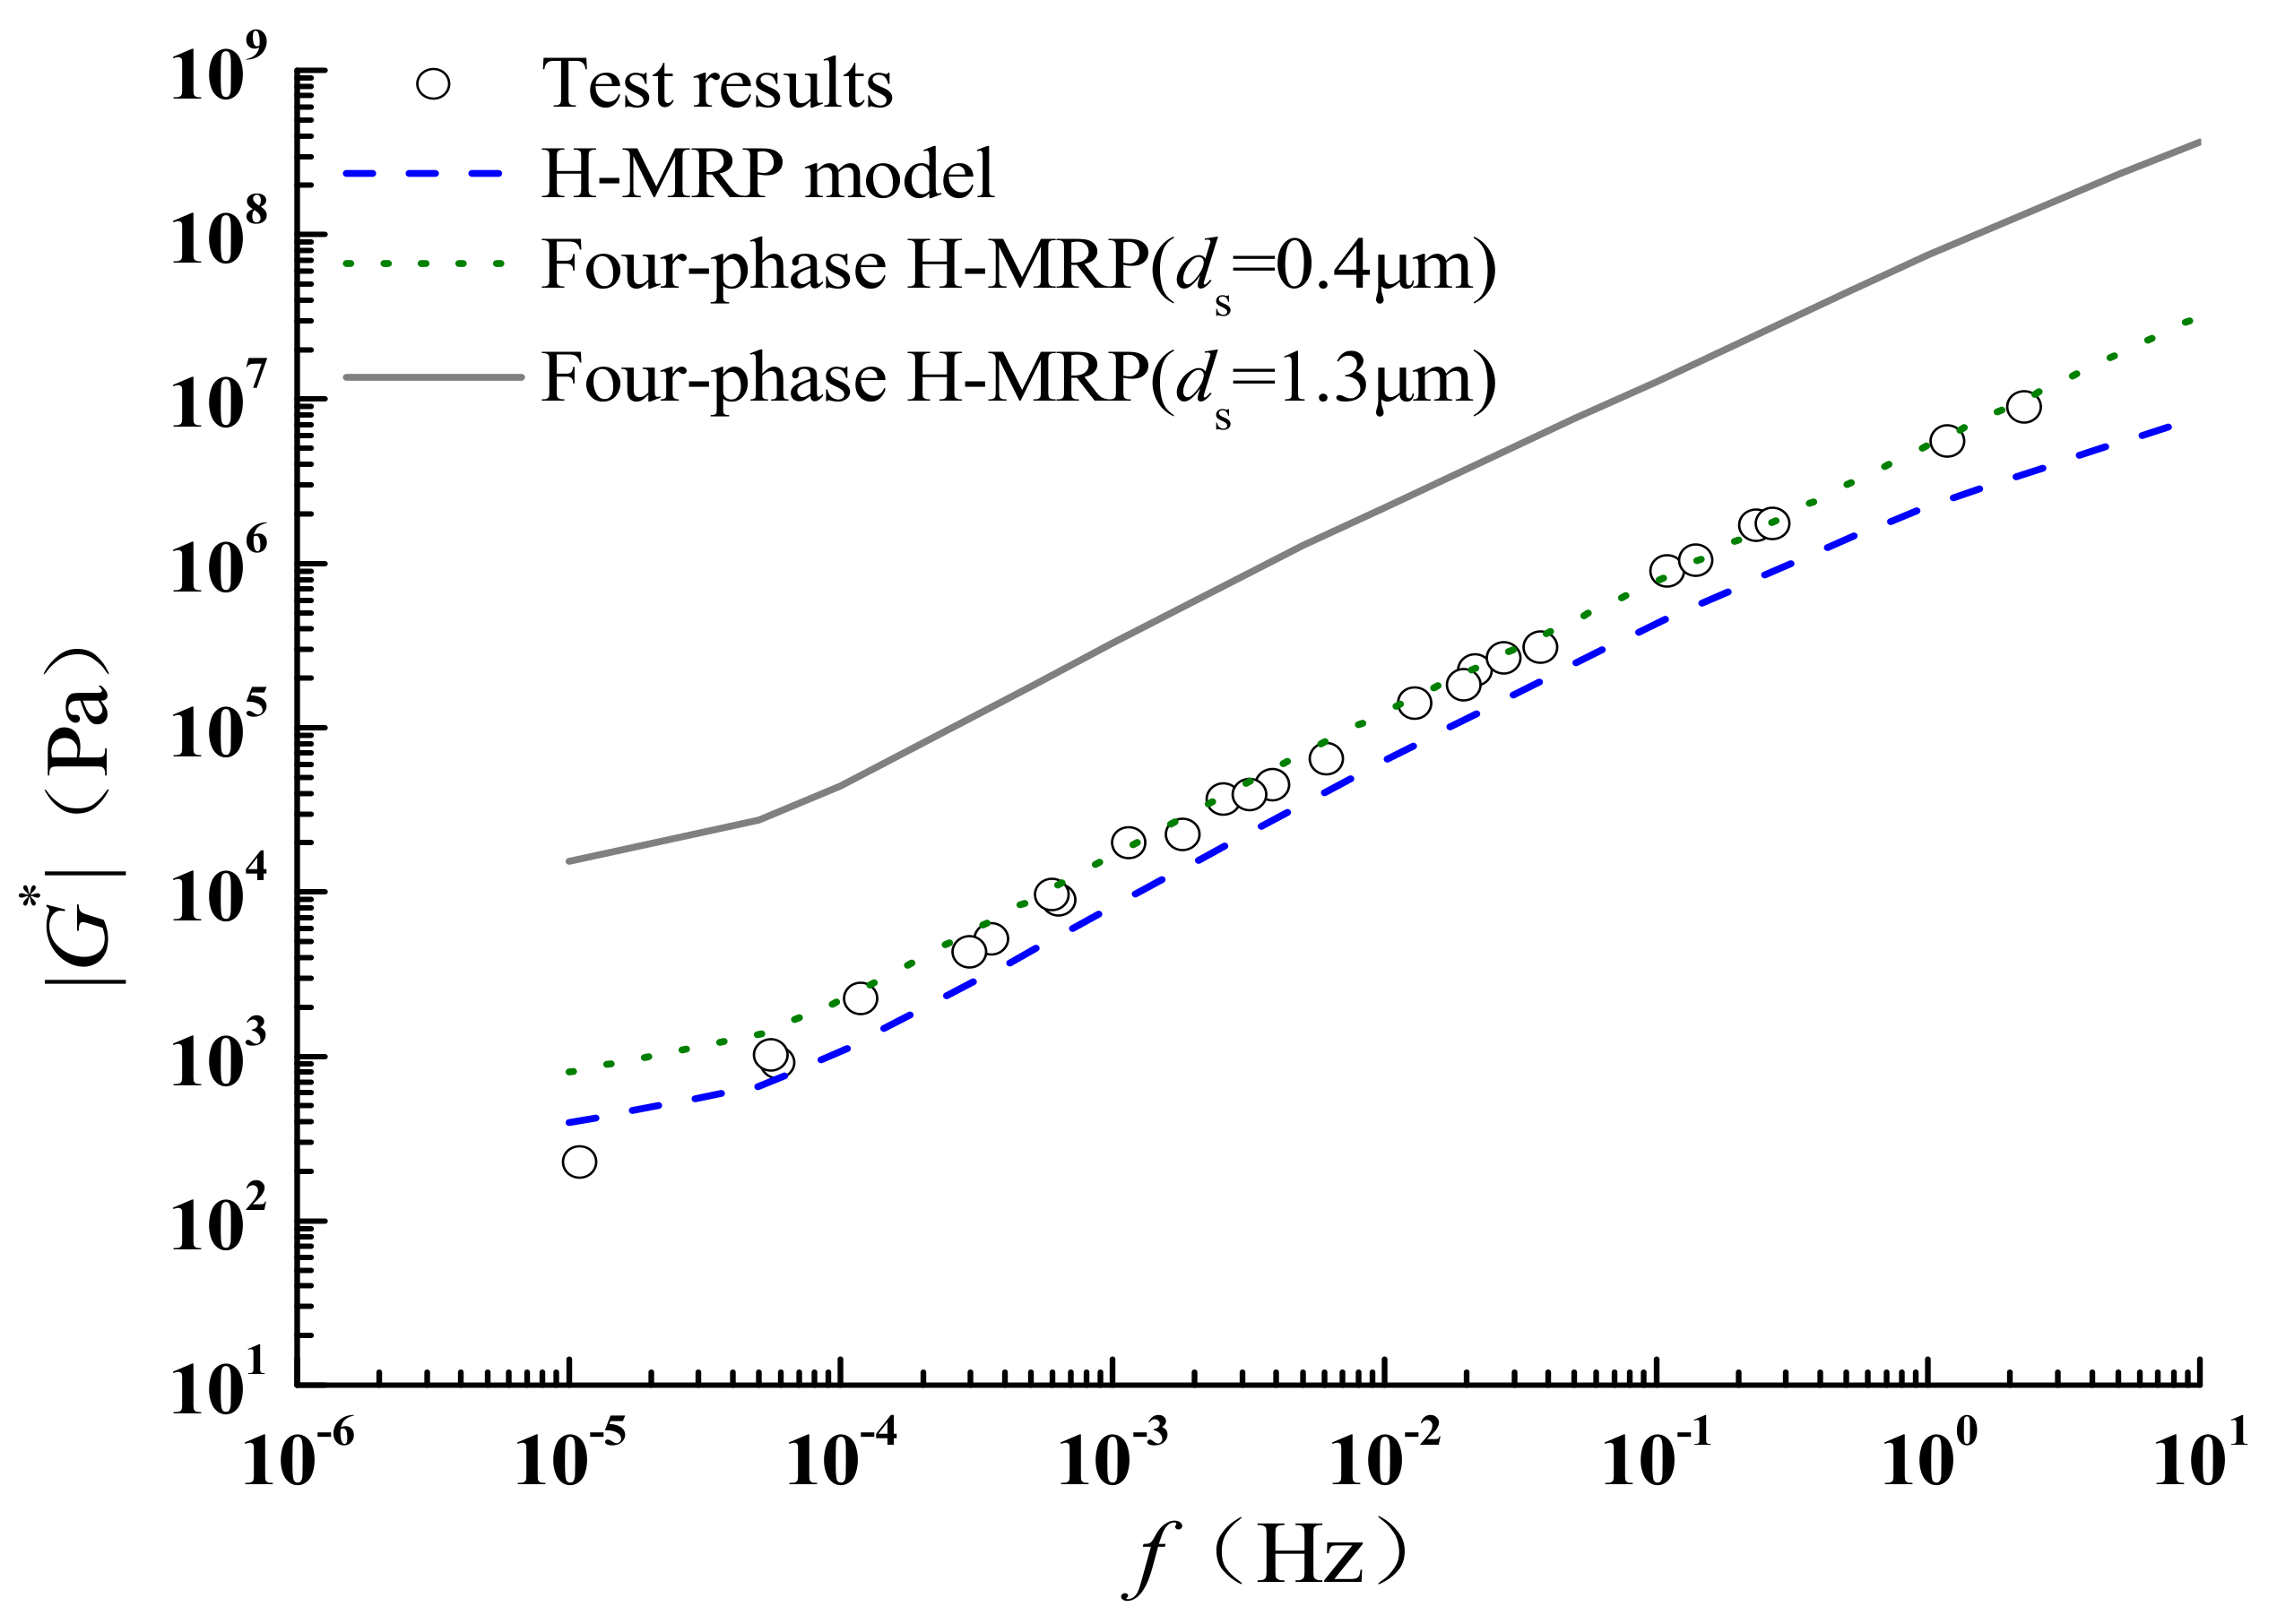
The four-phase H-MRP model is used to predict the |G*| of CAM. As, through the previous analysis, it was revealed the gangue and asphalt will have a strong interaction ability, and should have a thicker structural asphalt layer, it is assumed that the thickness of the interfacial structural layer between the coal gangue and asphalt ds = 1.30 μm. Figure 30 shows that when ds = 1.30 μm, the four-phase H-MRP model predictions are consistent with the test values.
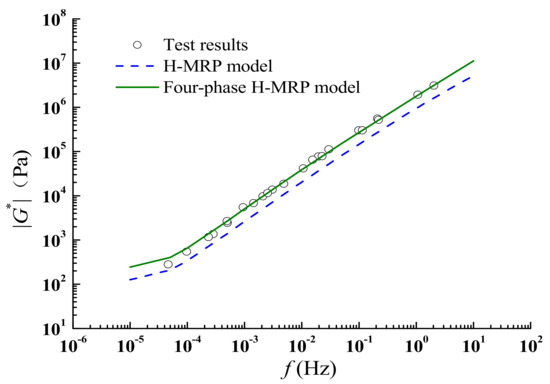
Figure 30.
Predicted results and test results of CAM (F/A = 0.4).
When the F/A of CAM is 0.8, with the same degree of adsorption as the F/A = 0.4, the thickness of the structural asphalt layer should also be ds = 1.3 μm. However, it can be seen from the previous analysis that with the incorporation of mineral powder, it is difficult for the mineral powder to completely adsorb the structural asphalt, resulting in a decrease in the thickness of the structural asphalt layer; therefore, it is assumed that the thickness of the structural asphalt layer decreases to ds = 0.6 μm for analysis. Figure 31 shows that when the thickness of structural asphalt layer decreases from 1.3 μm to 0.6 μm, the predicted value is close to the test value.
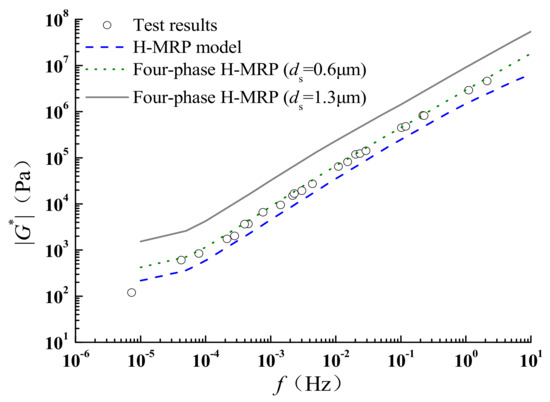
Figure 31.
Predicted results and test results of CAM (F/A = 0.8).
When the mineral powder content continues to increase, the thickness of the structural asphalt layer should continue to decrease; when the F/A of CAM is 1.2, suppose that ds = 0.4 μm, and compare this with the predicted results when ds = 1.3 μm. The result is shown in Figure 32: when ds = 0.4 μm, the predicted value is close to the experimental value, indicating that the hypothesis of the reduction in the thickness of the structural asphalt layer is reasonable. When ds = 1.3 μm is still used, the predicted value is significantly higher than the experimental value.
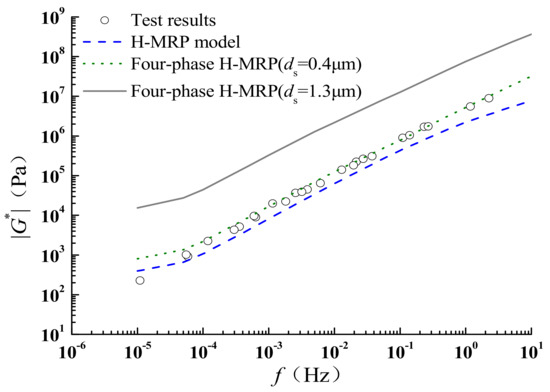
Figure 32.
Predicted results and test results of CAM (F/A = 1.2).
4.5. Prediction of TPU-Modified Asphalt Mastic based on Four-Phase H-MRP Model
The TPU-modified asphalt mastic is considered a composite material, consisting of TPU-modified asphalt and mineral powder. The four-phase H-MRP model can be used to predict the |G*| value of limestone TPU-modified asphalt mastic (LTAM). Since TPU-modified asphalt’s ability to interact with mineral powder is weaker than that of base asphalt, the thickness of the structural asphalt layer formed with the mineral powder should also be smaller than the base asphalt; hence, it is assumed that the thickness of the structural asphalt layer formed by TPU-modified asphalt and limestone is 0.1 μm, and the predicted results are shown in Figure 33.

Figure 33.
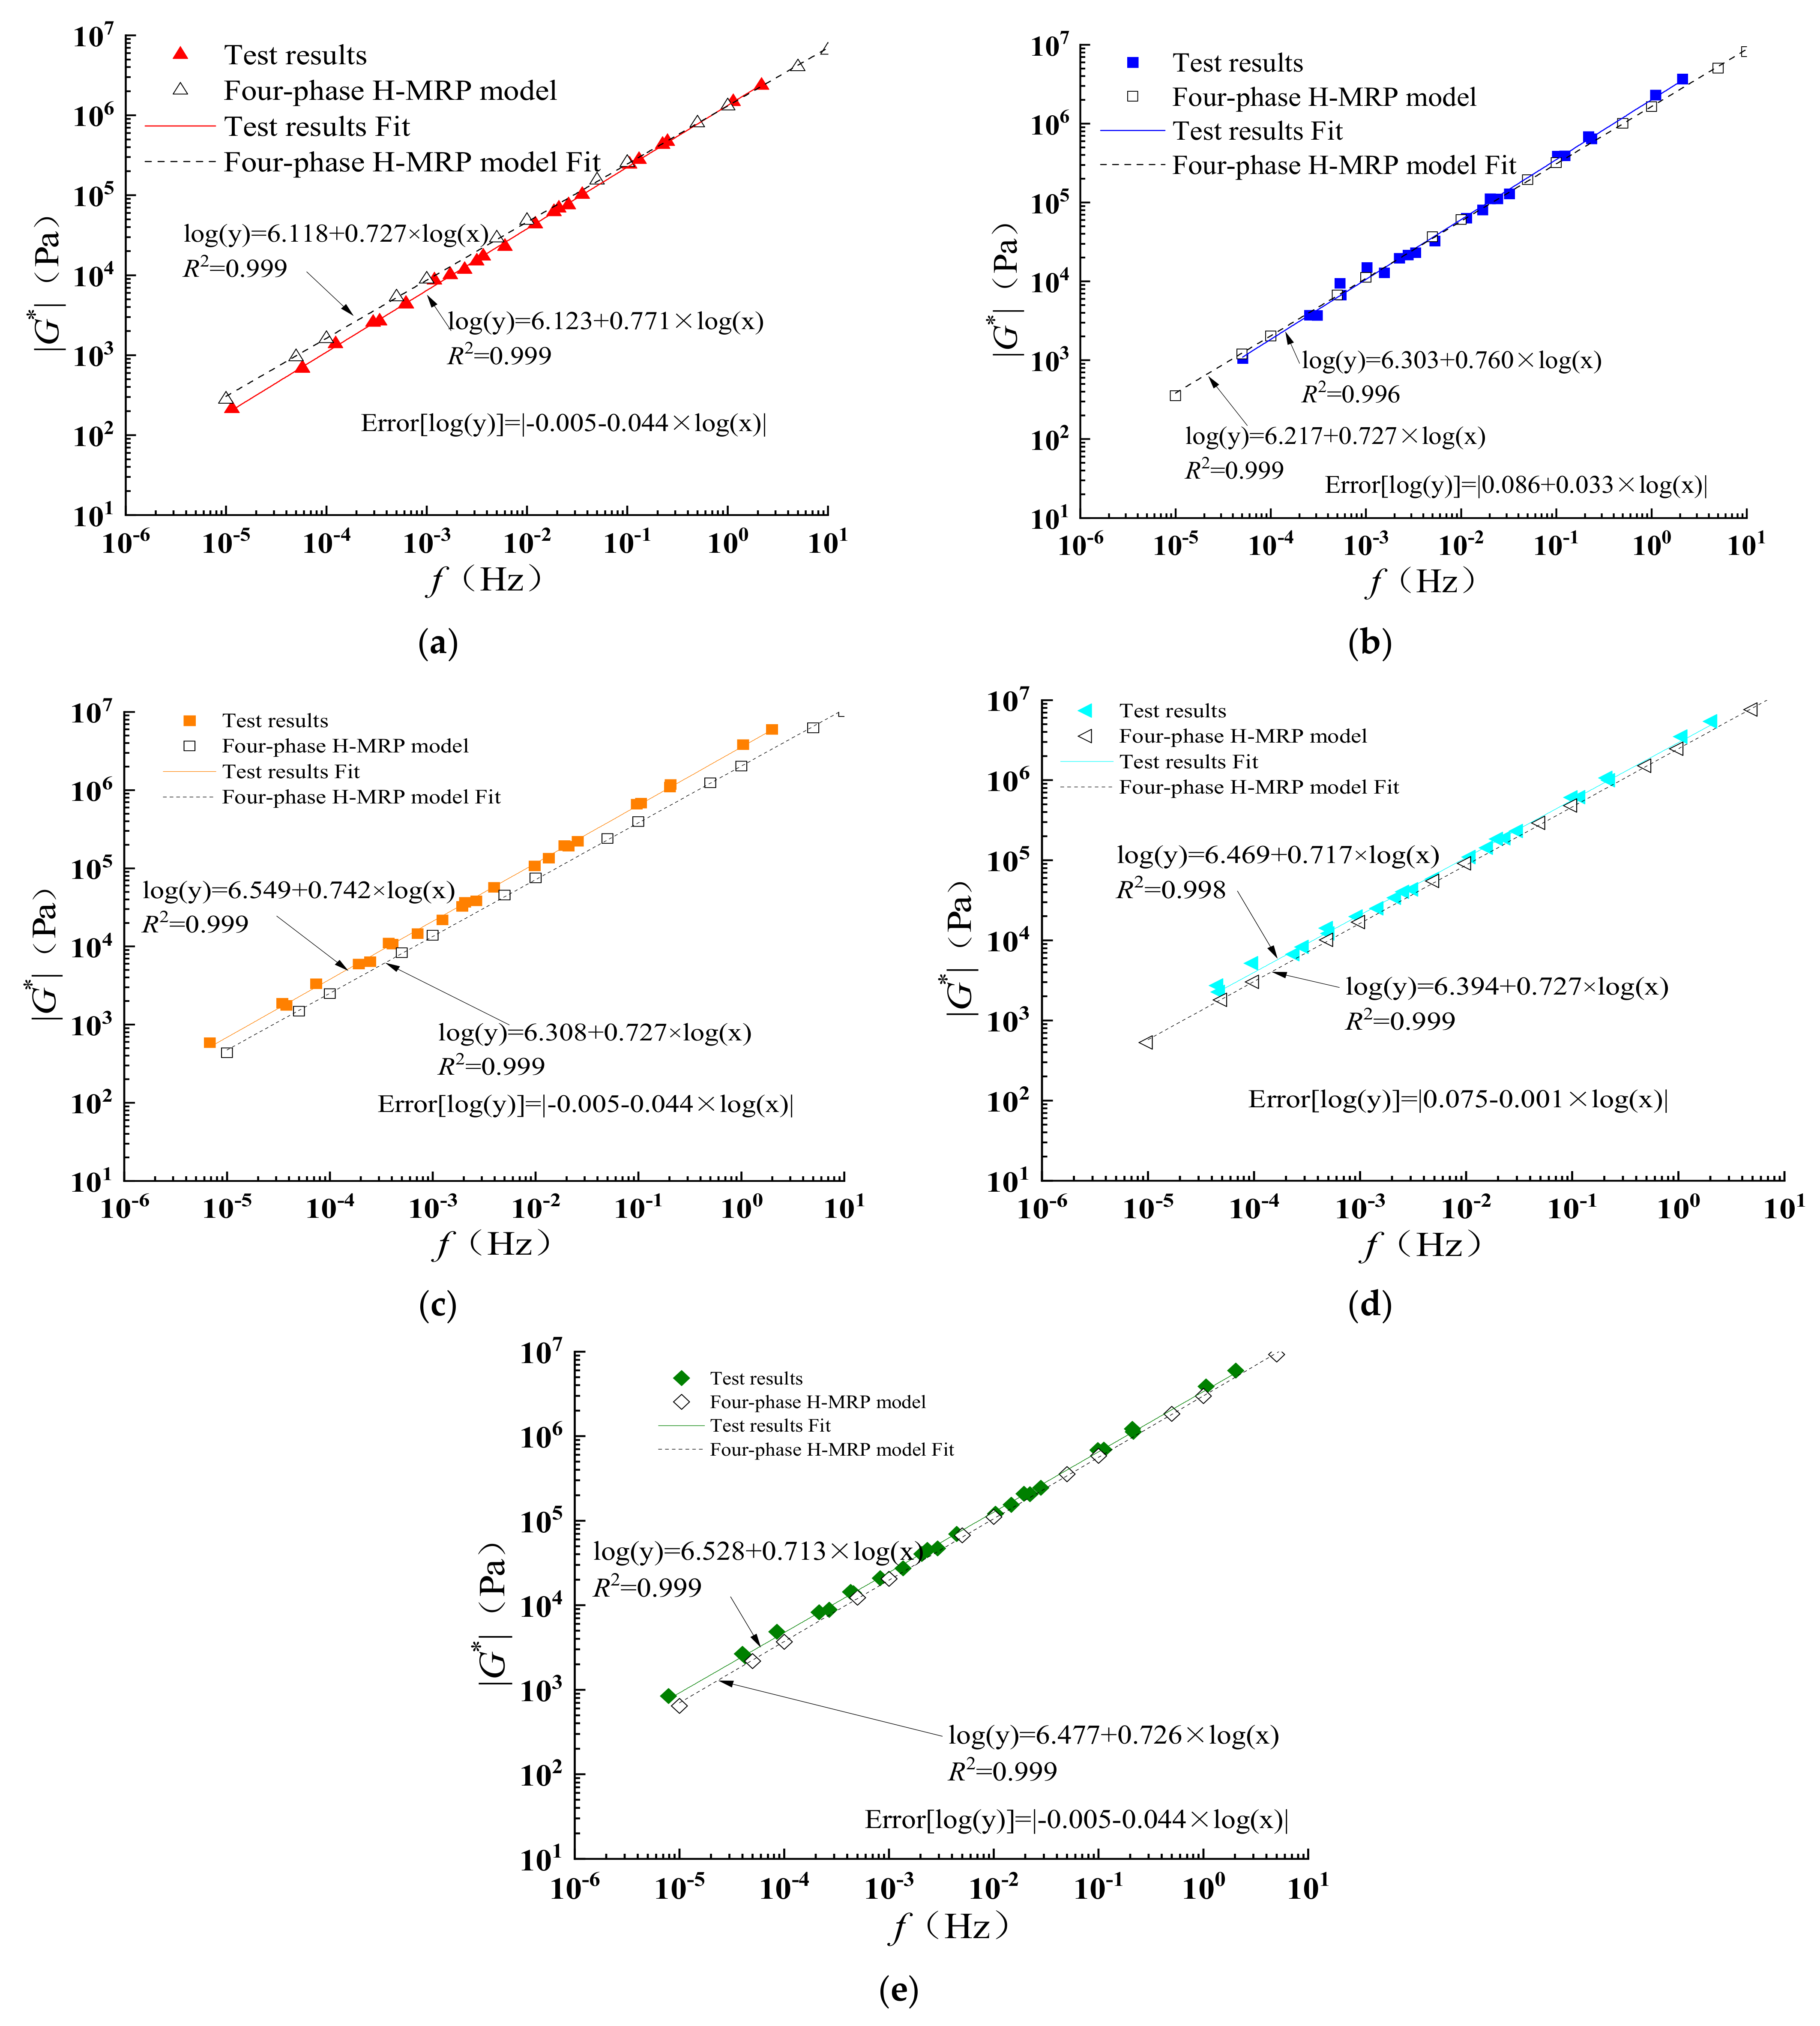
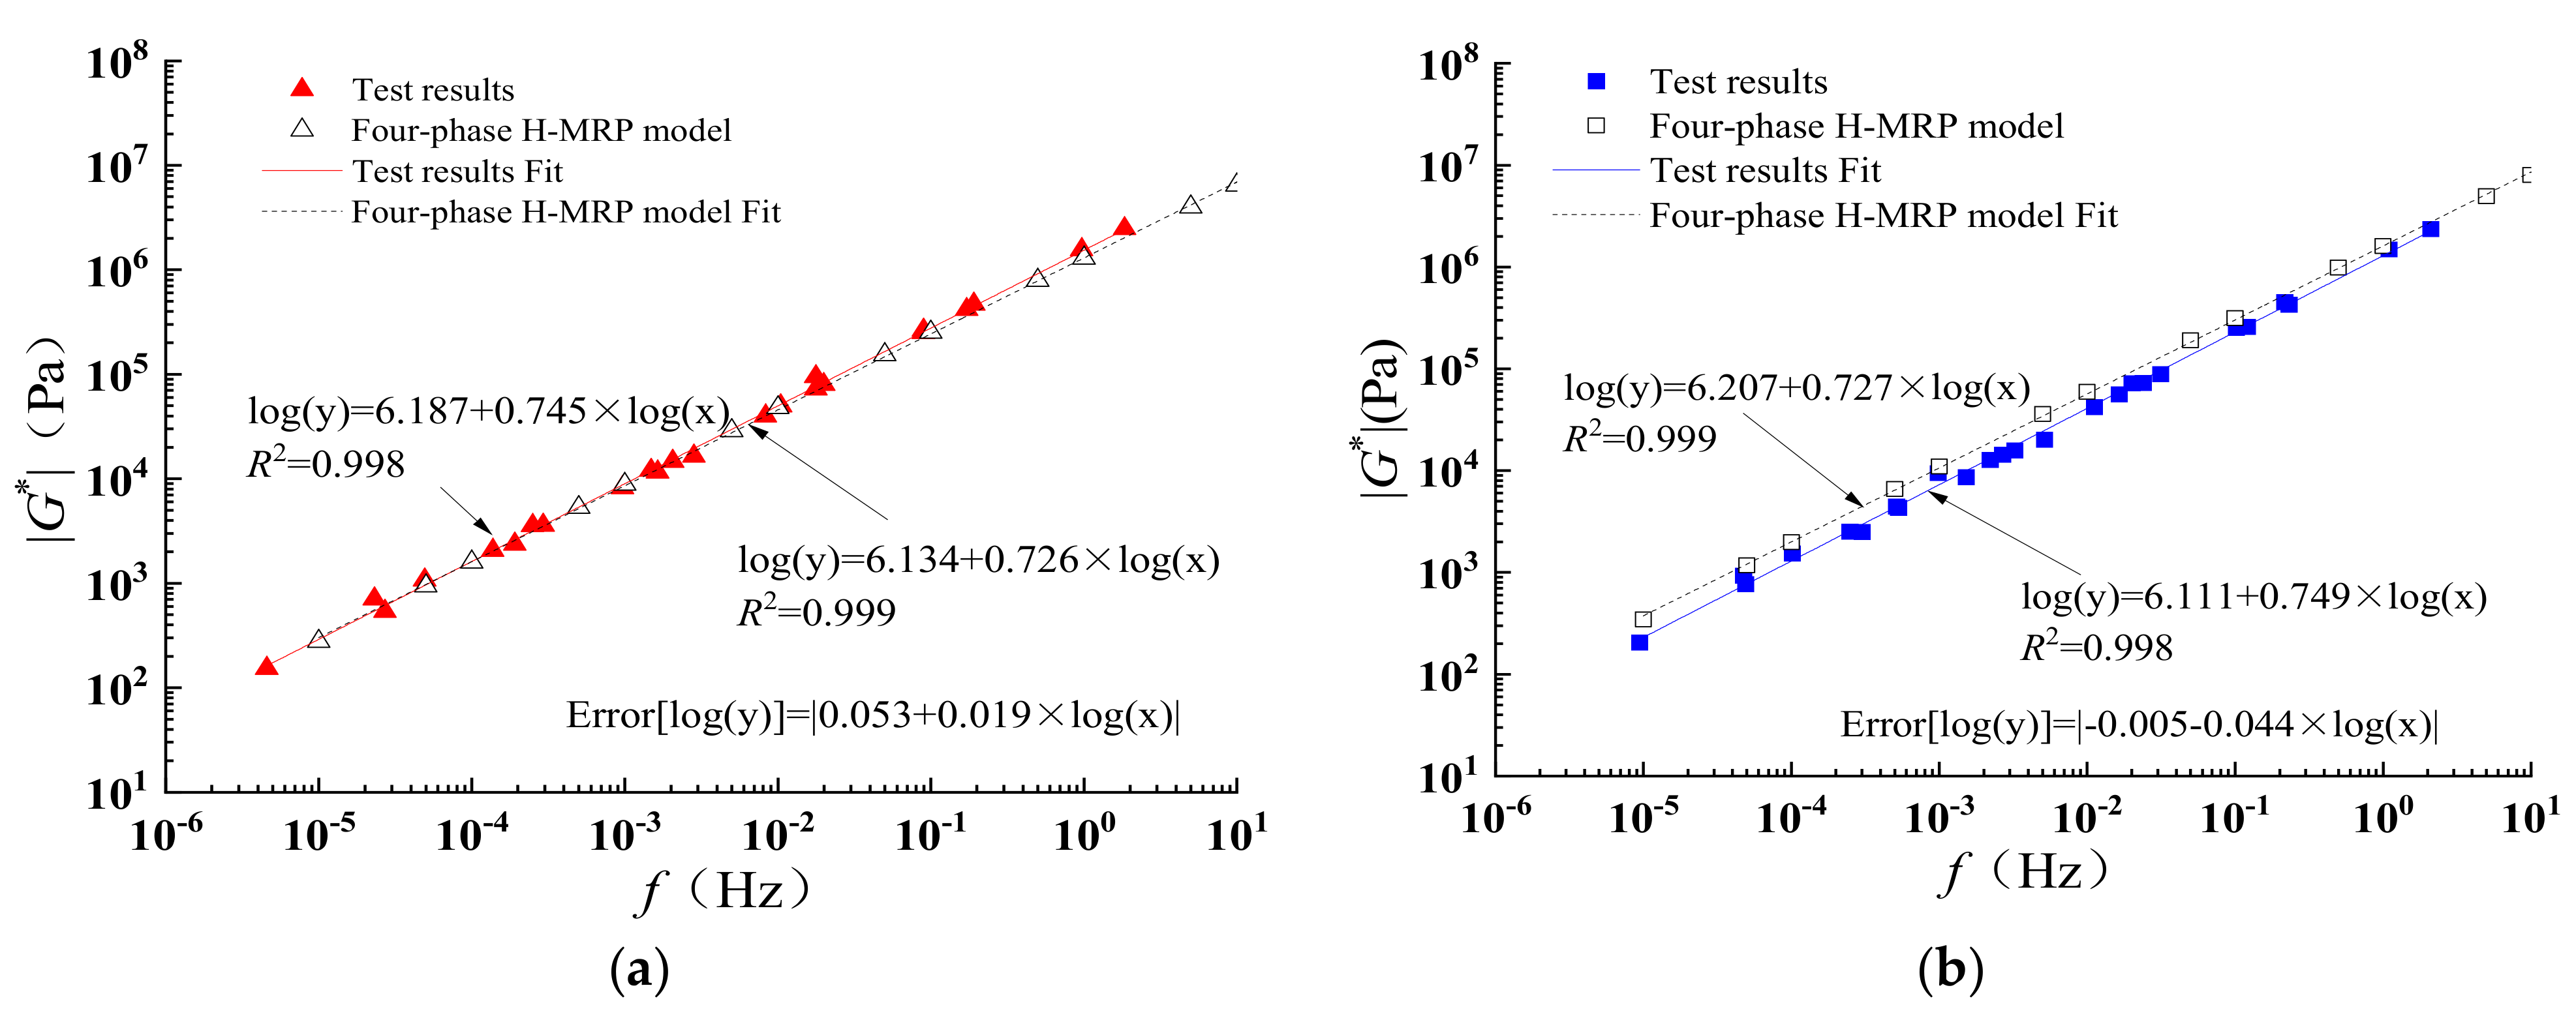
Prediction results of LTAM. (a) F/A = 0.4. (b) F/A = 0.8. (c) F/A = 1.2. (d) F/A = 1.6. (e) F/A = 2.0.
As can be seen from Figure 33, the predicted values of |G*| for LTAM obtained using the four-phase H-MRP model are closer to the experimental values, and the four-phase H-MRP model also achieves better predictions while the F/A is 1.6 and 2.0, and is not affected by the contact effect of mineral powder particles, which is due to the high modulus of the TPU-modified asphalt. The |G*| value of LTAM is mainly influenced by the |G*| value of TPU-modified asphalt, and the contact effect between mineral powders is weakened. Therefore, the four-phase H-MRP model is better for TPU-modified asphalt mastics than the base asphalt mastics.
The two fitting functions were subtracted to obtain the error function. Then, the Error[log(x)] was taken from 10−5 to 101. The average value was taken as the prediction error, where Eror (Average) = (Error[log(10−5)] + Error[log(10−4)] + Error[log(10−3)] + Error[log(10−2)] + Error[log(10−1) + Error[log(101)]]/6. Table 7 was obtained, and Error (average) can be used to compare prediction errors. When F/A = 1.2 or 2.0, the error of the prediction model is minimum, and when F/A = 1.6, the error of the prediction model is maximum.
Table 7.
Error function of LTAM.
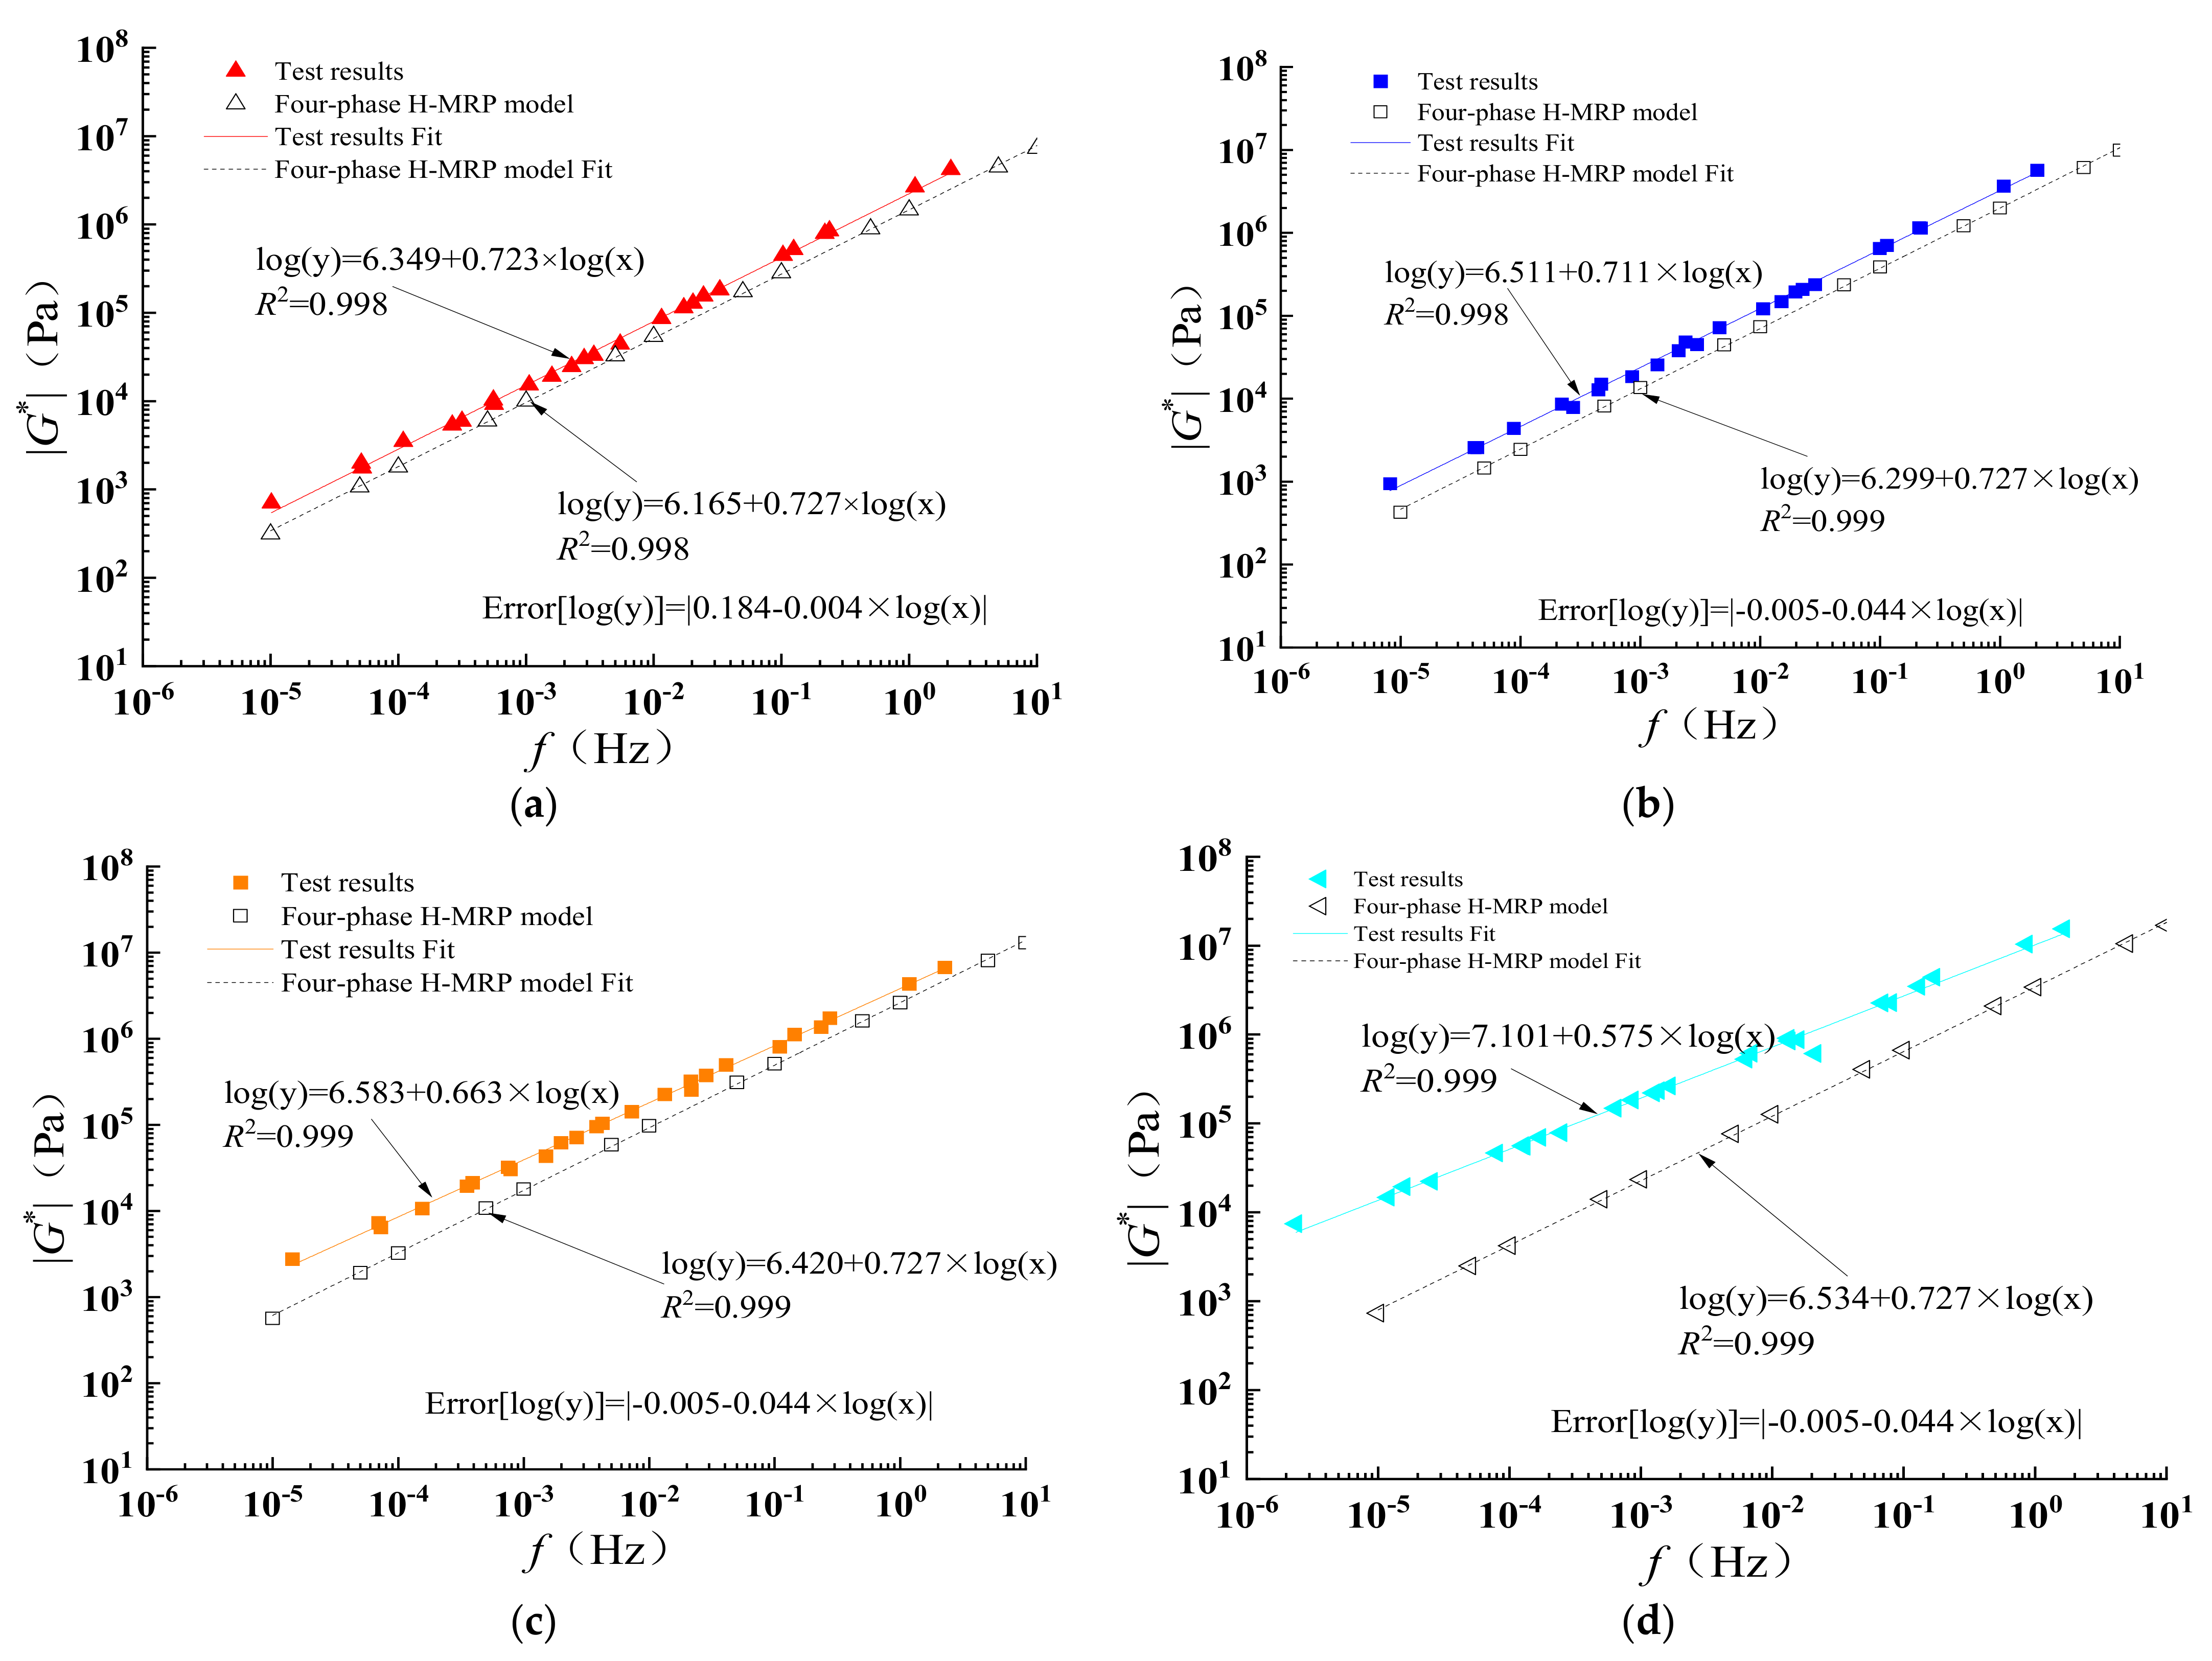
The four-phase H-MRP model was used to predict the |G*| value of granite TPU-modified asphalt mastic (GTAM): the interaction ability of granite and TPU-modified asphalt is weaker than that of limestone, and the thickness of the structural asphalt layer formed with the granite should be smaller than that of limestone. Hence, the thickness of the structural asphalt layer formed by TPU-modified asphalt and granite was assumed to be 0.05 μm. Figure 34 shows that the predicted value of |G*| for GTAM is closer to the experimental value, and the predicted value is lower than the experimental value, with F/A = 2.0, the contact between the mineral powder was not considered in the model.
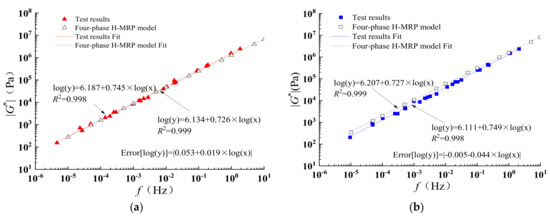

Figure 34.
Prediction results of GTAM. (a) F/A = 0.4. (b) F/A = 0.8. (c) F/A = 1.2. (d) F/A = 1.6. (e) F/A = 2.0.
Table 8 was obtained, and the Error (average) can be used to compare prediction errors. When F/A = 0.4, the error of the prediction model is minimum, and when F/A = 2.0, the error of the prediction model is maximum.
Table 8.
Error function of GTAM.
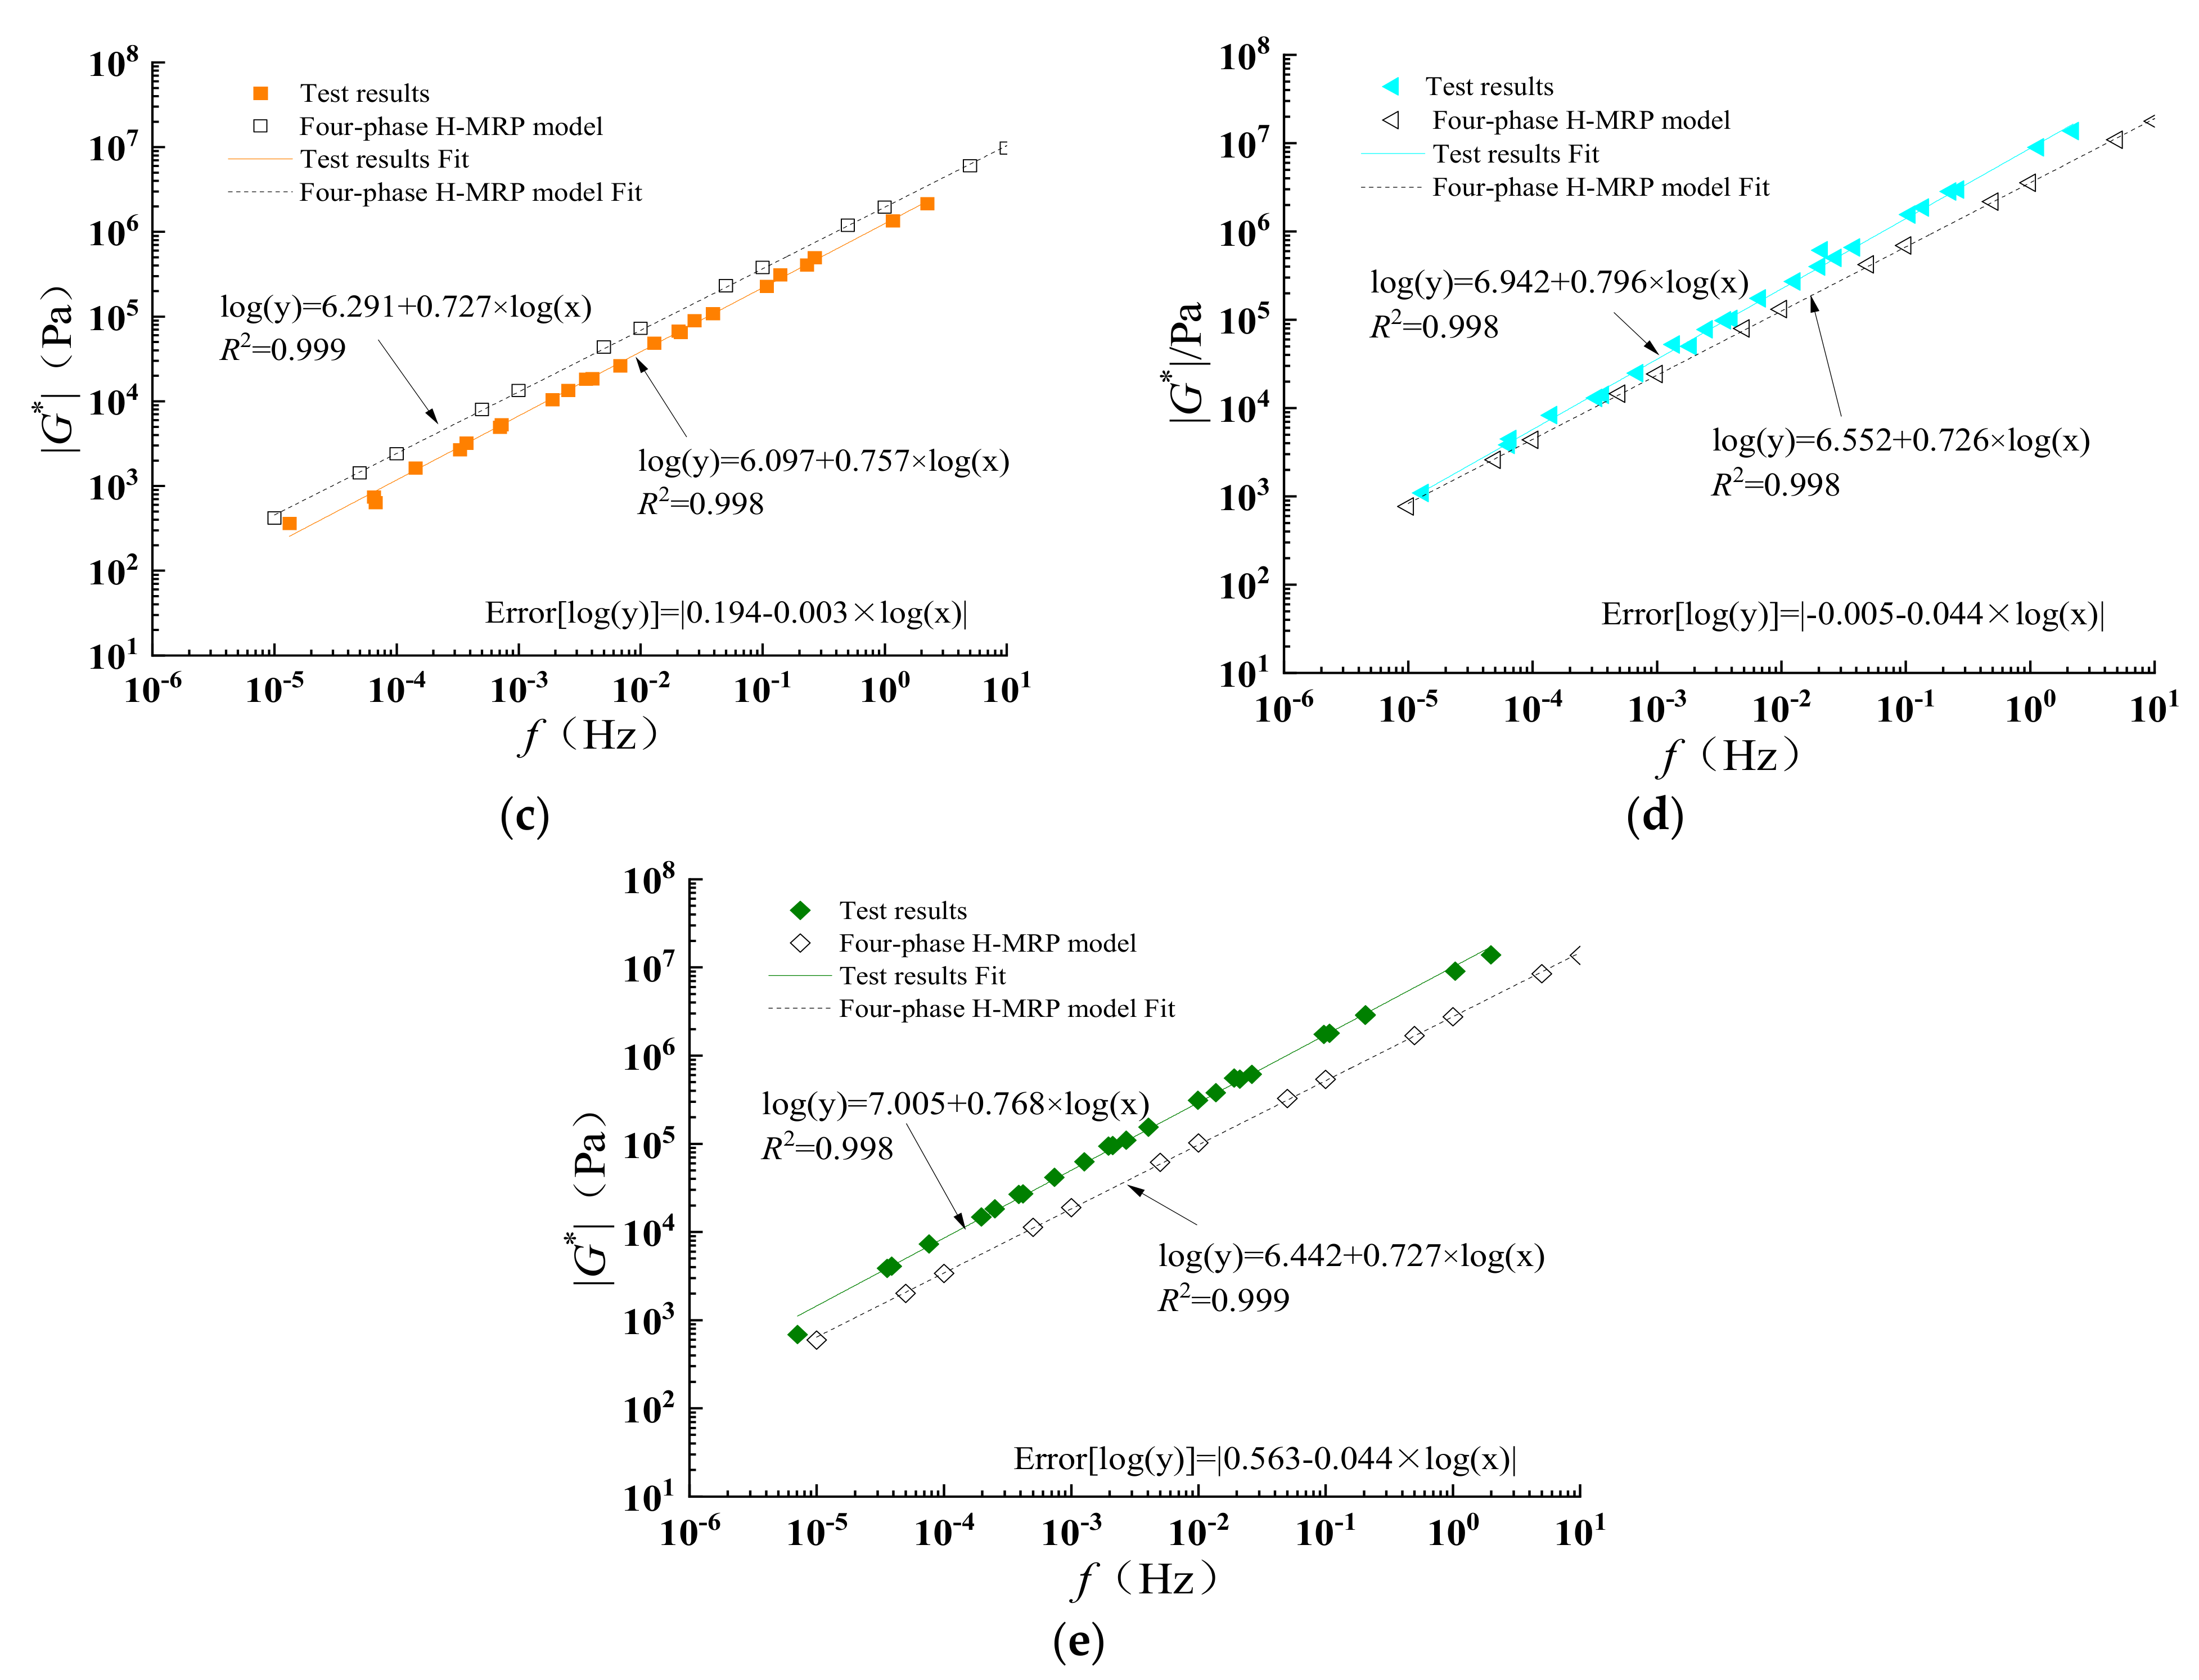
A four-phase H-MRP model was used to predict the |G*| of fly ash TPU-modified asphalt mastic (FTAM): the interaction ability of fly ash and TPU-modified asphalt is similar to that of limestone, and the thickness of the structural asphalt layer formed by TPU-modified asphalt and granite is assumed to be 0.1 μm. The predicted results are shown in Figure 35. The predicted value is closer to the experimental value, and the predicted value is lower than the experimental value when the F/A = 2.0, due to the contact effect between the mineral powders.
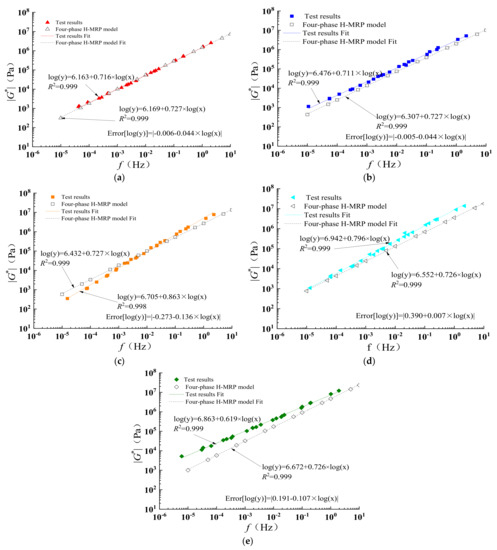
Figure 35.
Prediction results of FTAM. (a) F/A = 0.4. (b) F/A = 0.8. (c) F/A = 1.2. (d) F/A = 1.6. (e) F/A = 2.0.
Table 9 is obtained, and the error (average) can be used to compare prediction errors. When F/A = 0.8, the error of the prediction model is minimum, and when F/A=1.6, the error of the prediction model is maximum.
Table 9.
Error function of FTAM.
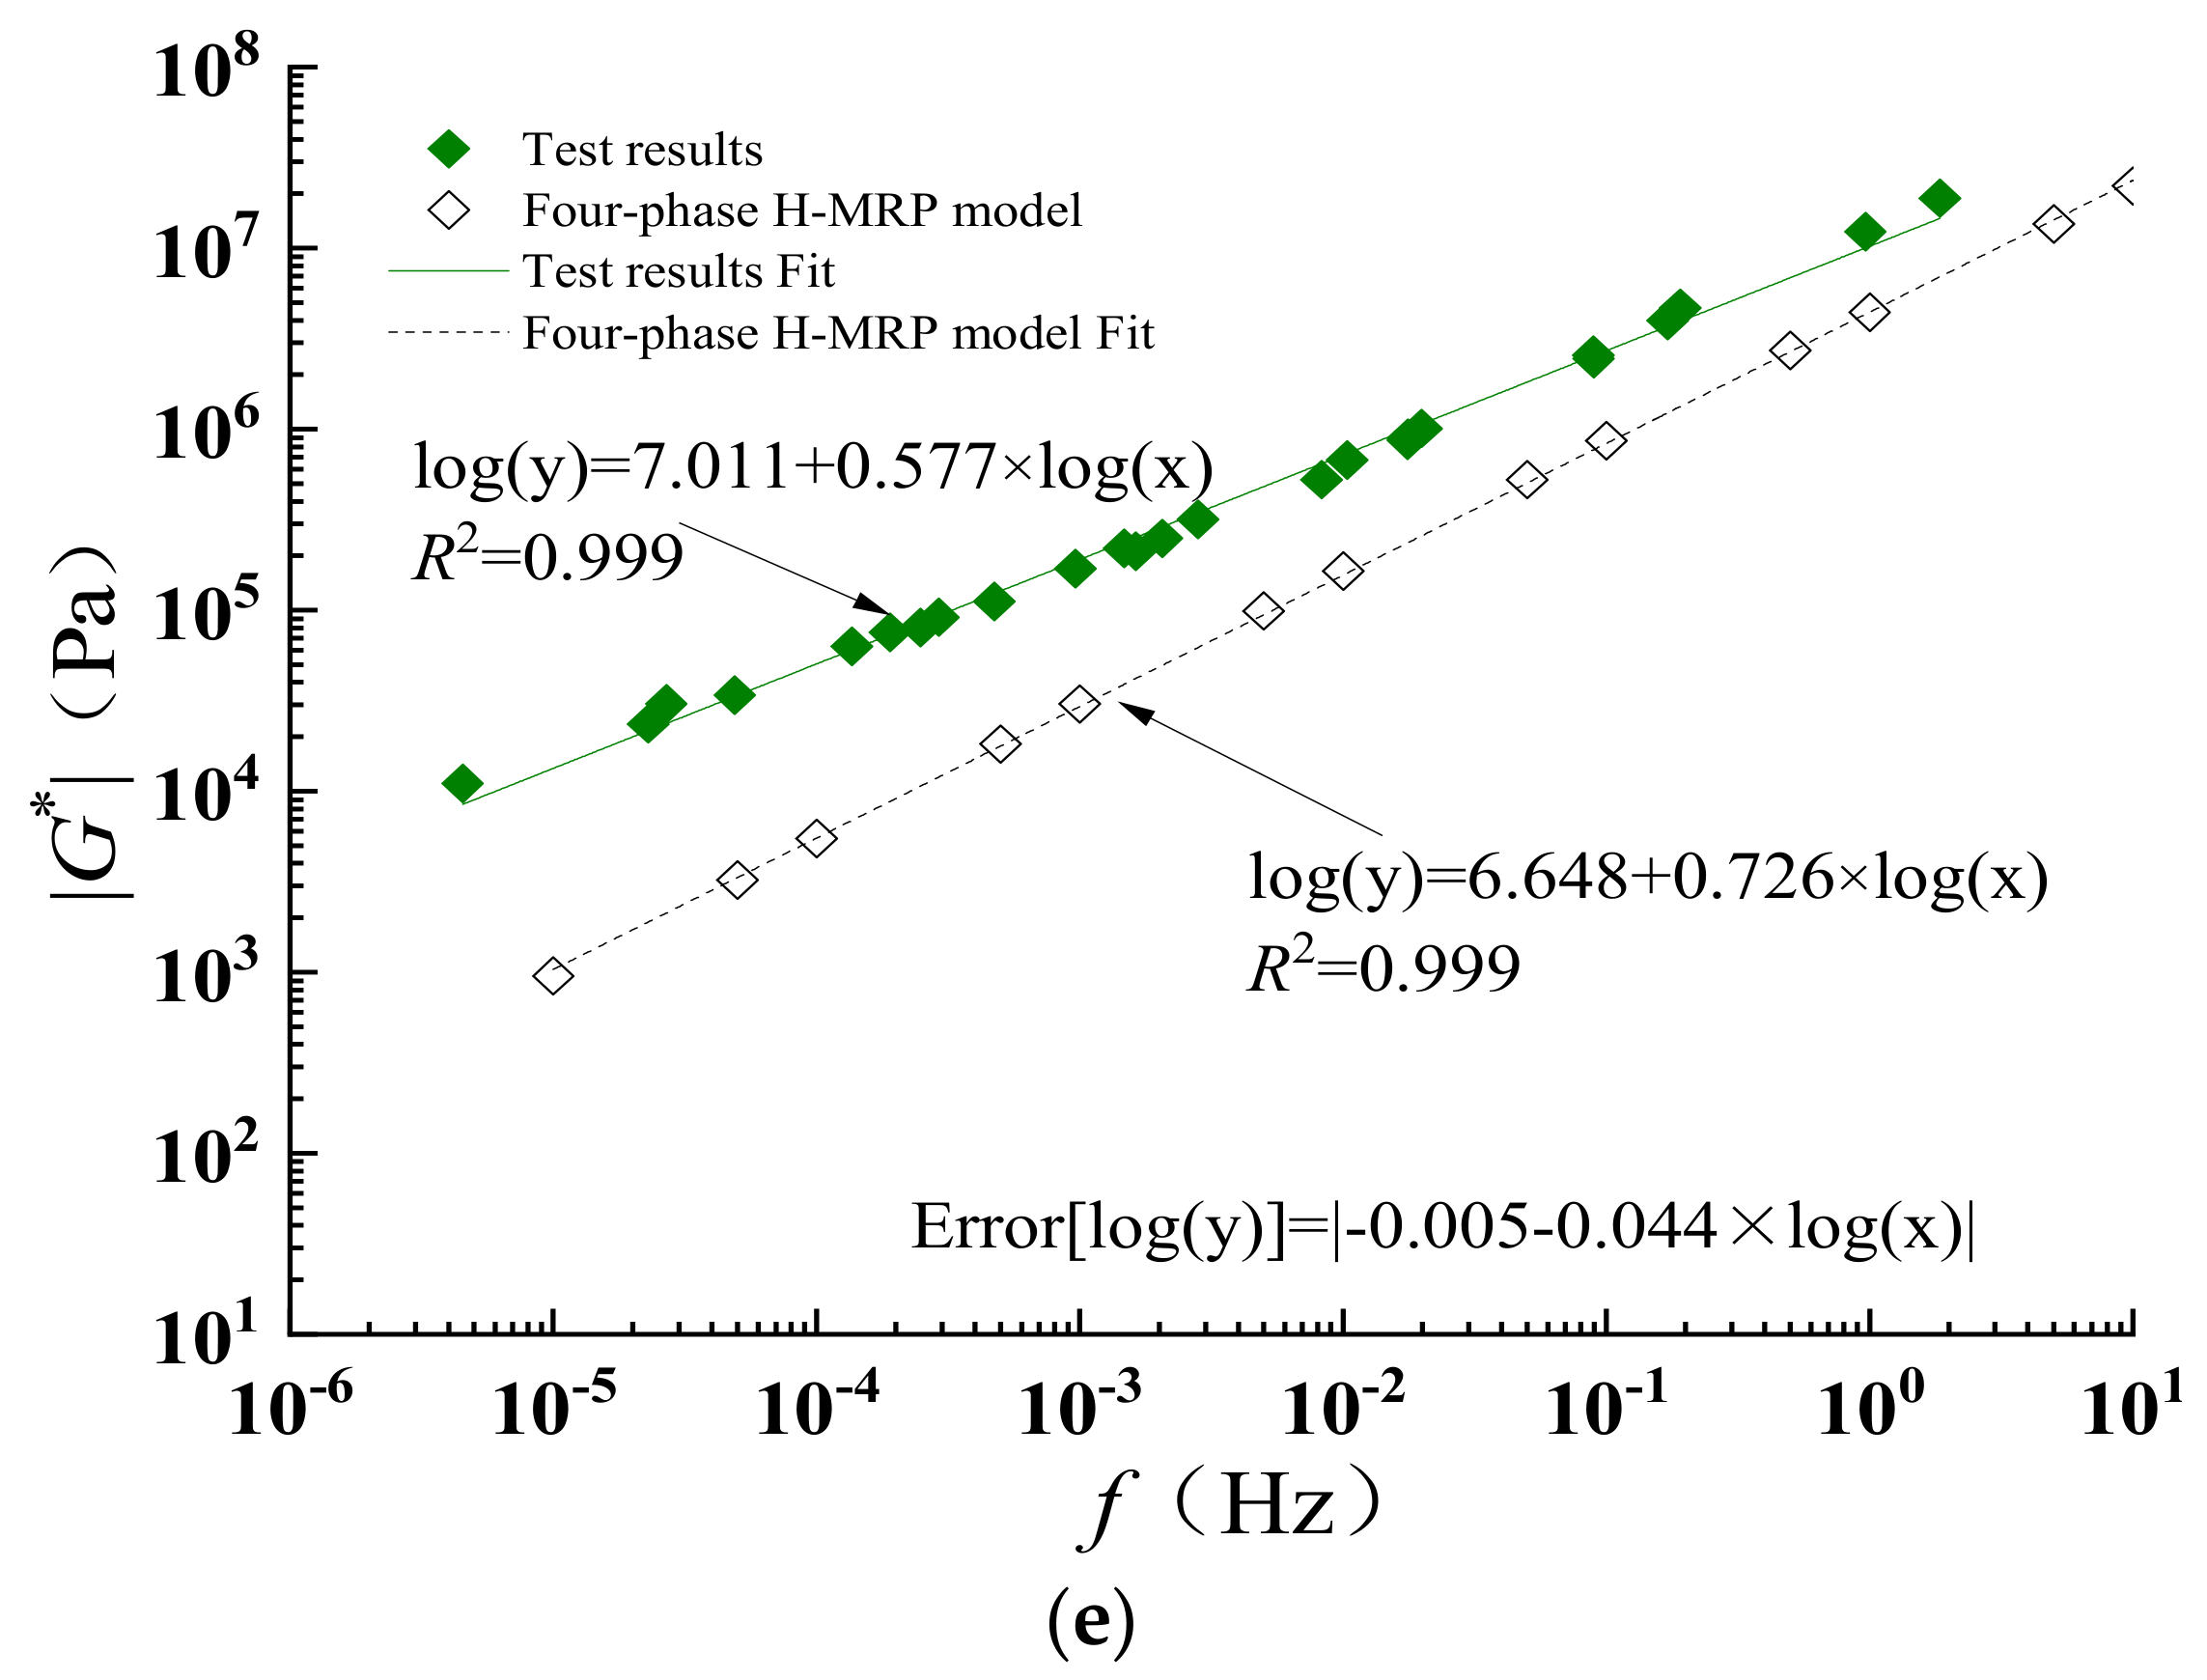
The four-phase H-MRP model was used to predict the |G*| value of coal gangue TPU-modified asphalt mastic (CTAM): the interaction ability of coal gangue and TPU-modified asphalt is close to that of limestone, assuming that TPU-modified asphalt and coal gangue formed a structural asphalt layer thickness of 0.1 μm. This can be seen in Figure 36, showing that the predicted |G*| value of CTAM is lower than the experimental value, and the larger the key ratio of F/A, the more clearly the predicted value is lower than the experimental value. This indicates that the assumed thickness of the structural asphalt layer is thin, and the actual gangue and asphalt has a strong interaction ability; hence, it should have a thicker structural asphalt layer. However, as the thickness of the structural asphalt layer is at the micron level, it is difficult to measure its thickness using indoor tests. For this reason, the influence of the thickness of the structural asphalt layer in the predicted results of TPU-modified asphalt mastic |G*| will be analyzed later in this study.


Figure 36.
Prediction results of CTAM. (a) F/A = 0.4. (b) F/A = 0.8. (c) F/A = 1.2. (d) F/A = 1.6. (e) F/A = 2.0.
Table 10 was obtained, and the error (average) can be used to compare prediction errors. When F/A = 1.2, the error of the prediction model is minimum, and when F/A = 1.6, the error of the prediction model is maximum.
Table 10.
Error function of CTAM.
In this thesis, R2 is greater than 0.99, which shows that the correlation of the fitting curves is higher. The small margin of error (Average) shows that the model in this paper is reasonable.
4.6. Mechanism Influence on |G*| of TPU-Modified Asphalt Mastic
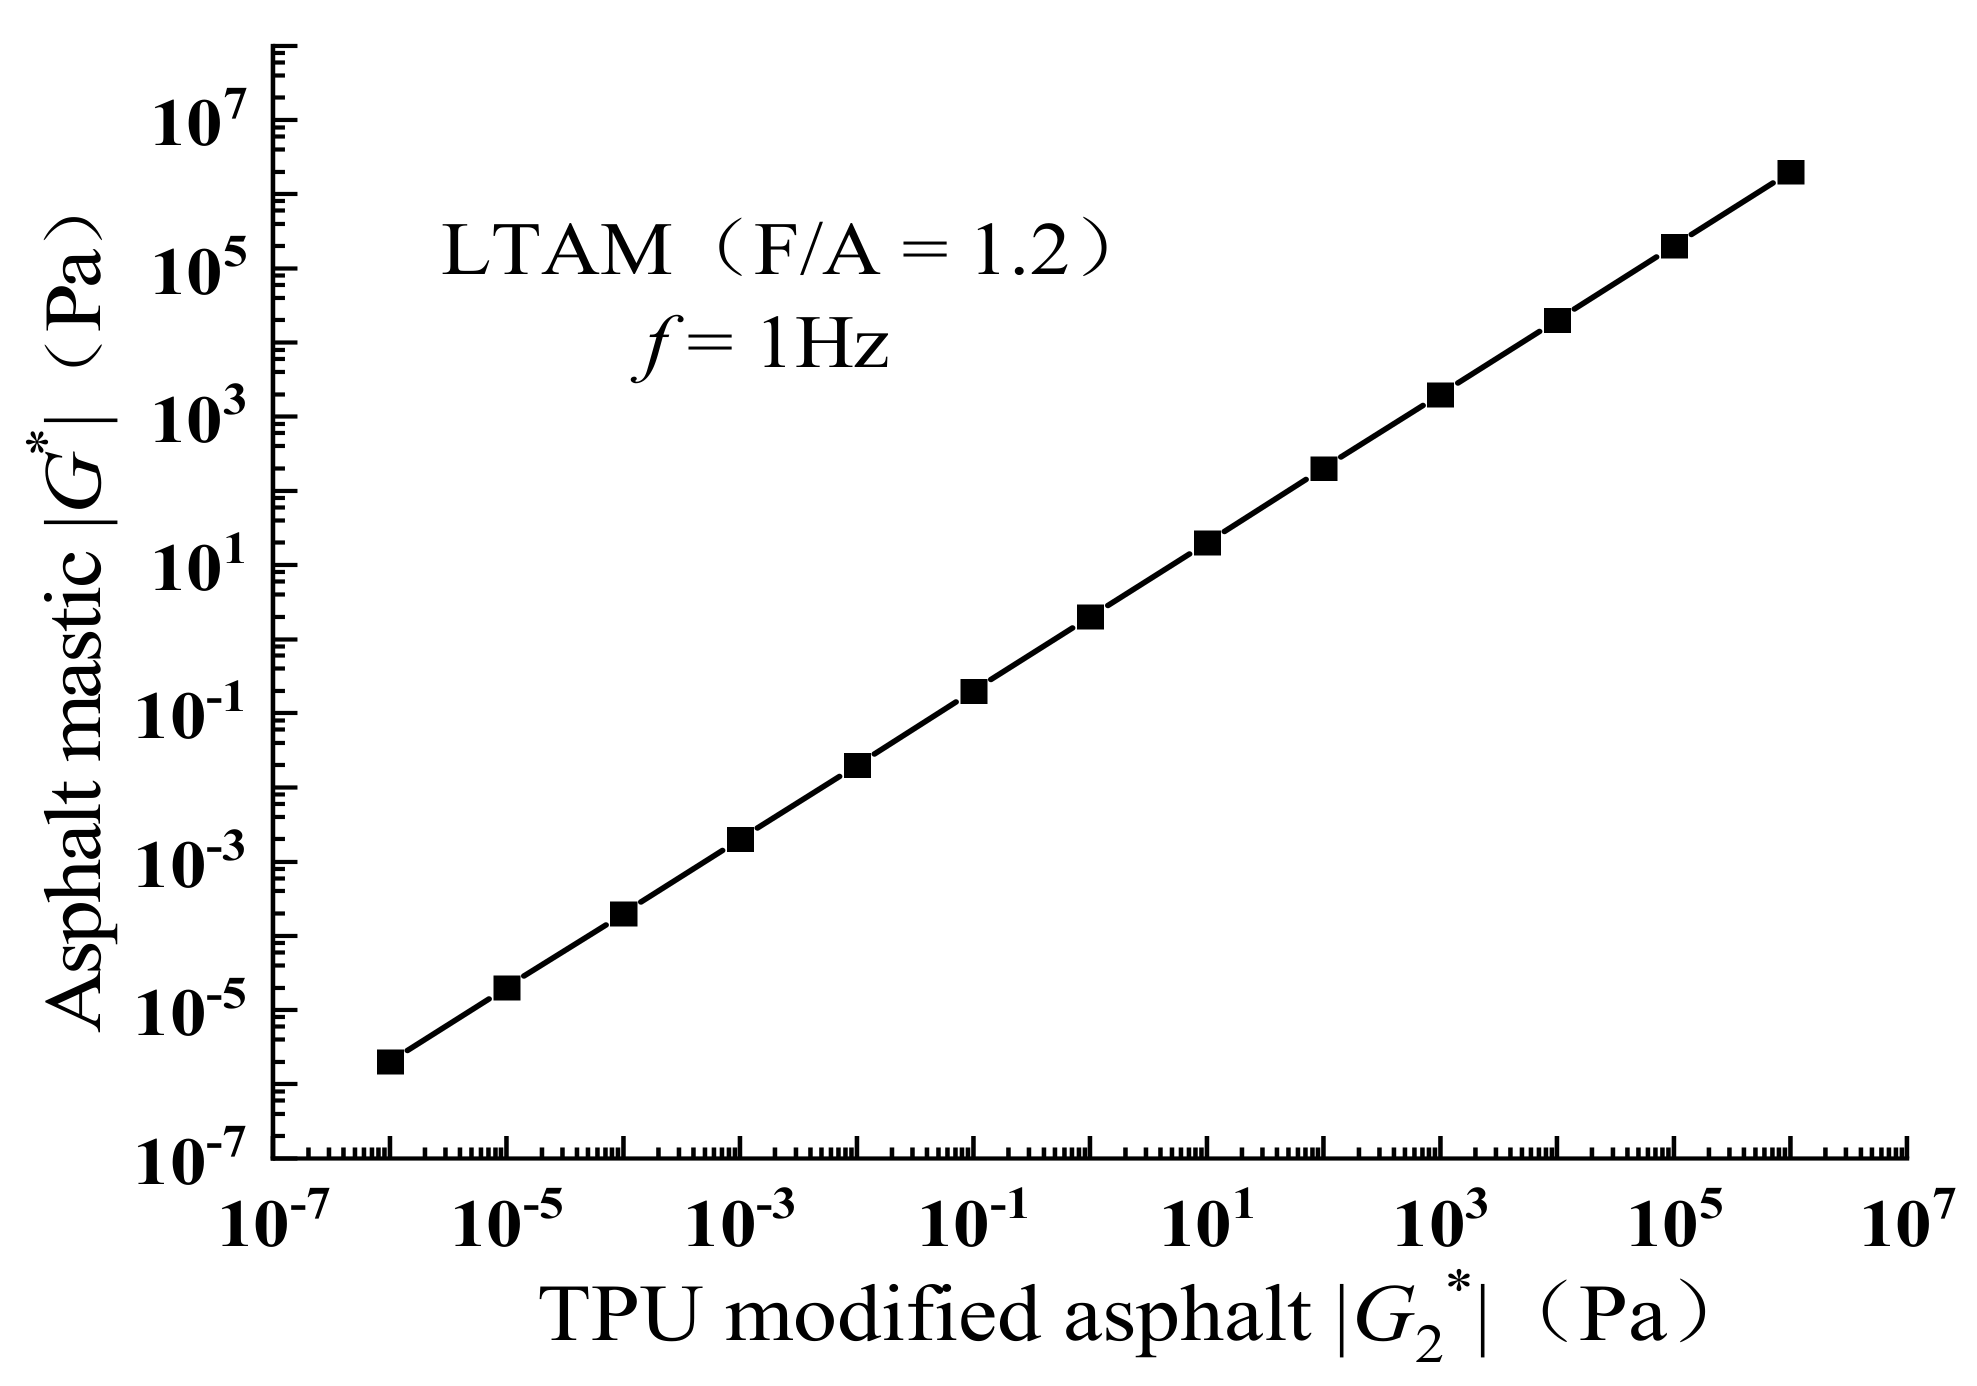
4.6.1. Effect of |G2*| and ν2
To analyze the influence of TPU-modified asphalt |G2*| on asphalt mastic |G*|, LTAM (F/A = 1.2) was selected as the study object, the model parameters were input according to Section 2.2, and the effect of TPU-modified asphalt |G2*| on asphalt mastic |G*| was obtained, as shown in Figure 36.
From Figure 37, it can be seen that the asphalt mastic |G*| linearly increases with the increase in |G2*|. The |G2*| of TPU-modified asphalt was between 1 × 10⁻⁶ and 1 × 10⁻⁶ Pa, indicating that the value of TPU-modified asphalt |G2*| will have an important effect on the asphalt mastic |G*|. The effect of ν2 on the asphalt mastic |G*| is shown in Figure 38, where it can be seen that the effect of ν2 on the asphalt mastic |G*| is small, indicating that increasing the TPU-modified asphalt |G2*| can be an effective way of increasing the asphalt mastic |G*|, while the Poisson’s ratio effect of TPU-modified asphalt can be approximately ignored.
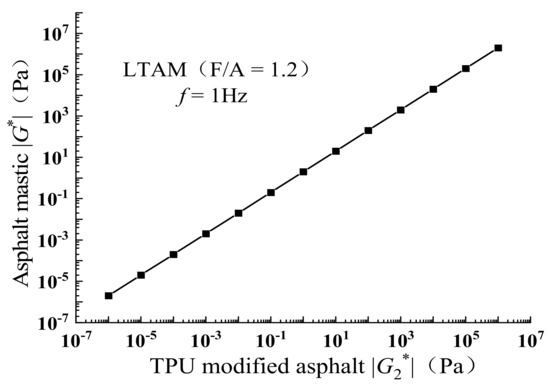
Figure 37.
Effect of TPU-modified asphalt |G*| on asphalt mastic |G*|.
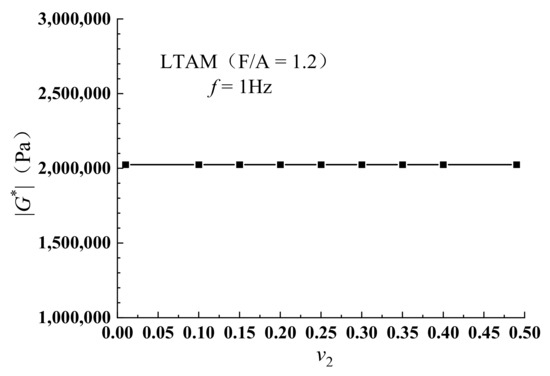
Figure 38.
Effect of TPU-modified asphalt ν2 on asphalt mastic |G*|.
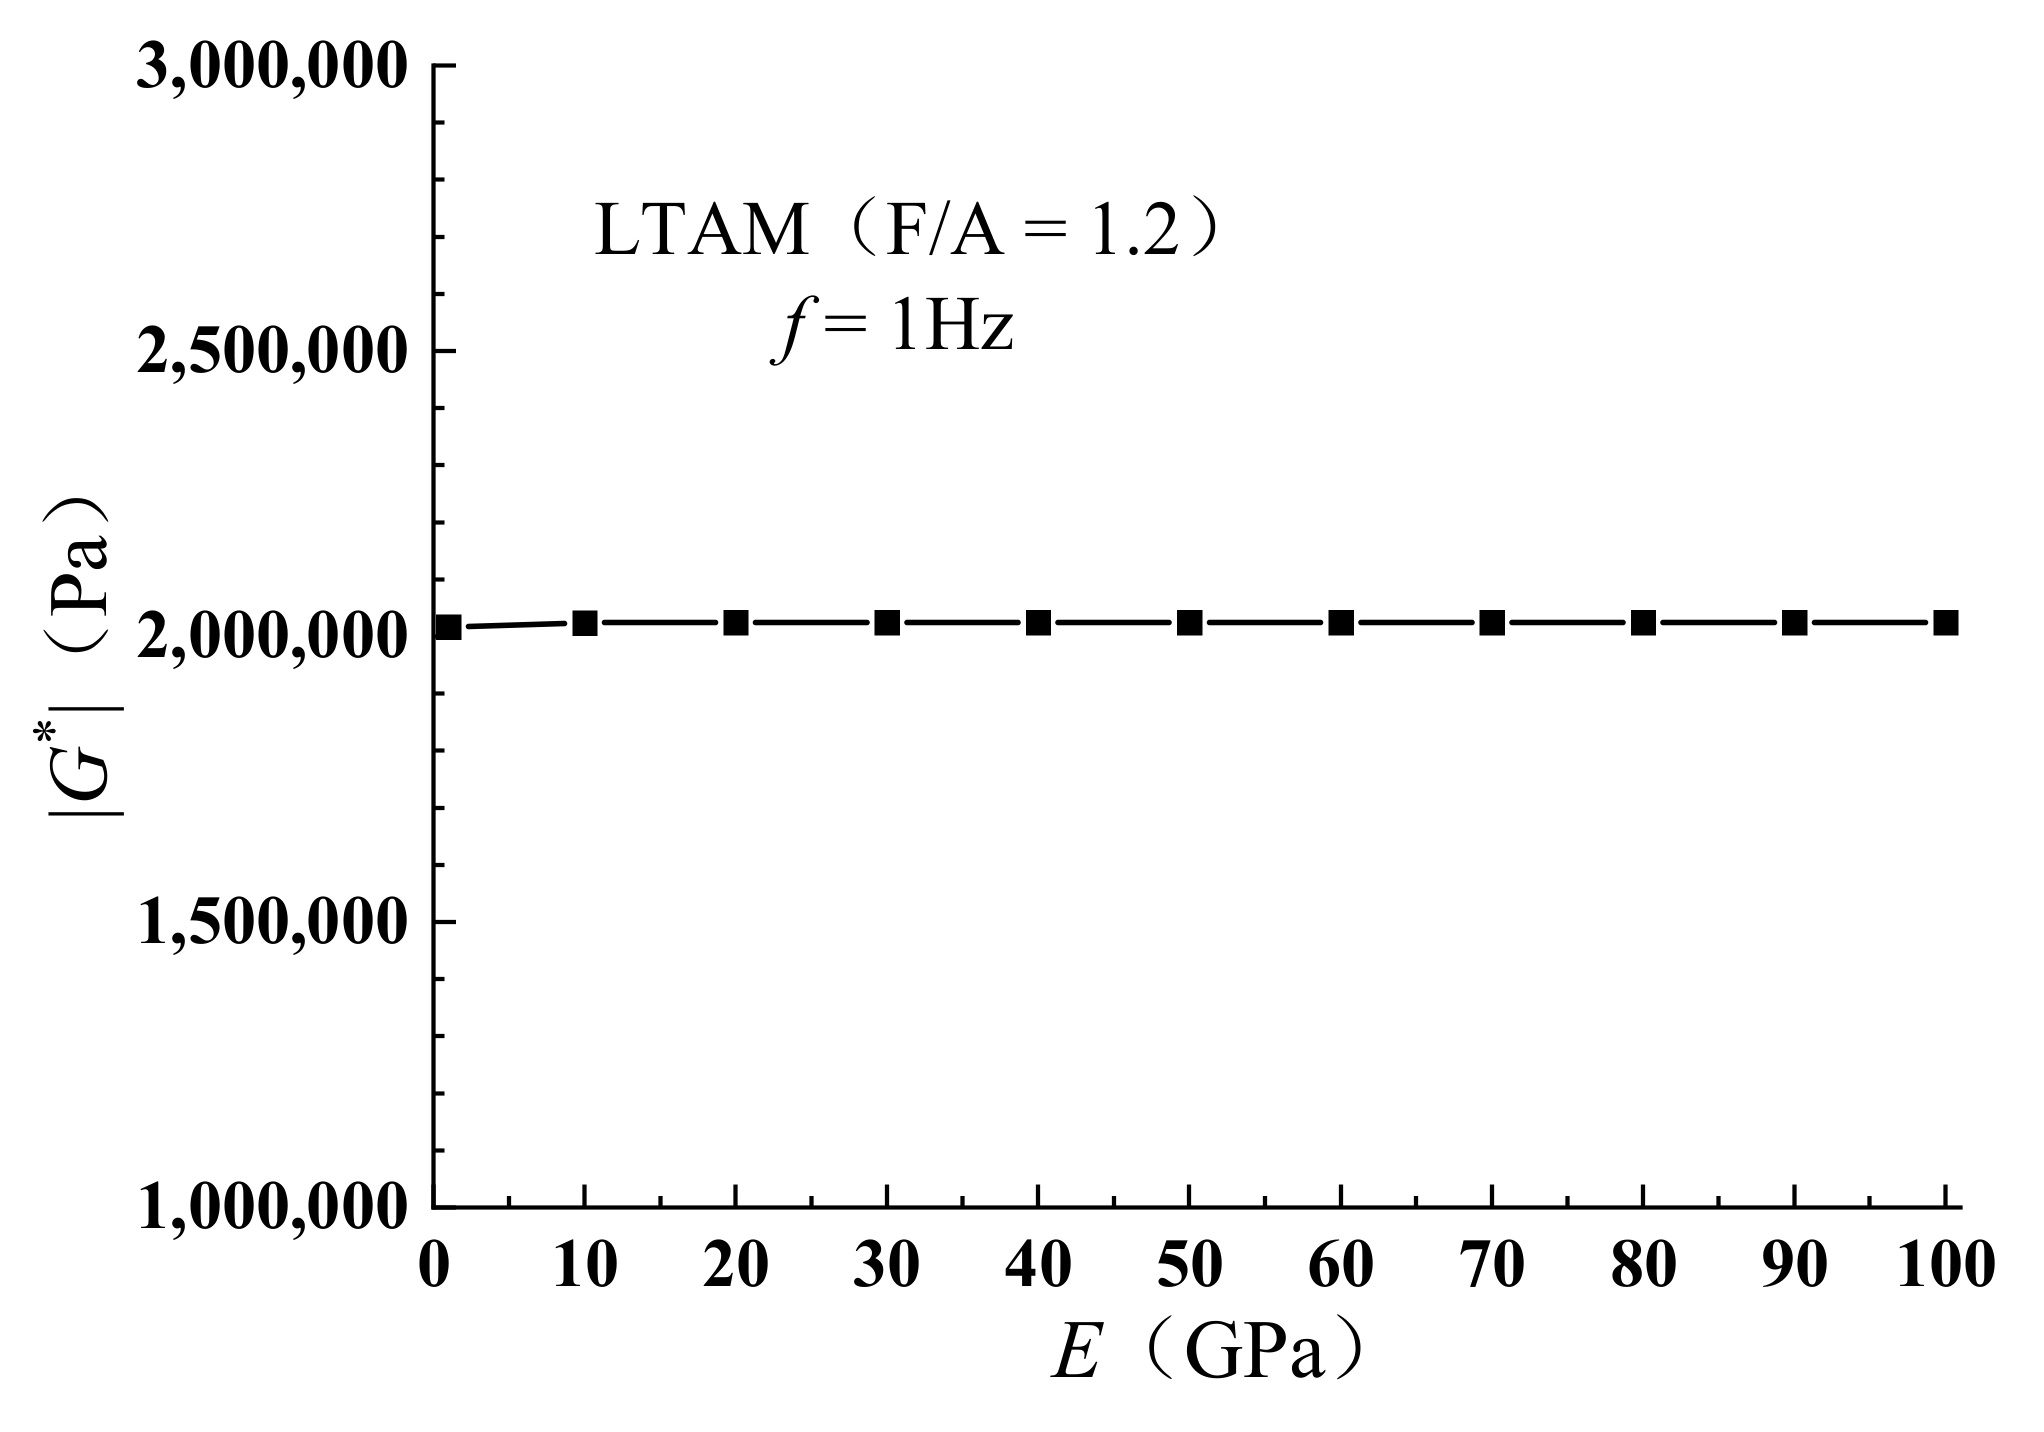
4.6.2. Effect of Mineral Powder Modulus E and Poisson’s Ratio ν1 on Asphalt Mastic |G*|
LTAM (F/A = 1.2) was also selected as the study object: the model parameters were input, the range of mineral powder modulus was taken as from 1 to 100 GPa, and the effect of mineral powder modulus E on asphalt mastic |G*| was analyzed, as shown in Figure 39. It can be seen that, since the mineral powder modulus is much larger than the modulus of the TPU-modified asphalt, the value of mineral powder modulus E on asphalt mastic |G*| has a lower effect. The effect of the Poisson’s ratio ν1 on the asphalt mastic |G*| is analyzed in Figure 40, which shows that the effect of the Poisson’s ratio ν1 on the asphalt mastic |G*| is also small, explaining that the effect of different types of mineral powders on asphalt mastic |G*| is less related to the modulus of mineral powder and Poisson’ ratio, and asphalt mastic |G*| is mainly influenced by the interaction between mineral powder and TPU-modified asphalt.
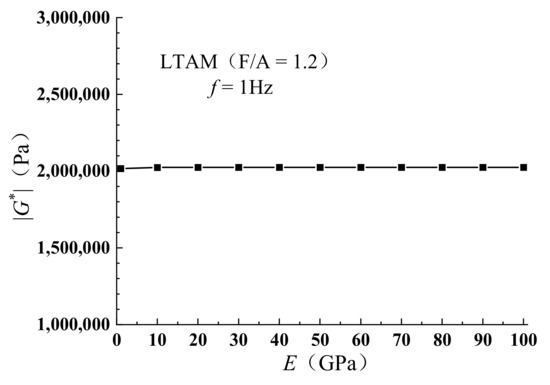
Figure 39.
Effect of mineral powder modulus E on asphalt mastic |G*|.

Figure 40.
Effect of Poisson’s ratio of mineral powder ν1 on asphalt mastic |G*|.
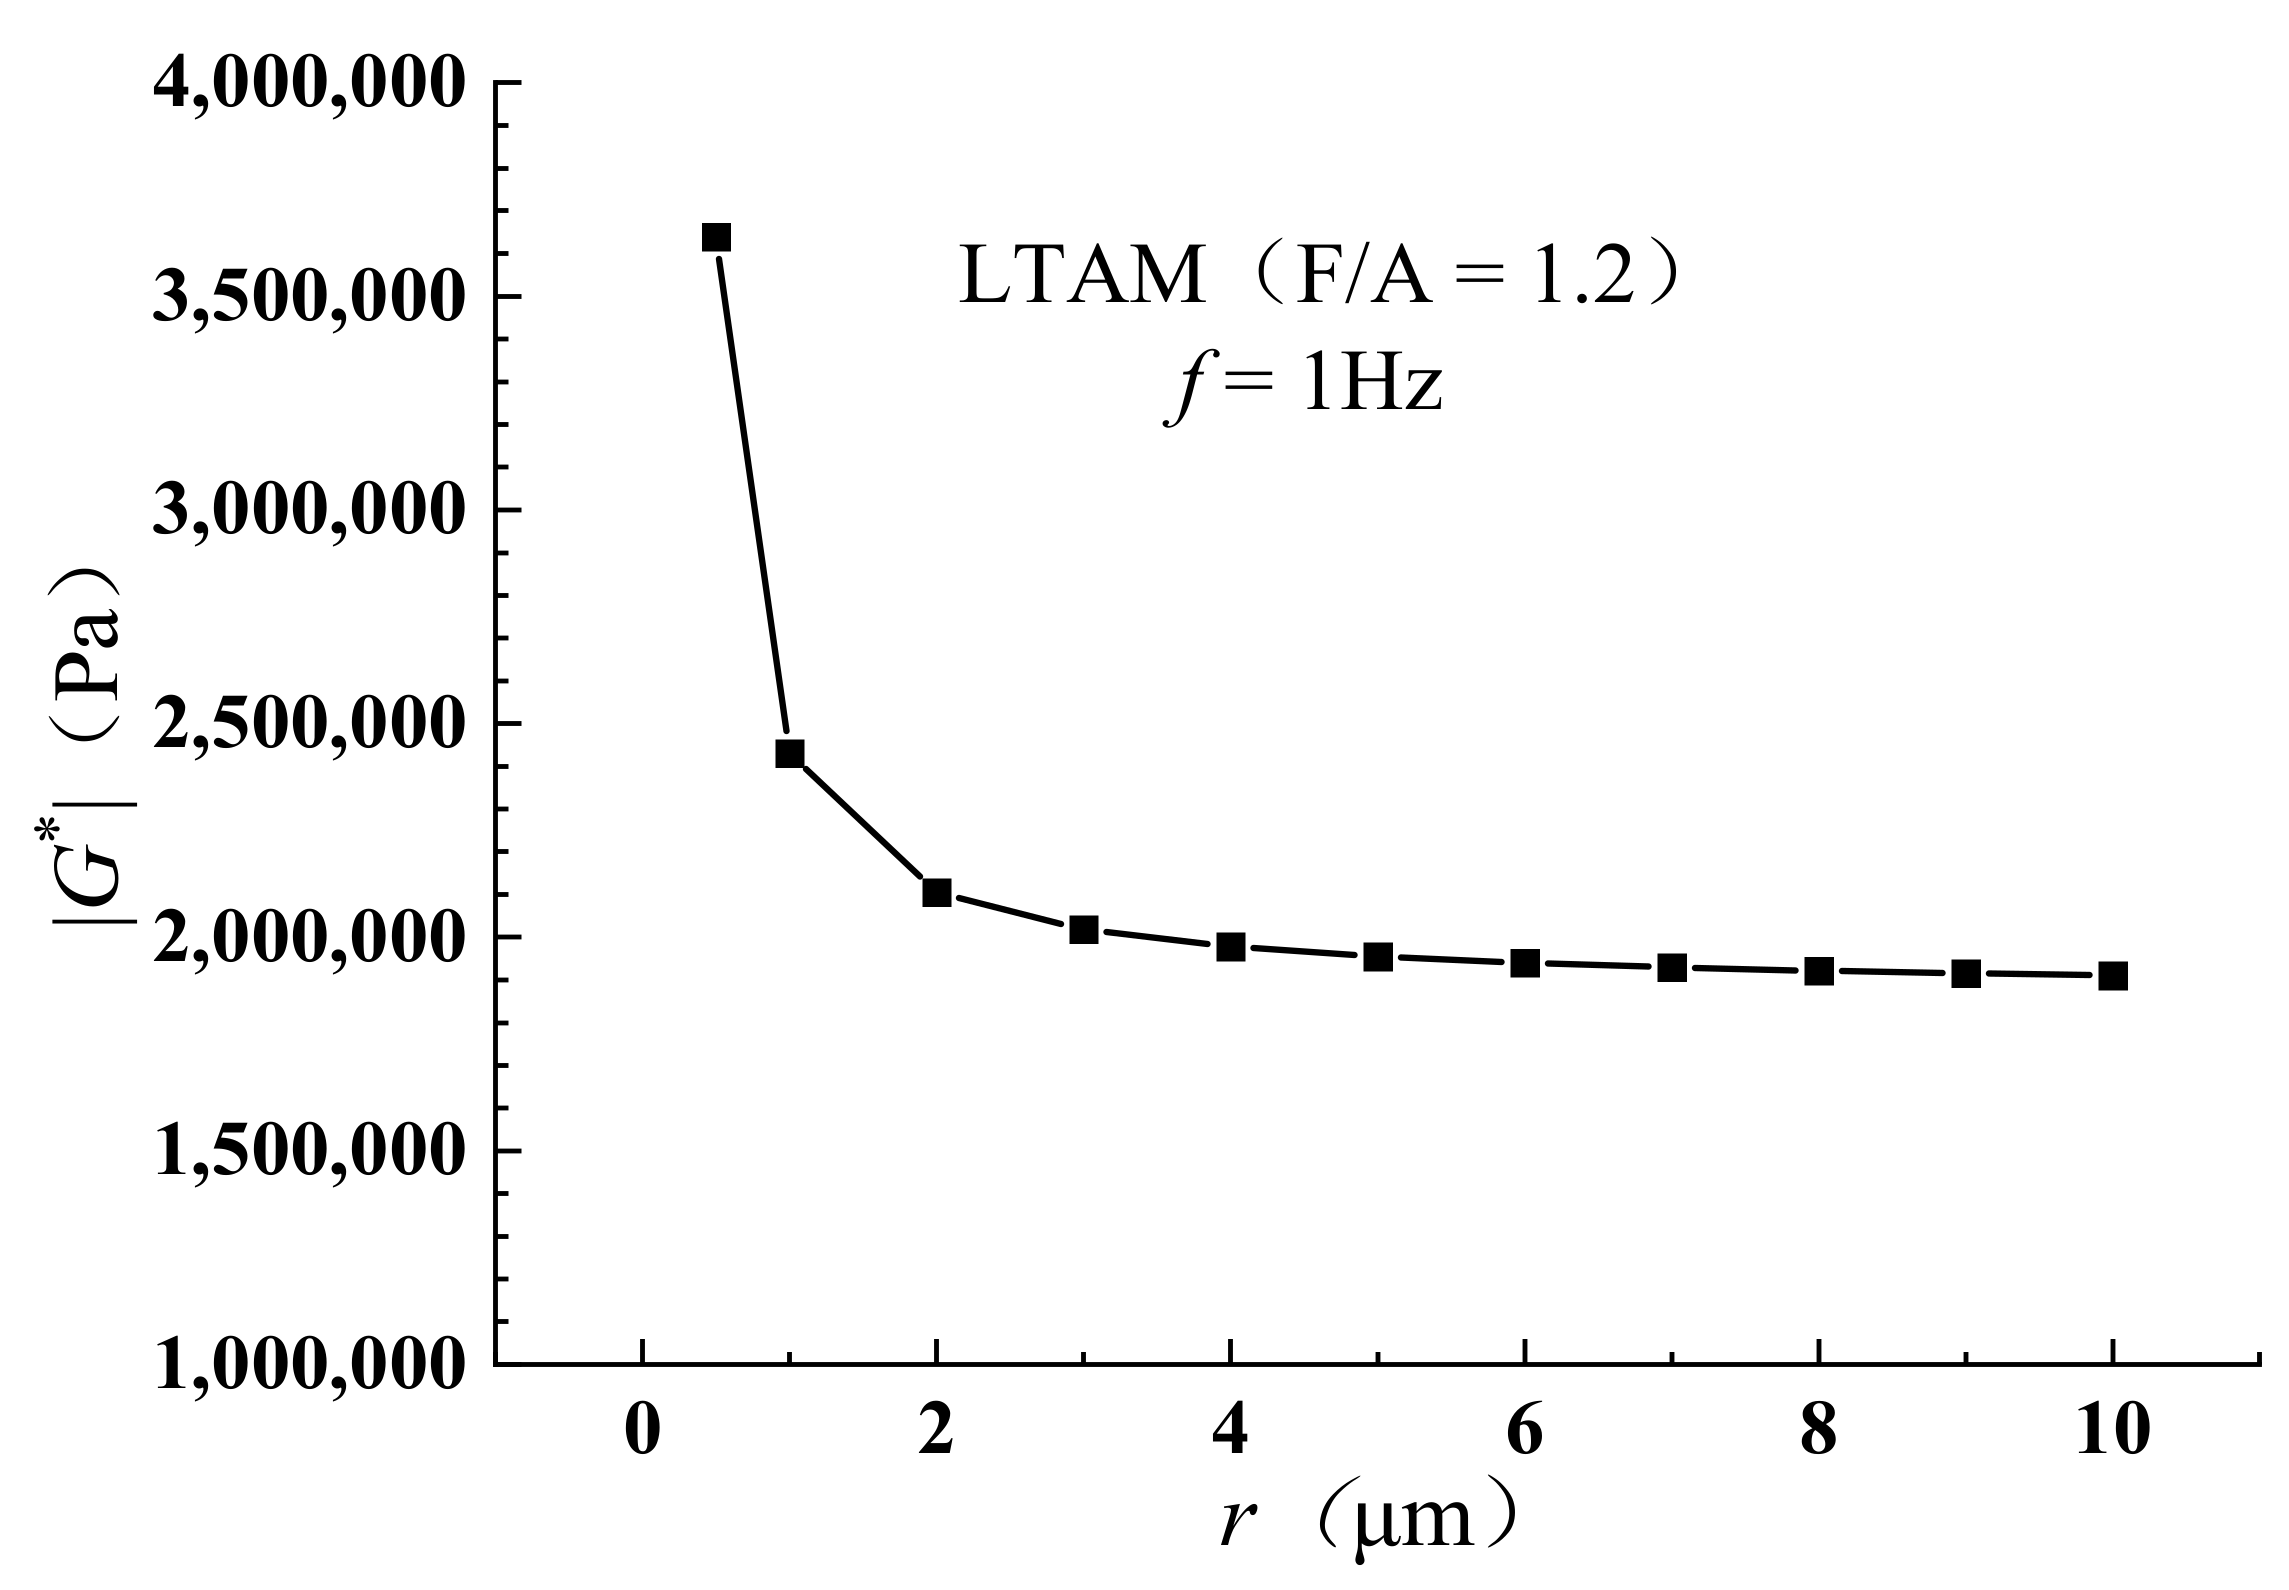
4.6.3. Effect of Mineral Powder Particle Size on Asphalt Mastic |G*|
To analyze the effect of mineral powder particle size on |G*|, LTAM (F/A = 1.2) was selected as the research object, and the range of mineral powder particle sizes was taken as r = 0.5–10 μm to analyze the effect of mineral powder particle size on asphalt mastic |G*|, as shown in Figure 41. When the average radius of mineral powder r > 2 μm, the effect of mineral powder particle size on asphalt mastic |G*| is smaller; hence, when r < 2 μm, the value of asphalt mastic |G*| rapidly increases as the particle size of the mineral powder decreases. The effect of mineral powder particle size on the asphalt mastic |G*| has a key particle size: when the mineral powder particle size decreases to a certain value, the mineral powder particles in the asphalt mastic cementing effect is significantly enhanced. Therefore, the volume content of the structural asphalt layer adsorbed by the mineral powder rapidly increases, which leads to a rapid increase in the asphalt mastic |G*| value.

Figure 41.
Effect of mineral powder particle size on asphalt mastic |G*|.
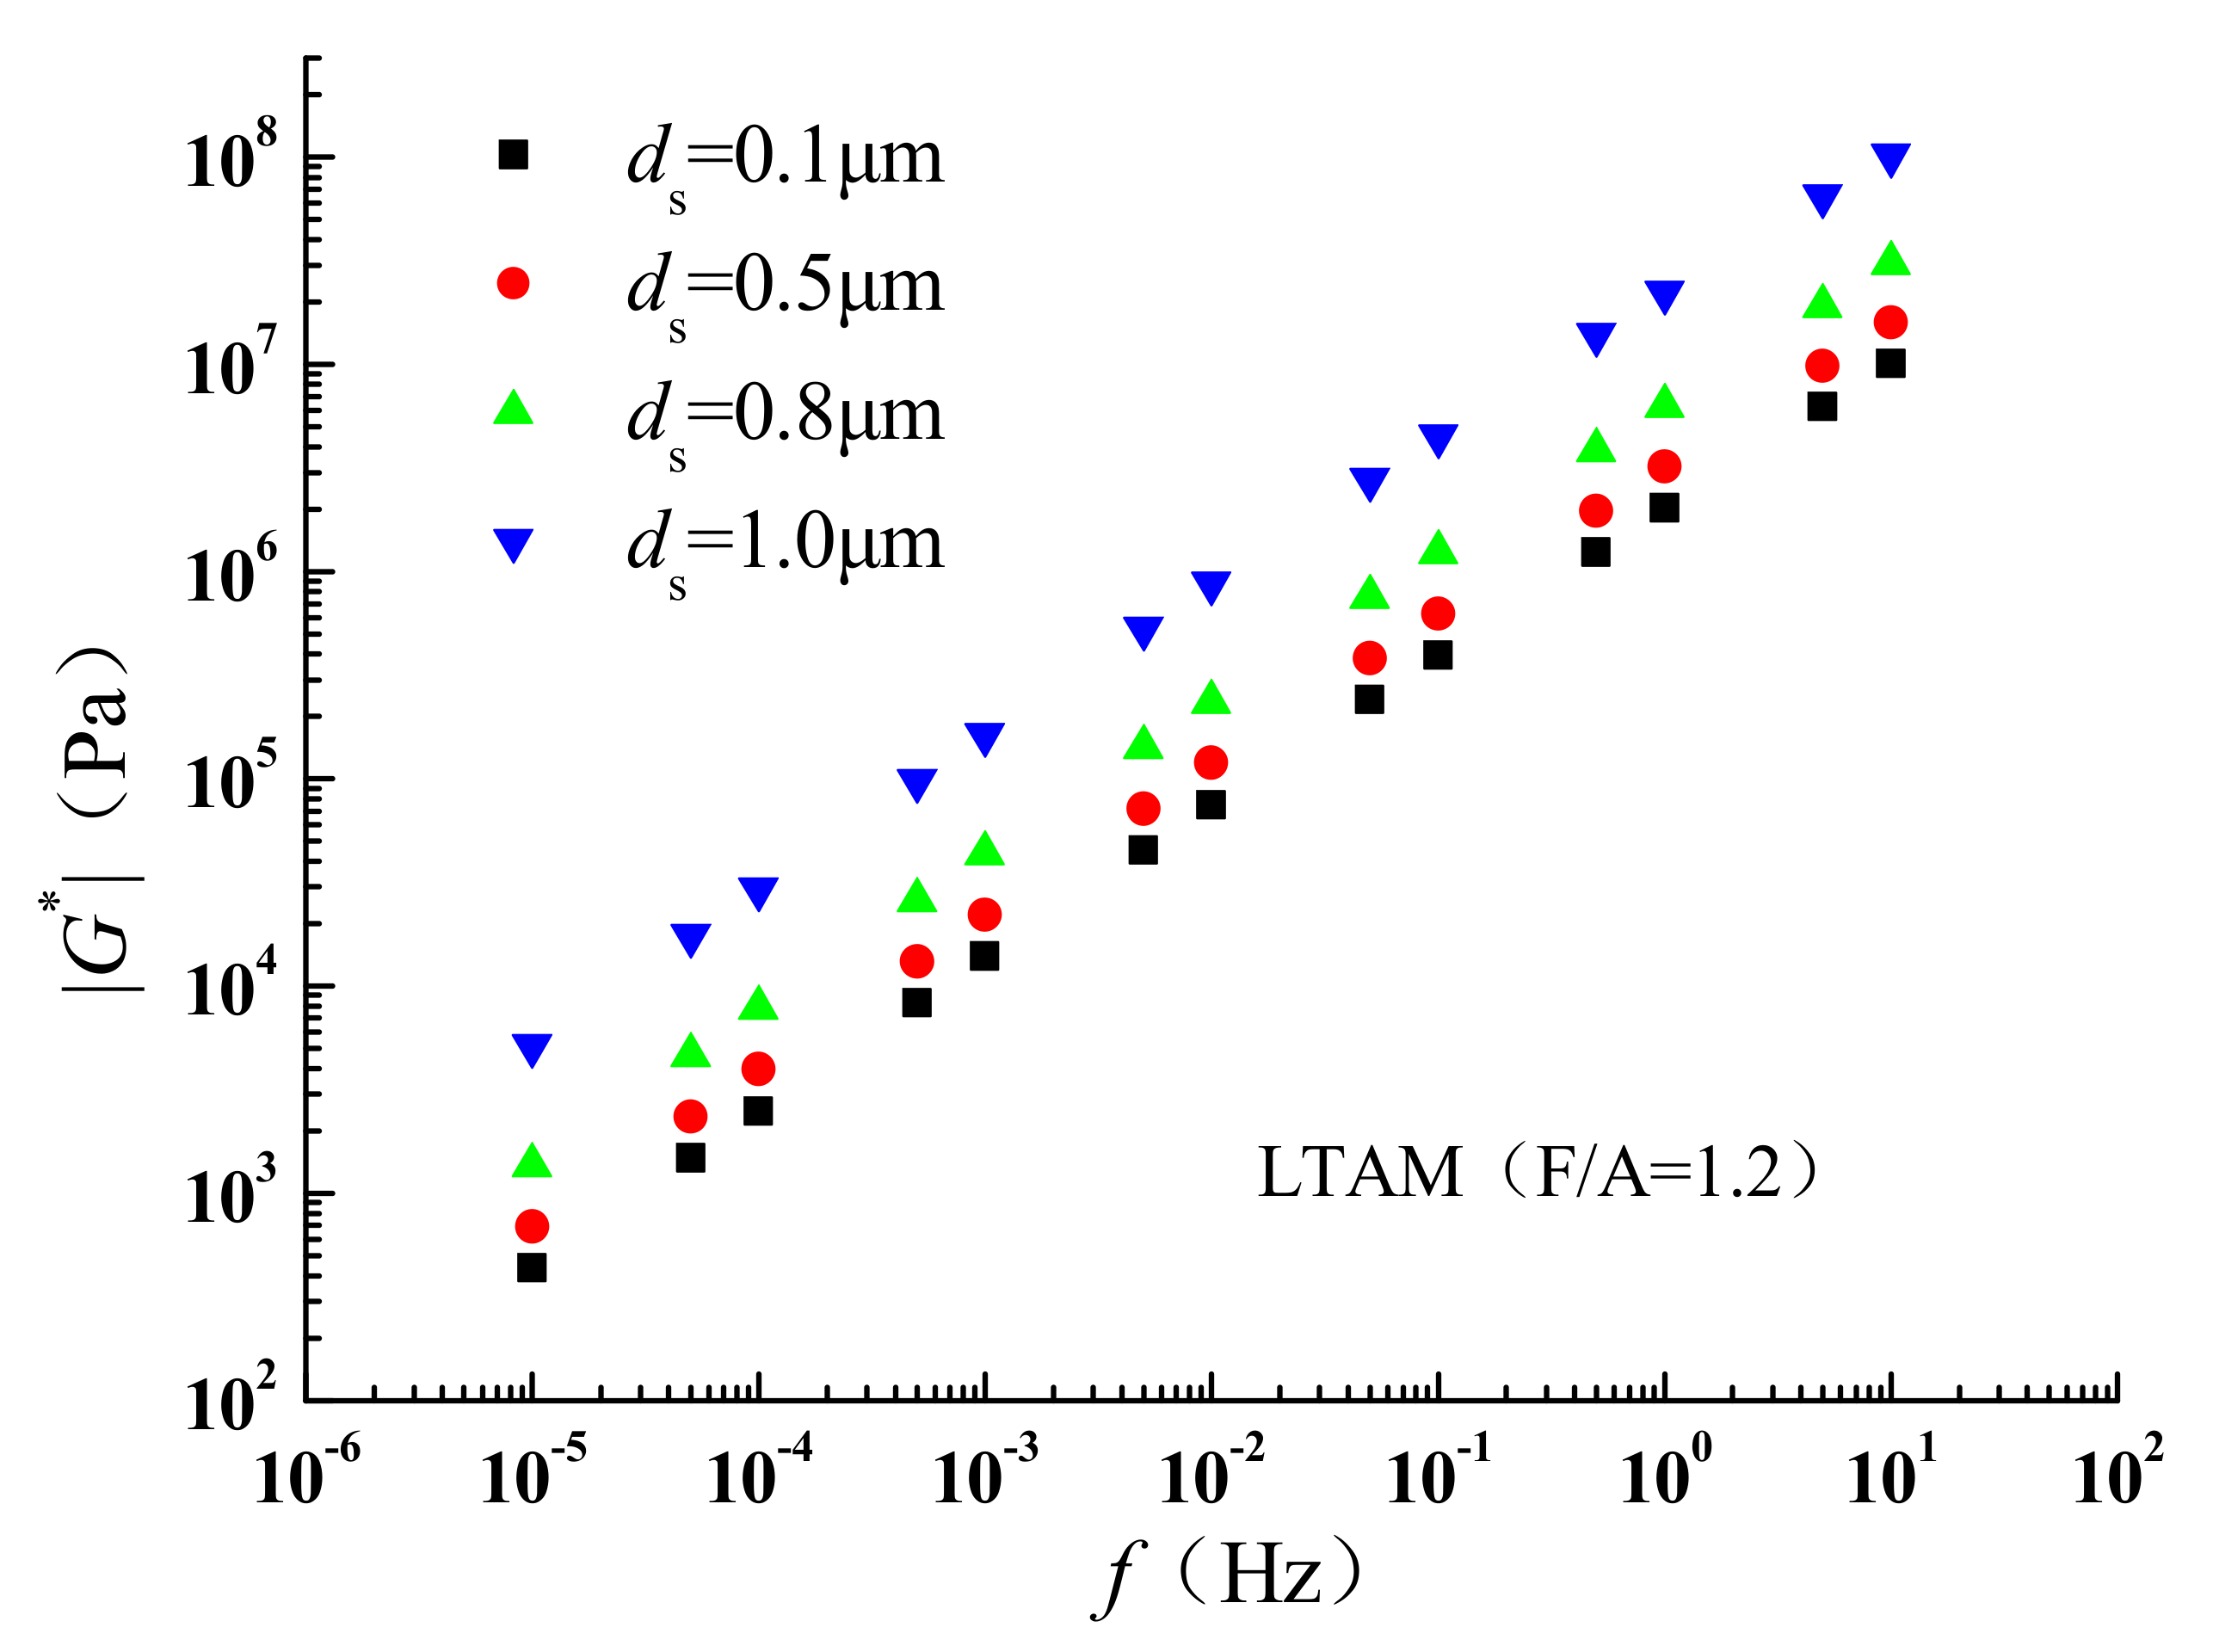
4.6.4. Effect of Structural Asphalt Layer Thickness on |G*|
The thickness of the structural asphalt layer depends on the interaction ability of TPU-modified asphalt and mineral powder. To analyze the effect of structural asphalt layer thickness ds on |G*|, LTAM (F/A = 1.2) was selected as the research object. The effect of ds on |G*| is shown in Figure 41. The variation curve of |G*| with ds for f = 1 Hz is shown in Figure 42.
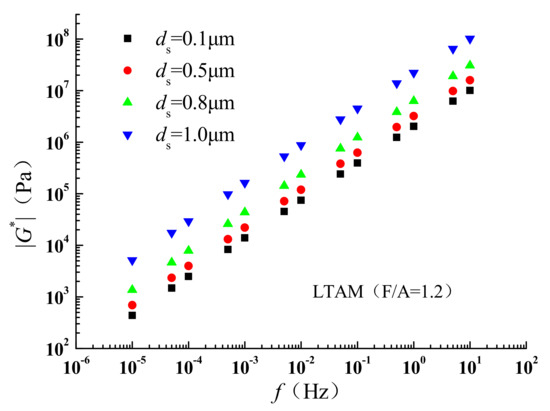
Figure 42.
Effect of ds on |G*|.
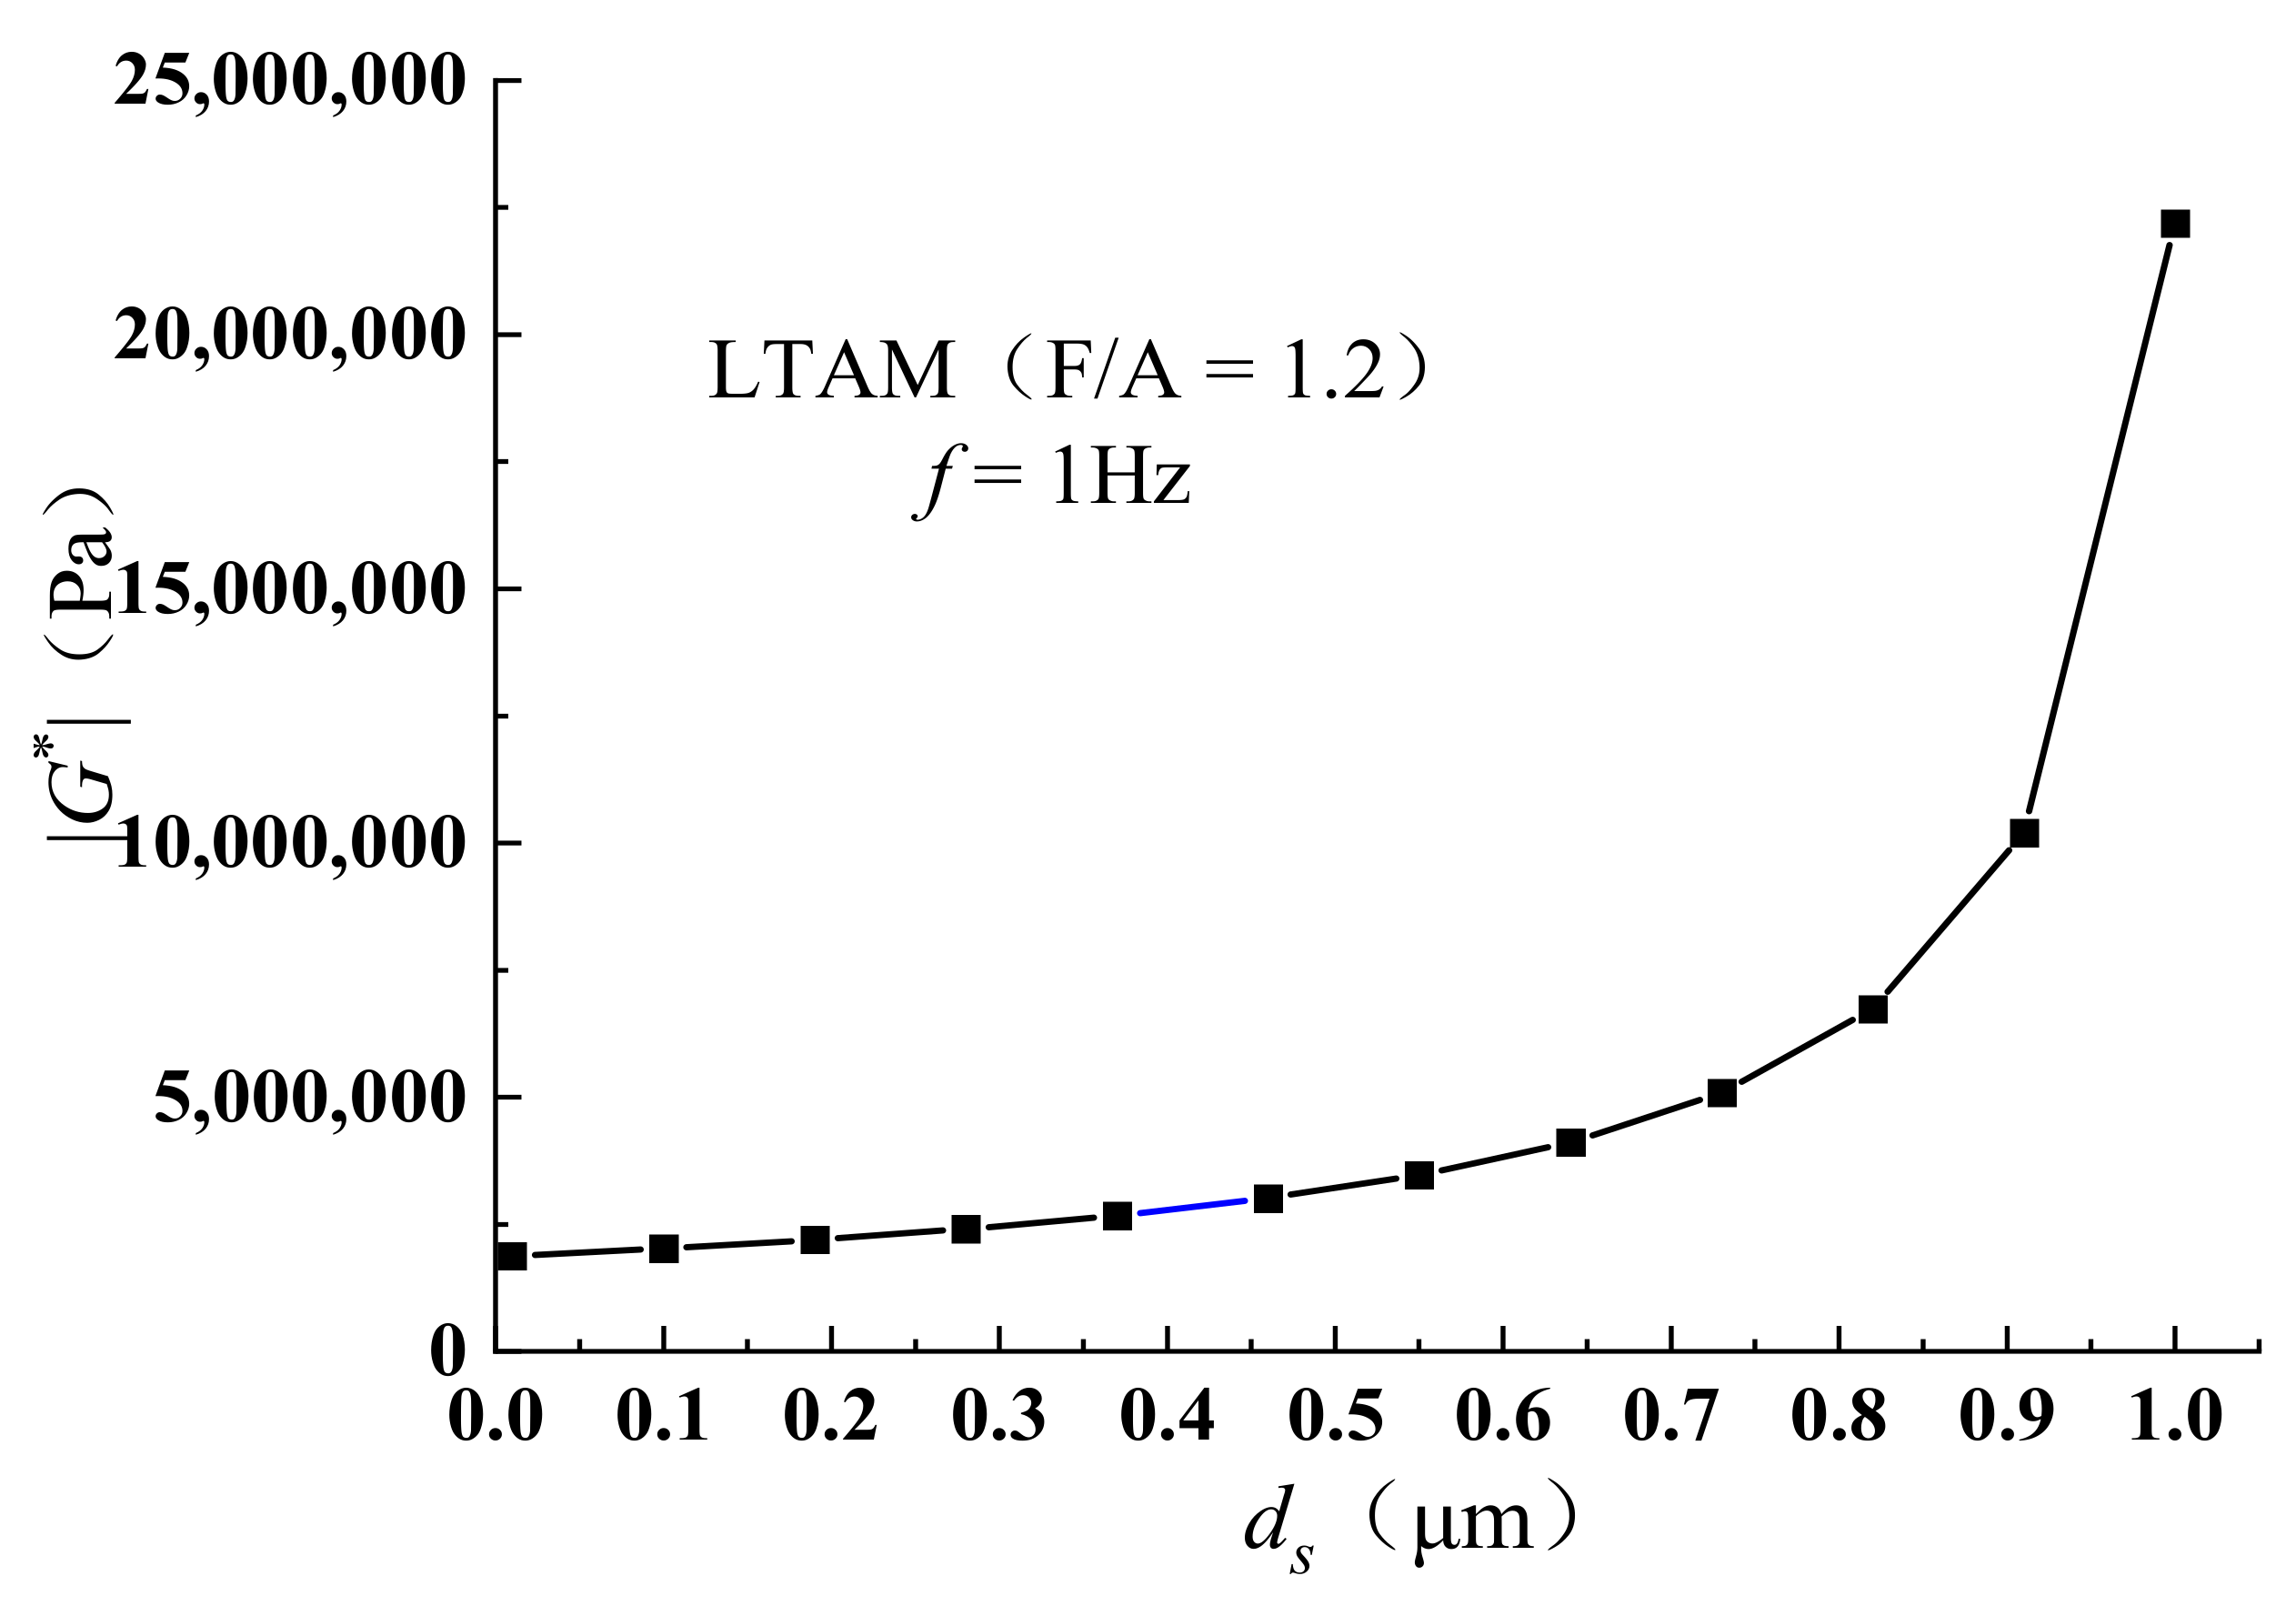
As can be seen from Figure 43, the |G*| of TPU-modified asphalt mastic increases with the increase in structural asphalt layer thickness ds, indicating that the interaction between TPU-modified asphalt and mineral powder will play an important role in enhancing the |G*| of asphalt mastic.
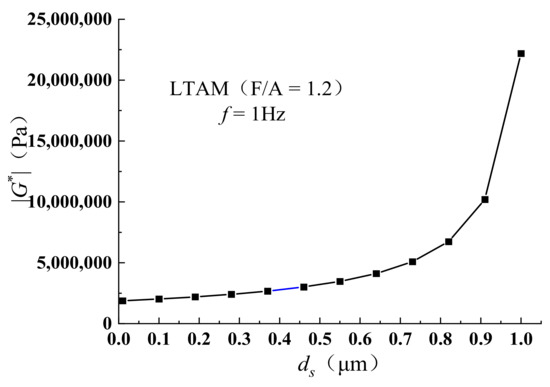
Figure 43.
Variation curve of |G*| with ds.
It is easy to see that when ds < 0.7 μm, the value of |G*| slowly and linearly increases with the increase in ds. When ds > 0.7 μm, the value of |G*| rapidly increases, due to the rapid increase in the volume fraction of structural asphalt after the increase in ds to a certain value. This indicates that improving the interaction ability of TPU-modified asphalt and mineral powder can effectively enhance the |G*| value of asphalt mastic.
The dynamic shear modulus of TPU-modified asphalt mastic |G*| is mainly affected by the dynamic shear modulus of TPU-modified asphalt |G2*|, the particle size of mineral powder and the thickness of structural asphalt layer ds. The dynamic shear modulus of TPU-modified asphalt mastic |G*| can be effectively increased by increasing the thickness of TPU-modified asphalt |G2*| and structural asphalt layer ds. Therefore, the dynamic shear modulus of asphalt |G*| can be further increased by TPU modification. Therefore, the dynamic shear modulus of asphalt can be further increased by TPU modification, and the interaction between asphalt and mineral powder can be increased by selecting a suitable mineral powder type to increase the thickness of the structural asphalt layer. The smaller the particle size of the mineral powder, the stronger the enhancement effect of TPU-modified asphalt mastic |G*|; hence, engineering applications should be preferred over obtaining a finer particle size of the mineral powder
5. Conclusions
Based on the micro-mechanics of composite principles, the H-MRP model was improved by considering the interaction between asphalt and mineral powder, the four-phase H-MRP model of TPU-modified asphalt mastic was established considering the thickness of structural asphalt, and the |G*| of TPU-modified asphalt mastic was predicted using this model, in addition to TPU-modified asphalt complex shear modulus and Poisson’s ratio, mineral powder modulus, Poisson’s ratio, mineral powder particle size and structural asphalt layer thickness on TPU-modified asphalt mastic |G*|. The main conclusions were as follows:
- (1)
- The key F/A ration ranges from 0.4 to 1.2. The predicted values of all three asphalt mastics were lower than the experimental values, except for the predicted values of |G*| for GAM, which were higher than the experimental values. This shows that the predicted values of the H-MRP model were influenced by the type of mineral powder. As a typical, rigid, particle-filled viscoelastic matrix composite, the mechanical properties of asphalt mastic are not only affected by asphalt, but also by the volume fraction of mineral powder and the interaction between asphalt and mineral powder.
- (2)
- The predicted values of the H-MRP model were lower than the experimental values in the range of a key F/A ratio, which was attributed to the fact that the interaction between asphalt and mineral powder was not considered. After considering the interaction, a structural asphalt layer was added to the H-MRP model, and a four-phase H-MRP model of asphalt mastic was established. The predicted values of |G*| for the asphalt mastic obtained using the four-phase H-MRP model were closer to the experimental values.
- (3)
- The |G*| values of the base asphalt mastic and TPU-modified asphalt mastic were predicted using the four-phase H-MRP model. The thickness of the structural asphalt layer formed by different types of mineral powders and asphalt differs: the stronger the interaction ability, the thicker the structural asphalt layer. The |G*|-predicted values obtained with the four-phase H-MRP model after selecting the appropriate structural asphalt layer thickness were close to the experimental values.
- (4)
- The influence mechanism of TPU-modified asphalt mastic |G*| was analyzed using the four-phase H-MRP model, and TPU-modified asphalt mastic |G*| was shown to mainly be influenced by TPU-modified asphalt |G2*|, mineral powder particle size and structural asphalt layer thickness ds. Therefore, it is possible to further increase the |G2*| value of the asphalt by TPU modification and select a suitable mineral powder type to enhance the interaction between asphalt and mineral powder, thereby increasing the thickness of the structural asphalt layer. The smaller the particle size of the mineral powder, the stronger the |G*| enhancement effect on the TPU-modified asphalt mastic.
Author Contributions
Conceptualization, X.J. and F.W.; methodology, Y.Y.; software, X.J. and Z. W; validation, X.J.; formal analysis, X.J. and F.W.; investigation, F.W. and N.G.; resources, F.W.; data curation, X.J., Z.W. and Y.Y.; writing—review and editing, X.J. and X.L.; supervision, Z.C. All authors have read and agreed to the published version of the manuscript.
Funding
This study was funded by the National Natural Science Funding of China under Grant No. 51308084.
Institutional Review Board Statement
Not applicable.
Informed Consent Statement
Not applicable.
Data Availability Statement
Not applicable.
Acknowledgments
This research was performed at Shenyang Jianzhu University and Dalian Maritime University.
Conflicts of Interest
The authors declare no conflict of interest.
References
- Hermida-Merino, D.; O’Driscoll, B.; Hart, L.R.; Harris, P.J.; Colquhoun, H.M.; Slark, A.T.; Prisacariu, C.; Hamley, I.W.; Hayes, W. Enhancement of microphase ordering and mechanical properties of supramolecular hydrogen-bonded polyurethane networks. Polym. Chem. 2018, 9, 3406–3414. [Google Scholar] [CrossRef]
- Gao, W.; Bie, M.; Quan, Y.; Zhu, J.; Zhang, W. Self-healing, reprocessing and sealing abilities of polysulfide-based polyurethane. Polymer 2018, 151, 27–33. [Google Scholar] [CrossRef]
- Jomaa, M.; Roiban, L.; Dhungana, D.; Xiao, J.; Cavaillé, J.; Seveyrat, L.; Lebrun, L.; Diguet, G.; Masenelli-Varlot, K. Quantitative analysis of grafted CNT dispersion and of their stiffening of polyurethane (PU). Compos. Sci. Technol. 2018, 171, 103–110. [Google Scholar] [CrossRef] [Green Version]
- De Risi, M.T.; Gaudio, C.D.; Verderame, G.M. Evaluation of repair costs for masonry infills in RC buildings from observed damage data: The case-study of the 2009 L’Aquila Earthquake. Buildings 2019, 9, 122. [Google Scholar] [CrossRef] [Green Version]
- Zhou, A.; Li, C.; Li, S. Polyurethane industry status and application. China Syn. Fib. Ind. 2013, 36, 46–49. [Google Scholar]
- Cuadri, A.A.; García-Morales, M.; Navarro, F.J.; Partal, P. Effect of transesterification degree and post-treatment on the in-service performance of NCO-functionalized vegetable oil bituminous products. Chem. Eng. Sci. 2014, 111, 126–134. [Google Scholar] [CrossRef] [Green Version]
- Du, S.Y.; Wang, B. Micro-Mechanics of Composites; Science Press: Beijing, China, 1998. [Google Scholar]
- Pichler, C.; Lackner, R.; Aigner, E. Generalized self-consistent scheme for upscaling of viscoelastic properties of highly-filled matrix-inclusion composites—Application in the context of multiscale modeling of bituminous mixtures. Compos. Part B Eng. 2012, 43, 457–464. [Google Scholar] [CrossRef]
- Mori, T.; Tanaka, K. Average stress in matrix and average elastic energy of materials with misfitting inclusions. Acta Met. 1973, 21, 571–574. [Google Scholar] [CrossRef]
- Christensen, R.; Lo, K. Solutions for effective shear properties in three phase sphere and cylinder models. J. Mech. Phys. Solids 1979, 27, 315–330. [Google Scholar] [CrossRef]
- Buttlar, W.G.; Bozkurt, D.; AL-Khateeb, G.G. Understanding asphalt mastic behavior through micro-mechanics. Transp. Res. Rec. 1999, 1681, 157–169. [Google Scholar] [CrossRef]
- Shashidhar, N.; Shenoy, A. On using micromechanical models to describe dynamic mechanical behavior of asphalt mastics. Mech. Mater. 2002, 34, 657–669. [Google Scholar] [CrossRef]
- Kim, Y.-R.; Little, D.N. Linear Viscoelastic Analysis of Asphalt Mastics. J. Mater. Civ. Eng. 2004, 16, 122–132. [Google Scholar] [CrossRef]
- Yin, H.M.; Buttlar, W.G.; Paulino, G.H.; Benedetto, H.D. Assessment of existing micro-mechanical models for asphalt mastics considering viscoelastic effects. Road Mater. Pavement Des. 2008, 9, 31–57. [Google Scholar] [CrossRef]
- Nemat-Nasser, S.; Hori, M.; Bielski, W. Micromechanics: Overall properties of heterogeneous materials. Adv. Cem. Based Mater. 1995, 2, 561–587. [Google Scholar] [CrossRef]
- Hill, R. A self-consistent mechanics of composite materials. J. Mech. Phys. Solids 1965, 13, 213–222. [Google Scholar] [CrossRef]
- Underwood, B.S.; Kim, Y.R. A four phase micro-mechanical model for asphalt mastic modulus. Mech. Mater. 2014, 75, 13–33. [Google Scholar] [CrossRef]
- Ju, J.W.; Chen, T. Chen. micro-mechanics and effective moduli of elastic composites containing randomly dispersed ellipsoidal inhomogeneities. Acta Mech. 1994, 103, 103–121. [Google Scholar] [CrossRef]
- Ju, J.W.; Chen, T.M. Effective elastic moduli of two-phase composites containing randomly dispersed spherical inhomogeneities. Acta Mech. 1994, 103, 123–144. [Google Scholar] [CrossRef]
- Pei, J.; Fan, Z.; Wang, P.; Zhang, J.; Xue, B.; Li, R. micro-mechanics prediction of effective modulus for asphalt mastic considering inter-particle interaction. Constr. Build. Mater. 2015, 101, 209–216. [Google Scholar] [CrossRef]
- Wang, Z.; Guo, N.; Zhao, Y.; You, Z. Dynamic shear modulus prediction of asphalt mastic based on micro-mechanics. J. Jilin Univ. 2017, 47, 459–467. [Google Scholar]
- Bu, X.; Cheng, F. Research on performance of polyurethane-epoxy resin compound modified asphalt and its mixture. Highway 2016, 61, 171–174. [Google Scholar]
- Jin, X.; Guo, N.; You, Z.; Wang, L.; Wen, Y.; Tan, Y. Rheological properties and micro-characteristics of polyurethane composite modified asphalt. Constr. Build. Mater. 2019, 234, 117395. [Google Scholar] [CrossRef]
- GB/T1033.1-2008; Plastics-Methods for Determining the Density of Non-Cellular Plastics-Part 1: Immersion Method, Liquid Pycnometer Method and Titration Method. China National Standardization Management Committee: Beijing, China, 2008.
- GB/T 3903.2-2008; Footwear-General Test Methods—Abrasion Resistance. China National Standardization Management Committee: Beijing, China, 2008.
- GB/T1040.1-2006; Plastics-Determination of Tensile Properties—Part 1:General Principles. China National Standardization Management Committee: Beijing, China, 2006.
- GB/T 529-2008; Rubber, Vulcanized or Thermoplastic—Determination of Tear Strength. China National Standardization Management Committee: Beijing, China, 2008.
- GB/T 1843-2008; Plastics-Determination of Izod Impact Strength. China National Standardization Management Committee: Beijing, China, 2008.
- GB/T 2411-2008; Plastics and Ebonite-Determination of Indentation Hardness. China National Standardization Management Committee: Beijing, China, 2008.
- GB/T 1041-2008; Plastics-Detemination of Compressive Properties. China National Standardization Management Committee: Beijing, China, 2008.
- JTG E20-2011; Standard Test Methods of Bitumen and Bituminous Mixtures for Highway Engineering. Ministry of Transport of the People’s Republic of China: Beijing, China, 2011.
- Marcadon, V.; Herve, E.; Zaoui, A. Micromechanical modeling of packing and size effects in particulate composites. Int. J. Solids Struct. 2007, 44, 8213–8228. [Google Scholar] [CrossRef] [Green Version]
- Wang, Z.; Guo, N.; Yang, X.; Wang, S. Micromechanical Prediction Model of Viscoelastic Properties for Asphalt Mastic Based on Morphologically Representative Pattern Approach. Adv. Mater. Sci. Eng. 2020, 7915140. [Google Scholar] [CrossRef]
- Zhang, Y.L.; Ding, M.; Wang, J. . The Latest Engineering Geology Handbook; China Knowledge Press: Beijing, China, 2006. [Google Scholar]
- Zhou, F.P.; Lydon, F.D.; Barr, B.I.G. Effect of course aggregate on elastic modulus and compressive strength of high performance concrete. Cem. Concr. Research 1995, 25, 177–186. [Google Scholar] [CrossRef]
- Di Benedetto, H.; Olard, F.; Sauzéat, C.; Delaporte, B. Linear viscoelastic behavior of bituminous materials: From binders to mixes. Int. J. Road Mater. Pavement Des. 2004, 5, 163–202. [Google Scholar] [CrossRef]
- Herve, E.; Zaoui, A. N-Layered inclusion-based micromechanical modelling. Int. J. Eng. Sci. 1993, 31, 1–10. [Google Scholar] [CrossRef]


Publisher’s Note: MDPI stays neutral with regard to jurisdictional claims in published maps and institutional affiliations. |
© 2022 by the authors. Licensee MDPI, Basel, Switzerland. This article is an open access article distributed under the terms and conditions of the Creative Commons Attribution (CC BY) license (https://creativecommons.org/licenses/by/4.0/).