Article

Synthesis and Characterization of Novel NiW–CeO2 Composite Coating with Enhanced Corrosion and Wear Resistance

Laboratory of New Materials for Energy and Electrochemistry, Polytechnique Montréal, 2500 Chemin de Polytechnique, Montreal, QC H3T 1J4, Canada
*
Authors to whom correspondence should be addressed.
Coatings 2022, 12(7), 878; https://doi.org/10.3390/coatings12070878
Submission received: 18 May 2022 / Revised: 10 June 2022 / Accepted: 16 June 2022 / Published: 21 June 2022

Abstract

:
Compact and uniform NiW composite coatings filled with ceramic particles such as CeO2 were electrodeposited on brass substrates using direct current (DC) and a well–designed pulse reverse current waveforms (PRC). PRC coatings exhibited the noblest corrosion potential and lowest current density compared to DC–electrodeposited coatings. Among all PRC coatings, PRC–NiW–CeO2 demonstrated the highest corrosion potential (−4.72 × 10⁻¹ V) and the lowest current density (5.32 × 10⁻⁶ V). It also seems that the addition of CeO2 particles to the NiW matrix enhanced the wear resistance of the coatings, and the lowest wear volume of (133.10 × 103 µm3) and friction coefficient of 0.25 were obtained due to the formation of the uniform, void free and compact structures with a high content of CeO2 particles in the coating.

1. Introduction

In recent years, metal matrix composites (MMCs) with an excellent performance, have been widely used in aerospace, automotive, and electronics applications. These materials are prepared by adding various reinforcing phases [1,2,3]. Among MMCs, nickel–based alloys have been widely used in different industrial applications due to their outstanding performance and low cost [1]. Among various fabrication techniques, electrodeposition is one of the most common method of producing various metal matrix coatings [1,2,3,4,5,6,7]. The reinforcing phases (insoluble materials) are suspended in a conventional electrodeposition bath and co–deposited within the metal matrix during the electrodeposition process. These insoluble components can be in the form of powder, fiber or encapsulated particles. The electrodeposition of various Ni–based composites has been reported in which one or more of various metallic oxides such as CeO2, ZrO2, Al2O3, TiO2, MoO2 and carbides such as SiC were added into Ni–based electrodeposition baths [1,2,3,4,5,6,7,8,9,10,11,12,13,14,15,16,17]. Substantial improvements were observed in material properties such as micro–hardness, wear, and corrosion resistance as a result of the co–deposition of reinforcements phase(s) into the Ni matrix [1,2,3,4,5,6,7,8,9,10,11,12,13,14,15,16,17]. The degree of improvements in the properties depends on various factors such as the type and content of the reinforcement particles as well as their uniformity in distribution within the Ni–based matrix, electrodeposition parameters such as the operating temperature, agitation modes, applied current density, plating duration, and electrolyte formulation (i.e., type and concentration of ingredients) [1,2,3,4,5,6,7,8,9,10,11,12,13,14,15,16,17,18,19,20].
Among the various metal–oxide reinforcement particles, CeO2 can be attractive due to its special physical and chemical characteristics. CeO2 particles have been used as fillers for fabricating polytetrafluoroethylene–based composites where the tribological properties of the fabricated composites were improved significantly at high temperatures [21,22,23]. The co–deposition of CeO2 particles with Ni has been reported in a few articles. It was found that the addition of cerium oxide particles into the Ni matrix enhances the hardness, wear and oxidation resistance of the matrix [1,4,5,6]. However, the inclusion of cerium oxide particles within the Ni matrix should be dispersed uniformly without agglomeration. Therefore, electrodeposition parameters including the applied current density and operating temperature as well as the plating electrolyte need to be well–designed and optimized [1,7]. Zhou et al. [8] reported that the sound dispersion of CeO2 in the Ni matrix enhances mechanical, wear and corrosion properties of the Ni–CeO2 coating compared to bare Ni. They attributed this enhancement to the grain–refining effect of CeO2 in the Ni matrix and formation of passivation layer on the surface [8].
The properties of DC– and PRC–electrodeposited Ni–based composites can be further improved by alloying with other transition metals such as tungsten (W) [24,25,26,27,28,29,30]. To the best of our knowledge, there is no research reported on the DC and PRC electrodeposition of NiW–CeO2 composites or investigations on their microstructure and properties.
In this research work, a NiW–CeO2 deposit was fabricated by using the DC and PRC process and applying a unique pulsed reverse current waveform with electrodeposition bath chemistry containing specially selected ingredients. The effect of incorporating CeO2 ceramic particles within the NiW matrix enhanced the corrosion and wear performance of the deposit. The corrosion and wear performance of the PRC–NiW–CeO2 was compared to the Ni and NiW.
It possessed superior corrosion and wear performance compared to the DC– and PRC–electrodeposited Ni and NiW coatings.

2. Methodology

2.1. Electrolyte Components

The Ni electrodeposition bath was composed of nickel sulfate (NiSO4.6H2O), citric acid, o–Benzoic sulfimide (sodium saccharin, C7H5NO3S), propargyl–oxopropane–2,3–dihydroxy, and DuPont Capstone Fluorosurfactant F–63. The NiW electrodeposition electrolyte was prepared by adding sodium tungstate dehydrate (Na2WO42H2O) as a source of tungstate ions into the same electrodeposition bath that was used for the electrodeposition of Ni. Finally, the NiW–CeO2 bath was made by adding CeO2 particles and a dispersant agent such as polyethyleneimine into the NiW plating solution. Table 1 displays the ingredients of the bath chemistry as well as the optimized experimental parameters to obtain uniform and void–free NiW coatings with the desired mechanical and tribological performance.
In this formulation, to prevent the direct interaction between nickel and tungstate ions, citric acid was used to form stable complexes with tungstate (WO2+4) and nickel (Ni2+) ions. Such direct interaction would result in the formation of a non–soluble nickel tungstate compound in the electrodeposition bath [31,32]. Sodium saccharin was used to decrease the internal stress within the coating [33]. We used propargyl–oxo–propane–2 and 3–dihydroxy as a brightener and grain refiner to control the Ni ion diffusion towards the cathode. This type of compound is a specific type of propargyl derivative containing a carbon–carbon triple bond (i.e., –C≡C–H) at the end of its molecular chain which has a tendency to deposit preferentially at high current density areas (sharp areas) on the substrate during electrodeposition. Therefore, a uniform, mirror–finish surface and crack–free deposit was obtained [34]. Finally, capstone fluorosurfactant FS–63 (DuPont), which is a low foaming type anionic fluorosurfactant, was utilized as a wetting agent to remove hydrogen gas bubbles from the substrate surface and to reduce the surface tensions [35].

2.2. Substrate Preparation

The surface of brass substrates were degreased, activated, and rinsed prior to the electrodeposition process followed by immersion into 50 g·L−1 alkaline soap solution (TEC1001; Technic Inc., Cranston, RI, USA) at a temperature of about 50 °C for approximately 1 min. Then, the substrates were rinsed with deionized (DI) water and activated by immersion into dilute sulfuric acid (10% v/v) at room temperature for about 10 s followed by rinsing with DI water. The water break test was performed to evaluate the cleanliness of the substrates. In this testing protocol, the brass substrates were gently rinsed with DI water following the final rinse step. The substrates were considered clean if the water completely wetted the surface.

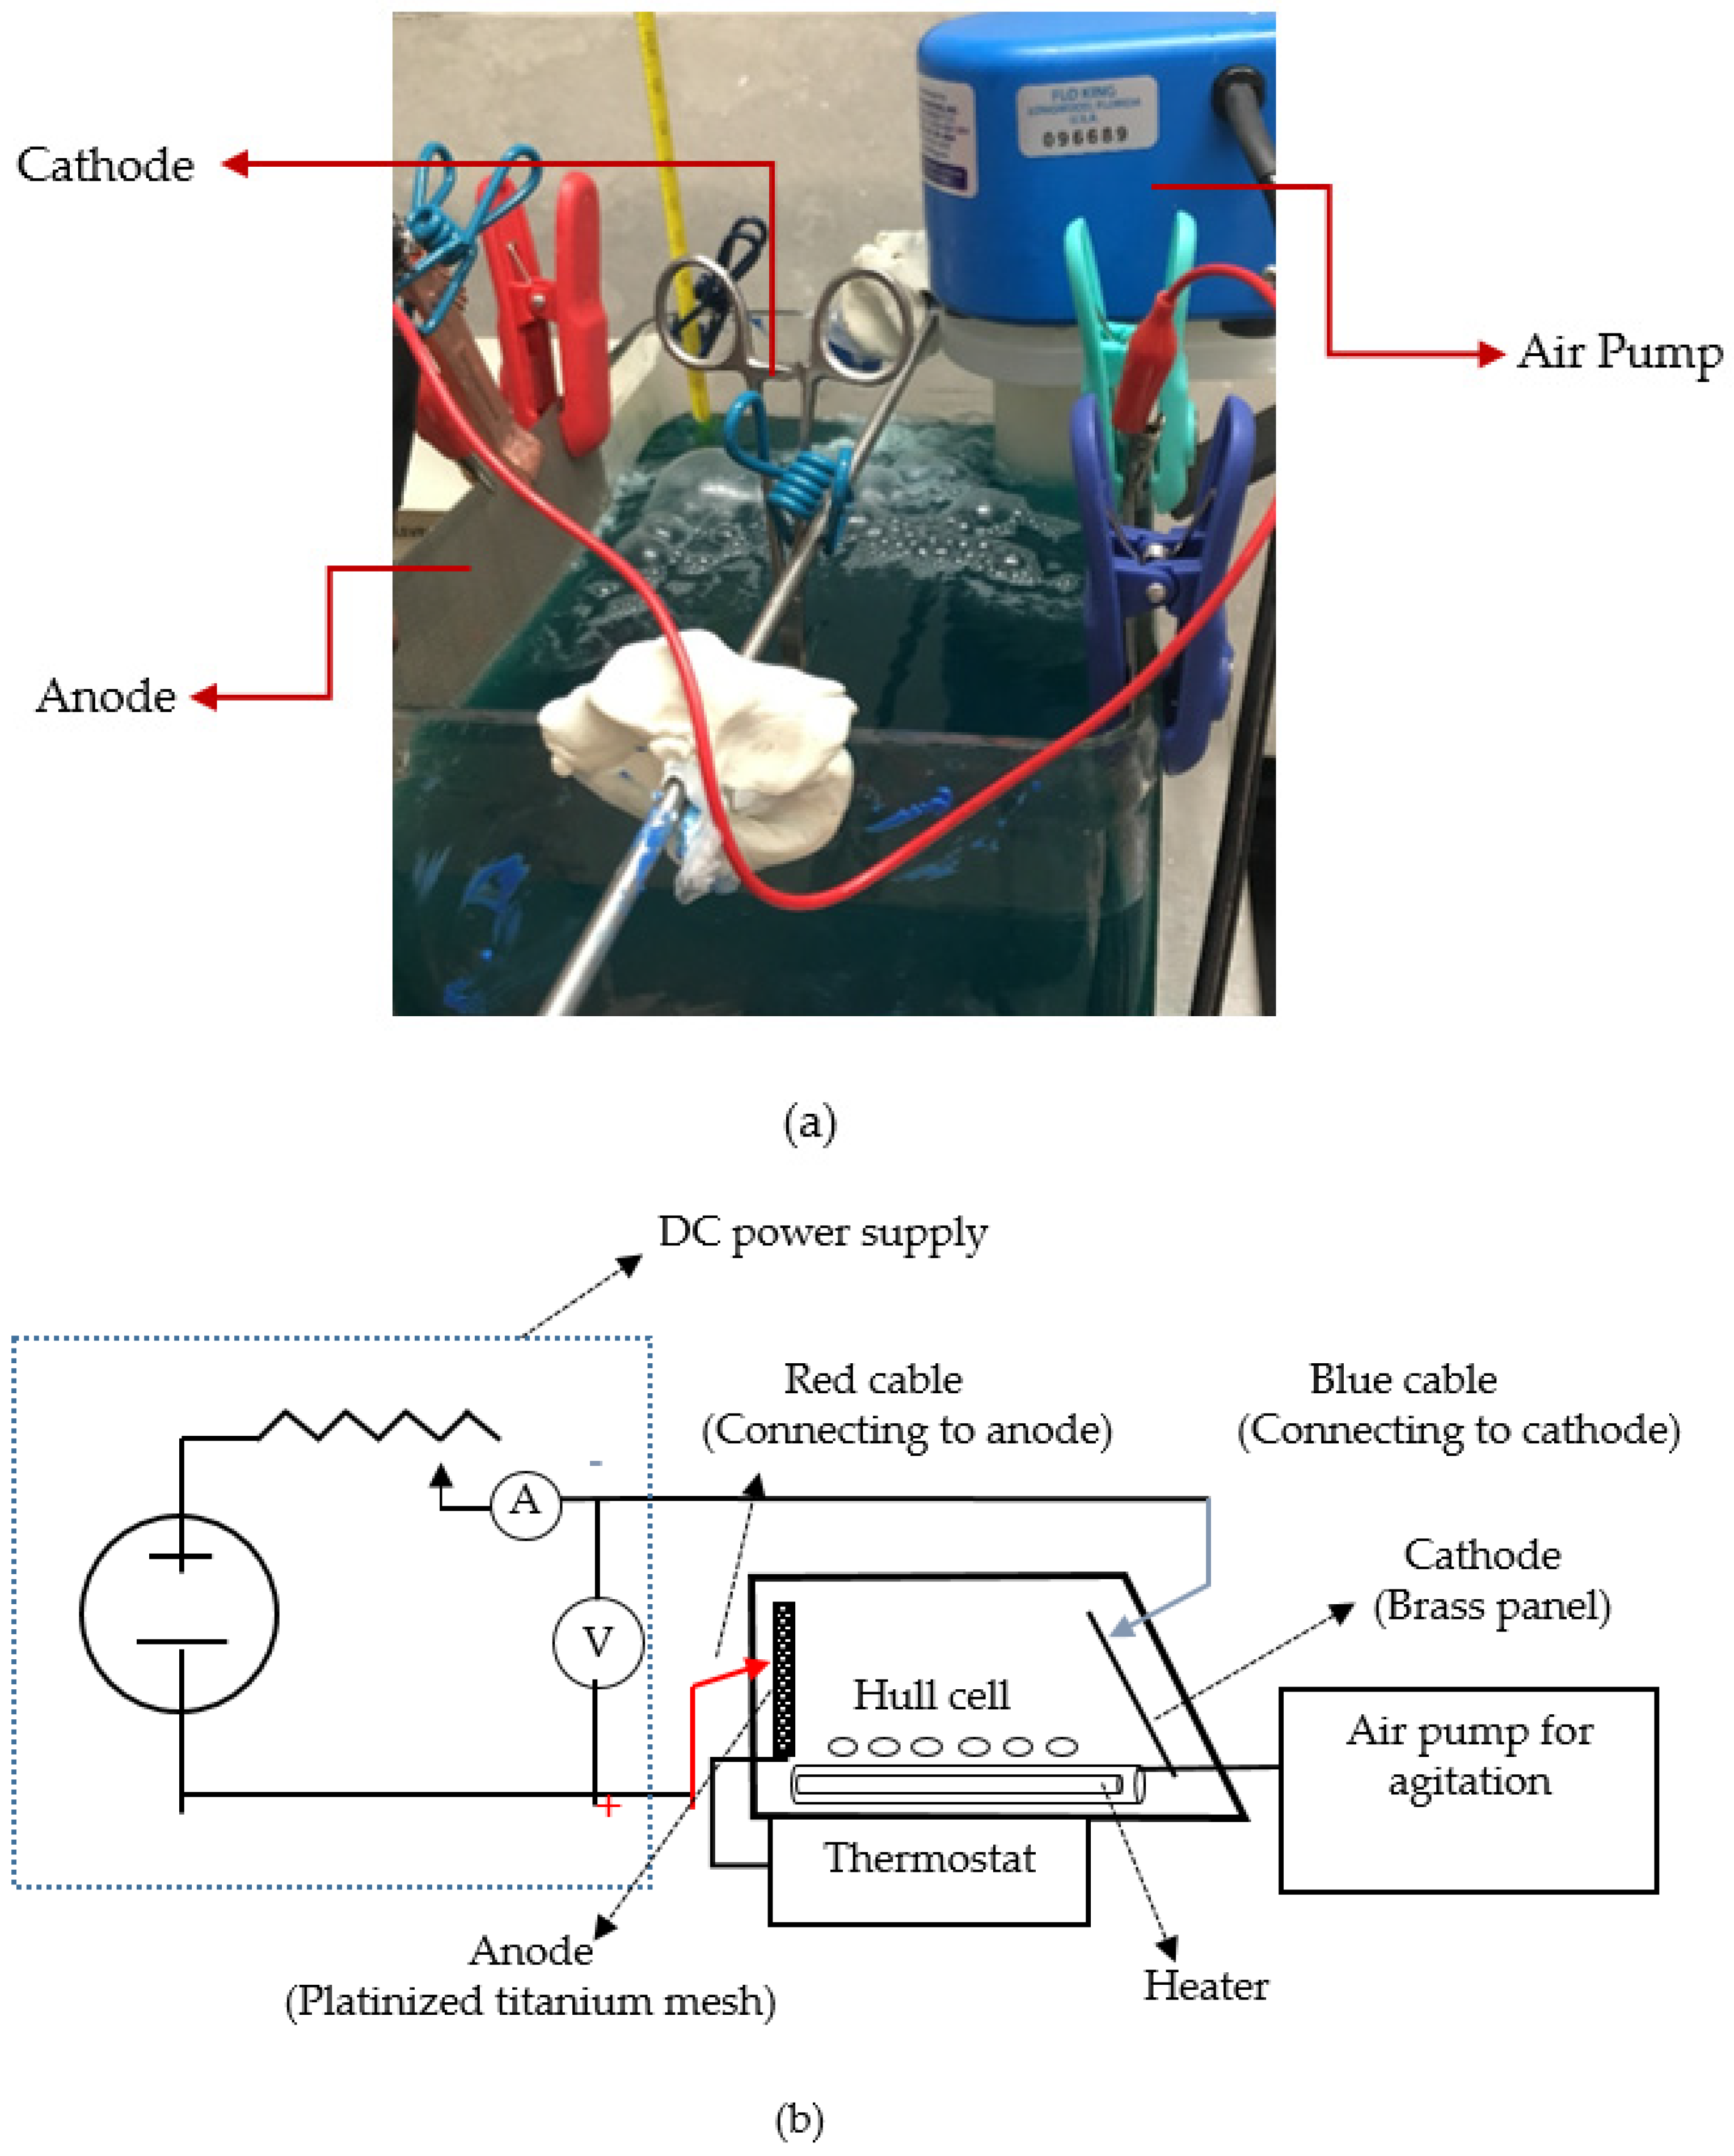
2.3. Electrodeposition Setup

The electrodeposition bath setup is displayed in Figure 1a. The electrodeposition setup was composed of an electrodeposition tank containing the electrolyte, a filter pump (Flo King Filter System Inc., Longwood, FL, USA) to provide adequate agitation, two anodes made of stainless steel mesh, a cathode made of brass as the substrate being electrodeposited, and a reversed pulse plating power supply (Model pe8005, Plating Electronic GmbH, Sexau, Berlin, Germany). The electrodeposition bath was placed inside a water–circulating bath operating at a 60 °C temperature.
A hull cell (Figure 1b) equipped with a heater, thermostat air agitation and air pump was used to perform the initial electrodeposition experiments to characterize and improve the current density distribution throughout the substrate surface. A brass substrate was used as the cathode and a platinized titanium mesh sheet was used as the anode.

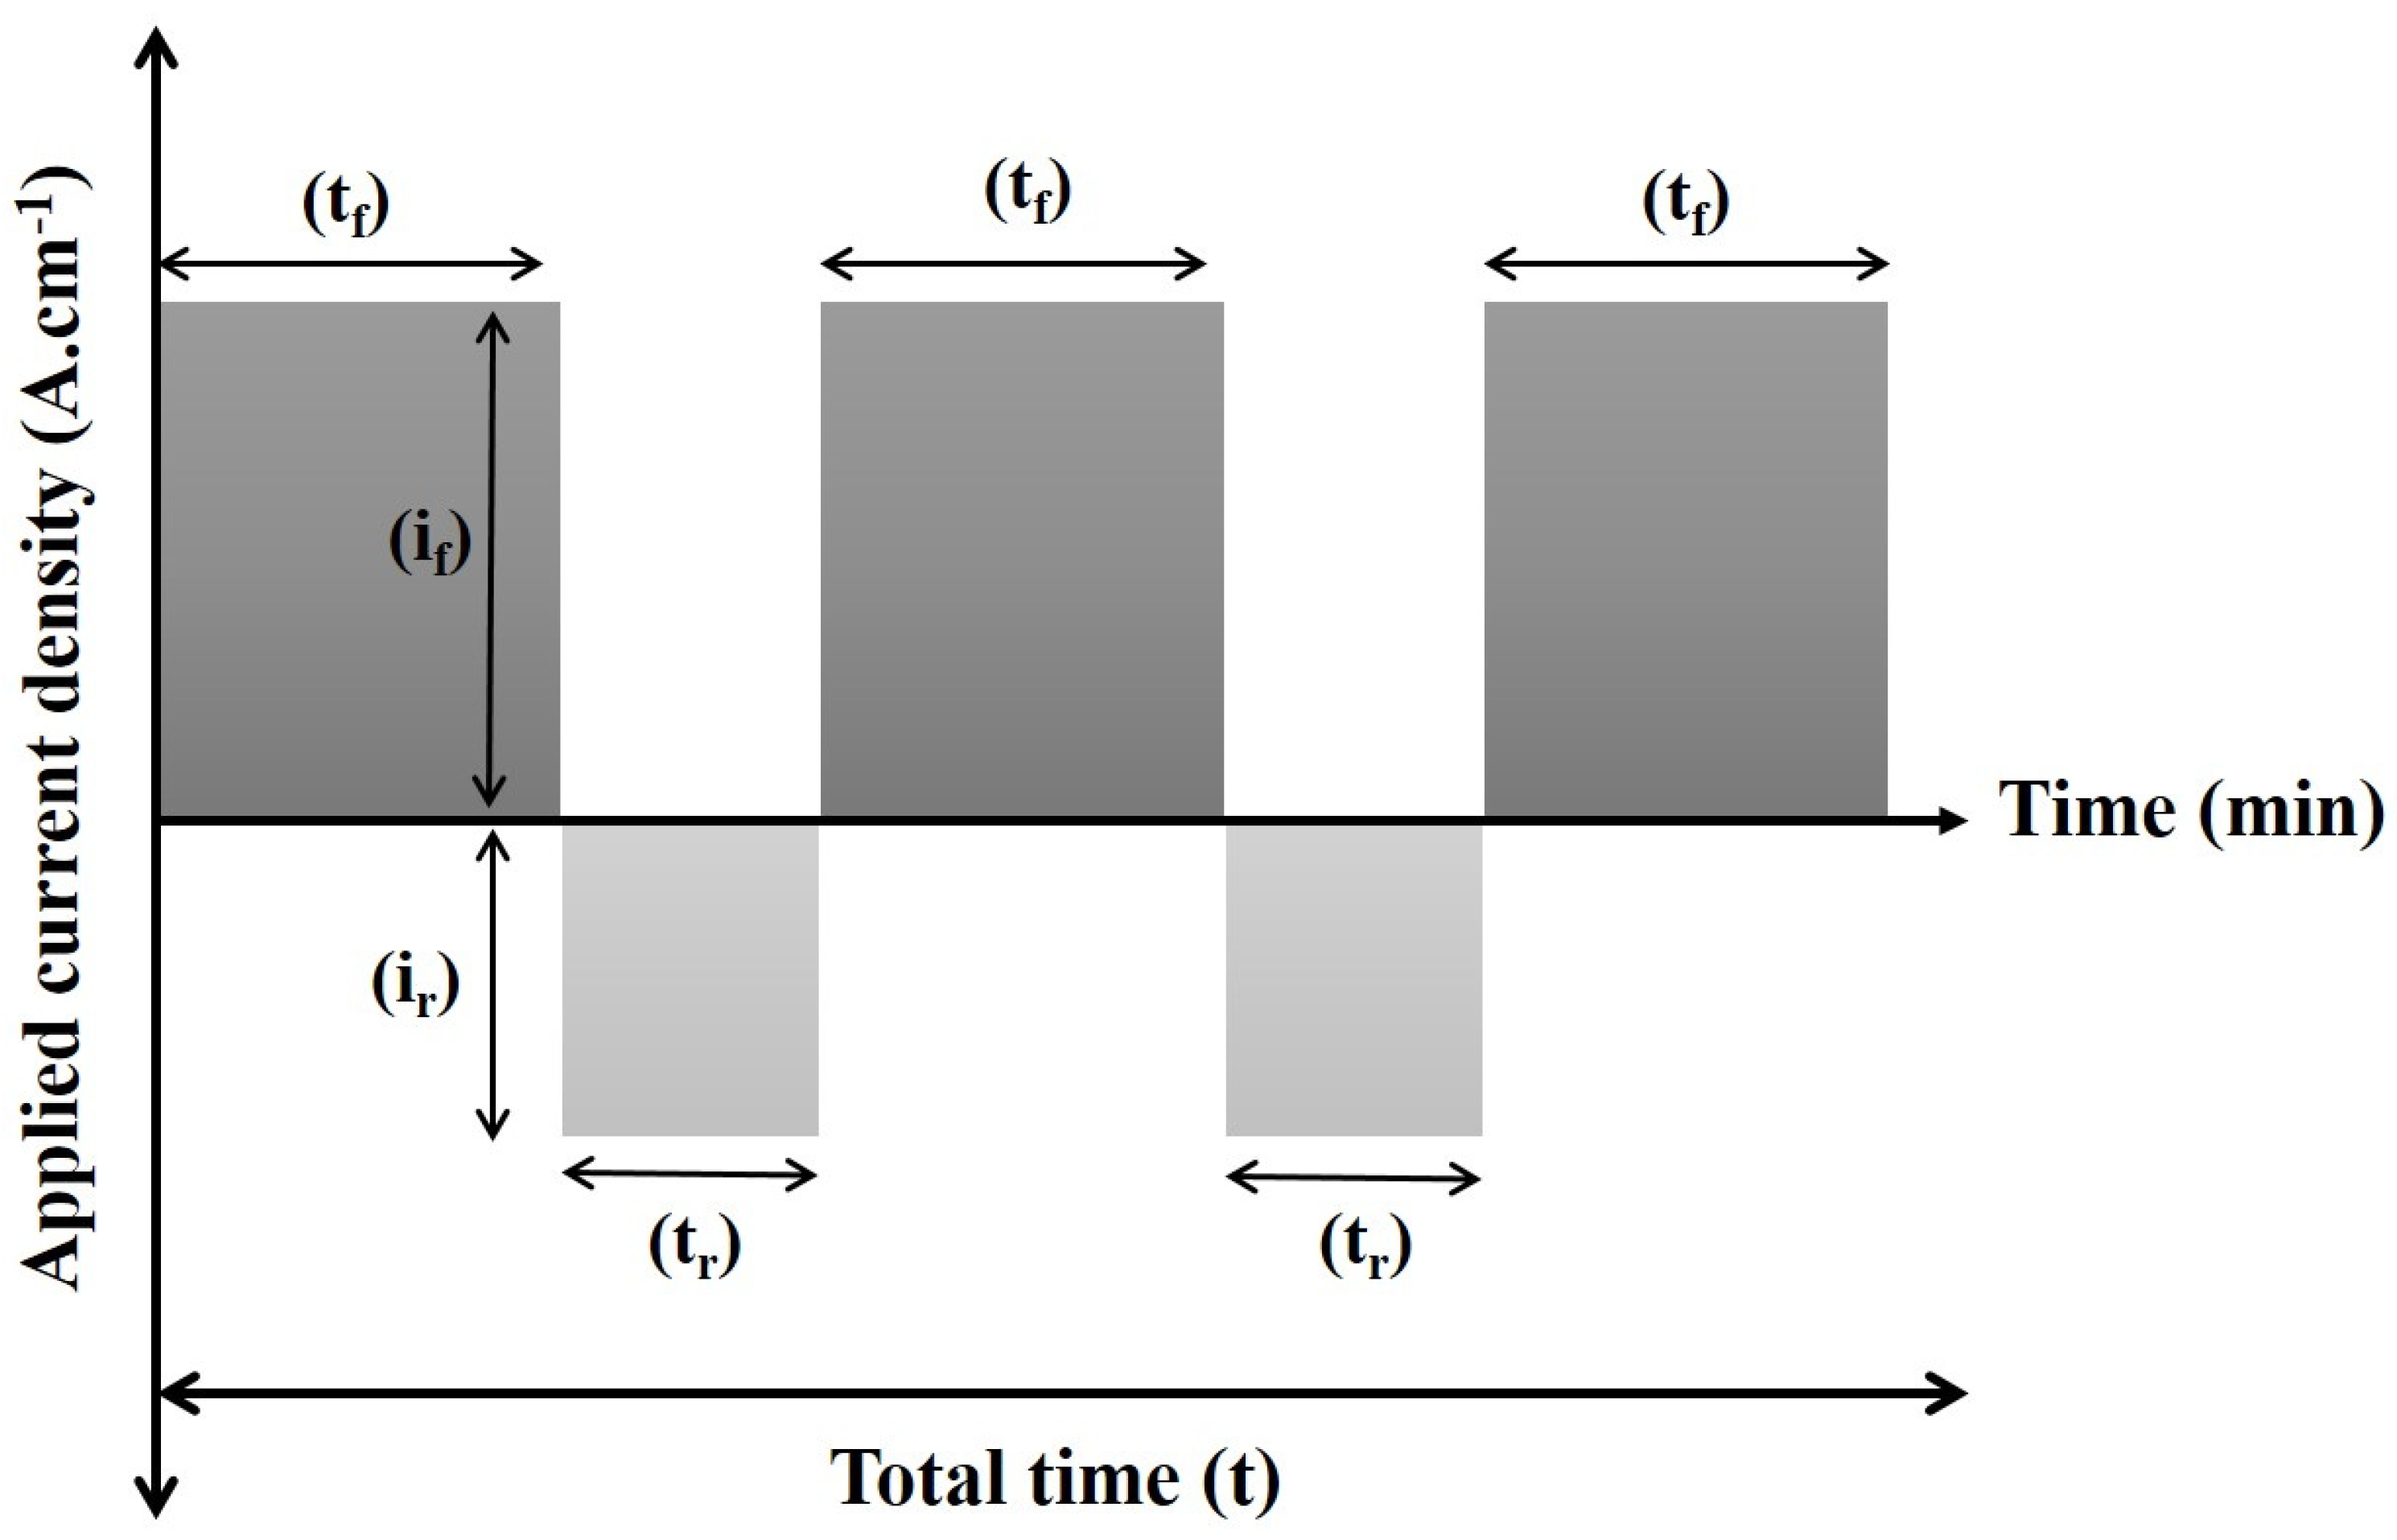
2.4. Optimization of PRC Waveform

The PRC current waveform was designed with regard to its forward and reverse current densities (If and Ir) and pulse durations (tf and tr). The schematic diagram of the applied PRC waveform is displayed in Figure 2.

2.5. Characterization of Deposits

The tungsten content, surface morphology of the deposits, and grain size were characterized by energy dispersive spectroscopy (EDS), scanning electron microscopy (SEM, Joel 7600 TFE), and X-ray diffraction (XRD, Bruker D8 Advance), respectively.
Potentiostat (Princeton Applied Research Potentiostat/Galvanostat Model 273A) was used to investigate the corrosion behavior of the deposits. The potentiostat was equipped with CorrWare software to apply potential scans remotely through the software. Potentiodynamic polarization (PP) scans were performed from −0.6 to 1.0 V vs. Ecorr at room temperature and at a 5 mV·s−1 scan rate. For all the PP experiments, a silver/silver sulfate electrode and graphite rod were used as reference and counter electrodes, respectively. The surface of the substrate was covered with an insulating 3M tape to expose 1 cm2 of the surface to corrosive media (artificial sea water). Table 2 displays the composition of the artificial sea water.
Pin–on–disk (Custom–built) and Profilometer (Bruker Dektak XT) were performed to measure the coefficient of friction and wear volume of the removed material. The tests were performed under dry air conditions and ambient temperature. Spherical Al2O3 steel balls with a diameter of 4.7 mm were used for the friction test. The sliding velocity and the number of revolutions were 180 mm/s and 3500, respectively. For all of the experiments, the applied load was 1N. The coefficients of friction were continuously recorded with respect to the number of revolutions. Each friction experiment was repeated three times and the average results were obtained.

3. Results and Discussion

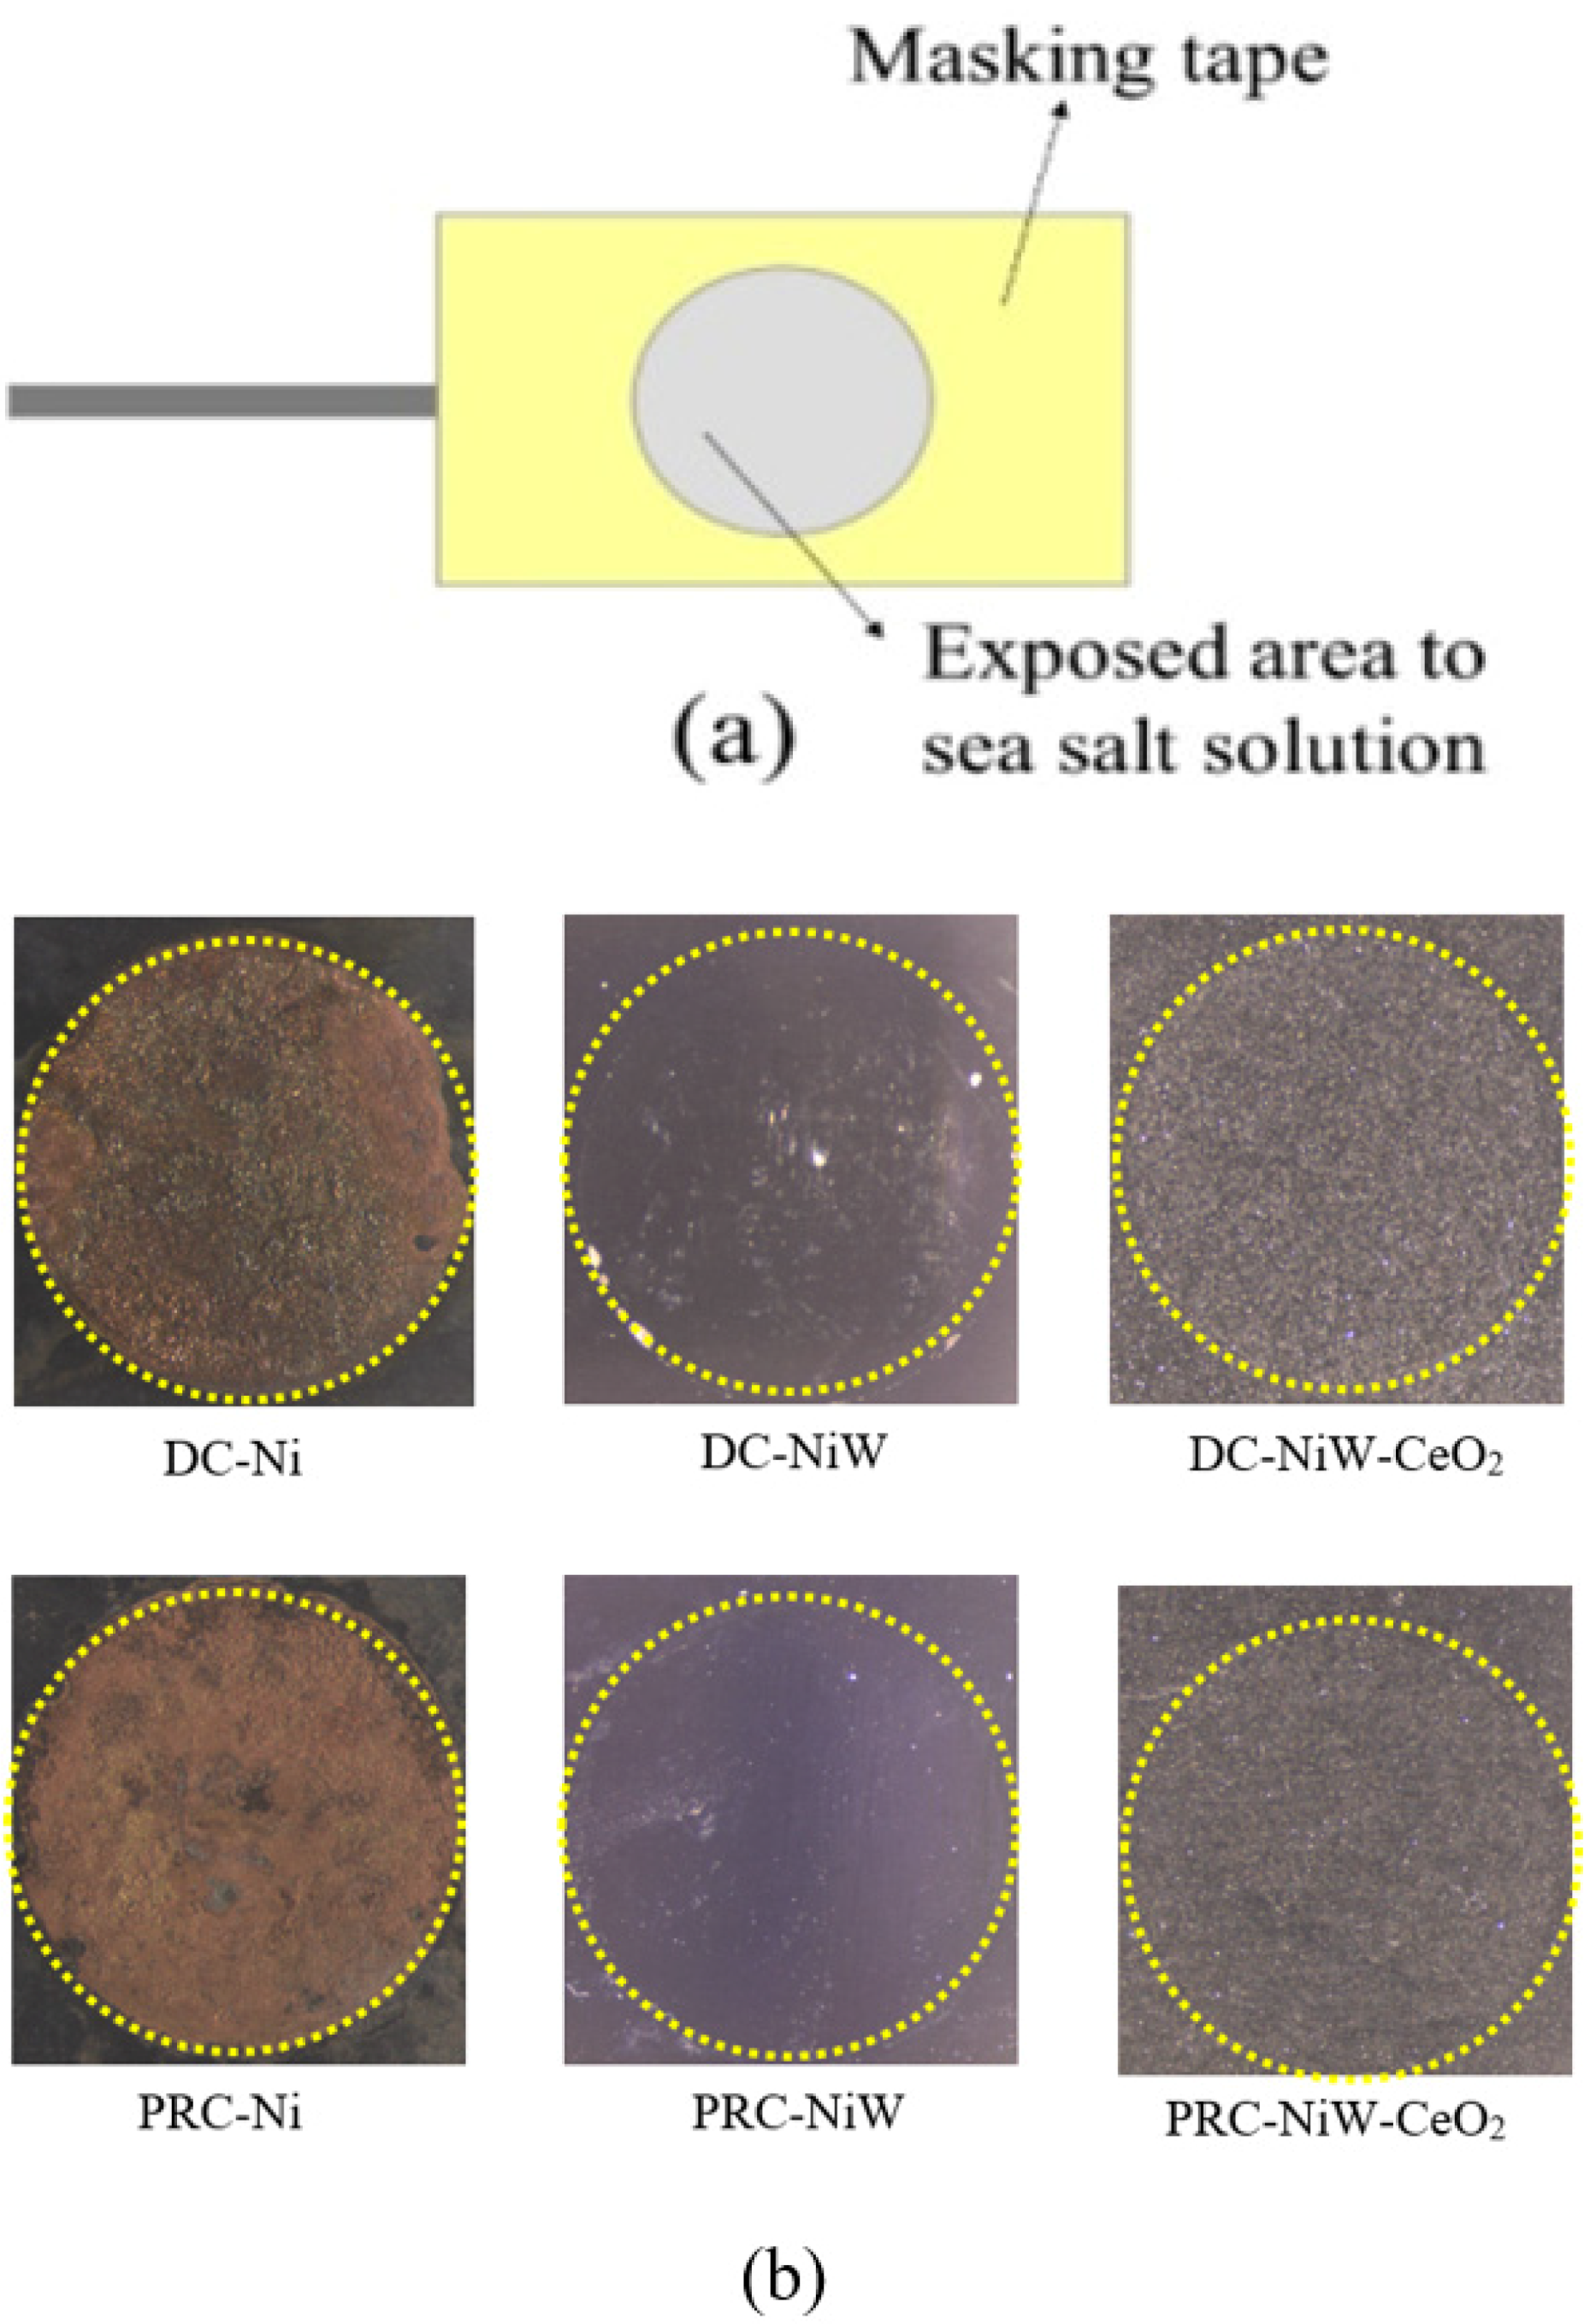
3.1. Corrosion Analysis

3.1.1. Cyclic Potentiodynamic Polarization (CPP)

Figure 3 displays the CPP graphs for DC– and PRC–electrodeposited Ni, NiW, and NiW–CeO2 coatings. As can be observed, in an anodic polarization scan, potential scanning starts from the corrosion potential (Ecorr) after reaching the steady state value. The rapid rise in current density before reaching the oxygen evolution potential could be attributed to the following factors: (1) local dissolution of the oxide film in the presence of corrosive ions; and (2) defective passive layer that can lead to the instability of the passive film over the passive region. Below the oxygen evolution potential, these defects are active and begin to extend, resulting in the rise of the current density [36,37,38]. In order to investigate the materials’ response to the pitting or localized corrosion after increasing the current density at the pitting corrosion, the scanning direction of the potential was changed from positive values towards the negative values. It can be observed that both DC– and PRC–deposited NiW–CeO2 exhibited a negative hysteresis loop, indicating the re–passivation of pits compared to DC– and PRC–coated Ni and NiW with positive or zero hysteresis loops. In fact, during the reversal scan, the reversed anodic curve shifted to lower current densities, in contrast to the forward scan. This indicates the uniform corrosion and restoration of the damaged passive film at higher potentials.
The corrosion potential values for DC– and PRC–deposited Ni, NiW, and NiW–CeO2 extracted from Figure 3 are displayed in Figure 4. As it can be seen, PRC–NiW–CeO2 demonstrated the more noble corrosion potential. It was also speculated that the difference in the grain structures of the coatings deposited by various current waveforms (DC and PRC), and outstanding corrosion properties of CeO2, were mainly responsible for different corrosion behaviors.

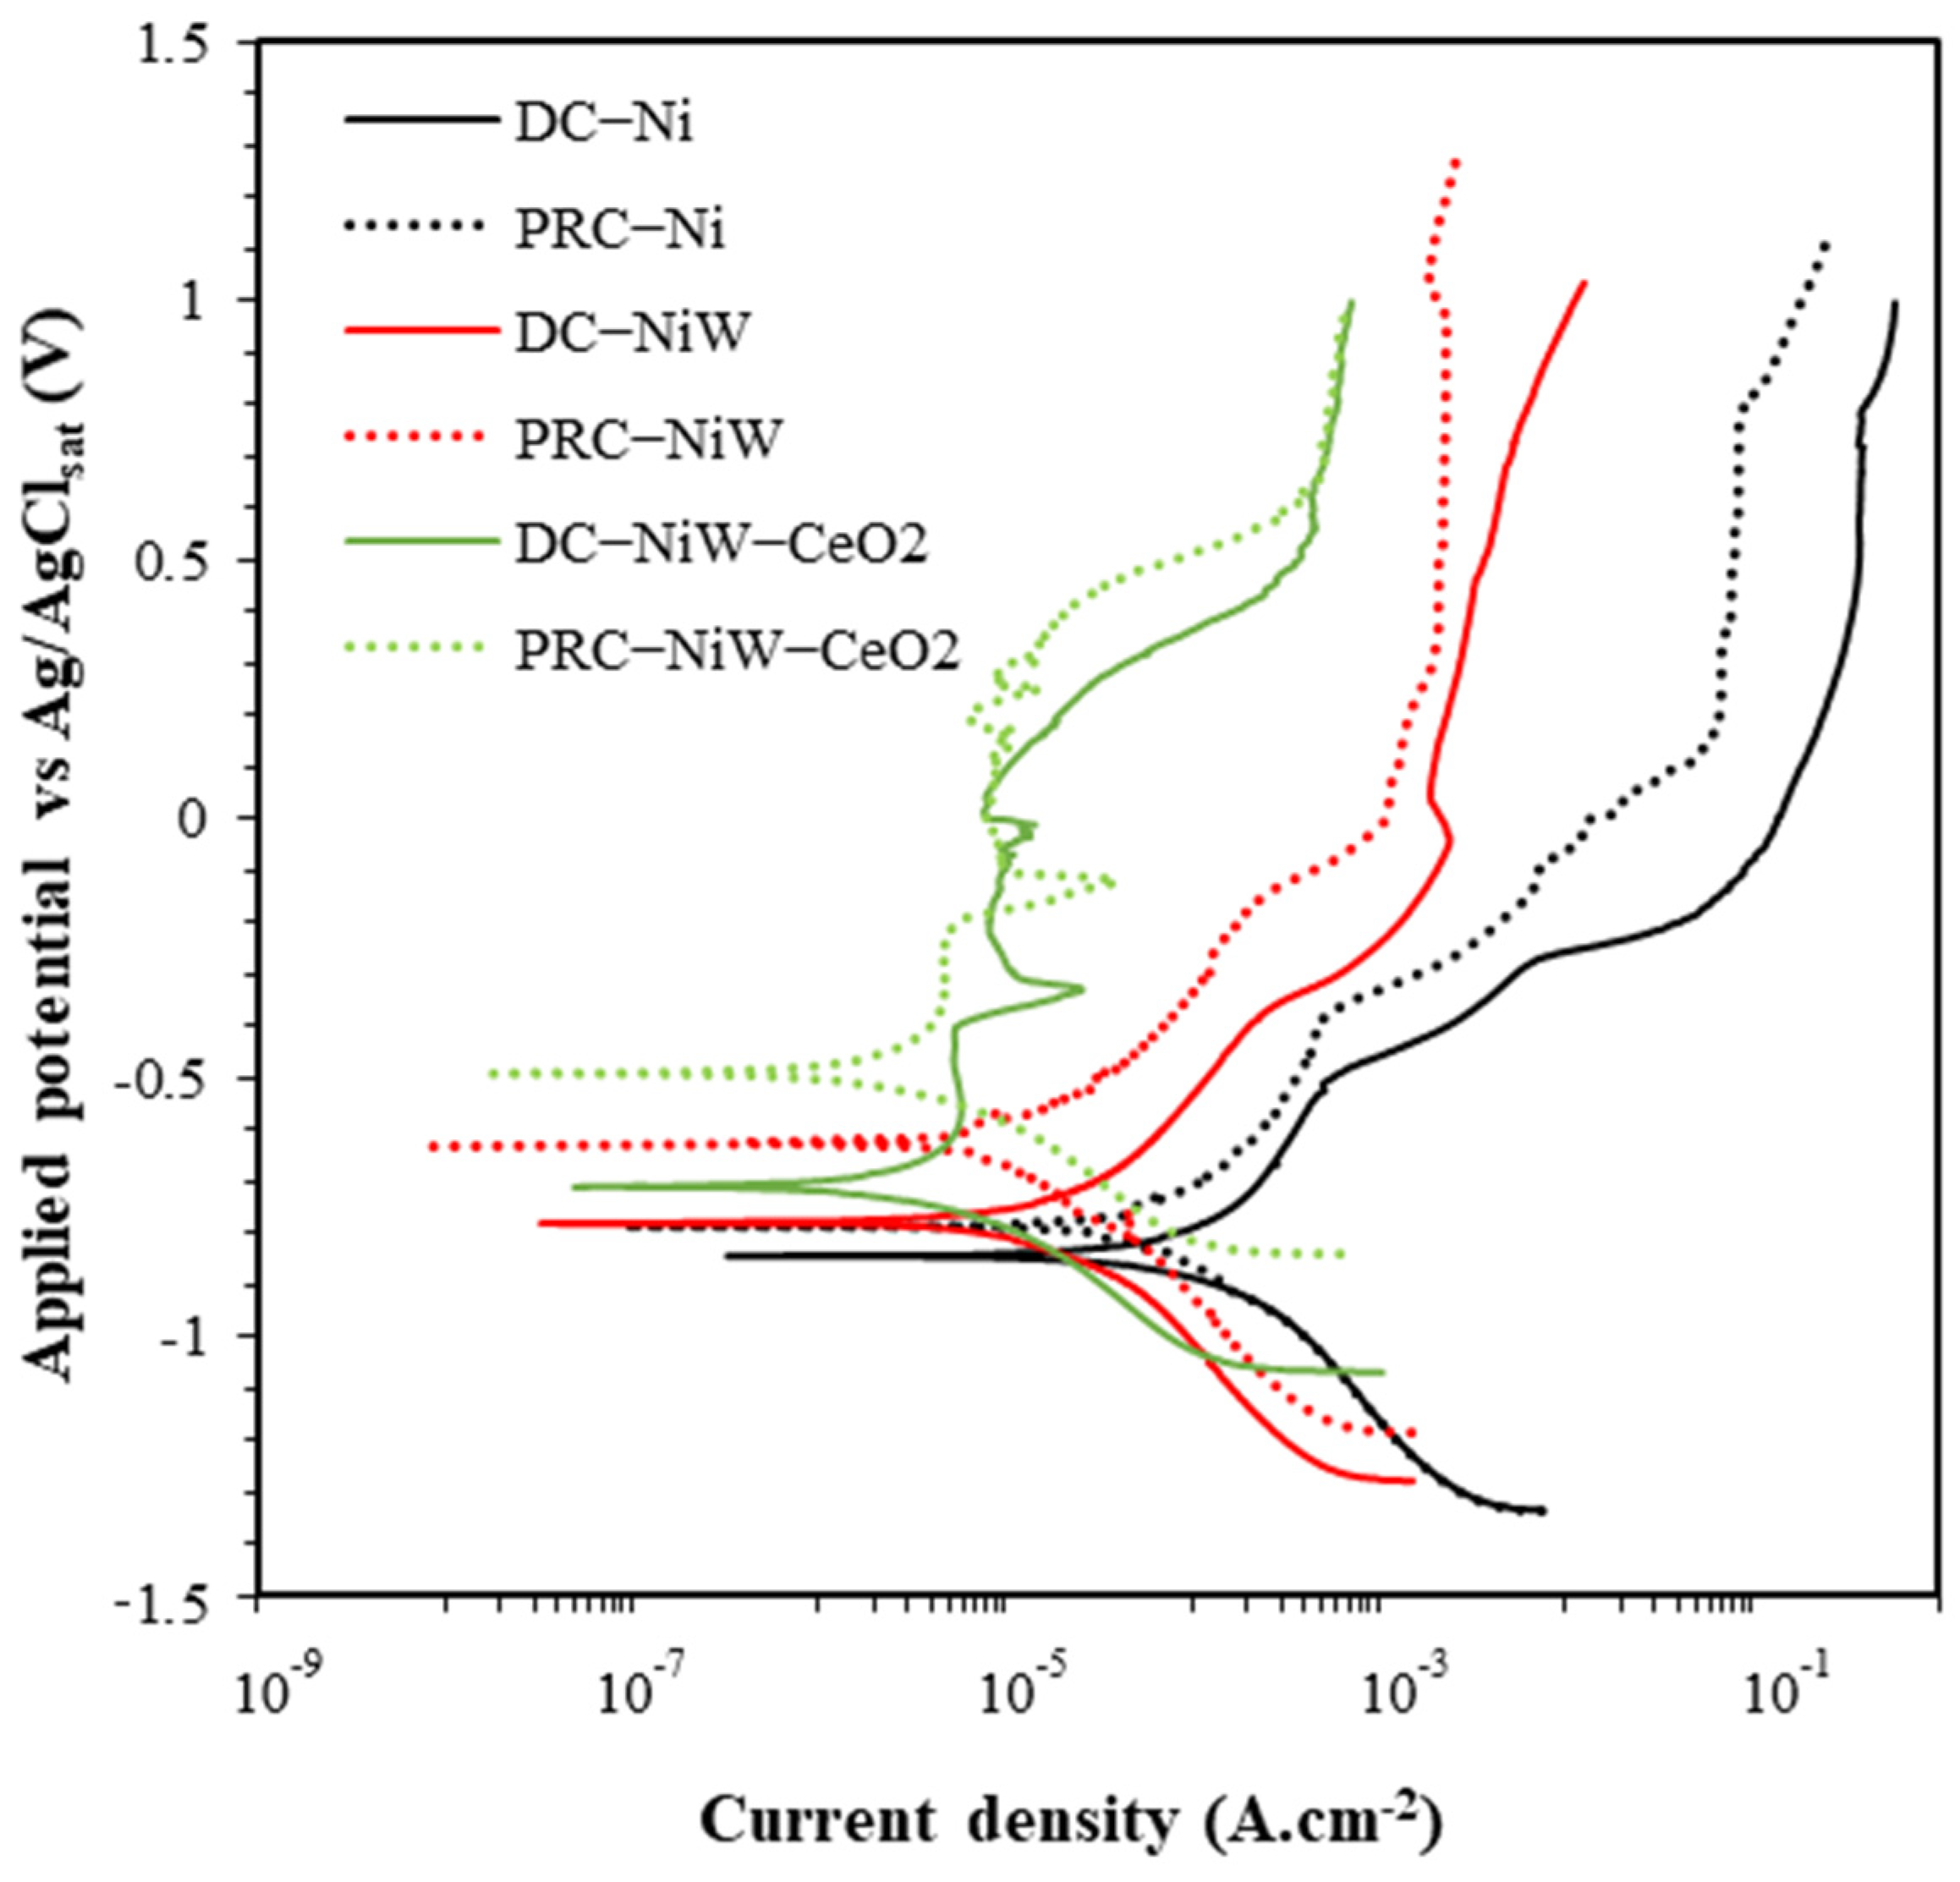
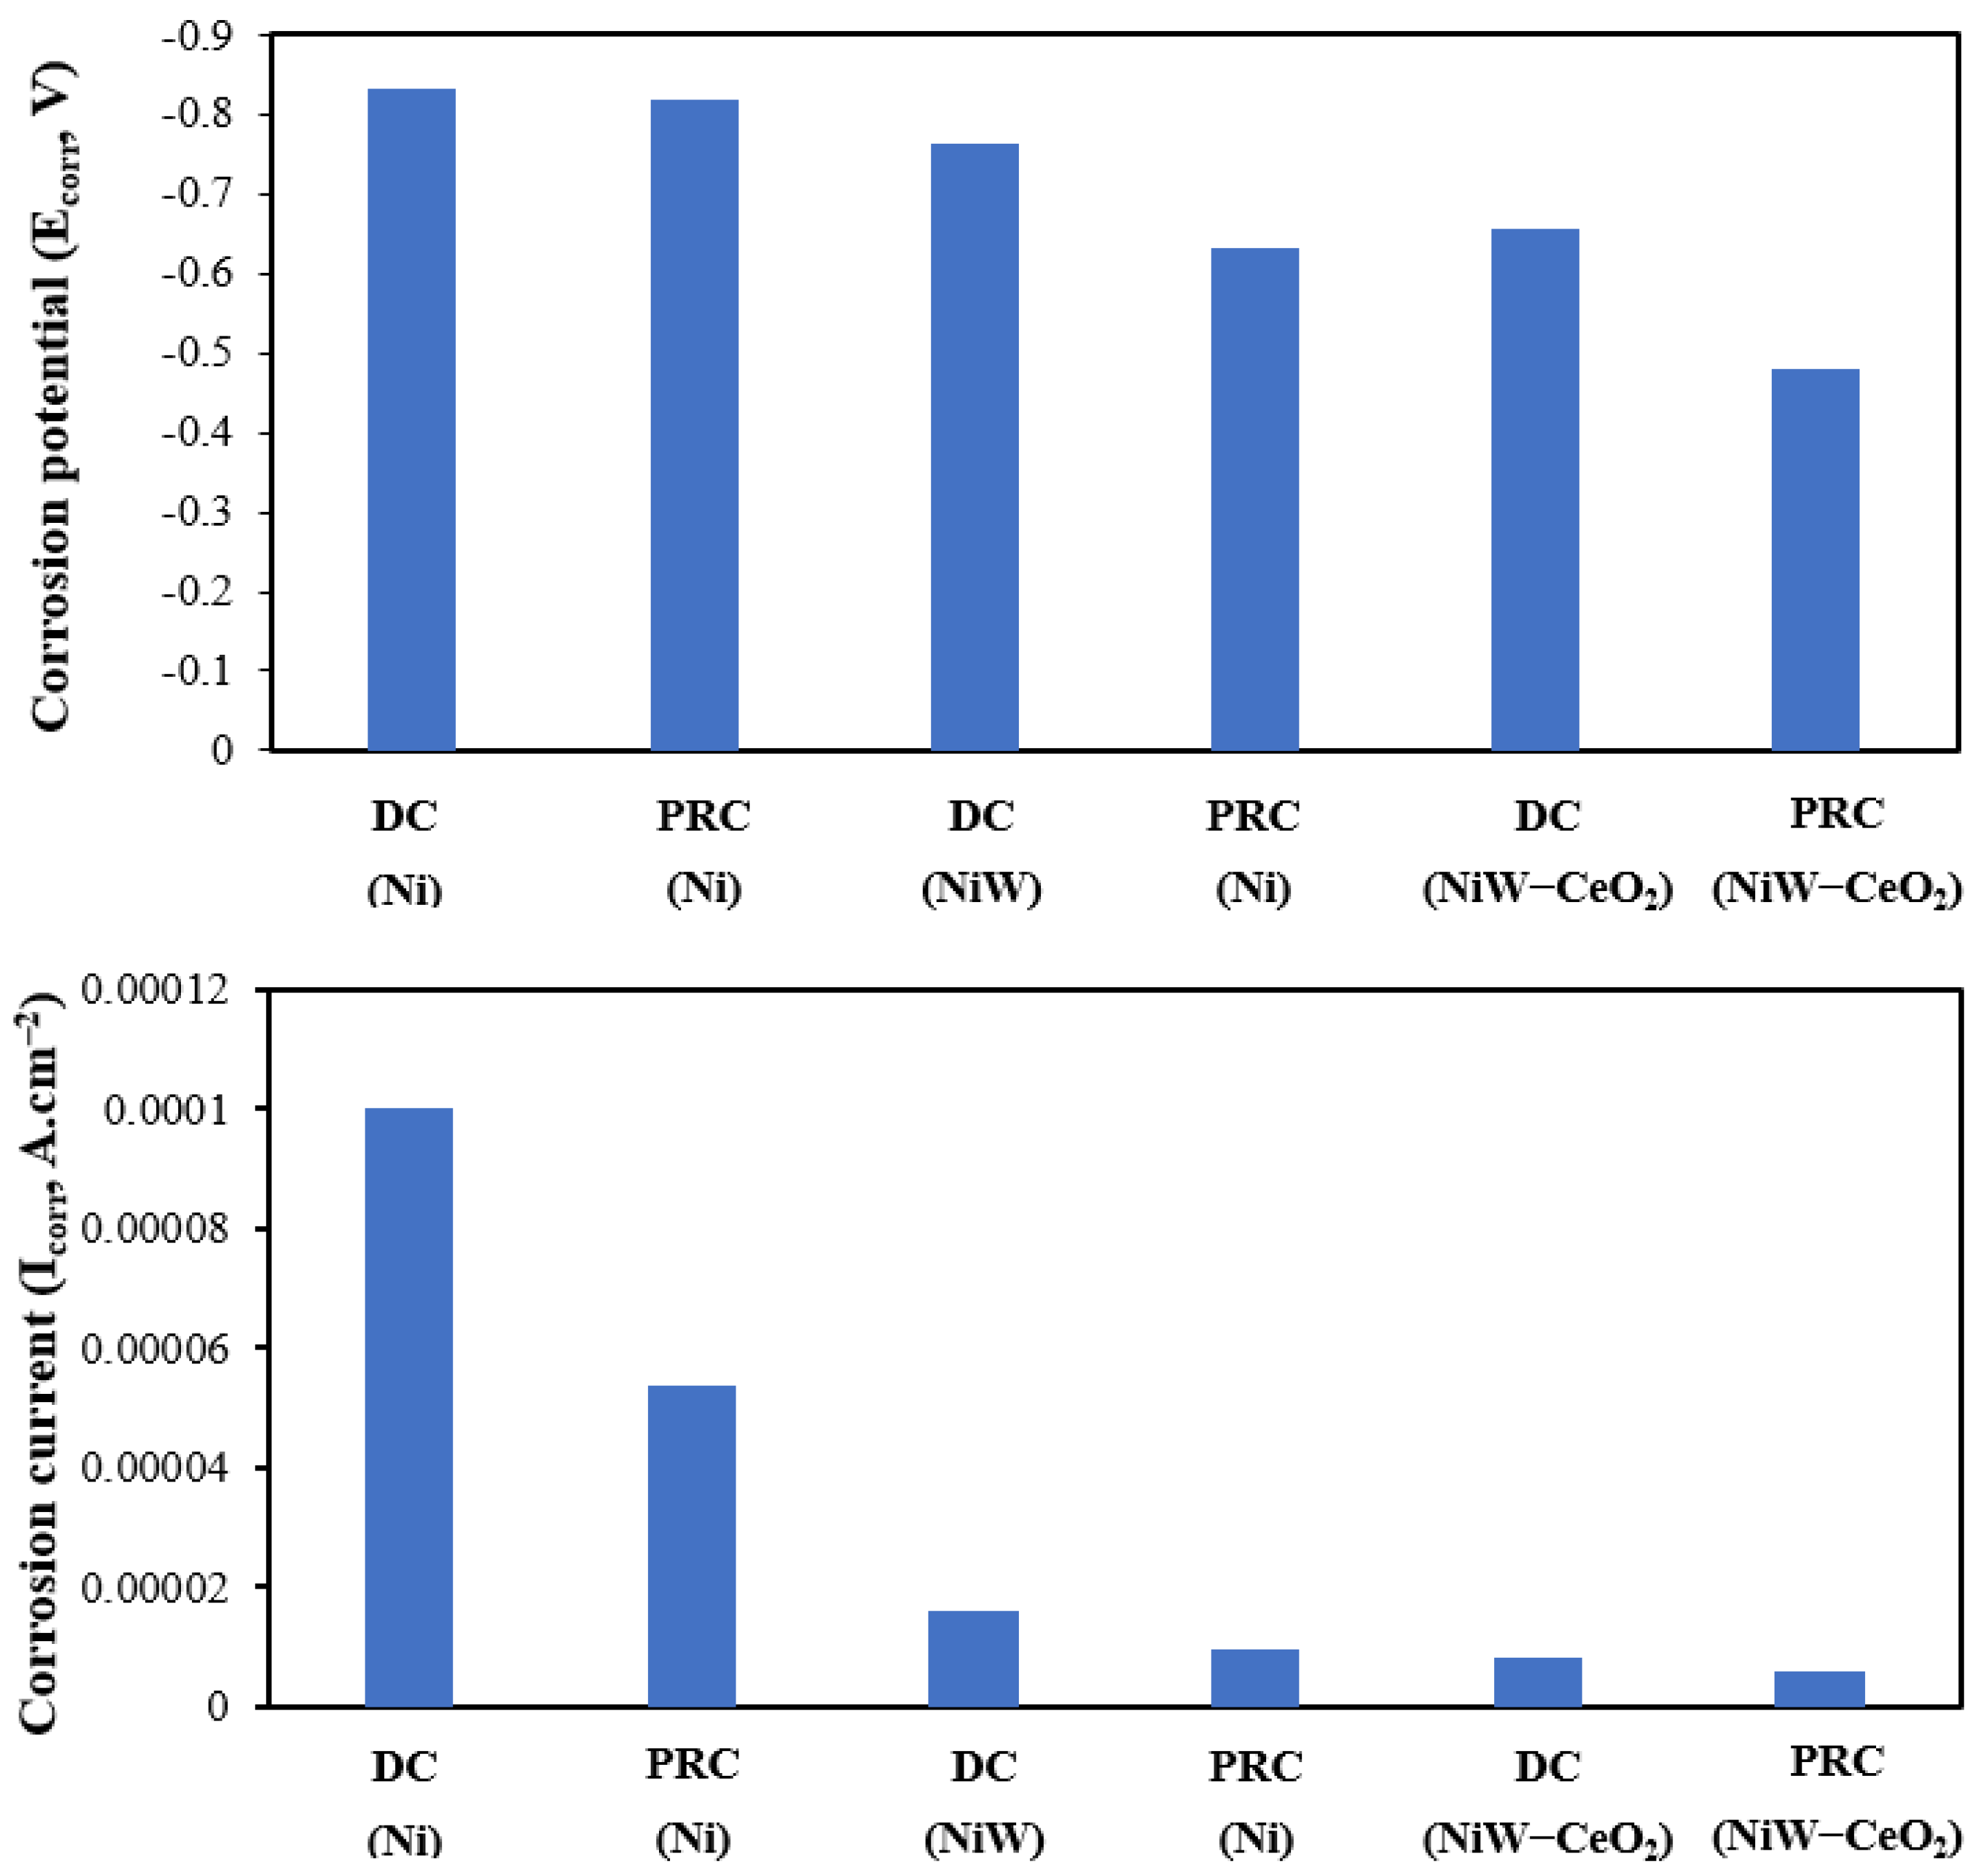
3.1.2. Potentiodynamic Polarization (PP)

Potentiodynamic polarization graphs of the DC– and PRC–deposited Ni, NiW, and NiW–CeO2 are displayed in Figure 5. The parameters of corrosion potential (Ecorr) and corrosion current density (Icorr) extracted from the polarization graphs in Figure 5 are demonstrated in Figure 6 for all the deposits. As it can be observed, the corrosion resistance improves in the following order for deposits:
DC–Ni < PRC–Ni < DC–NiW < DC–NiW–CeO2 < PRC–NiW < PRC–NiW–CeO2
The sharp increase in the anodic current density with increasing potential is attributed to the pitting corrosion that can be seen for all samples. For DC– and PRC–deposited Ni and NiW coatings, no passive region was established before pitting. However, for DC and PRC coatings, two wide, passive regions were observed. This could be due to the higher corrosion resistance and stability of the coatings in the corrosive media. Furthermore, for all coatings, a sudden increase in the anodic current density was observed at higher positive potentials due to the local breakdown or dissolution of the passive film which can lead to the failure of the coating. This could be attributed to the non–stability of the passive film in corrosive media at higher positive potentials.
Following the PP–tests, the masking tapes were removed from DC– and PRC–electrodeposited Ni, NiW, NiW, and NiW–CeO2 specimens and optical micrographs (Figure 7b) were taken from the surface of specimens. Figure 7a displays the schematic diagram of the specimen after masking the surface with tape and exposing the 1 cm2 unmasked surface area. As it can be seen from the optical micrographs, the DC– and PRC–deposited Ni deposits were completely corroded and pulled off the surface, whereas the surface of the DC– and PRC–electrodeposited NiW showed discoloration. This could be due to formation of passive films such as NiWO4 which can act as physical barriers in the initiation and propagation of corrosion. No damages were observed on the surface of DC– and PRC–deposited NiW–CeO2 after the PP–test. The optical micrographs in Figure 7b are correlated to the PP–test results as demonstrated in Figure 5.

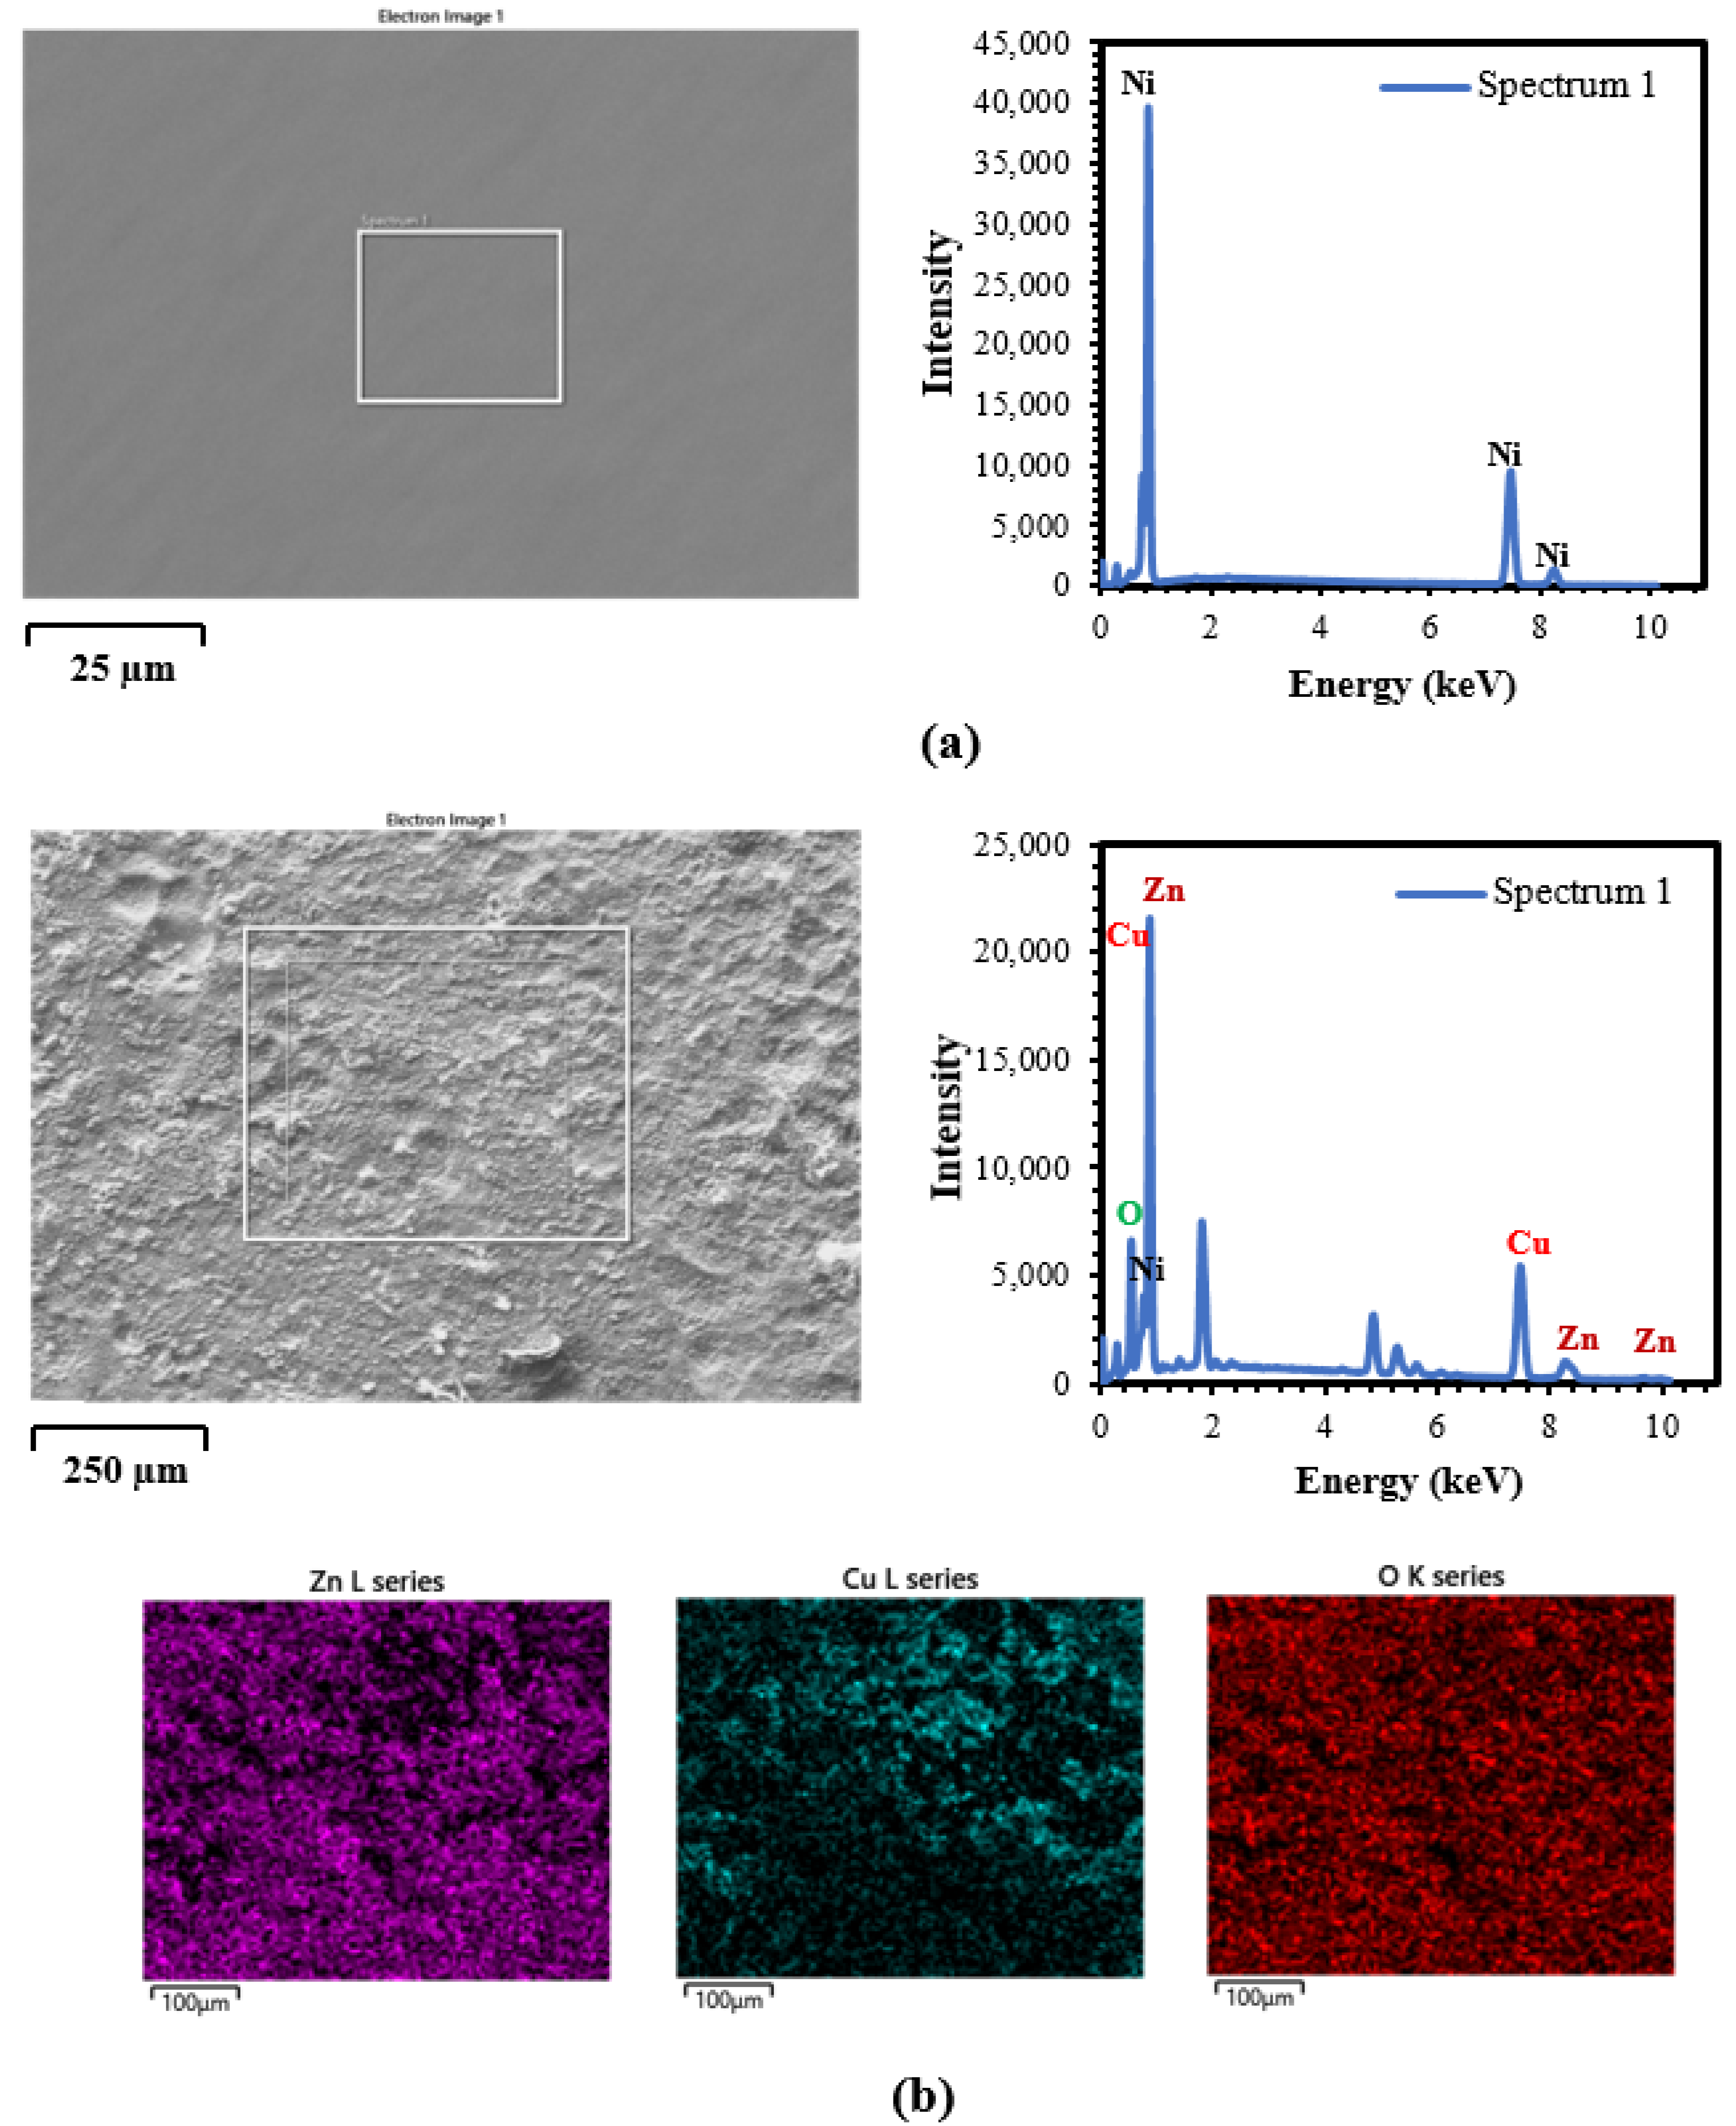
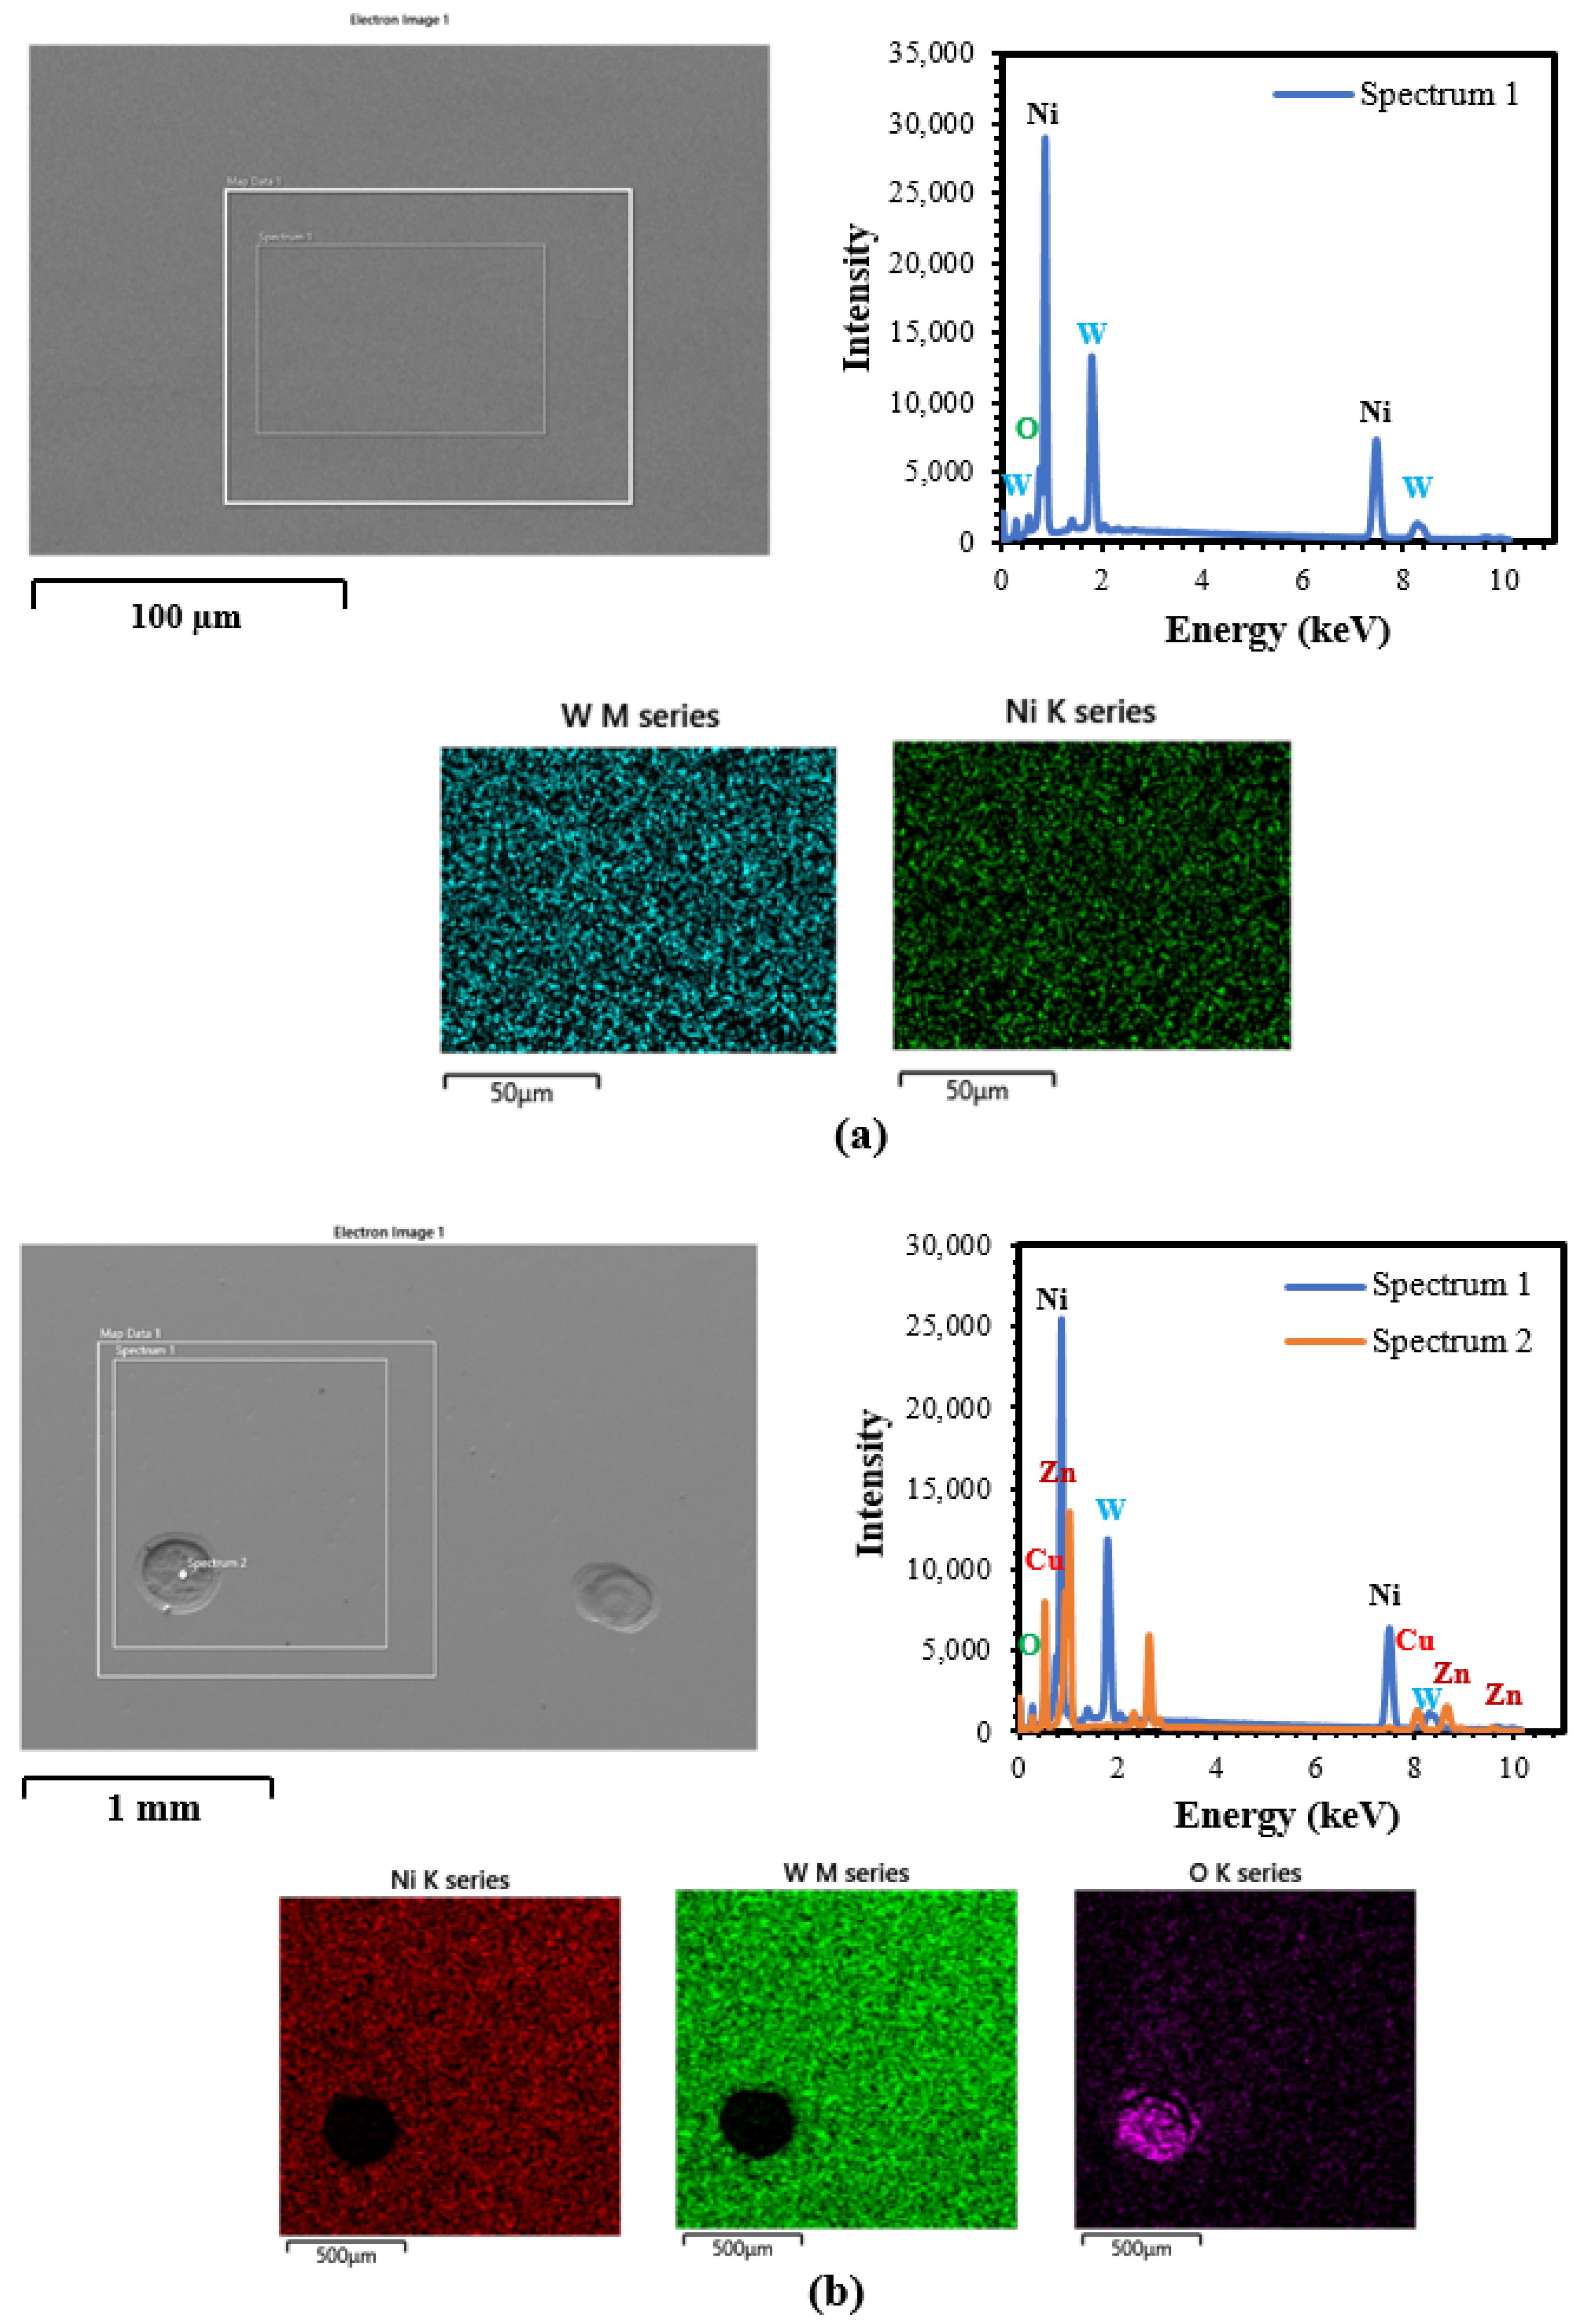
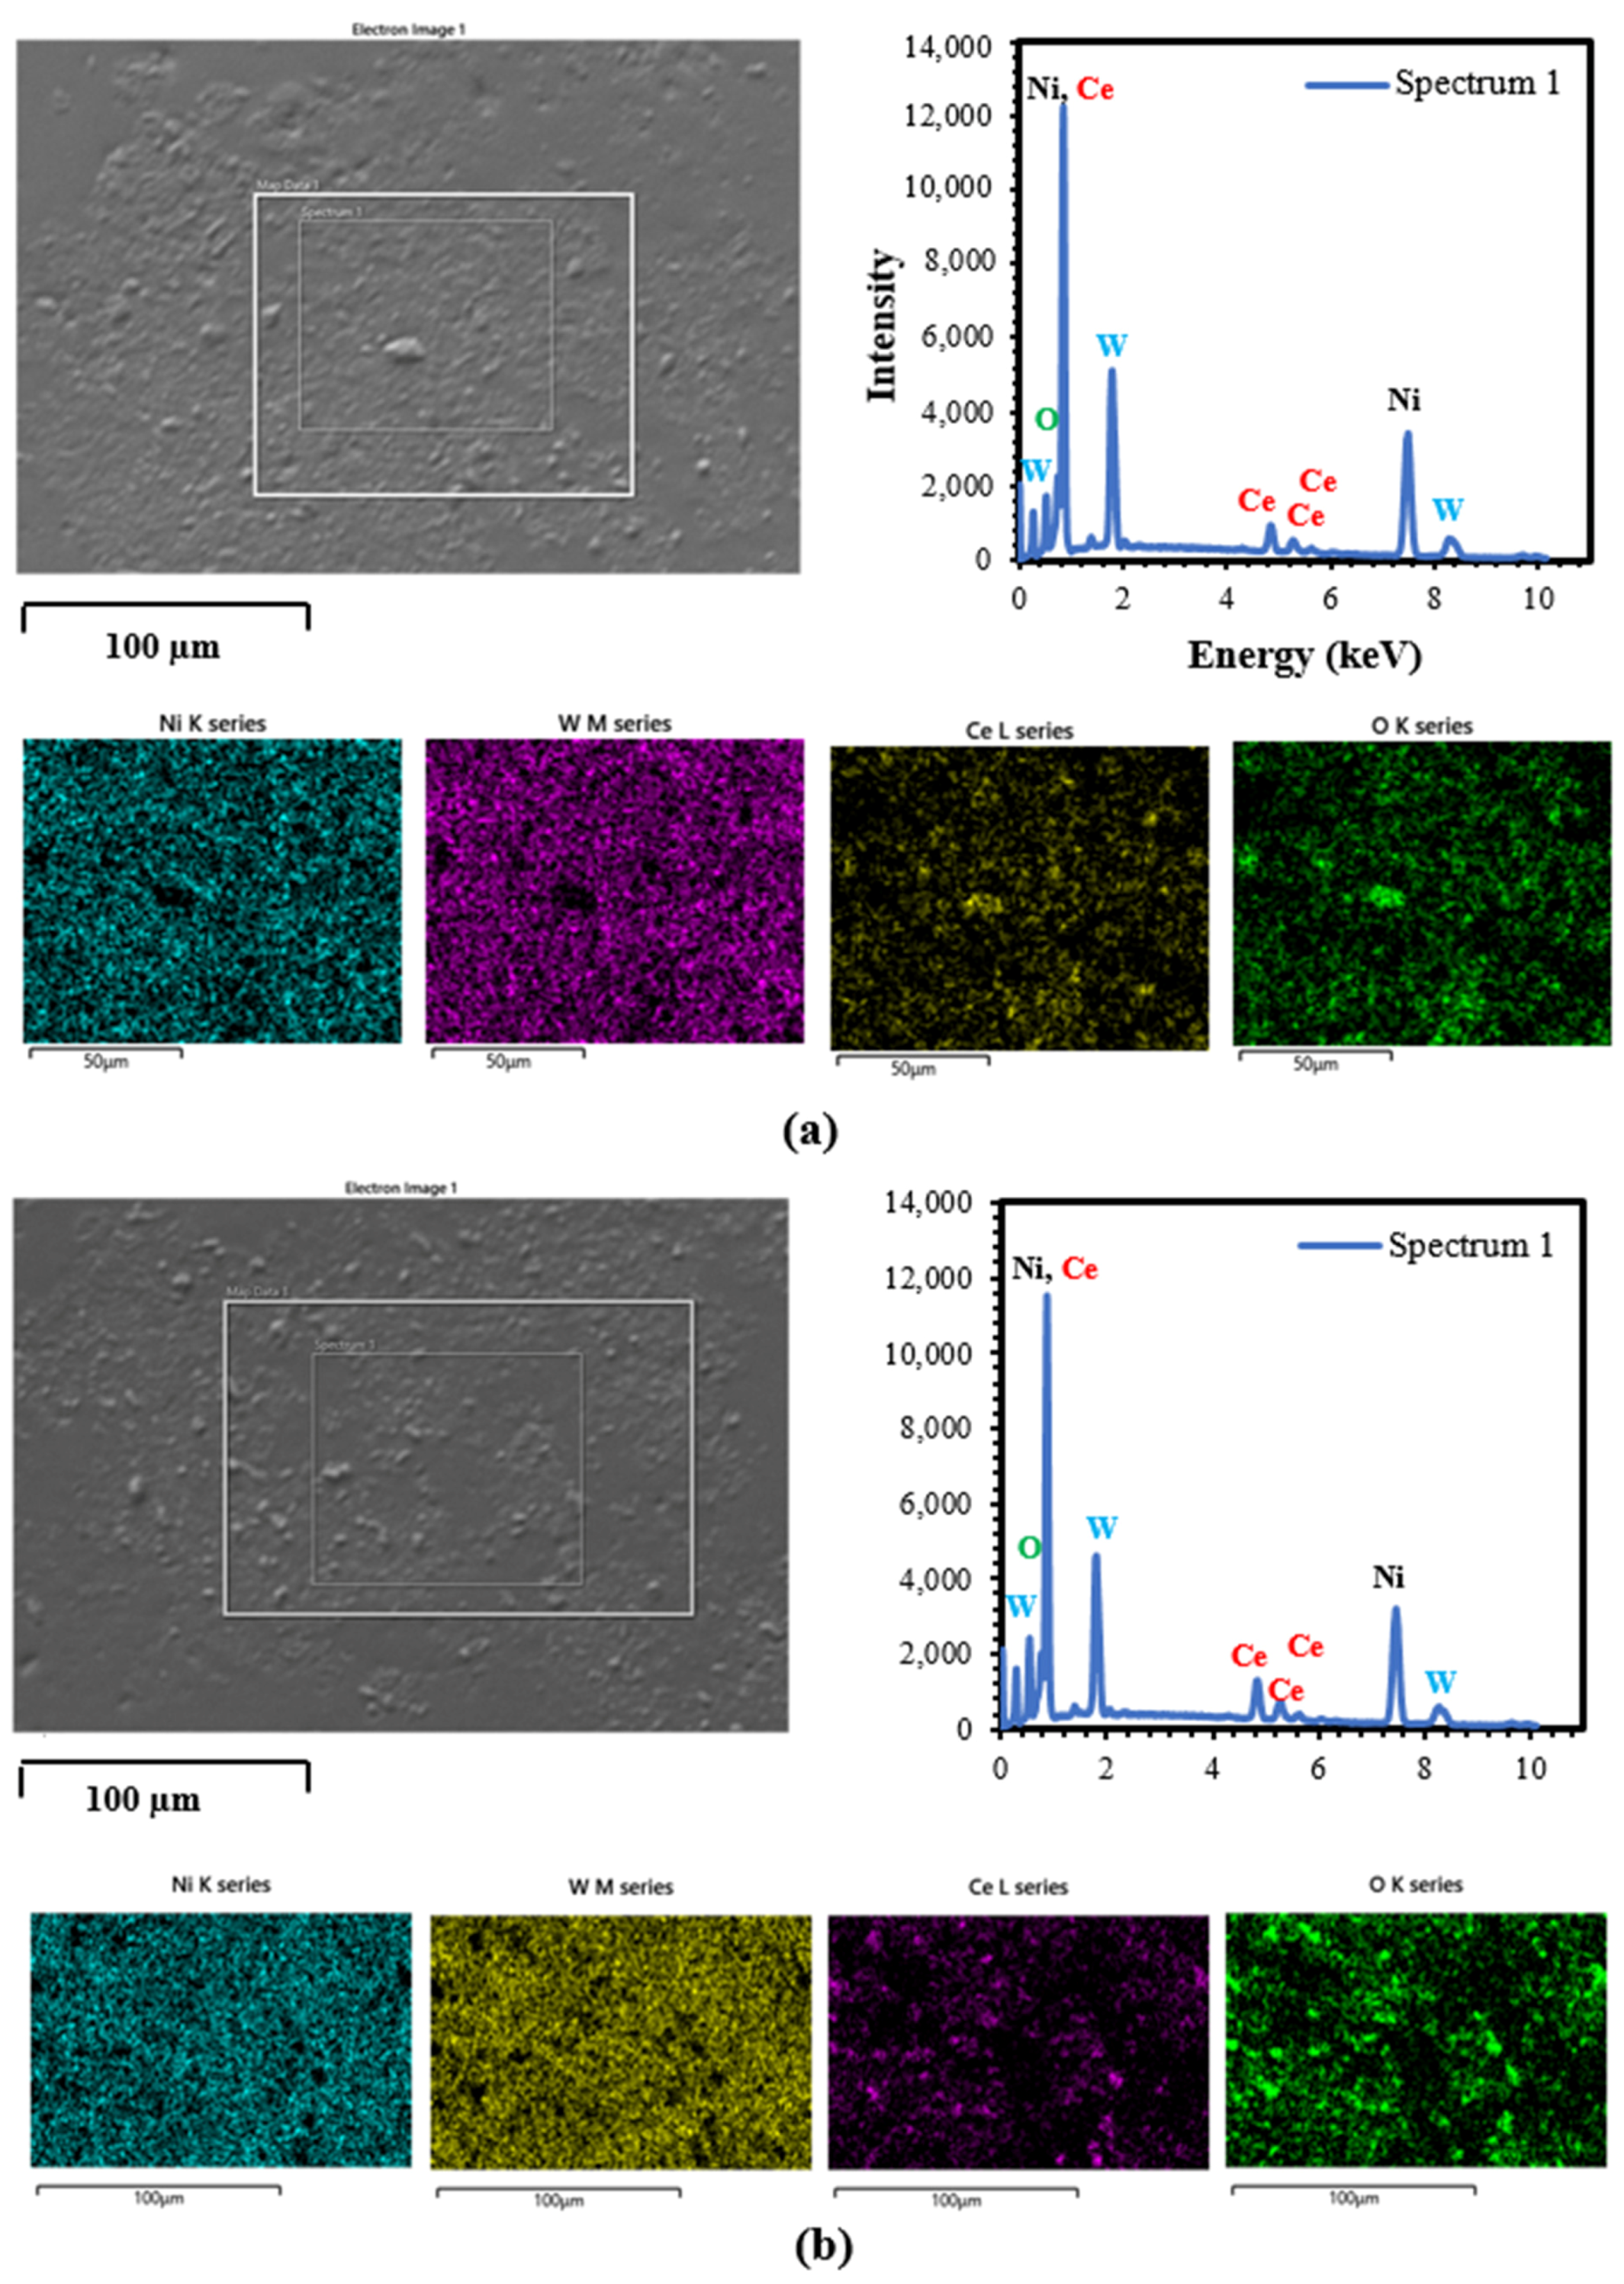
3.2. SEM/EDS Analysis

3.2.1. DC and PRC Deposited Ni

SEM micrographs (Figure 8 and Figure 9) were taken from the surfaces of DC– and PRC–electrodeposited Ni before and after corrosion. No cracks or delaminations were observed on the surface of the Ni coatings before corrosion, whereas after corrosion, the DC– and PRC–electrodeposited Ni were completely corroded and brass substrates were exposed to the surface (Figure 8b and Figure 9b).
In addition, EDS spectra taken from the surface of the DC– and PRC–electrodeposited Ni before corrosion suggest that Ni was the main element present in the coatings (Figure 8a and Figure 9a). The reported contents for DC–Ni deposits after corrosion (Figure 8b and Figure 9b) were 0.2% (Ni), 21.3% (Cu), 59.5% (Zn), and 19% (O) and for the PRC–deposited coating the contents were 1.4% (Ni), 28% (Cu), 52.7% (Zn), and 17.9% (O) accordingly. X-ray mapping results displayed a homogeneous distribution of the coating elements throughout the deposit before and after corrosion (Figure 8b and Figure 9b).

3.2.2. DC and PRC Deposited Ni–W

SEM micrographs (Figure 10 and Figure 11) were taken from the surface of DC– and PRC–electrodeposited NiW before and after corrosion. Before corrosion, the surface of the coatings were smooth and free of any cracks or defects. However, after corrosion, many defects and pits were observed on the surface of DC–NiW. A few pits were also observed on the surface of PRC–NiW after corrosion (Figure 10b and Figure 11b).
Moreover, EDS spectra and X-ray mapping taken from the surface of the DC– and PRC–electrodeposited NiW before corrosion suggest that Ni and W are the main elements present in the coatings (Figure 10a and Figure 11a). The reported contents for DC–NiW deposits were 64.6% (Ni), and 35.4% (W) and for PRC–deposited NiW coatings they were 70% (Ni), and 30% (W) accordingly.
EDS spectra taken from the surface of the DC– and PRC–electrodeposited NiW after corrosion revealed that the coatings contained peaks associated with Ni, W, O, Cu, and Zn (Figure 10b and Figure 11b). The reported contents for DC–NiW deposits were 5.1% (Ni), 5% (W), 5.8% (Cu), 13.3% (Zn), and 70.8% (O) and for PRC–deposited NiW coating the content were 61.2% (Ni), 33.2% (W), 2.8% (Zn), 2.4% (O), and 0.4% (Cu), respectively.

3.2.3. DC and PRC Deposited NiW–CeO2 Composite

SEM micrographs (Figure 12 and Figure 13) were taken from the surfaces of DC– and PRC–electrodeposited NiW–CeO2 before and after corrosion. No cracks or delaminations were observed on the surface of the coatings. It can be also observed in SEM micrographs that, in PRC–NiW–CeO2, the majority of the co–deposited CeO2 particles were embedded within the NiW matrix, while in DC–NiW–CeO2, the CeO2 particles were mainly electrodeposited on the surface of the coating. This is due to the fact that in the PRC method, during the anodic pulse (reverse current), greater opportunity will be provided for the arrival of CeO2 particles on the surface of the cathode and their embedment within the NiW matrix.
Additionally, the EDS spectra taken from the surface of the DC– and PRC–electrodeposited NiW–CeO2 before and after corrosion suggest that Ni, W, Ce, and O are the main elements present in the coatings (Figure 12a and Figure 13a). The reported contents for DC deposited coatings before corrosion were 61.4% (Ni), 21.7% (W), 10.9% (Ce), and 3.2% (O) and for PRC deposited coating before corrosion the contents were 55.5% (Ni), 23.9% (W), 15.5% (Ce), and 5.1% (O), accordingly. The higher contents of cerium and oxygen in PRC–NiW–CeO2 compared to the DC–NiW–CeO2 could be also related to the increased density of embedded CeO2 particles in the NiW matrix during the application of the anodic current. The increase in the amount of the particles favors the nucleation rate resulting in the grain refinement of the deposits. This greatly impacts the corrosion resistance of the coating by decreasing the antiparticle distance and formation of highly continuous protective film on the surface of the coating when exposed to the corrosive media.
EDS spectra results from both surfaces of the DC– and PRC–deposited NiW–CeO2 (Figure 12b and Figure 13b) after corrosion revealed that the contents for DC–NiW–CeO2 deposits were 58.6% (Ni), 24.5% (W), 12.9% (Ce), and 4% (O) and for the PRC–NiW–CeO2 coating the contents were 56.3% (Ni), 26.4% (W), 13.6% (Ce), and 3.7% (O), respectively. The contents of DC– and PRC–deposited NiW–CeO2 were almost similar before and after corrosion. This could be due to presence of CeO2 particulates within the NiW matrix covering the surface defects, refining the grains, and acting as a physical barrier to protect the metallic layer underneath from further corrosion. X-ray mapping results displayed a homogeneous distribution of the coating elements throughout the deposit before and after corrosion.

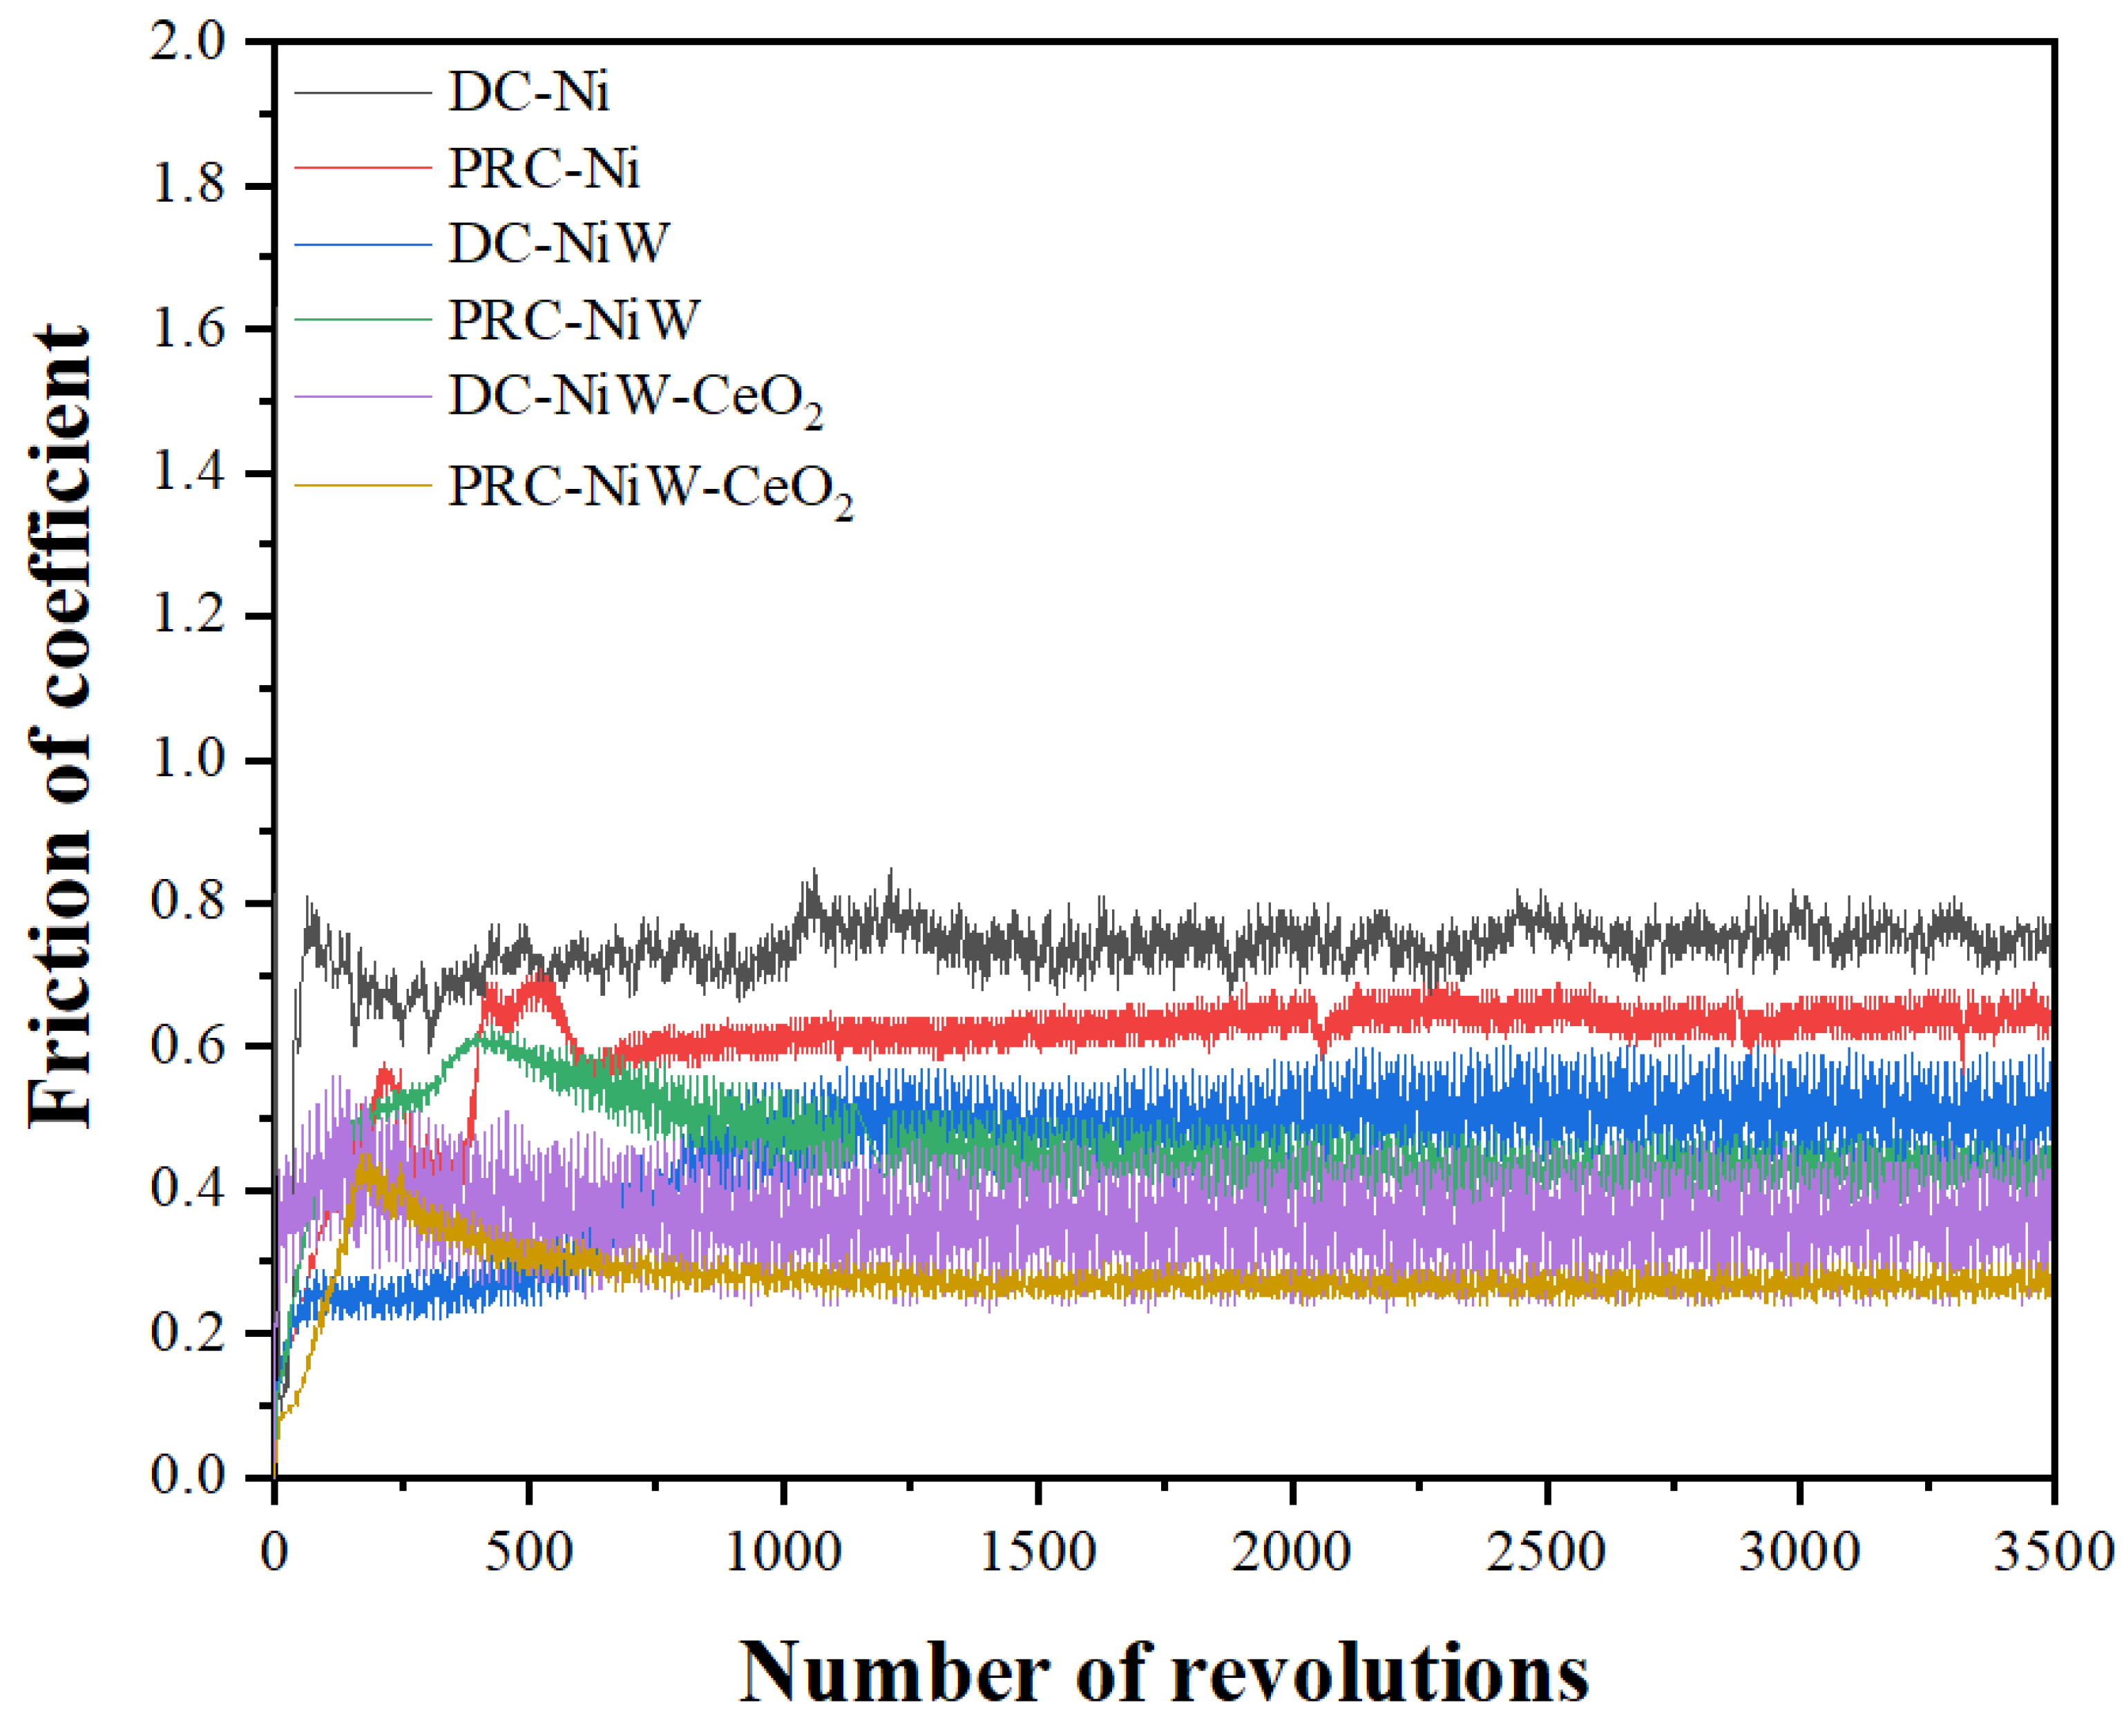
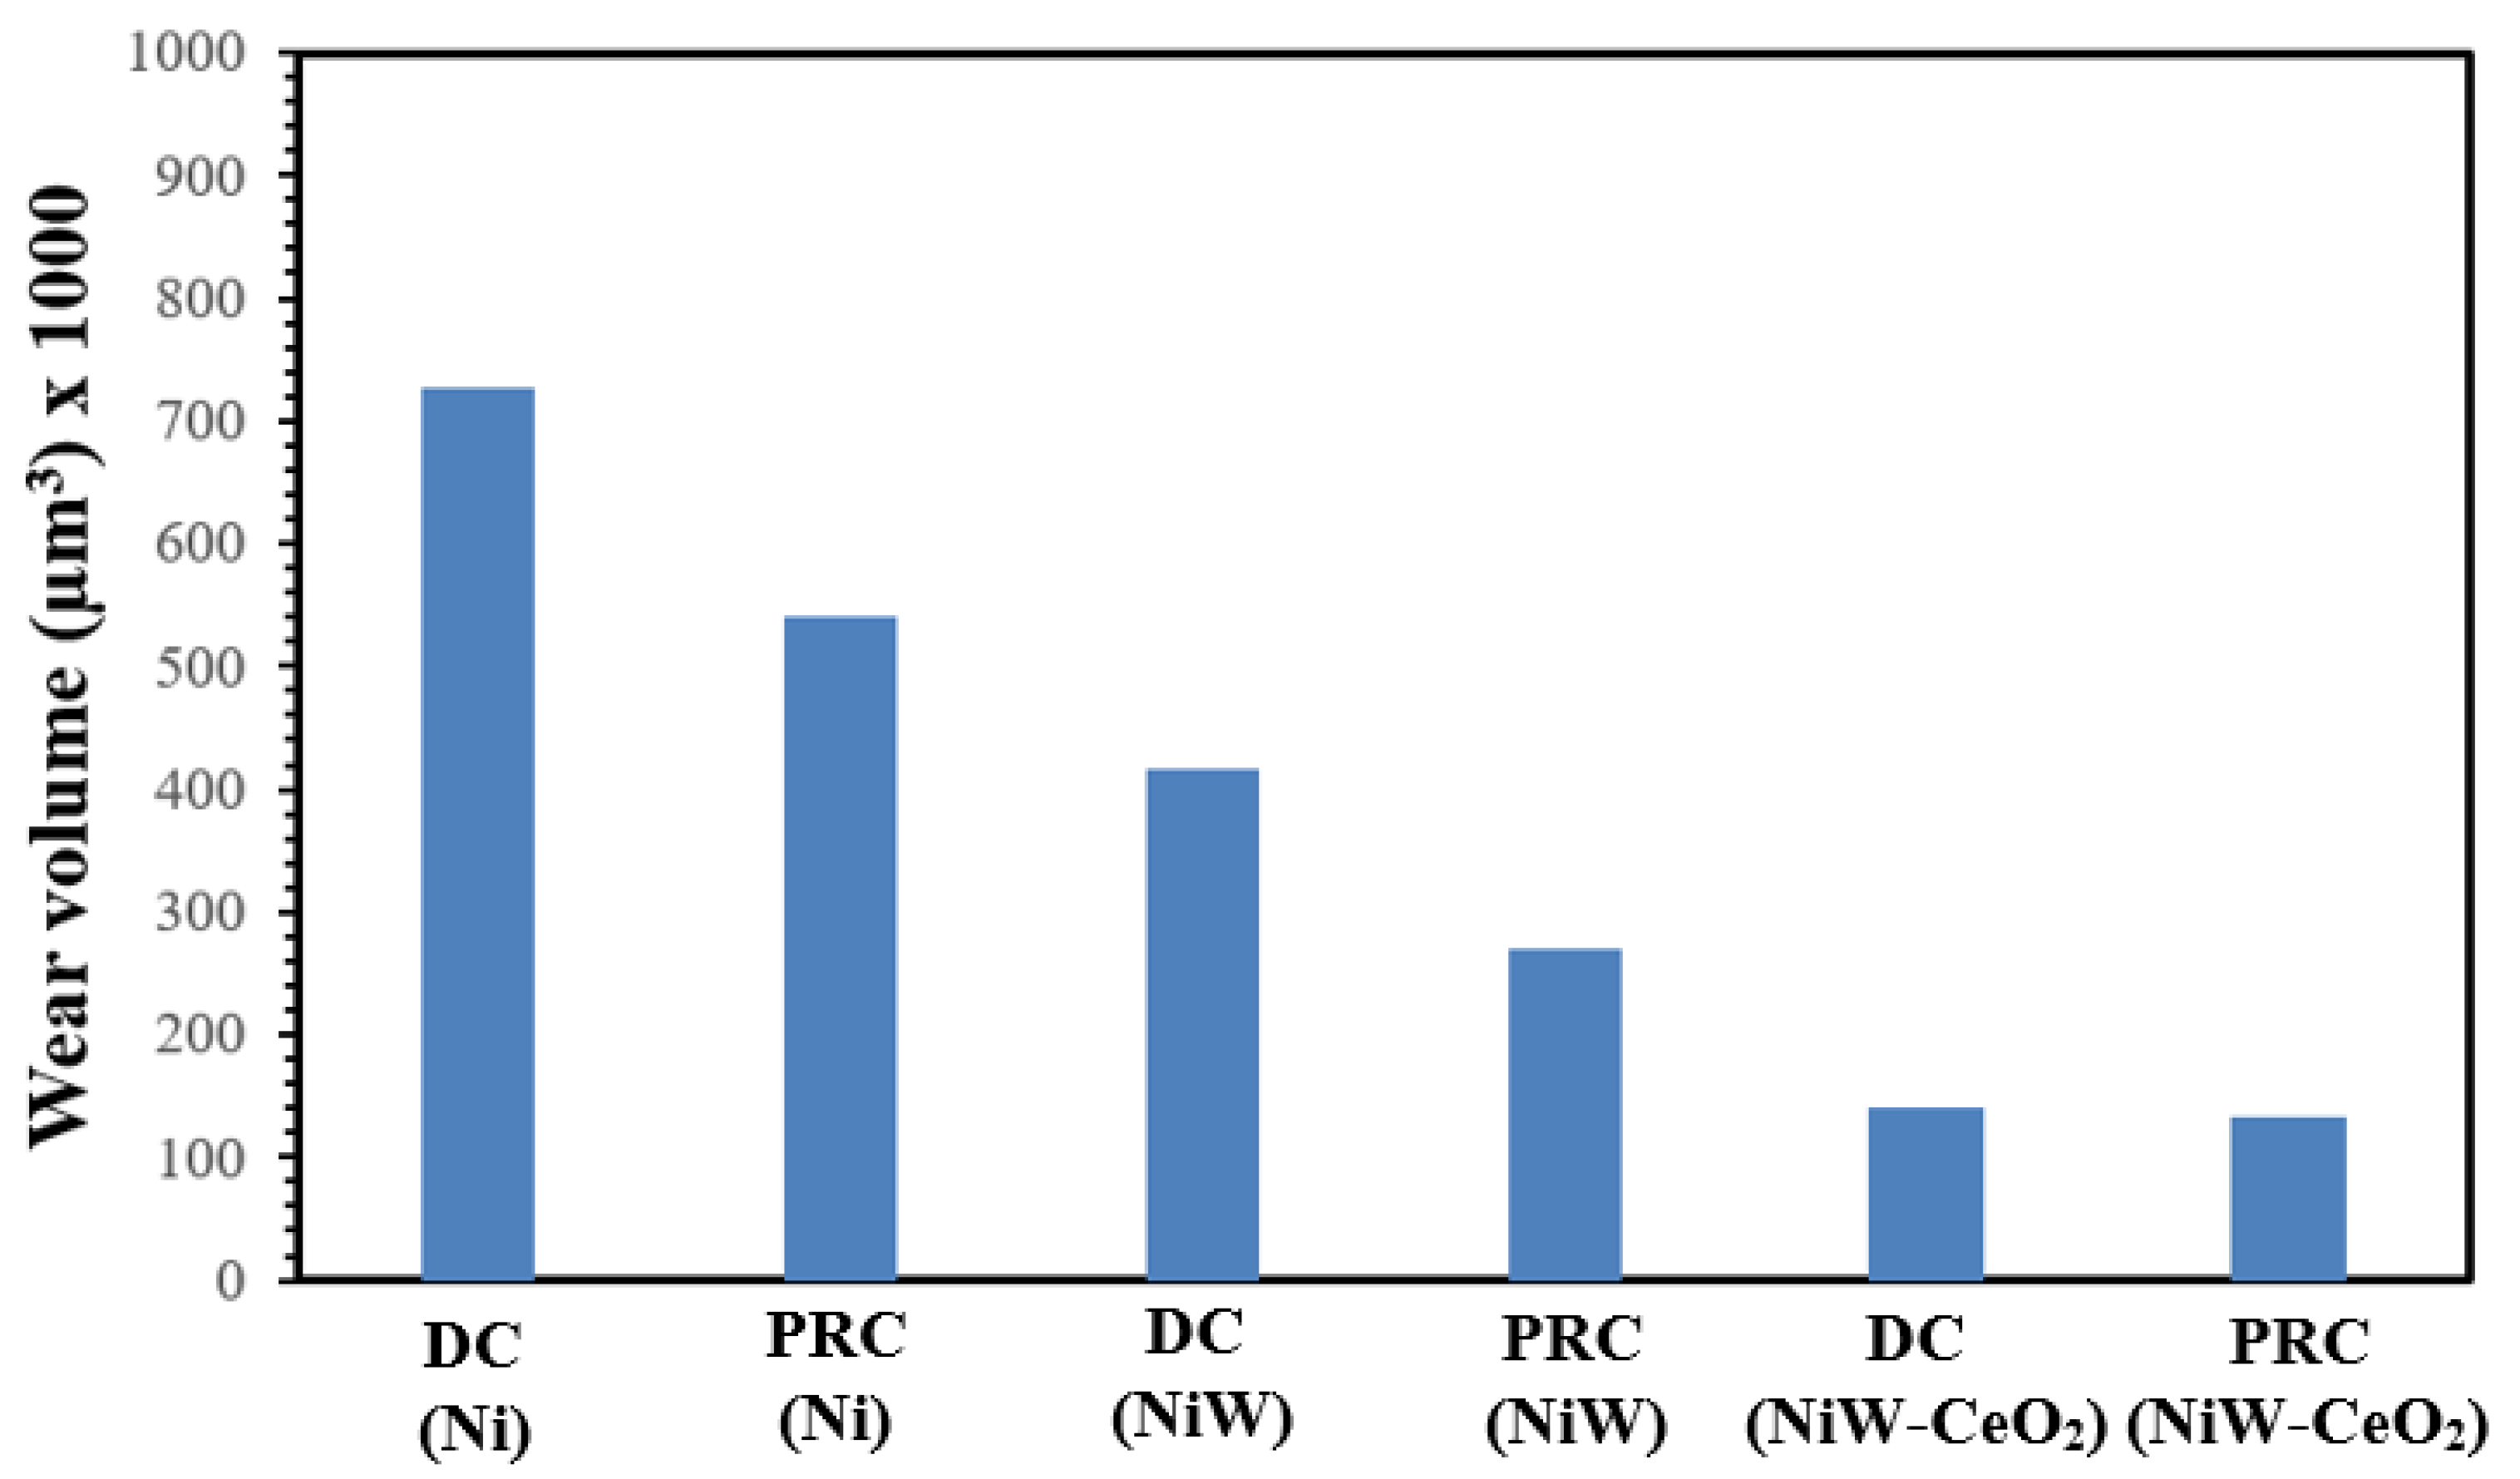
3.3. Tribological Analysis (Coefficient of Friction and Wear Rate)

Figure 14 displays the variation in the average coefficient of friction for DC– and PRC–deposited Ni, NiW, and NiW–CeO2 electrodeposited materials on brass substrates using the pin–on–disc wear testing facility. As it can be observed, PRC–NiW–CeO2 demonstrated the lowest coefficient of friction (0.25) compared to DC–NiW–CeO2 (0.35), DC–NiW (0.45), PRC–NiW (0.42), DC–Ni (0.67), and PRC–Ni (0.62). The low friction coefficient of PRC–NiW–CeO2 coating compared to the DC–NiW–CeO2 and PRC–deposited Ni and NiW can be attributed to the reduction in the contact between the Al2O3 ball and the coating. In addition, the formation of the stable nickel oxide and tungsten oxide layer during the reverse pulse on the coating surface effectively reduced the contact between the sliding surfaces. The low coefficient of friction of the DC– and PRC–deposited NiW compared to Ni could be related to the solid solution–strengthening mechanism by the tungsten of the nickel matrix. Figure 15 displays the wear volume rate of the removed material after the friction test.

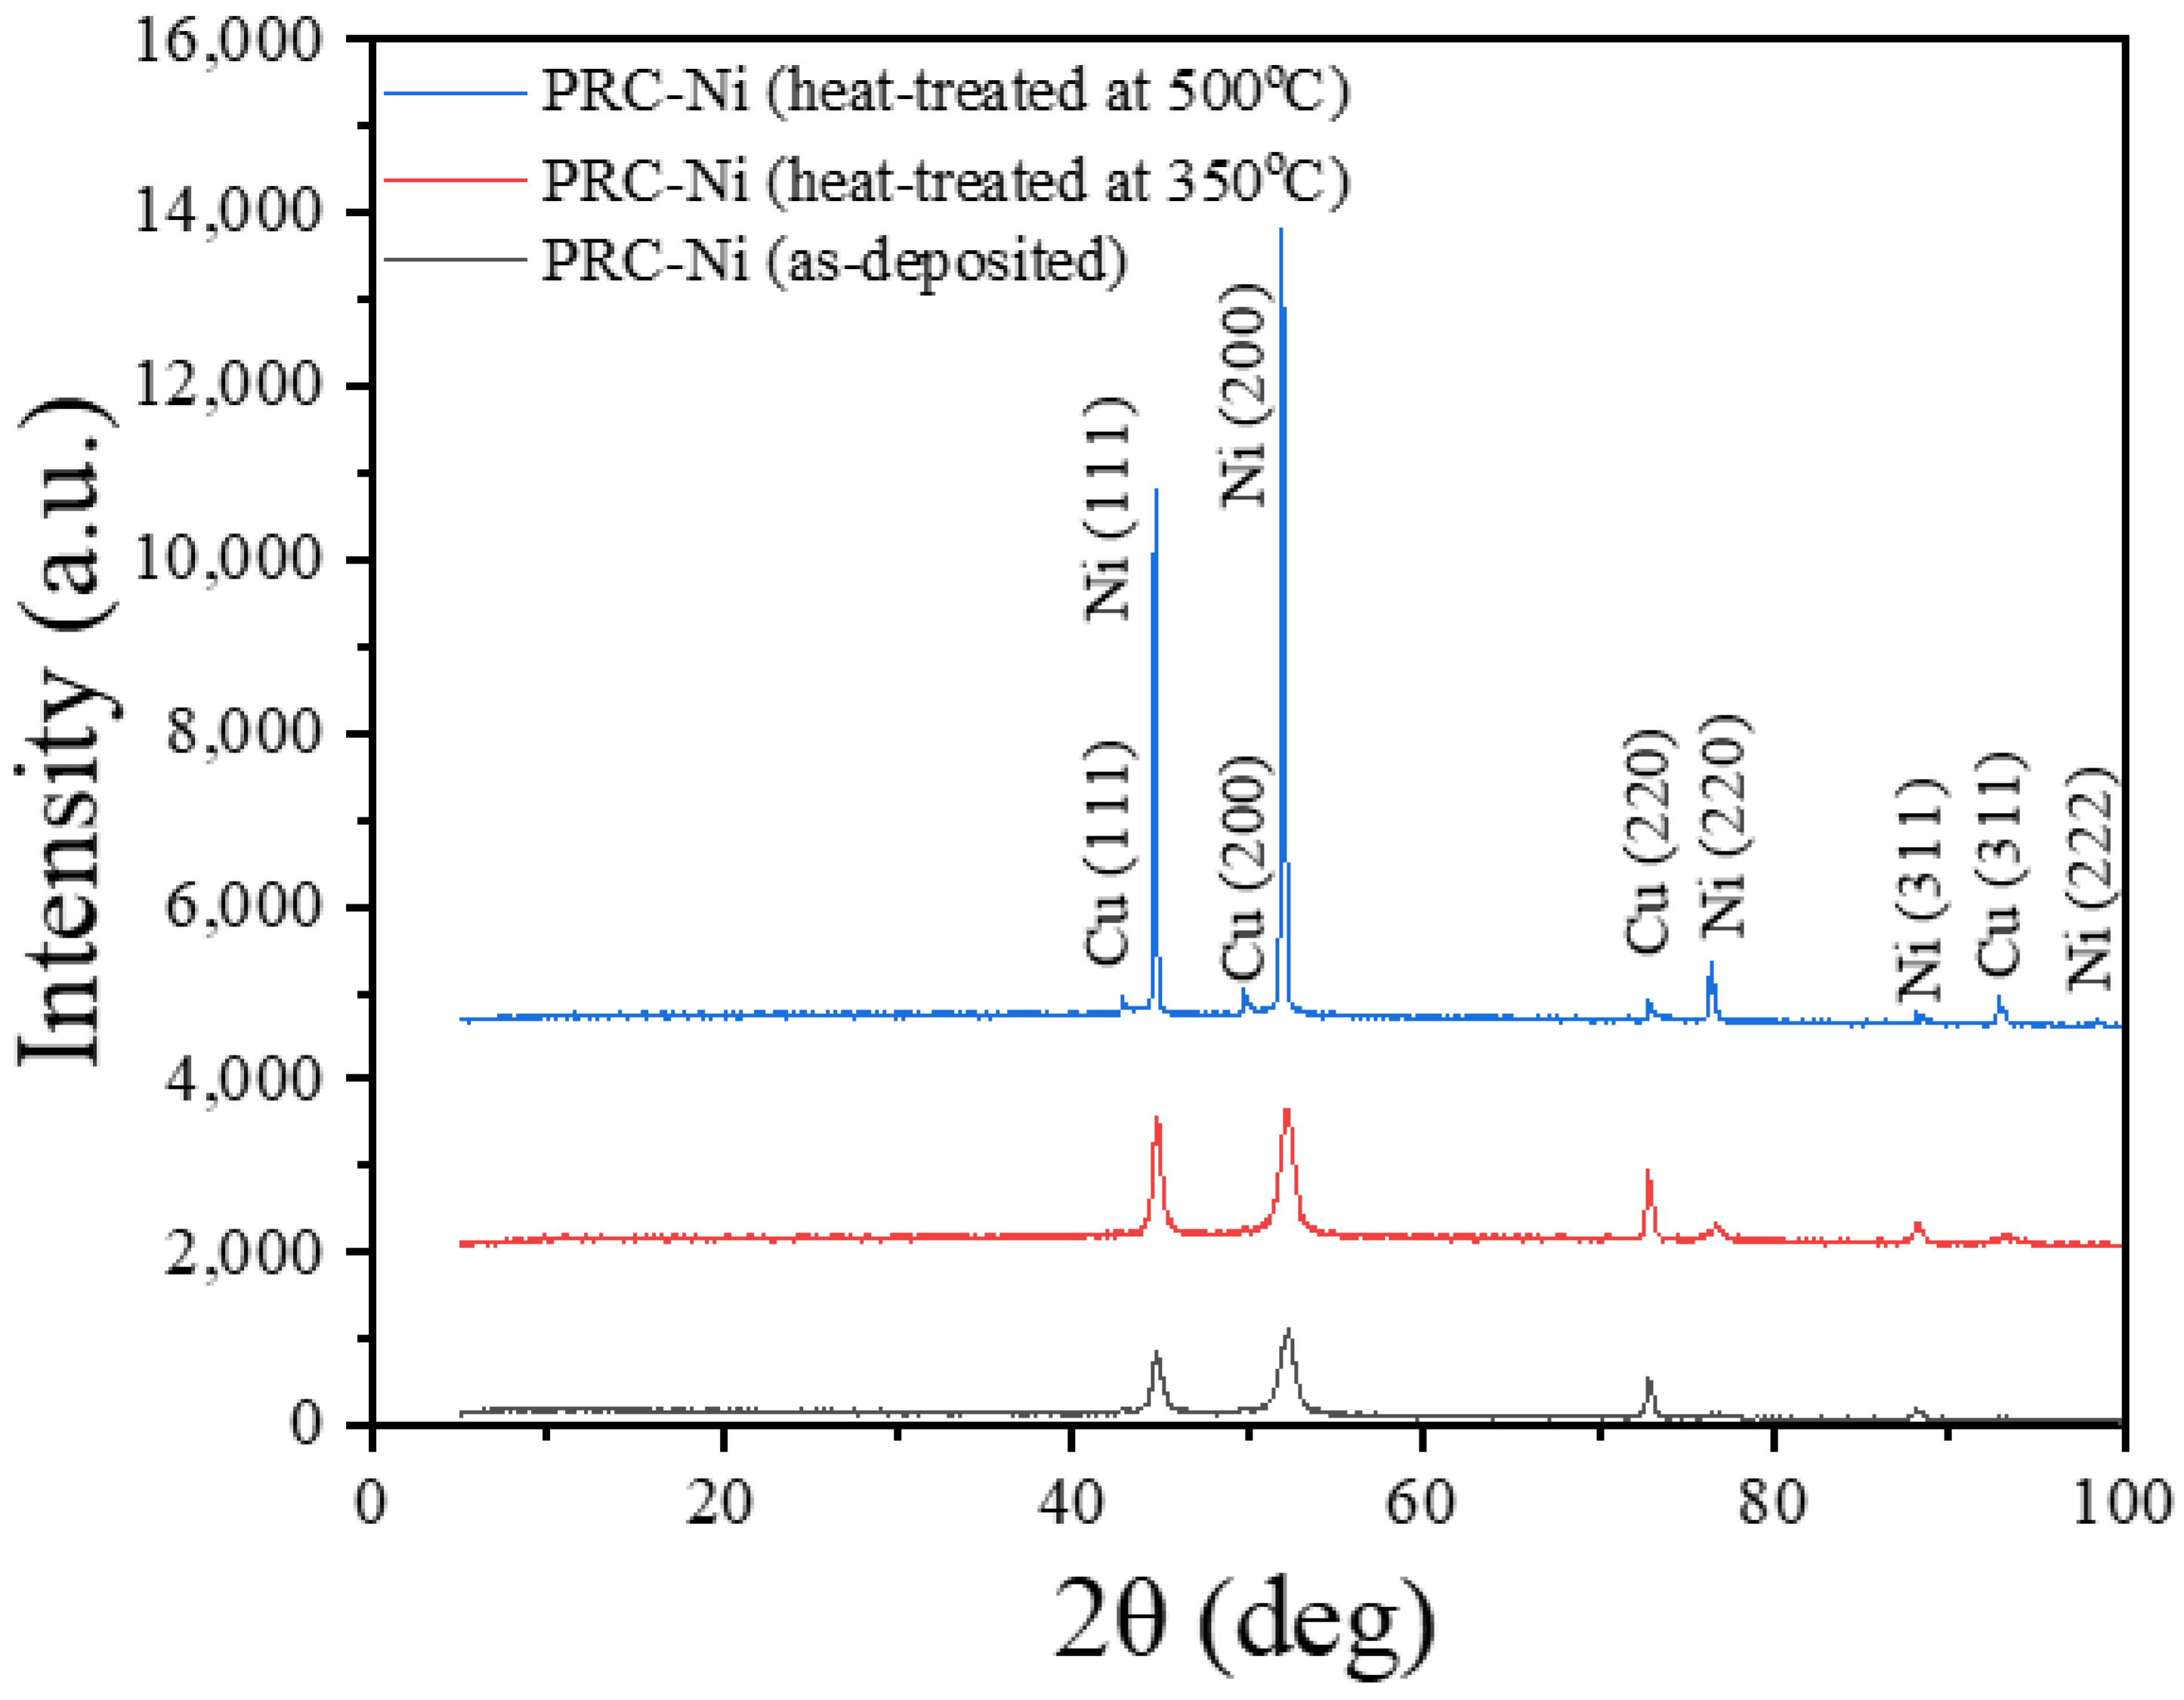
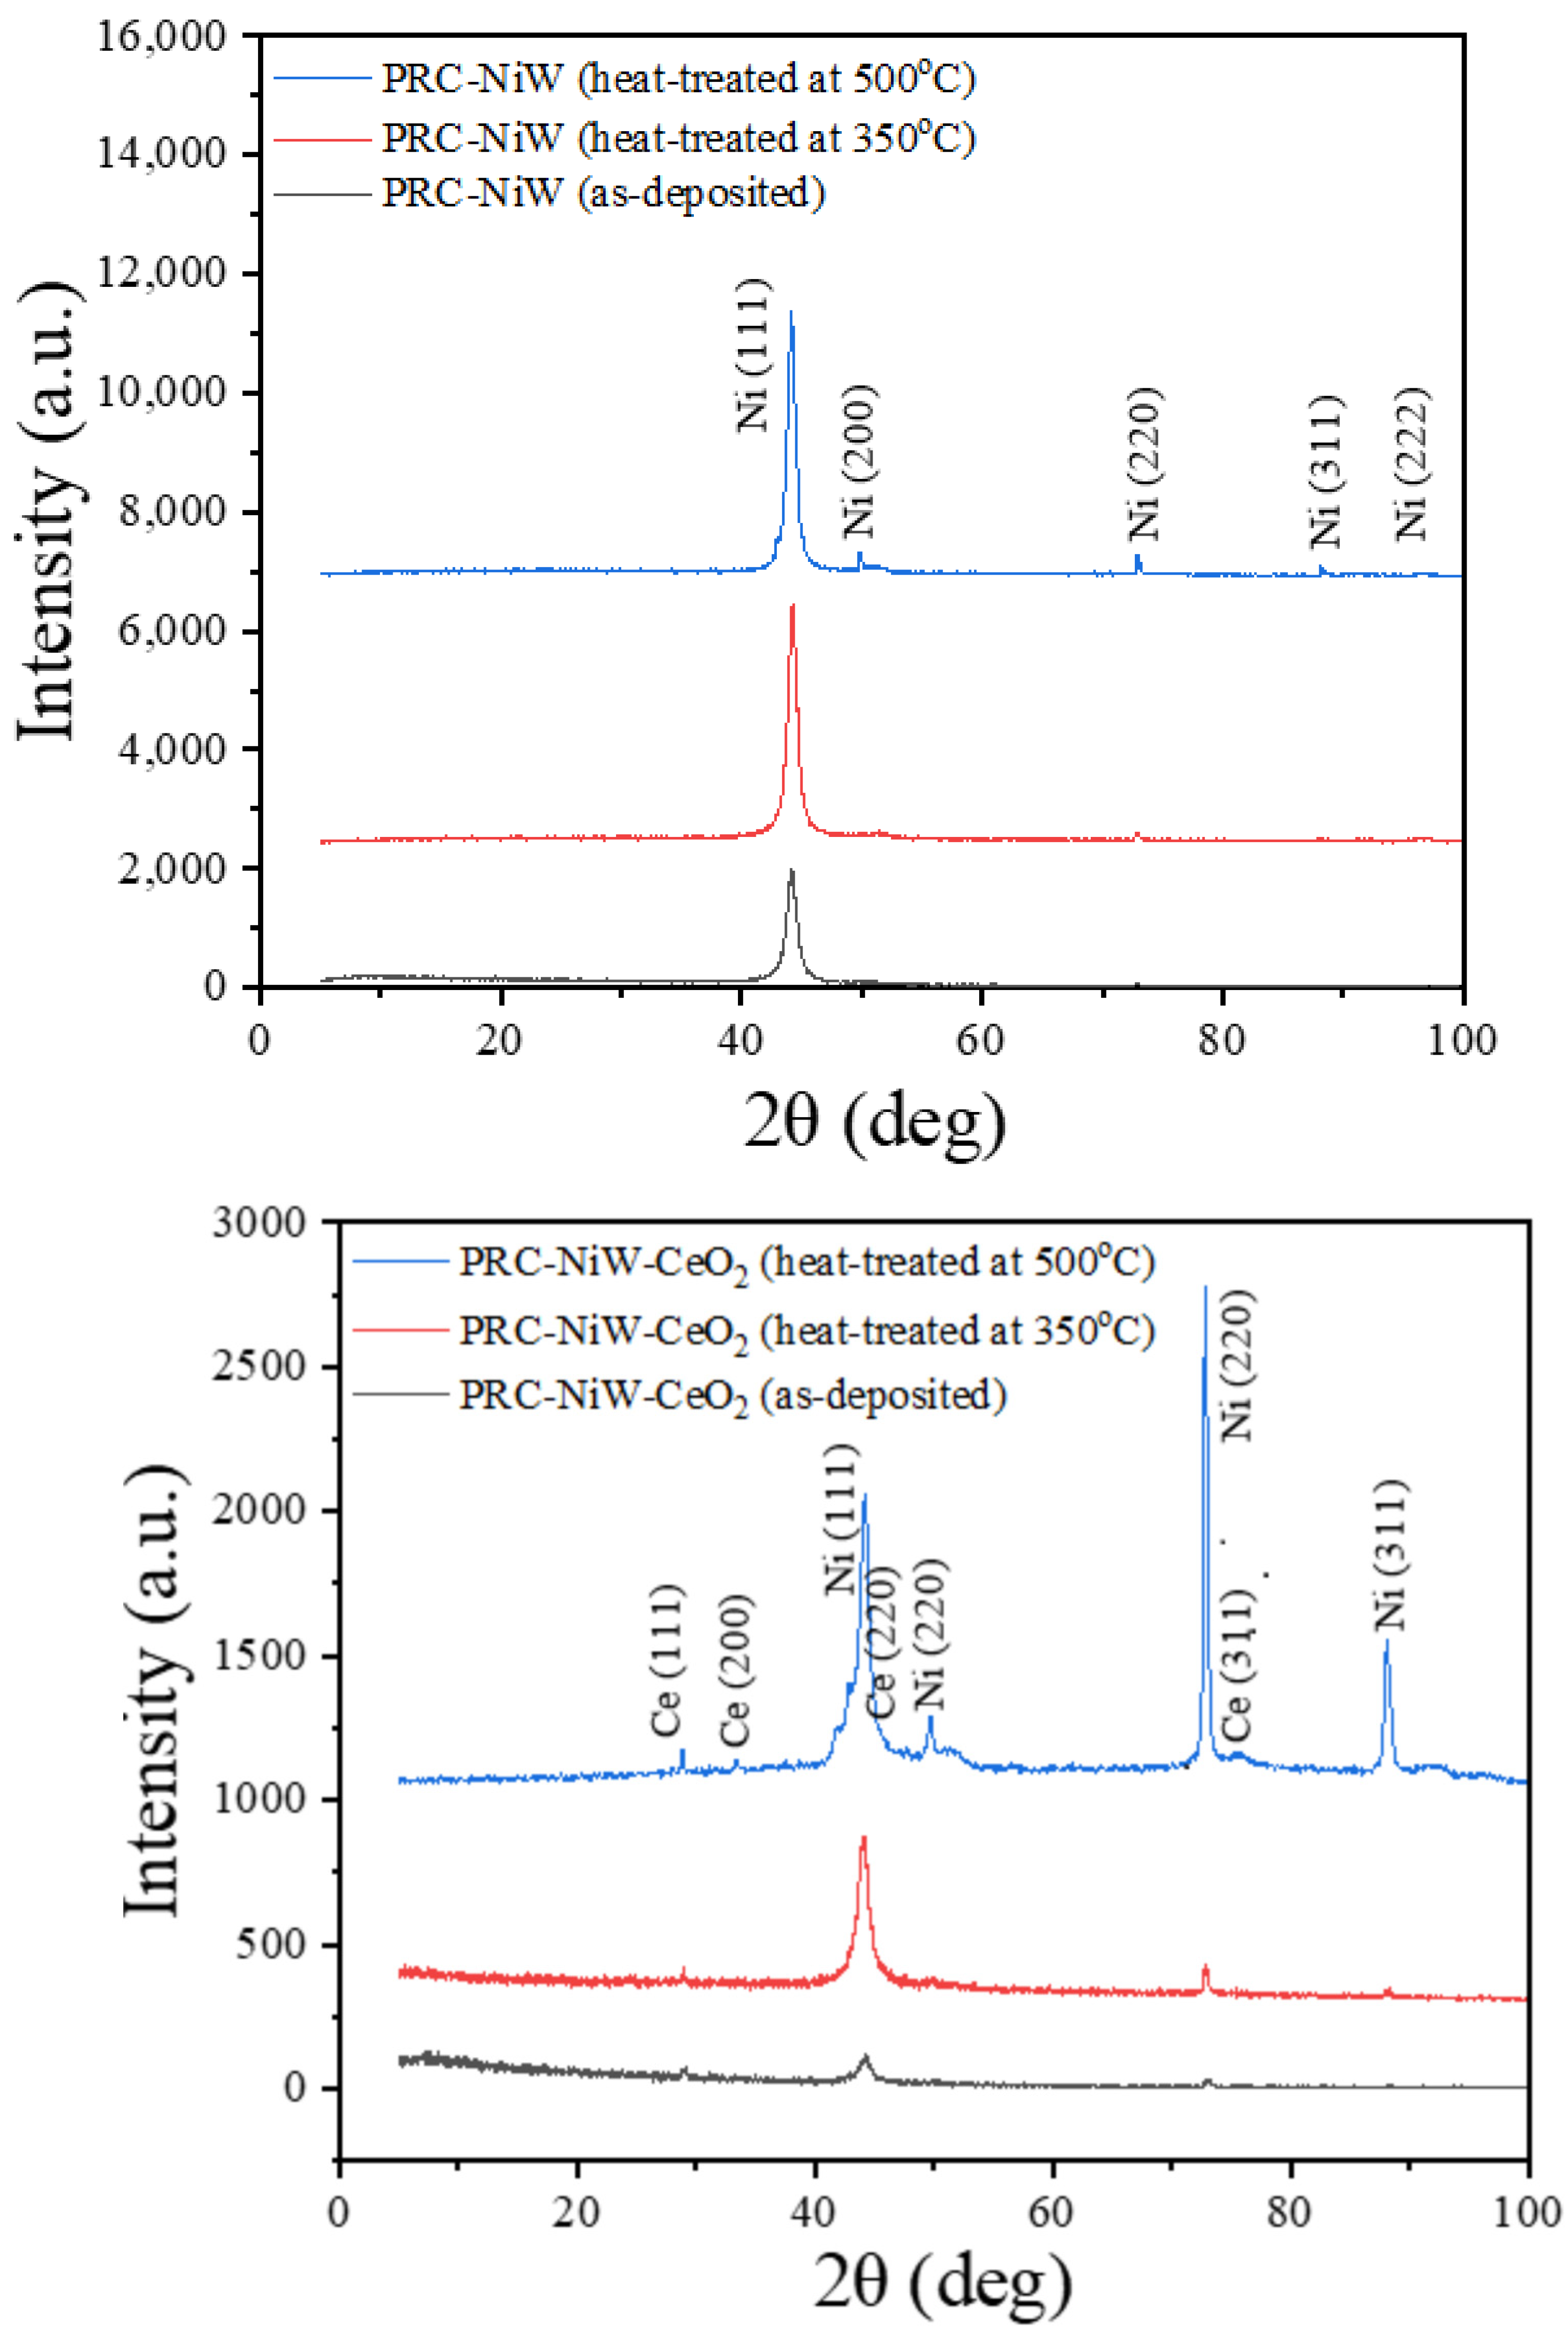
3.4. XRD Analysis (Effect of Heat Treatment on Crystallite Sizes of PRC deposited Ni, NiW and NiW–CeO2)

XRD results were taken from the surfaces of as–deposited and heat–treated PRC–electrodeposited Ni, NiW, and NiW–CeO2 at 350 °C and 500 °C on brass substrates (Figure 16). It was observed that the peak intensity of the heat–treated coatings were higher than that of the as–deposited coating, and hence the crystallite size increased with the increase in the annealing temperature which might be attributed to FCC crystal grain growth, and the decrease in the internal micro–strains. The crystallites’ size of the coatings were measured (Table 3) from the broadening of the (111) peaks using the Scherrer equation.
D = Kλ/βcosθ
where D is the crystallite size (nm), K is the Scherrer constant (0.9), λ is the wavelength of the X-ray source (0.15406 nm), β is the FWHM (radians), and θ is the peak position (radians).
XRD spectra taken from the surfaces of as–deposited and heat–treated PRC–Ni (Figure 16) contained diffraction peaks of Cu (111), Ni (111), Cu (200), Ni (200), Cu (220), Ni (220), Cu, (311), Ni (311), and Ni (222) planes. This demonstrated that PRC–Ni is a polycrystalline coating material. It was also observed that the peak intensity and average crystallite size increased from 197 Å up to 1210 Å with the increase in the annealing temperature. This was attributed to the increase in the degree of coating crystallinity and number of the crystallites. Additionally, the presence of the Cu peaks in the XRD spectra indicated its diffusion and segregation from the substrate outward to the coating surface due to the higher tendency of Cu for oxidization compared to Ni [39].
The XRD spectra taken from the surfaces of as–deposited and annealed PRC–NiW contained peaks of Ni (111), Ni (200), Ni (220), Ni (3111), and Ni (222), respectively. It was observed that the peak intensity of the Ni (111) and Ni (220) increased and additional peaks of Ni (200) and Ni (311) were formed after annealing at 500 °C. Unlike PRC–Ni, no peaks of Cu was observed, indicating the better shielding effect of NiW against the diffusion of Cu from substrate to Ni. This can have a great influence on the corrosion performance of the coating.
XRD spectra taken from the surfaces of as–deposited and annealed PRC–NiW–CeO2 at 350 °C and 500 °C contained the peaks of Ce (111), Ce (200), Ni (111), Ce (220), Ni (200), Ni (220), Ce (311), and Ni (311). It is worth mentioning that the introduction of CeO2 into the NiW matrix resulted in a decrease in the crystallite size of Ni (Table 3) which was due to the grain refinement effect of CeO2 particles on the alloy matrix. The smaller grain size promotes the formation of more compact passive films with a lower amount of defects due to the increase in the active atoms number on the surface. This can decrease the adsorption of chloride ions on the surface and remarkably enhance the pitting corrosion and wear resistance of the coatings [40,41,42]. It was also noticed that the intensity of Ce (111), Ni (111), Ni (220), and Ni (311) increased with the increase in the annealing temperature. Furthermore, some additional peaks of Ce (200), Ni (200), and Ce (311) appeared after annealing at 500 °C. The XRD results also revealed that the average grain size of Ni increased from 110 Å to 158 Å due to an increase in the annealing temperature to up to 500 °C.
In all the XRD graphs, the peaks of W were not observed. This was due to the partial replacement of Ni by W atoms and the formation of single–phase solid solutions (W in Ni) with the FCC structure. The addition of the alloying element of W in Ni also resulted in peak broadening and reduction in the average crystallite size due to the decrease in the Ni content and lattice distortion. These results on the lattice distortion are in agreement with the results published elsewhere [43,44].

4. Conclusions

The incorporation of CeO2 ceramic particles within the NiW matrix along with the application of the PRC waveform to the electrodeposition bath enhanced the corrosion performance of the NiW coating. Several sets of experiments were performed to investigate the corrosion performance of the NiW coatings reinforced with CeO2 ceramic particles. It was observed that the coatings prepared using PRC exhibited outstanding corrosion resistance when exposed to corrosive media compared to those prepared using DC. It was also revealed that the reinforcement of CeO2 within NiW significantly improved the corrosion performance of the coating and both DC and PRC–NiW–CeO2 exhibited the highest corrosion performance compared to DC– and PRC–deposited Ni and NiW. According to the PP–test results, the corrosion resistance improved in the following order for deposits:
DC–Ni < PRC–Ni < DC–NiW < DC–NiW–CeO2 < PRC–NiW < PRC–NiW–CeO2
From the optical micrographs of the corroded surfaces of DC and PRC electrodeposits, it was found that DC and PRC Ni were completely corroded and pulled off the surface, whereas the surface of DC and PRC–NiW showed discoloration. On the other hand, DC and PRC deposited on NiW–CeO2 remained almost unaffected after the PP–test.
DC– and PRC–electrodeposited NiW–CeO2 demonstrated the lowest coefficient of friction and wear rate compared to other DC– and PRC–deposited coatings.
Based on the XRD results, as–deposited and annealed PRC–electrodeposited Ni, NiW, and NiW–CeO2 at 350 °C and 500 °C also revealed that the intensity of the peaks and the average crystallite size increased with the annealing temperature to up to 500 °C.

Author Contributions

Conceptualization, M.D. and O.S.; methodology, M.D.; software, M.D.; validation, M.D., O.S.; formal analysis, M.D.; investigation, M.D.; resources, O.S.; data curation, M.D.; writing—original draft preparation, M.D.; writing—review and editing, M.D. And O.S.; visualization, M.D.; supervision, O.S.; project administration, O.S.; funding acquisition, O.S. All authors have read and agreed to the published version of the manuscript.

Funding

Laboratory of New Materials for Electrochemistry and Energy (LANOMAT), Montreal.

Institutional Review Board Statement

Not applicable.

Informed Consent Statement

Not applicable.

Data Availability Statement

Not applicable.

Conflicts of Interest

The authors declare that they have no known competing financial interests or personal relationships that could have appeared to influence the work reported in this paper.

References

  1. Ren, A.; Fu, X.-Q.; Chen, X.; Lin, J.; Cao, H. Effect of Current Density on the Properties of Ni–CeO2 Composite Coatings prepared using Magnetic Field–Assisted Jet Electrodeposition. Int. J. Electrochem. Sci. 2021, 16, 210658. [Google Scholar]
  2. Guo, S.; Wang, L.; Jin, Y.; Piao, N.; Chen, Z.; Tian, G.; Li, J.; Zhao, C.; He, X. A polymeric composite protective layer for stable Li metal anodes. Nano Converg. 2020, 7, 21. [Google Scholar] [CrossRef]
  3. Cao, J.; Wang, L.; He, X.; Fang, M.; Gao, J.; Li, J.; Deng, L.; Chen, H.; Tian, G.; Wang, J.; et al. In situ prepared nano–crystalline TiO2–poly(methyl methacrylate) hybrid enhanced composite polymer electrolyte for Li–ion batteries. J. Mater. Chem. A 2013, 1, 5955–5961. [Google Scholar] [CrossRef]
  4. Yao, Y.; Dong, H.; Jiao, L.; Yu, N.; He, L. Preparation and electrocatalytic property of PbO2–CeO2 nanocomposite electrodes by pulse reverse electrodeposition methods. J. Electrochem. Soc. 2016, 163, D179–D184. [Google Scholar] [CrossRef]
  5. Xu, Y.Y.; Xue, Y.J.; Yang, F.; Liu, C.Y.; Li, J.S. Preparation of Ni–ZrO2–CeO2 Nanocomposite Coatings by Pulse Electrodeposition. Appl. Mech. Mater. 2013, 395–396, 174–178. [Google Scholar] [CrossRef]
  6. Wang, L.; Xing, S.; Liu, H.; Jiang, C.; Ji, V. Improved wear properties of Ni Ti nanocomposite coating with tailored spatial microstructures by extra adding CeO2 nanoparticles. Surf. Coat. Technol. 2020, 399, 126119. [Google Scholar] [CrossRef]
  7. Uhm, S.; Yi, Y.; Lee, J. Electrocatalytic Activity of Pd–CeO2 Nanobundle in an Alkaline Ethanol Oxidation. Catal. Lett. 2010, 138, 46–49. [Google Scholar] [CrossRef]
  8. Zhou, X.; Shen, Y. A comparative study of pure nickel and the Ni–CeO2 nanocrystalline coatings: Microstructural evolution, oxidation behavior, and thermodynamic stability. J. Mater. Sci. 2014, 49, 3755–3774. [Google Scholar] [CrossRef]
  9. Xue, Y.J.; Jia, X.Z.; Zhou, Y.W.; Ma, W.; Li, J.S. Tribological performance of Ni–CeO2 composite coatings by electrodeposition. Surf. Coat. Technol. 2006, 200, 5677–5681. [Google Scholar] [CrossRef]
  10. Kim, S.K.; Yoo, H.J. Formation of bilayer Ni–SiC composite coatings by electrodeposition. Surf. Coat. Technol. 1998, 108–109, 564–569. [Google Scholar] [CrossRef]
  11. Garcia, I.; Fransaer, J.; Celis, J.-P. Electrodeposition and sliding wear resistance of nickel composite coatings containing micron and submicron SiC particles. Surf. Coat. Technol. 2001, 148, 171–178. [Google Scholar] [CrossRef]
  12. Wang, W.; Guo, H.T.; Gao, J.P.; Dong, X.H.; Qin, Q.X. XPS, UPS and ESR studies on the interfacial interaction in Ni–ZrO2 composite plating. J. Mater. Sci. 2000, 35, 1495–1499. [Google Scholar] [CrossRef]
  13. Banovic, S.W.; Barmak, K.; Marder, A.R. Characterization of single and discretely–stepped electro–composite coatings of nickel–alumina. J. Mater. Sci. 1999, 34, 3203–3211. [Google Scholar] [CrossRef]
  14. Wu, G.; Li, N.; Zhou, D.; Mitsuo, K. Electrodeposited Co–Ni–Al2O3 composite coatings. Surf. Coat. Technol. 2004, 176, 157–164. [Google Scholar] [CrossRef]
  15. Surviliene, S.; Orlovskaja, L.; Bikulcius, G.; Biallozor, S. Effect of MoO2 and TiO2 on electrodeposition and properties of chromium coating. Surf. Coat. Technol. 2001, 137, 230–234. [Google Scholar] [CrossRef]
  16. Losiewicz, B.; Stępień, A.; Gierlotka, D.; Budniok, A. Composite layers in Ni–P system containing TiO2 and PTFE. Thin Solid Films 1999, 349, 43–50. [Google Scholar] [CrossRef]
  17. Levin, B.; DuPont, J.; Marder, A. The effect of second phase volume fraction on the erosion resistance of metal–matrix composites. Wear 2000, 238, 160–167. [Google Scholar] [CrossRef]
  18. Jun, L.; Yiyong, W.; Dianlong, W.; Xinguo, H. The microstructure and wear resistance characteristics of electroformed nickel and partially stabilized zirconia composite coatings. J. Mater. Sci. 2000, 35, 1751–1758. [Google Scholar] [CrossRef]
  19. Hou, K.; Ger, M.; Wang, L.; Ke, S. The wear behaviour of electro–codeposited Ni–SiC composites. Wear 2002, 253, 994–1003. [Google Scholar] [CrossRef]
  20. Zhou, Y.; Xie, F.; Wu, X.; Zhao, W.; Chen, X. A novel plating apparatus for electrodeposition of Ni–SiC composite coatings using circulating–solution co–deposition technique. J. Alloys Compd. 2017, 699, 366–377. [Google Scholar] [CrossRef]
  21. Han, B.; Lu, X. Tribological and anti–corrosion properties of Ni–W–CeO2 coatings against molten glass. Surface and Coatings Technology. Surf. Coat. Technol. 2008, 202, 3251–3256. [Google Scholar] [CrossRef]
  22. Zhang, Z.-Z.; Xue, Q.J.; Liu, W.-M.; Shen, W.C. Effect of rare earth compounds as fillers on friction and wear behaviors of PTFE–based composites. J. Appl. Polym. 1999, 72, 361–369. [Google Scholar] [CrossRef]
  23. Sajjadnejad, M.; Haghshenas, S.M.S.; Badr, P.; Setoudeh, N.; Hosseinpour, S. Wear and tribological characterization of nickel matrix electrodeposited composites: A review. Wear 2021, 486–487, 204098. [Google Scholar] [CrossRef]
  24. Cârâc, G.; Benea, L.; Iticescu, C.; Lampke, T.; Steinhäuser, S.; Wielage, B. Codeposition of Cerium Oxide with Nickel and Cobalt: Correlation between Microstructure and Microhardness. Surf. Eng. 2004, 20, 353–359. [Google Scholar] [CrossRef]
  25. Tarkowski, L.; Indyka, P.; Bełtowska-Lehman, E. XRD characterisation of composite Ni–based coatings prepared by electrodeposition. Nucl. Instrum. Methods Phys. Res. Sect. B Beam Interact. Mater. At. 2012, 284, 40–43. [Google Scholar] [CrossRef]
  26. Atanassov, N.; Gencheva, K.; Bratoeva, M. Properties of nickel–tungsten alloys electrodeposited from sulfamate electrolyte. Plat. Surf. Finish. 1997, 84, 67–71. [Google Scholar]
  27. Jinlong, L.; Zhuqing, W.; Tongxiang, L.; Suzuki, K.; Hideo, M. Effect of tungsten on microstructures of annealed electrodeposited Ni–W alloy and its corrosion resistance. Surf. Coat. Technol. 2018, 337, 516–524. [Google Scholar] [CrossRef]
  28. Younes, O.; Gileadi, E. Electroplating of Ni/W alloys: I. Ammoniacal citrate baths. J. Electrochem. Soc. 2002, 149, C100. [Google Scholar] [CrossRef]
  29. Klimenkov, M.; Haseeb, A.; Bade, K. Structural investigations on nanocrystalline Ni–W alloy films by transmission electron microscopy. Thin Solid Films 2009, 517, 6593–6598. [Google Scholar] [CrossRef]
  30. Sriraman, K.; Raman, S.G.S.; Seshadri, S. Synthesis and evaluation of hardness and sliding wear resistance of electrodeposited nanocrystalline Ni–W alloys. Mater. Sci. Eng. A 2006, 418, 303–311. [Google Scholar] [CrossRef]
  31. Mohammadpour, Z.; Zare, H.R. Improving the Corrosion Resistance of the Nickel–Tungsten Alloy by Optimization of the Electroplating Conditions. Trans. Indian Inst. Met. 2020, 73, 937–944. [Google Scholar] [CrossRef]
  32. Wasekar, N.P.; Latha, S.M.; Ramakrishna, M.; Rao, D.; Sundararajan, G. Pulsed electrodeposition and mechanical properties of Ni–W/SiC nano–composite coatings. Mater. Des. 2016, 112, 140–150. [Google Scholar] [CrossRef]
  33. Wang, Y.; Yu, M.; Luo, H.; Qiao, Q.; Xiao, Z.; Zhao, Y.; Zhao, L.; Sun, H.; Xu, Z.; Matsugi, K.; et al. Effect of Saccharin on the Structure and Properties of Electrodeposition NiWP Alloy Coatings. J. Mater. Eng. Perform. 2016, 25, 4402–4407. [Google Scholar] [CrossRef]
  34. Cameron, J.C. Acetylenic Compositions and Nickel Plating Baths Containing Same. U.S. Patent No. 4,421,6111983, 20 December 1983. [Google Scholar]
  35. Rahman, O.A.; Wasekar, N.P.; Sundararajan, G.; Keshri, A.K. Experimental investigation of grain boundaries misorientations and nano twinning induced strengthening on addition of silicon carbide in pulse electrodeposited nickel tungsten composite coating. Mater. Charact. 2016, 116, 1–7. [Google Scholar] [CrossRef]
  36. Shi, Y.Z.; Yang, B.; Liaw, P.K. Corrosion–Resistant High–Entropy Alloys: A Review. Metals 2017, 7, 43. [Google Scholar] [CrossRef] [Green Version]
  37. Feng, L.; Ren, Y.-Y.; Zhang, Y.-H.; Wang, S.; Li, L. Direct Correlations among the Grain Size, Texture, and Indentation Behavior of Nanocrystalline Nickel Coatings. Metals 2019, 9, 188. [Google Scholar] [CrossRef] [Green Version]
  38. Dong, C.F.; Luo, H.; Xiao, K.; Li, X.G.; Cheng, Y.F. In Situ Characterization of Pitting Corrosion of Stainless Steel by a Scanning Electrochemical Microscopy. J. Mater. Eng. Perform. 2011, 21, 406–410. [Google Scholar] [CrossRef]
  39. Ahadian, M.; Zad, A.I.; Nouri, E.; Ranjbar, M.; Dolati, A. Diffusion and segregation of substrate copper in electrodeposited Ni–Fe thin films. J. Alloys Compd. 2007, 443, 81–86. [Google Scholar] [CrossRef]
  40. Liu, L.; Li, Y.; Wang, F. Influence of grain size on the corrosion behavior of a Ni–based superalloy nanocrystalline coating in NaCl acidic solution. Electrochimica Acta 2008, 53, 2453–2462. [Google Scholar] [CrossRef]
  41. Palumbo, G.; Dunikowski, D.; Wirecka, R.; Mazur, T.; Lelek-Borkowska, U.; Wawer, K.; Banaś, J. Effect of Grain Size on the Corrosion Behavior of Fe–3wt.%Si–1wt.%Al Electrical Steels in Pure Water Saturated with CO2. Materials 2021, 14, 5084. [Google Scholar] [CrossRef]
  42. Zhang, X.; Shi, M.; Li, C.; Liu, N.; Wei, Y. The influence of grain size on the corrosion resistance of nanocrystalline zirconium metal. Mater. Sci. Eng. A 2007, 448, 259–263. [Google Scholar] [CrossRef]
  43. Nyambura, S.M.; Kang, M.; Zhu, J.; Liu, Y.; Zhang, Y.; Ndiithi, N.J. Synthesis and Characterization of Ni–W/Cr2O3 Nanocomposite Coatings Using Electrochemical Deposition Technique. Coatings 2019, 9, 815. [Google Scholar] [CrossRef] [Green Version]
  44. Sriraman, K.; Raman, S.G.S.; Seshadri, S. Corrosion behaviour of electrodeposited nanocrystalline Ni–W and Ni–Fe–W alloys. Mater. Sci. Eng. A 2007, 460–461, 39–45. [Google Scholar] [CrossRef]
Figure 1. Schematic diagram of electrodeposition setup (a); Schematic diagram of hull cell equipped with thermostat and air agitation (b).
Coatings 12 00878 g001
Figure 2. Reverse pulse waveform; If = 0.15 Acm−2; Ir = 0.11 Acm−2; tf = 16 ms; tr = 9 ms; and total time = 30 min. If = forward current density; Ir = reverse current density; tf = forward pulse duration; tr = reverse pulse duration.
Coatings 12 00878 g002
Figure 3. Cyclic potentiodynamic polarization graphs of DC and PRC deposited. (a) Ni; (b) NiW; and (c) NiW–CeO2 exposed to artificial sea salt solution.
Coatings 12 00878 g003
Figure 4. Comparison of DC and PRC deposited Ni, NiW, and NiW–CeO2 coatings with respect to their corrosion potential determined in artificial sea salt solution.
Coatings 12 00878 g004
Figure 5. Potentiodynamic polarization (PP) of DC–Ni, PRC–Ni, DC–NiW, PRC–NiW, DC–NiW–CeO2, and PRC–NiW–CeO2 obtained in artificial sea salt solution.
Coatings 12 00878 g005
Figure 6. Corrosion current density and corrosion potential obtained from potentiodynamic polarizations graphs obtained in artificial sea salt solution for various deposits of DC–Ni, PRC–Ni, DC–NiW, PRC–NiW, DC–NiW–SiC, and PRC–NiW–SiC, DC–NiW–SiC–CeO2, and PRC–NiW–SiC–CeO2.
Coatings 12 00878 g006
Figure 7. (a) Schematic diagram of the specimen masked with 3M insulating tape with 1 cm2 exposed circular area. (b) Optical micrographs taken from the exposed area of various deposits after potentiodynamic polarization of the deposits in artificial sea salt solution.
Coatings 12 00878 g007
Figure 8. SEM micrograph and EDS spectra from the surface of DC−Ni before corrosion. (a) SEM micrograph, EDS spectra and X-ray mapping from the surface of DC−Ni after corrosion.
Coatings 12 00878 g008
Figure 9. SEM micrograph and EDS spectra from the surface of PRC−Ni before corrosion. (a) SEM micrograph, EDS spectra and X-ray mapping from the surface of PRC−Ni after corrosion.
Coatings 12 00878 g009
Figure 10. SEM micrograph, EDS spectra, and X-ray mapping from the surface of DC–NiW before corrosion. (a) SEM micrograph, EDS spectra, and X-ray mapping from the surface of DC–NiW after corrosion.
Coatings 12 00878 g010
Figure 11. SEM micrograph, EDS spectra, and X-ray mapping from the surface of PRC–NiW before corrosion (a); SEM micrograph, EDS spectra, and X-ray mapping from the surface of PRC–NiW after corrosion.
Coatings 12 00878 g011
Figure 12. SEM micrograph, EDS spectra, and X-ray mapping from the surface of DC–NiW–CeO2 before corrosion. (a) SEM micrograph, EDS spectra, and X-ray mapping from the surface of DC–NiW–CeO2 after corrosion. Concentration of CeO2 in electrolyte was 40 g·L−1.
Coatings 12 00878 g012
Figure 13. SEM micrograph, EDS spectra, and X-ray mapping from the surface of PRC–NiW–CeO2 before corrosion. (a) SEM micrograph, EDS spectra, and X-ray mapping from the surface of PRC–NiW–CeO2 after corrosion. Concentration of CeO2 in electrolyte was 40 g·L−1.
Coatings 12 00878 g013
Figure 14. Coefficient of friction for the DC and PRC deposited Ni, NiW, and NiW–CeO2 electrodeposited from an optimized electrolyte on the brass substrate for 3500 revolutions at room temperature and normal applied load of 1N.
Coatings 12 00878 g014
Figure 15. Wear volume for the DC and PRC deposited Ni, NiW, and NiW–CeO2 electrodeposited coatings.
Coatings 12 00878 g015
Figure 16. XRD spectra from the surface of PRC–electrodeposited Ni, NiW, and NiW–CeO2 (as–deposited and heat–treated at 350 °C and 500 °C).
Coatings 12 00878 g016aCoatings 12 00878 g016b
Table 1. Electrodeposition bath ingredients and optimized experimental parameters.
Name of ChemicalsConcentration
Nickel sulfate29.5–30 (g·L−1)
Sodium tungstate58–60 (g·L−1)
Citric acid63–67 (g·L−1)
Ammonia58 (mL·L−1)
Sulfuric acidas needed
Propargyl–oxo–propane–2,3–dihydroxy (POPDH)0.9–1 (g·L−1)
DuPont™ Capstone® Fluoro–surfactant FS–631.8–2 (g·L−1)
Sodium saccharin0.5–1 (g·L−1)
Experimental Parameters
pH7.8–8.0
Temperature58–61 °C
Duration of electrodeposition30 min
Table 2. Composition of Artificial Sea Water.
IngredientsConcentrations (wt%)
NaCl58.49
Na2SO49.75
CaCl22.765
KCl1.645
NaHCO30.477
KBr0.238
H3BO30.071
SrCl2.6H2O0.095
NaF0.007
MgCl226.46
Table 3. Crystallite sizes of PRC–deposited Ni, NiW and NiW–CeO2.
CoatingsPeak Position of (111)
[°2Th]
FWHM
[°2Th]
Crystallite Size
[Å]
PRC–Ni (as–deposited)44.7120.443197
PRC–Ni (heat–treated at 350 °C)44.8100.315280
PRC–Ni (heat–treated at 500 °C)44.6510.0791210
PRC–NiW (as–deposited)44.2200.630138
PRC–NiW (heat–treated at 350 °C)44.3190.433202
PRC–NiW (heat–treated at 500 °C)44.1300.386222
PRC–NiW–CeO2 (as–deposited)44.2610.779110
PRC–NiW–CeO2 (heat–treated at 350 °C)44.0750.692124
PRC–NiW–CeO2 (heat–treated at 500 °C)44.2140.543158
Publisher’s Note: MDPI stays neutral with regard to jurisdictional claims in published maps and institutional affiliations.

