
High-Temperature Interdiffusion of Tantalum and Niobium with SiC for Processing Hybrid Metal/CMC Components

 , ,
, ,
Abstract
:1. Introduction
2. State-of-the-Art
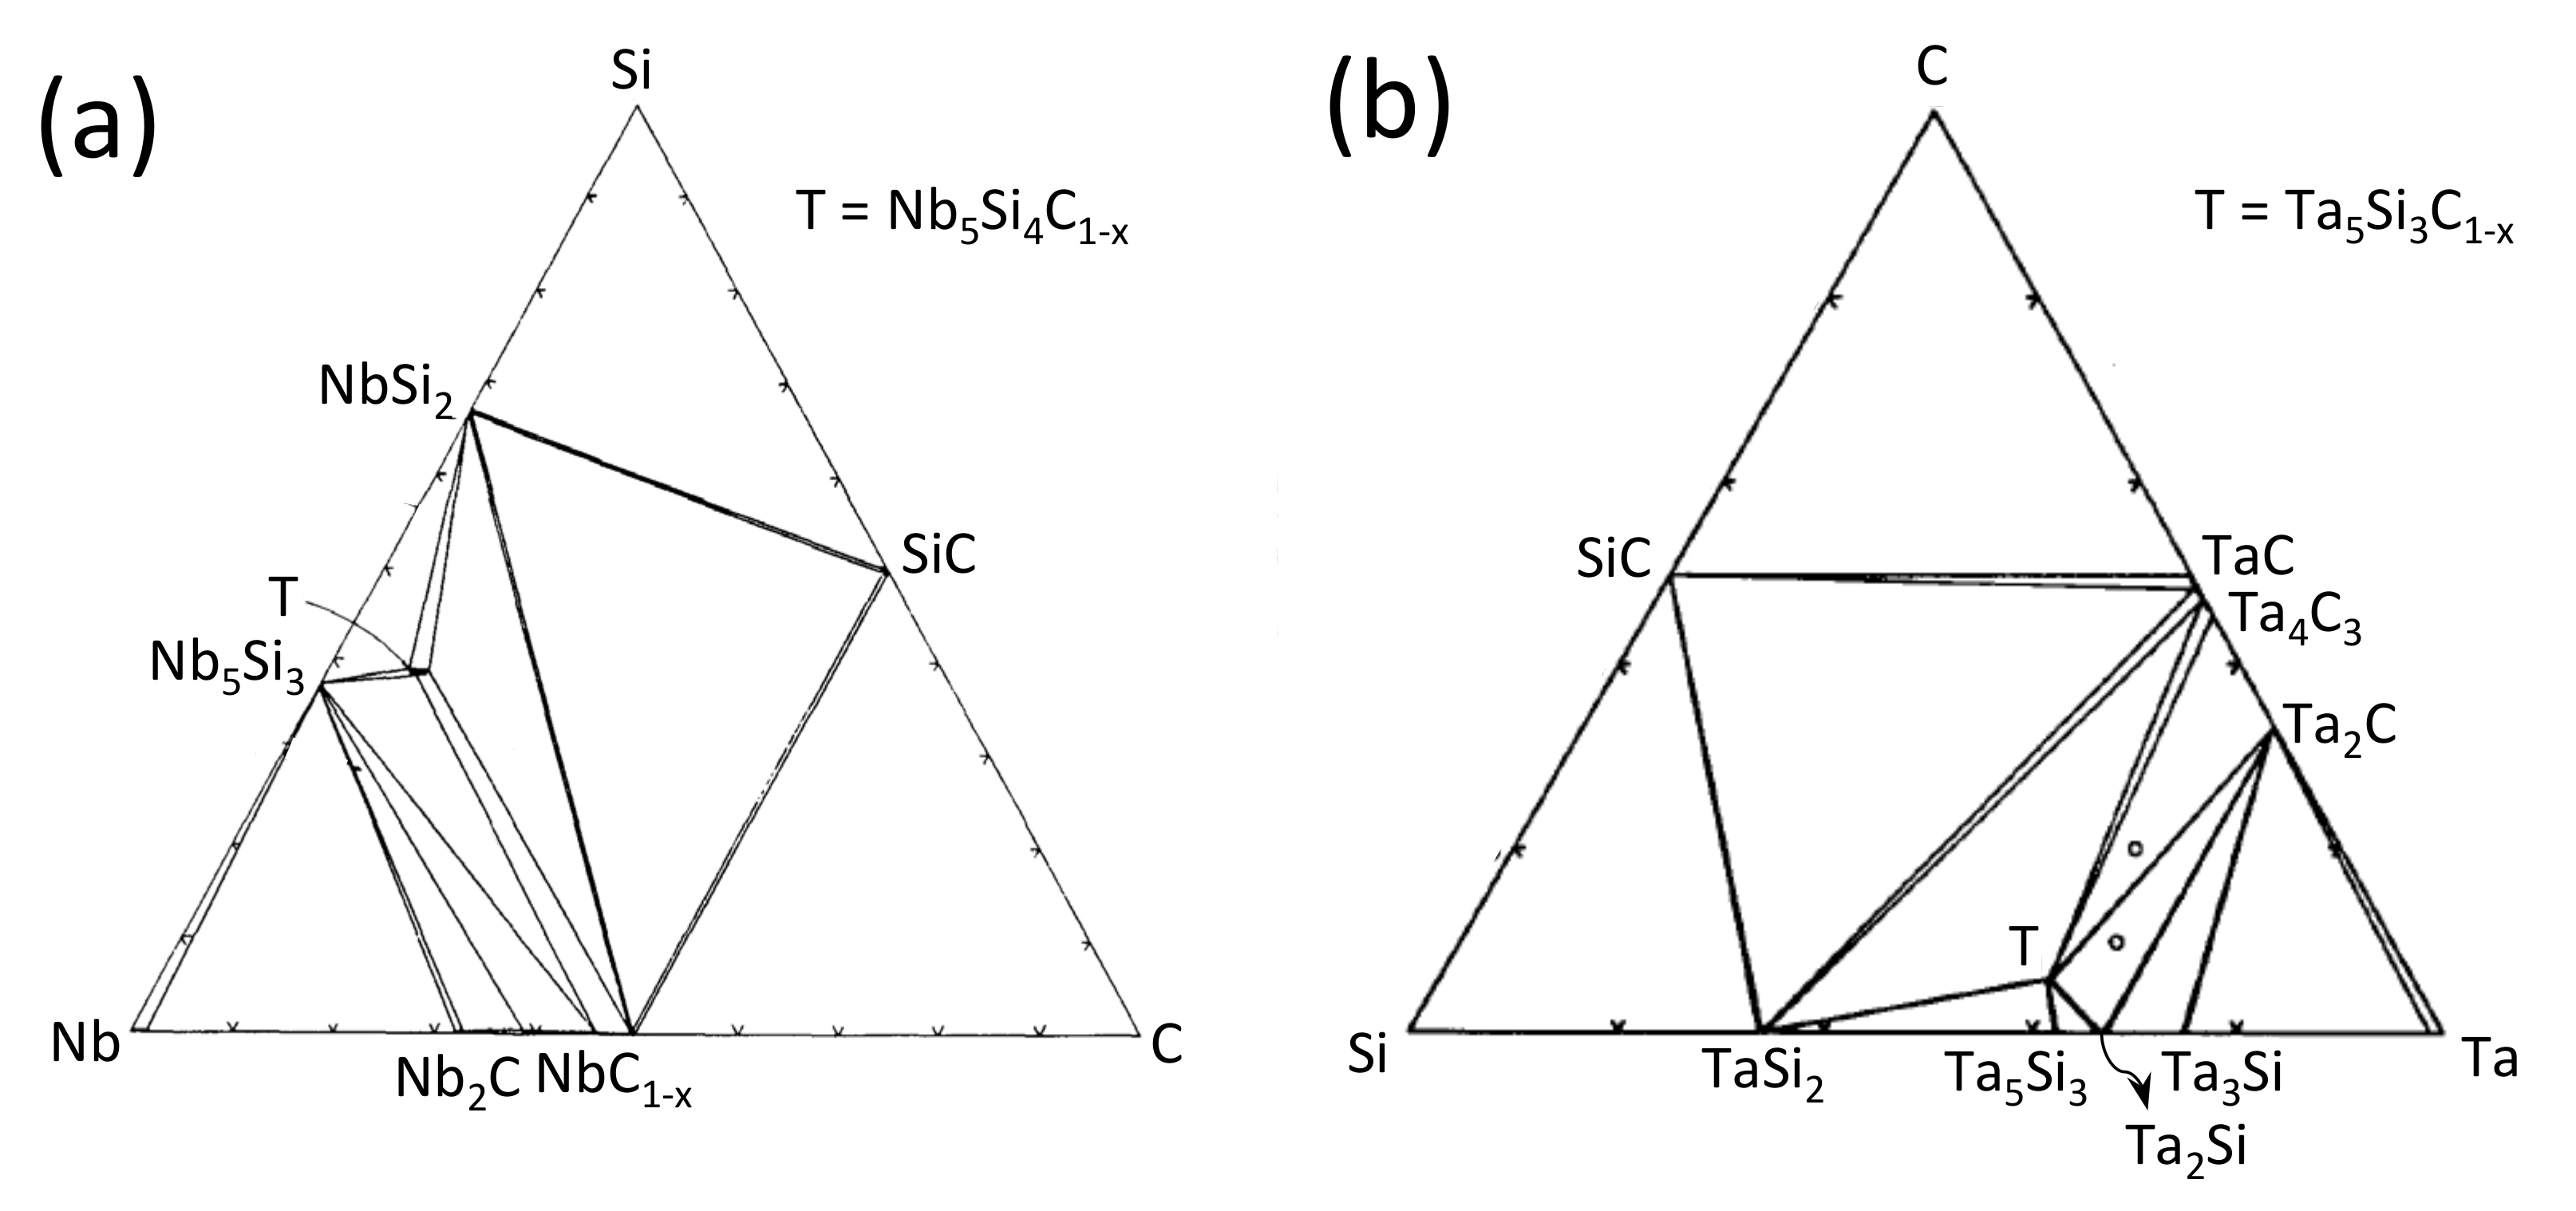
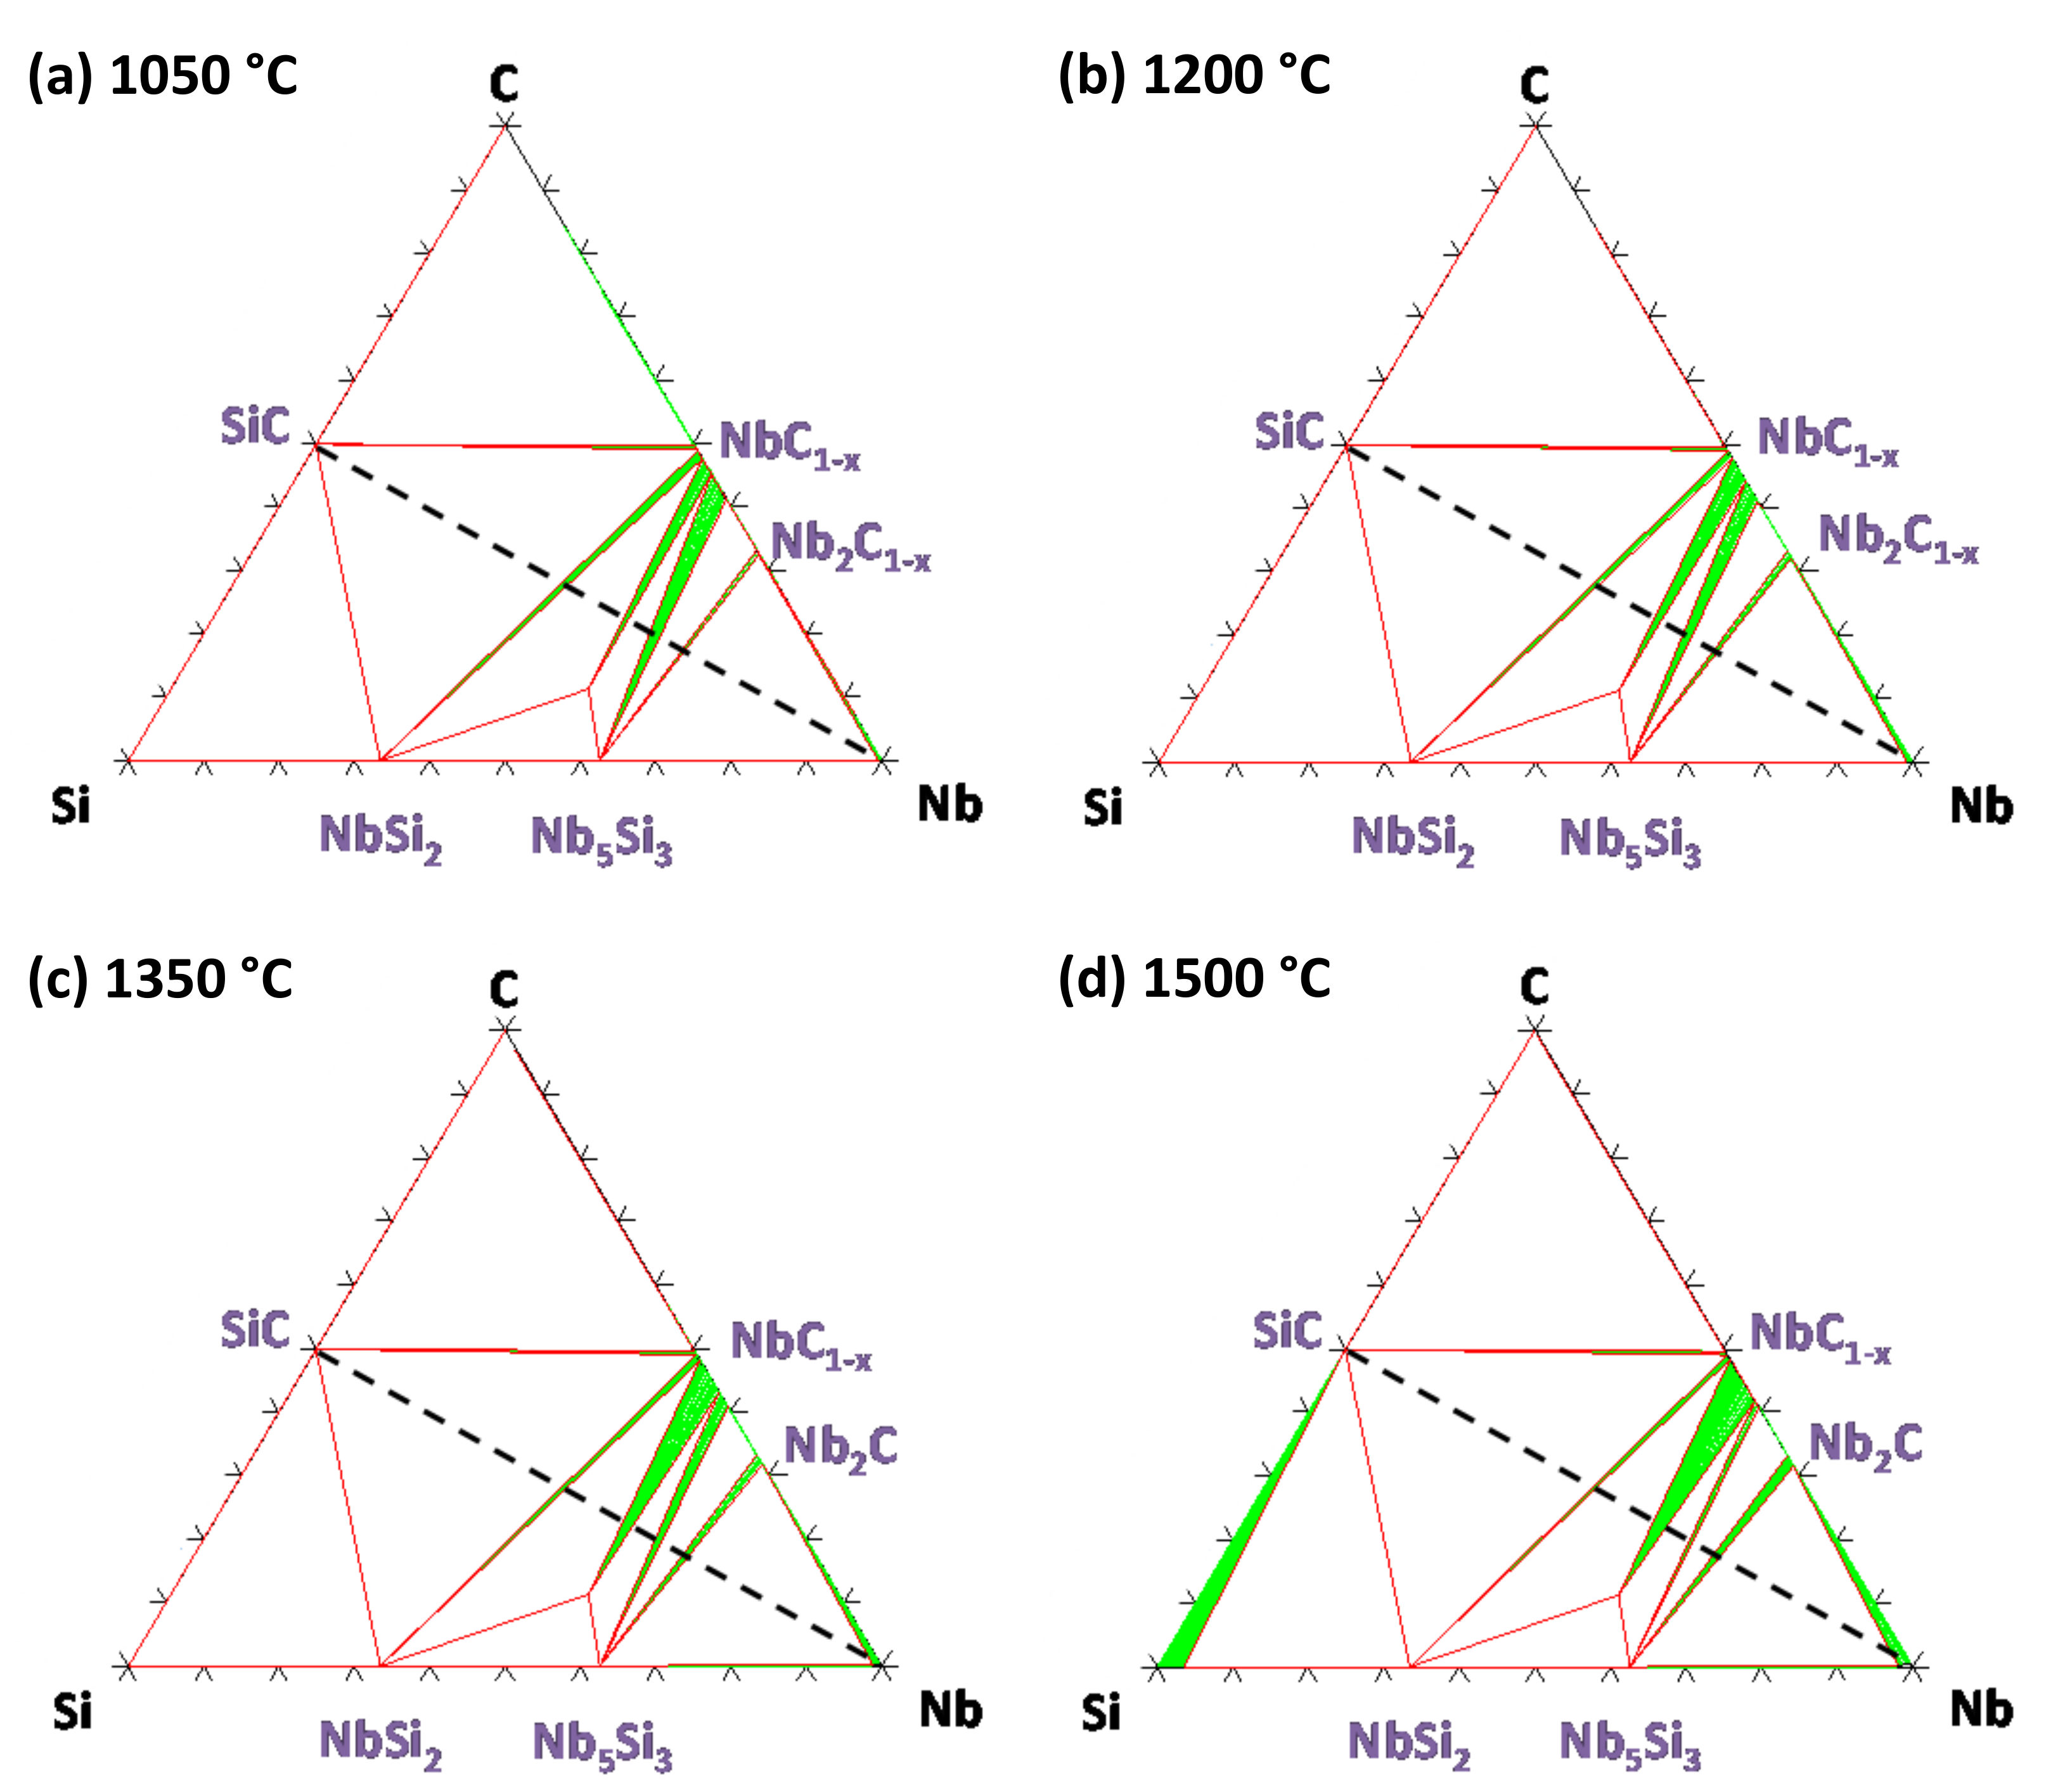
2.1. Nb–Si–C System

| T (°C) | Duration | System | Formed Phases | Reference |
|---|---|---|---|---|
| 1827 | 15 to 60 min | SiC/Nb (powders) | Nb5Si3, NbSi0.55 | Brewer [23] |
| 1200 to 1800 | - | SiC/Nb (SiC compacted on dense metal) | NbC, NbSi2 | Burykina [25] |
| ≥1800 | 2 h | NbC | ||
| 1425 | - | SiC (nano)/Nb (powder) | Nb2C, Nb5Si3 | Rahaman [26] |
| 1300 | - | SiC/Nb (powders) | Nb11Si8.1C2, NbSi2, Nb5Si3, NbC1−x Nb2C | Brukl [27] |
| 1100 | 4 h | SiC (substrate)/Nb (1 to 2 µm) | Nb5Si4C, Nb5Si3, Nb2C | Yaney [30] |
| 1200 | 6 to 48 h | SiC/Nb (plates) | NbCx, NbSiyCz | Chou [31] |
| 1000 to 1200 | 4 h | SiC/Nb (1 µm) | NbC, Nb5Si4C, Nb5Si3, Nb2C | |
| 1100 to 1500 | 30 min to 6 h | Si + SiC/Nb (plates) | Nb5Si3 (1200 °C) Nb5Si3, NbSi2 (1400 °C) | Naka [40] |
| 1100 | 2 to 8 h | SiC/Nb (1 µm) | NbC, Nb2C, T(Nb 64 at.%–C 20 at.%–Si 16 at.%), NbC | Joshi [35] |
| 1200 | NbCx, T, NbCy | |||
| 1100 to 1500 | 30 min to 6 h | SiC(B,C)/Nb | Nb5Si3, NbSi2 | Naka [41] |
| 845 to 1500 | 30 min to 30 h | SiC(Al2O3)/Nb (12.7 and 25 µm) | NbC, Nb5Si3C, Nb5Si3, Nb2C | Naka [43] |
| 1500 | - | Si(Al2O3)/Nb (12.7 µm) | NbC, Nb5Si3C, Nb5Si3, Nb2C | Naka [32] |
| 1500 | 10 h | SiC(Al2O3)/Nb (plates) | NbC, Nb5Si3Cx, NbC, Nb2C | Naka [44] |
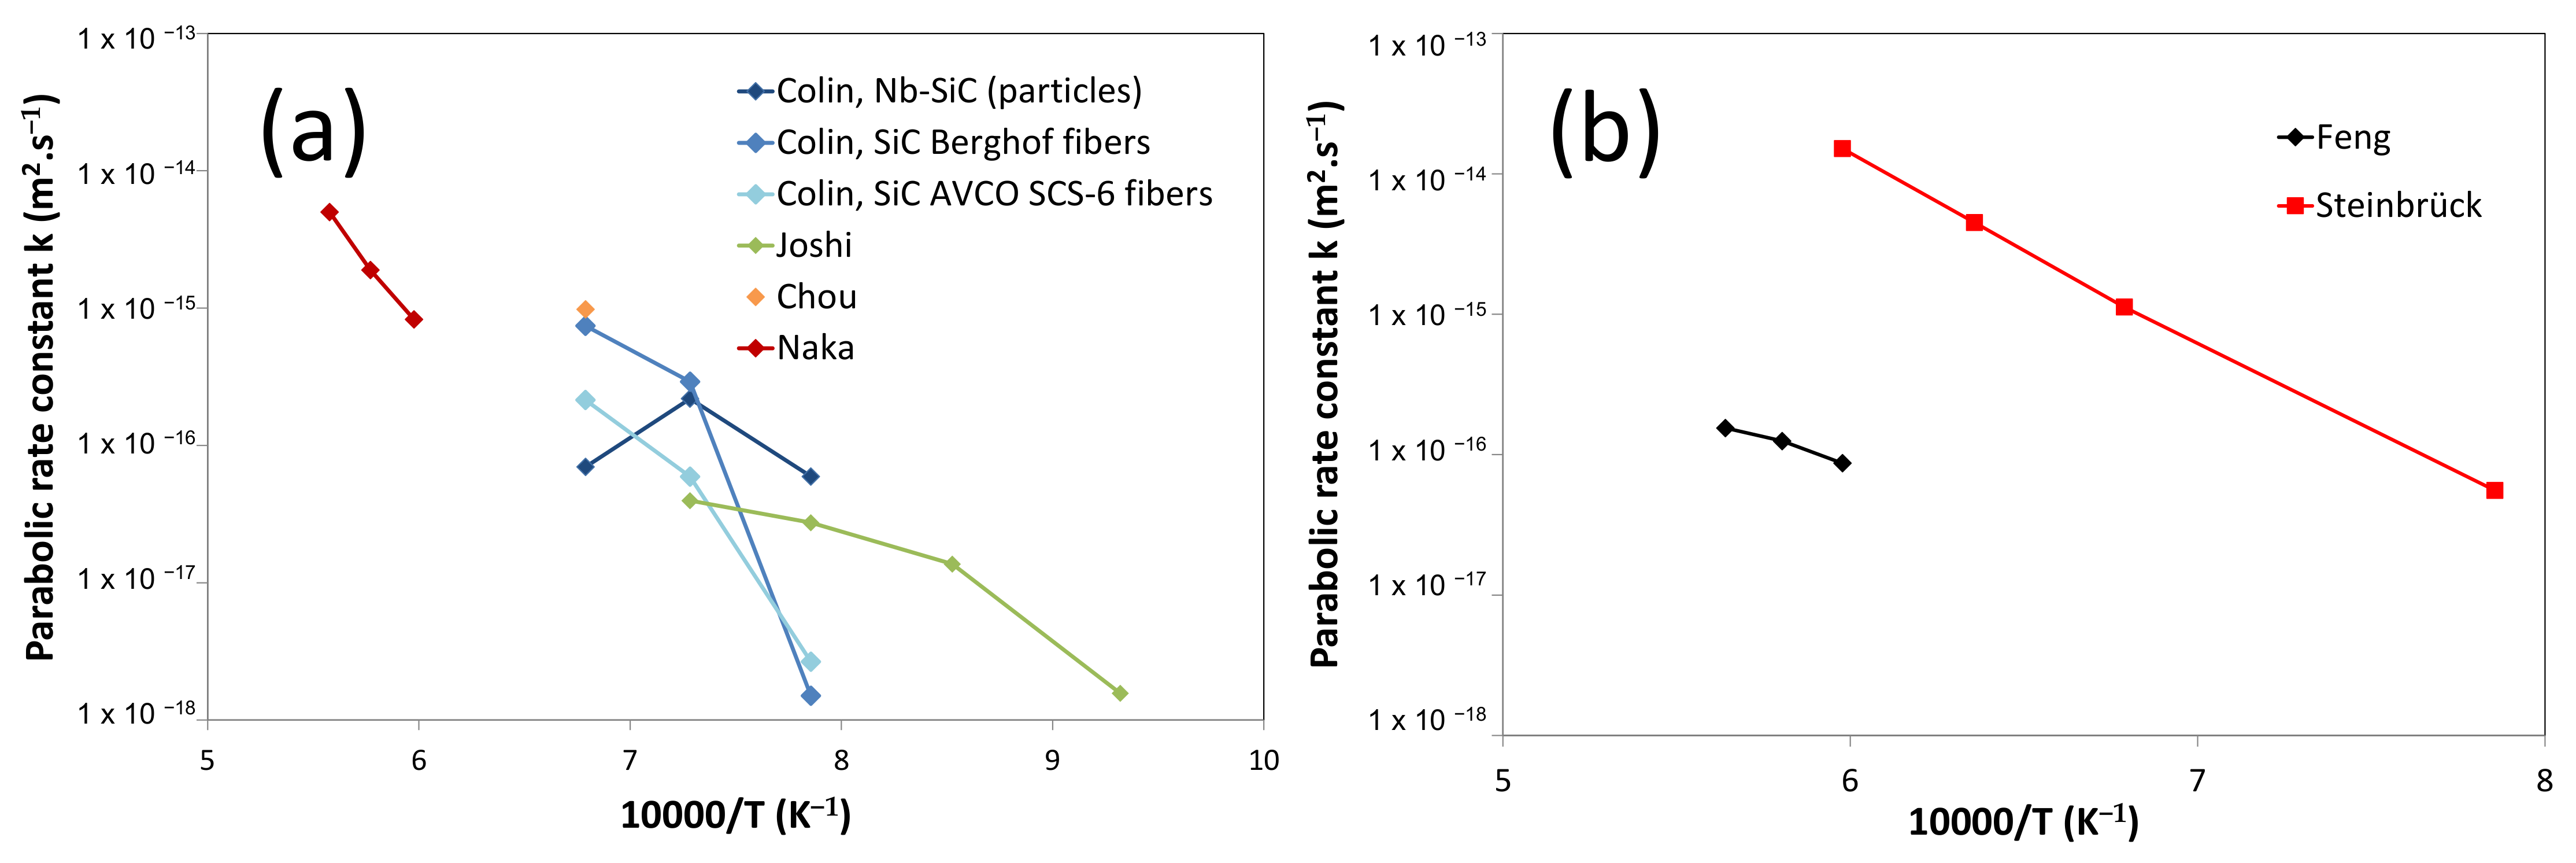
| 1000 to 1200 | 150 h | SiC (fibers or particles)/Nb (matrix) | NbC, Nb5Si3Cx, Nb5Si3, Nb2C | Colin [45] |
| 1300 | 8 to 100 h | NbC (sintered)/ Si (pure) | SiC, NbSi2 | Kao [36] |
2.2. The Ta–Si–C System
3. Experimental Methods
4. Thermodynamic Calculations
5. Results
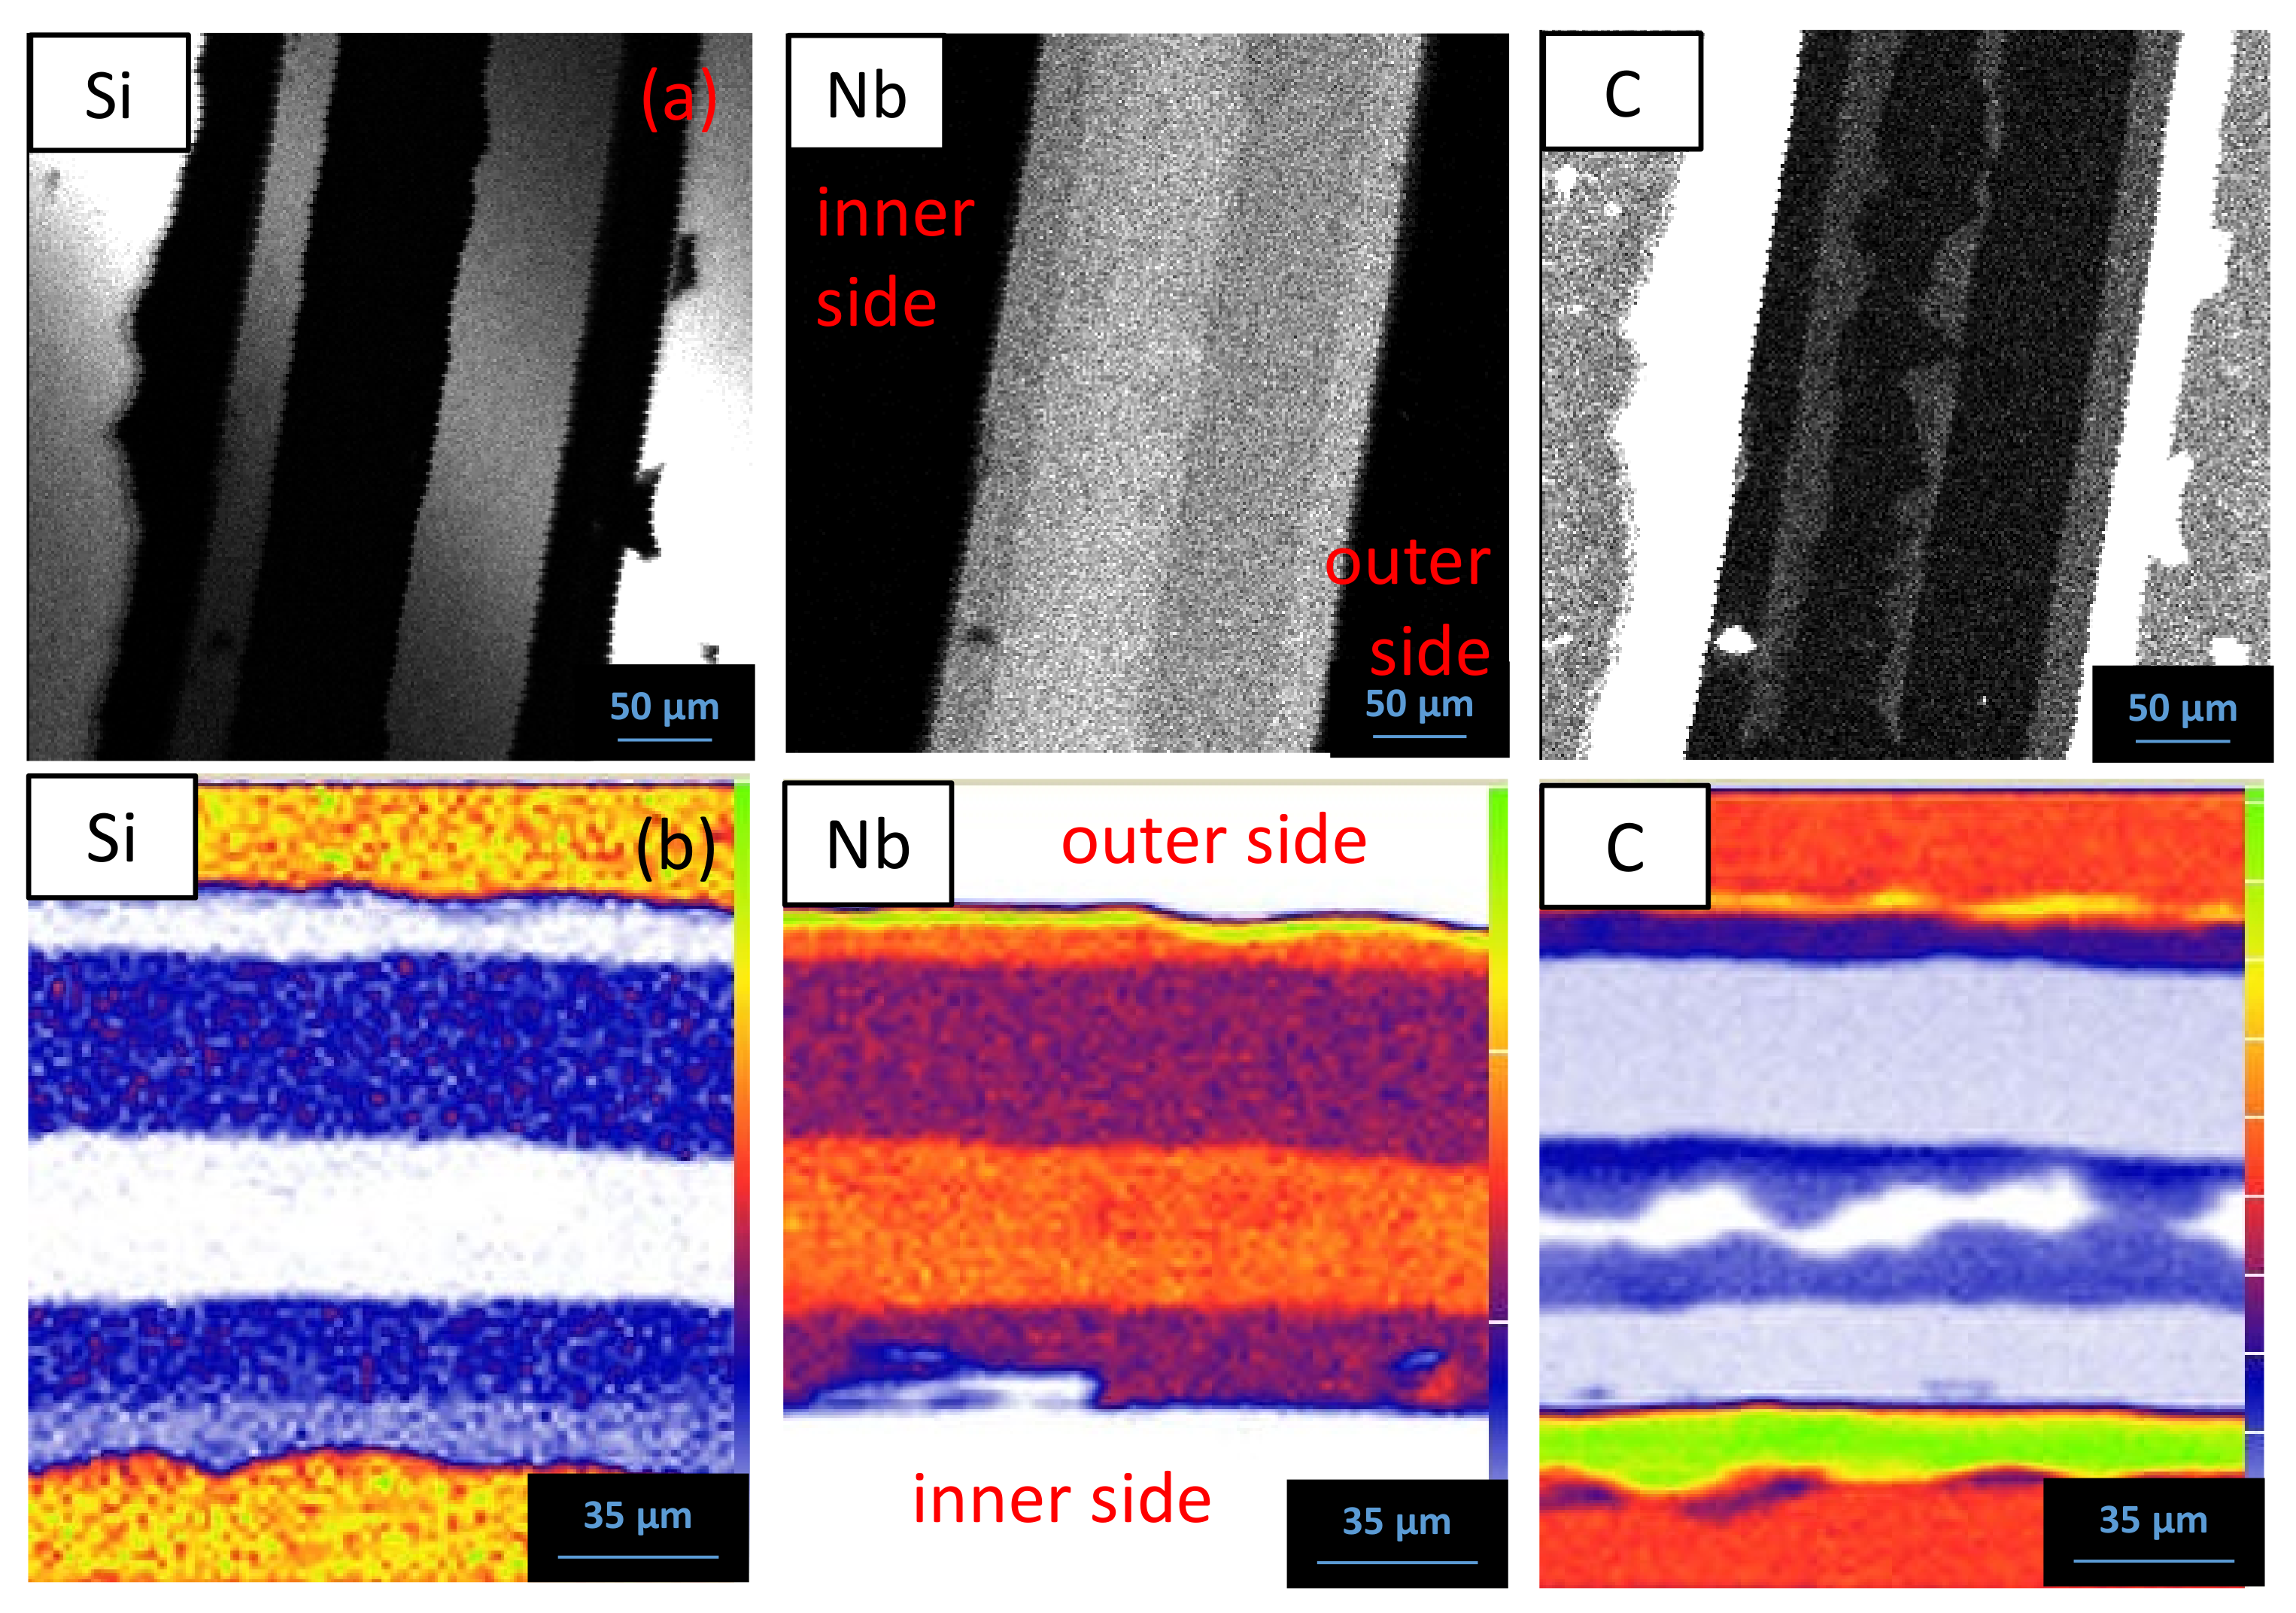
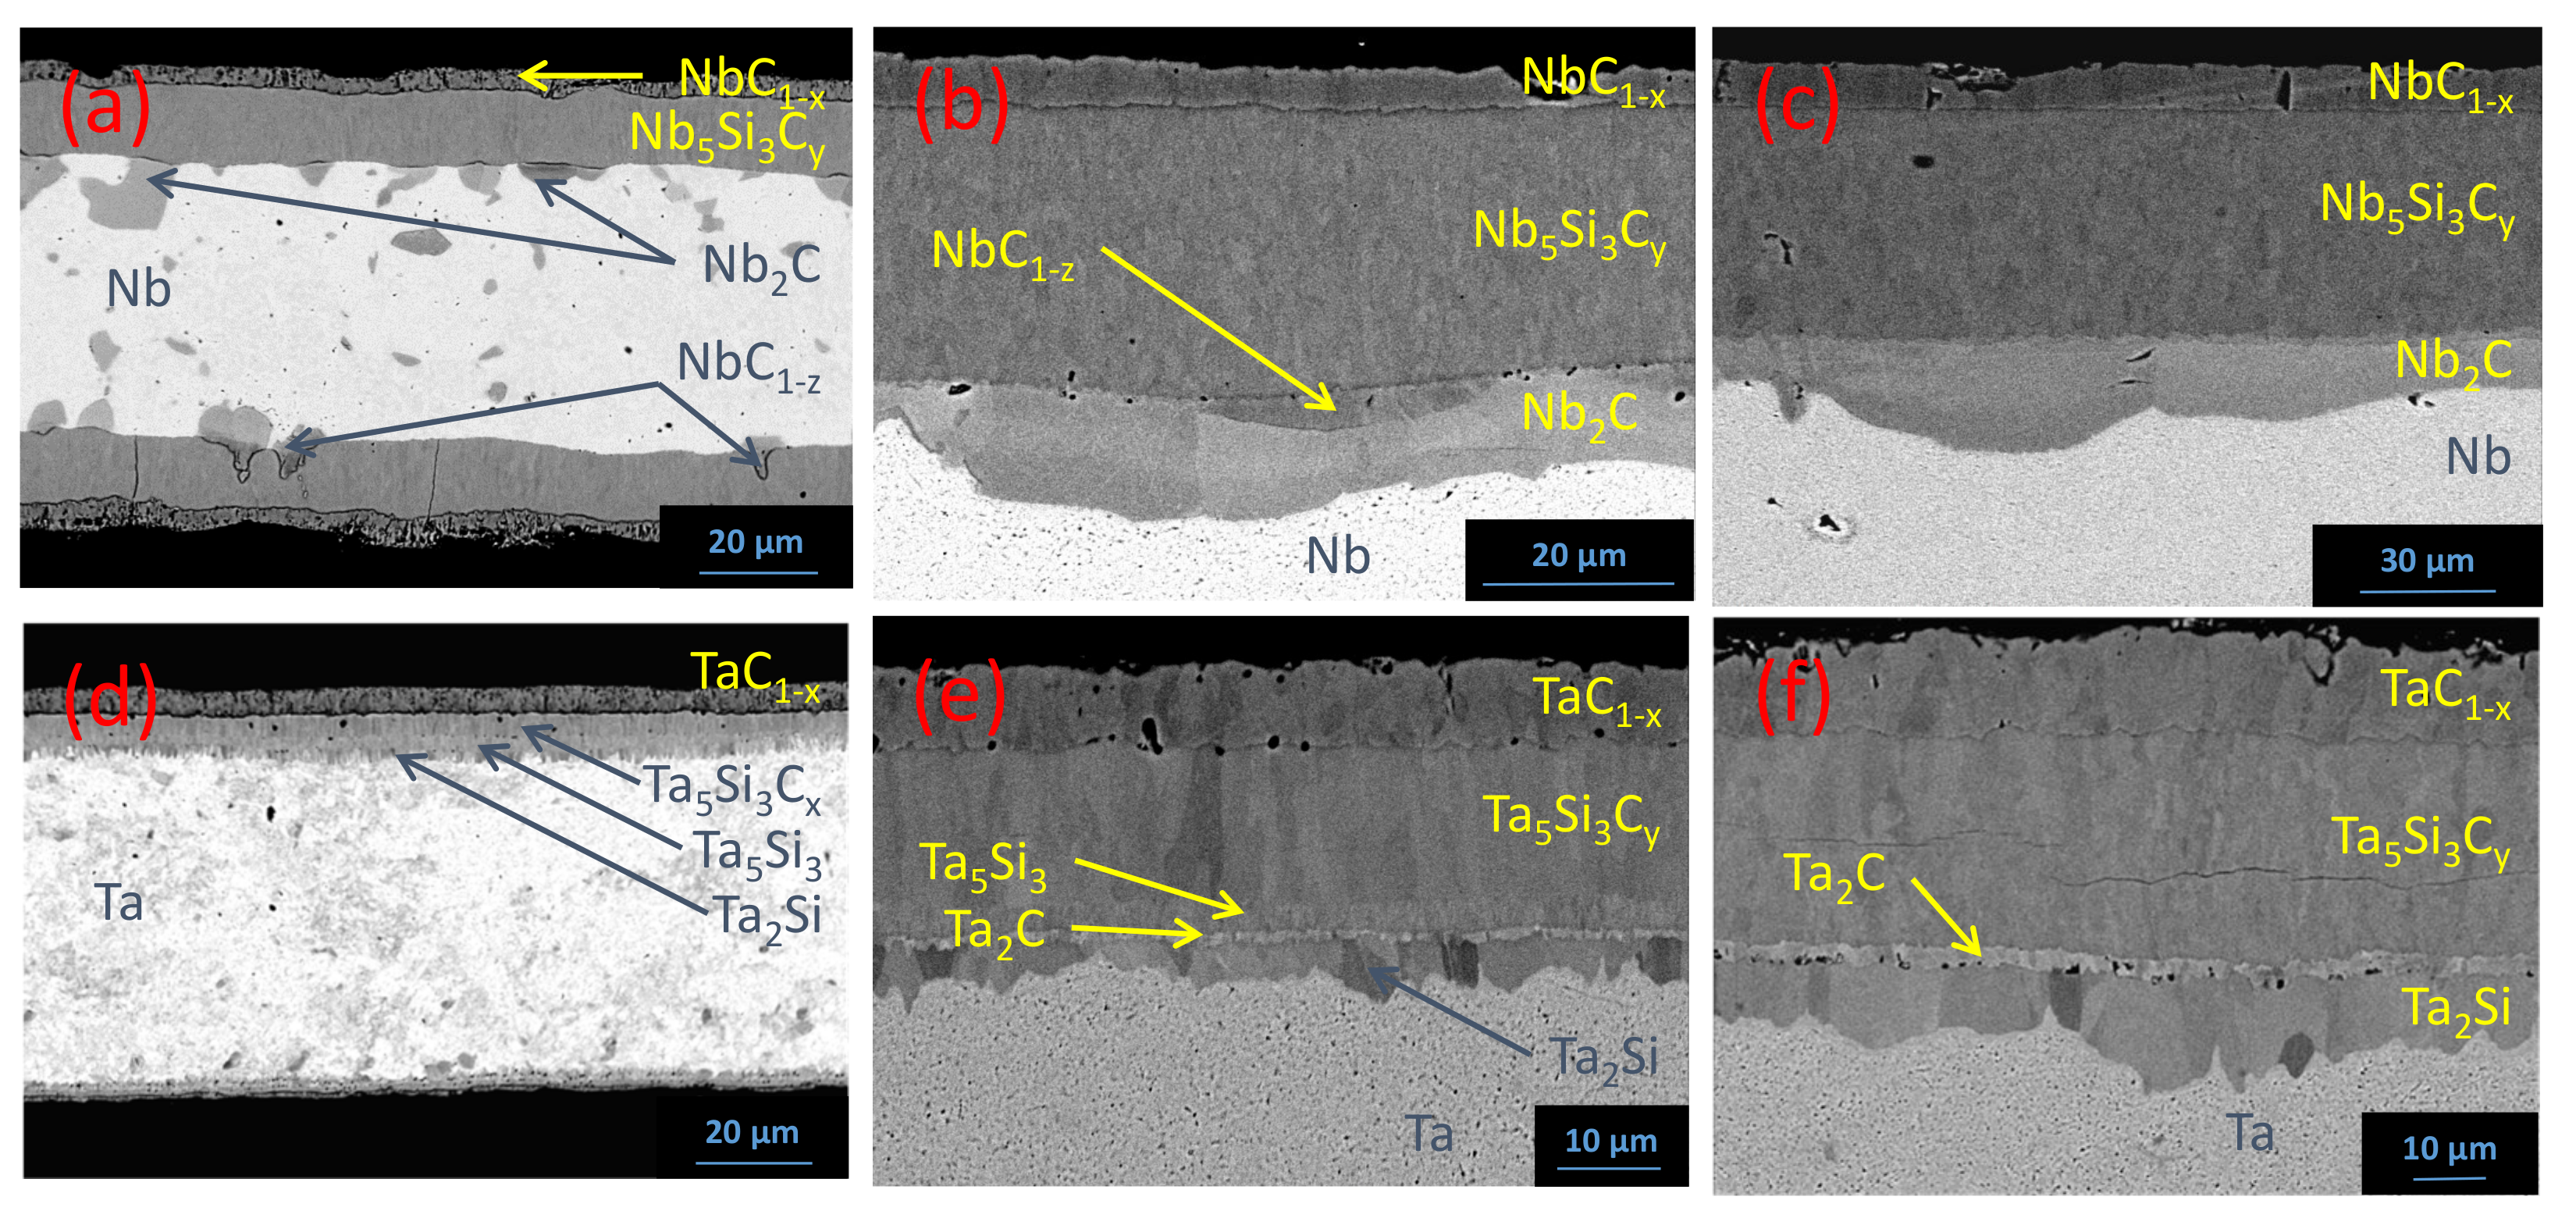
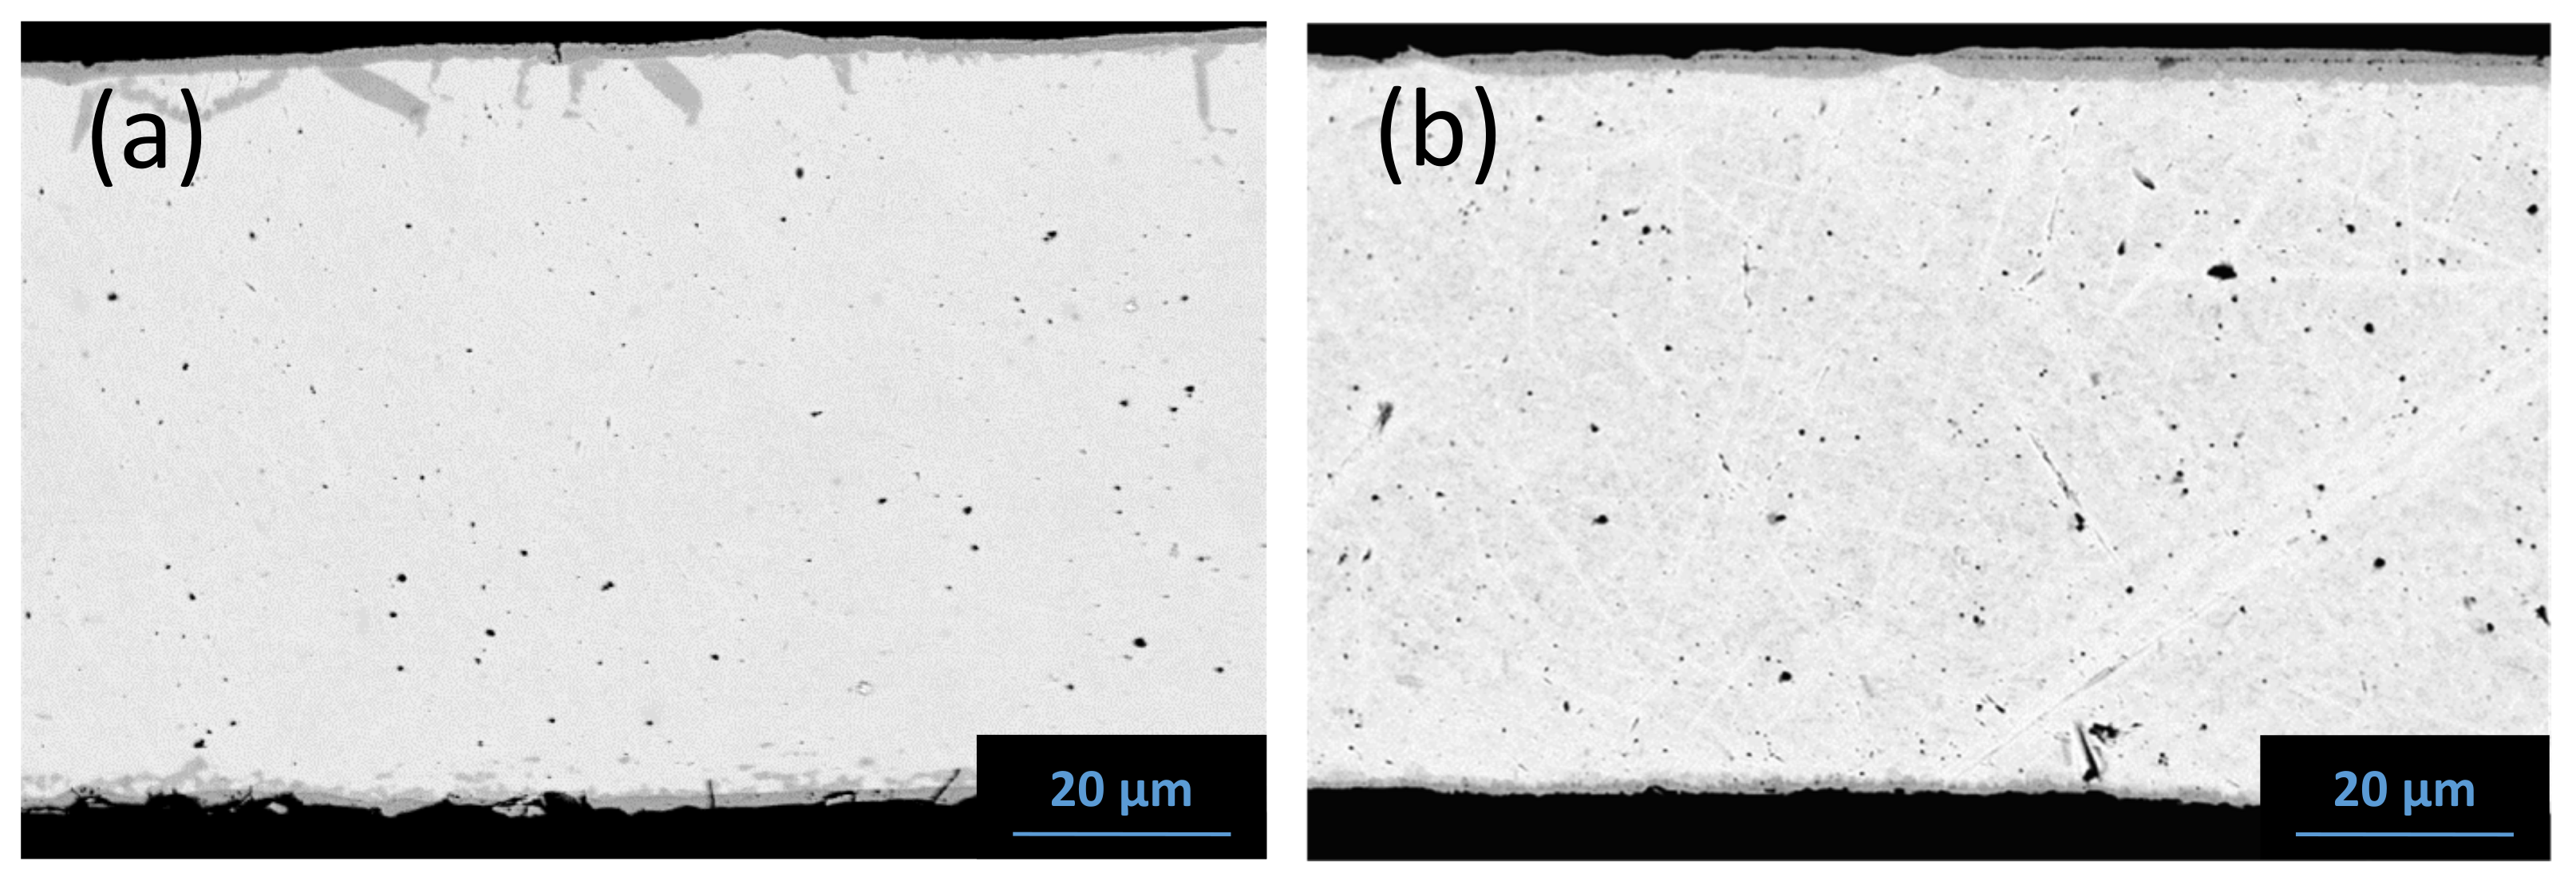
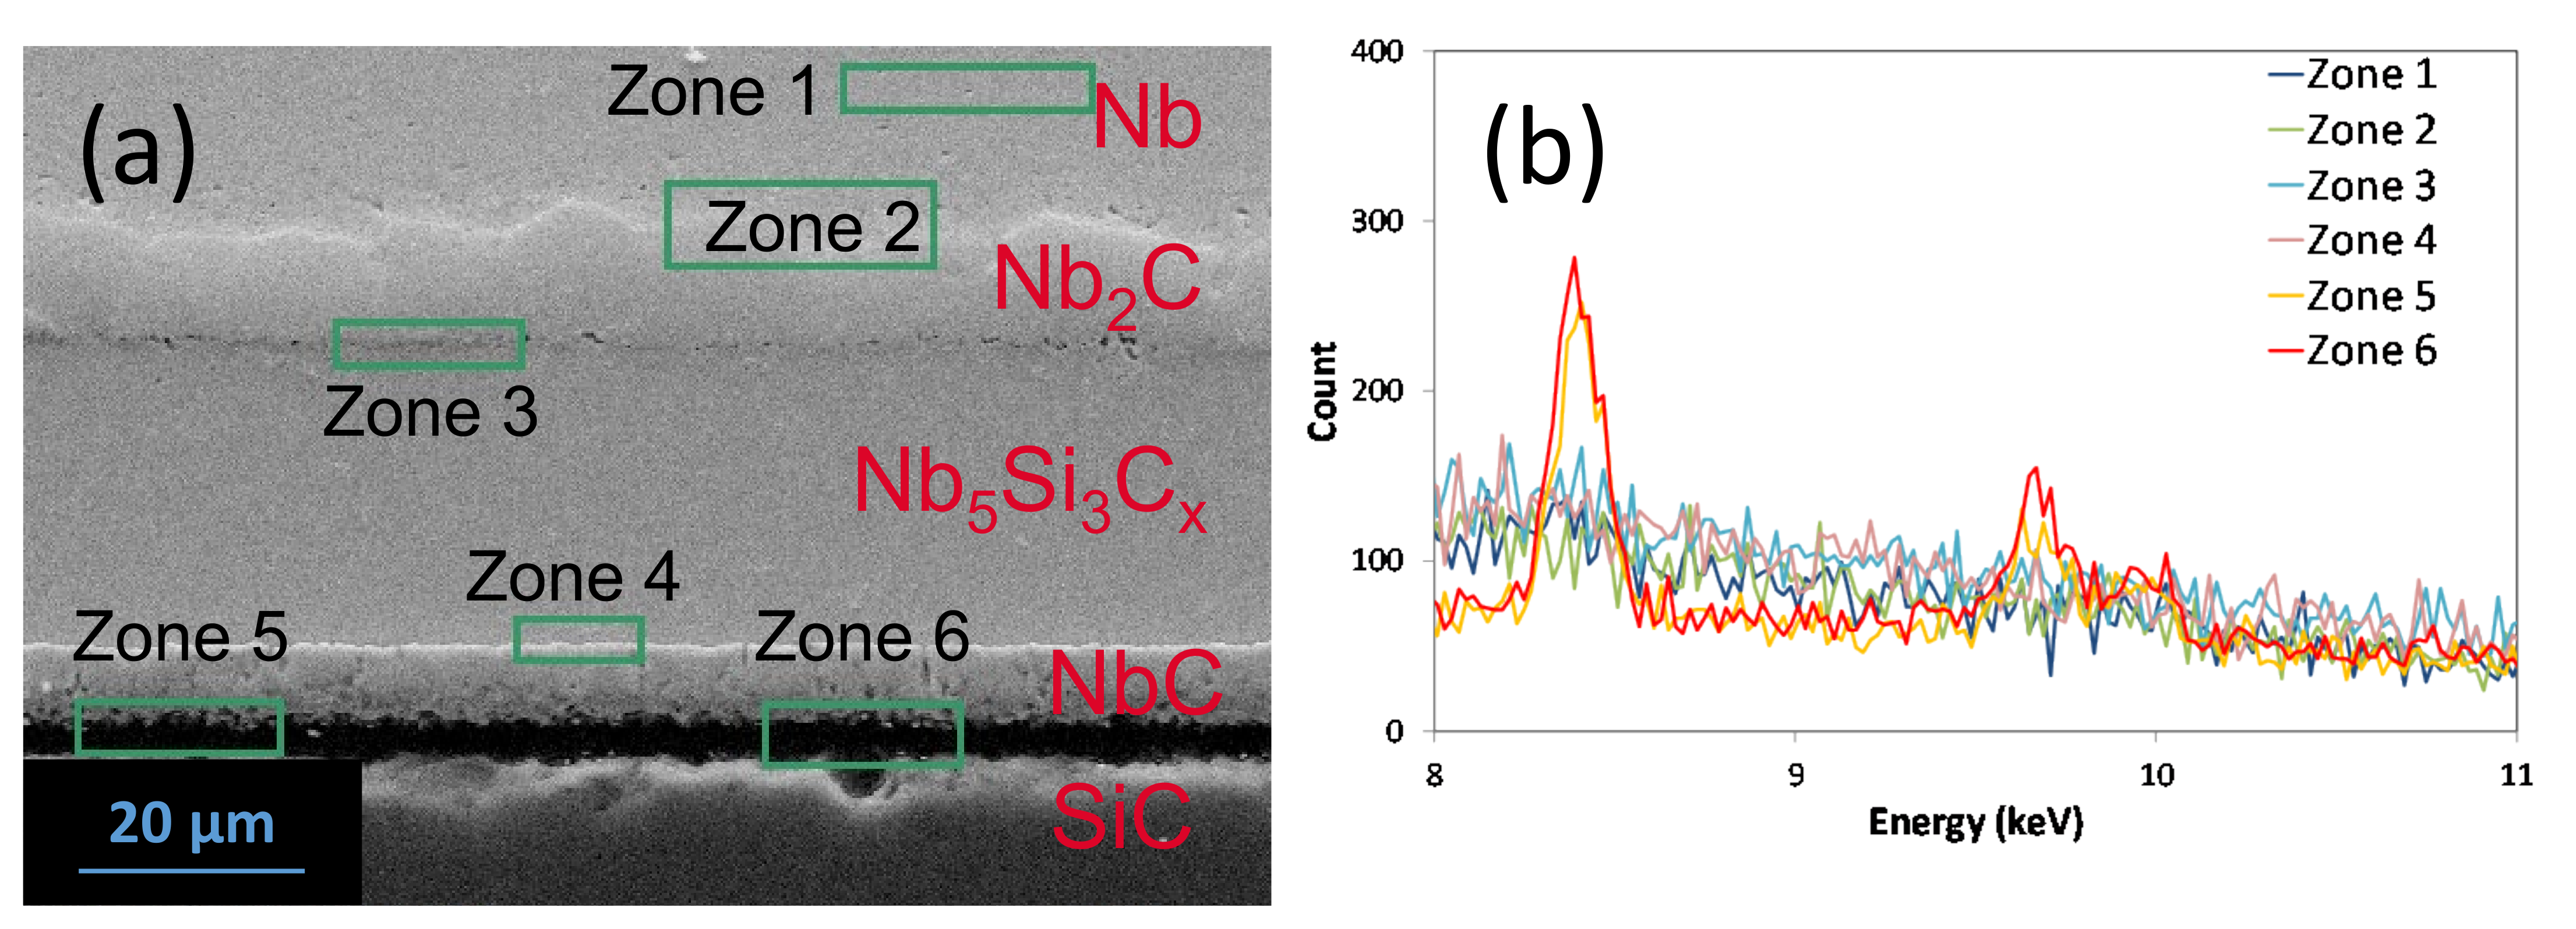
5.1. Reaction Zone Morphology and Composition at 1200 °C
- (a)
- SiC/NbC1−x/Nb5Si3Cy/NbC1−z/Nb2C/Nb
- (b)
- SiC/TaC1−x/Ta5Si3Cy/Ta5Si3/Ta2Si/Ta + (Ta2C)precipitates/Ta
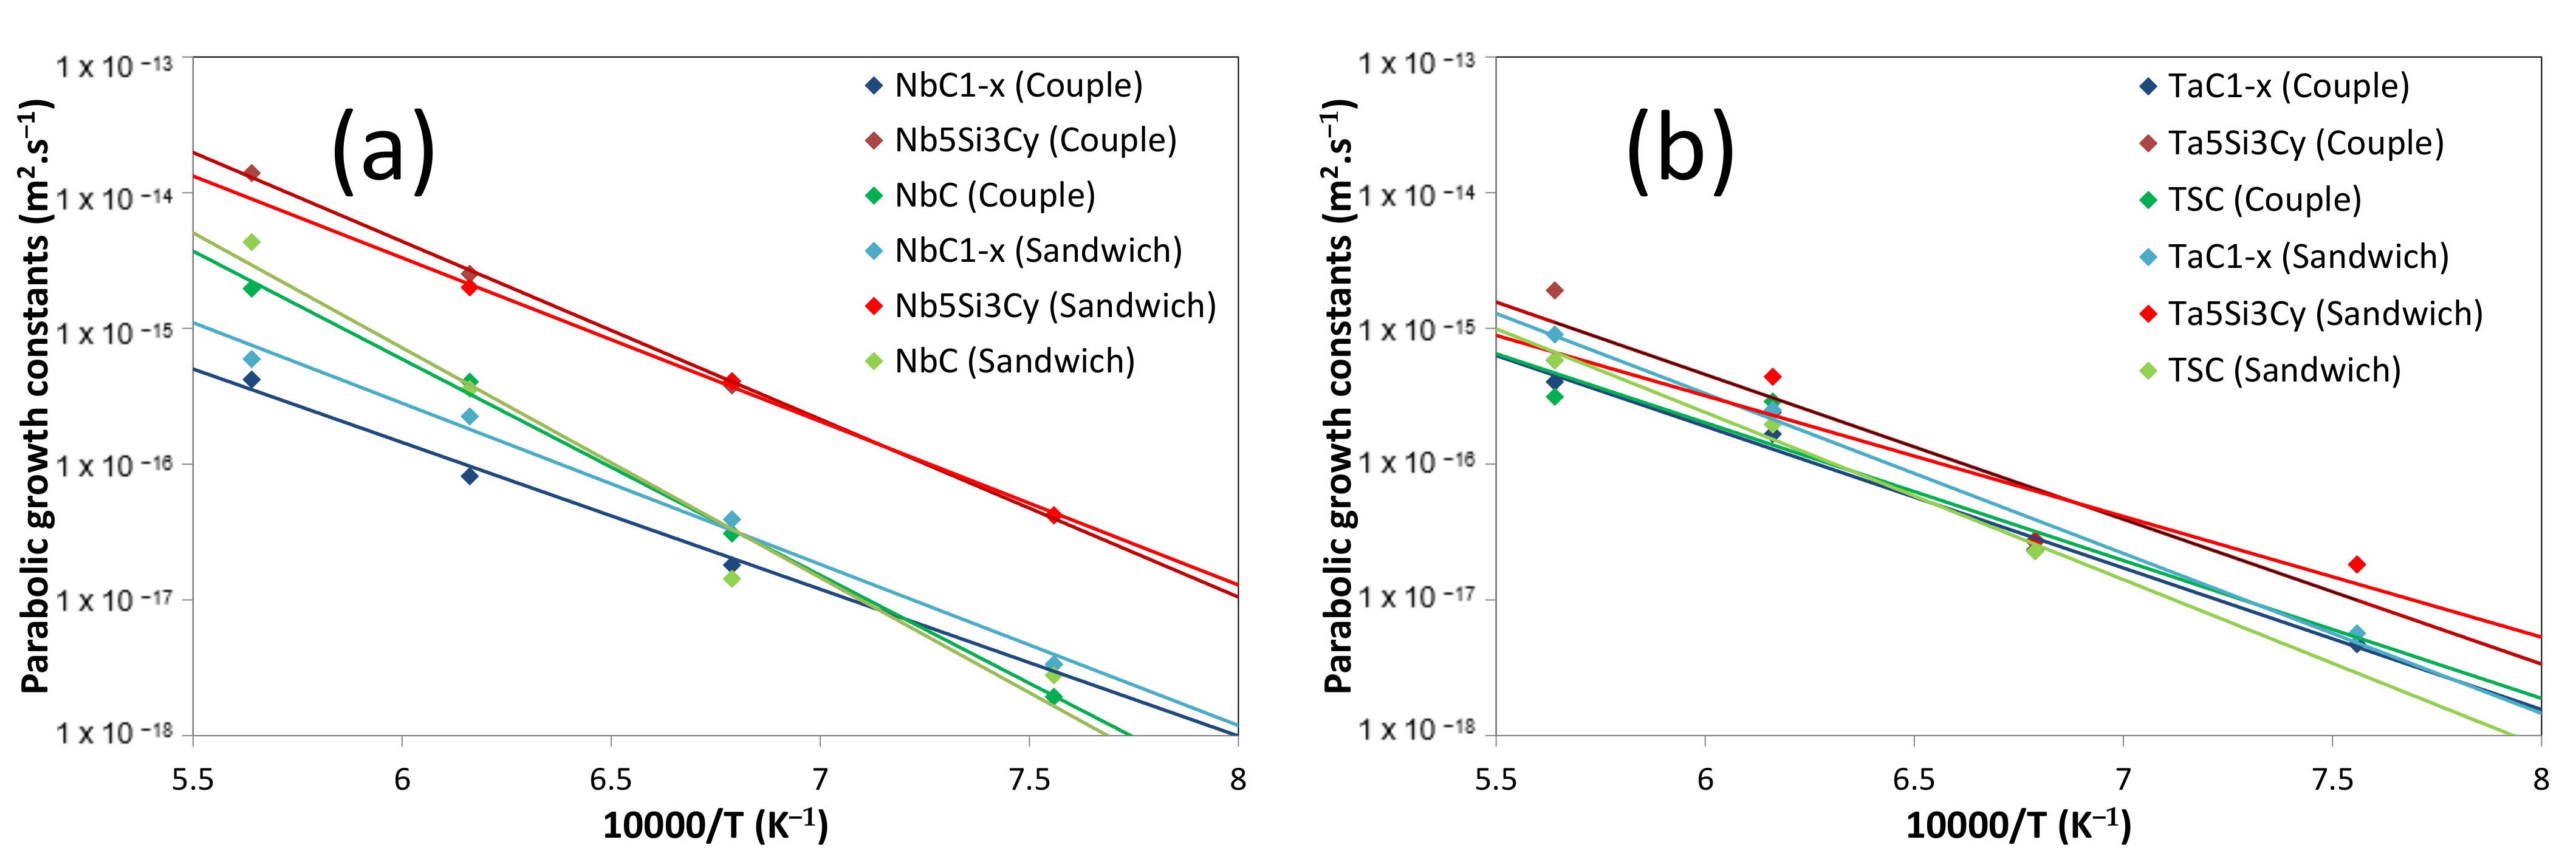
5.2. Influence of Temperature
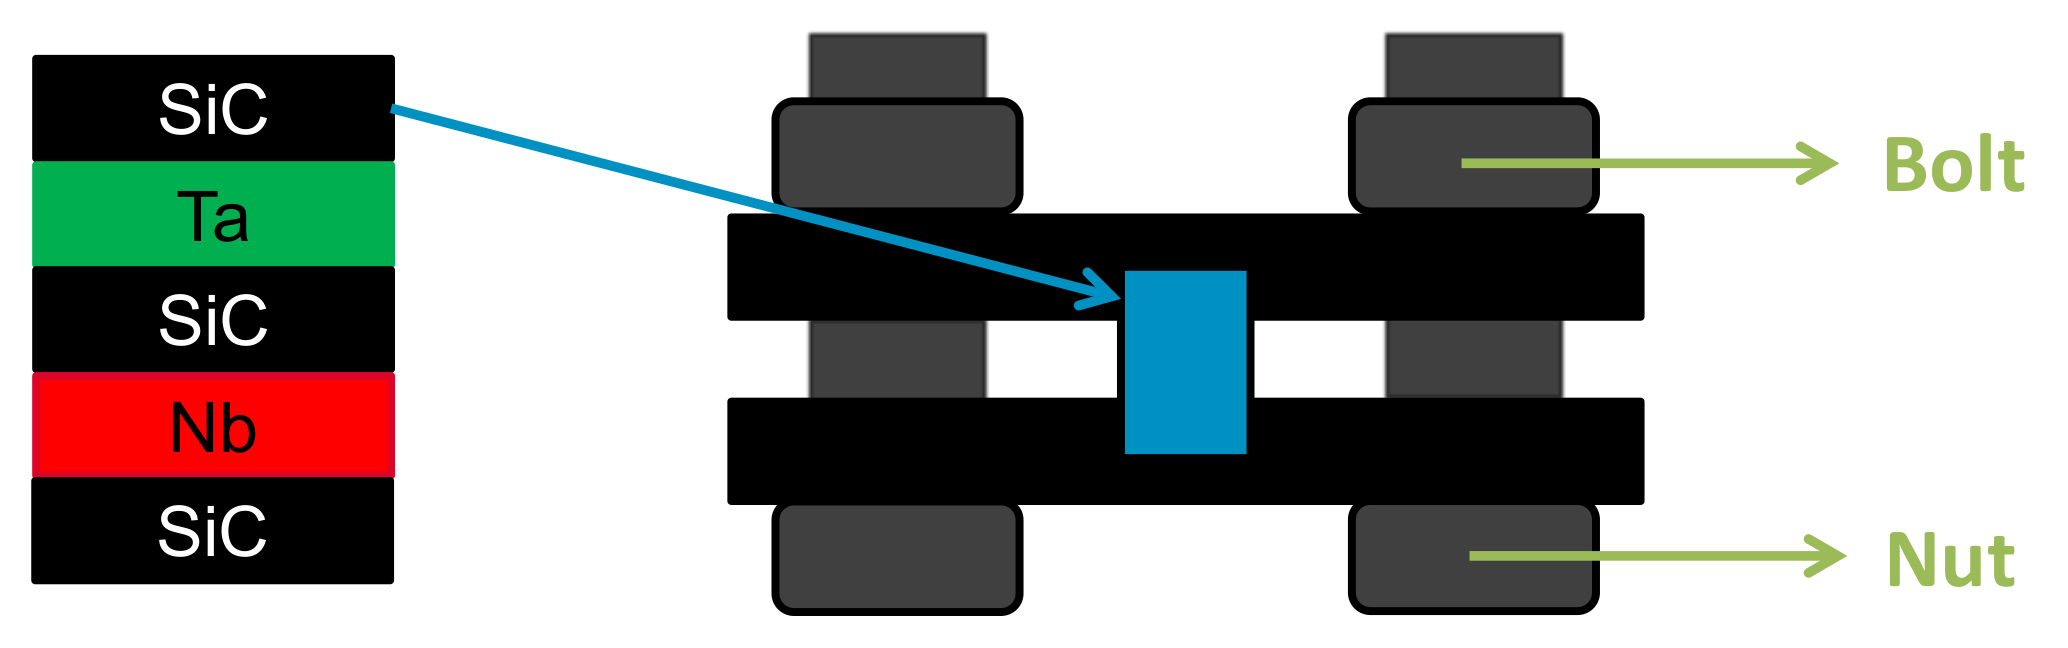
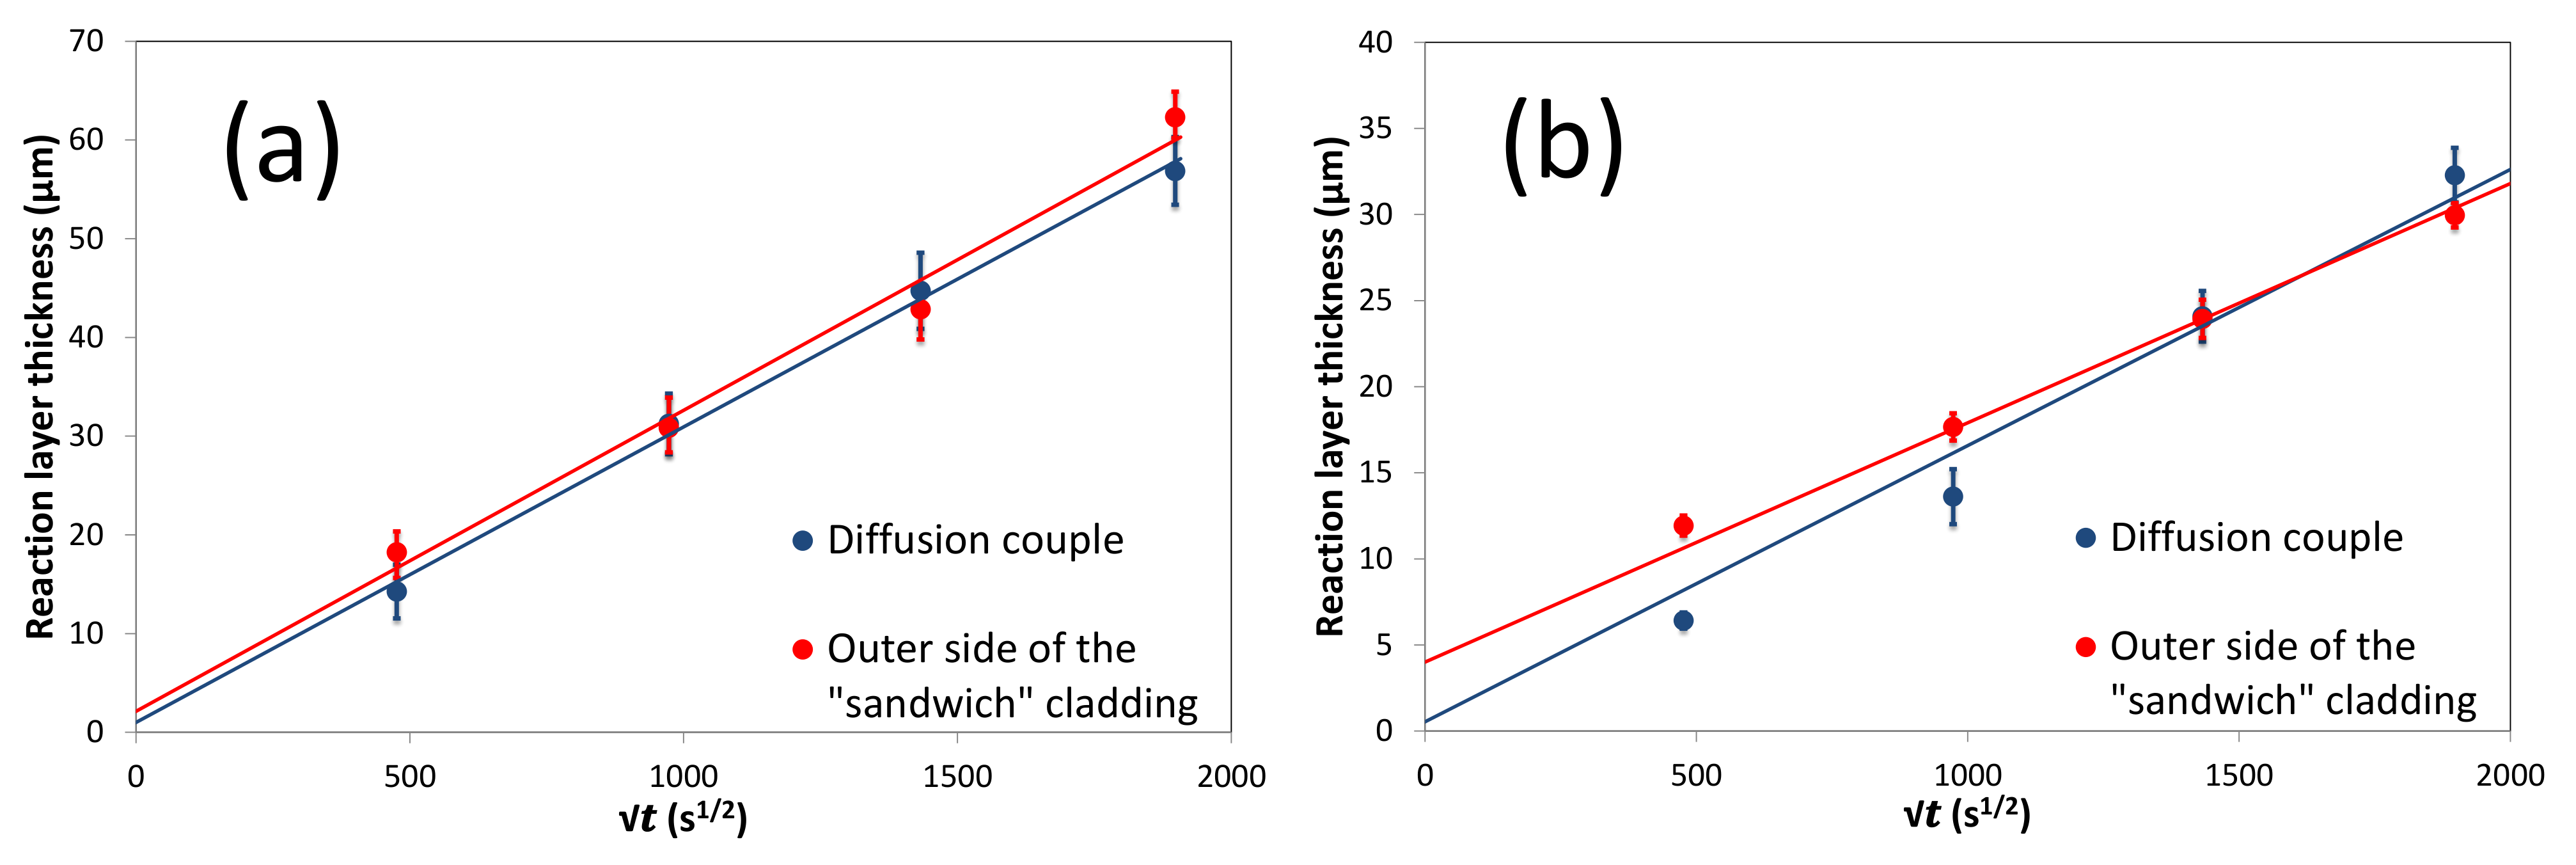
5.3. Diffusion Couple and Sandwich Geometry Comparison
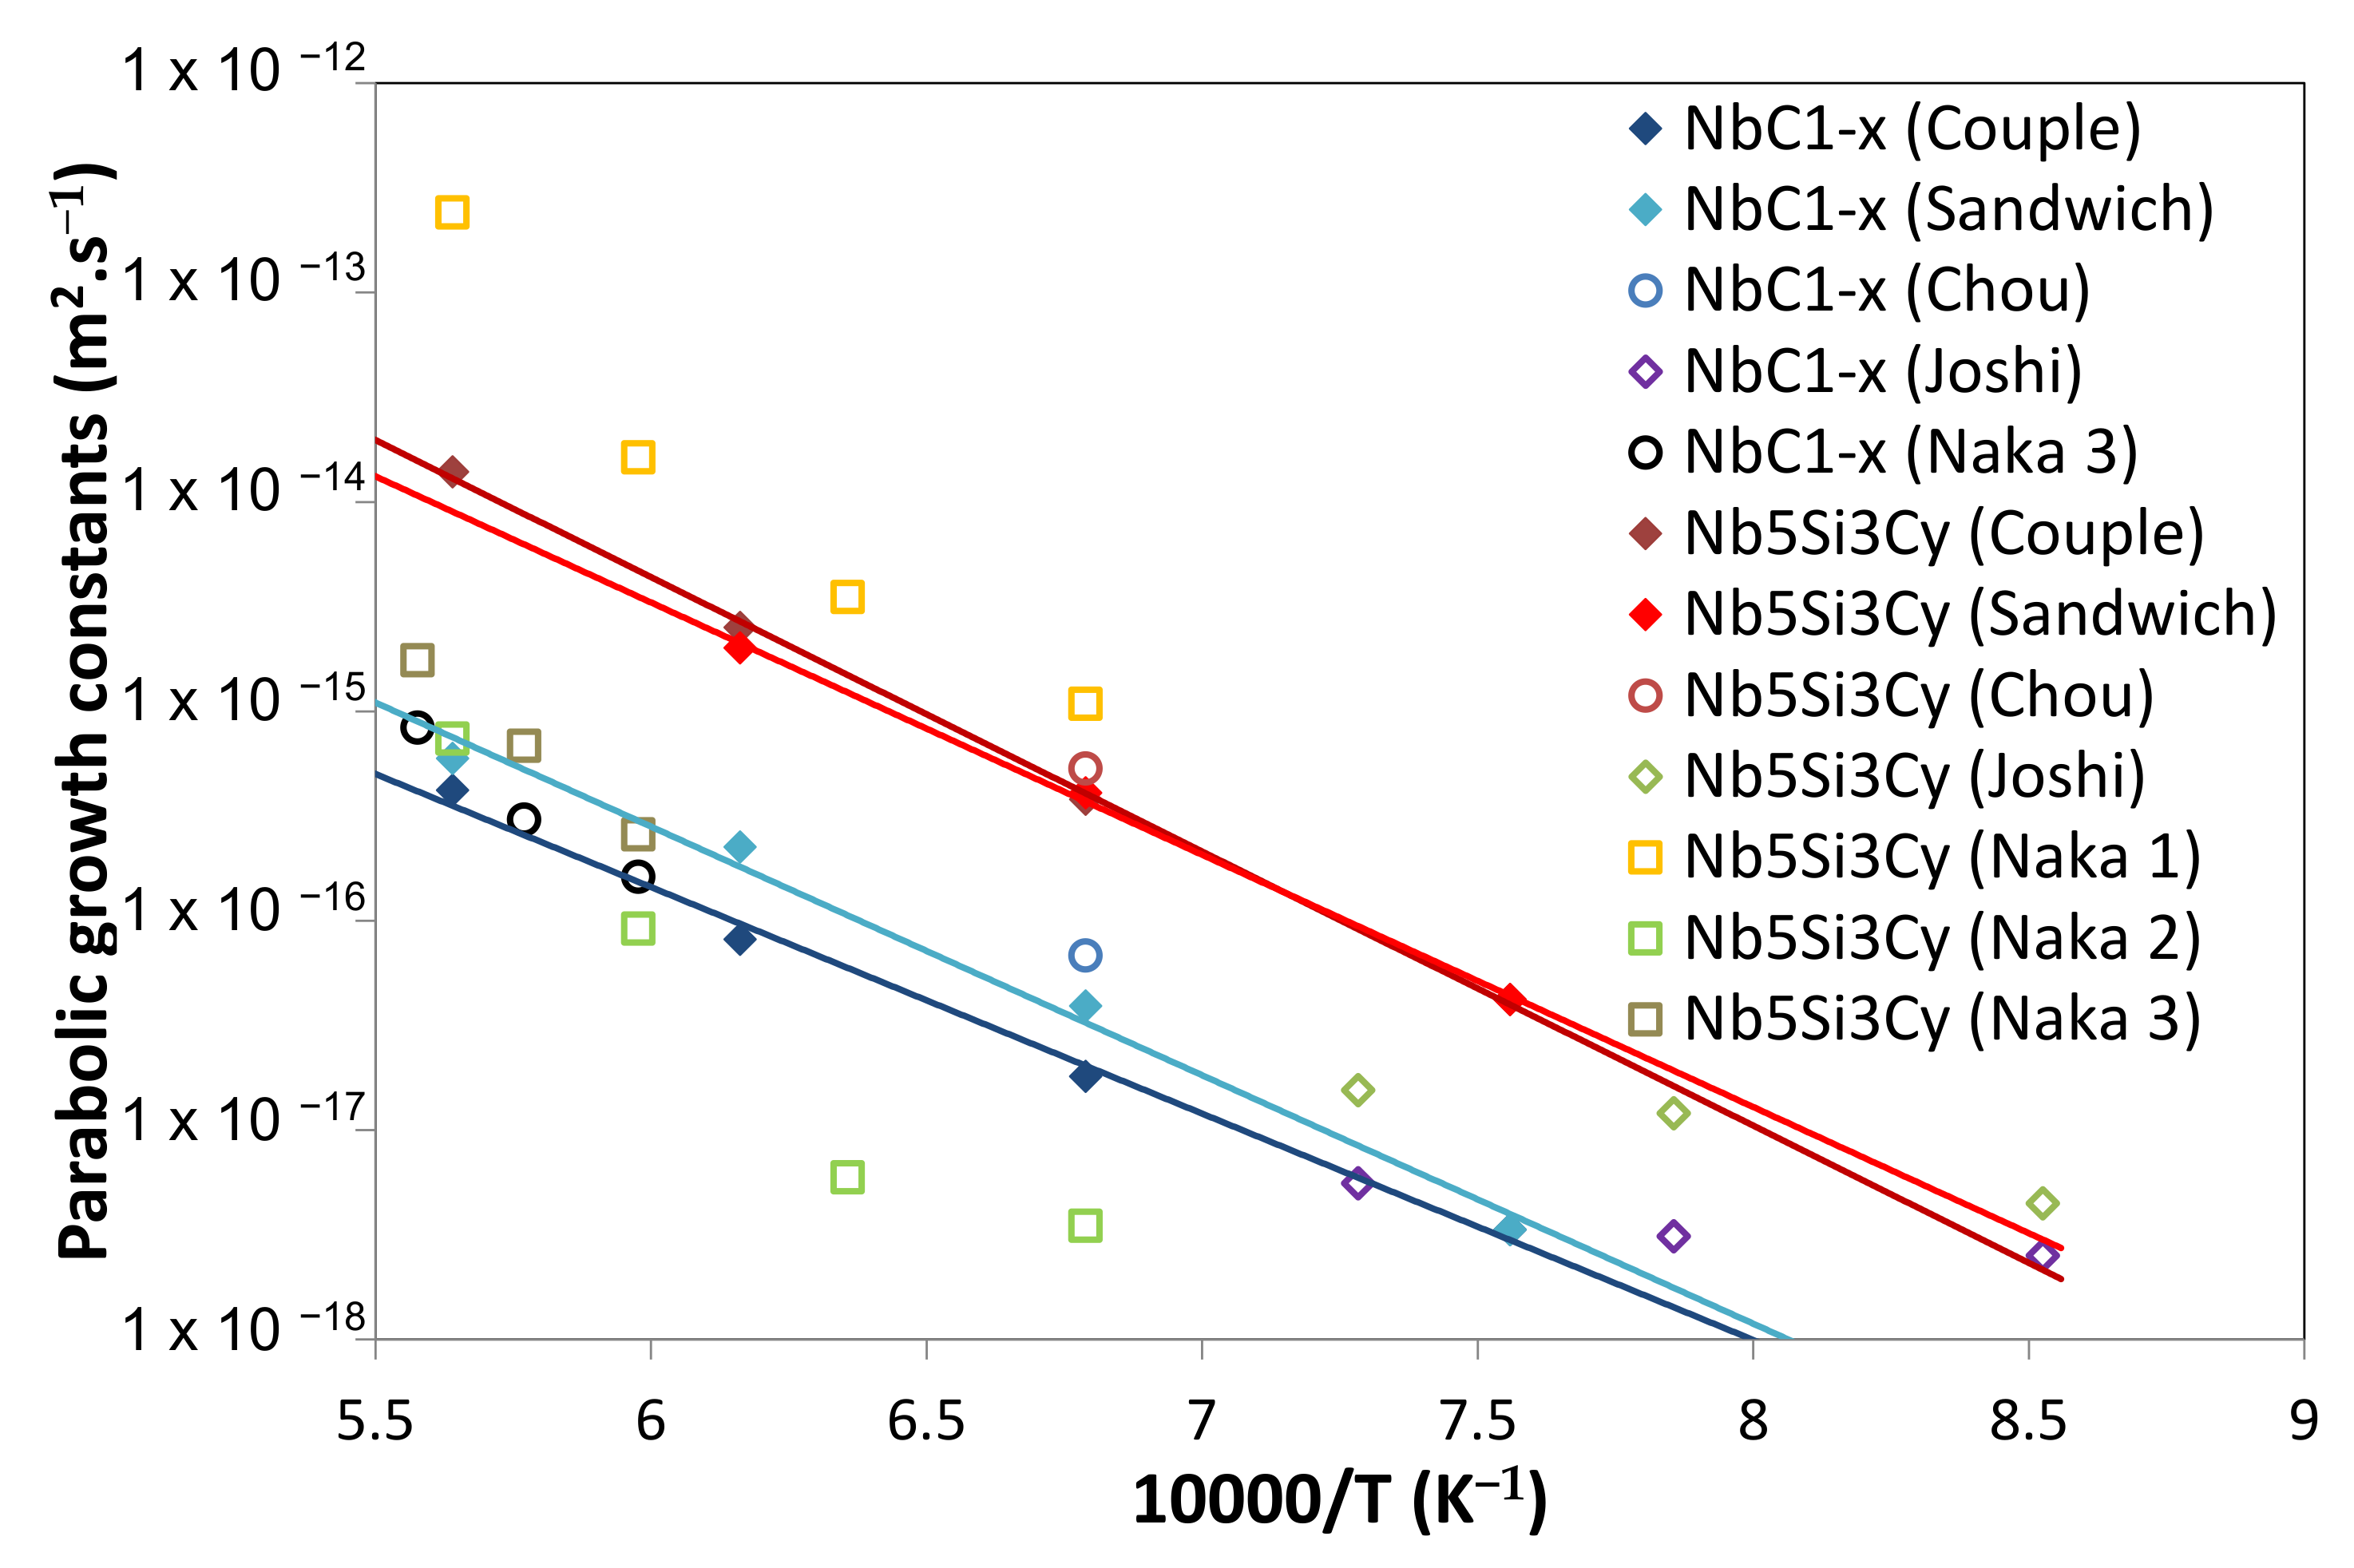
5.4. Growth Kinetics of the Reaction Layer
6. Discussion
6.1. Diffusion Paths
6.2. Diffusing Species
| Interface | ||
| NbC1−x/SiC | (7) | |
| TaC1−x/SiC | ||
| Nb5Si3Cy/NbC1−x | (8) | |
| NbC1−z/Nb5Si3Cy | (9) | |
| Nb2C/NbC1−z | (10) | |
| Nb/Nb2C | (11) | |
| Ta5Si3Cy/TaC1−x | (12) | |
| Ta5Si3/Ta5Si3Cy (1050–1350 °C) | (13) | |
| Ta2C/Ta5Si3 (1350 °C) | (14) | |
| Ta2C/Ta5Si3Cy (1500 °C) | (15) | |
| Ta2Si/Ta5Si3 (1050–1200 °C) | (16) | |
| Ta2Si/Ta2C (1350–1500 °C) | (17) | |
| Ta/Ta2Si | (18) |
6.3. Evolution of a Reactive System-Chemical Potentials Gradients through Reactive Layers
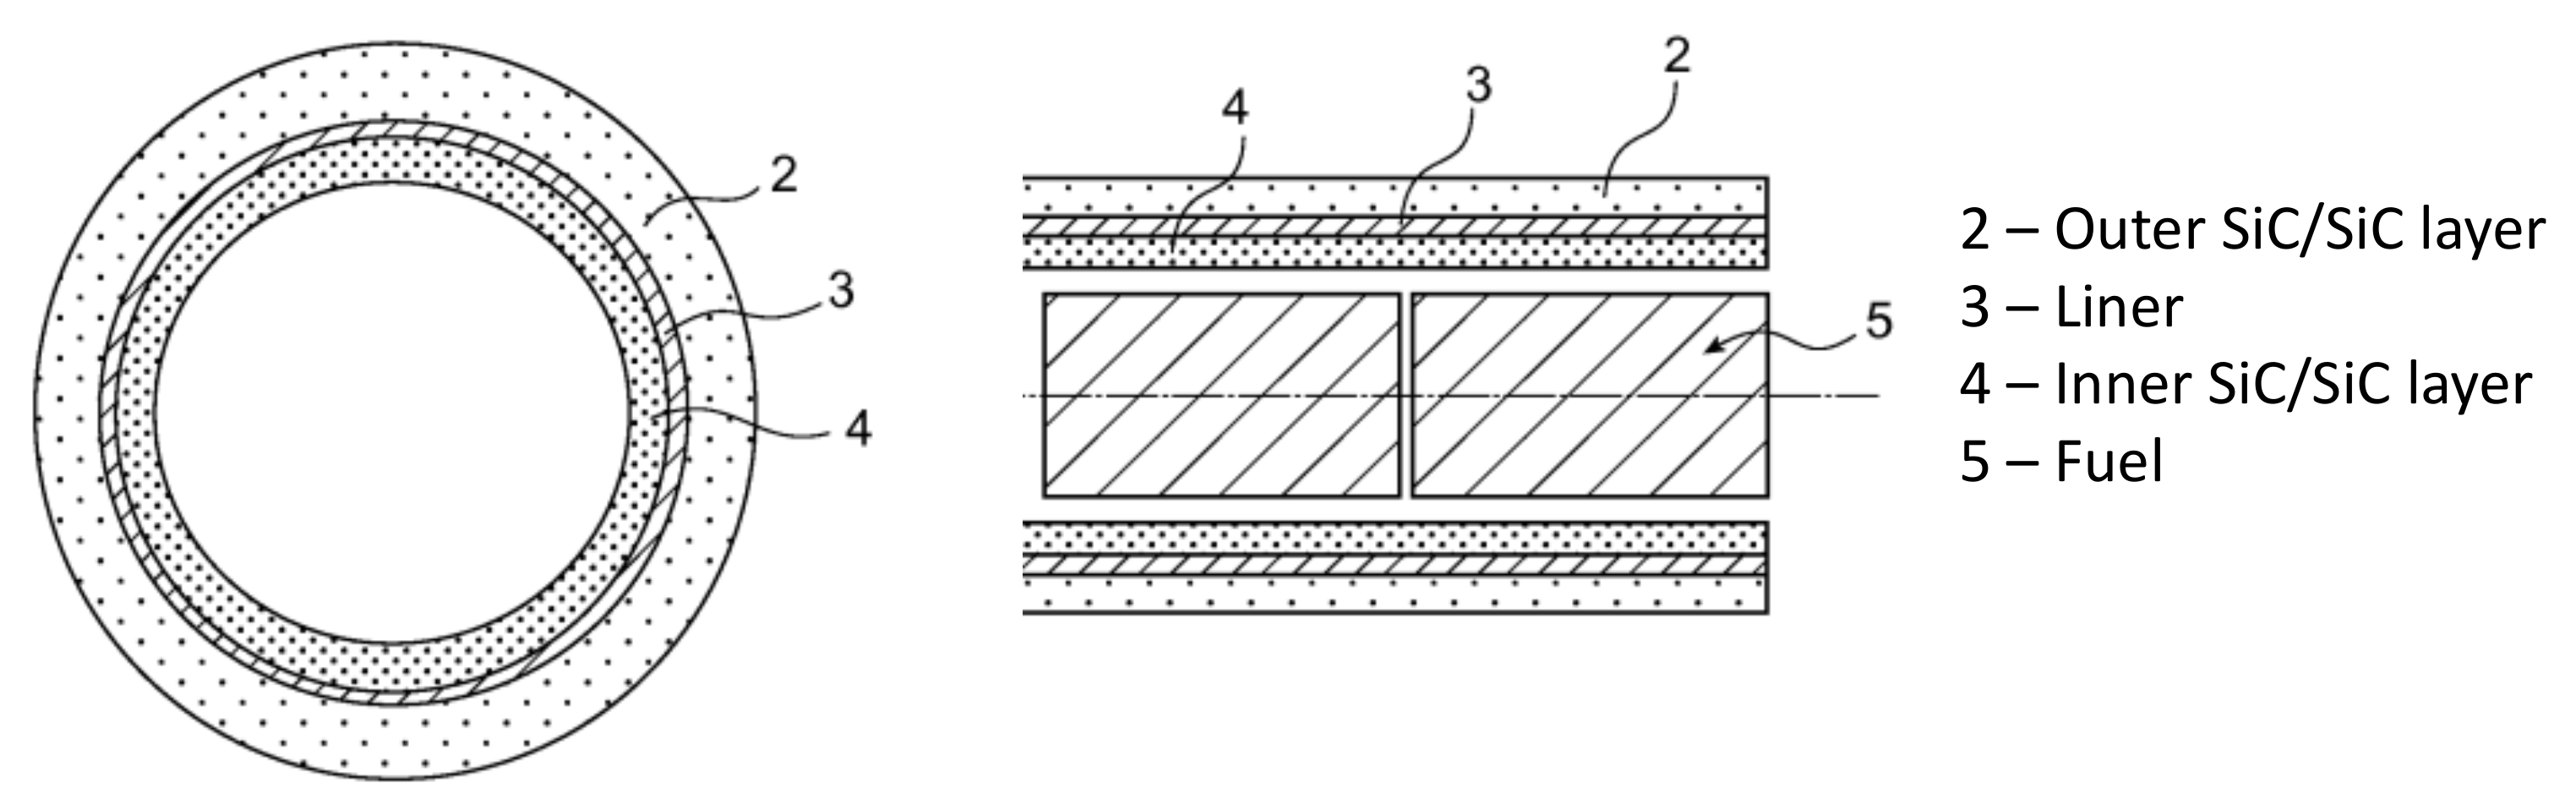
6.4. Application for GFR
7. Conclusions
Author Contributions
Funding
Institutional Review Board Statement
Informed Consent Statement
Data Availability Statement
Acknowledgments
Conflicts of Interest
References
- Bertel, E. Advanced Fuel Cycles and Radioactive Waste Management. NEA News 2006, 24, 4–6. [Google Scholar]
- Van Rooijen, W.F.G. Gas-Cooled Fast Reactor: A Historical Overview and Future Outlook. Sci. Technol. Nucl. Install. 2009, 2009, e965757. [Google Scholar] [CrossRef]
- Čížek, J.; Kalivodová, J.; Janeček, M.; Stráský, J.; Srba, O.; Macková, A. Advanced Structural Materials for Gas-Cooled Fast Reactors—A Review. Metals 2021, 11, 76. [Google Scholar] [CrossRef]
- U.S. DOE Nuclear Energy Research Advisory Committee; The Generation IV International Forum. A Technology Roadmap for Generation IV Nuclear Energy Systems. 2002. Available online: https://www.gen-4.org/gif/jcms/c_40481/technology-roadmap (accessed on 1 April 2022).
- Idaho National Laboratory. Gas-Cooled Fast Reactor Research and Development Roadmap; Idaho National Laboratory: Idaho Falls, ID, USA, 2018.
- Snead, L.L.; Nozawa, T.; Katoh, Y.; Byun, T.-S.; Kondo, S.; Petti, D.A. Handbook of SiC Properties for Fuel Performance Modeling. J. Nucl. Mater. 2007, 371, 329–377. [Google Scholar] [CrossRef]
- López-Honorato, E.; Tan, J.; Meadows, P.J.; Marsh, G.; Xiao, P. TRISO Coated Fuel Particles with Enhanced SiC Properties. J. Nucl. Mater. 2009, 392, 219–224. [Google Scholar] [CrossRef]
- Seibert, R.L.; Jolly, B.C.; Balooch, M.; Schappel, D.P.; Terrani, K.A. Production and Characterization of TRISO Fuel Particles with Multilayered SiC. J. Nucl. Mater. 2019, 515, 215–226. [Google Scholar] [CrossRef]
- Dormeval, M. Sintering and Characterization of Ceramics for GFR Applications. In Proceedings of the ICAPP05, Seoul, Korea, 15–19 May 2005. Paper 5469. [Google Scholar]
- Sauder, C. Nuclear Applications. In Ceramic Matrix Composites; Bansal, N.P., Lamon, J., Eds.; Wiley: Hoboken, NJ, USA, 2014. [Google Scholar]
- Zabiego, M.; Sauder, C.; Lorrette, C.; Guedeney, P. Improved Multilayer Tube Made from Ceramic-Matrix Composite Material, the Resulting Nuclear Fuel Cladding and Associated Production Methods. CEA Patent WO2013017621 A1, 7 February 2013. [Google Scholar]
- Weaver, K.D.; Toemeier, T.C.; Clark, D.E.; Feldman, E.E.; Hoffman, E.A.; Vilim, R.B.; Wei, T.Y.C.; Gan, J.; Meyer, M.K.; Gale, W.F.; et al. Gen IV Nuclear Energy Systems Gas-Cooled Fast Reactor (GFR) FY-04 Annual Report; Idaho National Engineering and Environmental Laboratory: Idaho Falls, ID, USA, 2004. [Google Scholar]
- Zhao, X.; Duan, L.; Wang, Y. Fast Interdiffusion and Kirkendall Effects of SiC-Coated C/SiC Composites Joined by a Ti-Nb-Ti Interlayer via Spark Plasma Sintering. J. Eur. Ceram. Soc. 2019, 39, 1757–1765. [Google Scholar] [CrossRef]
- Li, H.; Shen, W.; He, Y.; Zhong, Z.; Zheng, W.; Ma, Y.; Yang, J.; Wu, Y. Microstructural Evolution and Characterization of Interfacial Phases in Diffusion-Bonded SiC/Ta–5W/SiC Joints. Ceram. Int. 2020, 46, 22650–22660. [Google Scholar] [CrossRef]
- Camarano, A.; Narciso, J.; Giuranno, D. Solid State Reactions between SiC and Ir. J. Eur. Ceram. Soc. 2019, 39, 3959–3970. [Google Scholar] [CrossRef]
- Zhao, X.; Duan, L.; Liu, W.; Wang, Y. Fast-Diffusion Joining of SiC-Coated Three-Dimensional C/SiC Composites with a Mo-W-Mo Interlayer by Spark Plasma Sintering. Ceram. Int. 2019, 45, 23111–23118. [Google Scholar] [CrossRef]
- Smallwood, R.E. Refractory Metals and Their Industrial Applications; ASTM Special Technical Publication; ASTM International: West Conshohocken, PA, USA, 1983; Volume 849. [Google Scholar]
- HSC: Chemistry–V6.12 (Thermochemical Database); Outotec Research Oy: Pori, Finland, 2007.
- Cowgill, M.G.; Stringer, J. The Effect of Oxygen Pressure on the High Temperature Oxidation of Tantalum. J. Less Common Met. 1960, 2, 233–240. [Google Scholar] [CrossRef]
- Strafford, K.N. A Comparison of the High Temperature Nitridation and Oxidation Behaviour of Metals. Corros. Sci. 1979, 19, 49–62. [Google Scholar] [CrossRef]
- Lyon, S.B. Corrosion of tantalum and niobium and their alloys. Shreir’s Corros. 2010, 3, 2135–2150. [Google Scholar] [CrossRef]
- Reffo, G.; Fabbri, F.; Wisshak, K.; Käppeler, F. Fast Neutron Capture Cross Sections and Related Gamma-Ray Spectra of Niobium-93, Rhodium-103 and Tantalum-181. Nucl. Sci. Eng. 1982, 80, 630–647. [Google Scholar] [CrossRef]
- Brewer, L.; Krikorian, O. Reactions of Refractory Silicides with Carbon and Nitrogen. J. Electrochem. Soc. 1956, 103, 38. [Google Scholar] [CrossRef] [Green Version]
- Schlesinger, M.E.; Okamoto, H.; Gokhale, A.B.; Abbaschian, R. The Nb-Si (Niobium-Silicon) System. JPE 1993, 14, 502–509. [Google Scholar] [CrossRef]
- Burykina, A.L.; Strashinskaya, L.V.; Evtushok, T.M. Investigation of the Interaction of Silicon Carbide with Refractory Metals and Oxides. Sov. Mater. Sci. A Transl. Fiz. Khimicheskaya Mekhanika Mater. Acad. Sci. Ukr. SSR 1968, 4, 220–223. [Google Scholar] [CrossRef]
- Rahaman, M.N.; Huang, T.; Yao, A.; Bal, B.S.; Li, Y. SiC Nanoparticle-Reinforced Al2O3–Nb Composite as a Potential Femoral Head Material in Total Hip Arthroplasty. Mater. Sci. Eng. C 2010, 30, 1197–1203. [Google Scholar] [CrossRef]
- Brukl, C.E. Ternary Phase Equilibria in Transition Metal-Boron-Carbon-Silicon Systems Part II. Ternary Systems Vol VII. The Ti-Si-C, Nb-Si-C and W-Si-C Systems; Aerojet General Corporation: Sacramento, CA, USA, 1965. [Google Scholar]
- Schachner, H.; Cerwenka, E.; Nowotny, H. Neue Silizide Vom M5Si3-Typ MitD 88-Struktur. Mon. Für Chem. Und Verwandte Teile And. Wiss. 1954, 85, 245–254. [Google Scholar] [CrossRef]
- Nowotny, H.; Lux, B.; Kudielka, H. Das Verhalten metallreicher, hochschmelzender Silizide gegenüber Bor, Kohlenstoff, Stickstoff und Sauerstoff. Mon. Für Chem. 1956, 87, 447–470. [Google Scholar] [CrossRef]
- Yaney, D.L.; Joshi, A. Reaction between Niobium and Silicon Carbide at 1373 K. J. Mater. Res. 1990, 5, 2197–2208. [Google Scholar] [CrossRef]
- Chou, T.C. High Temperature Interfacial Reactions of SiC with Metals. J. Vac. Sci. Technol. A Vac. Surf. Film. 1991, 9, 1525. [Google Scholar] [CrossRef]
- Naka, M.; Feng, J.C. Phase Reactions and Interface Strength of SiC/Nb Couples. In Strength of Materials; Japan Institute of Metals: Tokyo, Japan, 1994; Volume 4, pp. 235–238. [Google Scholar]
- Schuster, J.C. Silicon Carbide and Transition Metals: A Critical Evaluation of Existing Phase Diagram Data Supplemented by New Experimental Results. Int. J. Refract. Met. Hard Mater. 1993, 12, 173–177. [Google Scholar] [CrossRef]
- Birla, N.C.; Hoch, M. The Age Hardening Characteristics of Nb-Base Alloys Containing Carbon and/or Silicon: Part I.(Nb-15 At. Pct Hf). Metall. Trans. A 1975, 6, 1631–1643. [Google Scholar] [CrossRef]
- Joshi, A.; Hu, H.S.; Jesion, L.; Stephens, J.J.; Wadsworth, J. High-Temperature Interactions of Refractory Metal Matrices with Selected Ceramic Reinforcements. Metall. Trans. A 1990, 21, 2829–2837. [Google Scholar] [CrossRef]
- Kao, C.R.; Woodford, J.; Chang, Y.A. Reactive Diffusion between Silicon and Niobium Carbide: Application to the in-Situ Synthesis of a Silicon Carbide-Niobium Disilicide Composite. In Design Fundamentals of High Temperature Composites, Intermetallics, and Metal-Ceramics Systems; Lin, R.Y., Chang, Y.A., Reddy, R.G., Liu, C.T., Eds.; Minerals, Metals and Materials Society: Warrendale, PA, USA, 1995. [Google Scholar]
- Kao, C.R.; Woodford, J.; Chang, Y.A. A Mechanism for Reactive Diffusion between Si Single Crystal and NbC Powder Compact. J. Mater. Res. 1996, 11, 850–854. [Google Scholar] [CrossRef]
- Woodford, J.; Yang, C.Y.; Chang, Y.A. The Effect of NbC Porosity on Reaction-Layer Microstructure in NbC| Si Diffusion Couples. J. Mater. Res. 2000, 15, 248–252. [Google Scholar] [CrossRef]
- Grechnev, A.; Li, S.; Ahuja, R.; Eriksson, O.; Jansson, U.; Wilhelmsson, O. Layered Compound Nb3SiC2 Predicted from First-Principles Theory. Appl. Phys. Lett. 2004, 85, 3071. [Google Scholar] [CrossRef]
- Naka, M.; Saito, T.; Okamoto, I. Niobium Silicides at Interface between Niobium and SiC. J. Mater. Sci. Lett. 1987, 6, 875–876. [Google Scholar] [CrossRef]
- Naka, M.; Saito, T. Niobium Interlayer for Joining SiC to Stainless Steel. J. Mater. Sci. Lett. 1991, 10, 339–340. [Google Scholar] [CrossRef]
- Naka, M.; Saito, T.; Okamoto, I. Effect of a Silicon Sintering Additive on Solid State Bonding of SiC to Nb. J. Mater. Sci. 1991, 26, 1983–1987. [Google Scholar] [CrossRef]
- Naka, M.; Feng, J.C. Phase Reaction and Diffusion Path of SiC/Nb System. Trans. Mater. Res. Soc. Jpn. 1993, 16B, 1143–1146. [Google Scholar]
- Naka, M. Interfacial Reactions between Silicon Base Ceramics and Metals. Mater. Sci. Res. Int. 1996, 2, 273–274. [Google Scholar] [CrossRef]
- Colin, C. High Temperature Chemical Reactivity between Sic Reinforcements and Refractories Metallics or Intermetallics Matrix. Ph.D. Thesis, Université Claude Bernard, Lyon, France, 1993. [Google Scholar]
- Jung, K.; Sutou, Y.; Koike, J. Improved Microstructure and Ohmic Contact of Nb Electrode on N-Type 4H-SiC. Thin Solid Film. 2012, 520, 6922–6928. [Google Scholar] [CrossRef]
- Kieffer, R.; Benesovsky, F.; Nowotny, H.; Schachner, H. Beitrag Zum System Tantal-Silizium. Z. Met. 1953, 44, 242–246. [Google Scholar] [CrossRef]
- Geib, K.M.; Wilson, C.; Long, R.G.; Wilmsen, C.W. Reaction between SiC and W, Mo, and Ta at Elevated Temperatures. J. Appl. Phys. 1990, 68, 2796. [Google Scholar] [CrossRef]
- Chen, J.S.; Kolawa, E.; Nicolet, M.-A.; Ruiz, R.P.; Baud, L.; Jaussaud, C.; Madar, R. Reaction of Ta Thin Film with Single Crystalline (001) β-SiC. J. Appl. Phys. 1994, 76, 2169. [Google Scholar] [CrossRef]
- Steinbrueck, M.; Angelici Avincola, V.; Markel, I.J.; Stegmaier, U.; Gerhards, U.; Seifert, H.J. Oxidation of SiCf-SiC CMC Cladding Tubes for GFR Application in Impure Helium Atmosphere and Materials Interactions with Tantalum Liner at High Temperatures up to 1600 °C. J. Nucl. Mater. 2019, 517, 337–348. [Google Scholar] [CrossRef]
- Rudy, E.; Harmon, D.P. Ternary Phase Equilibria in Transition Metal-Boron-Carbon-Silicon Systems—Part I. Related Binary Systems—Volume V. Ta-C System; Aerojet General Corporation: Sacramento, CA, USA, 1965. [Google Scholar]
- Cao, Y.; Pérez-García, S.A.; Nyborg, L. Interface Reactions and Electrical Properties of Ta/4H-SiC Contacts. Mater. Sci. Forum 2007, 556–557, 713–716. [Google Scholar] [CrossRef]
- Feng, J.C.; Naka, M.; Schuster, J.C. Phase Formation and Diffusion Path of SiC/Ta/SiC Joint. J. Mater. Sci. Lett. 1997, 16, 1116–1117. [Google Scholar] [CrossRef]
- Feng, J.C.; Naka, M.; Schuster, J.C. Interfacial Reaction and Strength of SiC/Ta/SiC Joint. J. Jpn. Inst. Met. 1997, 61, 456–461. [Google Scholar] [CrossRef] [Green Version]
- Olowolafe, J.O.; Solomon, J.S.; Mitchel, W.; Lampert, W.V. Thermal and Electrical Properties of Au/B4C, Ni/B4C, and Ta/Si Contacts to Silicon Carbide. Thin Solid Film. 2005, 479, 59–63. [Google Scholar] [CrossRef]
- Braun, J.; Sauder, C.; Lamon, J.; Balbaud-Célérier, F. Influence of an Original Manufacturing Process on the Properties and Microstructure of SiC/SiC Tubular Composites. Compos. Part A Appl. Sci. Manuf. 2019, 123, 170–179. [Google Scholar] [CrossRef]
- Raepsaet, C.; Khodja, H.; Bossis, P.; Pipon, Y.; Roudil, D. Ion Beam Analysis of Radioactive Samples. Nucl. Instrum. Methods Phys. Res. Sect. B Beam Interact. Mater. At. 2009, 267, 2245–2249. [Google Scholar] [CrossRef]
- Guéneau, C.; Dupin, N.; Sundman, B.; Martial, C.; Dumas, J.-C.; Gossé, S.; Chatain, S.; Bruycker, F.D.; Manara, D.; Konings, R.J.M. Thermodynamic Modelling of Advanced Oxide and Carbide Nuclear Fuels: Description of the U–Pu–O–C Systems. J. Nucl. Mater. 2011, 419, 145–167. [Google Scholar] [CrossRef]
- Thurnay, K. Thermal Properties of Transition Metals; Forschungszentrum Karlsruhe: Karlsruhe, Germany, 1998; p. 137. [Google Scholar]
- Hidnert, P. Thermal expansion of tantalum. Bur. Stand. J. Res. 1929, 2, 887. [Google Scholar] [CrossRef]
- Li, Z.; Bradt, R.C. Thermal Expansion of the Cubic (3C) Polytype of SiC. J. Mater. Sci. 1986, 21, 4366–4368. [Google Scholar] [CrossRef]
- Li, Q.; Jun, Y.-S. The Apparent Activation Energy and Pre-Exponential Kinetic Factor for Heterogeneous Calcium Carbonate Nucleation on Quartz. Commun. Chem. 2018, 1, 56. [Google Scholar] [CrossRef] [Green Version]
- Van Loo, F.J.J. Multiphase Diffusion in Binary and Ternary Solid-State Systems. Prog. Solid State Chem. 1990, 20, 47–99. [Google Scholar] [CrossRef] [Green Version]
- Barzilai, S.; Raveh, A.; Frage, N. Inter-Diffusion of Carbon into Niobium Coatings Deposited on Graphite. Thin Solid Film. 2006, 496, 450–456. [Google Scholar] [CrossRef]
- Barzilai, S.; Frage, N.; Raveh, A. Niobium Layers on Graphite: Growth Parameters and Thermal Annealing Effects. Surf. Coat. Technol. 2006, 200, 4646–4653. [Google Scholar] [CrossRef]
- Brizes, W.F. Diffusion of Carbon in the Carbides of Tantalum. J. Nucl. Mater. 1968, 26, 227–231. [Google Scholar] [CrossRef]
- Prasad, S.; Paul, A. Growth Mechanism of Phases by Interdiffusion and Diffusion of Species in the Niobium–Silicon System. Acta Mater. 2011, 59, 1577–1585. [Google Scholar] [CrossRef]
- Roy, S.; Paul, A. Growth Mechanism of Tantalum Silicides by Interdiffusion. Philos. Mag. 2012, 92, 4215–4229. [Google Scholar] [CrossRef]
- Philibert, J. Reactive Diffusion. Defect Diffus. Forum 1991, 66–69, 995–1014. [Google Scholar] [CrossRef]
- Ingremeau, J.-J. Optimization Method Development of the Core Characteristics of a Fast Reactor in Order to Explore Possible High Performance Solutions (a Solution Being a Consistent Set of Fuel, Core, System and Safety). Ph.D. Thesis, Université Paris Sud-Paris XI, Bures-sur-Yvette, France, 2011. [Google Scholar]


| T(°C) | Duration (h) | System | Formed Phases | Reference |
|---|---|---|---|---|
| 1827 | 0.25 to 1 | Si + Ta powders (35 to 105 µm) | Ta4.5Si, Ta2Si, Ta5Si3 | Brewer [23] |
| Si + C + Ta powders (35 to 105 µm) | Ta4.8Si3C0.5, Ta5Si3, Ta4.5Si, Ta2Si | |||
| 1200 to 2000 | - | SiC powder compacted on dense Ta | TaC, T5Si3, Ta2Si | Burikyna [25] |
| 1100 | 4 | SiC single crystal + Ta (1 µm) sputtered | TaCx + TaCxSiy | Joshi [35] |
| 1200 | TaCxSiy | |||
| 400 | 0.5 | 10 µm β-SiC single crystal + Ta (30 nm) sputtered | Ta + TaCx | Geib [48] |
| 800 | Ta + TaCx + TaSix | |||
| 900 | 1 | 5 µm β-SiC single crystal + Ta (320 nm) sputtered | Ta + Ta2C + Ta5Si3Cx | Chen [49] |
| 1000 | TaC + Ta5Si3Cx + α-Ta5Si3 + Ta2C | |||
| 1100 | TaC + Ta5Si3Cx | |||
| 1200 | TaC + TaSi2 | |||
| 650 | 0.5 | 4H-SiC N-doped substrates + Ta (100 nm) sputtered | Ta | Cao [52] |
| 800 | Ta + Ta2C | |||
| 950 | Ta + Ta2C + Ta5Si3Cx | |||
| 1500 | 2 | SiC/Ta/SiC couples with SiC 4 mm and Ta (7.5 µm) | SiC/Ta5Si3Cx/Ta2C/Ta | Feng [53] |
| 30 | SiC + TaSi2 + TaC | |||
| 650 | - | 4H- and 6H-SiC wafers + Ta (150 nm) sputtered | TaC/Si/SiC | Olowolafe [55] |
| T (°C) | 1050 | 1200 | 1350 | 1500 |
|---|---|---|---|---|
| Atmosphere | Vacuum | Vacuum | Argon | Argon |
| Duration (h) | 63, 250, 570, 1000 | 63, 250, 570, 1000 | 6.25, 24, 48, 100 | 3, 12, 27, 48 |
| Phase | Average Thickness (µm) | EPMA Measurements (at.%) | Ion Beam Analyses (at.%) |
|---|---|---|---|
| NbC1−x | 9.2 ± 0.8 | Nb: 57.7 | Nb: 51.0 |
| C: 42.0 | C: 48.0 | ||
| Nb5Si3Cy | 38.2 ± 0.8 | Nb: 59.0 | Nb: 56.5 |
| Si: 33.7 | Si: 34 | ||
| C: 7.3 | C: 9.5 | ||
| Nb1−z | 2.3 ± 1.6 | Nb: 61.2 | - |
| C: 38.6 | |||
| Nb2C | 8.5 ± 3.1 | Nb: 69.5 | Nb: 77.0 |
| C: 30.4 | C:22.2 | ||
| TaC1−x | 9.9 ± 0.6 | Ta: 56.0 | Ta: 53.3 |
| C: 45.2 | C: 46.7 | ||
| Ta5Si3Cy | 10.4 ± 0.7 | Ta: 58.5 | Ta: 56.9 |
| Si: 34.1 | Si: 33.0 | ||
| C: 7.4 | C: 10.1 | ||
| Ta5Si3 | 3.4 ± 0.4 | Ta: 63.4 | - |
| Si: 36.6 | |||
| Ta2Si | 6.0 ± 0.8 | Si: 67.5 | - |
| Si: 32.5 |
| Temperature (°C) | Diffusion Path in the Ta/SiC System | Diffusion Path in the Nb/SiC System |
|---|---|---|
| 1050 | SiC/TaC1−x/Ta5Si3Cx/Ta5Si3/Ta2Si/ (Ta2C)precipitates + Ta | SiC/NbC1−x/Nb5Si3Cy/NbC1−z/Nb2C/Nb |
| 1200 | ||
| 1350 | SiC/TaC1−x/Ta5Si3Cx/Ta5Si3 /Ta2C/Ta2Si/Ta | |
| 1500 | SiC/TaC1−x/Ta5Si3Cx/Ta2C/Ta2Si/Ta |
| System | Nb/SiC | Ta/SiC | ||||||
|---|---|---|---|---|---|---|---|---|
| Phases | NbC1−x | Nb5Si3Cy | NbC | RL | TaC1−x | Ta5Si3Cy | TSC | RL |
| Diff. Couple | 207 | 251 | 305 | 259 | 200 | 204 | 194 | 196 |
| Sandwich | 227 | 231 | 324 | 237 | 226 | 170 | 236 | 218 |
(kJ/mol) | NbC1−x | Nb5Si3Cy | NbC1−z | Nb2C |
|---|---|---|---|---|
| C | 25.9 | 48.2 | 21.0 | 44.0 |
| Si | 12.2 | 53.0 | 26.5 | 36.0 |
| Nb | 23.9 | 41.5 | 15.9 | 21.7 |
| Duration | 600 °C | 700 °C | 800 °C | 900 °C | 950 °C | 1000 °C | |
|---|---|---|---|---|---|---|---|
| Nb | 3 years | 0.4 | 2.2 | 9 | 26 | 43 | 69 |
| 4 years | 0.5 | 2.5 | 10 | 30 | 50 | 80 | |
| Ta | 3 years | 0.4 | 1.8 | 6 | 18 | 28 | 42 |
| 4 years | 0.4 | 2.0 | 7 | 20 | 32 | 49 |
Publisher’s Note: MDPI stays neutral with regard to jurisdictional claims in published maps and institutional affiliations. |
© 2022 by the authors. Licensee MDPI, Basel, Switzerland. This article is an open access article distributed under the terms and conditions of the Creative Commons Attribution (CC BY) license (https://creativecommons.org/licenses/by/4.0/).
Share and Cite
Braun, J.; Sauder, C.; Guéneau, C.; Hodaj, F.; Balbaud-Célérier, F. High-Temperature Interdiffusion of Tantalum and Niobium with SiC for Processing Hybrid Metal/CMC Components. Coatings 2022, 12, 887. https://doi.org/10.3390/coatings12070887
Braun J, Sauder C, Guéneau C, Hodaj F, Balbaud-Célérier F. High-Temperature Interdiffusion of Tantalum and Niobium with SiC for Processing Hybrid Metal/CMC Components. Coatings. 2022; 12(7):887. https://doi.org/10.3390/coatings12070887
Chicago/Turabian StyleBraun, James, Cédric Sauder, Christine Guéneau, Fiqiri Hodaj, and Fanny Balbaud-Célérier. 2022. "High-Temperature Interdiffusion of Tantalum and Niobium with SiC for Processing Hybrid Metal/CMC Components" Coatings 12, no. 7: 887. https://doi.org/10.3390/coatings12070887