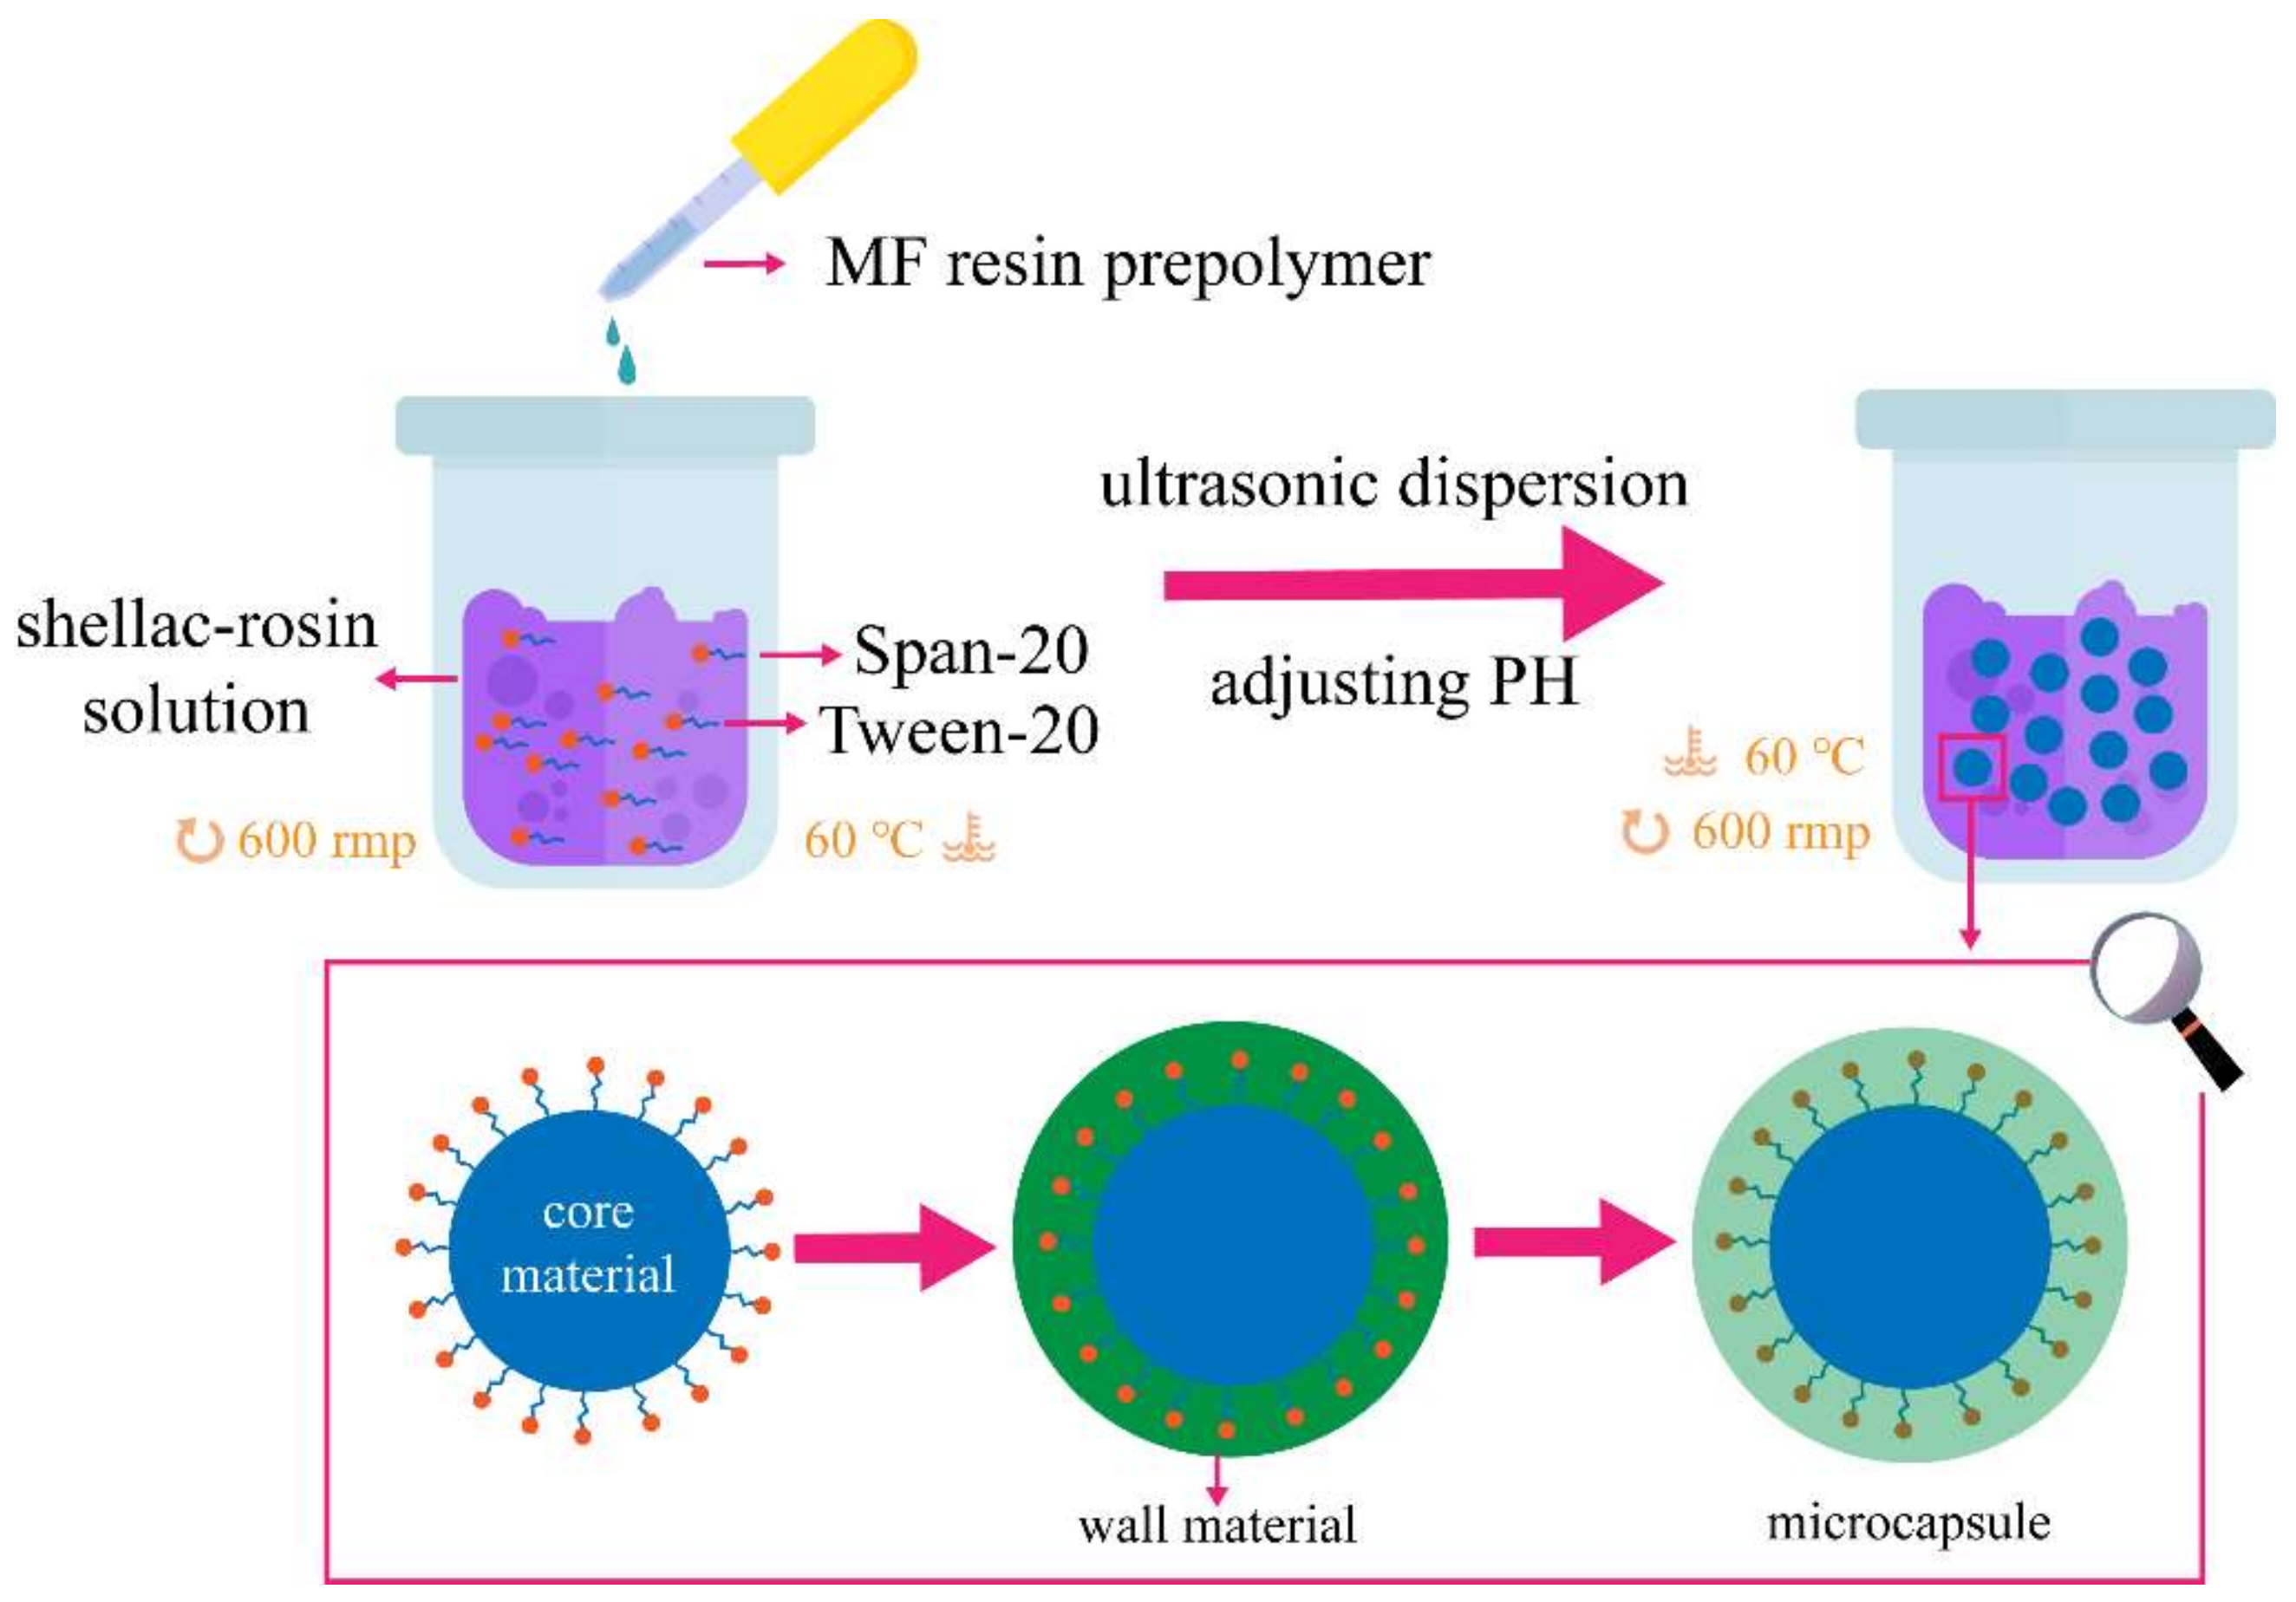
Figure 1.
The overall schematic diagram of the change in the built emulsion system during the reaction.
Figure 1.
The overall schematic diagram of the change in the built emulsion system during the reaction.
Figure 2.
OM image (A), SEM image (B), and particle size distribution (C) of transparent shellac microcapsules.
Figure 2.
OM image (A), SEM image (B), and particle size distribution (C) of transparent shellac microcapsules.
Figure 3.
FTIR image of transparent shellac microcapsules.
Figure 3.
FTIR image of transparent shellac microcapsules.
Figure 4.
Results of width change of the surface coating on the ebony after scratch: (A) sample 1 before repair, (B) sample 2 before repair, (C) sample 3 before repair, (D) sample 4 before repair, (E) sample # after repair, (F) sample 2 after repair, (G) sample 3 after repair, (H) sample 4 after repair.
Figure 5.
Photographs of ebony boards: (A) impregnation 0 times, before coating, (B) impregnation 0 times, after coating, (C) impregnation 3 times, after coating, (D) impregnation eight times, after coating, and (E) impregnation 15 times, after coating.
Figure 5.
Photographs of ebony boards: (A) impregnation 0 times, before coating, (B) impregnation 0 times, after coating, (C) impregnation 3 times, after coating, (D) impregnation eight times, after coating, and (E) impregnation 15 times, after coating.
Figure 6.
SEM images of the end face of the ebony: (A) impregnation 1 time, (B) impregnation 3 times, (C) impregnation 8 times, and (D) impregnation 15 times.
Figure 6.
SEM images of the end face of the ebony: (A) impregnation 1 time, (B) impregnation 3 times, (C) impregnation 8 times, and (D) impregnation 15 times.
Figure 7.
FTIR of the end face of the ebony.
Figure 7.
FTIR of the end face of the ebony.
Figure 8.
SEM images of coatings on the ebony before and after aging under different deposition times: (A) impregnation 0 times before repair, (B) impregnation 3 times before repair, (C) impregnation 5 times before repair, (D) impregnation 15 times before repair, (E) impregnation 0 times after repair, (F) impregnation 3 times after repair, (G) impregnation 5 times after repair, and (H) impregnation 15 times after repair.
Figure 9.
FTIR of the surface coating on impregnated ebony before and after aging.
Figure 9.
FTIR of the surface coating on impregnated ebony before and after aging.
Figure 10.
The light loss rate of the surface coating on the ebony under different numbers of impregnations before and after aging.
Figure 10.
The light loss rate of the surface coating on the ebony under different numbers of impregnations before and after aging.
Figure 11.
OM of the surface coating on the ebony under different numbers of impregnations before and after aging: (A) impregnation 0 times before repair, (B) impregnation 3 times before repair, (C) impregnation 5 times before repair, (D) impregnation 15 times before repair, (E) impregnation 0 times after repair, (F) impregnation 3 times after repair, (G) impregnation 5 times after repair, and (H) impregnation 15 times after repair.
Figure 12.
Changes in the scratch width of the surface coating on the ebony under different numbers of impregnations after aging.
Figure 12.
Changes in the scratch width of the surface coating on the ebony under different numbers of impregnations after aging.
Table 1.
Orthogonal test factors and levels.
Table 1.
Orthogonal test factors and levels.
| Level | Impregnation Times (Time) | Microcapsule Content in the Coating (%) | Film Thickness (μm) |
|---|
| 1 | 3 | 0 | 10 |
| 2 | 15 | 3 | 20 |
Table 2.
Orthogonal test schedule.
Table 2.
Orthogonal test schedule.
| Sample (#) | Number of Impregnations (Impregnations) | Microcapsule Content in the Coating (%) | Film Thickness (μm) |
|---|
| 1 | 3 | 0 | 10 |
| 2 | 3 | 3 | 20 |
| 3 | 15 | 0 | 20 |
| 4 | 15 | 3 | 10 |
Table 3.
Scratch width change rate results.
Table 3.
Scratch width change rate results.
| Sample (#) | Instant Scratch Width (μm) | Scratch Width after Repair for 5 d (μm) | Scratch Width Change Rate (%) |
|---|
| 1 | 22.74 | 25.69 | 11.48 |
| 2 | 30.99 | 26.47 | 14.59 |
| 3 | 31.65 | 24.99 | 21.04 |
| 4 | 22.87 | 17.59 | 23.09 |
Table 4.
Range and variance analysis of scratch width change rate.
Table 4.
Range and variance analysis of scratch width change rate.
| Range and Variance | Sample (#) | Number of Impregnations (Impregnations) | Microcapsule Content in the Coating (%) | Film Thickness (μm) | Scratch Width Change Rate (%) |
|---|
| Range | 1 | 3 | 0 | 10 | 11.48 |
| 2 | 3 | 3.0 | 20 | 14.59 |
| 3 | 15 | 0 | 20 | 21.04 |
| 4 | 15 | 3.0 | 10 | 23.09 |
| Mean 1 | 13.035 | 16.260 | 17.285 | - |
| Mean 2 | 22.065 | 18.840 | 17.815 | - |
| R | 9.030 | 2.580 | 0.530 | - |
| Variance | Error Square Sum | 81.541 | 6.656 | 0.281 | - |
| Degree of Freedom (df) | 1 | 1 | 1 | - |
| Fratio | 290.181 | 23.687 | 1.000 | - |
| Fcritical value | 161.000 | 161.000 | 161.000 | - |
| Significance | * | - | - | - |
Table 5.
Single-factor experiment schedule.
Table 5.
Single-factor experiment schedule.
| Sample (#) | Number of Impregnations (Impregnations) | Microcapsules Content (%) | Film Thickness (μm) |
|---|
| 5 | 0 | 3.0 | 10 |
| 6 | 3 | 3.0 | 10 |
| 7 | 8 | 3.0 | 10 |
| 8 | 15 | 3.0 | 10 |
Table 6.
FTIR characteristic peak of end faces for sample 7, sample 5, and the blank sample.
Table 6.
FTIR characteristic peak of end faces for sample 7, sample 5, and the blank sample.
| Wavenumber (cm−1) | Bond | Substance |
|---|
| 3340 | –OH | ebony cell |
| 1695 | C=O | Shellac |
| 2900 | –CH3 | Shellac |
| 1725 | –COOH | Shellac |
| 1650 | C=N | MF resin |
| 1558 | N–H | MF resin |
| 1380 | C–N | MF resin |
| 1151 | C–O–C | MF resin |
| 1001 | C–H | MF resin |
| 813 | Triazine ring | MF resin |
Table 7.
Mechanical properties of coatings on the ebony under different numbers of impregnations.
Table 7.
Mechanical properties of coatings on the ebony under different numbers of impregnations.
| Number of Impregnations (Impregnations) | Hardness | Adhesion (Grade) | Impact Strength (kg·cm) | Roughness (μm) |
|---|
| 0 | H | 2 | 8 | 1.31 |
| 3 | H | 2 | 8 | 1.39 |
| 8 | H | 3 | 9 | 0.88 |
| 15 | H | 3 | 9 | 1.53 |
Table 8.
Chromatic difference values of coatings on the ebony under different numbers of impregnations.
Table 8.
Chromatic difference values of coatings on the ebony under different numbers of impregnations.
| Number of Impregnations (Impregnations) | ΔL* | Δa* | Δb* | ΔE* |
|---|
| 0 | 51.15 | 13.48 | 23.83 | - |
| 3 | 51.18 | 14.35 | 29.38 | 5.62 |
| 8 | 58.35 | 12.08 | 23.53 | 7.34 |
| 15 | 60.88 | 11.88 | 24.33 | 9.87 |
Table 9.
Gloss values of coatings on ebony under different numbers of impregnations.
Table 9.
Gloss values of coatings on ebony under different numbers of impregnations.
| Number of Impregnations (Impregnatnions) | Gloss (%) |
|---|
| 20° | 60° | 85° |
|---|
| 0 | 11.7 | 47.0 | 44.3 |
| 3 | 7.9 | 30.7 | 32.4 |
| 8 | 9.2 | 31.9 | 31.8 |
| 15 | 4.6 | 20.9 | 23.8 |
Table 10.
FTIR characteristic peaks of the surface coating on impregnated ebony before and after aging.
Table 10.
FTIR characteristic peaks of the surface coating on impregnated ebony before and after aging.
| Wavenumber (cm−1) | Bond | Substance |
|---|
| 2952 | –CH3 | Shellac |
| 1728 | –COOH | Shellac |
| 1540 | N–H | MF resin |
| 1384 | C–N | MF resin |
| 1141 | C–O–C | MF resin |
| 1020 | C–H | MF resin |
| 817 | Triazine ring | MF resin |
Table 11.
Mechanical properties of the surface coating on the ebony under different numbers of impregnations before and after aging.
Table 11.
Mechanical properties of the surface coating on the ebony under different numbers of impregnations before and after aging.
| Number of Impregnations (Impregnations) | Aging Time (h) | Hardness | Adhesion (Grade) | Impact Strength (kg·cm) | Roughness (μm) |
|---|
| 0 | 0 | H | 2 | 8 | 1.31 |
| 36 | 2H | 3 | 6 | 0.98 |
| 3 | 0 | H | 2 | 8 | 1.39 |
| 36 | H | 3 | 7 | 1.14 |
| 8 | 0 | H | 3 | 9 | 0.88 |
| 36 | 2H | 4 | 9 | 0.96 |
| 15 | 0 | H | 3 | 9 | 1.53 |
| 36 | H | 4 | 8 | 2.11 |
Table 12.
Chromatic difference of the surface coating on the ebony under different numbers of impregnations before and after aging.
Table 12.
Chromatic difference of the surface coating on the ebony under different numbers of impregnations before and after aging.
| Number of Impregnations (Impregnations) | Aging Time (h) | ΔL* | Δa* | Δb* | ΔE* |
|---|
| 0 | 0 | 51.15 | 13.48 | 23.83 | - |
| 6 | 52.93 | 12.70 | 25.28 | 2.42 |
| 12 | 52.45 | 11.47 | 27.50 | 4.40 |
| 18 | 51.40 | 11.85 | 28.20 | 4.67 |
| 24 | 53.83 | 11.65 | 32.55 | 9.31 |
| 30 | 52.40 | 10.38 | 33.03 | 9.79 |
| 36 | 53.45 | 10.55 | 33.58 | 10.44 |
| 3 | 0 | 53.18 | 14.35 | 29.38 | - |
| 6 | 52.00 | 9.65 | 28.33 | 4.96 |
| 12 | 51.45 | 9.73 | 25.85 | 6.07 |
| 18 | 51.95 | 9.33 | 26.05 | 6.15 |
| 24 | 49.25 | 9.40 | 26.73 | 6.85 |
| 30 | 52.35 | 7.68 | 25.83 | 7.61 |
| 36 | 53.30 | 9.60 | 21.73 | 9.01 |
| 8 | 0 | 58.35 | 12.08 | 23.53 | - |
| 6 | 61.00 | 8.40 | 25.90 | 5.12 |
| 12 | 58.43 | 8.20 | 27.90 | 5.84 |
| 18 | 59.23 | 9.35 | 28.88 | 6.08 |
| 24 | 59.93 | 8.58 | 28.75 | 6.48 |
| 30 | 58.40 | 7.85 | 29.70 | 7.48 |
| 36 | 58.75 | 10.90 | 32.40 | 8.96 |
| 15 | 0 | 60.88 | 11.88 | 24.33 | - |
| 6 | 59.80 | 6.85 | 27.05 | 5.89 |
| 12 | 62.10 | 6.45 | 26.28 | 5.82 |
| 18 | 60.63 | 6.85 | 29.40 | 7.15 |
| 24 | 61.23 | 5.23 | 28.35 | 7.78 |
| 30 | 60.15 | 8.15 | 31.38 | 8.01 |
| 36 | 62.30 | 6.43 | 31.33 | 8.99 |
Table 13.
The gloss of the surface coating on the ebony under different numbers of impregnations before and after aging.
Table 13.
The gloss of the surface coating on the ebony under different numbers of impregnations before and after aging.
| Number of Impregnations (Impregnations) | Aging Time (h) | Gloss (%) |
|---|
| 20° | 60° | 85° |
|---|
| 0 | 0 | 11.70 | 46.98 | 44.25 |
| 6 | 10.03 | 36.55 | 34.63 |
| 12 | 10.23 | 36.18 | 32.03 |
| 18 | 10.23 | 35.73 | 33.45 |
| 24 | 9.48 | 35.48 | 31.98 |
| 30 | 8.38 | 34.98 | 34.10 |
| 36 | 9.68 | 33.43 | 34.68 |
| 3 | 0 | 7.88 | 30.65 | 32.35 |
| 6 | 3.65 | 14.05 | 8.98 |
| 12 | 4.00 | 13.90 | 8.33 |
| 18 | 3.75 | 13.78 | 7.23 |
| 24 | 3.38 | 13.65 | 7.40 |
| 30 | 2.93 | 13.55 | 8.40 |
| 36 | 3.28 | 12.90 | 6.18 |
| 8 | 0 | 9.15 | 31.93 | 31.78 |
| 6 | 4.63 | 16.70 | 15.65 |
| 12 | 3.90 | 16.63 | 13.75 |
| 18 | 4.20 | 15.80 | 14.95 |
| 24 | 3.75 | 15.68 | 13.35 |
| 30 | 3.88 | 15.13 | 12.90 |
| 36 | 4.35 | 14.88 | 13.93 |
| 15 | 0 | 4.55 | 20.85 | 23.80 |
| 6 | 3.48 | 13.45 | 10.88 |
| 12 | 3.48 | 13.40 | 9.40 |
| 18 | 3.60 | 13.20 | 10.93 |
| 24 | 3.23 | 12.80 | 8.48 |
| 30 | 3.15 | 12.55 | 8.55 |
| 36 | 3.35 | 12.30 | 8.63 |


