Abstract
The quantum yield and fluorescence properties of carbon dots are key issues for environmental detection. In this study, nitrogen–sulfur-doped carbon dots (N,S-CDs) were prepared hydrothermally by adding thiourea to provide the N source. By adjusting the ratio of citric acid (CA) to thiourea (N,S) and adding anhydrous ethanol, blue fluorescent doped carbon dots with a quantum yield of up to 53.80% were obtained. The particle morphology and crystalline organization of the N,S-CDs were analyzed using transmission electron microscopy (TEM) and X-ray diffraction (XRD). Fourier transform infrared (FTIR) spectroscopy was used to illuminate distinct functional units through the recording of typical vibration bands. The luminescence properties of the N,S-CDs were investigated using ultraviolet–visible (UV-vis) absorption spectroscopy and steady-state fluorescence spectroscopy (PL). In addition, the fluorescence stability of the N,S-CDs was studied in detail. The results showed that the functional groups of the N,S-CDs chelate Fe3+ ions to quench the fluorescence of carbon dots. This shows that the N,S-CDs exhibit high selectivity for Fe3+ ions. With the addition of Fe3+ in the concentration of 0–100 µM, the fluorescence intensity of the N,S-CDs exhibited distinct and linear dependence upon the Fe3+ concentration (R2 = 0.9965), and the detection limit (D = 3ơ/m) was measured as 0.2 µM. The excellent optical properties and Fe3+ selectivity of the N,S-CDs provide a huge boost for application in the field of environmental monitoring.
1. Introduction
Iron, one of the essential trace elements for all living organisms, has little toxicity to humans and animals, but an excess amount of Fe3+ will lead to imbalanced human homeostasis and cause symptoms such as chronic poisoning, which seriously affect the healthy development of the human body [1,2,3]. In the water system, Fe3+ accumulates in organisms through the food chain and cannot be directly degraded. In vivo, Fe3+ can be transformed into a more toxic form or can directly interfere with metabolic processes [4,5,6,7]. When the concentration of Fe3+ in water is 0.1–0.3 mg/L [8], it will affect the color, smell, and taste of the water. Moreover, some special industries have higher requirements for iron content in water, such as the textile [9], paper [10], brewing [11], and food industries [12]. Therefore, under the condition of strictly controlling the Fe3+ content, researchers need to strictly detect Fe3+ in water resources [4,5,6,7].
Therefore, how to quickly and accurately detect Fe3+ in the environment has always attracted much attention [13]. At present, there are many detection methods for Fe3+, including potential voltammetry [14], atomic absorption spectrometry [15], and colorimetric methods [16]. However, most of these testing methods require expensive tools or instruments, and the more complex testing processes also put forward higher technical requirements for sample processing and operation. In recent years, with the maturity of fluorescent carbon dot detection technology, it has been widely applied to detect the concentration of Fe3+ due to its advantages of simple and low-cost preparation [17,18], high sensitivity [19], instantaneous response, and the specific recognition of metal ion [20,21,22].
As new carbon nanomaterials, carbon dots have a large number of hydrophilic functional groups on the surface, which allow them to have good water solubility and excellent fluorescence properties. At present, there are two commonly used methods for the synthesis of carbon dots, namely microwave-based synthesis and hydrothermal synthesis. For microwave-assisted methods, the advantage is that they can quickly synthesize carbon dots. For example, Chen et al. [23] rapidly synthesized 12.45% QY carbon dots in 4 min utilizing a mixture of glutamic acid and ethylenediamine, which specifically responds to Fe3+ in the linear range of 8–80 µM. It has been successfully applied to the detection of Fe3+ in fungal cells due to its detection limit of 3.8 µM and its good water solubility. However, compared to the hydrothermal method, the linear range and detection limit can be further improved by using a simpler hydrothermal method to synthesize doped carbon dots, as reported in references [24,25,26,27,28].
Muhammad et al. [24] used cranberry beans to prepare carbon dots with a detection limit of 9.55 µM in the linear range of 30–600 µM Fe3+, and Fe3+ ion detection could be achieved in a short time. The carbon dots prepared by Zhu et al. presented a detection limit of 0.45 µM in the concentration range of 0–60 µM [25]. These carbon dots that were synthesized using a hydrothermal method have a better detection range and detection limit than the microwave method. On the basis of these studies, a great deal of effort is devoted to improving the detection limit and range by changing the raw materials. Pu et al. [26] used phenylalanine as a nitrogen source and a common carbon source to prepare carbon dots. The results showed that Fe3+ combined with oxygen-containing functional groups outside of carbon dots formed static quenching, and Fe3+ combined with the induced carbon dots performed selective quenching. The carbon dots have a linear relationship with relative strength in the detection range of 5–500 µM, and the detection limit is as low as 0.720 µM. However, on the original basis, by using an environmentally friendly carbon source, that is, changing the type of carbon source, carbon dots with a QY of 28.6% and a lower detection limit of 0.398 µM were successfully prepared [27]. Through the analysis of the quenching mechanism, it was found that the carbon dots have an obvious selective quenching effect on Fe3+, and they also showed a good linear relationship in the range of 0–100 µM. Huang et al. reported the preparation of 8.6% QY copper nanocarbon dots (Cu-NCs) using glutathione as a stabilizer [28]. The nanocarbon dots were in the Fe3+ concentration range of 1–100 µM, the fluorescence of Cu-NCs was linearly quenched, the detection limit was 0.3 µM, and the nanocarbon dots were available for the detection of Fe3+ in real water samples. All of this proves that the detection of Fe3+ by carbon dots has the characteristics of high efficiency, reliability, and high selectivity, which can make it widely used in the field of environmental monitoring. However, due to the high detection limit and low-fluorescence quantum yield, carbon dots still cannot be widely used as sensors for the detection of ions in food and production.
In this work, we aimed to synthesize nitrogen–sulfur-doped carbon dots (N,S-CDs) with high fluorescence intensity and fluorescence quantum yield using a hydorthermal method (as shown in Figure 1) and utilizing a mixed citric acid, thiourea, and ethanol solution that can provide heteroatomic sulfur, amino, and hydroxyl functional groups during the synthesis process. The synthesized carbon dots had good water solubility, photostability, a high quantum yield, a specific response to Fe3+ ions, and high selectivity, which enable the carbon dots to be successfully applied in the field of environmental monitoring.
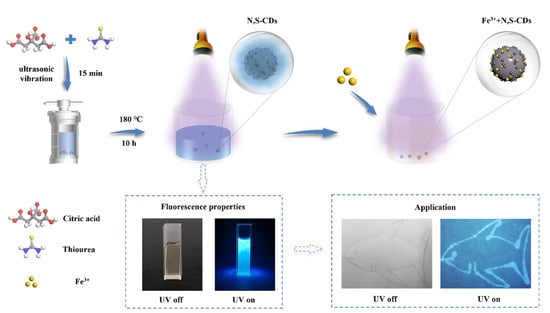
Figure 1.
Schematic diagram of the preparation and application of N,S-CDs and their application in Fe3+ sensing.
2. Experimental Section
2.1. Materials
All metal ion salts were analytically pure, including NaCl, KCl, Ba(NO3)2, Bi(NO3)2, ZnCl2, MgCl2, Al(NO3)3. The compounds 9H2O, Co(NO3)2, AgNO3, FeCl3, Pb(NO3)2, and CuSO4 were all obtained from Aladdin. Citric acid monohydrate, thiourea, dialysis membrane (MWCO 1000 Da), and quinine sulfate (98%) were purchased from Aladdin (Shanghai, China). The water used in all experiments was deionized water.
2.2. Instruments
The fluorescence and UV spectra were determined by using a fluorescence spectrometer (Hitachi, Tokyo, Japan) and a UVprobe2.70 UV-Vis spectrophotometer (Shimadzu Corporation, Shimadzu, Japan). The FTIR spectra were determined by using an IS20 Fourier Transform Infrared Spectrometer (Thermo Fisher Scientific, Shanghai, China). A drop of an aqueous solution containing N,S-CDs was dropped into the KBr particles, and after the water had evaporated, the particles were used to measure the FTIR spectrum (Thermo Fisher Scientific, Shanghai, China). XRD pictures were obtained using a MINIFLEX 600 benchtop X-ray diffractometer (Rigaku MiniFlex, Jiangsu, China). Transmission electron microscopy (TEM, Thermo Fisher, Shanghai, China) graphics were acquired on a FEI Tecnai G2 F20 high-resolution transmission electron microscope.
2.3. Preparation of N,S-CDs
Citric acid (CA) and thiourea (N,S) were first dissolved in a 10 mL absolute ethanol solution with the different substance ratios (2:1, 1:1, 1:2, 1:3, 1:4) and then were treated via ultrasonic dispersion for 10 min. The mixture was then added to the liner of a 50 mL Teflon reactor and heated at 180 °C for 12 h. The product obtained from the reaction was placed at room temperature for a period of time. The room temperature product was placed in a centrifuge (10,000 rpm, 30 min) to obtain the supernatant, and the filtrate containing the N,S-CDs was collected by filtration through a 0.22 μm syringe filter 2–3 times. Finally, the filtrate was put into a bag with a dialysis function (Mw = 1000 Da) for 3 days; the water was changed every 5 h to remove impurities; and the N,S-doped carbon dot products were acquired. In order to meet the needs of characterization, e.g., XRD, the sample needed to be prepared as a solid, and the method was as follows: the solution was placed in the cold trap of a freeze dryer to freeze, and freeze-drying was performed to obtain a solid powder product.
2.4. Fluorescence Quantum Yield Determination
The fluorescence quantum yield was calculated using the reference method in [29,30]. Quinine sulfate was dissolved in 0.1 M sulfuric acid to obtain a quinine sulfate solution as a standard solution. The quantum yield was 0.54 at excitation wavelengths of 340 nm and 360 nm. The quantum yield of doped carbon dots is calculated as
where QY indicates the fluorescence quantum yield, F indicates the fluorescence integral area at the excitation wavelength, A represents the absorbance (required to be kept at 0.05 or below), N indicates the refractivity of the solution, and the subscripts of S and R represent the carbon point solution and the quinine sulfate solution, respectively.
QYS = QYR × (FS/FR) × (AR/AS) × (NS2/NR2)
2.5. Detection of Fe3+ Ions
FeCl3 was used as the ion detection source, and differently weighted volumes were used. A 10 mL volumetric flask had 1 mM of Fe3+ solution and 2 mL of carbon dot dialysate. Ultrapure water was used to dilute the solution to the calibration line. The final concentrations of diluted Fe3+ were 0, 10, 20, 30, 40, 50, 60, 70, 80, 90, 100, 200, 300, 400, 500, and 600 µM. After shaking the volumetric flask up and down, the fluorescence intensity was measured at room temperature, and the process was repeated.
2.6. Selective Detection of Metal Ions
Under the same conditions as Fe3+ ion detection, 12 kinds of 1 mM metal ion solutions (Ag+, Ba2+, Bi2+, Co2+, Cu2+, Fe3+, Pb2+, Na+, Zn2+, Al3+, K+, Mg2+) and 1 mL of carbon dot solution were mixed to prepare the test stock solution with a metal ion concentration of 500 µM. The metal ion selectivity experiments were performed at room temperature with 11 replicates for each set of experiments, and standard deviation error bars were calculated. In addition, after the determination of ion selectivity, stability testing was carried out. For example, under the premise of the same concentration of N,S-CDs, the addition of different concentrations of NaCl solution and pH was conducted to explore the stability of the N,S-CDs. Relative ratio (F/F0) of the fluorescence emission intensities of the N,S-CDs in the presence and absence of metal ions was used to indirectly indicate the stability of the N,S-CDs.
2.7. Real Samples Measurement
To evaluate the feasibility of Fe3+ carbon spot detection in real samples, tap water samples obtained in our laboratory were analyzed using this method. All water samples were spiked with different concentrations of Fe3+ without any pretreatment, including the real samples and the N,S-CD probes. To examine the practical application of carbon dots, we analyzed the tap water samples obtained in our laboratory using spiked recovery. The collected water samples were treated with 0.22 µm filter membrane, and different concentrations of Fe3+ were added to the real samples and the N,S-CD probes. Finally, the fluorescence emission spectra were recorded at the excitation wavelength of 360 nm for all samples.
3. Results and Discussion
3.1. Structure and Characterization of Carbon Dots
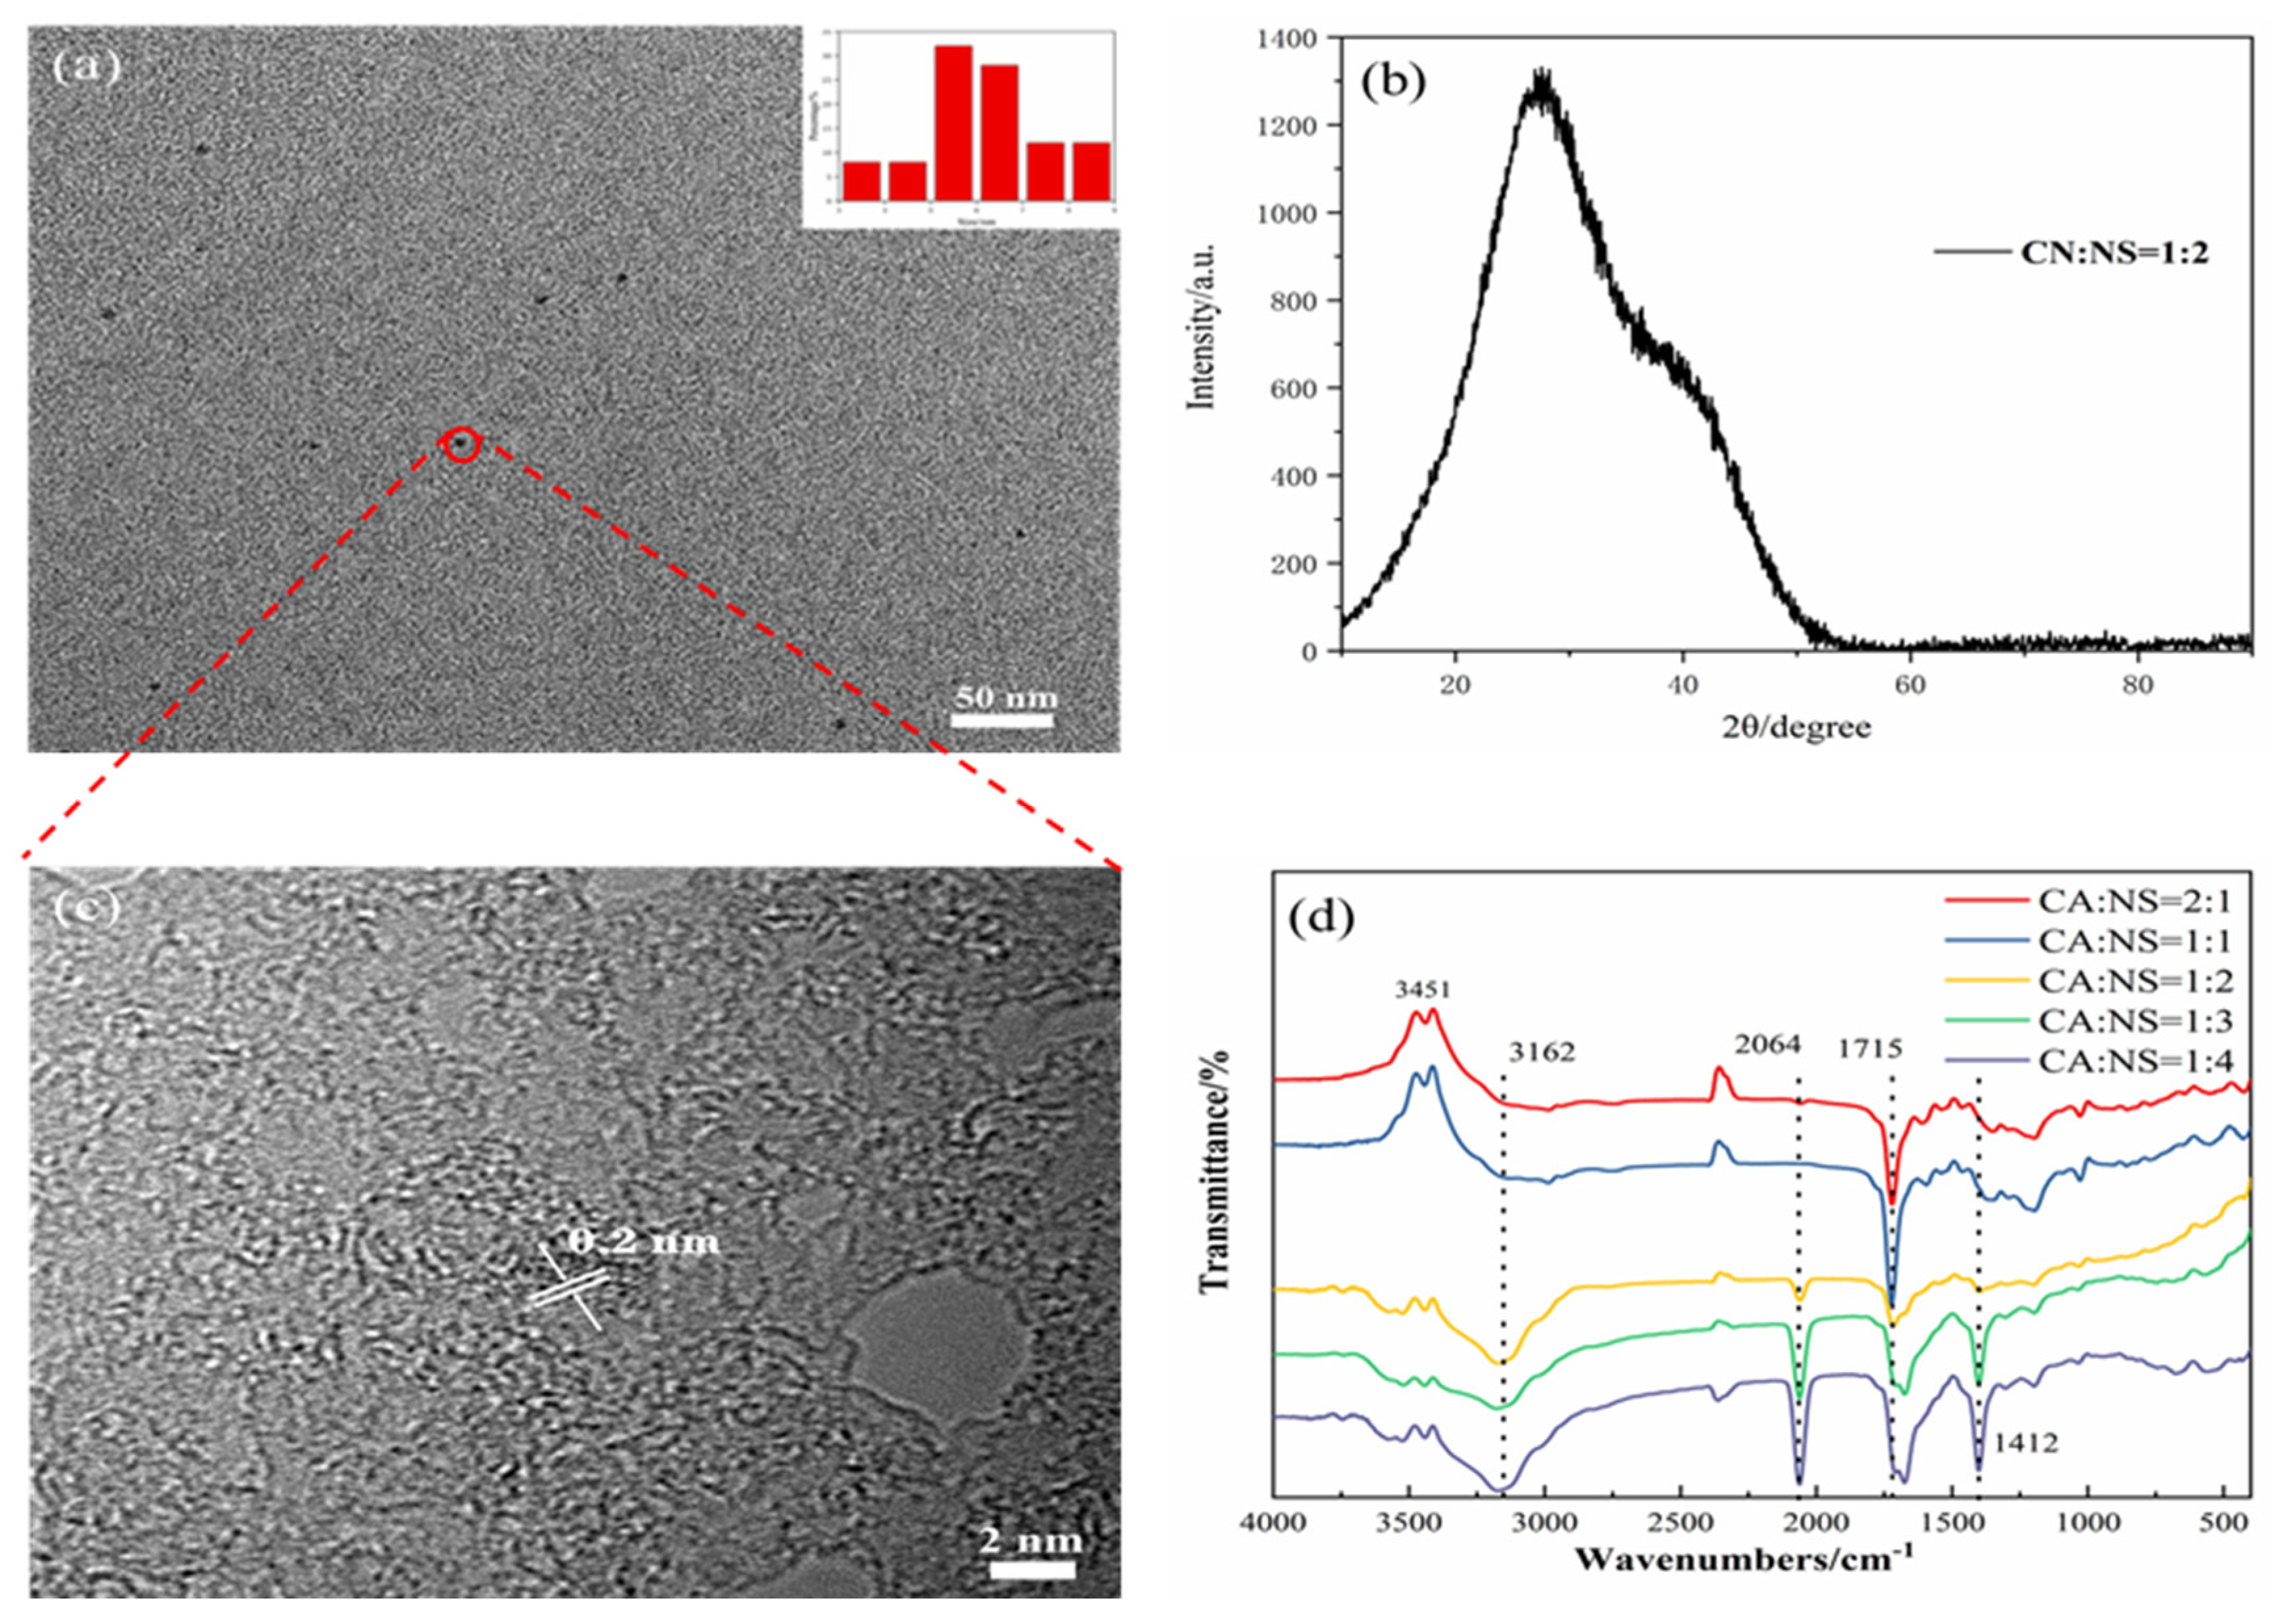
Using citric acid as a carbon source and thiourea as a nitrogen and sulfur source, high-QY fluorescent N,S-CDs were prepared by a one-step hydrothermal reaction. The morphology and particle size of the synthesized carbon dots were characterized by TEM. The TEM image in Figure 2a shows that the N,S-CDs are uniform in size, approximately spherical, and have good dispersion. As can be seen from the inset of Figure 2a, the size distribution of the N,S-CDs is between 5 and 7 nm. As shown in Figure 2c, the XRD diagram exhibits a peak trend of the carbon dots, with a peak at 2θ = 26.3°, which corresponds to the (002) graphitic carbon diffraction curve and also corresponds to the lattice spacing of 0.21 nm (Figure 2b) [31,32]. Moreover, infrared spectroscopy (FTIR) was used to analyze the surface functional groups of the N,S-CDs to determine their water solubility. As shown in Figure 2d, which is from the perspective of the infrared spectrogram, the stretching vibration peak of C=S at 2064 cm−1 increases with the decrease in the CA:NS ratio [33], and the stretching vibration peak of C=C [10,11,12] at 1412 cm−1 also increases with the decrease in the ratio. Both functional groups are chromogenic groups, which affect the fluorescence emission of carbon dots. Moreover, the stretching vibration of O−H [15,16,17] at 3451 cm–1, the stretching vibration of N–H [15,16,17] in –NH2 at 3162 cm−1, and the stretching vibration of C−N [22,26] at 1224 cm−1 all provide the basis for the fluorescence properties of the auxochrome-based carbon dots. These are hydrophilic groups, which provide the carbon dots with good water solubility [21]. The change in the amide C=O’s [27] bending vibration peak at 1715 cm−1 gradually changed from a single peak to a double peak, which may be due to the structural changes caused by the changes in the amide reaction during product synthesis and may affect the fluorescence properties of the carbon dots. Combined with infrared spectroscopic analysis, it was shown that the N and S atoms were co-doped in the carbon dots in the form of functional groups, and functional groups such as hydroxyl, carboxyl, and amide groups existed on the surface of the N,S-CDs. These results are similar to those of many other reported CDs [18,19,20,21,22,23,24,25,26,27] and demonstrate that the prepared fluorescent products are CDs and have good water solubility.
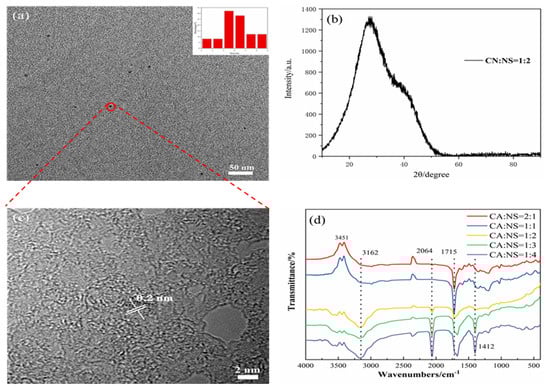
Figure 2.
TEM and particle size distribution (a), XRD (b), lattice spacing (c), and IR spectrum (d) of N,S-CDs.
3.2. Optical Properties of Carbon Dots
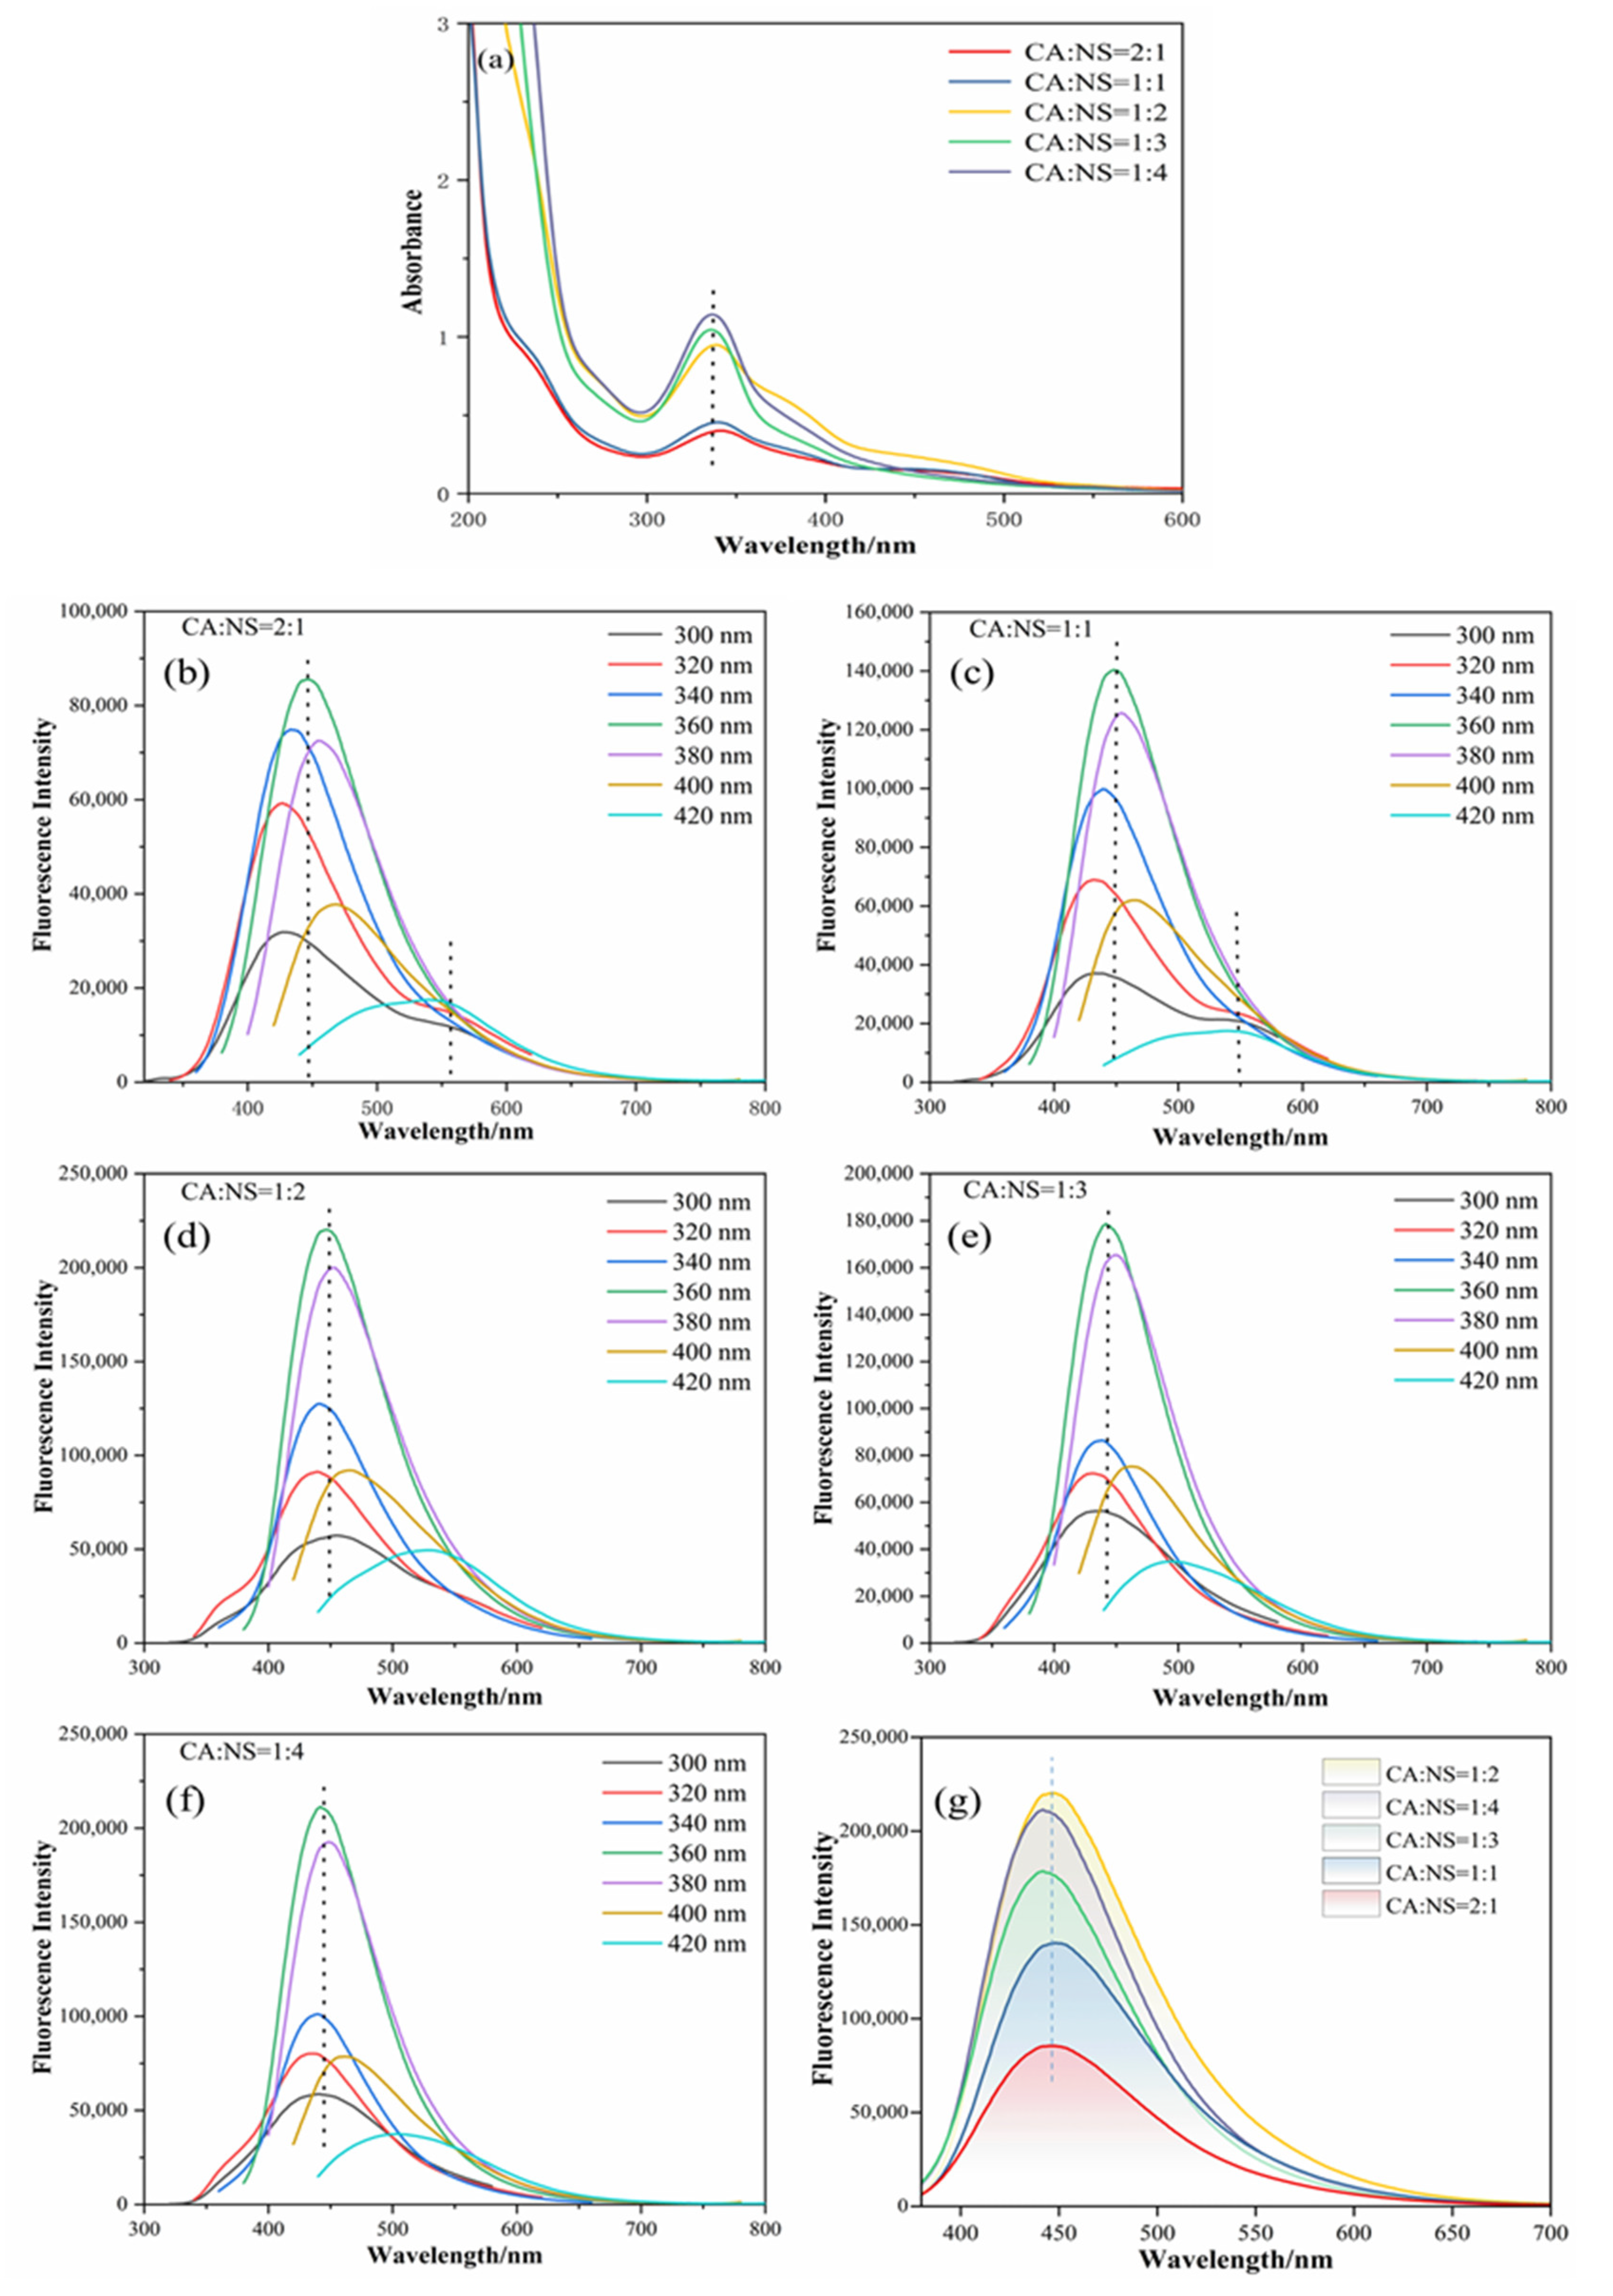
The optical properties of the N,S-CDs were studied using UV-vis and fluorescence spectra. From the UV-Vis absorption spectrum in Figure 3b, the shoulder peak around 245 nm is due to the π→π* energy transition of conjugated C=C hybridization, which confirmed the formation of a ring reaction and the formation of heterocyclic structure in the amidation process [24]. The peak around 345 nm is related to the n→π* energy transition of C=O/C−O generated by the “surface band”. This peak produces strong fluorescence emissions due to the electron holes (surface states) on the surface of the carbon dots that capture and release the excited-state energy [24].
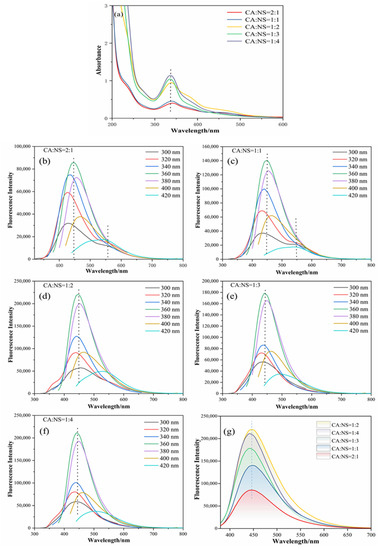
Figure 3.
UV-Vis absorption spectra of different components of N,S-CDs (a), fluorescence emission spectra (b–f) at different excitation wavelengths from 300 to 420 nm, and emission spectra of each component at the optimal excitation wavelength of 360 nm (g).
In this experiment, the optical properties of the N,S-CDs were further characterized by measuring the fluorescence spectra of the N,S-CDs. The results of the fluorescence spectra of the N,S-CDs with different CA:NS ratios are shown in Figure 3b–f. It can be seen from the figure that with the change in the excitation wavelength from 300 nm to 400 nm, the fluorescence emission intensity first goes up and then comes down, and the characteristic emission peak of the N,S-CDs is obviously red-shifted. This indicates that different proportions of the N,S-CDs have obvious excitation light dependence. As can be seen in Figure 3b–f, different N,S-CDs all have the same optimal excitation wavelength, which is 360 nm. At the excitation wavelength of 360 nm, their corresponding emission peaks (445 nm, 447 nm, 450 nm, 445 nm, and 443 nm) are all in the blue emission range. Furthermore, in Figure 2b,c, there is a weak peak at 550 nm, which appears as a green fluorescence emission. However, at this time, the maximum emission peak of the N,S-CDs is around 450 nm, corresponding to the blue fluorescence emission, which overlays the green fluorescence emission, eventually leading to the blue fluorescence emission of the carbon dots. From the conclusions in these figures, it is inferred that the position of the starting emission peak is related to the excitation wavelength, and the emission peak has a red-shift phenomenon at different excitation wavelengths. These phenomena are induced by specific surface defects of the NS-CDs near the Fermi level, which can be illustrated by the IR spectra [26,34].
The optimal excitation wavelength of the N,S-CDs was determined to be 360 nm in Figure 3b–f. Figure 3g demonstrates the emission spectra of carbon dots with different doping ratios at the excitation wavelength of 360 nm. It was found that when the ratio of CA:NS was 1:2, the fluorescence intensity of the N,S-CDs was the highest. This is due to the unsaturated bond chromophore groups on the surface of the N,S-CDs, namely C=C and C=O, which lead the N,S-CDs to emit fluorescence under ultraviolet and visible light, and the fluorescence intensity is under the joint influence of the auxochrome group and the chromophore group. This resulted in the best fluorescence intensity at the ratio of 1:2.
3.3. Fluorescence Quantum Yield of Carbon Dots
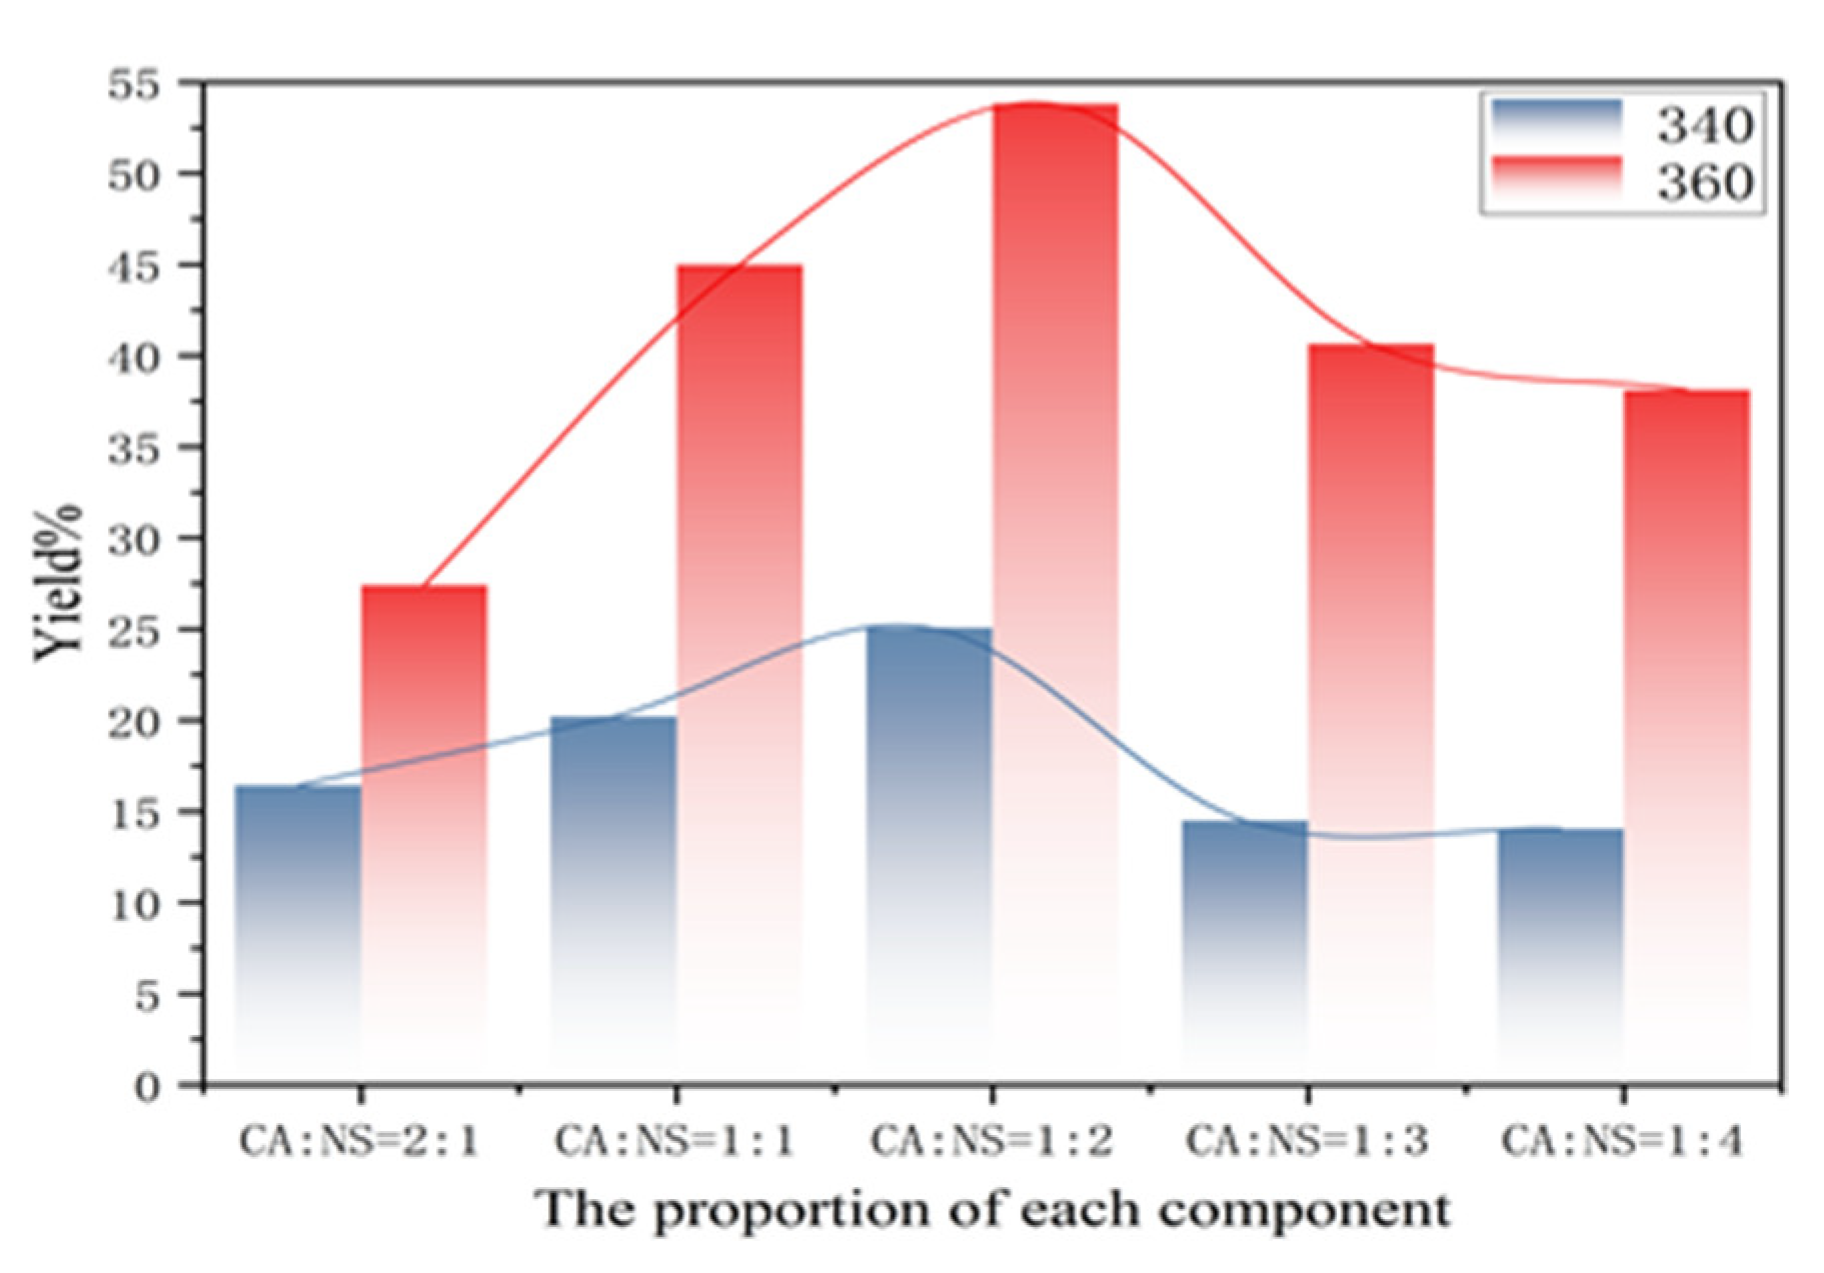
It can be seen from the graph of the yield variation in each component in Figure 4 that with the decrease in the CA:NS ratio, the yield does not increase linearly, but presents an arched bridge trend, which first increased and then decreased with the increase in NS content. The maximum yield was achieved when the CA:NS ratio was 1:2, which was 53.80% (when the excitation wavelength was 360 nm), corresponding to the fluorescence emission intensity map in Figure 3g. The reason for this is that during the reaction of citric acid and thiourea, a large number of chromophore groups and auxochrome groups were generated on the surface of the carbon dots, and the surface oxidation degree was high, which affected the change in the fluorescence yield.
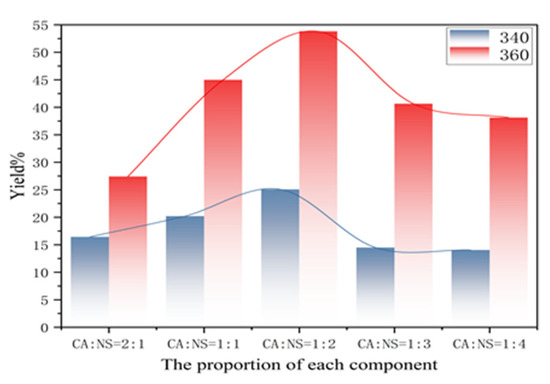
Figure 4.
Variation in fluorescence yield in each component at excitation wavelengths of 340 and 360 nm.
3.4. Stability of Carbon Dots
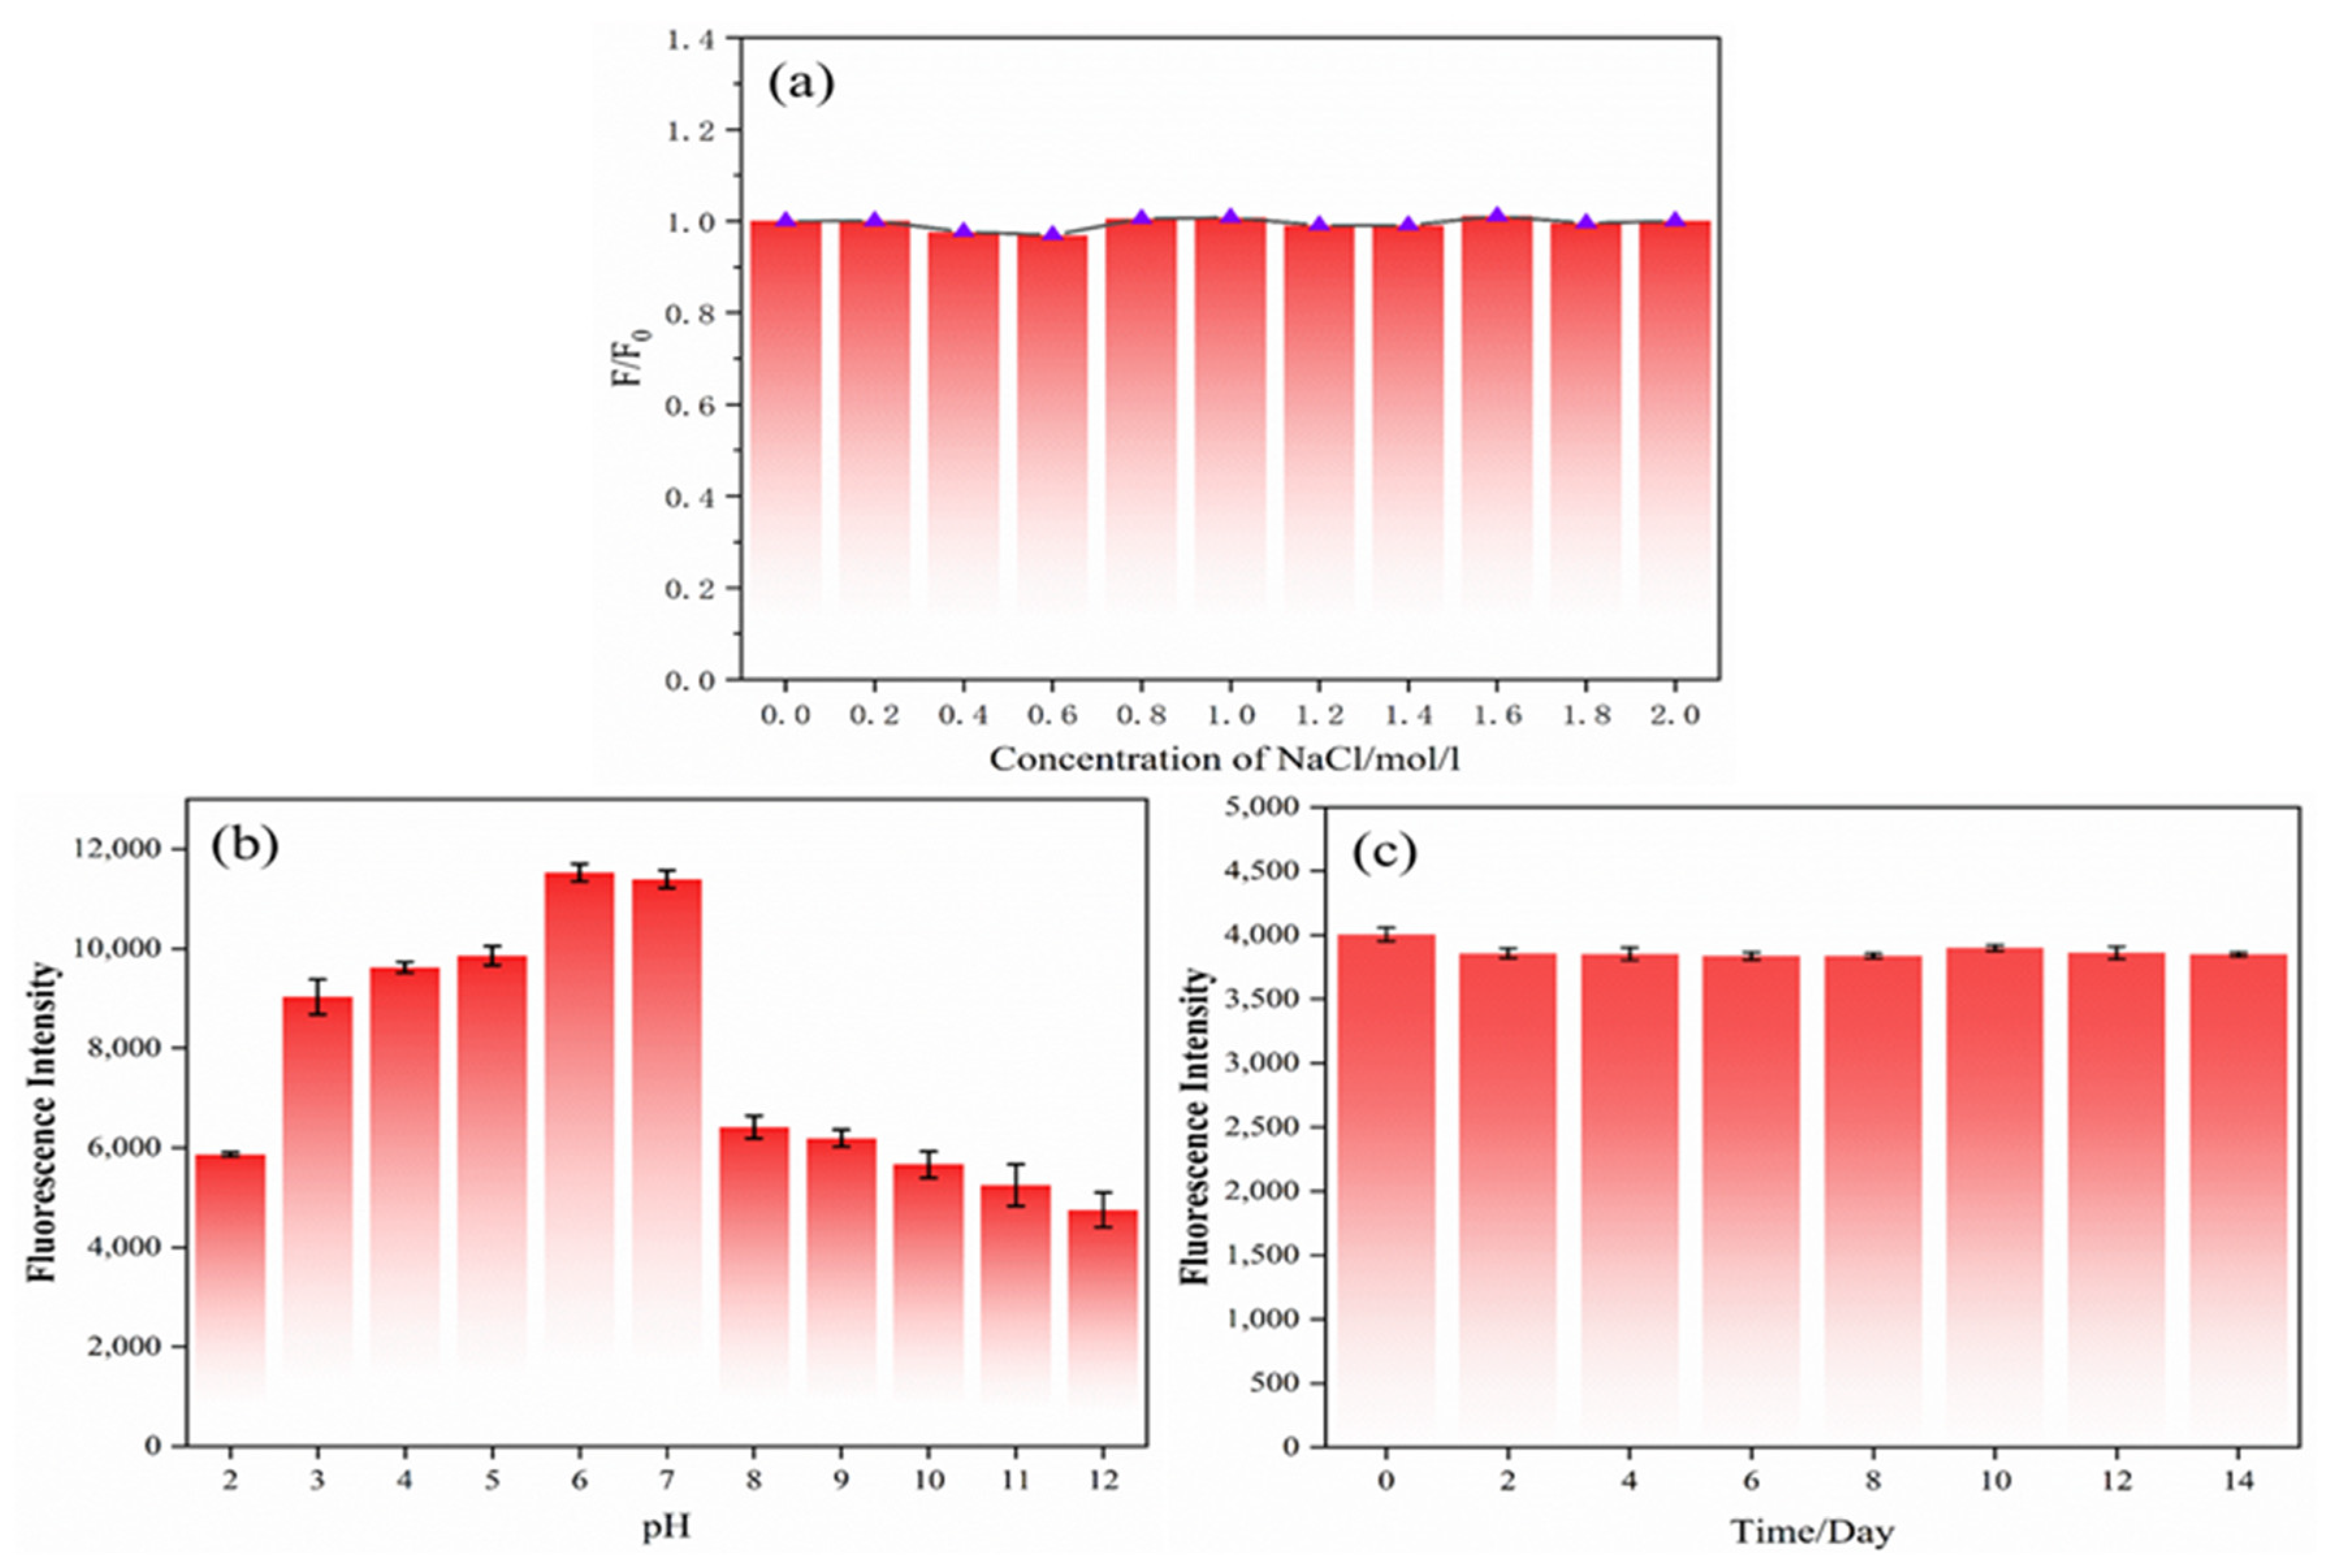
For the purpose of exploring the stability of carbon dots, the carbon dots were first mixed with NaCl standard solution to make the final concentration of 0–2 mol/L. The influence of the NaCl standard solution concentration on the fluorescence intensity of the N,S-CDs is displayed in Figure 5a. F and F0 represent the fluorescence emission intensities of the N,S-CDs in the presence and absence of metal ions, respectively. With the increase in the solution concentration, the fluorescence intensity of the N,S-CDs did not change much, which indicated that the N,S-CDs could exist stably in a high-concentration ionic environment. In addition, to further understand the stability of the carbon dots, the carbon dot solution was placed in different pH buffer solutions of pH 2–12, as shown in Figure 5b, which is the altered trend of the pH on the fluorescence intensity. From this, we can see that the fluorescence intensity of the N,S-CDs is about two times higher when the pH values are 6 and 7 than it is at pH 2 and pH 8–12. With the decrease in the pH value from 7 to 2 and the increase in acidity, the fluorescence intensity of the carbon dots weakened; as the pH increased from 7 to 12 and the alkalinity increased, the fluorescence intensity decreased significantly between 7 and 8 and then decreased slowly with the increase in the pH, demonstrating that the N,S-CDs have good fluorescence in neutral and weakly acidic environments. The luminescence intensity at the excitation wavelength of 360 nm was recorded as the photostability of the N,S-CDs under long-term storage at room temperature. As displayed in Figure 5c, with the passage of time at room temperature, the luminescence intensity of the carbon dots fluctuated up and down very little, demonstrating that the carbon dots have good photostability. In summary, the experiments show that the N,S-CDs have good stability.

Figure 5.
Effects of pH (a), NaCl solution concentration (b), and time (c) on fluorescence intensity of nitrogen–sulfur-doped carbon dots.
3.5. Metal Ion Selectivity
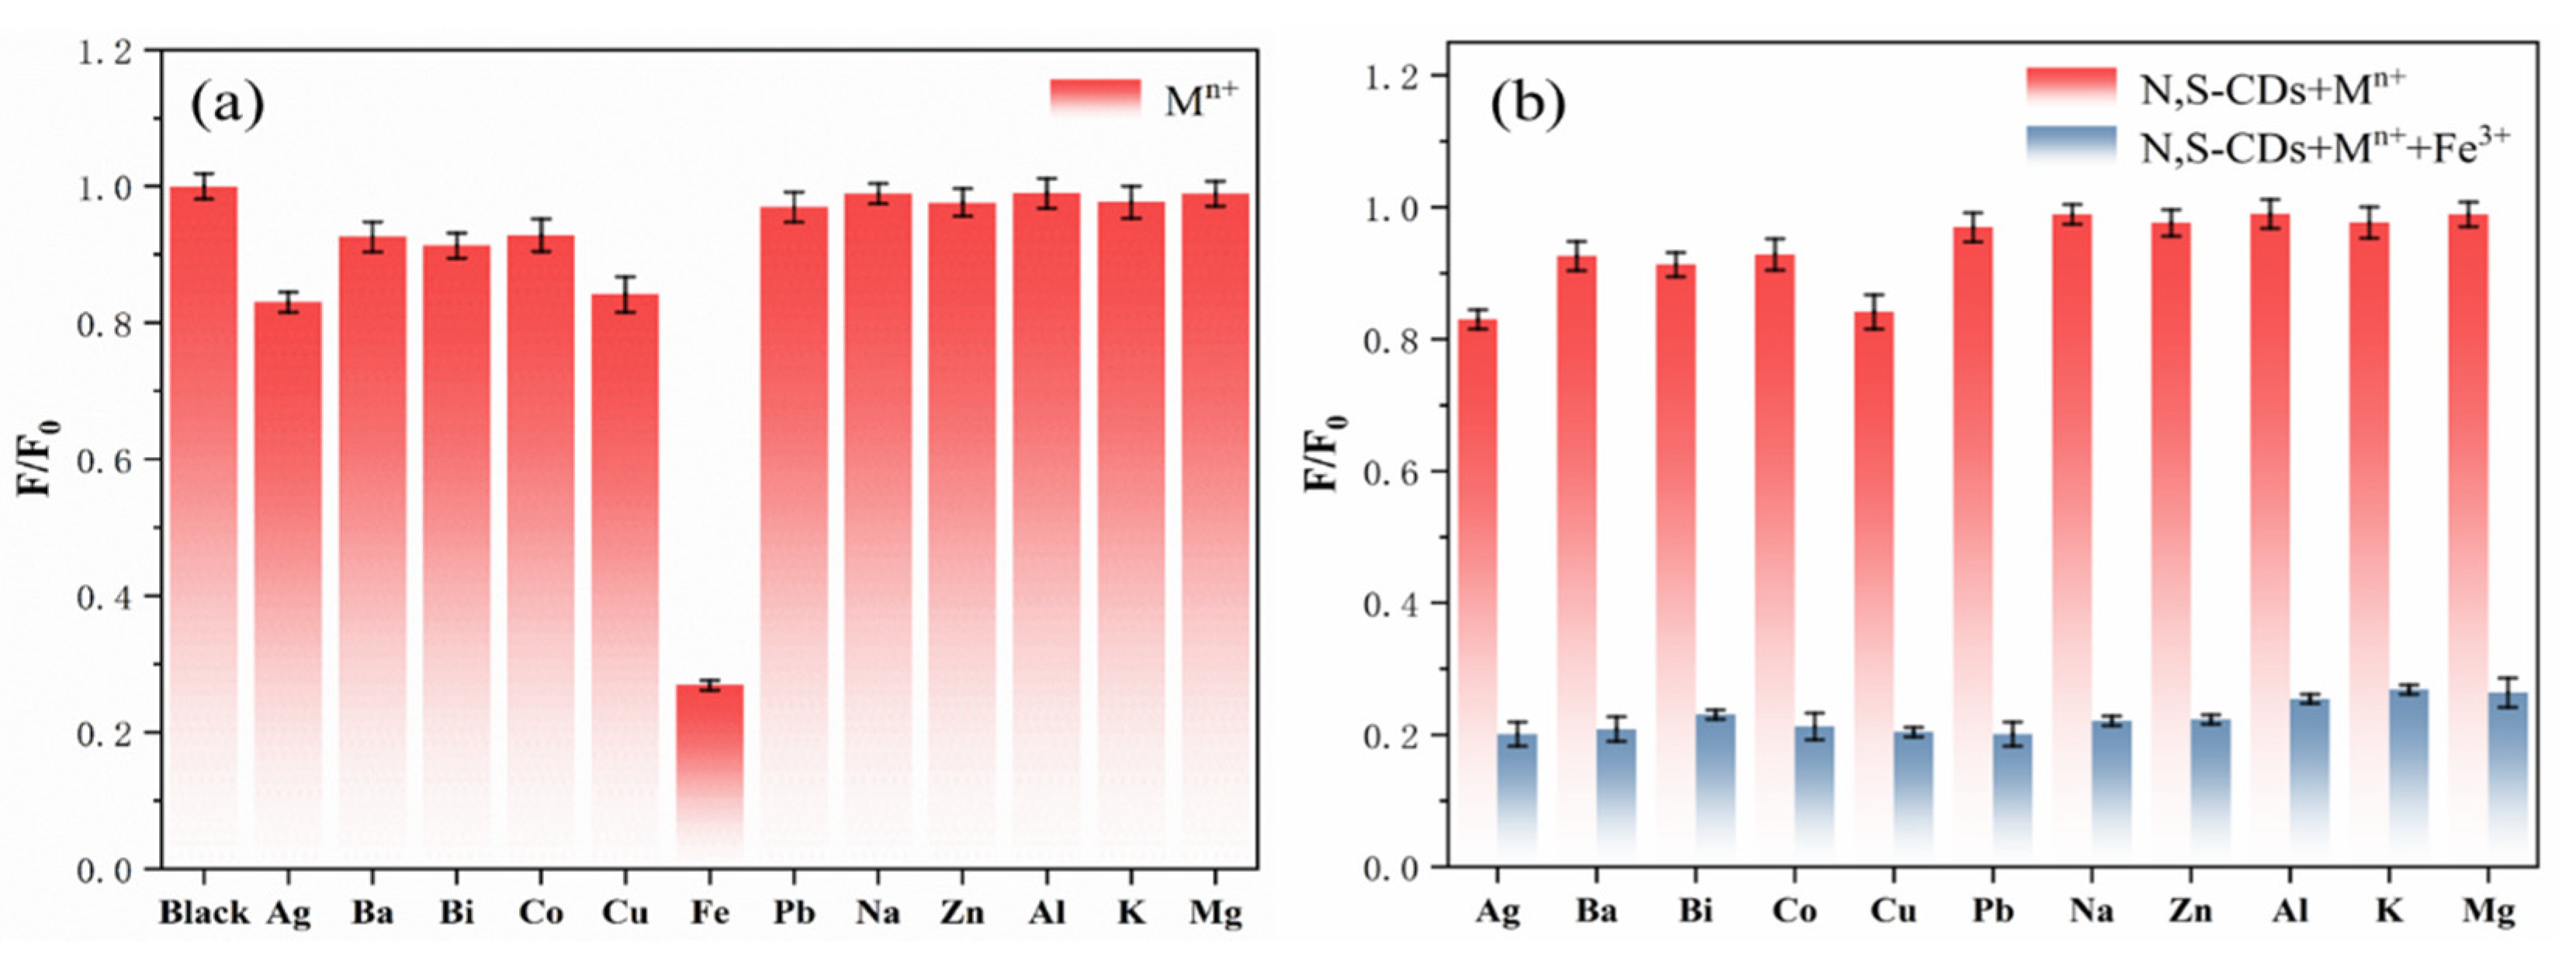
In order to evaluate the selective sensing ability and anti-interference ability of the N,S-CDs regarding metal ion selectivity, the fluorescence emission intensities of the N,S-CDs in the presence of different metal ions were investigated. Figure 6a illustrates the relative luminescence emission intensity (F/F0) of the metal ions at a concentration of 500 µM when the excitation wavelength is 360 nm. F and F0 are the fluorescence emission intensities of the N,S-CDs in the presence and absence of metal ions. Different metal ions have different effects on the fluorescence intensity of the N,S-CDs. From the bar chart of the N,S-CDs mixed with metal ions (Figure 6a), it can be seen that the addition of Fe3+ resulted in a significant decrease in the luminous intensity of the carbon dots and that the quenching was as high as 80%. Because the fluorescence intensity of other metal ions experienced no change or little change, the influence can be ignored. This shows that the prepared N,S-CDs have a stronger affinity for Fe3+ and can have good selectivity to Fe3+. Figure 6b indicates the effect of adding Fe3+ on the relative fluorescence emission intensity (F/F0) of the mixture system of metal ions and N,S-CDs. It can be seen from the bar chart (Figure 6b) that the addition of Fe3+ into the mixed system can still reduce the fluorescence intensity of the N,S-CDs to the greatest extent and that other metal ions cannot affect the quenching effect of Fe3+ on the N,S-CDs. This proves that the prepared N,S-CDs have good ionic anti-interference ability.

Figure 6.
Selectivity (a) and anti-interference ability (b) of nitrogen–sulfur-doped carbon dots for different ions.
3.6. Linear Analysis of Carbon Dots on Fe3+
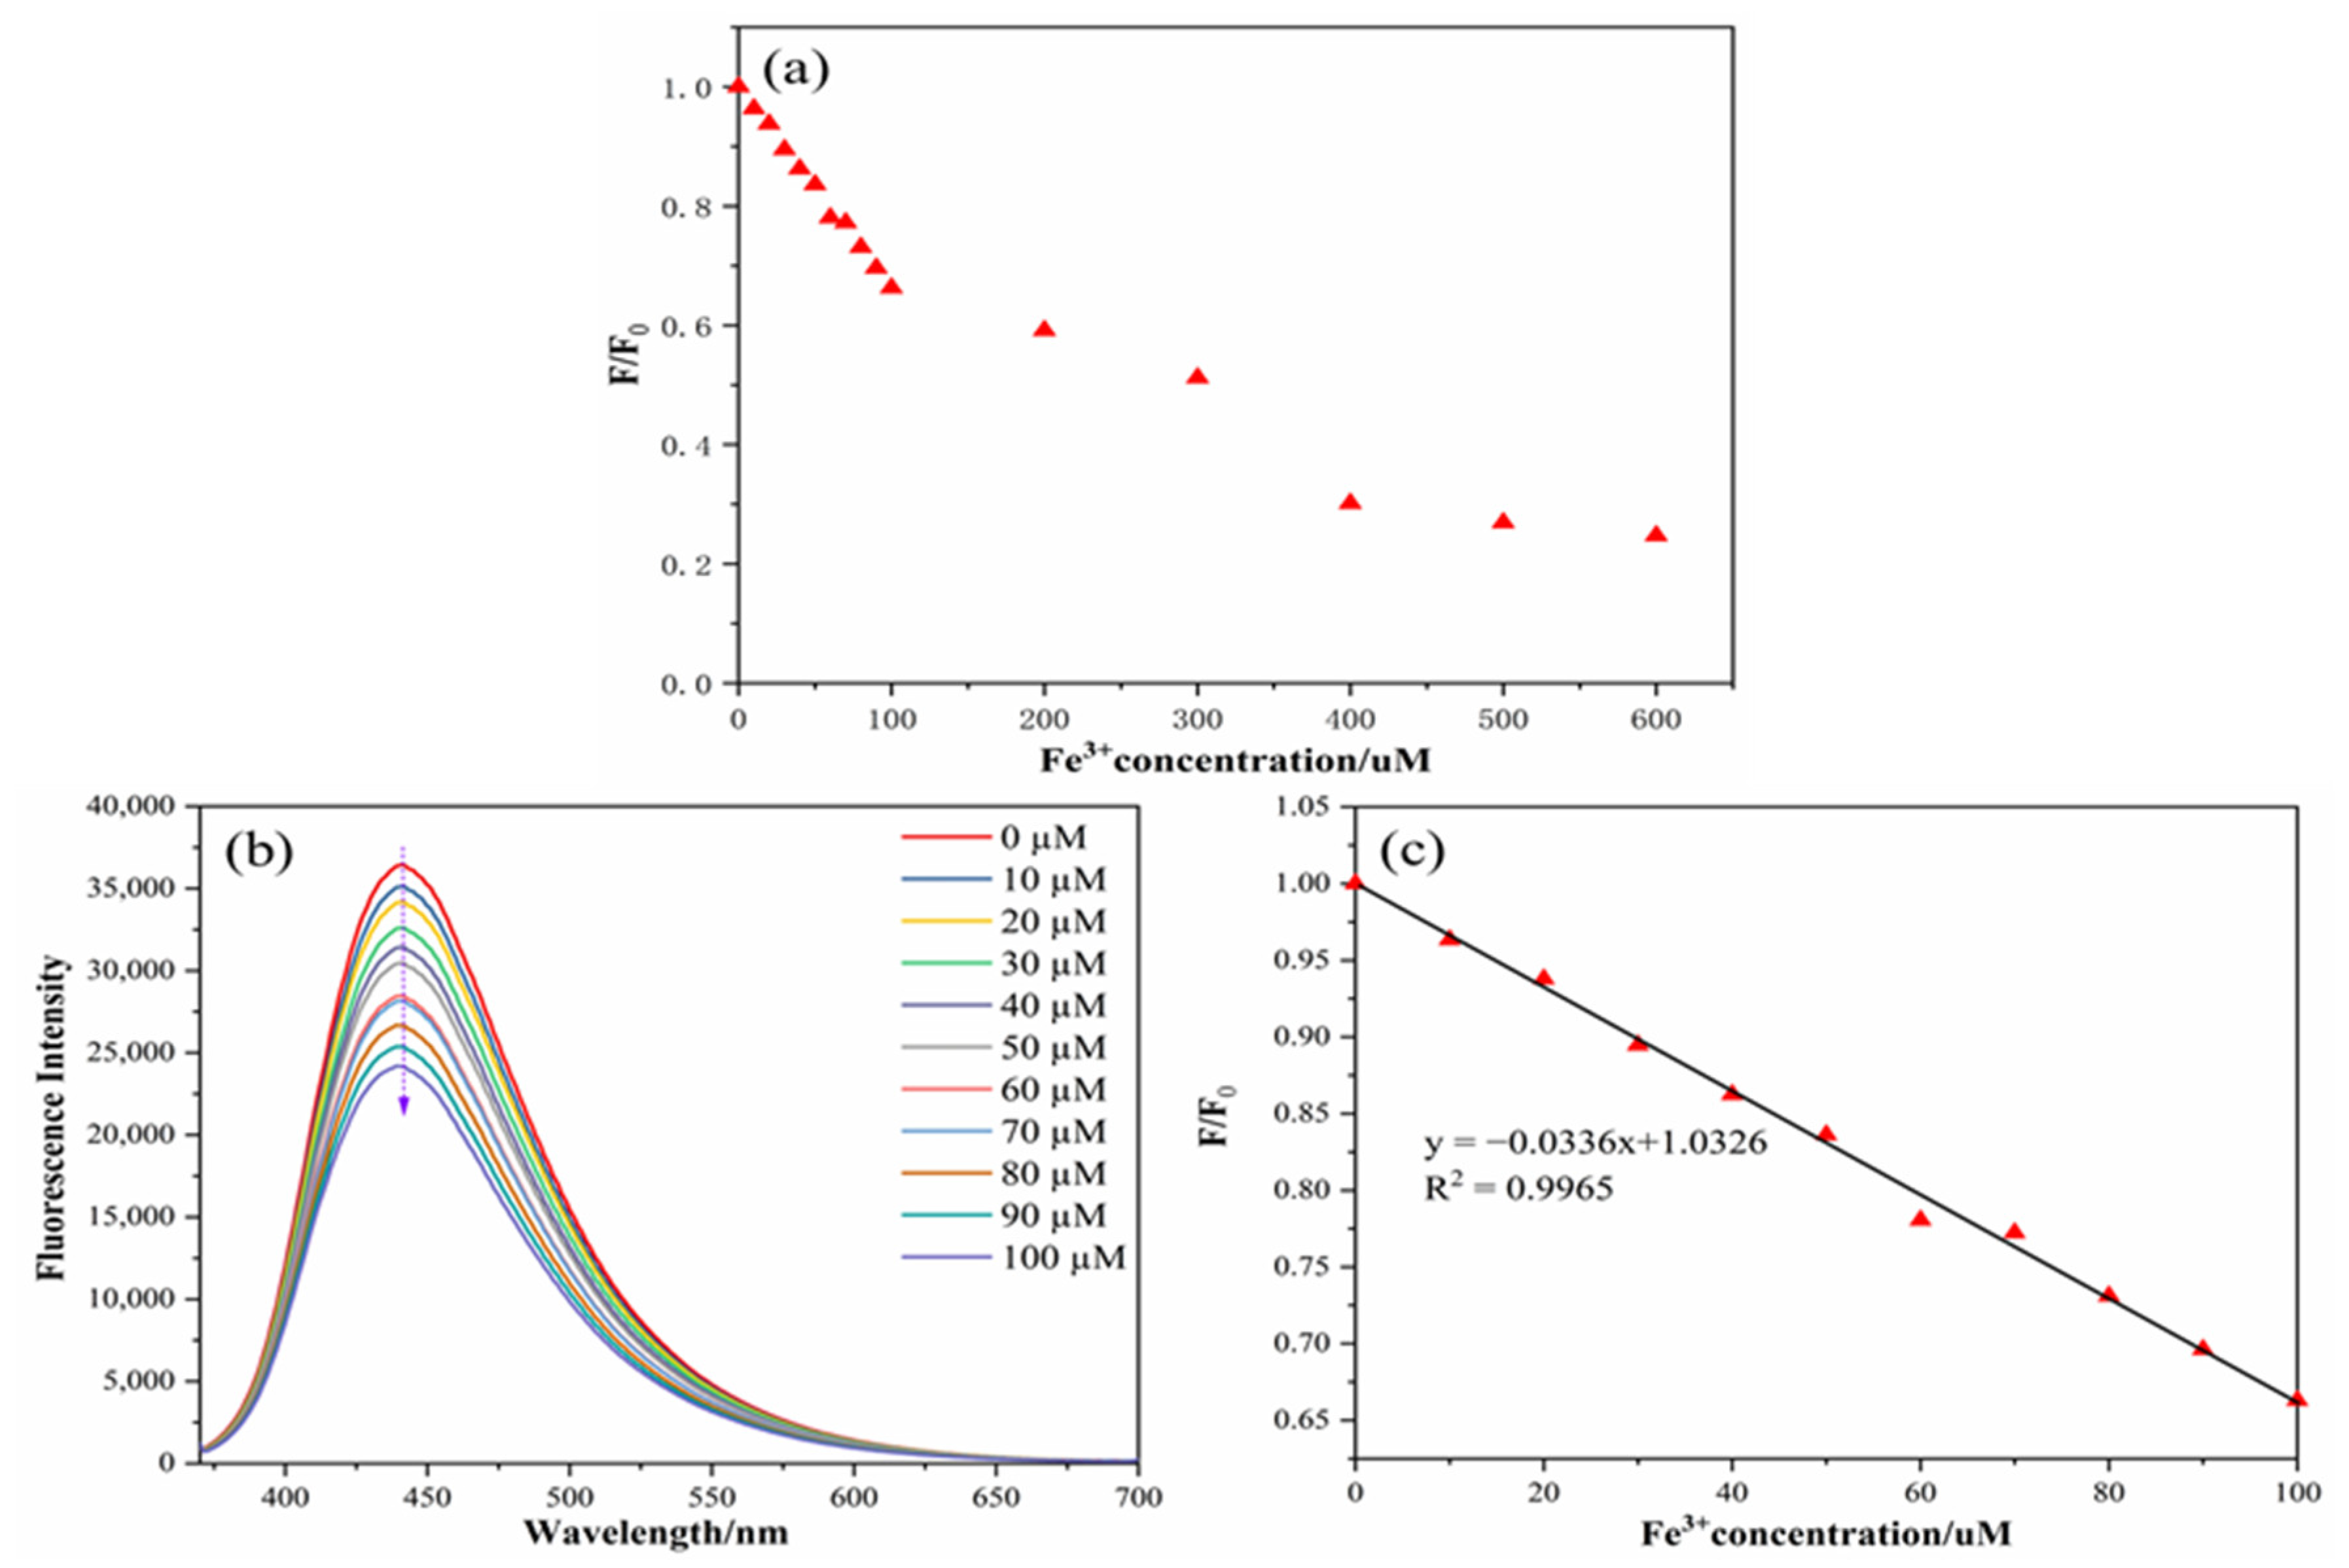
The linear analysis of Fe3+ can be continued by using the stability of the N,S-CDs mentioned above. As displayed in Figure 7a,b, the relative fluorescence intensity changes and fluorescence intensity diagrams of the nitrogen–sulfur-doped carbon dots with various concentrations of Fe3+ (0, 10, 20, 30, 40, 50, 60, 70, 80, 90, 100, 200, 400, 500, and 600 µM) are described. This can clearly show that when the concentration of Fe3+ increases, the intensity of the N,S-CDs also decreases. As displayed in Figure 7c, in the range of 0–100 µM, the relative fluorescence intensity (F/F0) displayed a good linear relationship, with an Fe3+ concentration (R2 = 0.9965). According to the formula D = 3ơ/m [19,23,26,27,28], the detection limit (D) was obtained as 0.20 µM (about 0.11 mg/L). Compared to the detection limits in the literature (Table 1), the carbon dots prepared in this paper have higher quantum yields and lower detection limits, which can be used for actual sample detection.
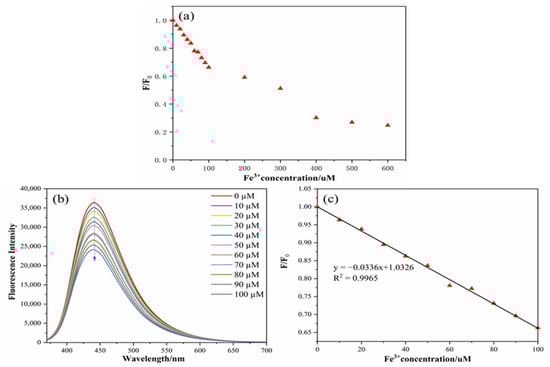
Figure 7.
Relative fluorescence intensity changes in N,S-CDs under different concentrations of Fe3+ (a), fluorescence intensity spectra of N,S-CDs under different concentrations of Fe3+ (b), and linear relationship between Fe3+ concentration and fluorescence intensity of the N,S-CDs (c).

Table 1.
Performance comparison of the different detection ranges and detection limits of carbon dots in the literature.
Finally, the quenching mechanism of Fe3+ on the N,S-CDs was briefly explored through the infrared and ultraviolet absorption spectra of the N,S-CDs and N,S-CDs+Fe3+. Figure 8a displays the UV absorption spectrum in the mixed system of N,S-CDs+Fe3+, and an absorption curve that is different from that of single N,S-CDs appeared. The curve has absorption peaks centered at 300 nm and 365 nm, and the peaks are higher than those in the N,S-CDs alone. In the infrared spectrum as displayed in Figure 8b, it can be observed that the stretching vibration peak of O–H of the hydroxyl group at 3451 cm−1 in the mixed system of N,S-CDs+Fe3+ is significantly weakened compared to that of the N,S-CDs alone, while the other peaks remain unchanged. This explains that when Fe3+ is added, the hydroxyl functional groups on the surface of the N,S-CDs are complexed with them to form ground-state complexes, which are attached to the surfaces of the carbon dots, affecting the luminescence properties of the N,S-CDs and resulting in the quenching effect of Fe3+.
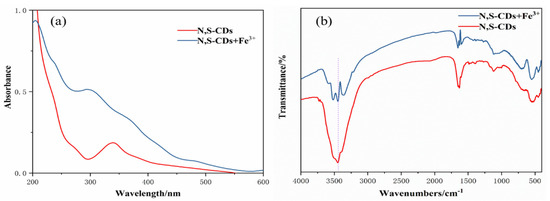
Figure 8.
UV spectra (a) and infrared spectra (b) of N,S-CDs+Fe3+ system and N,S-CDs.
3.7. Real Sample Analysis
To further prove the effectiveness of N,S-CDs in detecting Fe3+, three groups of Fe3+ with different concentrations were injected into a solution mixed with carbon dots and local tap water, and the data were recorded three times. The conclusion is displayed in Table 2, where the recovery rate of Fe3+ in tap water is 97.3%–110.1%, and the relative standard deviation is not more than 4%. The conclusion indicates that the N,S-CDs prepared in this paper had sufficient reliability and sensitivity and that the iron content indicated in the national sanitary standard for drinking water (GB 5749-2006) was 0.3 mg/L (5 µM) [8], which was higher than the detection limit in this paper, proving that the N,S-CDs could be used to measure the iron ion concentration in drinking water.
Table 2.
The recovery rate of standard addition of Fe3+ in tap water.
4. Conclusions
In this study, co-doped nitrogen–sulfur carbon dots (N,S-CDs) were synthesized hydrothermally by employing thiourea and citric acid as precursors. By changing the ratio of citric acid and thiourea, blue fluorescent N,S-CDs with a quantum yield of 53.80% were synthesized. In weakly acidic, neutral, and high-concentration ionic environments, the N,S-CDs have a highly selective quenching response to Fe3+. When the concentration is 0–100 µM, the fluorescence intensity of the N,S-CDs has a linear relationship with the concentration of Fe3+ (R2 = 0.9965), and the measured detection limit (D = 3ơ/m) is 0.2 µM. The results reported in this paper demonstrates the prospective potential application of carbon dots in the field of environmental analysis and monitoring.
Author Contributions
Project administration, Z.L. (Zhengxin Li); Supervision, W.H.; Writing – original draft, H.Z.; Writing – review & editing, Y.R.; Help experiment, Z.L. (Zheng Li). All authors have read and agreed to the published version of the manuscript.
Funding
This work was financially supported by the Innovative Funds Plan of Henan University of Technology (No. 2021ZKCJ06) and supported by the Project of Henan Science and Technology Research Program in 2022 (No.222102230040) and the Cultivation Programme for Young Backbone Teachers in Henan University of Technology (No. 21420117).
Institutional Review Board Statement
Not applicable.
Informed Consent Statement
Not applicable.
Data Availability Statement
The supporting data are available in Henan University of Technology and can be availed upon reasonable request. The data sets generated during this study are available from the corresponding author upon reasonable request.
Conflicts of Interest
The authors declare no conflict of interest.
References
- Yan, Z.; Hu, L.; You, J. Sensing materials developed and applied for bio-active Fe3+ recognition in water environment. Anal. Methods. 2016, 8, 5738–5754. [Google Scholar] [CrossRef]
- Roth-Walter, F.; Pacios, L.F.; Bianchini, R.; Jensen-Jarolim, E. Linking iron-deficiency with allergy: Role of molecular allergens and the microbiome. Met. Integr. Biometal Sci. 2017, 9, 1676–1692. [Google Scholar] [CrossRef] [Green Version]
- Bischof, H.; Burgstaller, S.; Waldeck-Weiermair, M. Live-Cell Imaging of Physiologically Relevant Metal Ions Using Genetically Encoded FRET-Based Probes. Cells 2019, 8, 492. [Google Scholar] [CrossRef] [PubMed] [Green Version]
- Qi, D.; Chen, L.; HaiJun, W. Electrochemical detection of heavy metal ions in water. Chem. Commun. 2021, 57, 7215–7231. [Google Scholar]
- Malik, L.A.; Bashir, A.; Qureashi, A.; Pandith, A.H. Detection and removal of heavy metal ions: A review. Environ. Chem. Lett. 2019, 17, 1495–1521. [Google Scholar] [CrossRef]
- Rao, K.M.; Raagala, V.; Kasula, N. Fabrication of Polyelectrolyte Membranes of Pectin Graft-Copolymers with PVA and Their Composites with Phosphomolybdic Acid for Drug Delivery, Toxic Metal Ion Removal, and Fuel Cell Applications. Membranes 2021, 11, 792. [Google Scholar]
- Sugumari, V.; Karthikeyan, R.; Remya, R.R. Recent developments in magnetic nanoparticles and nano-composites for wastewater treatment. J. Environ. Chem. Eng. 2021, 7, 106553. [Google Scholar]
- GB 5749–2006; Standards for Drinking Water Quality. National Standards of the People’s Republic of China: Beijing, China, 2006.
- Reddy, D.R.; Dinesh, G.K.; Anandan, S. Sonophotocatalytic treatment of Naphthol Blue Black dye and real textile wastewater using synthesized Fe doped TiO2. Chem. Eng. Process. Process Intensif. 2016, 99, 10–18. [Google Scholar] [CrossRef]
- Shi, D.; Ouyang, Z.; Zhao, Y.; Xiong, J.; Shi, X. Catalytic Reduction of Hexavalent Chromium Using Iron/Palladium Bimetallic Nanoparticle-Assembled Filter Paper. Nanomaterials 2019, 9, 1183. [Google Scholar] [CrossRef] [Green Version]
- Wietstock, P.C.; Kunz, T.; Waterkamp, H.; Methner, F.J. Uptake and Release of Ca, Cu, Fe, Mg, and Zn During Beer Production. J. Am. Soc. Brew. Chemists. 2015, 73, 179–184. [Google Scholar] [CrossRef]
- Deckers, M.; Deforce, D.; Fraiture, M.A.; Roosens, N.H.C. Genetically Modified Micro-Organisms for Industrial Food Enzyme Production: An Overview. Foods 2020, 9, 326. [Google Scholar] [CrossRef] [PubMed] [Green Version]
- Juan, Z.; LiHui, X.; QingNan, L. Metal chelator EGCG attenuates Fe(III)-induced conformational transition of α-synuclein and protects AS-PC12 cells against Fe(III)-induced death. J. Neurochem. 2017, 143, 136–146. [Google Scholar]
- Mittal, S.K.; Kumar, S.; Kaur, N. Enhanced Performance of CNT-doped Imine Based Receptors as Fe(III) Sensor Using Potentiometry and Voltammetry. Electroanalysis 2019, 31, 1229–1237. [Google Scholar] [CrossRef] [Green Version]
- Adolfo, F.R.; Nascimento, P.D.; Leal, G.C. Simultaneous determination of iron and nickel as contaminants in multimineral and multivitamin supplements by solid sampling HR-CS GF AAS. Talanta 2019, 159, 745–751. [Google Scholar] [CrossRef]
- Jalili, R.; Khataee, A.; Rashidi, M.R. Dual-colored carbon dot encapsulated metal-organic framework for ratiometric detection of glutathione. Sens. Actuators B Chem. 2019, 297, 126775. [Google Scholar] [CrossRef]
- Kim, K.W.; Choi, T.Y.; Yong, M.K. Simple synthesis of photoluminescent carbon dots from a marine polysaccharide found in shark cartilage. Electron. J. Biotechnol. 2020, 47, 36–42. [Google Scholar] [CrossRef]
- Thomas, C.W.; Piergiorgio, G.; Anh, N.P. Biomass-Based Carbon Dots: Current Development and Future Perspectives. ACS Nano. 2021, 15, 15471–15501. [Google Scholar]
- Hashemi, N.; Mousazadeh, M.H. Preparation of fluorescent nitrogen-doped carbon dots for highly selective on-off detection of Fe3+ ions in real samples. Opt. Mater. 2021, 121, 111515. [Google Scholar] [CrossRef]
- Lu, X.; FengYun, W.; Lei, W. The synthesis and modification of highly fluorescent carbon quantum dots for reversible detection of water-soluble phosphonate-1-hydroxyethane-1,1-diphosphonic acid by fluorescence spectroscopy. J. Biol. Chem. Lumin. 2021, 36, 200–209. [Google Scholar] [CrossRef]
- Gorakh, B.D.; Garje, S.S. Nitrogen and Phosphorus Co-Doped Carbon Dots for Selective Detection of Nitro Explosives. ACS Omega 2020, 5, 2710–2717. [Google Scholar]
- Dong, Y.; Zhang, Y.; Zhi, S. Green Synthesized Fluorescent Carbon Dots from Momordica charantia for Selective and Sensitive Detection of Pd2+ and Fe3+. ChemistrySelect 2021, 6, 123–130. [Google Scholar] [CrossRef]
- Chen, Y.; Sun, X.; Pan, W. Fe3+-Sensitive Carbon Dots for Detection of Fe3+ in Aqueous Solution and Intracellular Imaging of Fe3+ Inside Fungal Cells. Front. Chem. 2020, 7, 911. [Google Scholar] [CrossRef] [PubMed]
- Zulfajri, M.; Gangaraju, G.; Chang, C.J. Cranberry Beans Derived Carbon Dots as a Potential Fluorescence Sensor for Selective Detection of Fe3+ Ions in Aqueous Solution. ACS Omega 2019, 4, 15382–15392. [Google Scholar] [CrossRef] [PubMed] [Green Version]
- Zhu, X.; Zhang, Z.; Xue, Z. Understanding the Selective Detection of Fe3+ based on Graphene Quantum Dots as Fluorescent Probes: The Ksp of a Metal Hydroxide-Assisted Mechanism. Anal. Chem. 2017, 89, 12054–12058. [Google Scholar] [CrossRef] [PubMed]
- Pu, Z.F.; Wen, Q.L.; Yang, Y.J. Fluorescent carbon quantum dots synthesized using phenylalanine and citric acid for selective detection of Fe3+ ions. Spectrochim. Acta Part A Mol. Biomol. Spectrosc. 2020, 229, 117944. [Google Scholar] [CrossRef]
- Nair, S.; Kottam, N.; Prasanna, K. Green Synthesized Luminescent Carbon Nanodots for the Sensing Application of Fe3+ Ions. J. Fluoresc. 2020, 30, 357–363. [Google Scholar]
- Huang, H.; Li, H.; Feng, J.; Feng, H.; AiJun, W. One-pot green synthesis of highly fluorescent glutathione-stabilized copper nanoclusters for Fe3+ sensing. Sens. Actuator B Chem. 2017, 241, 292–297. [Google Scholar] [CrossRef]
- Mei, S.; Wei, X.; Hu, Z. Amphipathic carbon dots with solvent-dependent optical properties and sensing application. Opt. Mater. 2019, 89, 224–230. [Google Scholar] [CrossRef]
- Crista, D.; Mragui, A.E.; Algarra, M. Turning Spent Coffee Grounds into Sustainable Precursors for the Fabrication of Carbon Dots. Nanomaterials 2020, 10, 1209. [Google Scholar] [CrossRef]
- Ra, A.; Tnjie, A.; Sp, B. Green synthesized multiple fluorescent nitrogen-doped carbon quantum dots as an efficient label-free optical nanoprobe for in vivo live-cell imaging. J. Photochem. Photobiol. A: Chem. 2019, 372, 99–107. [Google Scholar]
- Atchudan, R.; Nesakumar, J.; Perumal, S. Indian Gooseberry-Derived Tunable Fluorescent Carbon Dots as a Promise for In Vitro/In Vivo Multicolor Bioimaging and Fluorescent Ink. ACS Omega 2018, 3, 17590–17601. [Google Scholar] [CrossRef]
- Miao, X.; Yan, X.; Qu, D. Red emissive S, N codoped carbon dots and their application in ion detection and theraonostics. Acs Appl. Mater. Interfaces 2017, 77, 99–107. [Google Scholar]
- ChenLong, S.; Qing, L.; ChongXin, S. Near-Infrared Chemiluminescent Carbon Nanodots and Their Application in Reactive Oxygen Species Bioimaging. Adv. Sci. 2020, 7, 1903525. [Google Scholar]


Publisher’s Note: MDPI stays neutral with regard to jurisdictional claims in published maps and institutional affiliations. |
© 2022 by the authors. Licensee MDPI, Basel, Switzerland. This article is an open access article distributed under the terms and conditions of the Creative Commons Attribution (CC BY) license (https://creativecommons.org/licenses/by/4.0/).