Review

Macroscopic and Microstructural Features of Metal Thin-Wall Fabricated by Laser Material Deposition: A Review

School of Mechanical Engineering, Dalian Jiaotong University, Dalian 116028, China
*
Author to whom correspondence should be addressed.
Coatings 2022, 12(8), 1104; https://doi.org/10.3390/coatings12081104
Submission received: 4 July 2022 / Revised: 30 July 2022 / Accepted: 1 August 2022 / Published: 3 August 2022

Abstract

:
Owing to the versatility without expanding the machine’s size, thin-wall has been widely used in high-value parts. The investigation of laser additive manufacturing (LAM), which has advantages such as high powder density, easy controllability, and excellent stability, on the fabrication of thin-wall has drawn much attention. In this paper, the research status of macroscopic and microstructural features of metal thin-wall fabricated by LAM has been reviewed. The deposition quality was mainly focused on the effect of process parameters and especially the matching of z-increment and single deposition height. Based on the grain size and growth of columnar, the characteristics of microstructures were analyzed. Considering the structural feature of thin-wall, the effect of grain size and phases on the hardness and distribution of hardness were discussed. The effect of grain size, phases and loading direction on the tensile properties were reviewed. The distribution and modification of thermal stress were presented.

1. Introduction

Thin-wall, which always possesses small thickness and complex structure, can allow machine to have more functions without expanding the machine’s size and to assemble small machines [1,2]. So, it is widely used in high-value parts, such as aircraft engine cowling, space airborne equipment, key auto components and so forth [3,4]. The thin-wall parts can be made by the conventional processes, such as casting, welding, assembling and so on, in which the disadvantages such as long process cycle, cumbersome, low material utilization, and low bonding strength. Owing to the incremental layer-by-layer manufacturing by adding material, laser additive manufacturing (LAM), which has many advantages such as high powder density, easy controllability, and excellent stability, can cover the mentioned above disadvantages in fabrication of thin-wall by conventional processes and directly create the final mental thin-wall parts [5,6,7,8,9,10].
LAM mainly includes powder bed fusion (PBF) mode, such as selective laser melting/selective laser sintering [11,12,13], and direct laser deposition (DLD) mode, such as laser material deposition (LMD) [14,15,16]. In PBF process, the powder is preset in powder bed and fed by the scraper layer-by-layer. Due to the existing of powder bed, the fabricated part is surrounded and supported by the un-melted powder during the fabricating process. In addition, the used workbench and powder in PBF are smaller than that of in DLD process. Therefore, the PBF process is suitable for the fabrication of part with small size and complex structure [17,18]. However, in the LMD process, the powder is delivered by inert gas such as argon gas into the molten pool that contributes to the improvement of controllability of fabrication process [19]. Due to the bigger power particle size and diameters of laser spot, the parts created by LMD usually possesses larger thickness and surface roughness that can be improved by the post-treatment process such as milling [20,21,22]. Thus, the LMD process is more suitable for the fabrication of parts with bigger size. In particular, the LMD has incomparable advantages in fabrication of functionally graded material, repairing of high value-add component with big size and cladding the enhancement coating on the substrate [3,23,24]. Therefore, the LMD process has a promising application prospect in the fabrication and repairing of thin-wall parts in the areas of aerospace, aviation, die and mold, etc. [25]. In LMD process, laser beam acts as the heating source to create a molten pool on the substrate and the powder, which is delivered by the flowing inert gas, is injected into the molten pool simultaneously. The delivered powder would be captured by the molten pool and melt. After the laser beam goes away, the molten pool solidifies and increases the volume. Based on the scanning path designed by the computer, the laser beam and powder feed nozzle move above the substrate and create the first expected clad layer. Then, the laser cladding head moves up z-increment to the new position for the preparing of deposition of second layer. Based on the first layer, the new layer can be deposited through creating metallurgical bonding with the first layer along the scanning path. Similar process, in which the latter layers are sequentially created on the former layer, repeats again and again that makes the three-dimensional (3D) part to be built layer-by-layer [26,27,28,29,30].
The LMD process of thin-wall, in which single-track and multi-layers are deposited, is unfavorable for the heat conduction that results in the heat accumulation [31]. The thickness of thin-wall is closely related to the width of the single deposited layer, which is significantly affected to the diameter of laser spot, laser power, powder feed rate, scanning speed and so on. Owing to the small thickness and heat accumulation, the thin-wall created by LMD is easy to deform if the fabrication process cannot be precisely controlled. Therefore, based on the different structure feature of targeted thin-wall, the optimization of LMD process of thin-wall should be conducted to modify the heat history during the fabrication process and then obtain a high-quality thin-wall with superior mechanical properties. The capability and challenges of LMD on fabrication and repairing of thin-wall parts has drawn researchers’ much attention. Therefore, based on the simulation of temperature field, law of energy conservation, law of mass conservation, and process experiments, some investigation about the effect of fabrication process on the surface quality, microstructures, microhardness, tensile properties, and residual stress have been conducted. The deposited material refers to Fe-based alloy, Ni-based alloy, titanium and so on. Table 1 provides a summary of some common materials that have been investigated for the fabrication and repairing of thin-wall by LMD. In addition, the used parameters including laser power, powder feed rate, scanning speed, and z-increment, which are the most influential factors for the deposition of LMD, also are presented in Table 1. This article provides an overview of the macroscopic and microstructural features of metal thin-wall deposited by LMD.

2. Surface Quality and Dimension Precision

Owing to the existing of multitudinous parameters during the LMD process, the successfully optimization of parameters is different to accomplish. The interactional relationships between the input parameters, such as laser power, scanning speed, powder feed rate, defocusing, and z-increment, as well as the deposition results, such as size, precision, and shape of deposited parts still lack for a comprehensive experimental and theoretical outstanding [60,61]. In particular, the laser power, scanning speed, and powder feed rate were regarded as the three-main parameters to affecting the LMD process. Lu indicated that increasing the laser power without over-burning could reduce the adhesion of powder, surface waviness, surface roughness, and then improve the surface quality. It can be explained by the increase of temperature of the molten pool, which was beneficial to increase the flow rate of the molten pool and melt the powder. Moreover, the increased of laser power contributed to the remelting of the former layer and reduced the surface waviness. In addition, the increase of scanning speed and decrease of powder feed rate contributed to the declination of surface waviness and surface roughness because the small deposition thickness and contact angle could be obtained [45].
In the deposition process of thin-wall, which possesses the features of single-track and multi-layers, the effect of geometrical feature of the former layer on the deposition of latter layer is easier to show up than the deposition of multi-track. The unsuitable parameters would result in corrugated surface and even shutoff of thin-wall deposition process [62]. Finally, the fact, that whether the parameter is suitable or not, can be reflected by the matching relation between the single deposition height and z-increment of laser cladding head. In the ideal case, the z-increment should be equal to the single deposition height to assure the constant defocusing and single deposition height. However, owing the existing the fluctuation and instantaneous defects, the matching relation cannot be ideally assured that has been proved extremely detrimental to the surface quality and precision of thin-wall parts [63,64]. The effect of matching of z-increment and single deposition height on the fabrication of thin-wall is analyzed in the follow section.

2.1. Matching of Z-Increment and Single Deposition Height

In addition to the laser power, powder feed rate, and scanning speed, the z-increment is also an important parameter for the deposition of thin-wall parts, and it has significant influence on the surface roughness, dimension precision, and surface oxidation that was proved by researchers [32,65]. With the different z-increment, the thin-wall presents various contours during another parameter is same. The contours of thin-wall are mainly related to the matching relationship between the z-increment and single deposition height.
As shown in Figure 1a, both the powder convergence point and laser focus point overlap. During the focus points exactly are seated on the deposition surface, the powder utilization, the power density, and the deposition efficiency are biggest. During the focus points are below or above the deposition surface, the decrease of powder utilization and power density result in the reduction of deposition height. As shown in Figure 1b, during the z-increment is smaller than the single deposition height, at the beginning of deposition process, the thin-wall is deposited rapidly with a single deposition height, which is bigger than the z-increment, because the sufficient powder can be captured by the molten pool. However, the deposited surface, in which the molten pool exists, would shift to the position which is above the focus points of laser and powder. The minus defocusing appeared in the subsequent deposition process. Owing to the passive defocusing, powder captured by the molten pool decreases that leads to the reduction of the deposition height of latter layer. With the reduction of single deposition height, the minus defocusing, f1, decreases in the deposition process of latter layer that contributes to the increase of single deposition height. Similar process repeated during the deposition process. Thus, so-called self-regulation-effect presents. During the z-increment is smaller than the single deposition height, the self-regulation-effect can ensure the molten pool to capture sufficient powder and create a deposition layer. However, during the z-increment is extremely smaller than the single deposition height, the minus defocus is big that results in the significantly decreased powder utilization and depositing efficiency. As shown in Figure 1c, during the z-increment is bigger than the single deposition height, the positive defocusing, f2, presents that results in the decrease of captured powder by molten pool and then the deposition height. The decreased deposition height leads to the increase of positive defocusing that makes the further decrease of deposition height. Similar interactional effect repeats that would result in gradually increase of positive defocusing, insufficient powder captured by molten pool and failure in deposition of thin-wall finally. As reported in the research work by Bi et al., in which the 316L thin-wall parts were fabricated with 120 layers and different z-increment, the height of fabricated thin-wall with the z-increment of 0.05 mm was obvious lower than that by z-increment of 0.15 mm which was much closer to the single deposition height. However, the surface of deposited thin-wall still showed flat and smooth as shown in Figure 2a. During the z-increment was 0.25 mm, the surface of deposited thin-wall showed strong fluctuation and pool surface quality as shown in Figure 2b [32].
However, during the laser focus point and powder convergence point present noncoincidence, the condition would change. For example, Zhu et al. fabricated 316L thin-wall parts used LMD and investigated the relative position between the laser focus point, powder convergence point, and substrate. Table 2 shows the maximum values of 316L thin-walled parts’ top surface unevenness measured with different laser and powder defocusing distances. The results shown that the maximum surface unevenness was 0.325 mm and 0.702 mm during the powder defocusing distance was −1 mm and laser focus distance was −3 mm, respectively. The fact indicated that a high surface quality was obtained during the powder converged below the substrate and laser focused above the substrate. In addition, compared to the influence of laser focus position, the variation of distance between the powder convergence point and substrate played a leading role in the influence on the surface quality. Finally, with the powder and laser defocusing distance of −1 and +3 mm, respectively, a thin-walled blade sample with the maximum surface unevenness of 0.242 mm were deposited. The high quality surface of thin-walled sample indicated the compensated mechanism by the self-regulation effect [33].

2.2. Thin-Wall with Complex Structures

In addition to the rectangular thin-wall which was common in most studies, the thin-wall parts with more complex structures were also investigated. As shown in Figure 3a, Zhang optimized the process parameters of 316L deposition by LMD and fabricated the complex polygon, rotary blade, and acronymic emblem thin-wall [14]. Aiming at the circumferentially inclined thin-walled cylinders, Sun et al. obtained the relationship between inclination angle and circumferential offset by developing the model. They also pointed out that the 316L inclined thin-wall can be fabricated with high quality during the z-increment is 0.224 mm, the offset angle is 0.75° and the inclination angle is 25.95° [35]. Li proposed a method of fractal stratification and fabricated flat-top 316L thin-wall on a special-shaped substrate as shown in Figure 3b. Based on the segmented variable speed and segmented deposited height, the flat-top thin-wall parts with the size error of 8% were created. Based on the relationship between z-increment and deposition height as well as the self-regulation effect [66]. Wang et al. proposed three-dimensional deposition way, in which the z-increment was different at the different point in single deposition layer, and analyzed the effect of parallel and three-dimensional deposition way on the mechanical properties [26]. Carrol et al. deposited Ti-6Al-4V cruciform thin-wall to investigate the anisotropic tensile behavior [67]. Tian et al. fabricated 316L hollow thin-walled cylinder with high forming quality and shape accuracy by using the optimized z-increment of 0.224 mm [38]. In order to solving the problem of variable width forming, Zhang et al. proposed a variable width method and obtained the Inconel 718 thin-wall with variable width and same height through changing the overlapping rate and the scanning speed as shown in Figure 3d [52]. Li et al. investigated the scanning strategy for the fabrication of ring-shaped thin-wall and confirmed the laser changing-point as the better scanning strategy. As shown in Figure 3e, Wang fabricated the 316L thin-walled overhang structure with the reciprocating deposition way in which the collapsed ends can be prevented owing to the compensation of height caused by the periodical change between the start and end side. Finally, they obtained the maximum angle of inclination (θ) was 32.9° based on the optimization of z-increment [68].

3. Microstructures

3.1. Grain Size

As shown in Figure 4a, the microstructures of thin-wall created by LMD are affected by the solidification rate of molten pool, the ratio of cooling rate to thermal gradient (R), and the temperature gradient at the solid liquid interface (G). The solid-liquid interface shape is determined by the G/R and the grain size is affected by the cooling rate which is represent by G × R [8,9,69,70]. Based on the microstructures’ characteristics, thin-wall can be divided into three regions which names the upper, middle, and bottom region. In the bottom region which is near the interface zone between the deposition layer and substrate, the amount of G/R is very high that contributes to the growth of solid-liquid interface at a low-speed flat interface and the occurrence of cellular and even the planar crystal [46,71]. With the continuous of LMD process, the decrease of G/R contributes to the occurrence of columnar dendritic crystals which present in the middle region of thin-wall. In addition, the orientation of heat transfer is from the upper to the bottom of the thin-wall that results in the columnar grains growth along the perpendicular direction to the substrate. With the progression of LMD process, which is accompanied with the heat accumulation, the decreased G/R results in the formation of equiaxed crystal in the upper region of thin-wall [72,73].
For example, Xue et al. pointed out that the sub-grain size of the bottom, middle, and upper region of the CrCoNi medium-entropy alloy thin-wall was gradually increased owing to the decreased temperature gradient and then the cooling rate [58]. Bi et al. fabricated 316L thin-wall with a 0.15 mm z-increment and 120 layers. The microstructure of deposited thin-wall presented a mixture of cellular and dendrite structures. The bottom region, which had bigger cooling rate and better cooling conditions, showed smaller gain size and the microstructure near the edge was coarser because of the higher temperature and lower cooling rate [32]. Yu et al. fabricated Fe 105 steel thin-wall on the 45# steel and observed the epitaxial growth of columnar crystal inversing the heat flow direction. With the height increased, the crystal gradually changed from a single thick columnar crystal to a small cross-dendrite and tiny equiaxed crystals in the middle of deposition layers. The microstructure of the top region presented the denser and smaller equiaxed [49]. Zhao et al. processed Al-4.55Mg-0.51Mn-0.65Sc-0.30Zr alloy thin-wall and observed the equiaxed 3~5 and 8~10 μm sized grains near the bottom as well as the columnar 15~20 μm sized grains in the middle of deposition [59]. As shown in Figure 4b, the images of microstructure of IN625 thin-wall provided by Kim et al. showed that the column grain near the bottom region, where possessed the high thermal gradient in heat transfer, transformed to large equiaxed grain with the grain size of 5 μm in the middle region and then small equiaxed grain with the grain size of 2 μm in the upper region of thin-wall, where most of the heat was transferred by conduction [74]. The similar results were reported by Cao et al. in their study where the microstructure of IN625 deposition present the cellular grains near the bottom region, columnar grains near the middle region, and equiaxed grains near the top region [73]. Liu fabricated IN718 thin-wall, whose microstructure mainly consisted of γ columnar dendrites and small amount of (γ + Laves) eutectics in the interdendritic areas, and measured the primary dendrite arm space which can reflected the grain size. The results showed the primary dendrite arm space increased from 11.5 to 38 μm with the measured region changed from bottom to upper region of thin-wall [53].
In addition, there are some other factors, such as different region along the parallel direction, thickness of thin-wall, and particle size, affecting the grain size of the thin-wall. Owing to the edge effect, which is means the higher temperature gradient near the edge region and lower temperature gradient in the middle region of thin-wall part [75]. That was also verified by the research of Wang et al. in which 316L thin-wall parts with the height of 60 mm were fabricated. The microstructure showed smaller grain size near the edge regions compared to that in the middle region [37]. Karczewski et al. deposited box-like Fe-16Al (wt%) thin-wall with different thickness. The average grain size of thin-wall was about 200, 200~300, 200~800 μm during the thickness was 0.5, 1, 2, and 5 mm, respectively, that also was verified by other researcher [76]. In addition, the thicker thin-wall possessed B2-type structure owing to the higher cooling rate. however, the thin-wall with the thickness of 0.5 mm presented DO3-type structure because of the low cooling rate [46]. By observation of transverse and longitudinal cross-section of WC/Ni thin-wall with the height of 5.7 mm and thickness of 1.7 mm, Huang pointed out that the uniform thickness demonstrate that the interface remelted and created metallurgical bonding between adjacent layers in the multi-layer LMD process. They also emphasized that modulation of particle size was significant for sake of controlling and designing the ideal microstructures [77]. Furthermore, in order to obtain the refined microstructure of thin-wall, auxiliary methods, such as ultrasonic vibration (UV), magnetic field, and electric -magnetic coupled field, were chosen to modify the microstructure [78,79,80,81]. Liu et al. deposited the Fe 60 on the Q 235 steel with the auxiliary of rotating magnetic field and obtained smaller grain size compared to that without the magnetic field owing to the existing of electromagnetic stirring which contributed to the breaking of columnar crystal and creating of crystal nucleus [79]. Gatzen et al. conducted the deposition of AlSi18 with the auxiliary of electric -magnetic coupled field and pointed out that the increase of current can intensify the convection of molten pool and promote the peritectic reaction [80]. Ning deposited 17-4PH Fe-Cr stainless steel on the low carbon steel by ultrasonic vibration-assisted LMD. The columnar grain structure with an average size of about 7~11 μm was observed inside the deposition fabricated without UV. However, the deposition fabricated with UV presented equiaxed grain with smaller size of about 1.5~3 μm that attributed to the actions of acoustic streaming and cavitation induced by UV [81].

3.2. Growth of Columnar

The long columnar sun-grains of the thin-wall grew along the height direction and passed through multiple deposition layers that attributed to the epitaxial mechanism. During the LMD process of thin-wall, the partial melting of substrate grains, the melting of molten pool, and the semi-melted grains averted the nucleation barrier and directly nucleate on the bonding surface that induced the sub-grains to grow along the original direction of the semi-melted grains. However, the inclined angle of long columnar sub-grains to the vertical direction was affected by the scanning direction because the scanning strategy can provide a certain temperature gradient in the parallel direction [39,82,83]. As shown in Figure 5a where CrCoNi medium-entropy alloy thin-wall was fabricated, the angle of growth direction of sub-grains and vertical direction kept constant owing to the same scanning direction which caused the maximum heat dissipation direction and temperature gradient direction to be along the same direction [58]. As shown in Figure 5b where the IN718 thin-wall was fabricated by continuous wave laser, during the bidirectional scanning direction was used, the angle of growth direction of columnar grains and vertical direction, which was about 60°~80°, presented periodical variation. However, as shown in Figure 5c, during the quasi-continuous-wave laser with the pulse frequency of 100 Hz was used, the normal of growth direction of columnar grains in each layer is about 45° to the scanning direction that resulted in the almost vertical angle of growth direction between two adjacent layers. Therefore, the highly oriented “zigzag” columnar grains were obtained [54].
In the molten pool created during the LMD process, the crystal growth and microstructure formation are determined by the solidification conditions of the advancing solidification interface. The sufficient extent of constitutional supercooling (CS) contributes to the growth of equiaxed grains ahead of the solidification interface. The ratio of G / V , where G is the thermal gradient and V is solidification velocity, can describe the extent of CS. A lower G / V conduces to the increased extent of CS that results in greater capability of equiaxed grains formation. When the G n / V , where n is a material-dependent constant, exceeds a critical value which is represented by KCET, the columnar structure can be obtained. As shown in Figure 6, along the solidification interface in the longitudinal section of Rene N5 deposition created by Liu, the ratio of | G 001 | 3.4 / | V 001 | decreased from the bottom to the top of the molten pool trailing edge. However, the ratio of | G 100 | 3.4 / | V 100 | presented an opposite trend. As shown in Figure 6c, at the top of solidification interface, the | G 100 | 3.4 / | V 100 | had a maximum value and | G 001 | 3.4 / | V 001 | presented the minimum value, while at the bottom of solidification interface, | G 001 | 3.4 / | V 001 | achieved the maximum value and | G 100 | 3.4 / | V 100 | had a minimum value. In addition, the ratio of | G 001 | 3.4 / | V 001 | is much bigger than the ratio of | G 100 | 3.4 / | V 100 | . This indicated that in the longitudinal direction, the (100)/[100] crystallographic orientation is less competitive than the (001)/[100] crystallographic orientation which naturally acted as the epitaxial growth direction of the columnar dendrite trunk. The results of | G 001 | 3.4 / | V 001 | and | G 010 | 3.4 / | V 010 | in the transverse section presented the similar relationships which implied that the (010)/[100] crystallographic orientation is less competitive than the (001)/[100] crystallographic orientation which naturally acted as the epitaxial growth direction of the columnar dendrite [84]. Chen observed the increased amount of stray grains during the angle between the dendrite growth direction and thermal gradient direction (β) was close to 45° because of the similar solidification condition in the [001] and [100] direction that contributed to the dendrites grow along both direction. The competitive growth of these two preferred orientations also conduced to the occurrence of columnar-to-equiaxed transition in the dendrite intersection area. However, when the angle β was less than 30° or more than 60°, no obvious stray grain was observed [85]. Fu et al. pointed out that in the deposition of Ti-6Al-4V thin-wall, columnar β-grains possessed the preferential growth in the direction of [100] which was paralleled with the maximum G direction. Compared to the initial two layers, the competitive growth reduced the number of columnar β-grains and increased the sizes in the low regions of thin-wall. With the progress of deposition process, the decrease of dissipation rate and increase of heat accumulation resulted in the reduction of G gradually. In the middle region of thin-wall, the length of columnar β-grains decreased, and the nucleation events increased before the solid/liquid interface that also conduced to the occurrence of a small amount of equiaxed grains. Finally, the equiaxed grains were observed In the upper regions because of the further decreased of G [86].

4. Microhardness

4.1. Effect of Grain Size and Phases

Microhardness, which is recognized as an important indicator to evaluate the mechanical properties, is determined by the microstructure and composition. The decrease of grain size conduces to the improvement of microhardness. The small grain size contributes to the increase of microhardness that also can be indicated by the Hall-Petch formula which is as follows [46,87]:
H v = H 0 + k H d 1 / 2
where H v represents the hardness, H 0 and k H represents the constants which are related to the hardness, and d represents the average grain size. The grain size is closely related to the cooling rate of molten pool during the LMD process. The cooling rate is affected by the process parameters, the different region of thin-wall, and the dimensions of thin-wall part. Liu also pointed that the microhardness in the upper region was slightly lower than that in the middle region of thin-wall because the upper region formed oxide affected by the air and the middle region formed a denser and fine crystal structure [47]. The microhardness of CrCoNi medium-entropy alloy thin-wall fabricated by Xue et al. presented gradually decrease from the bottom region with the value of 245.6 HV to the upper region with the value of 179.6 HV [58]. Karczewski et al. pointed out that the microhardness of deposited box-like Fe-16Al (wt%) thin-wall was affected by the thickness of thin-wall. The results shown that the microhardness was about 337 ± 13, 333 ± 15, 371 ± 18, 381 ± 17 HV during the thickness was 0.5, 1, 2, and 5 mm, respectively. The increase of thickness increase the cooling rate, the grain size, and then the microhardness [46].
The formation of strengthening structure and hardening phase also contribute to the improvement of hardness. Li deposited the IN718 superslloy and indicated that the hardness in the bottom, middle, and top region were 385, 381, and 298 HV, respectively. The improvement of hardness in the bottom and middle region attributed to the precipitation of γ″ and γ′ phase [88]. The IN718 thin-wall deposited by Xu et al. also presented higher hardness in the bottom region compared on the middle and top region that was ascribed to the enhanced precipitation hardening caused by reiterated thermal cycles. In the bottom region, the partial dissolution of Laves phases provided free Nb atoms which can diffuse into t he matrix and accelerate γ″ precipitation in the inter-dendritic region [89]. Xiang et al. used the pulsed LMD to deposited the CoNiTi medium-entropy alloy and obtained the high hardenss with the value of 571 ± 46 HV which was about five times of the hardness in the substrate (114 ± 4 HV) that contributed to the formation of solid-solution hardening BCC phase and second-phase hardening from the Ti2Ti and Ti2Co type intermetallic compounds [90].

4.2. Distribution of Microhardness

With the increase of the height of thin-wall, the heat accumulation aggravates and the influence of thermal history on the microhardness become complex that result in the various of microhardness in the different region of thin-wall part. In the vertical direction of the thin-wall, the microhardness distribution can be explained as follows. In the deposition process of thin-wall where the scanning path is single-track and multi-layer, the top surface of former deposited layer is remelted and the whole former layers is reheated that results in the occurrence of different regions in the former layer. Huang et al. divided the former layers into four regions including remelted region, semisolid region, secondary quenching region and tempering region. The remelted and semisolid region were accompanied with the repaid melting and solidification process. The solidification of semisolid region contributed to the crystallization of coarse grains. The remelted region, which was integrated with the latter layer, provided platform for the coarse grain to grow that resulted in the appearance of coarse grain zone at the interface between the adjacent layers. As shown in Figure 7a, the troughs in the curve represented the coarse regions of the interface as a result of remelting and reheating. The secondary quenching region, which is the quenching region in the former layer deposition process, underwent secondary quenching that led to the increase of microhardness. Owing to the long distance to the top surface, the bottom region of the former layer suffered low reheating temperature and underwent tempering that attributed to the insufficient quantity of heat which is transmitted from new deposited layer. The results indicated that the microhardness distribution across the longitudinal section of WC/Ni thin-wall with the height of 6 mm presented a periodical fluctional, as shown in Figure 7a, that attributed to the remelting and reheating during the deposition of latter layer and then the variation of the grain size [77]. The periodical fluctuation of the hardness with the increase of height also was indicated in the work reported by Wang et al. as shown in Figure 7d. In addition, the hardness near the edge region presented higher than that in the middle region because of the finer grains near the edge region [37]. Zhang et al. observed the similar rules of hardness in the SS410 thin-wall part with the height of 20 mm. They indicated that the interface between the substrate and deposition presented the maximum harness with the value of 350 HV because of the existing of ferrite and retained austenite. During the height was above 2 mm, the harness decreased suddenly to 200 HV and then kept consistent in the deposition where the microstructure manly consisted of ferrite [40].
However, the microhardness distribution of thin-wall with great height in the perpendicular direction would present different rules. Wang fabricated 316L slope thin-wall part with three-dimensional and parallel deposition way. The height of deposited thin-wall part exceeded 50 mm. It was worth noting that the microhardness increased initially and then decreased with the increase of distance to the interface between the deposition and substrate. The maximum value of hardness presented at the distance of about 25 mm to the interface. Wang pointed out that the tempering, which was harmful for the hardness, played a dominant role in affecting the hardness distribution in the perpendicular direction as shown in Figure 7b. During the height was lower than 25 mm, the heat was effectively transferred by the substrate and the inputted heat was insufficient to warm the former layers that resulted in the highlight of the tempering effect of latter deposition process on the former layer high. Thus, the hardness increased with the distance to the interface increased during the distance was lower than 25 mm. However, during the height exceeded 25 mm, the temperature of former layer became high owing to the heat accumulation that led to the tempering of former layers on the latter layers dominated the process. Thus, the hardness decreased with the increase of distance to the interface during the height exceeded 25 mm [26].
In addition, the hardness distribution along the parallel direction was relatively uniform because of the similar conditions and grain size. However, the hardness of edge and middle of the thin-wall always presented slight different owing to the slight different temperature gradient. It was worthy to notice that the hardness distribution of slope thin-wall along the parallel direction was significantly different as shown in Figure 7c. Owing to the more inputted heat and longer heating time, the high side of slope thin-wall with parallel deposition way suffered from obvious temping effect that resulted in the maximum hardness near the low side. In the case of three-dimensional deposition way as shown in Figure 3c, the maximum hardness presented near the high side that attributed to the identical inputted heat along the surface of slope thin-wall and higher cooling rate caused by the bigger height and deposition volume near the high side [26].

5. Tensile Properties

5.1. Effect of Grain Size

The indicator of tensile properties always consists of the yield strength, ultimate tensile strength, and elongation. The grain size is a factor to affect the yield strength that can be expressed by the Hall-Petch relation [91]:
σ y = σ 0 + k / d 1 / 2
where σ y is the yield strength, d is the grain size, σ 0 and k are the constants related to the materials. The decrease of the grain size can increase the yield strength. The finer grains can bring higher grain boundaries and dislocation density that contributes to the strengthening of the materials by hindering the movement of the dislocations. Owing to the generation of refined dendrites in the thin-wall fabricated by the LMD process in which the cooling rate of molten pool was high, the LMD-ed thin-wall possessed higher tensile strength compared to the conventional machining ones. However, the elongation presented contrary law. The one reason for the lower elongation was the occurrence of atmospheric oxidation caused by the LMD process without the vacuum environment of glove box [14]. For instance, the yield strength, ultimate tensile strength, and elongation of the CrCoNi medium-entropy alloy thin-wall in the vertical direction showed higher than that in the parallel direction because of the smaller grain size [58]. Compared to the cast samples as shown in Table 3, the yield strength and ultimate tensile strength of the thin-wall fabricated by LMD increased about 39.5%~100%. However, the elongation showed approximately with that by the casting process [58,92,93].

5.2. Effect of Phases

In the deposition process of thin-wall, the average temperature inside of deposition and the duration time of the high temperature range will be increased compared to the single-track deposition process. Therefore, the intense thermal cycling effects may conduce the temperature to rise to the phase transition point or even induce solid phase transition that will eventually affects the tensile properties of thin-wall. In the investigation of anisotropic tensile behavior of deposited Ti-6Al-4V cruciform thin-wall reported by Carroll et al., the prior-β grains have long axes of about 1.5~10 mm along with the vertical direction. The boundaries of prior-β grains were decorated with the grain boundary α phase which conduced to the decrease of elongation by furnishing a preferential path for damage accumulation aligned with the prior-β grain boundaries. Compared to the previous results, the yield and tensile strength of the cruciform thin-wall reduced but still were well above the requirement for cast and wrought of Ti-6Al-4V, as shown in Table 4. They observed little α′ (hcp martensite) in the microstructures. This observation indicated that the cooling rate during the deposition of cruciform thin-wall was above the β transfer of ~1000 °C, while rapid was not sufficient fast to allow the formation of martensite which was generally stronger than α-β microstructures owing to the presence of lattice strains [94]. Thus, the absence of martensite was account for the reduction of yield and tensile strength of cruciform thin-wall [67]. Li pointed out that although the grain size is coarser compared to the SLM process where the improvement of yield strength was mainly determined by the fine grains, the interaction between the precipitation and dislocation induced the IN718 to act as a precipitation strengthened superalloy. They deposited IN718 superalloy and the results of tensile test showed that the yield strength at the bottom, middle, and top region were 745.1 ± 5.2, 752.2 ± 12.1, and 464.7 ± 44.2 MPa, respectively. The results can be explained by the precipitation of strengthening phases (γ″ and γ′) in the bottom and middle region [88]. The ductility of IN718 during the tensile process was investigated by Xu et al. from the angle of Laves phases. They indicated that the granular laves phases had strong coordination and can be retained or directly separated from the γ matrix, while the failure of long-chain Laves phases were mainly in forms of debonding and fragmentation during the tensile process that implied the granular Laves phases presented higher ability of plastic deformation compared to the long-chain Laves phases [89].

5.3. Effect of Loading Direction

The ductile deformation is also related to the grain sliding which is caused by shearing force. Due to the existing of molten pool boundaries (MPBs) caused by overlapping between the molten pools, the fracture preferentially occurs along the boundaries where the bonding force is weaker [13]. In the fabrication of thin-wall where the single-track and multi-layer are deposited, the laser spot is continuous during the scanning of single-track that contributes to the disappearing of MPBs. However, the MPBs caused by the layer-by-layer deposition process are obvious and present perpendicular to the epitaxial growth direction of grains as shown in Figure 8a. Figure 8b illustrates the different relationship between the shearing force and tensile loading direction. The shearing force along the direction of grain sliding (τ) can be expressed as:
τ = F cos θ F A cos λ = F A cos θ F × cos λ
where F represents the tensile force, θ F represents the angle between the direction of grain sliding and tensile force, λ is the angle between the sliding surface and tensile force, A represents the cross-section area acted by tensile stress. The tensile stress ( F / A ) increases until reaches the yield strength of the material with the increase of tensile force ( F ). Furthermore, the slide would happen after the shearing force exceeds the ultimate value which the sliding surface can sustain that means the occurrence of deformation. Therefore, as shown in Figure 8b, during tensile force is along the vertical direction, the thin-wall present the low tensile strength because the tensile force is approximately parallel to the sliding surface that contributes to the high shearing force and pool ability for hindering the tensile force. However, in the case of tensile test along the parallel direction of thin-wall, the angle between the sliding surface and tensile force is big that results in the small shearing force and high tensile strength [13,26].
Wang et al. fabricated 316L thin-wall with the height of 60 mm as shown in Figure 9a and investigated the ultimate tensile strength and elongation along different loading direction. The results showed that the UTS of the sample 1, 2, and 3, whose loading direction was horizontal, were higher than that of sample 4, 5, and 6, whose loading direction was vertical. The dendritic boundaries of the thin-wall were primarily perpendicular to the scanning path that contributes to the higher UTS during the loading force was parallel to the scanning path because of the effective hindering for the dislocation movement of samples. However, the results of elongation presented contrasting rules [37,95]. Zhang conducted the tensile test of 316 thin-wall along the vertical and parallel directions as shown in Figure 9b and the experimental results were summarized in Table 3. It can be seen that the tensile performance appeared anisotropic with the tensile direction. Compared to the samples tested along the vertical direction where the interlayer bonding places easily become the fracture source, the tensile strengths along the parallel direction with the yield strength of 558 MPa and ultimate tensile strength of 639 MPa were higher. Owing to the dendrites can hold better ductility along the growth orientation, the higher elongation was presented during the vertical loading direction was used that also can be verified by the features of dimples as shown in Figure 9b. The dimples in fracture surface of vertical tensile samples were much deeper and denser that indicated the vertical tensile direction possesses better ductility [14]. As shown in Figure 7c and Figure 9c, the results of tensile test in the investigation of 316L slope thin-wall with the angle θ of 20° reported by X. Wang et al. revealed that the biggest UTS was presented due to the smallest shearing force during the angle between tensile loading direction and horizontal direction (β) was 45°. During the angle β was 90°, the small angle between the direction of tensile loading and sliding surface as well as the high shearing force led to the low UTS [26].

6. Thermal Stress

6.1. Distribution of Thermal Stress

LMD, which is a process accompanied with non-uniform heating and melting, induces extremely uneven temperature distribution around the molten pool that leads to uneven contraction and expansion in different region of the deposition layer and ultimately leads to residual stress and deformation [96]. When the deposition stress exceeds the yield limit, the deformation, which is mainly caused by deposition stress, occurs. During the LMD process, the region acted by the laser beam is rapidly heated and melted, but the temperature of the region, which is far from the laser beam, is low that results in uneven thermal expansion. The metal of laser-active region experiences thermally expanded which is constrained by the surrounding cold material that contributes to the causing of compressive stress in thermal material and tensile stress in cold material. The increase of temperature decreases the yield limit of metal in the laser-active region. As shown in Figure 10b, during the thermal expansion of the deposition is larger than that of substrate, the arch deformation occurs. However, after the laser beam goes away as shown in Figure 10c, the material in the laser-active region shrinks and undergoes tensile stress, but the material in the cold region undergoes compressive stress that results in the occurrence of warping deformation under the influence of shrinkage force [46].
The plastic deformation of the crystalline material was assumed to obey the Von Mises yield criterion and the associated flow rule. The following equation can express the equivalent von Mises stress (EVMS):
σ e = [ ( σ x x σ y y ) 2 + ( σ y y σ z z ) 2 + ( σ z z σ x x ) 2 ] 1 2 2 ( 1 + v )
where v represents the equivalent Poisson’s ratio. The EVMS is a uniaxial random stress that is characterized in frequency domain by a power spectral density, which is calculated as a linear combination of the quto- and cross-spectra of multiaxial random stress. The EVMS can be used to quickly estimate the fatigue damage in frequency domain [97]. It can be seen from the Equation (4) that the EVMS is composed of three principal stresses including the X-directional stress, Y-directional stress, and Z-directional stress [51]. Therefore, in order to estimate the properties of thin-wall by LMD, the different directional stresses of thin-wall have been tested and simulated by many researchers.
The time-dependent temperature distribution plays a significant role in the stress pattern of the thin-wall with four layers fabricated by the LMD process. Owing to the unhandy monitoring of time-dependent temperature, the numerical analysis is a powerful tool. M. Alimardani et al. obtained 3D temperature distribution and stress pattern for any elapsed time during the LMD process of 304L thin-wall by numerical simulation. As shown in Figure 11a,b, the stress concentration presented around the molten pool during the laser beam moved to the middle region. However, as the laser beam arrived at the edge region, the growth of stress concentration can be observed and two regions of concentration, including the region around molten pool and the corner of thin-wall. In addition, with the increase of deposition height, the heat loss by convection/radiation gradually became dominant compared to the heat loss by conduction that contributed to the increase of temperature, volume of molten pool, and then the powder catchment [98]. It was worth to noticed that the thermal stains and stress decreased with the increase of deposition height and the decrease of the temperature gradient. Although the decreased trend of stress presented along the height direction, the maximum stresses still occurred at the edge region of the layers 2~4 [43].
As reported by Wang et al. [37] and Rangaswamy et al. [99], for the Z-directional stress, the tensile stress played the dominant role at the edge region and compress stress was presented at the central region of thin-wall part. For the Y-directional stress, the tensile stress and compress stress were observed at the central and edge region, respectively. The occurrence of tensile stress can be justified that the scanning speed gave less time to material stretched in the Y-direction owing to different cooling rate to recover its position [37,100]. Balichakra investigated the residuals tress of γ-TiAl thin-wall and pointed out that the encountered transient thermal gradients significantly affected the state and magnitude of residual stress. In addition, the compressive stress decreased with the increase of height of deposition in the vertical direction [55].

6.2. Modification of Thermal Stress

Preheating of the substrate is an effective treatment to improve the status of stress distribution and alleviate the deformation. Zhang built Ni 60A thin-wall on the Q235 substrate with the preheating temperature of 200, 300, 400, 500 and 600 °C. They pointed out that the tensile stress along the horizontal direction decreased with the increase of preheating temperature because of the alleviation of the temperature gradient. The preheating of substrate contributed to the volume increasing of deposition owing to the more powder melted into the molten pool. The increase of the preheating temperature caused the increase of volume of deposition, the increase of tensile stress, and more significant contraction of depositions during cooling [50]. However, Alimardani et al. pointed that the thermal stress of 304 thin-wall showed inconspicuous decrease after preheating the substrate to 500 K during the laser power kept constant. However, the maximum thermal stress significantly reduced by preheating the substrate and decreasing the laser power. For instance, compared to the thermal stress induced by the laser power of 300 W and non-preheat treatment of substrate, the maximum stress decreased by 16.7% during the laser power was 250 W and the preheating temperature was 700 K. The maximum stress only presented 3.6% reduction with the same preheating temperature and laser power of 300 W. These results demonstrated that preheating the substrate accompanied with optimizing the laser power can significantly reduce the thermal stress [43].
Using of pulsed laser is another method to modifying the stress pattern of the thin-wall. Wang fabricated the 316L thin-wall with pulsed wave laser (PW) and continuous wave laser (CW). Compared to the CW laser, the pattern of Z-directional stress of thin-wall by PW laser presented opposite trend that the tensile stress was induced in the central region. In addition, the decrease of inputted energy by reducing the pulse time can relieve the tensile stress and even drew forth the compress stress. For the Y-directional stress, the stress showed a periodic variation between the tensile and compress stress that was explained as the effect of duty cycle which is the special feature in pulse laser [37].

7. Conclusions

This review addresses the research status of deposition quality, microstructures, microhardness, tensile properties, and thermal stress of metal thin-wall created by laser material deposition. The main conclusions can be drawn as follows:
(1)
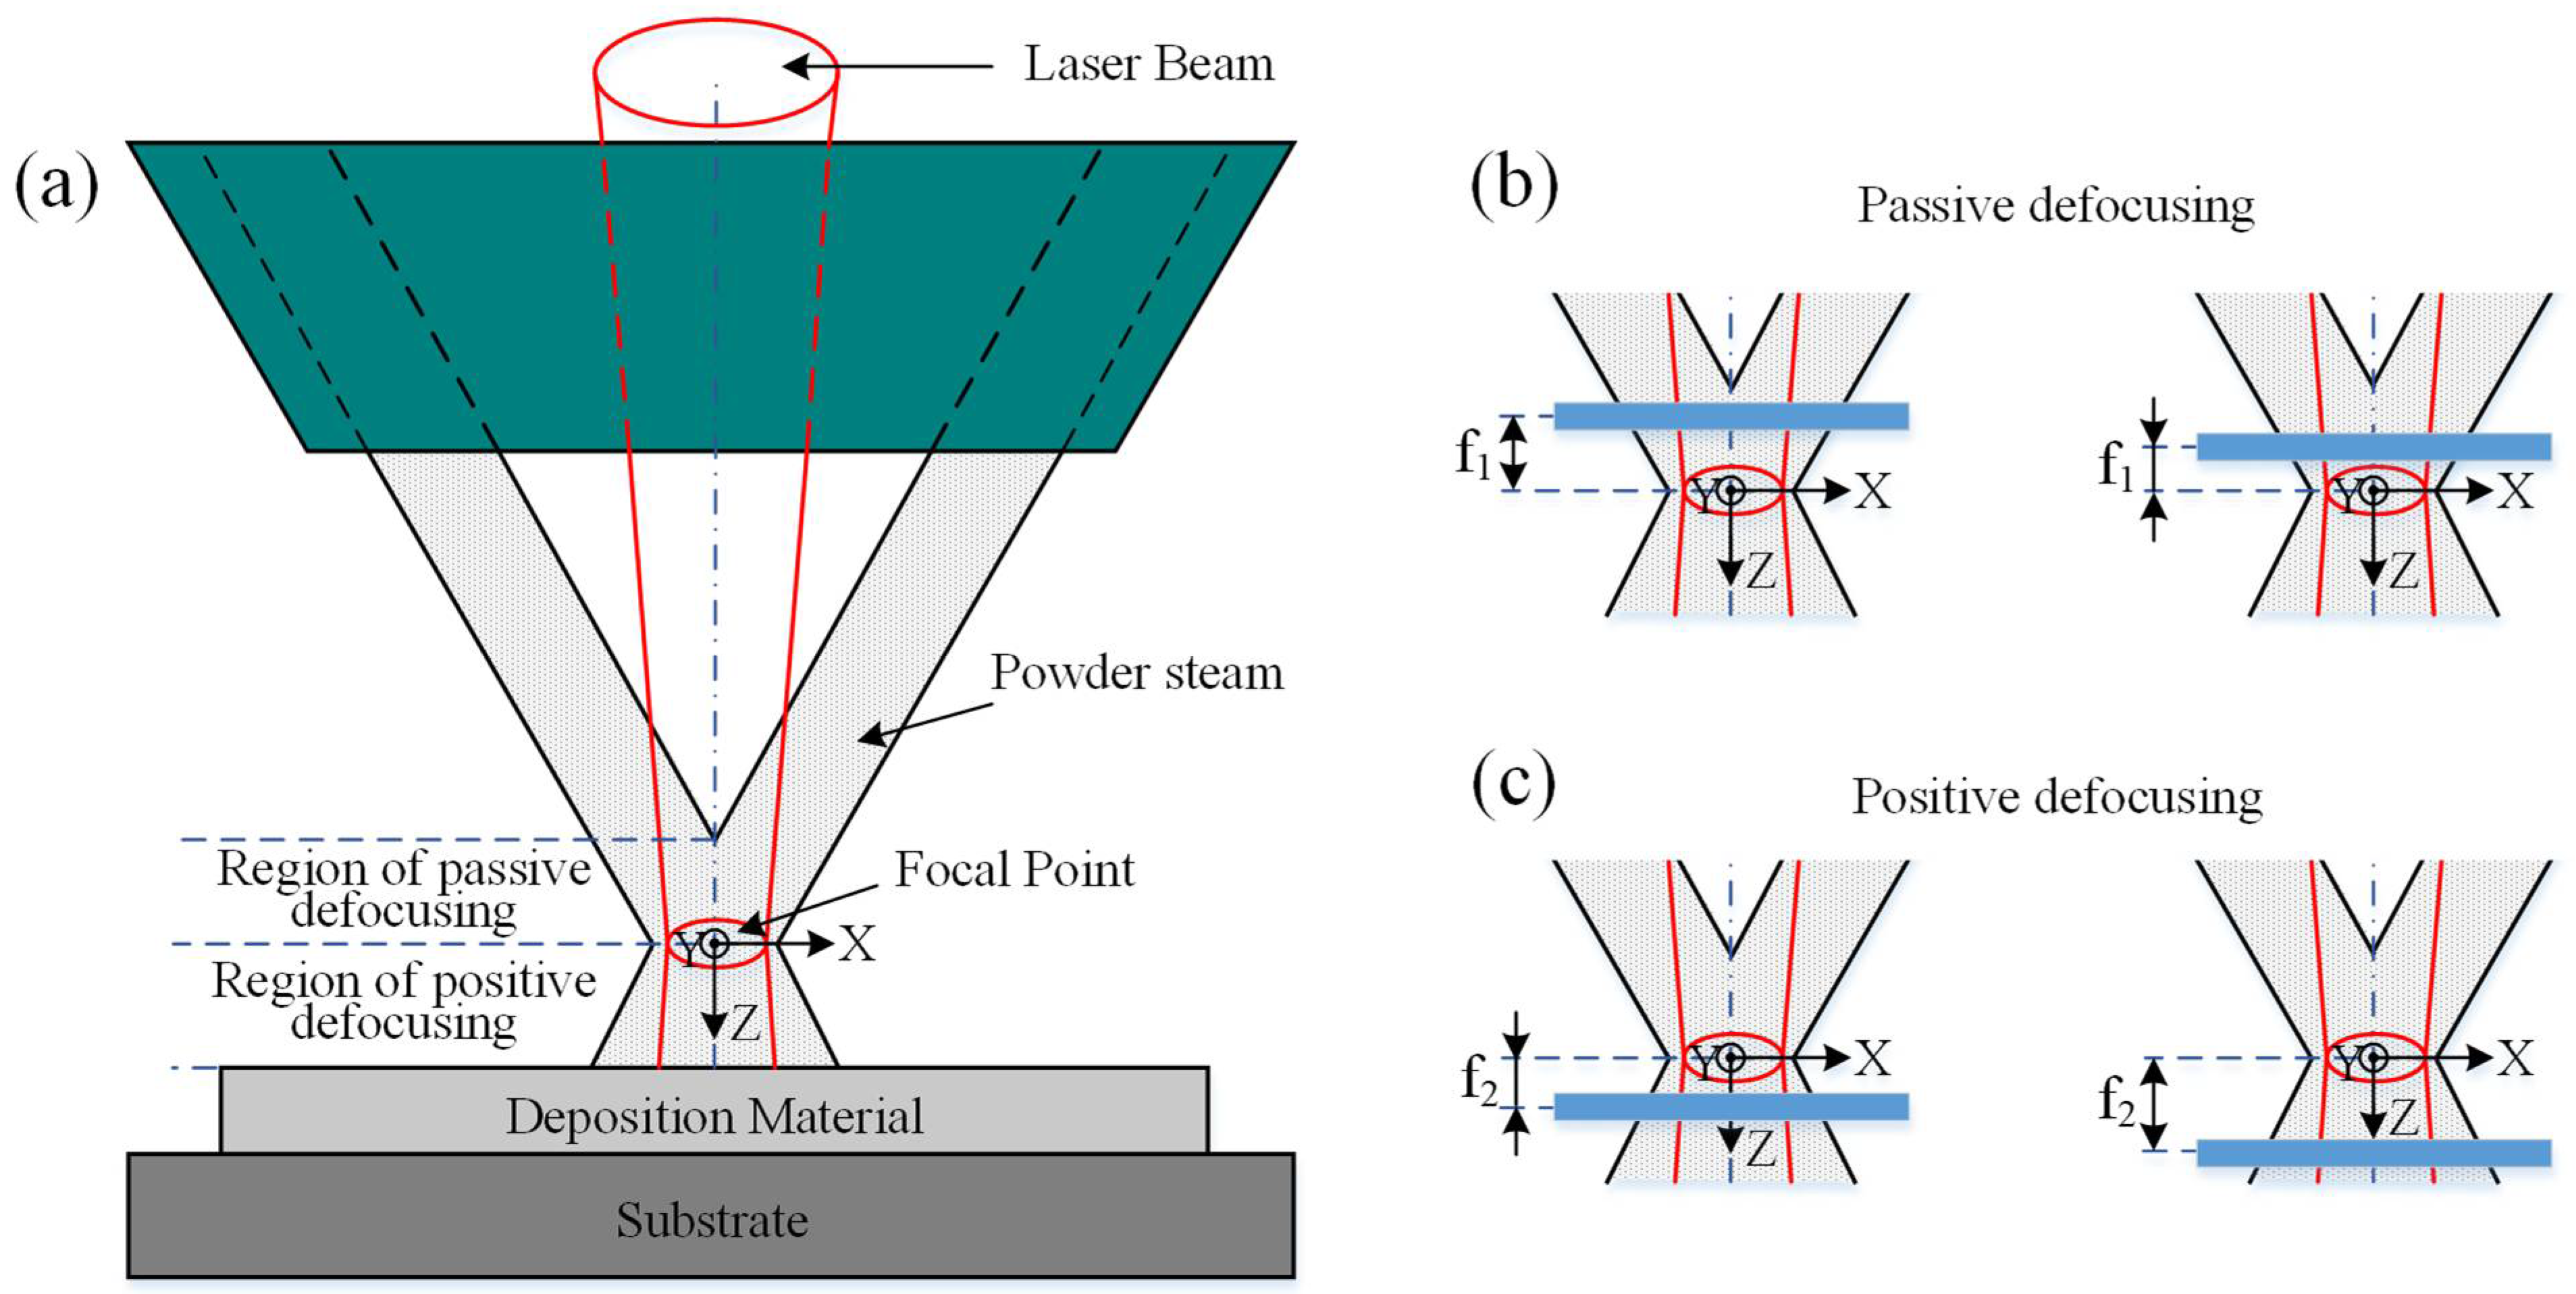
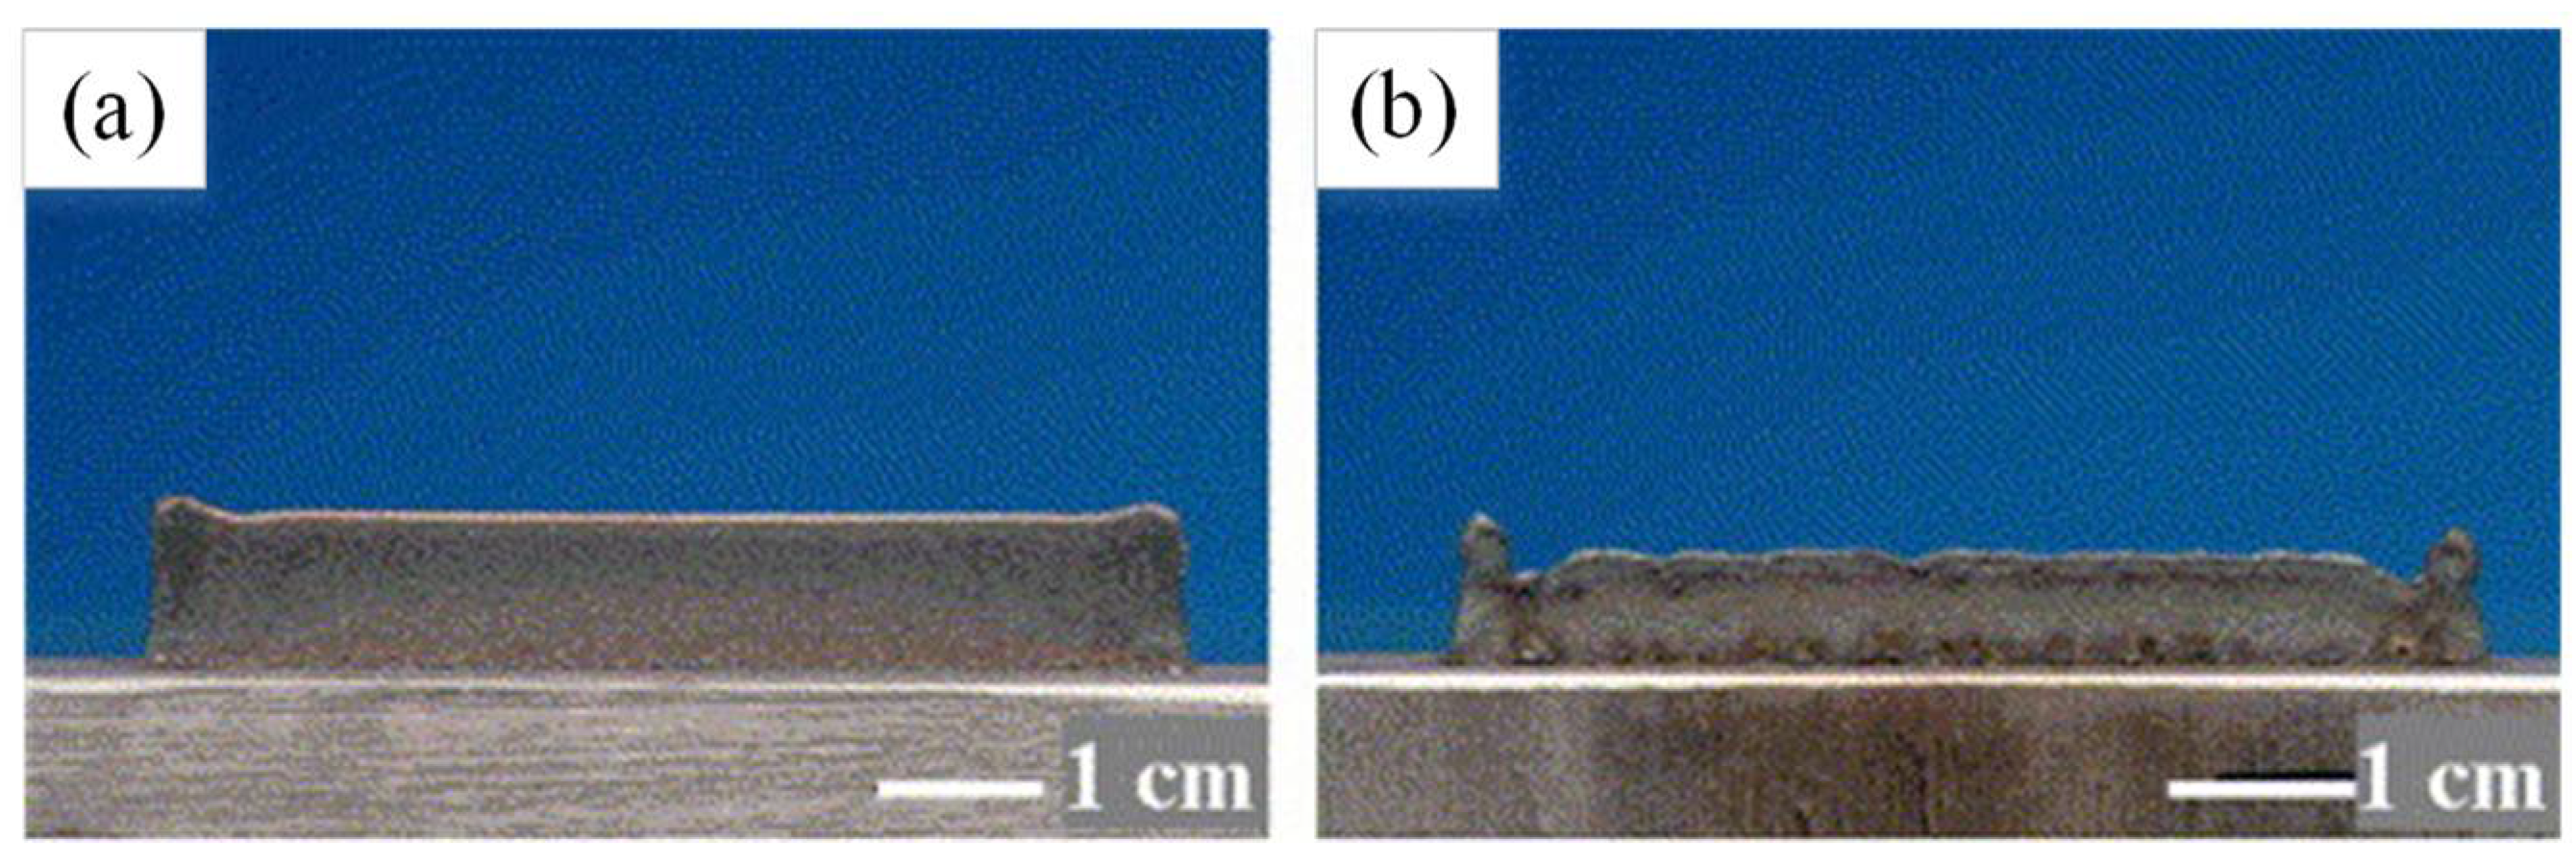
Except for the process parameters, such as laser power, scanning speed, powder feed rate, the matching of z-increment and single deposition height played a significant role in affecting the surface quality and dimension precision. During the z-increment was bigger than the single deposition height, the positive de-focusing could result in gradually insufficient powder captured by molten pool, decrease of single deposition height, and then the failure in deposition of thin-wall finally because of the inter-actional effect. However, during the z-increment was smaller than the deposition height, the self-regulation-effect could assure the molten pool to capture sufficient powder and create a deposition layer. Based on the optimizing of the fabrication process, some thin-wall parts with complex structures, such as inclined thin-walled cylinder, special-shaped bottom thin-wall, slope thin-wall, thin-walled overhang structures and so on, were fabricated with high quality.
(2)
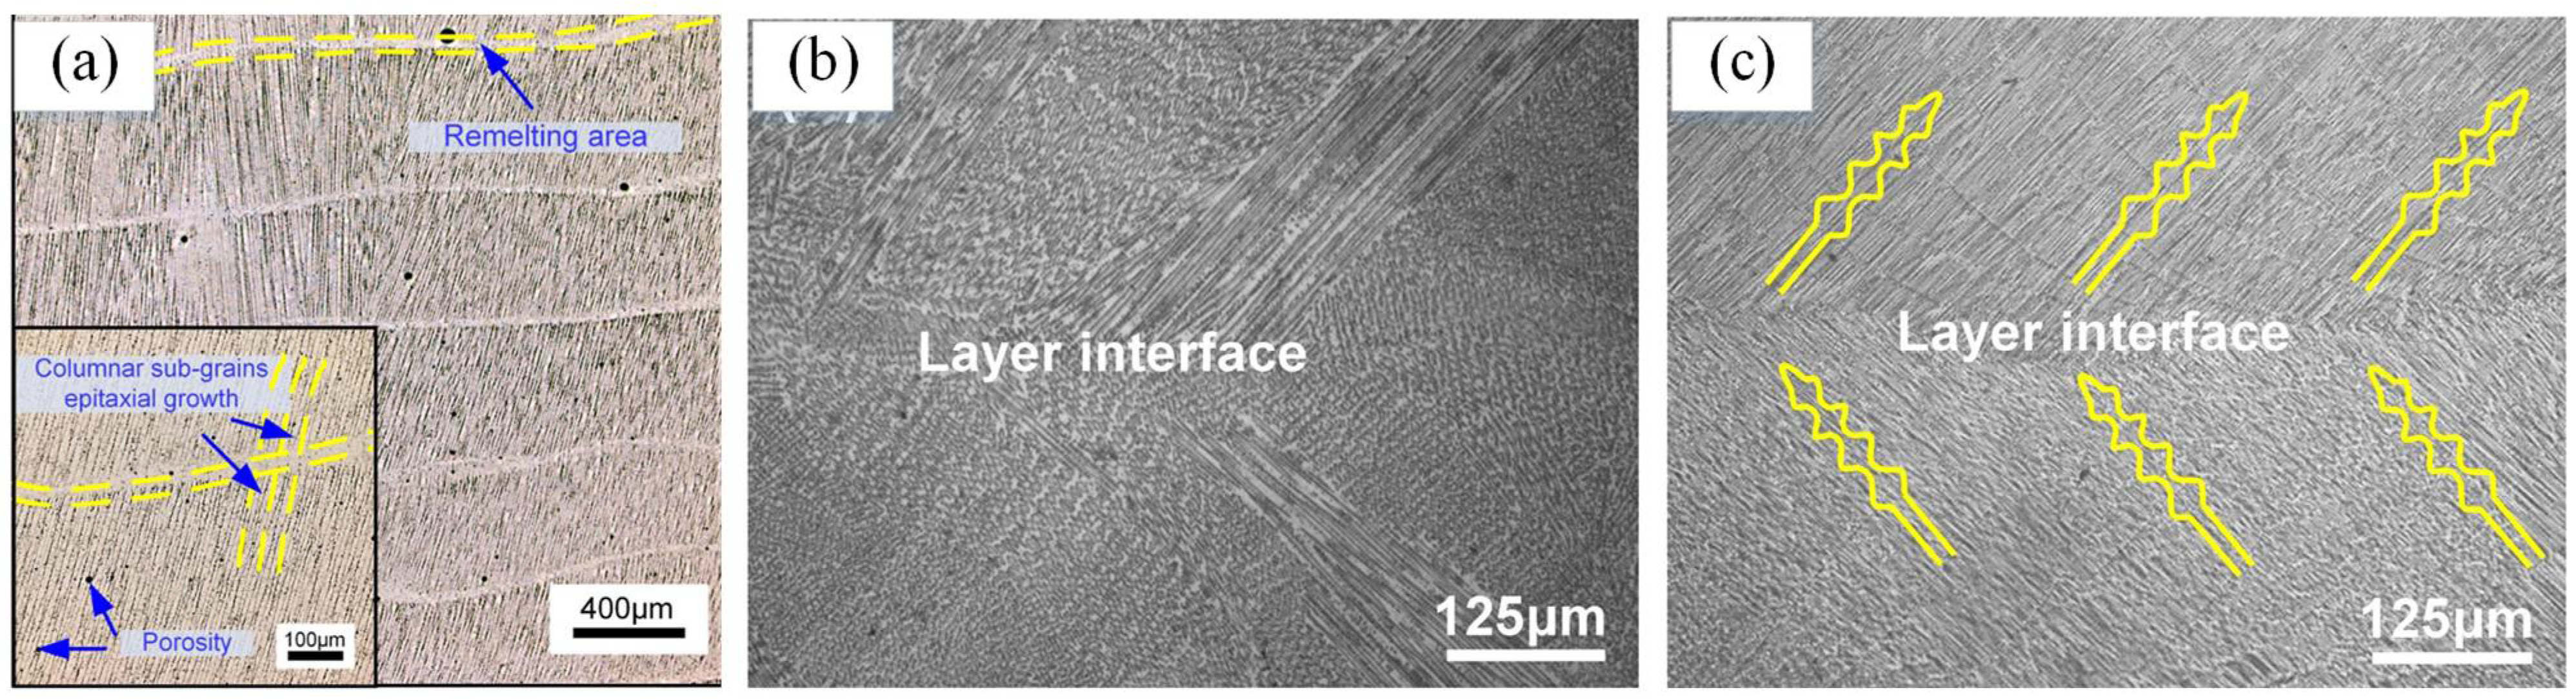
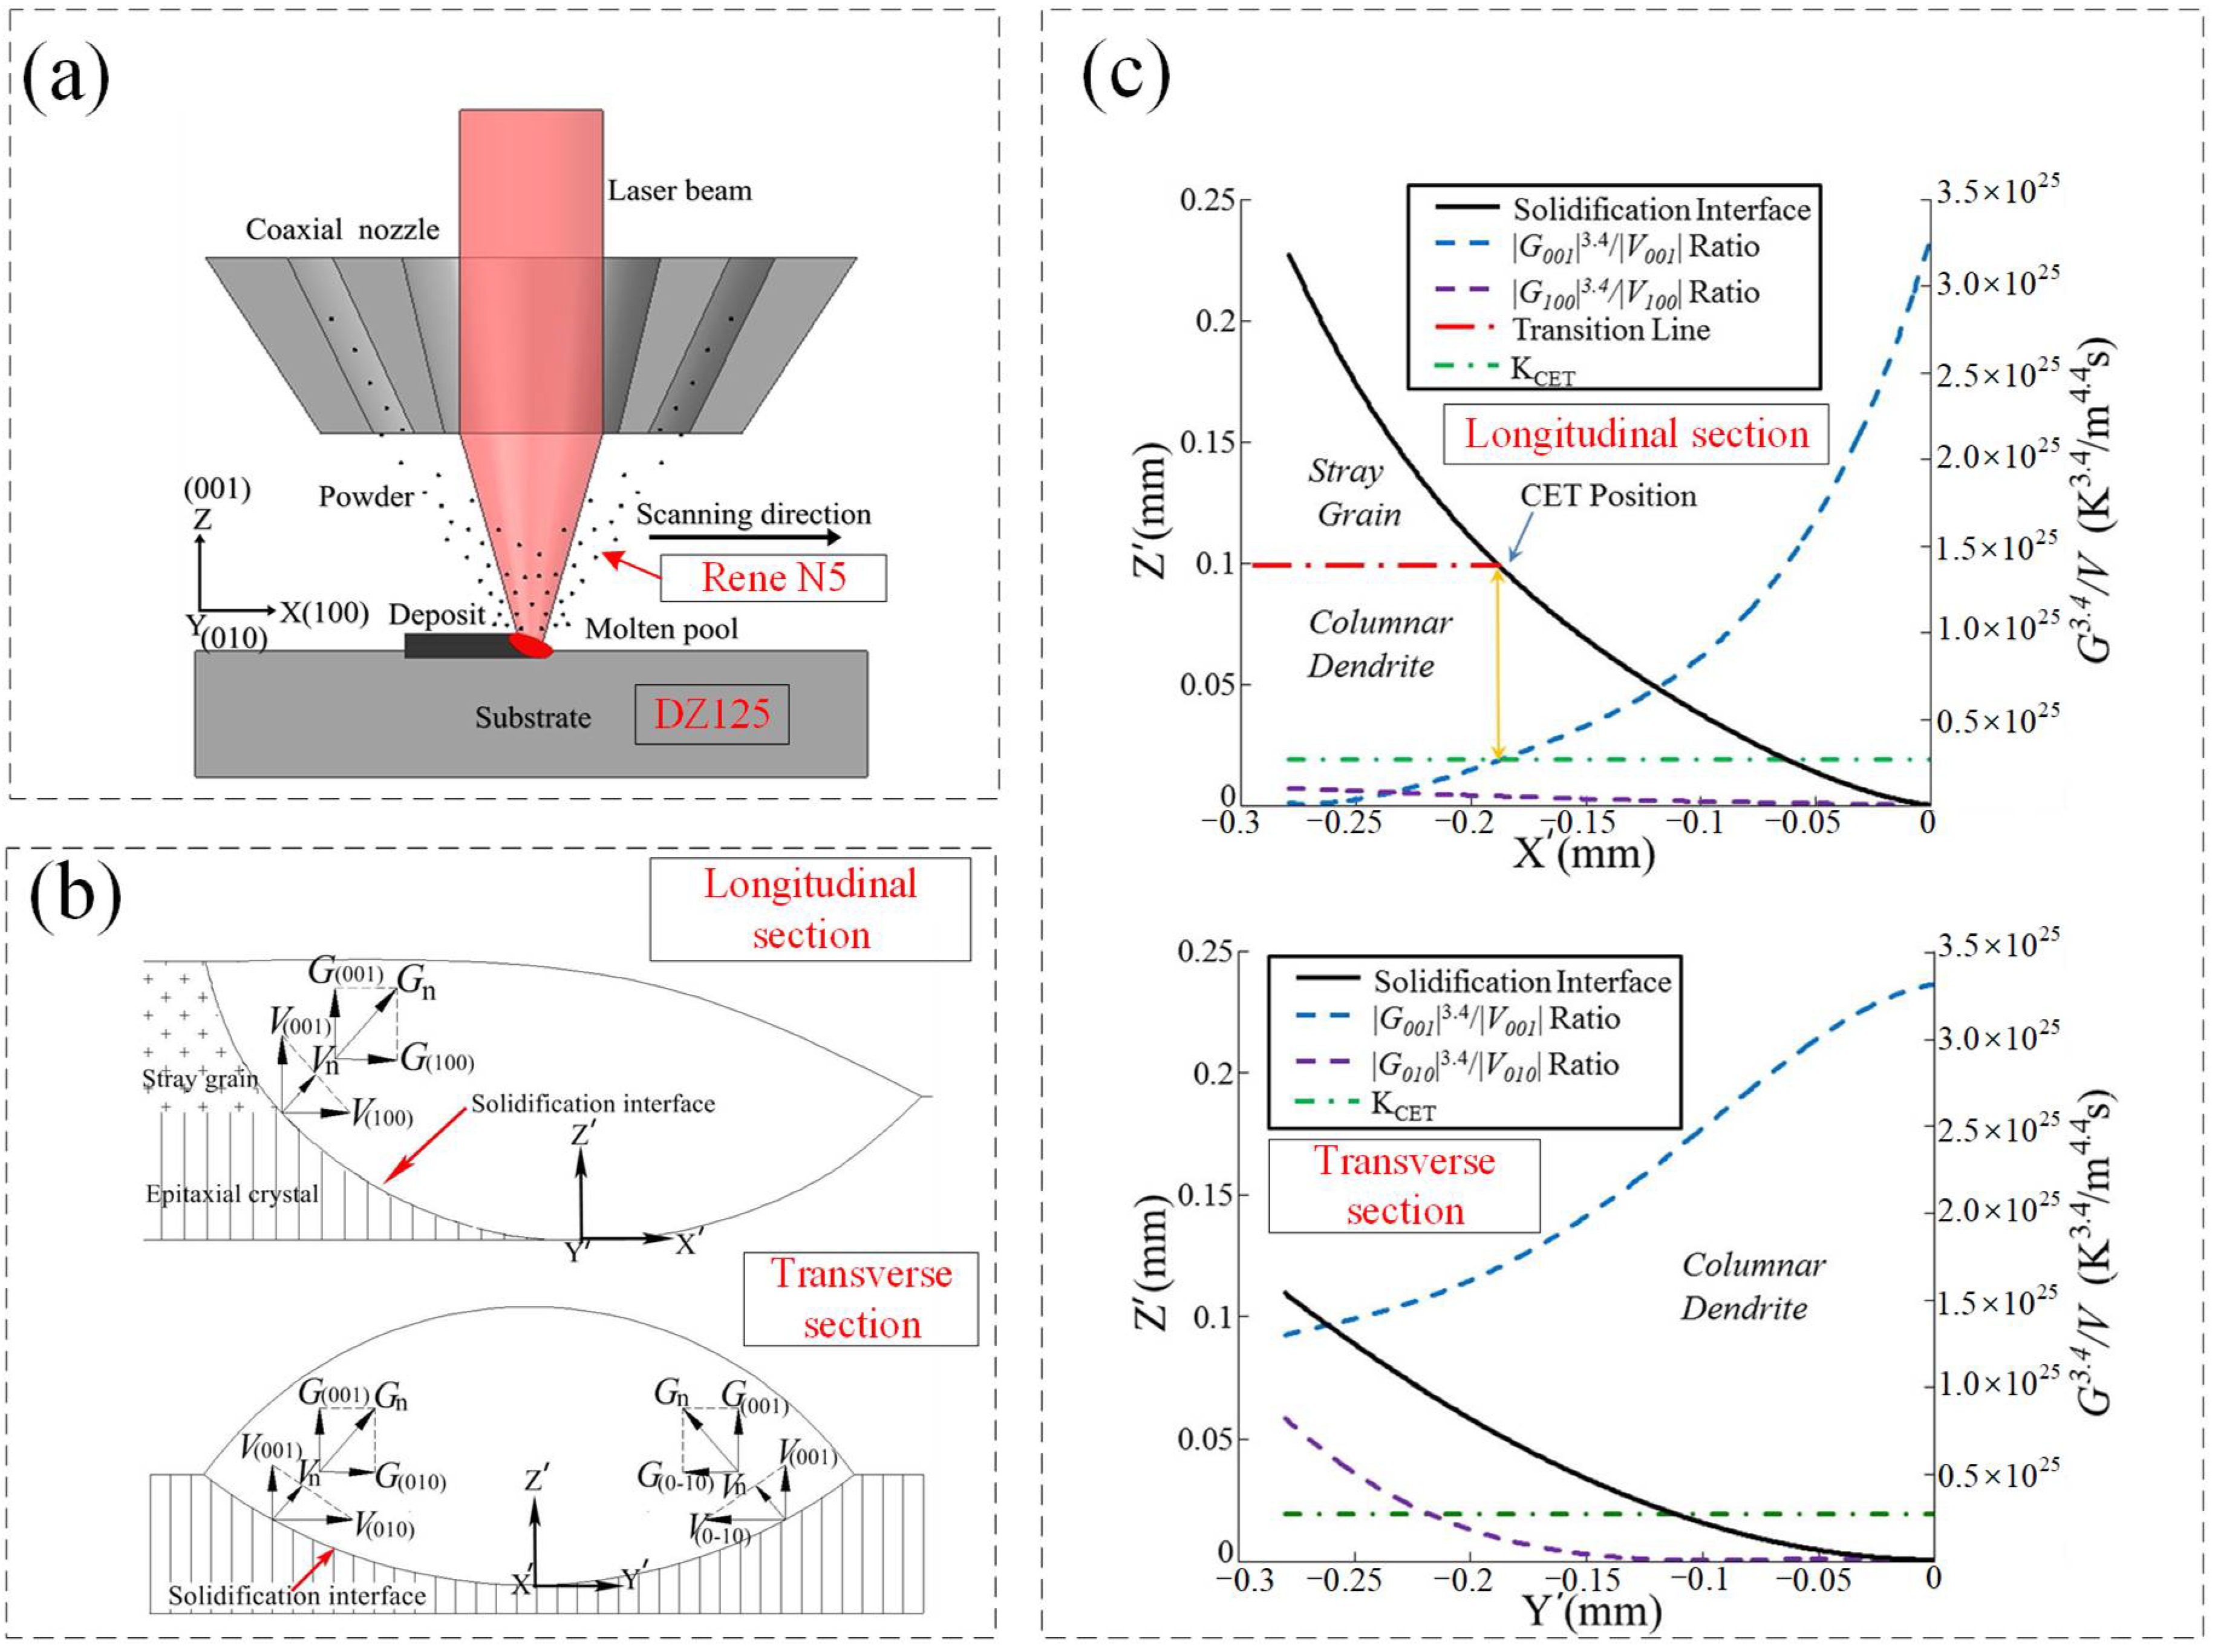
Based on the microstructures’ characteristics, the thin-wall could be divided into three regions which names the upper, middle, and bottom region. Plane, columnar, and cellular crystal presented in the bottom, middle, and upper region of thin-wall, respectively. Owing to the decrease of temperature gradient with the increase of deposition height, the grain size gradually decreases because of the reduction of cooling rate. The long columnar grains of the thin-wall grew almost along the height direction and passed through multiple deposition layers that attributed to the epitaxial mechanism. The growth direction of columnar grains could be affected by the changing of heat dissipation direction.
(3)
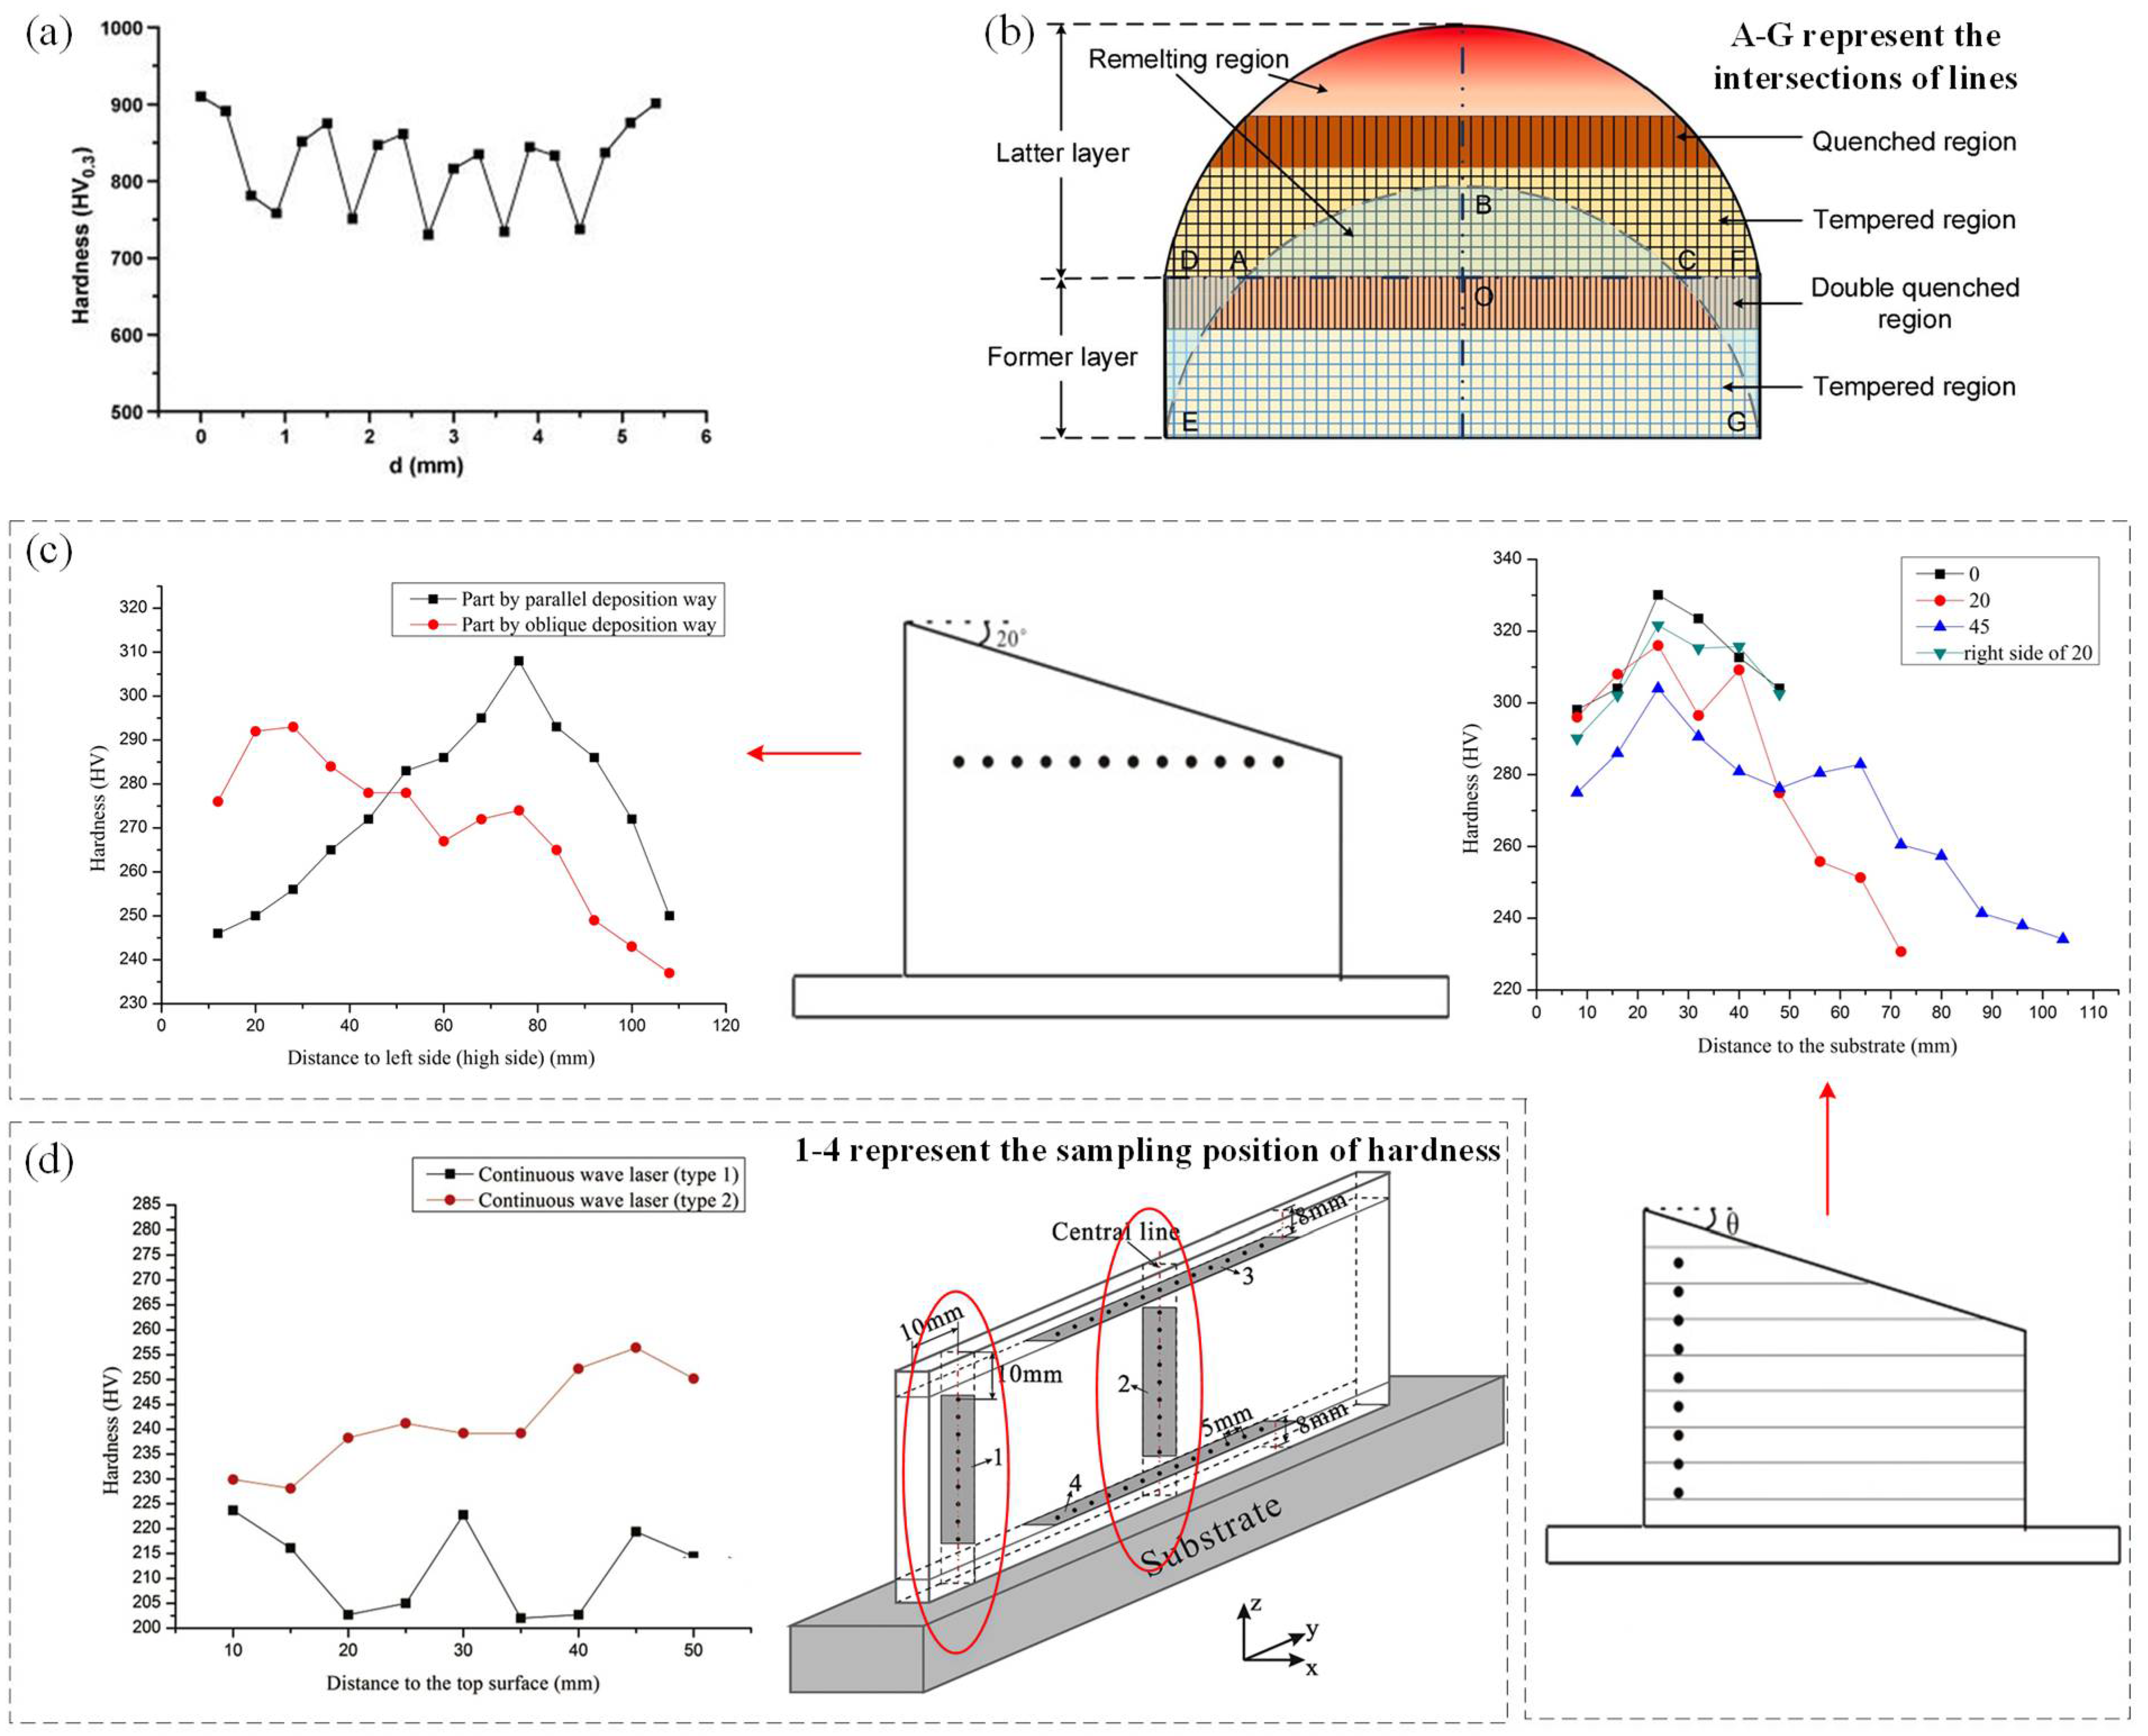
Microhardness had a negative correlation with the grain size. During the deposition height is small, the hardness decreased slightly form the bottom to upper region because of the decrease of grain size. Owing to the remelting and reheating which could lead to the coarse regions, the hardness was periodic variation. During the deposition height is great, the hardness increased initially and then decreased with the increase of height that attributed to the temping effect between the former layers and latter layers. The formation of strengthening structure and hardening phase also contribute to the improvement of hardness. In addition, the hardness distribution along the parallel direction was relatively uniform because of the similar conditions and grain size.
(4)
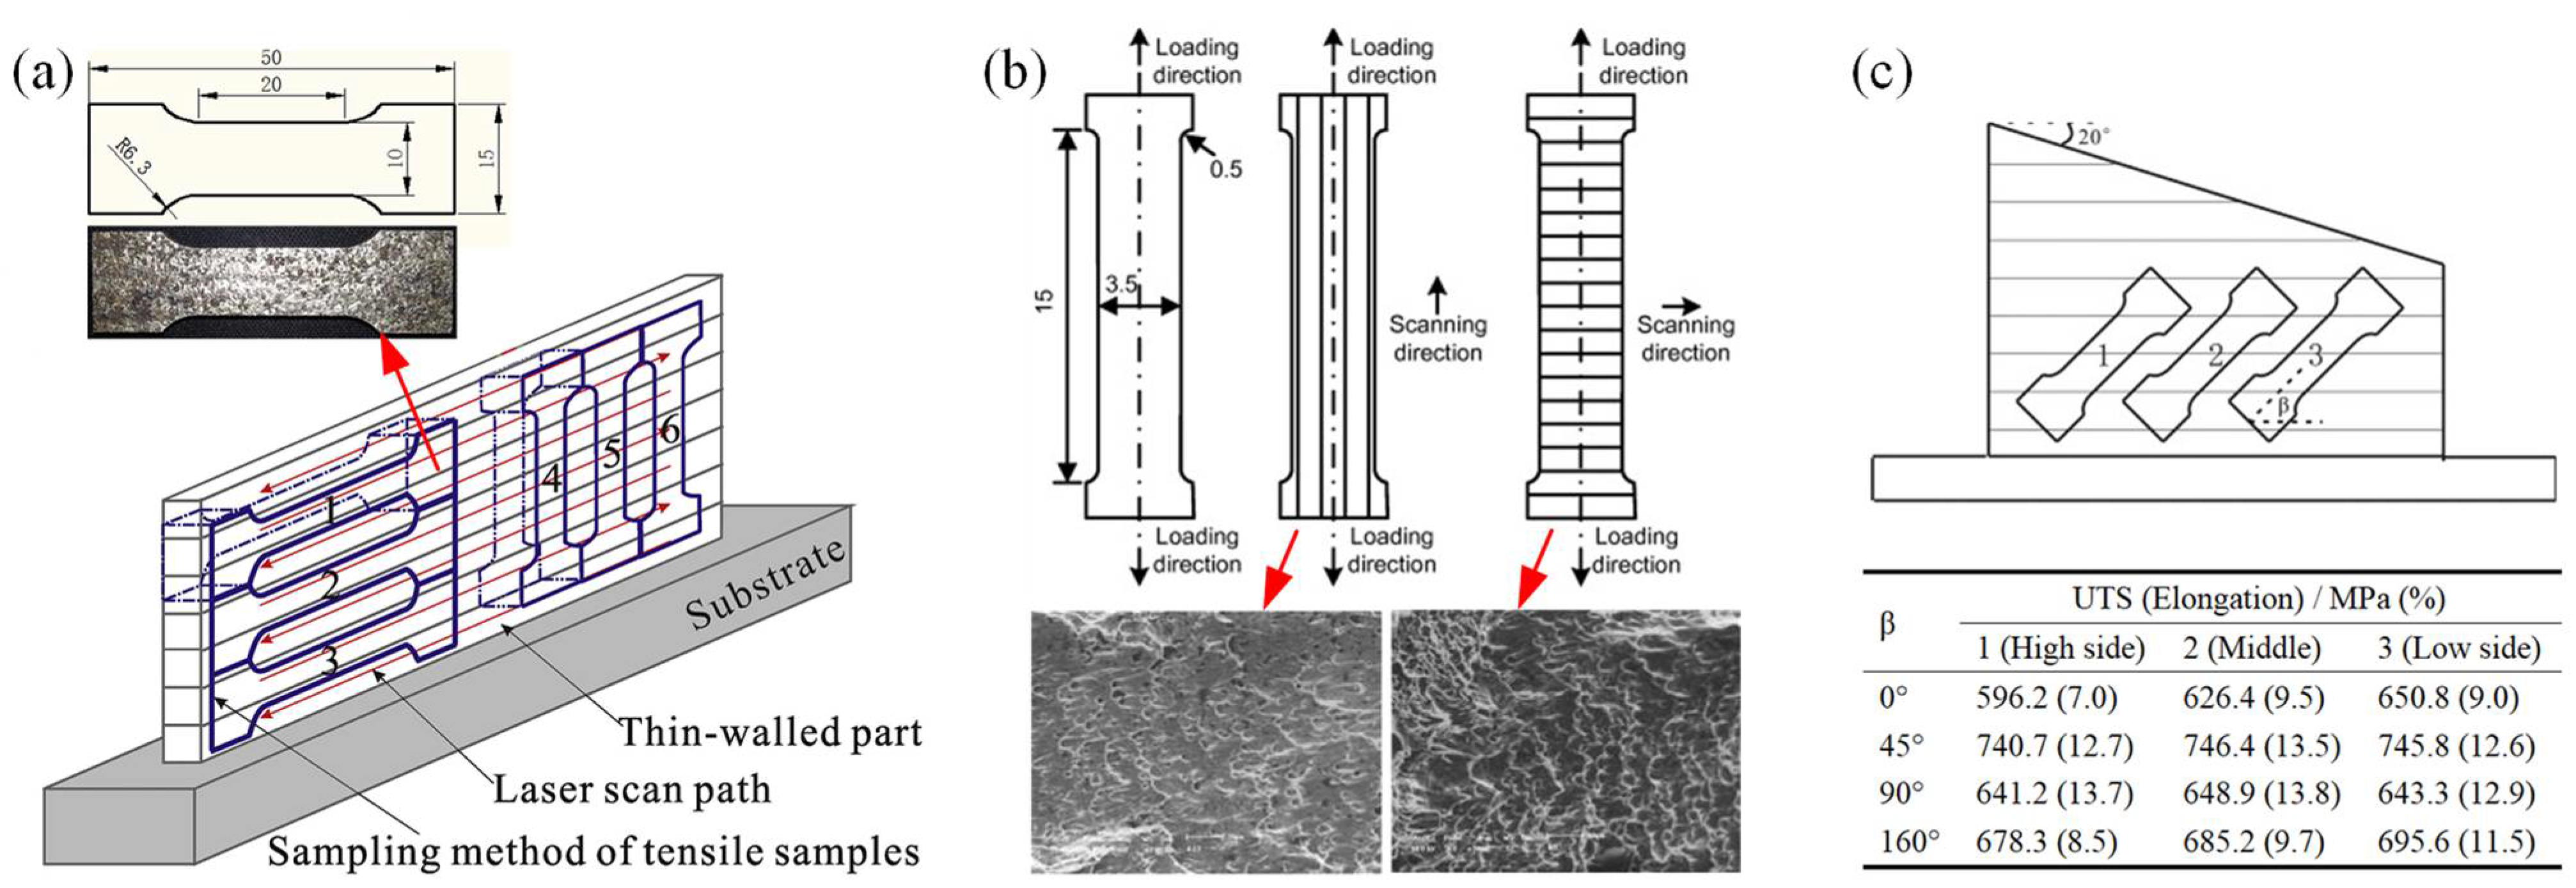
The finer grains can improve the tensile strength because of the higher grain boundaries and dislocation density which can hindering the movement of the dislocations. The UTS of thin-wall fabricated by LMD process was bigger than that by conventional process such as casting. However, the elongation presented adverse rules. During the tensile loading was along the parallel direction, the small shearing force contributes to the big tensile strength. In the case of vertical direction of tensile loading, owing to the small angle between the sliding surface and tensile force, the low tensile strength was present because of the high shearing force during the tensile test. The intense thermal cycling effects may induce solid phase transition and eventually affects the tensile properties of thin-wall. In addition, with the changing of shape of thin-wall, the tensile strength could be changed owing to the different direction of MPBs.
(5)
The encountered transient thermal gradients significantly affected the state and magnitude of residual stress. By pre-heating of the substrate and utilization of pulsed laser, the pattern of thermal stress could be modified.

Author Contributions

Investigation, X.W. and J.J.; writing—original draft preparation, X.W.; writing—review and editing, X.W., J.J., C.X. and Y.Y. All authors have read and agreed to the published version of the manuscript.

Funding

This research was funded by the Natural Science Foundation of Liaoning Province, grant number 2020-BS-206, Liaoning Department of Education Scientific Research Foundation, grant number JDL2020022, and Scientific and technological research program of China National Railway Group Limited, grant number N2021T010.

Institutional Review Board Statement

Not applicable.

Informed Consent Statement

Not applicable.

Data Availability Statement

Data is contained within the article.

Conflicts of Interest

The authors declare no conflict of interest.

References

  1. Liu, J.; Li, L. Direct fabrication of thin-wall parts by laser cladding. J. Manuf. Process. 2006, 8, 1–7. [Google Scholar] [CrossRef]
  2. Wang, X.; Deng, D.; Qi, M.; Zhang, H. Influences of deposition strategies and oblique angle on properties of AISI316L stainless steel oblique thin-walled part by direct laser fabrication. Opt. Laser Technol. 2016, 80, 138–144. [Google Scholar] [CrossRef]
  3. Liu, Y.; Liu, C.; Liu, W.; Ma, Y.; Zhang, C.; Cai, Q.; Liu, B. Microstructure and properties of Ti/Al lightweight graded material by direct laser deposition. Mater. Sci. Technol. 2018, 34, 945–951. [Google Scholar] [CrossRef]
  4. Ouyang, H.; Yu, Z.; Chen, T.; Fu, X.-J. Sub-Regional Process Planning for Large Nuclear Power Head. Mach. Des. Manuf. 2014, 5, 253–255. [Google Scholar]
  5. Herzog, D.; Seyda, V.; Wycisk, E.; Emmelmann, C. Additive manufacturing of metals. Acta Mater. 2016, 117, 371–392. [Google Scholar] [CrossRef]
  6. Huang, S.H.; Liu, P.; Mokasdar, A.; Hou, L. Additive manufacturing and its societal impact: A literature review. Int. J. Adv. Manuf. Technol. 2012, 67, 1191–1203. [Google Scholar] [CrossRef]
  7. Shim, D.-S.; Baek, G.-Y.; Seo, J.-S.; Shin, G.-Y.; Kim, K.-P.; Lee, K.-Y. Effect of layer thickness setting on deposition characteristics in direct energy deposition (DED) process. Opt. Laser Technol. 2016, 86, 69–78. [Google Scholar] [CrossRef]
  8. Thompson, S.M.; Bian, L.; Shamsaei, N.; Yadollahi, A. An overview of Direct Laser Deposition for additive manufacturing; Part I: Transport phenomena, modeling and diagnostics. Addit. Manuf. 2015, 8, 36–62. [Google Scholar] [CrossRef]
  9. Shamsaei, N.; Yadollahi, A.; Bian, L.; Thompson, S.M. An overview of Direct Laser Deposition for additive manufacturing; Part II: Mechanical behavior, process parameter optimization and control. Addit. Manuf. 2015, 8, 12–35. [Google Scholar] [CrossRef]
  10. Das, S.; Beama, J.J.; Wohlert, M.; Bourell, D.L. Direct laser freeform fabrication of high performance metal components. Rapid Prototyp. J. 1998, 4, 112–117. [Google Scholar] [CrossRef]
  11. Zhang, B.; Dembinski, L.; Coddet, C. The study of the laser parameters and environment variables effect on mechanical properties of high compact parts elaborated by selective laser melting 316L powder. Mater. Sci. Eng. A 2013, 584, 21–31. [Google Scholar] [CrossRef]
  12. Mumtaz, K.; Hopkinson, N. Selective laser melting of thin wall parts using pulse shaping. J. Mater. Process. Technol. 2010, 210, 279–287. [Google Scholar] [CrossRef]
  13. Shifeng, W.; Shuai, L.; Qingsong, W.; Yan, C.; Sheng, Z.; Yusheng, S. Effect of molten pool boundaries on the mechanical properties of selective laser melting parts. J. Mater. Process. Technol. 2014, 214, 2660–2667. [Google Scholar] [CrossRef]
  14. Zhang, K.; Wang, S.; Liu, W.; Shang, X. Characterization of stainless steel parts by Laser Metal Deposition Shaping. Mater. Des. 2014, 55, 104–119. [Google Scholar] [CrossRef]
  15. El Cheikh, H.; Courant, B.; Branchu, S.; Huang, X.; Hascoët, J.-Y.; Guillén, R. Direct Laser Fabrication process with coaxial powder projection of 316L steel. Geometrical characteristics and microstructure characterization of wall structures. Opt. Lasers Eng. 2012, 50, 1779–1784. [Google Scholar] [CrossRef] [Green Version]
  16. Sun, W. Application Status and Development Trend of Additive Manufacturing Technology for Metal Materials. Guangdong Sci. Ence Technol. 2021, 30, 99–102. [Google Scholar]
  17. Yap, C.Y.; Chua, C.K.; Dong, Z.L.; Liu, Z.H.; Zhang, D.Q.; Loh, L.E.; Sing, S.L. Review of selective laser melting: Materials and applications. Appl. Phys. Rev. 2015, 2, 041101. [Google Scholar] [CrossRef]
  18. Lu, L.; Guo, K.; Sun, J.; Zhang, G.; Sun, C. Investigation on hot sizing process based on creep mechanism for laser cladded thin-walled titanium alloy components. J. Laser Appl. 2019, 31, 042002. [Google Scholar] [CrossRef]
  19. Yu, J.; Lin, X.; Ma, L.; Wang, J.; Fu, X.; Chen, J.; Huang, W. Influence of laser deposition patterns on part distortion, interior quality and mechanical properties by laser solid forming (LSF). Mater. Sci. Eng. A 2011, 528, 1094–1104. [Google Scholar] [CrossRef]
  20. Zhang, H.; Chong, K.; Zhao, W.; Sun, Z. Effects of pulse parameters on in-situ Ti-V carbides size and properties of Fe-based laser cladding layers. Surf. Coat. Technol. 2018, 344, 163–169. [Google Scholar] [CrossRef]
  21. Zhan, M.; Sun, G.; Wang, Z.; Shen, X.; Yan, Y.; Ni, Z. Numerical and experimental investigation on laser metal deposition as repair technology for 316L stainless steel. Opt. Laser Technol. 2019, 118, 84–92. [Google Scholar] [CrossRef]
  22. Yu, J.; Rombouts, M.; Maes, G. Cracking behavior and mechanical properties of austenitic stainless steel parts produced by laser metal deposition. Mater. Des. 2013, 45, 228–235. [Google Scholar] [CrossRef]
  23. Ocylok, S.; Weisheit, A.; Kelbassa, I. Functionally graded multi-layers by laser cladding for increased wear and corrosion protection. Phys. Procedia 2010, 5, 359–367. [Google Scholar] [CrossRef]
  24. Abioye, T.E.; Farayibi, P.K.; Kinnel, P.; Clare, A.T. Functionally graded Ni-Ti microstructures synthesised in process by direct laser metal deposition. Int. J. Adv. Manuf. Technol. 2015, 79, 843–850. [Google Scholar] [CrossRef] [Green Version]
  25. Corbin, D.; Nassar, A.; Reutzel, E.; Allison, M.; Nathan, A. Effect of directed energy deposition processing parameters on laser deposited Inconel® 718: External morphology. J. Laser Appl. 2017, 29, 022001. [Google Scholar] [CrossRef]
  26. Wang, X.; Liu, Z.; Guo, Z.; Hu, Y. A fundamental investigation on three–dimensional laser material deposition of AISI316L stainless steel. Opt. Laser Technol. 2020, 126, 106107. [Google Scholar] [CrossRef]
  27. Zhang, K.; Liu, W.; Shang, X. Research on the processing experiments of laser metal deposition shaping. Opt. Laser Technol. 2007, 39, 549–557. [Google Scholar] [CrossRef] [Green Version]
  28. D’Oliveira, A.S.C.M.; da Silva, P.S.C.P.; Vilar, R.M.C. Microstructural features of consecutive layers of Stellite 6 deposited by laser cladding. Surf. Coat. Tech. 2002, 153, 203–209. [Google Scholar] [CrossRef]
  29. Wang, X.; Lei, L.; Yu, H. A Review on Microstructural Features and Mechanical Properties of Wheels/Rails Cladded by Laser Cladding. Micromachines 2021, 12, 152. [Google Scholar] [CrossRef] [PubMed]
  30. Wang, X.; Yu, H.; Jiang, J.; Xia, C.; Zhang, Z. Influences of Pulse Shaping on Single-Track Clad of AISI316L Stainless Steel by Laser Material Deposition. Coatings 2022, 12, 248. [Google Scholar] [CrossRef]
  31. Lepski, D.; Brückner, F. Laser Cladding; Springer: Berlin/Heidelberg, Germany, 2009; pp. 235–279. [Google Scholar]
  32. Bi, G.; Gasser, A.; Wissenbach, K.; Drenker, A.; Poprawe, R. Investigation on the direct laser metallic powder deposition process via temperature measurement. Appl. Surf. Sci. 2006, 253, 1411–1416. [Google Scholar] [CrossRef]
  33. Zhu, G.; Li, D.; Zhang, A.; Pi, G.; Tang, Y. The influence of laser and powder defocusing characteristics on the surface quality in laser direct metal deposition. Opt. Laser Technol. 2012, 44, 349–356. [Google Scholar] [CrossRef]
  34. Gangxian, Z.; Anfeng, Z.; Dichen, L.; Gang, P. Model of layer thickness of thin-walled parts in laser metal direct manufacturing. Trans. China Weld. Inst. 2010, 8, 57–60. [Google Scholar]
  35. Jiayu, S.; Tianbiao, Y.; Yu, Z.; Lin, Y.; Chuang, G. Research on laser cladding forming process of circumferentially inclined thin-walled cylinders. Chin. J. Lasers 2018, 45, 0802004. [Google Scholar] [CrossRef]
  36. Mahmood, K.; Pinkerton, A.J. Direct laser deposition with different types of 316L steel particle: A comparative study of final part properties. Proc. Inst. Mech. Eng. Part B J. Eng. Manuf. 2013, 227, 520–531. [Google Scholar] [CrossRef]
  37. Wang, X.; Deng, D.; Yi, H.; Xu, H.; Yang, S.; Zhang, H. Influences of pulse laser parameters on properties of AISI316L stainless steel thin-walled part by laser material deposition. Opt. Laser Technol. 2017, 92, 5–14. [Google Scholar] [CrossRef]
  38. Yu, T.; Sun, J.; Qu, W.; Zhao, Y.; Yang, L. Influences of z-axis increment and analyses of defects of AISI 316L stainless steel hollow thin-walled cylinder. Int. J. Adv. Manuf. Technol. 2018, 97, 2203–2220. [Google Scholar] [CrossRef]
  39. Xin, B.; Zhou, X.; Cheng, G.; Yao, J.; Gong, Y. Microstructure and mechanical properties of thin-wall structure by hybrid laser metal deposition and laser remelting process. Opt. Laser Technol. 2020, 127, 106087. [Google Scholar] [CrossRef]
  40. Zhang, Y.; Yu, G.; He, X.; Ning, W.; Zheng, C. Numerical and experimental investigation of multilayer SS410 thin wall built by laser direct metal deposition. J. Mater. Process. Technol. 2012, 212, 106–112. [Google Scholar] [CrossRef] [Green Version]
  41. Tan, H.; Chen, J.; Zhang, F.; Lin, X.; Huang, W. Process analysis for laser solid forming of thin-wall structure. Int. J. Mach. Tools Manuf. 2010, 50, 1–8. [Google Scholar] [CrossRef]
  42. Zhu, G.; Zhang, A.; Li, D.; Tang, Y.; Tong, Z.; Lu, Q. Numerical simulation of thermal behavior during laser direct metal deposition. Int. J. Adv. Manuf. Technol. 2011, 55, 945–954. [Google Scholar] [CrossRef]
  43. Alimardani, M.; Toyserkani, E.; Huissoon, J.P.; Paul, C.P. On the delamination and crack formation in a thin wall fabricated using laser solid freeform fabrication process: An experimental–numerical investigation. Opt. Lasers Eng. 2009, 47, 1160–1168. [Google Scholar] [CrossRef]
  44. Pinkerton, A.J.; Li, L. An experimental and numerical study of the influence of diode laser beam shape on thin wall direct metal deposition. J. Laser Appl. 2005, 17, 47–56. [Google Scholar] [CrossRef]
  45. Lu, L.; Shi, T.; Zhang, J.; Mei, Y.; Cheng, D.; Fu, G.; Yu, S. Research on surface finish of thin-wall parts by laser with coaxial inside-beam powder feeding. J. Laser Appl. 2021, 33, 022003. [Google Scholar] [CrossRef]
  46. Yu, J.; Sun, W.; Huang, H.; Huang, Y. Study on the deformation control and microstructures of thin-walled parts repaired by laser cladding. Coatings 2020, 10, 369. [Google Scholar] [CrossRef] [Green Version]
  47. Liu, J.; Li, L. Effects of powder concentration distribution on fabrication of thin-wall parts in coaxial laser cladding. Opt. Laser Technol. 2005, 37, 287–292. [Google Scholar] [CrossRef]
  48. Jardin, R.T.; Tuninetti, V.; Tchuindjang, J.T.; Hashemi, N.; Carrus, R.; Mertens, A.; Duchêne, L.; Tran, H.S.; Habraken, A.M. Sensitivity Analysis in the Modelling of a High Speed Steel Thin-Wall Produced by Directed Energy Deposition. Metals 2020, 10, 1554. [Google Scholar] [CrossRef]
  49. Yu, T.; Bao, Y. Research on manufacturing technology of thin-walled parts of Fe105 metal based on laser cladding. J. Phys. Conf. Ser. 2019, 1187, 032043. [Google Scholar] [CrossRef]
  50. Zhang, K.; Wang, S.; Liu, W.; Long, R. Effects of substrate preheating on the thin-wall part built by laser metal deposition shaping. Appl. Surf. Sci. 2014, 317, 839–855. [Google Scholar] [CrossRef]
  51. Long, R.; Sun, S.; Lian, Z. The influence of scanning methods on the cracking failure of thin-wall metal parts fabricated by laser direct deposition shaping. Eng. Fail. Anal. 2016, 59, 269–278. [Google Scholar] [CrossRef]
  52. Zhang, H.; Zhu, L.; Xue, P. Laser direct metal deposition of variable width thin-walled structures in Inconel 718 alloy by coaxial powder feeding. Int. J. Adv. Manuf. Technol. 2020, 108, 821–840. [Google Scholar] [CrossRef]
  53. Liu, F.; Lin, X.; Leng, H.; Cao, J.; Liu, Q.; Huang, C.; Huang, W. Microstructural changes in a laser solid forming Inconel 718 superalloy thin wall in the deposition direction. Opt. Laser Technol. 2013, 45, 330–335. [Google Scholar] [CrossRef]
  54. Xiao, H.; Cheng, M.; Song, L. Direct fabrication of single-crystal-like structure using quasi-continuous-wave laser additive manufacturing. J. Mater. Sci. Technol. 2021, 60, 216–221. [Google Scholar] [CrossRef]
  55. Balichakra, M.; Bontha, S.; Krishna, P.; Balla, V.K. Prediction and validation of residual stresses generated during laser metal deposition of γ titanium aluminide thin wall structures. Mater. Res. Express 2019, 6, 106550. [Google Scholar] [CrossRef]
  56. Ahsan, M.N.; Pinkerton, A.J.; Moat, R.J.; Shackleton, J. A comparative study of laser direct metal deposition characteristics using gas and plasma-atomized Ti–6Al–4V powders. Mater. Sci. Eng. A 2011, 528, 7648–7657. [Google Scholar] [CrossRef]
  57. Ahsan, M.N.; Bradley, R.; Pinkerton, A.J. Microcomputed tomography analysis of intralayer porosity generation in laser direct metal deposition and its causes. J. Laser Appl. 2011, 23, 022009. [Google Scholar] [CrossRef]
  58. Xue, P.; Zhu, L.; Xu, P.; Ren, Y.; Xin, B.; Wang, S.; Yang, Z.; Ning, J.; Meng, G.; Liu, Z. CrCoNi medium-entropy alloy thin-walled parts manufactured by laser metal deposition: Microstructure evolution and mechanical anisotropy. Mater. Sci. Eng. A 2021, 817, 141306. [Google Scholar] [CrossRef]
  59. Zhao, T.; Cai, W.; Dahmen, M.; Schaible, J.; Hong, C.; Gasser, A.; Weisheit, A.; Biermann, T.; Kelbassa, I.; Zhang, H. Ageing response of an Al-Mg-Mn-Sc-Zr alloy processed by laser metal deposition in thin-wall structures. Vacuum 2018, 158, 121–125. [Google Scholar] [CrossRef]
  60. Huang, Y.-L.; Liu, J.; Ma, N.-H.; Li, J.-G. Three-dimensional analytical model on laser-powder interaction during laser cladding. J. Laser Appl. 2006, 18, 42–46. [Google Scholar] [CrossRef]
  61. Cong, W.; Ning, F. A fundamental investigation on ultrasonic vibration-assisted laser engineered net shaping of stainless steel. Int. J. Mach. Tools Manuf. 2017, 121, 61–69. [Google Scholar] [CrossRef]
  62. Huang, W.; Chen, J.; Li, Y.; Lin, X. Laser rapid forming technology of high-performance dense metal components with complex structure. In Proceedings of Lasers in Material Processing and Manufacturing II; SPIE: Bellingham, WA, USA; pp. 67–75.
  63. Wang, J.-H.; Han, F.-Z.; Ying, W.-S. Surface evenness control of laser solid formed thin-walled parts based on the mathematical model of the single cladding layer thickness. J. Laser Appl. 2019, 31, 022009. [Google Scholar]
  64. Gu, D.D.; Meiners, W.; Wissenbach, K.; Poprawe, R. Laser additive manufacturing of metallic components: Materials, processes and mechanisms. Int. Mater. Rev. 2012, 57, 133–164. [Google Scholar]
  65. Devesse, W.; De Baere, D.; Guillaume, P. Modeling of laser beam and powder flow interaction in laser cladding using ray-tracing. J. Laser Appl. 2015, 27, S29208. [Google Scholar] [CrossRef]
  66. Dongsheng, L.; Tuo, S.; Shihong, S.; Weiwei, J.; Shuguang, W. Laser Cladding Forming Technology of Flat-Top Thin-Walled Part Based on Special-Shaped Base Surface. Chin. J. Lasers 2019, 46, 1102002. [Google Scholar] [CrossRef]
  67. Carroll, B.E.; Palmer, T.A.; Beese, A.M. Anisotropic tensile behavior of Ti–6Al–4V components fabricated with directed energy deposition additive manufacturing. Acta Mater. 2015, 87, 309–320. [Google Scholar] [CrossRef]
  68. Wang, X.; Deng, D.; Hu, Y.; Ning, F.; Wang, H.; Cong, W.; Zhang, H. Overhang structure and accuracy in laser engineered net shaping of Fe-Cr steel. Opt. Laser Technol. 2018, 106, 357–365. [Google Scholar]
  69. Selcuk, C. Laser metal deposition for powder metallurgy parts. Powder Metall. 2011, 54, 94–99. [Google Scholar] [CrossRef]
  70. Wang, X.; Jiang, J.; Tian, Y. A Review on Macroscopic and Microstructural Features of Metallic Coating Created by Pulsed Laser Material Deposition. Micromachines 2022, 13, 659. [Google Scholar] [CrossRef]
  71. Bontha, S.; Klingbeil, N.W.; Kobryn, P.A.; Fraser, H.L. Thermal process maps for predicting solidification microstructure in laser fabrication of thin-wall structures. J. Mater. Process. Technol. 2006, 178, 135–142. [Google Scholar] [CrossRef]
  72. Yang, K.; Wang, Z.D.; Chen, M.Z.; Lan, H.F.; Sun, G.F.; Ni, Z.H. Effect of pulse frequency on the morphology, microstructure, and corrosion resistance of high-nitrogen steel prepared by laser directed energy deposition. Surf. Coat. Technol. 2021, 421, 127450. [Google Scholar] [CrossRef]
  73. Cao, Y.; Farouk, N.; Taheri, M.; Yumashev, A.V.; Bozorg, S.F.K.; Ojo, O.O. Evolution of solidification and microstructure in laser-clad IN625 superalloy powder on GTD-111 superalloy. Surf. Coat. Technol. 2021, 412, 127010. [Google Scholar] [CrossRef]
  74. Kim, M.J.; Saldana, C. Thin wall deposition of IN625 using directed energy deposition. J. Manuf. Process. 2020, 56, 1366–1373. [Google Scholar] [CrossRef]
  75. Tabernero, I.; Lamikiz, A.; Martínez, S.; Ukar, E.; Figueras, J. Evaluation of the mechanical properties of Inconel 718 components built by laser cladding. Int. J. Mach. Tools Manuf. 2011, 51, 465–470. [Google Scholar] [CrossRef]
  76. Atwood, C.; Ensz, M.; Greene, D.; Griffith, M.; Harwell, L.; Reckaway, D.; Romero, T.; Schlienger, E.; Smugeresky, J. Laser engineered net shaping (LENS (TM)): A tool for direct fabrication of metal parts. In International Congress on Applications of Lasers & Electro-Optics; Laser Institute of America: Orlando, FL, USA, 1998. [Google Scholar]
  77. Huang, F.; Jiang, Z.; Liu, X.; Lian, J.; Chen, L. Microstructure and properties of thin wall by laser cladding forming. J. Mater. Process. Technol. 2009, 209, 4970–4976. [Google Scholar] [CrossRef]
  78. Hu, Y.; Wang, L.; Yao, J.; Xia, H.; Li, J.; Liu, R. Effects of electromagnetic compound field on the escape behavior of pores in molten pool during laser cladding. Surf. Coat. Technol. 2020, 383, 125198. [Google Scholar] [CrossRef]
  79. Liu, H.; Ji, S.; Jiang, Y.; Zhang, X.; Wang, C. Microstructure and Property of Fe60 Composite Coatings by Rotating Magnetic Field Auxiliary Laser Cladding. Chin. J. Lasers 2013, 40, 0103007. [Google Scholar]
  80. Gatzen, M.; Tang, Z.; Vollertsen, F. Effect of electromagnetic Stirring on the Element Distribution in Laser Beam Welding of Aluminium with Filler Wire. Phys. Procedia 2011, 12, 56–65. [Google Scholar] [CrossRef] [Green Version]
  81. Ning, F.; Cong, W. Microstructures and mechanical properties of Fe-Cr stainless steel parts fabricated by ultrasonic vibration-assisted laser engineered net shaping process. Mater. Lett. 2016, 179, 61–64. [Google Scholar] [CrossRef]
  82. Sun, S.-H.; Hagihara, K.; Nakano, T. Effect of scanning strategy on texture formation in Ni-25 at.% Mo alloys fabricated by selective laser melting. Mater. Des. 2018, 140, 307–316. [Google Scholar] [CrossRef]
  83. Xiang, S.; Li, J.; Luan, H.; Amar, A.; Lu, S.; Li, K.; Zhang, L.; Liu, X.; Le, G.; Wang, X. Effects of process parameters on microstructures and tensile properties of laser melting deposited CrMnFeCoNi high entropy alloys. Mater. Sci. Eng. A 2019, 743, 412–417. [Google Scholar] [CrossRef]
  84. Liu, Z.; Qi, H. Effects of substrate crystallographic orientations on crystal growth and microstructure formation in laser powder deposition of nickel-based superalloy. Acta Mater. 2015, 87, 248–258. [Google Scholar] [CrossRef]
  85. Chen, H.; Lu, Y.; Luo, D.; Lai, J.; Liu, D. Epitaxial laser deposition of single crystal Ni-based superalloys: Repair of complex geometry. J. Mater. Process. Technol. 2020, 285, 116782. [Google Scholar] [CrossRef]
  86. Fu, Y.; Guo, N.; Wang, G.; Yu, M.; Cheng, Q.; Zhang, D. Underwater additive manufacturing of Ti-6Al-4V alloy by laser metal deposition: Formability, gran growth and microstructure evolution. Mater. Des. 2021, 197, 109196. [Google Scholar] [CrossRef]
  87. Wang, K.; Du, D.; Liu, G.; Chang, B.; Ju, J.; Sun, S.; Fu, H. Microstructure and property of laser clad Fe-based composite layer containing Nb and B4C powders. J. Alloys Compd. 2019, 802, 373–384. [Google Scholar] [CrossRef]
  88. Li, Z.; Chen, J.; Sui, S.; Zhong, C.; Lu, X.; Lin, X. The microstructure evolution and tensile properties of Inconel 718 fabricated by high-deposition-rate laser directed energy deposition. Addit. Manuf. 2020, 31, 100941. [Google Scholar] [CrossRef]
  89. Xu, L.; Chai, Z.; Chen, H.; Zhang, X.; Xie, J.; Chen, X. Tailoring Laves phase and mechanical properties of directed energy deposited Inconel 718 thin-wall via a gradient laser power method. Mater. Sci. Eng. A 2021, 824, 141822. [Google Scholar] [CrossRef]
  90. Xiang, K.; Chai, L.; Wang, Y.; Wang, H.; Guo, N.; Ma, Y.; Murty, K.L. Microstructural characteristics and hardness of CoNiTi medium-entropy alloy coating on pure Ti substrate prepared by pulsed laser cladding. J. Alloys Compd. 2020, 849, 156704. [Google Scholar] [CrossRef]
  91. Hansen, N. Hall–Petch relation and boundary strengthening. Scr. Mater. 2004, 51, 801–806. [Google Scholar] [CrossRef]
  92. Shi, Y.; Wang, Y.-D.; Li, S.; Li, R.; Wang, Y. Mechanical behavior in boron-microalloyed CoCrNi medium-entropy alloy studied by in situ high-energy X-ray diffraction. Mater. Sci. Eng. A 2020, 788, 139600. [Google Scholar] [CrossRef]
  93. Liu, X.; Laplanche, G.; Kostka, A.; Fries, S.; Pfetzing-Micklich, J.; Liu, G.; George, E. Columnar to equiaxed transition and grain refinement of cast CrCoNi medium-entropy alloy by microalloying with titanium and carbon. J. Alloys Compd. 2019, 775, 1068–1076. [Google Scholar] [CrossRef]
  94. Peters, M.; Hemptenmacher, J.; Kumpfert, J.; Leyens, C. Structure and properties of titanium and titanium alloys. In Titanium and Titanium Alloys: Fundamentals and Applications; Wiley-VCH: Hoboken, NJ, USA, 2003; pp. 1–36. [Google Scholar]
  95. Qiu, C.; Ravi, G.A.; Dance, C.; Ranson, A.; Dilworth, S.; Attallah, M.M. Fabrication of large Ti-6Al-4V structures by direct laser deposition. J. Alloys Compd. 2015, 629, 351–361. [Google Scholar] [CrossRef]
  96. Balla, V.K.; Das, M.; Mohammad, A.; Al-Ahmari, A.M. Additive Manufacturing of γ-TiAl: Processing, Microstructure, and Properties. Adv. Eng. Mater. 2016, 18, 1208–1215. [Google Scholar] [CrossRef]
  97. Long, R.-S.; Liu, W.-J.; Xing, F.; Wang, H.-B. Numerical simulation of thermal behavior during laser metal deposition shaping. Trans. Nonferrous Met. Soc. China 2008, 18, 691–699. [Google Scholar] [CrossRef] [Green Version]
  98. Bergman, T.L.; Lavine, A.S.; Incropera, F.P.; DeWitt, D.P. Introduction to Heat Transfer; John Wiley & Sons: Hoboken, NJ, USA, 2011. [Google Scholar]
  99. Rangaswamy, P.; Griffith, M.L.; Prime, M.B.; Holden, T.M.; Rogge, R.B.; Edwards, J.M.; Sebring, R.J. Residual stresses in LENS® components using neutron diffraction and contour method. Mater. Sci. Eng. A 2005, 399, 72–83. [Google Scholar] [CrossRef]
  100. Wang, L.; Felicelli, S.D.; Pratt, P. Residual stresses in LENS-deposited AISI 410 stainless steel plates. Mater. Sci. Eng. A 2008, 496, 234–241. [Google Scholar] [CrossRef]
Figure 1. Schematic diagram of (a) relative position between the deposition surface and laser focus point, (b) passive defocusing, and (c) positive defocusing.
Coatings 12 01104 g001
Figure 2. The 316L thin-wall fabricated by LMD with z-increment of (a) 0.15 mm and (b) 0.25 mm (Reprinted from ref. [32], copyright (2006), with permission from Elsevier).
Coatings 12 01104 g002
Figure 3. (a) Images of 316L thin-wall parts with complex structures (Reprinted from ref. [14], copyright (2013), with permission from Elsevier); (b) Image of deposited cruciform thin-wall (Reprinted from ref. [67], copyright (2015), with permission from Elsevier); (c) 316L slope thin-wall part fabricated using parallel and three-dimensional deposition way (Reprinted from ref. [26], copyright (2020), with permission from Elsevier); (d) Schematic and samples of typical variable width thin-walled structures [52]; (e) Schematic and 316L thin-walled overhang structures (Reprinted from ref. [68] copyright (2018), with permission from Elsevier).
Coatings 12 01104 g003
Figure 4. (a) Solidification map established by solidification parameters (Reprinted from ref. [72], copyright (2021), with permission from Elsevier); (b) Evolution of grain structure of IN625 thin-wall from columnar (core/interfacial), large equiaxed grains (transition), to small equiaxed grains (surface) (Reprinted from ref. [74], copyright (2020), with permission from Elsevier); (c) Evolution of grain structure of IN625 thin-wall from cellular (bottom region), columnar (middle region), to equiaxed grains (top region) (Reprinted from ref. [73], copyright (2020), with permission from Elsevier).
Coatings 12 01104 g004
Figure 5. (a) Microstructure of CrCoNi medium-entropy alloy thin-wall (Reprinted from ref. [58], copyright (2021), with permission from Elsevier); microstructure of the IN718 thin-wall with the (b) continuous wave laser and (c) quasi-continuous-wave laser (Reprinted from ref. [54], copyright (2021), with permission from Elsevier).
Coatings 12 01104 g005
Figure 6. (a) Schematic of the LMD process, (b) The geometrical relationship of the magnitudes of Ghkl and Vhkl along the preferred growth directions relative to those normal to the solidification interface in the different section, and (c) The solidification conditions ahead of the solidification interface in the different section of a simulation deposition. (Reprinted from ref. [84], copyright (2015), with permission from Elsevier).
Coatings 12 01104 g006
Figure 7. (a) Hardness distribution in height-direction of the WC/Ni thin wall sample, (Reprinted from ref. [77], copyright (2009), with permission from Elsevier); (b) Schematic illustration of thermal history in laser material deposition process (Reprinted from ref. [26], copyright (2020), with permission from Elsevier); (c) Hardness distribution in parallel and vertical direction of the 316L slope thin-wall (Reprinted from ref. [2], copyright (2016), with permission from Elsevier); (d) Hardness distribution in the vertical direction of 316L thin wall (Reprinted from ref. [37], copyright (2016), with permission from Elsevier).
Coatings 12 01104 g007
Figure 8. (a) Schematic of direction of grain growth in different deposition way (Reprinted from ref. [26], copyright (2020), with permission from Elsevier); (b) The force analysis diagram of molten pool boundaries produced in horizontal and vertical direction (Reprinted from ref. [13], copyright (2014), with permission from Elsevier).
Coatings 12 01104 g008
Figure 9. (a) Schematic for tensile test specimens of 316L thin-wall. (Reprinted from ref. [37], copyright (2016), with permission from Elsevier); (b) Schematic for tensile test specimens SEM morphology of tensile fracture surface of 316 thin-wall (Reprinted from ref. [14], copyright (2013), with permission from Elsevier). (c) Schematic for tensile test specimens of 316L slope thin-wall (Reprinted from ref. [2], copyright (2016), with permission from Elsevier).
Coatings 12 01104 g009
Figure 10. Schematic of the deformation process of thin-walled parts. (a) Before the LAM; (b) During the LAM; (c) After the LAM (Reprinted from ref. [46]. copyright (2020), with permission from MDPI).
Coatings 12 01104 g010
Figure 11. (a,c) Thermal field (isothermal contours), (b,d) stress field (Von Mises) for the second-layer deposition at different times on the surface normal to y = 0 (Reprinted from ref. [43], copyright (2009), with permission from Elsevier).
Coatings 12 01104 g011
Table 1. Summary of materials used in metal thin-wall by laser material deposition.
SubstratePowder
(Particle Size)
Z-Increment
(mm)
Laser Power
(W)
Scanning Speed (mm/s)Powder Feed Rate
(g/s)
Ref.
steel C1045, 20#45# steel, 304, 304L, 316L, 42CrMo4 steelFe-based
(15~150)
316L, 410,
304L, 313
0.05–0.3250, 300, 350,
800, 1000, 1600
1~14, 5.5, 6,
8.3, 13
0.13, 0.194,
0.04, 0.078
[2,26,32,33,34,35,36,37,38,39,40,41,42,43,44,45]
Fe-16Al (wt%)0.25-90.2[46]
24# steel,
Pure iron
-220, 250, 3002.5~3.50.012, 0.58,
0.77
[1,47]
M4,
Fe 105 steel
-260, 440, 5005.5, 8.30.1[48,49]
45# steel, 316L, Q235Ni-based
(45~106)
Ni60, Ni60A-800, 25003.3, 50.067, 0.083,
0.117
[50,51]
IN 718, IN6250.3175~275, 650,
1000
6~100.033, 0.198,
0.333
[52,53,54]
γ-TiAl, Ti-6Al-4VTi-based
(45~150)
γ-TiAl-200, 250, 3008, 10, 120.048~0.733[55]
Ti-6Al-4V-800, 100050.033~0.135[56,57]
316L-CrCoNi0.48009.50.228[58]
EN AW-5083-Al-Mg-Mn-500, 550, 6009.167-[59]
Table 2. Maximum values of 316L thin-walled parts’ top surface unevenness measured with different laser defocusing distances (Dl) and powder defocusing distances (Dp) [33].
Dp (mm)Dl (mm)Total Layer NumbersSurface Unevenness (mm)
−1+
(Above the
substrate)
900.325
01.098
12.886
+
(Above the
substrate)
−32.403
01.098
30.702
Table 3. Tensile properties of CrCoNi medium-entropy alloy and 316 samples of thin-wall fabricated by LMD and casting process in the vertical and parallel direction.
PowderProcess RouteLoading DirectionYield Strength (MPa)Ultimate Tensile Strength (MPa)Elongation (%)Ref.
CrCoNiLAMvertical360.793584.58453.690[58]
parallel364.941574.55836.943
Casting-257.713547.93582.650
-~170~480~55[93]
316LAMvertical35253646[14]
parallel55863921
Anneal-24158650
Table 4. Summary of relevant Ti-6Al-4V mechanical properties by LMD process during the tensile axis was along longitudinal orientation [67].
Built Part GeometryYield Strength
(MPa)
Ultimate Tensile Strength
(MPa)
Elongation
(%)
Test coupon1105 ± 191163 ± 224 ± 1
Tall wall1052 ± 271153 ± 135.3 ± 2.1
Flat plate984 ± 251069 ± 195.4 ± 1
Cruciform thin-wall959 ± 221064 ± 23 MPa11
Wrought973 ± 81050 ± 817
Publisher’s Note: MDPI stays neutral with regard to jurisdictional claims in published maps and institutional affiliations.

