Article

Effect of Groove Width on Micromachine Groove Texture Tribology Characteristics of 0Cr17Ni7Al

1
School of Mechatronics Engineering, Henan University of Science and Technology, Luoyang 471023, China
2
Luoyang Bearing Research Institute Co., Ltd., Luoyang 471039, China
3
School of Mechanical Engineering, Tsinghua University, Beijing 100084, China
*
Author to whom correspondence should be addressed.
Coatings 2022, 12(8), 1221; https://doi.org/10.3390/coatings12081221
Submission received: 19 July 2022 / Revised: 15 August 2022 / Accepted: 19 August 2022 / Published: 21 August 2022

Abstract

:
Friction and wear are the main forms of material surface failure. Surface modification is very effective in friction reduction and wear resistance systems. Therefore, as a method of surface modification to improve the tribological properties of materials, surface texture has been widely loved by scholars. However, most scholars use laser and other processing methods to prepare the surface texture. Although these processing methods have a high preparation efficiency, they cannot obtain a surface texture with high dimensional accuracy due to their non-contact processing characteristics. Moreover, previous studies on different surface texture preparation methods are insufficient. Scholars have not fully studied the size parameters of surface modification. Micromachining is a contact machining method. It has high dimensional accuracy. Therefore, the surface groove texture of 0Cr17Ni7Al material commonly used in sliding bearings was prepared by micromachining in this paper. Under dry friction conditions, the effects of different groove widths on the tribological properties of surface texture were studied. The results show that the friction coefficient at the 0.6 mm-wide groove texture is the lowest, σ = 0.632. The minimum wear rate is ω = 3.351 × 10⁻⁴ mm3/(N·mm). The friction coefficient and wear rate of all groove textures are lower than those of untextured surfaces. It can be judged that the groove texture prepared by micromachining has good friction reduction and wear resistance under the same load, time, and linear speed. With the increase of the groove width, the friction coefficient and wear rate of groove texture decrease first and then increase.

1. Introduction

Wear is the main failure form of materials and has been widely studied by international researchers. In addition to the scientific design of friction systems, surface modification technology has become the main way to reduce friction and wear [1,2,3]. In 1978, Walsh [4] believed that the resistance of a surface texture can be reduced by 10% compared to a smooth surface. Then, Etsion [5] found that selecting the appropriate pit size and pit area occupancy can increase the bearing characteristics. Thus, the door to surface texture research was opened, and researchers began to pay more and more attention to it. The friction characteristics of the metal contact surface can be optimized through the micro-modeling technology of the contact surface, that is, texture modification, and the friction reduction effect is obvious [6,7,8]. Surface texture technology has opened-up a new direction for tribology research. Common surface texture shapes include circle, ellipse, sphere [9,10,11], diamond, groove [12], and cone [13,14].
There are many factors influencing the tribology characteristics of surface texture, including relative velocity, relative load, lubricating conditions, surface size parameters, and ambient temperature [15,16]. The size of the surface texture is the main influencing factor. The size of surface texture is generally too large or too small, which is not conducive to giving full play to texture, and even has a negative impact. Therefore, researchers have carried out research in many aspects, such as research on different sliding directions of textured surfaces [17], surface friction coupled with lubricating oil and surface texture [18,19], research on adding additives to textured surfaces [20], research on the hydrophobicity of the surface texture [21], increasing friction by using a convex surface texture [22], corrosion resistance of surface texture [23], the combination of fabric and surface texture [24], and the reduction of resistance by surface texture [25], etc. Many scholars have tried to use different methods to optimize the design parameters of the surface texture. Through the research, it was found that the distribution mode, depth parameter, texture orientation, texture area density, texture spacing, and texture pit bottom shape of the surface texture are important parameters for the study of surface texture [26,27,28,29,30,31]. The variable texture geometric parameters make the surface texture have broad development space and application prospects [32]. The design of the texture mostly imitates and optimizes the bionic structure to improve the friction performance in practical application [33]. It can be seen from the above literature that the structural parameters of surface texture are significantly related to their tribology characteristics. However, a large number of scholars’ studies on the size parameters of surface texture mainly focus on the area density, depth, and texture angle. However, there are few studies on the influence of the geometric size of the width of the texture on the tribology characteristics. Moreover, most scholars use laser and other processing methods to prepare the surface texture. Although these processing methods have a high preparation efficiency, they cannot obtain surface texture with high dimensional accuracy due to their non-contact processing characteristics. Moreover, previous studies on different surface texture preparation methods are insufficient. Micromachining is a contact machining method, and high dimensional machining accuracy can be obtained.
Based on the previous research of the authors [34,35], the groove texture of 0Cr17Ni7Al material commonly used in sliding bearings is prepared by using the micromechanical preparation method with controllable texture size. The friction test machine was used to carry out the tests under different groove widths. We used the scanning electron microscope (SEM) and energy spectrometer (EDS) to analyze the surface morphology and the friction and wear state of the samples. The friction and wear mechanism of texture is discussed. The tribology characteristics of textured surfaces with different texture widths were studied and the influence of different groove widths on the texture and tribological properties of micromachined grooves was investigated. This study provides a theoretical basis for the practical application of micromechanical groove texture.

2. Materials and Methods

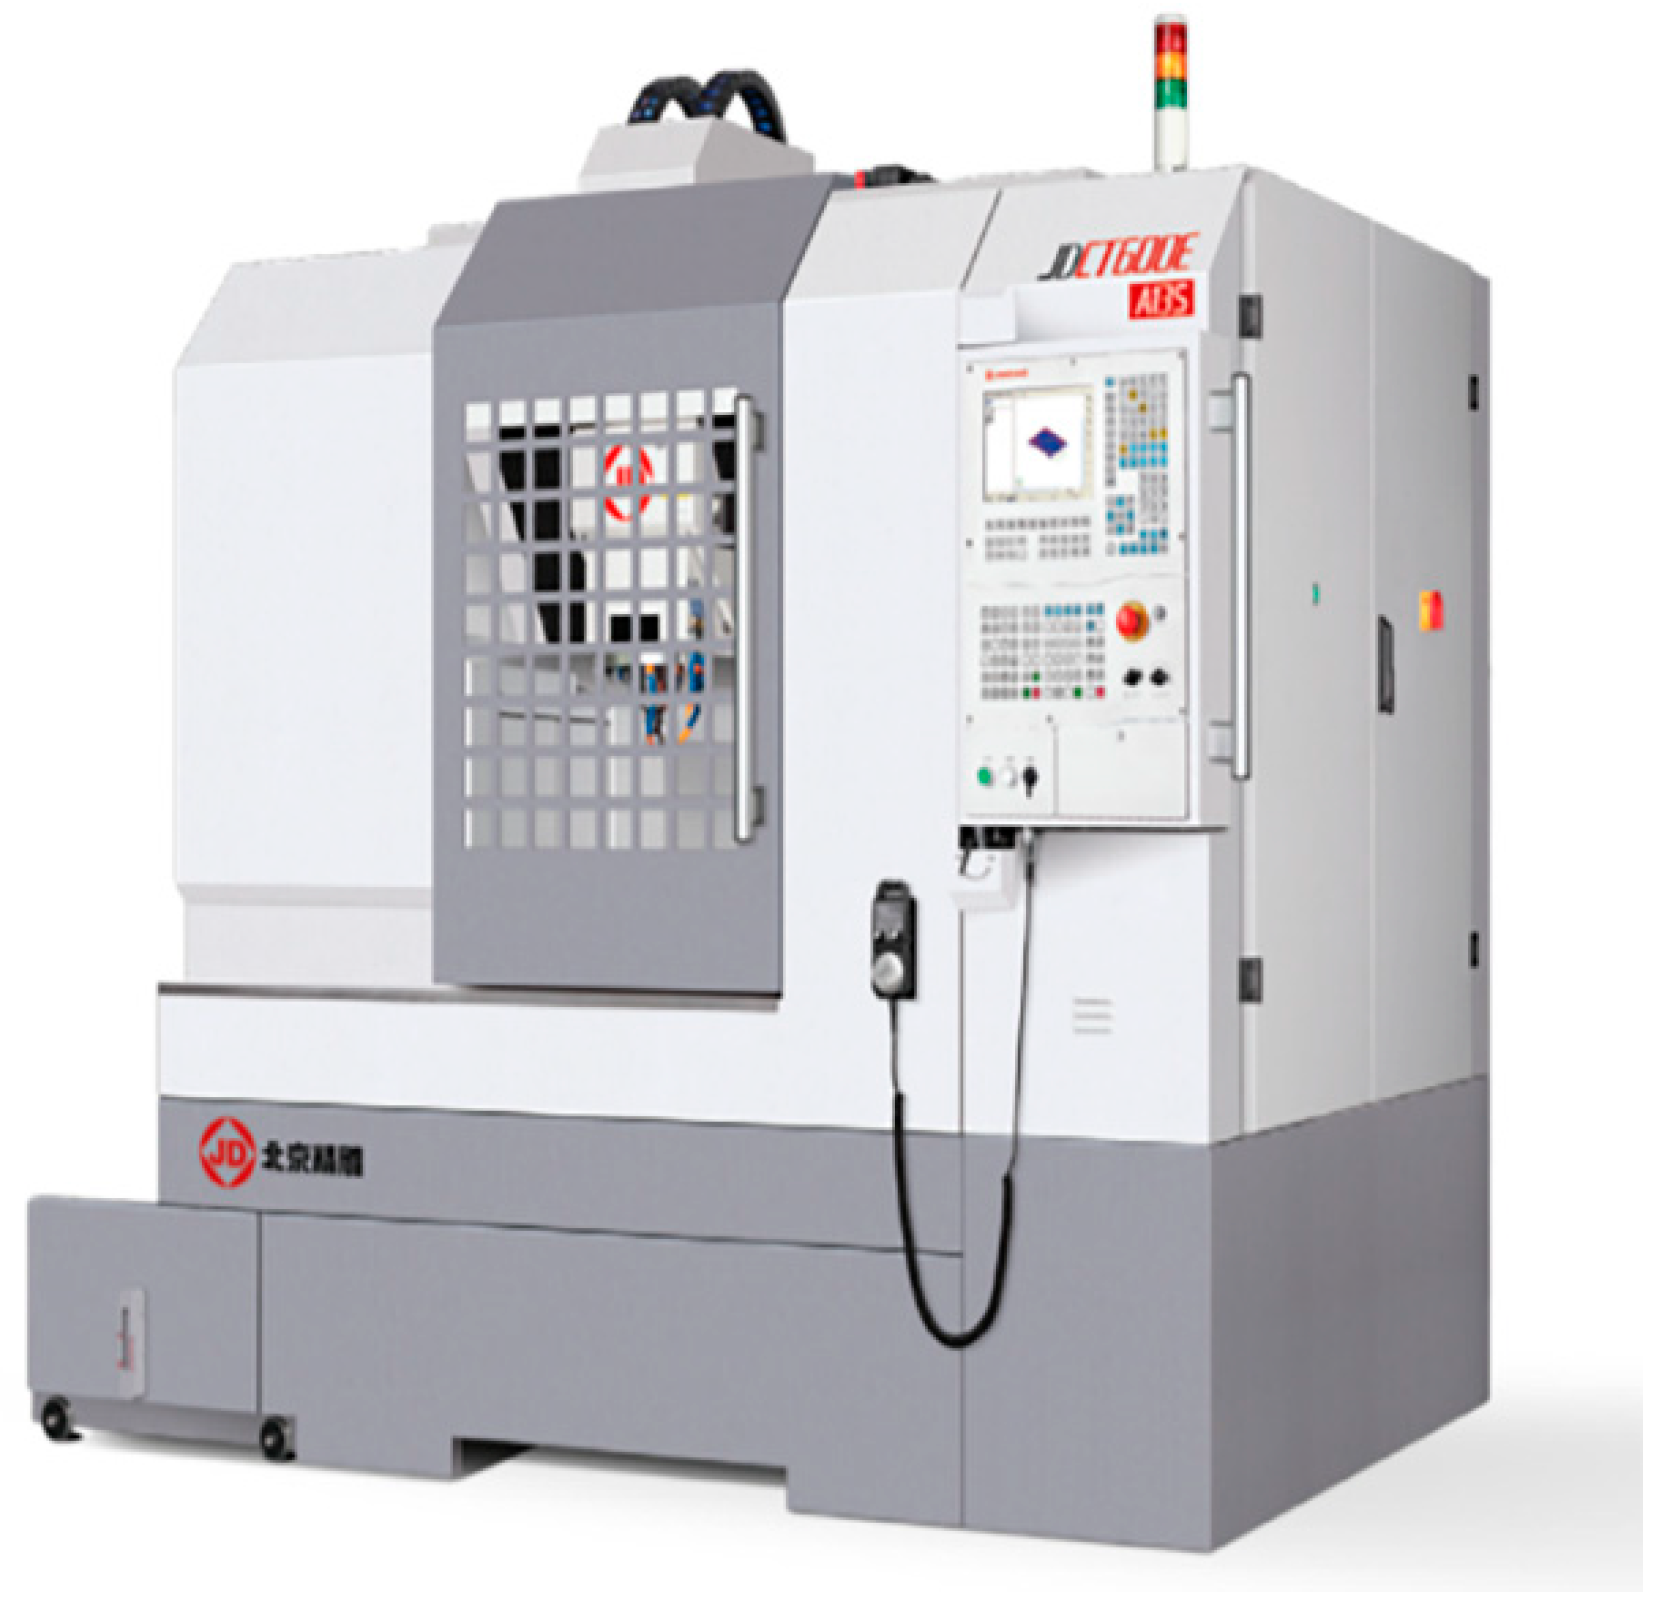
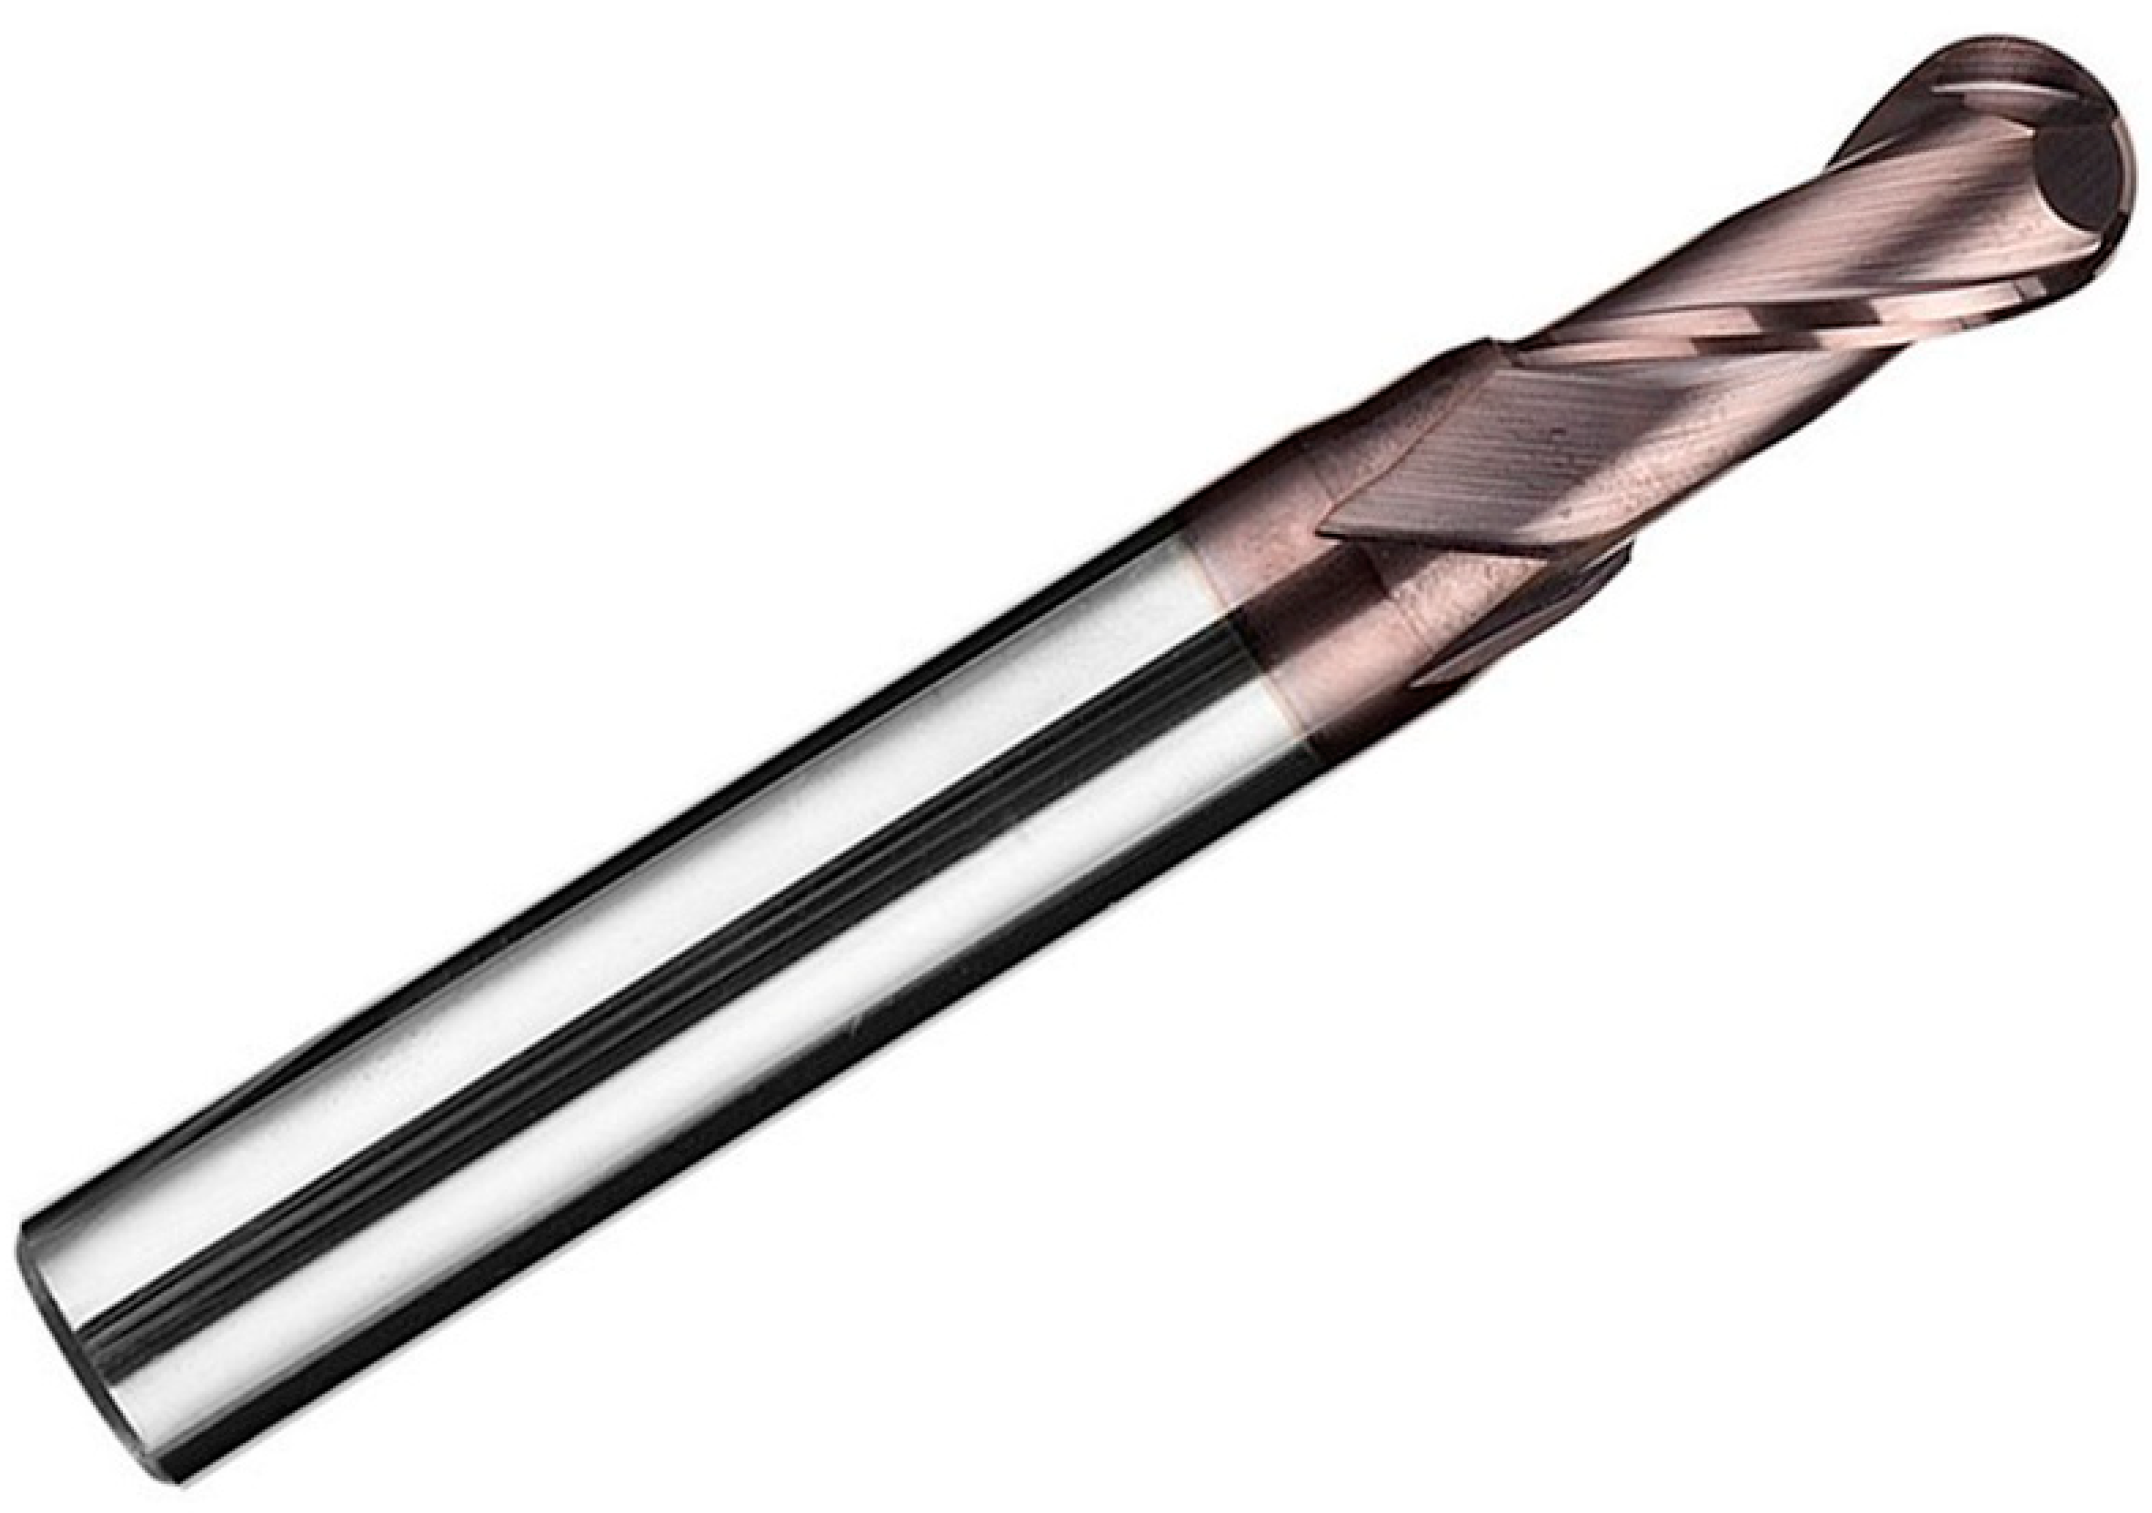
2.1. Micromachining Plate

With the deepening of scholars’ research on surface texture, there are more and more surface texture processing methods, such as micromachining [36,37,38,39,40], EDM [41], laser [42], shot peening [43], ultrasound [44], chemical etching [45], electrolysis [46,47], etc. The costs of various methods for preparing surface texture vary. Among them, the cost of EDM and chemical etching is the highest, and the cost of laser and micromachining is the lowest.
Micromachining is a low-cost and convenient metal-cutting technology. Through specific equipment and tools, the shape of a specific texture on the surface of parts is prepared. The tools used are often made of materials with wear resistance, high-temperature resistance, and high bending strength and stiffness, and have very sharp cutting edges. Micromachining has the advantages of high preparation efficiency and unlimited processing materials, which greatly improves the surface dimensional accuracy.
Figure 1 shows that the friction test samples in this paper were prepared by the JDGR200T precision carving high-speed machining center, produced by Beijing Jingdiao Technology Group Co., Ltd. (Beijing, China).
Figure 2 shows the ball end-milling cutter required for preparing the sample. Table 1 shows the main processing parameters of the JDGR200T precision carving high-speed machining center equipment.
To ensure that all texture samples have the same variation of the groove width, the parameters of texture samples are set as shown in Table 2.

2.2. Friction and Wear Test Material

The tribological properties of the groove texture on the surface of 0Cr17Ni7Al were studied by using an MFT-5000 friction tester. The relevant parameters of the testing machine and the sample are shown in Figure 3 and Table 3, respectively.
The friction pair of the friction and wear experiment adopts the experimental method of fixing the upper test piece (ball) and rotating the lower test piece (disk). As shown in Table 4, relevant experimental parameters were set.
Friction experiments were conducted on smooth surfaces and four kinds of micromechanical texture test pieces. Before the test of each group of samples, we used acetone for ultrasonic cleaning for 5 min, and used ether to clean the surface of the samples. After the experiment, the wear morphology was detected by SEM and EDS, and the results were analyzed with the change of the friction coefficient.

2.3. Friction and Wear Calculation

We listed the specific experimental parameters in Table 4. The cross-sectional profile of the wear trace was detected by the white light interferometer, and we calculated the wear area by integrating the cross-sectional profile. The wear volume was obtained by multiplying the friction step and the wear area [48]:
H = V F S
where H is the wear rate, 10−4 mm3/(N·mm), V is the wear volume, mm3, F is the load, N, and S is the sliding distance, mm.
We prepared the experimental materials and the experimental equipment was de-bugged. The friction and wear experiments were completed according to the set experimental parameters. The formula in Section 2.3 was used to calculate the wear rate. The specific detection and analysis of the results are described below.

3. Results and Discussion

3.1. Friction and Wear

It can be seen from Figure 4 that both untextured and textured surfaces entered a stable wear stage at 200 s. In Figure 4a, although the fluctuation range of the friction coefficient is small, it shows a stable upward trend over time. In the whole friction stage, it did not really enter the stable stage. We can call this stage the pseudo-stable stage. It can be judged that in the overall friction stage, the friction of the untextured surface has been intensifying. It can be seen from the curve in Figure 4b that the friction coefficient curve jumps at 100 s. Although it enters the stable stage at 200 s, the fluctuation range of the friction coefficient becomes larger with the progress of the friction. Although there is also a jump in Figure 4c, the friction coefficient is in a small range. The friction coefficient is small, so it can be inferred that the surface texture of 0.6 mm has better friction reduction performance. The initial stage of the friction coefficient curve in Figure 4d is a smooth transition, and the fluctuation range of the curve is small. Although the curve in Figure 4e enters the stable stage faster, the curve is generally stable. However, the friction coefficient has been maintained at a high level. It shows that the friction reduction performance of the 1.0 mm surface texture is poor, but the friction stability is good.
In combination with Figure 4 and Table 5, we analyzed the reasons for the above phenomena. We can see that the friction coefficients of all surface textures were smaller than those of untextured surfaces. It shows that the surface groove texture has good friction reduction performance. It may be caused by the following two reasons. The first reason is that during the friction process, wear debris is carried away with the friction and stored in the groove. The further aggravation of abrasive wear is reduced. The second reason is that during the friction process, the texture groove can reduce the contact area and contact time of friction. Thus, the increase of friction heat is reduced to achieve the effect of heat dissipation. It slows down the formation of oxidation wear and fretting wear. For different widths of texture, the surface friction coefficient curve has different characteristics. We need to introduce a new term to explain this friction reduction characteristic, that is, “leap times”. The number of leaps refers to the number of times that the upper specimen ball leaps over the groove in the whole friction process. Different groove widths will inevitably lead to different numbers of grooves under the same texture plane density.
It can be seen from the parameters in Table 6 that the parameters of the friction experiment were the same. In the whole friction process, the number of leaps of the ball in different groove widths is different. This is probably the reason why there are different friction coefficient curves, because after the ball flies over the groove, the ball contacts with the groove and constantly collides. The vibration of the friction pair makes the wear debris roll and slide to reduce friction. However, samples with different groove widths have different collision laws, resulting in different friction characteristics. The untextured sample is regarded as the groove texture with zero groove width. The friction coefficient first decreased and then increased with the increase of the groove texture width. The friction coefficient of surface texture with a 0.6 mm groove width was the lowest, σ = 0.632. The friction reduction effect was the best at this time. The general trend of the wear rate also decreased first and then increased with the increase of the groove texture width. Similarly, when the groove width was 0.6 mm, the minimum wear rate was ω = 3.351 × 10 4   mm 3 / ( N · mm ) . This shows that the surface texture with a 0.6 mm groove width had the best friction reduction and wear resistance effect. Therefore, it is necessary to find out the friction and wear law of groove texture and make rational use of the tribological characteristics of different widths. Only in this way can the surface texture modification be applied to practical engineering and play the role of friction reduction and wear resistance.

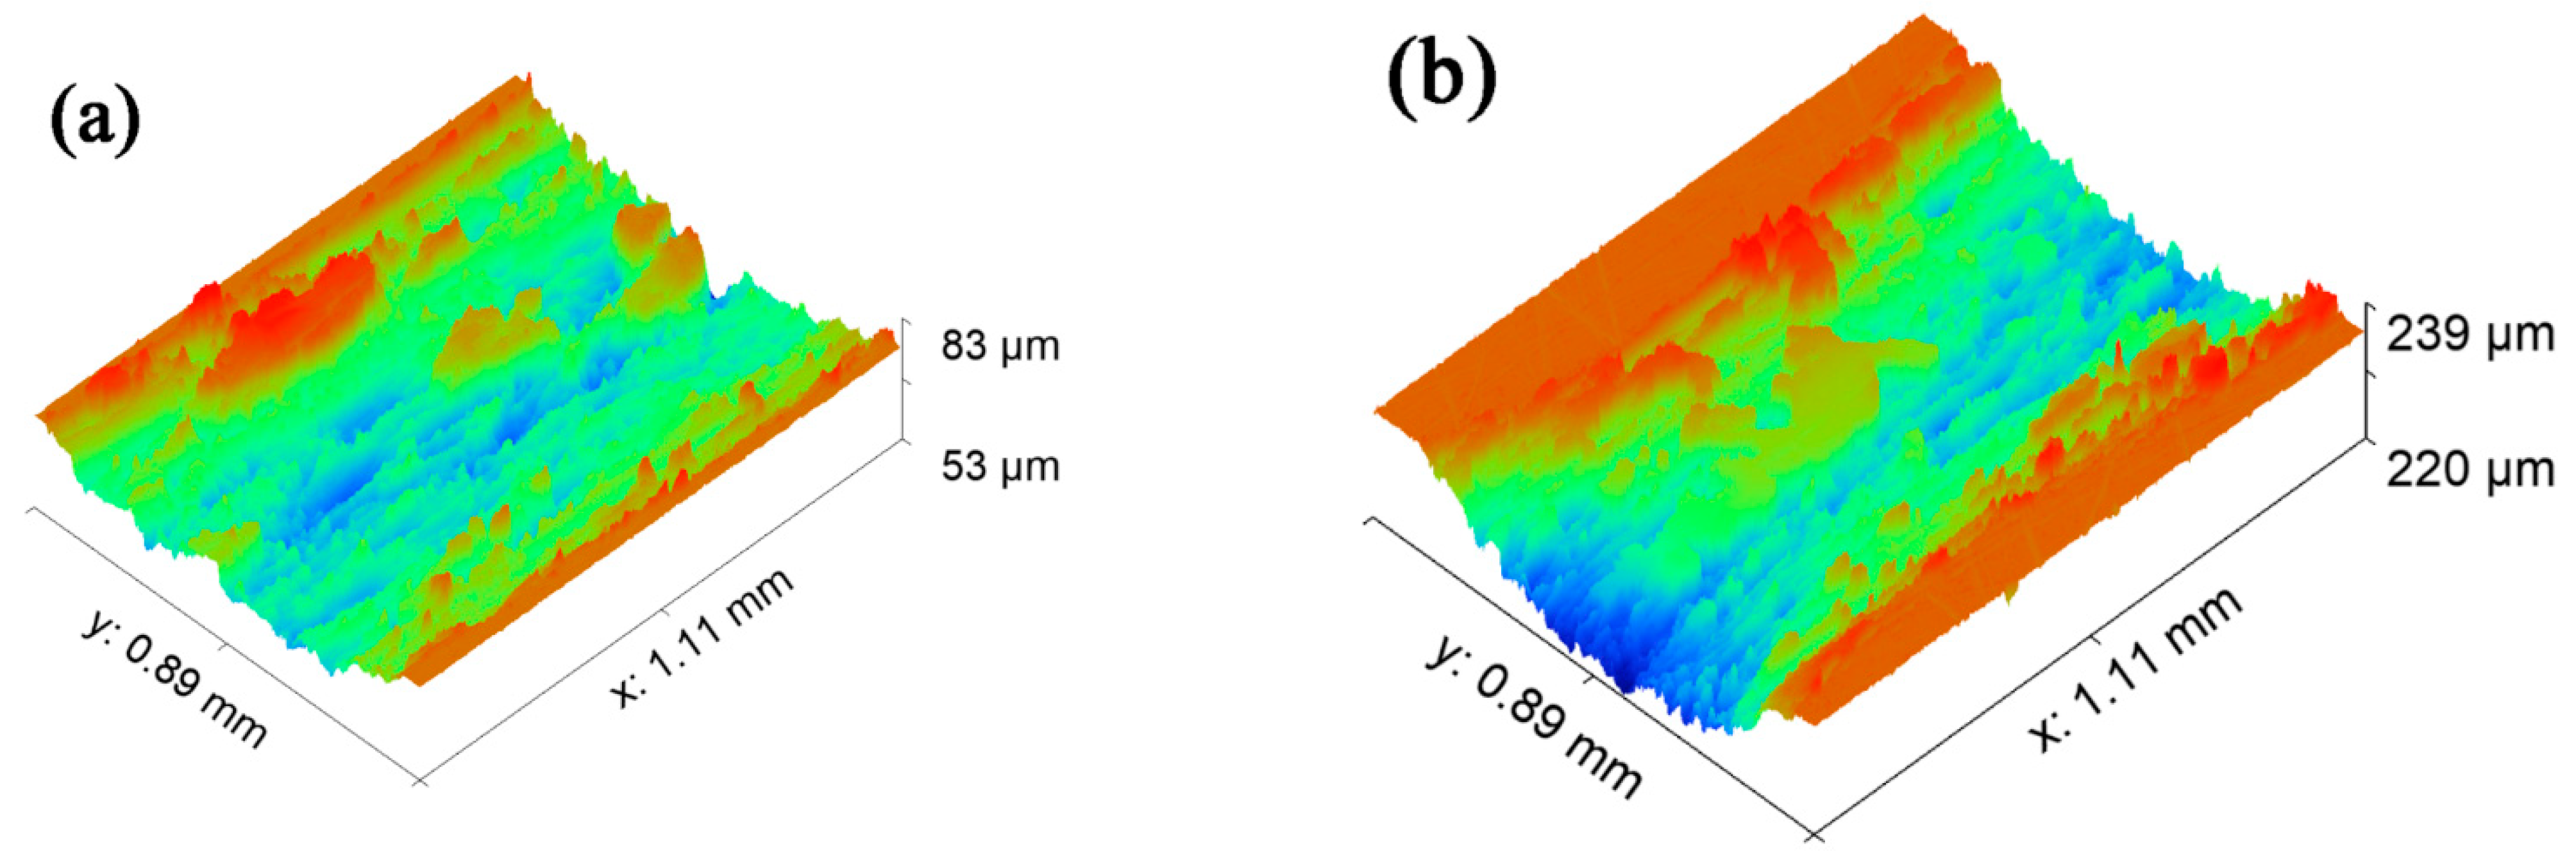
3.2. Wear Morphology Analysis

The flaky convex part formed on the surface of the wear mark is called the hard phase peak [34]. This kind of hard phase peak may be the migration of wear debris under the combined action of the load and sliding speed in the process of friction. It is formed by rapid cooling after friction generates heat. It can be seen from Figure 5 that the red part is the hard phase peak. The hard phase peak near the middle part of the wear mark is the hard phase peak of the wear mark. The hard phase peak near the edge of the wear mark is the edge hard phase peak. The blue part in the figure is the pear groove produced during the friction process. It can be seen from Figure 5a that the untextured wear scar surface is mostly the hard phase peak of the wear scar. Combined with Table 5 and Figure 5, it can be seen that this hard phase peak is not conducive to friction reduction and will aggravate wear. In Figure 5b, there are both wear scar hard phase peaks and edge hard phase peaks. However, the number of hard phase peaks on the edge is more and the area is larger. The two cancel each other out and play a coupling role, which is conducive to further reducing wear. In Figure 5c,d, there are basically edge hard phase peaks and pear furrows. Under the positive action of the edge hard phase peak, the wear of the groove texture is reduced. It can be seen from the ordinate of the wear scar morphology in Figure 5e that the surface wear scar depth of the 1.0 mm groove texture is larger. At this time, the reverse effect of the hard phase peak in the wear scar has exceeded the positive effect of the edge hard phase peak.

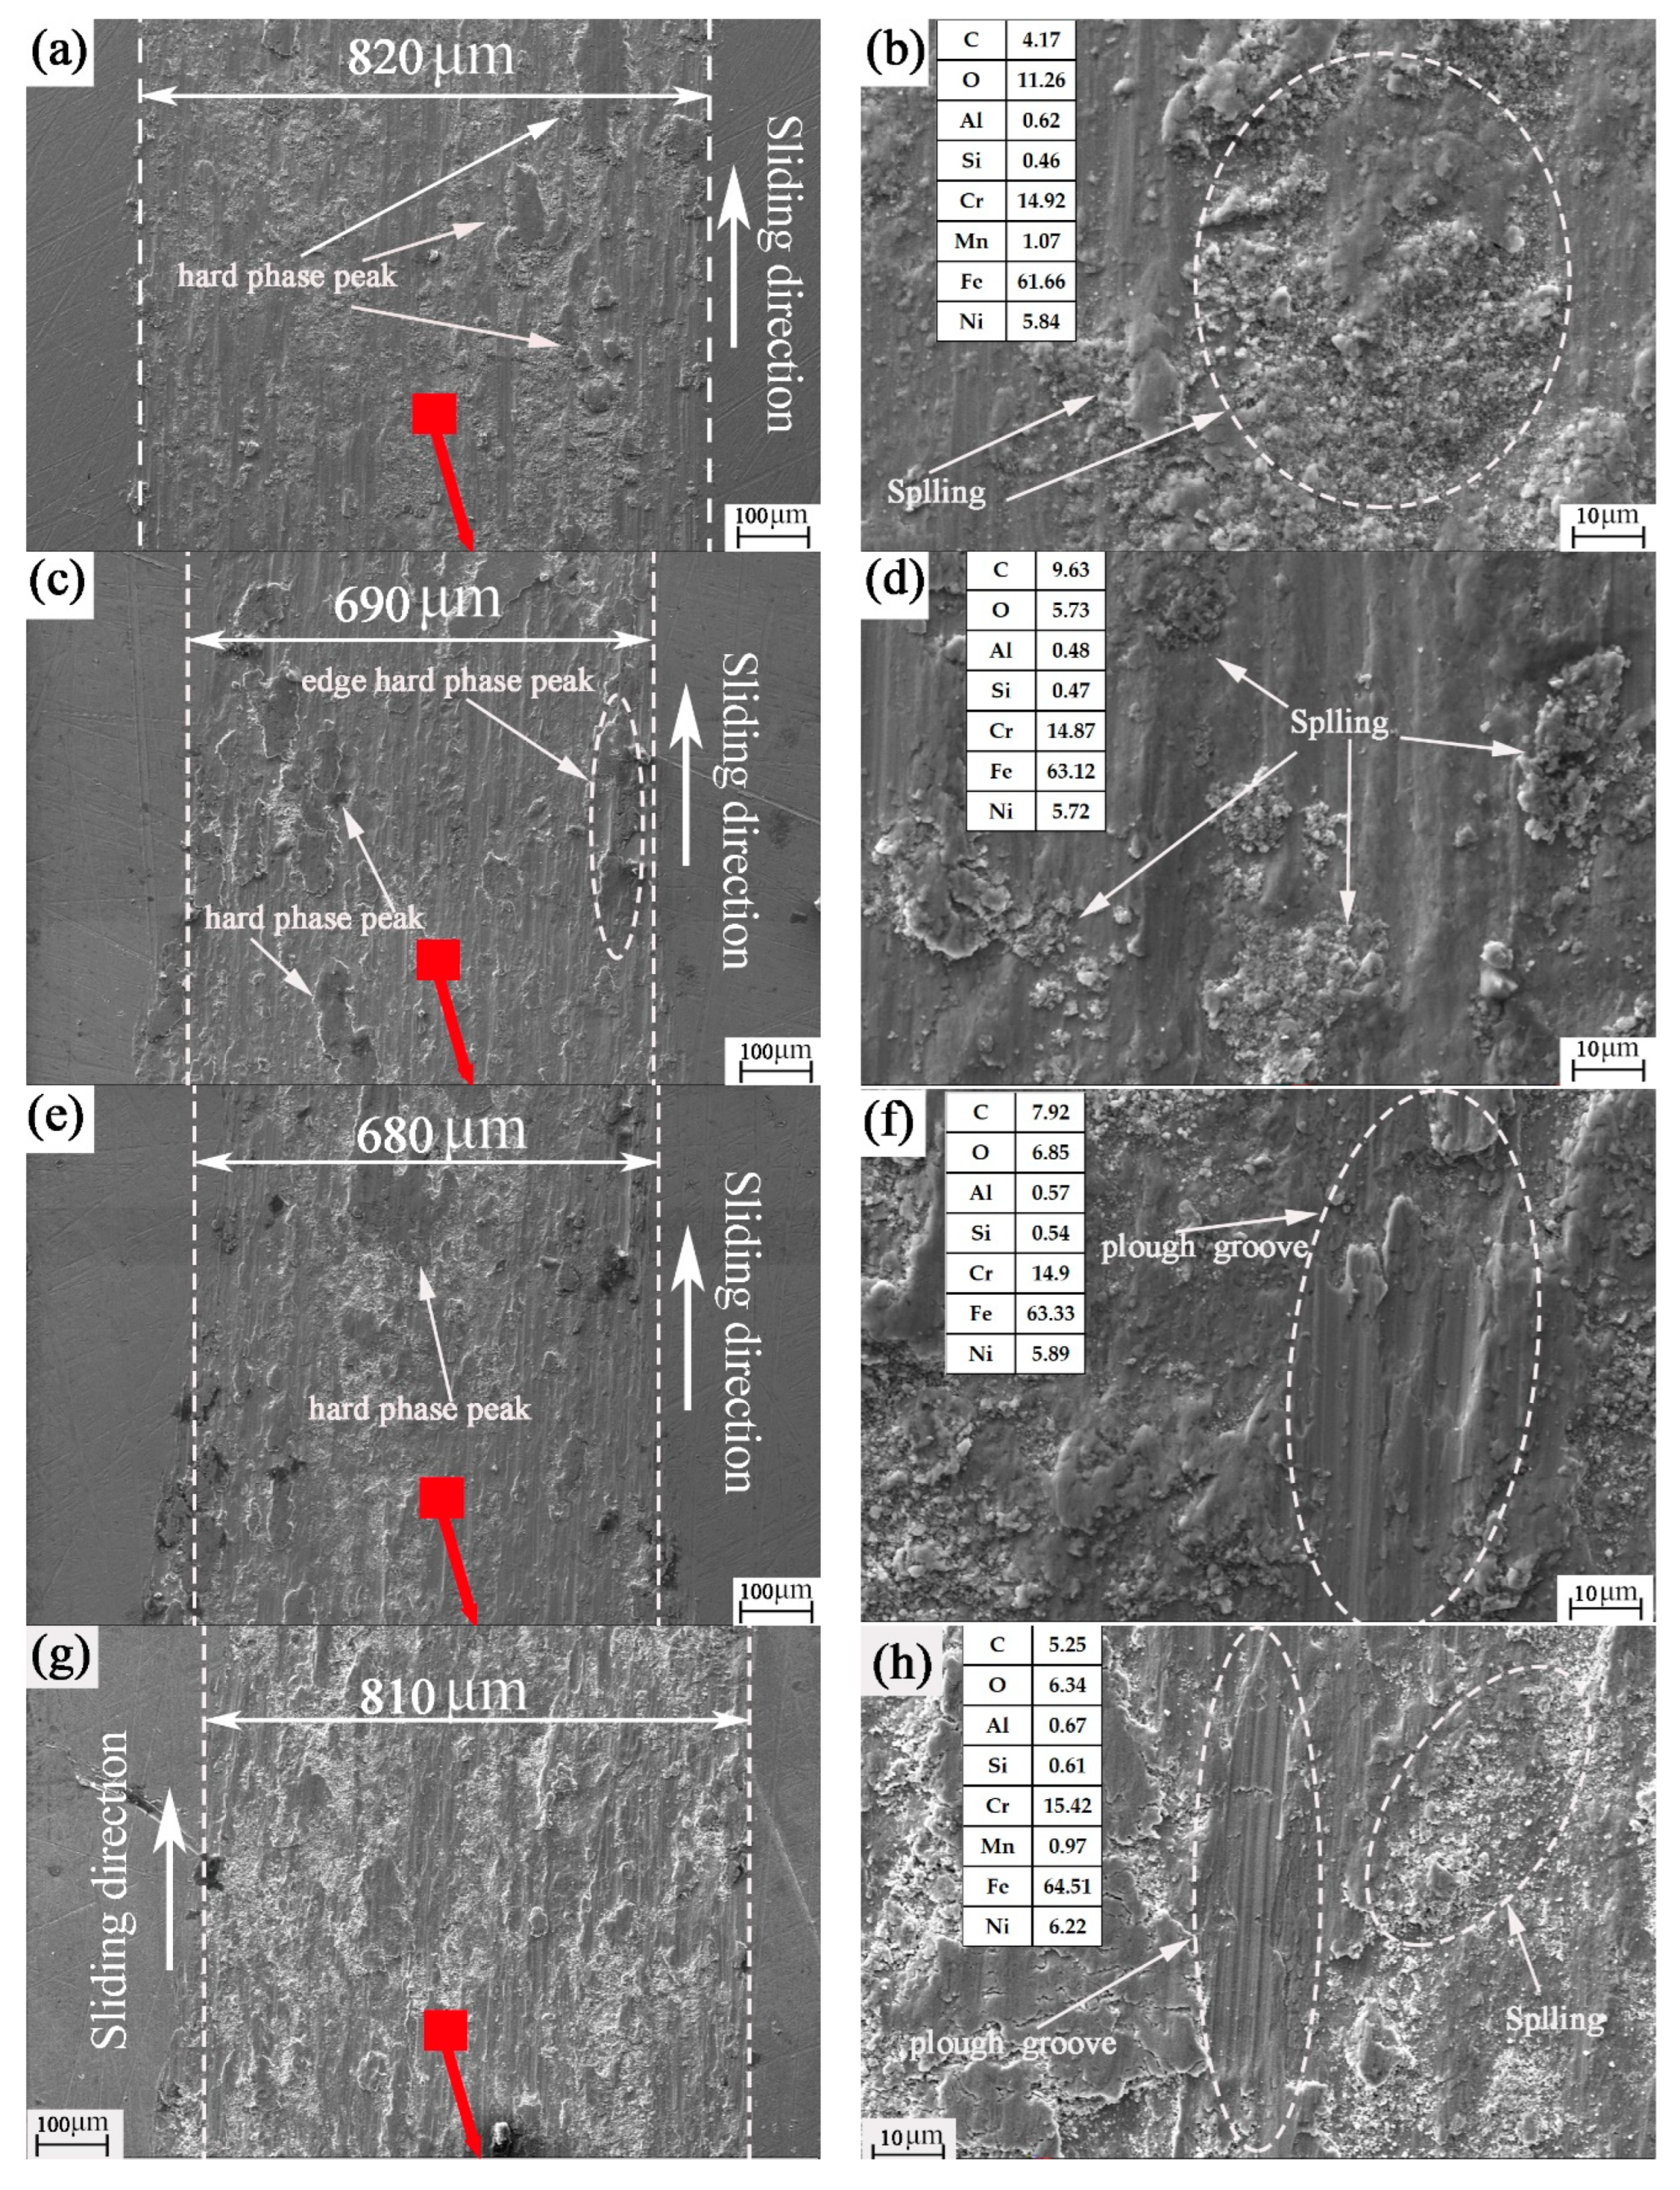
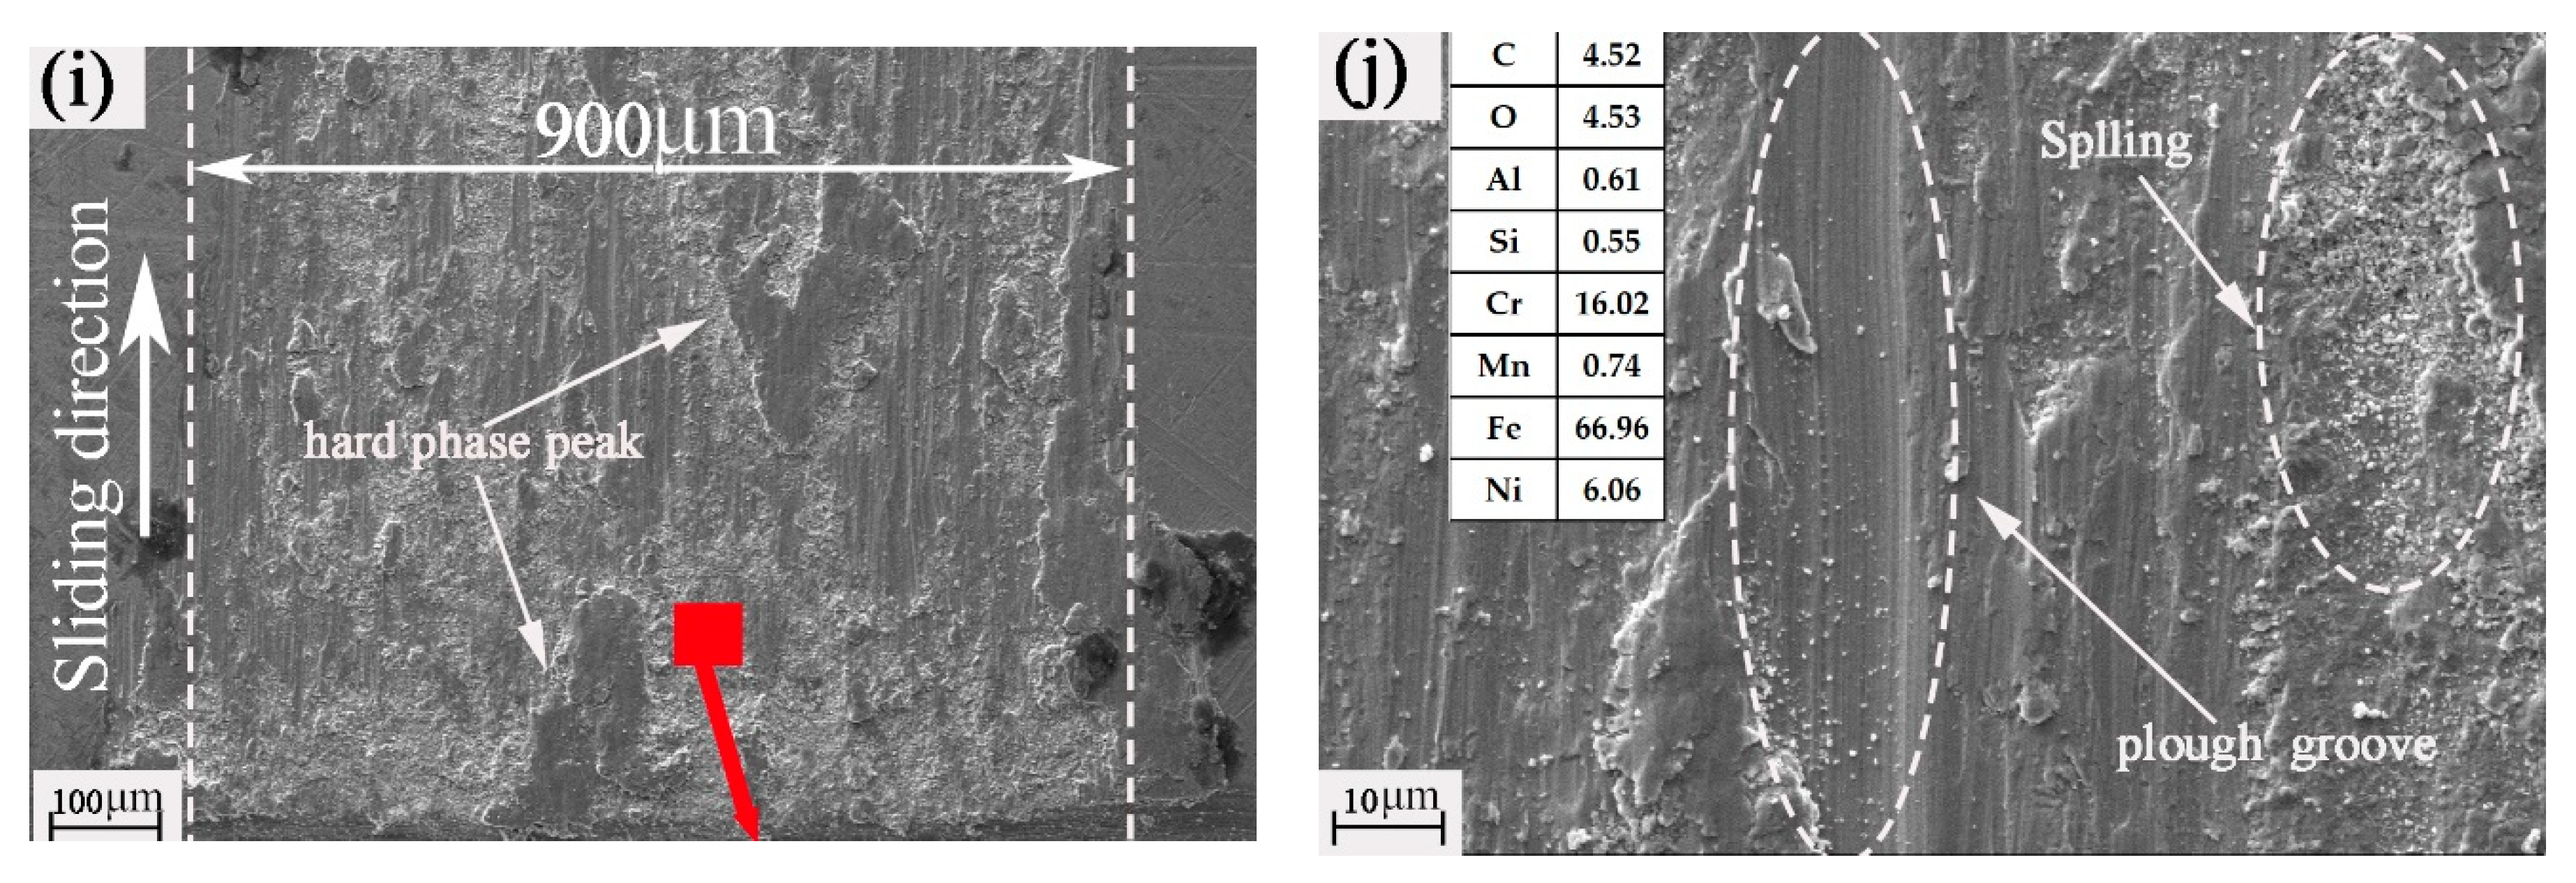
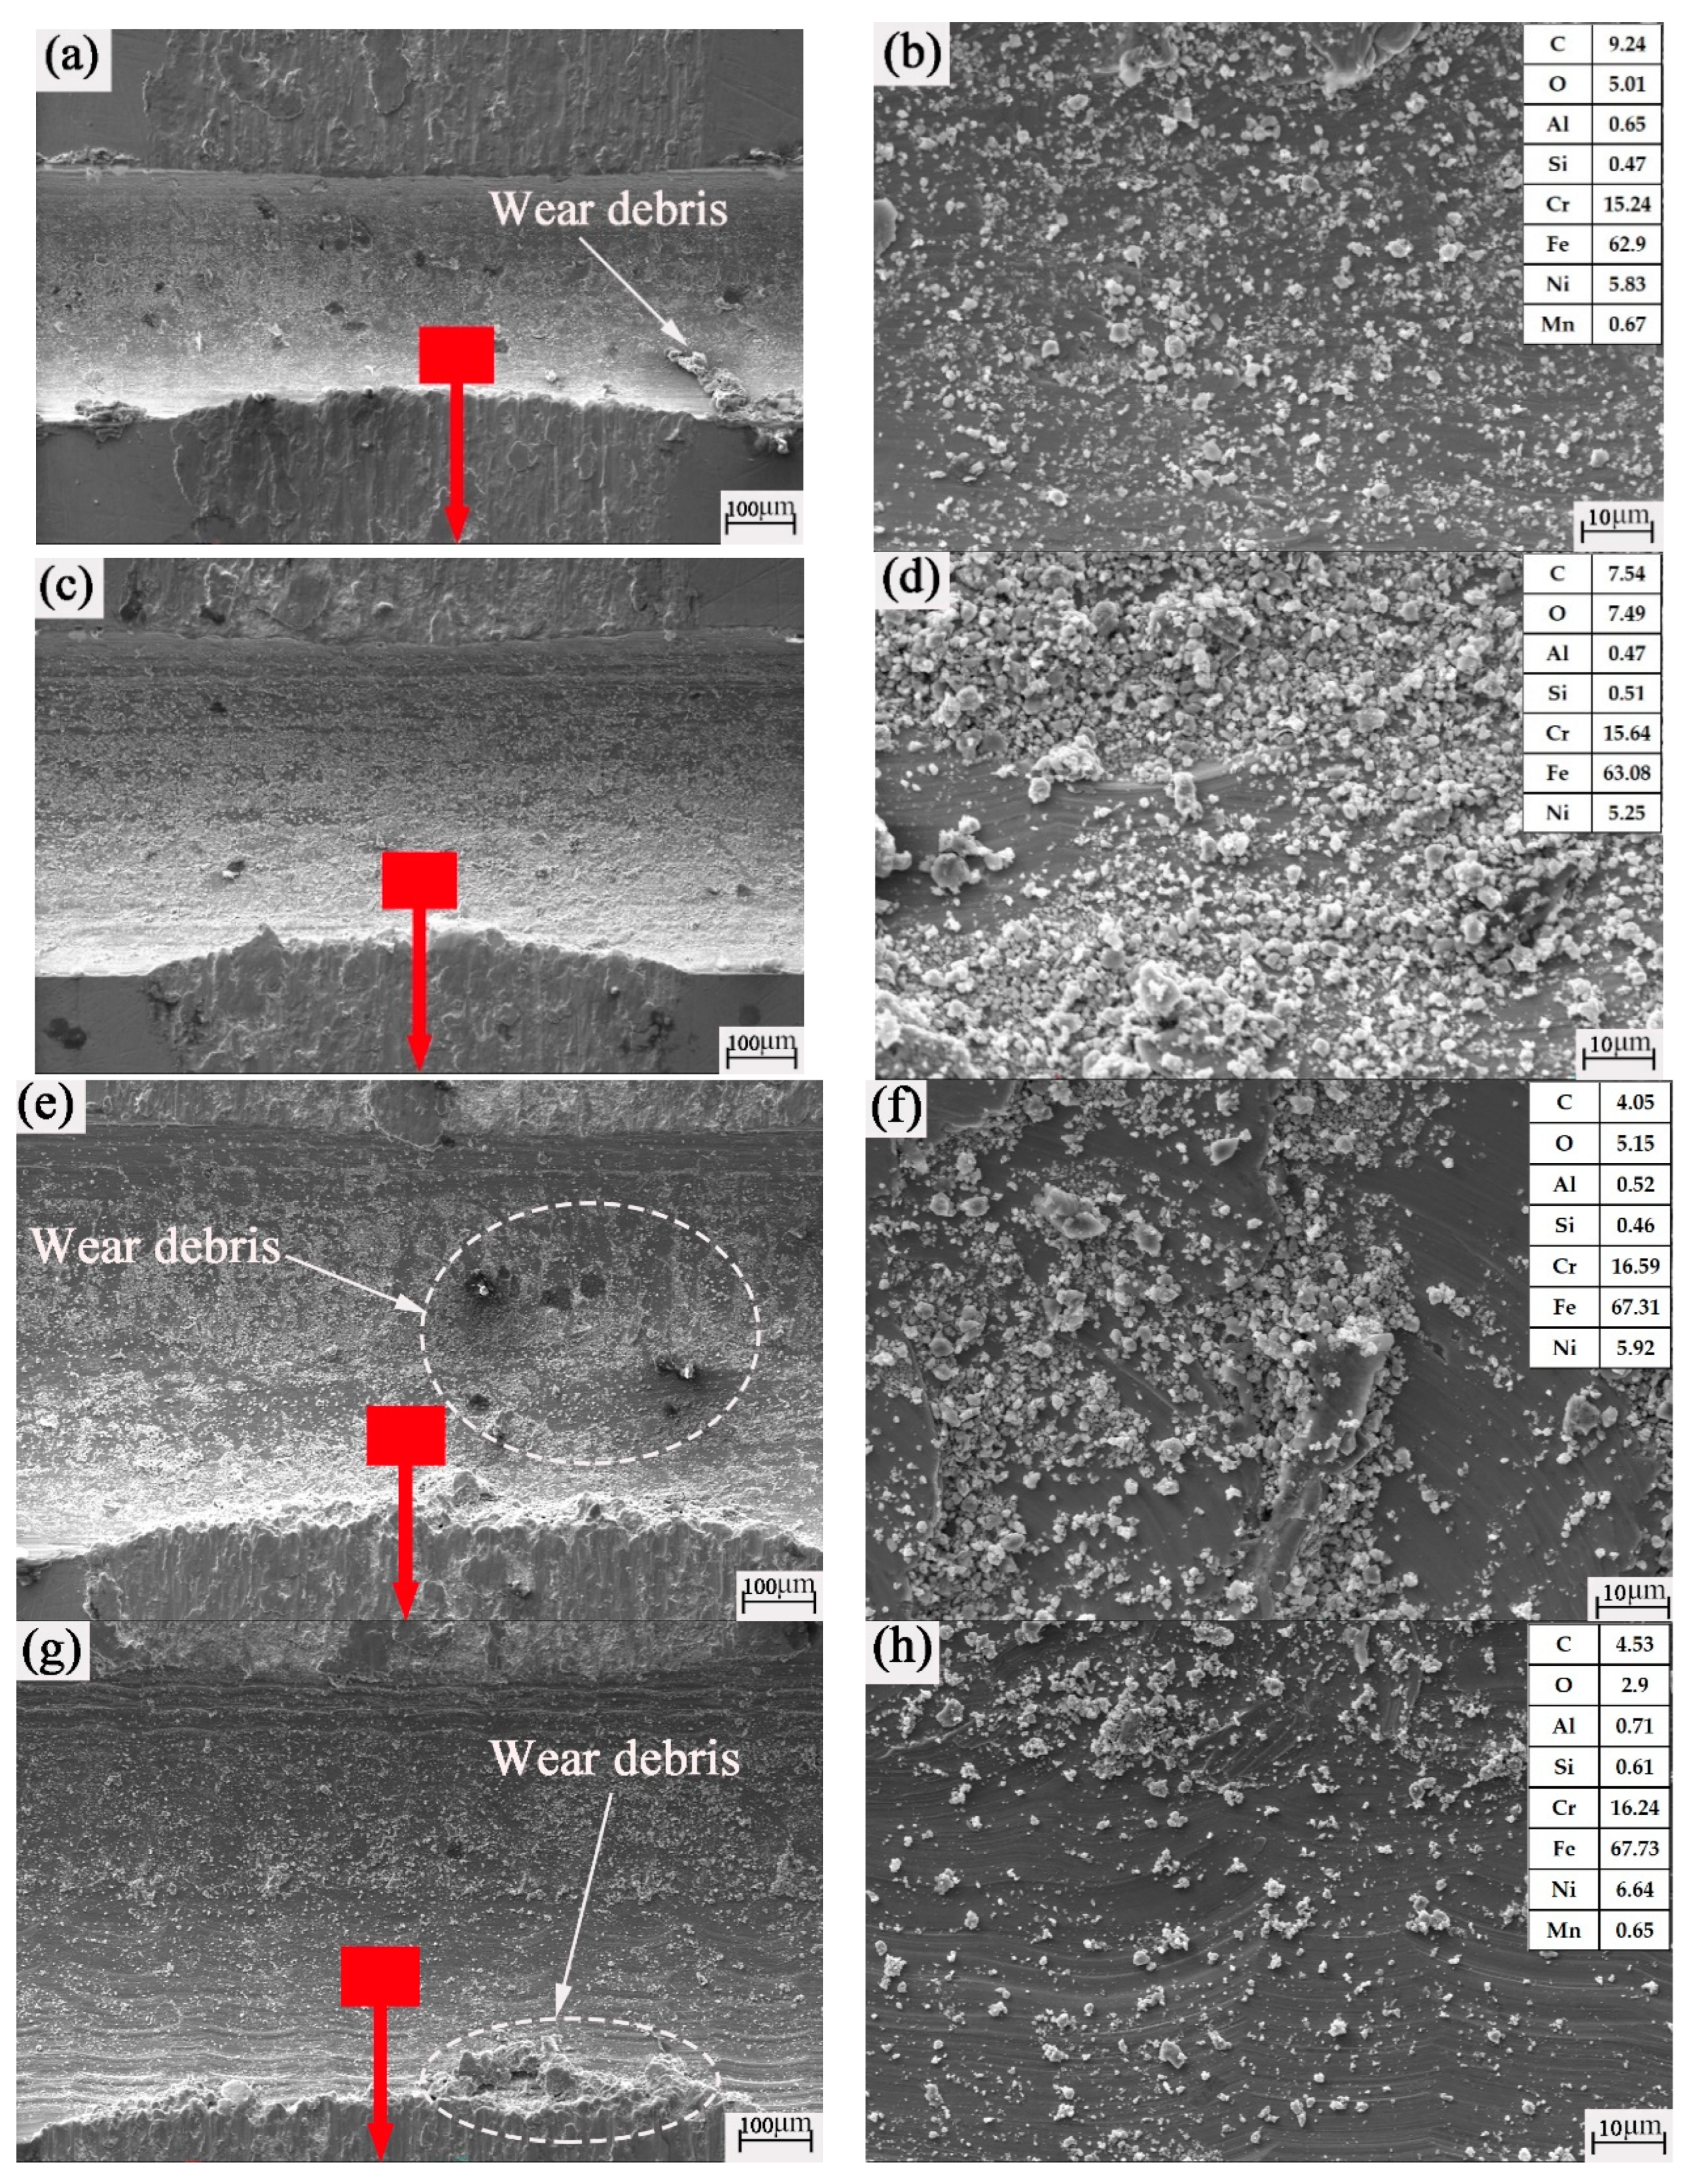
3.3. Scanning Electron Microscope and Energy-Spectrum Analysis of Plate Worn Surface

As mentioned above [48], the hard phase peak that formed on the surface of the friction pair during the friction process plays an important role in friction and wear. The hard phase peak is divided into a wear mark hard phase peak and an edge hard phase peak. It can be seen from Figure 6 that the wear scar width of untextured and 1.0 mm textured surfaces is relatively large. The 0.6 mm textured surface has the smallest wear scar width. As shown in Figure 6a,b, a large number of surface spalling has occurred on the untextured surface. Moreover, there are less wear debris in the wear scar area of the surface, but there are larger glued flakes. This is because at the initial stage of wear, the debris produced by abrasive wear may accumulate and glue together due to the concentrated heat generated at the moment of friction, forming a hard phase peak of wear marks. As mentioned earlier, the hard phase peak of the wear mark intensifies further wear. This is also the main reason for the gradual increase of the friction coefficient and pseudo-stable wear of untextured samples. At this time, the untextured surface has basically changed from abrasive wear to adhesive wear. It can be seen from Figure 6c that there are both wear scar hard phase peaks and edge hard phase peaks on the 0.4 mm surface texture. In Figure 6d, there are a lot of flaking debris. It shows that at this time, the late stage of abrasive wear and the early stage of adhesive wear exist at the same time, and the form of adhesive wear is the main form.
It can be seen from Figure 6e–h that there are hard phase peaks and pear grooves on the surface of the wear marks. At this time, the wear is mainly abrasive wear, and the abrasive wear and adhesive wear develop together. In Figure 6i,j, there are many flakes and debris. It shows that at this time, it is mainly in the stage of adhesive wear. According to the energy spectrum elements in Figure 6 and Table 7, oxygen is produced in all energy spectra. It is proven that there is abrasive wear and adhesive wear in the friction process. Under the action of friction heat and air, there is also oxidation corrosion wear. It can be seen that this experiment is accompanied by a variety of wear forms combined. The oxygen content in Figure 6b has reached 11.26, which is significantly higher than that of other textured surfaces. It shows that the oxidation corrosion and wear of the untextured surface are serious. However, P, S, and Mn in the energy spectrum elements are not detected in some energy spectra due to their low content.
It can be found from Figure 7 that the bottom size of the texture groove is regular. There is a large amount of wear debris in the groove. It shows that the groove plays a good role in capturing and storing wear debris. Relatively speaking, there are large pieces of wear debris in Figure 7a,b,e–h. In Figure 7c,d, there are a large number of fine debris particles. It further proves the previous inference that the 0.6 mm textured surface is dominated by abrasive wear. The groove textures of 0.4, 0.8, and 1.0 mm are mainly adhesive wear. The energy spectrum oxygen element in Figure 7 can also support our judgment. The oxygen content in the grooves in Figure 7c,d is higher than that in other grooves, which proves that the effect of debris collection in the 0.6 mm texture is better.

3.4. Scanning Electron Microscope and Energy-Spectrum Analysis of Ball Worn Surface

As shown in Table 7, the chemical composition contents of the two pairs of wear parts are very similar. Only in terms of Al and Ni content is the content of the disk higher than that of the ball, so it can be used as an element for observation. From the energy spectrum of all groups of experiments, the content of energy spectrum elements of each surface groove texture under different groove widths is almost the same. Therefore, the energy spectrum with a width of 0.6 mm is extracted and compared to the untextured surface.
As can be seen from Figure 8a,b, the wear marks of the balls are circular. There are some large particles on the surface of the wear trace of the ball, and the wear particles accumulate at the edge of the wear trace along the sliding direction. There are several very obvious ploughs in Figure 8b. After the friction, these convex abrasive particles and ploughs can still exist. It shows that the hardness of these raised abrasive particles is very high. It can be inferred that the bulges and ploughs accumulated by abrasive particles during the friction process will cut the untextured surface like a sharp edge. In Figure 8c,d, the surface of the ball shows the shape of waves. This wave-shaped wear scar surface will play a role in friction reduction. This reduces both friction and wear.
In the previous electric mirror of the disk specimen, we cannot judge whether the material of the ball specimen is transferred to the disk specimen. However, we can see the Al element in Figure 8d, and the mass fraction of the Ni element significantly increases. It can be inferred that the material of the disc with the groove texture is transferred to the ball. The debris generated by friction is subjected to the combined action of load, sliding friction speed, collision, vibration, and friction heat. Some wear debris is captured by the groove. Another part of the wear debris is adhered and transferred to the surface of the spherical specimen to protect the lower test piece and play the role of friction reduction. However, this finding was not found in the electron microscope without a textured sphere. This may be the unique principal characteristic of surface modification of groove texture.

4. Conclusions

This paper studied the effect of groove width on the friction and wear properties of groove texture machined on the 0Cr17Ni7Al surface. The following conclusions were made:
(1)
Micromachining can produce groove texture. The friction coefficient and wear rate of groove texture with a width of 0.4, 0.6, 0.8, or 1.0 mm were lower than those of the untextured surface. The friction coefficient and wear rate decreased first and then increased with the increase of the groove width. The minimum friction coefficient at the groove with a width of 0.6 mm was σ = 0.632. The minimum wear rate was ω = 3.351 ×   10 4   mm 3 / ( N · mm ) . The surface groove texture had good friction reduction and wear resistance.
(2)
It was found that for groove texture, the more times the groove is crossed, the better. It is not that the lower the number of leaps, the better, but within a reasonable range. In this study, the total number of leaps of the 0.6 mm groove texture was 40,000, which is a more reasonable number of leaps.
(3)
This study was compared with previous studies on electric spark, picosecond laser, nanosecond laser, and femtosecond laser [34]. When the size parameters of the groove texture were 0.8 mm-wide, 30 grooves, and the friction radius was 18 mm, the friction reduction performance of the micromachined texture was the best, friction coefficient σ = 0.730. However, the friction coefficient of the five textures was lower than that of the untextured surface. It shows that no matter whether the processing mode did not affect the friction reduction effect of textured or untextured samples, the friction reduction effect of different processing modes was different. The wear rate of the nanosecond laser textured surface was higher than that of the untextured surface under the same friction radius of 18 mm. The texture of other machining methods was smaller than that of the untextured surface, and the wear resistance of EDM texture was the best: wear rate ω = 4.266 ×   10 4   mm 3 / ( N · mm ) . This indicates that when the processing mode of texture is incorrect, the effect of friction reduction may not be achieved.
(4)
In the process of friction, on the one hand, the groove of the texture is conducive to the capture and storage of wear particles by the groove texture. On the other hand, the collision after the ball leaps over the groove promotes the wear debris to the edge of the wear mark. It is beneficial to texture friction reduction and wear resistance. Through the oxygen element in the friction process, it can be seen that there is abrasive wear, adhesive wear, and oxidation corrosion wear in the friction and wear process. A wavy friction reduction zone is formed on the surface of the ball. This wavy surface has the function of reducing resistance and friction.

Author Contributions

Conceptualization, L.Y., W.M. and F.G.; Data curation, L.Y.; Formal analysis, L.Y. and S.X.; Funding acquisition, L.Y. and F.G.; Investigation, L.Y.; Methodology, L.Y. and W.M.; Project administration, L.Y. and W.M.; Resources, F.G. and S.X.; Software, L.Y.; Visualization, S.X. All authors have read and agreed to the published version of the manuscript.

Funding

There is no fund support for this research.

Institutional Review Board Statement

Not applicable.

Informed Consent Statement

Not applicable.

Conflicts of Interest

The authors declare no conflict of interest.

References

  1. Xi, J.J.; Li, H.F. Research Progress of Friction and Wear Properties of MoSi2 and Its Composite. Hot Work. Technol. 2013, 42, 4. [Google Scholar] [CrossRef]
  2. Pogrebnjak, A.; Ivashchenko, V.; Bondar, O.; Beresnev, V.; Sobol, O.; Załęski, K.; Jurga, S.; Coy, E.; Konarski, P.; Postolnyi, B. Multilayered vacuum-arc nanocomposite TiN/ZrN coatings before and after annealing: Structure, properties, first-principles calculations. Mater. Charact. 2017, 134, 55–63. [Google Scholar] [CrossRef] [Green Version]
  3. Maksakova, O.V.; Simoẽs, S.; Pogrebnjak, A.D.; Bondar, O.V.; Kravchenko, Y.; Koltunowicz, T.N.; Shaimardanov, Z. Multilayered ZrN/CrN coatings with enhanced thermal and mechanical properties. J. Alloys Compd. 2019, 776, 679–690. [Google Scholar] [CrossRef]
  4. Walsh, M.J.; Weinstein, L.M. Drag and heat transfer on surfaces with small longitudinal fins. Aiaa 1978. [Google Scholar] [CrossRef]
  5. Etsion, I.; Burstein, L. A Model for Mechanical Seals with Regular Microsurface Structure. Tribol. Trans. 1996, 39, 677–683. [Google Scholar] [CrossRef]
  6. Grützmacher, P.G.; Profito, F.J.; Rosenkranz, A. Multi-Scale Surface Texturing in Tribology-Current Knowledge and Future Perspectives. Lubricants 2019, 7, 95. [Google Scholar] [CrossRef] [Green Version]
  7. Rosenkranz, A.; Costa, H.L.; Profito, F.; Gachot, C.; Dini, D. Influence of surface texturing on hydrodynamic friction in plane converging bearings—An experimental and numerical approach. Tribol. Int. 2019, 134, 190–204. [Google Scholar] [CrossRef]
  8. Mao, Y.; Yang, J.; Xu, W.; Liu, Y. Study on the influence of round pits arrangement patterns on tribological properties of journal bearings. Ind. Lubr. Tribol. 2019, 71, 931–941. [Google Scholar] [CrossRef] [Green Version]
  9. Ramesh, A.; Akram, W.; Mishra, S.P.; Cannon, A.H.; Polycarpou, A.A.; King, W.P. Friction characteristics of microtextured surfaces under mixed and hydrodynamic lubrication. Tribol. Int. 2013, 57, 170–176. [Google Scholar] [CrossRef]
  10. Bai, S.X.; Peng, X.D.; LI, J.Y.; Meng, L.X. Experimental study on hydrodynamic effect of orientation micro-pored surfaces. Sci. China Technol. Sci. 2011, 54, 659–662. [Google Scholar] [CrossRef]
  11. Ma, C.B.; Zhu, H. An optimum design model for textured surface with elliptical-shape dimples under hydrodynamic lubrication. Tribol. Int. 2011, 44, 987–995. [Google Scholar] [CrossRef]
  12. Podgornik, B.; Vilhena, L.M.; Sedlaček, M.; Rek, Z.; Žun, I. Effectiveness and design of surface texturing for different lubrication regimes. Mecc. Milano 2012, 47, 1613–1622. [Google Scholar] [CrossRef]
  13. Siripuram, R.B.; Stephens, L.S. Effect of Deterministic Asperity Geometry on Hydrodynamic Lubrication. J. Trib. 2004, 126, 527–534. [Google Scholar] [CrossRef]
  14. Pratap, T.; Patra, K. Mechanical micro-texturing of Ti-6Al-4V surfaces for improved wettability and bio-tribological performances. Surf. Coat. Technol. 2018, 349, 71–81. [Google Scholar] [CrossRef]
  15. Santos, A.F.; Santiago, A.; Latour, M.; Rizzano, G.; Silva, L. Response of friction joints under different velocity rates. J. Constr. Steel Res. 2020, 168, 106004. [Google Scholar] [CrossRef]
  16. Weiss, M.; Majchrzycki, U.; Borkowska, E.; Cichomski, M.; Ptak, A. Nanoscale dry friction: Dependence on load and sliding velocity. Tribol. Int. 2021, 162, 107113. [Google Scholar] [CrossRef]
  17. Saeidi, F.; Meylan, B.; Hoffmann, P.; Wasmer, K. Effect of surface texturing on cast iron reciprocating against steel under starved lubrication conditions: A parametric study. Wear 2016, 348–349, 17–26. [Google Scholar] [CrossRef] [Green Version]
  18. Galda, L.; Sep, J.; Olszewski, A.; Zochowski, T. Experimental investigation into surface texture effect on journal bearings performance. Tribol. Int. 2019, 136, 372–384. [Google Scholar] [CrossRef]
  19. Liu, C.; Guo, F.; Wong, P.; Li, X. Laser pattern-induced unidirectional lubricant flow for lubrication track replenishment. Tribol. Int. 2021, 10, 1234–1244. [Google Scholar] [CrossRef]
  20. Peng, J.; Shen, M.; Cai, Z. Nano Diesel Soot Particles Reduce Wear and Friction Performance Using an Oil Additive on a Laser Textured Surface. Coatings 2018, 8, 89. [Google Scholar] [CrossRef] [Green Version]
  21. Volpe, A.; Covella, S.; Gaudiuso, C.; Ancona, A. Improving the Laser Texture Strategy to Get Superhydrophobic Aluminum Alloy Surfaces. Coatings 2021, 11, 369. [Google Scholar] [CrossRef]
  22. Pranav, C.; Do, M.T.; Tsai, Y.C. Analysis of High-Friction Surface Texture with Respect to Friction and Wear. Coatings 2021, 11, 758. [Google Scholar] [CrossRef]
  23. Wang, Z.; Song, J.; Wang, T.; Wang, H.; Wang, Q. Laser Texturing for Superwetting Titanium Alloy and Investigation of Its Erosion Resistance. Coatings 2021, 11, 1547. [Google Scholar] [CrossRef]
  24. Qi, X.; Wang, H.; Dong, Y.; Fan, B.; Zhang, W.; Zhang, Y.; Ma, J.; Zhou, Y. Experimental analysis of the effects of laser surface texturing on tribological properties of PTFE/Kevlar fabric composite weave structures. Tribol. Int. 2019, 135, 104–111. [Google Scholar] [CrossRef]
  25. Bai, Q.; Bai, J.; Meng, X.; Ji, C.; Liang, Y. Drag reduction characteristics and flow field analysis of textured surface. Friction 2016, 4, 11. [Google Scholar] [CrossRef] [Green Version]
  26. Liu, H.B.; Meng, Y.G. Hydrodynamic lubrication analysis of textured surfaces with the domain decomposition method-effect of texture distribution Patterns. Tribology 2007, 27, 555–561. [Google Scholar] [CrossRef]
  27. Ryk, G.; Kligerman, Y.; Etsion, I. Experimental investigation of laser surface texturing for reciprocating automotive components. ASLE Trans. 2002, 45, 444–449. [Google Scholar] [CrossRef]
  28. Hsu, S.M.; Jing, Y.; Hua, D.; Zhang, H. Friction reduction using discrete surface textures: Principle and design. J. Phys. D Appl. Phys. 2014, 47, 335307. [Google Scholar] [CrossRef]
  29. Jiang, W.; Zhang, C.Y.; Gu, Q.M.; Xu, K.; Zhu, H.; Cao, Z.H. Tribological properties of micro-pit texture generated by composite processing. Lubr. Eng. 2019, 44, 85–89. [Google Scholar] [CrossRef]
  30. Zhang, D.D.; Sun, X.Z.; Gao, F.; Zhong, S.J.; Duan, J.H. Effect of texture parameters on tribological performance of slipper surface in hydraulic motor. Surf. Technol. 2019, 48, 244–250. [Google Scholar] [CrossRef]
  31. Shi, L.P.; Wei, W.; Wang, T.; Zhang, Y.C.; Zhu, W.; Wang, X.L. Experimental investigation of the effect of typical surface texture patterns on mechanical seal performance. J. Braz. Soc. Mech. Sci. Eng. 2020, 42, 1–12. [Google Scholar] [CrossRef]
  32. Miao, J.Z.; Guo, Z.W.; Yuan, C.Q. Effect of textured surface on the friction performance of cylinder liner-piston ring system in the internal combustion engine. Tribology 2017, 37, 465–471. [Google Scholar] [CrossRef]
  33. Ge, L.C.; Ma, J.J.; Cao, Y.P.; Ge, G.L.; Hua, G.R.; Wang, Z.G.; Jiang, S.Z. Influence of micro texture and its parameters on the effect of lubrication reduction. Laser Infrared 2019, 49, 921–928. [Google Scholar] [CrossRef]
  34. Yang, L.; Ma, W.; Gao, F.; Xi, S. Effect of EDM and Femtosecond-Laser Groove-Texture Collision Frequency on Tribological Properties of 0Cr17Ni7Al Stainless Steel. Coatings 2022, 12, 611. [Google Scholar] [CrossRef]
  35. Yang, L.; Ma, W.; Gao, F.; Li, J.; Deng, M.; Liu, Z.; Ma, L.; Meng, H. Study on Tribological Properties of groove texture in surface micromachining. Tool Technol. 2021, 55, 73–76. [Google Scholar] [CrossRef]
  36. Ping, G.; Ehmann, K.F. An Analysis of the Surface Generation Mechanics of the Elliptical Vibration Texturing Process. Int. J. Mach. Tools Manuf. 2013, 64, 85–95. [Google Scholar] [CrossRef]
  37. Chae, J.; Park, S.S.; Freiheit, T. Investigation of micro-cutting operations. Int. J. Mach. Tools Manuf. 2006, 46, 313–332. [Google Scholar] [CrossRef]
  38. Zhang, T.; Liu, Z.; Xu, C. Influence of size effect on burr formation in micro cutting. Int. J. Adv. Manuf. Technol. 2013, 68, 1911–1917. [Google Scholar] [CrossRef]
  39. Cho, M.H.; Park, S. Micro CNC surface texturing on polyoxymethylene (POM) and its tribological performance in lubricated sliding. Tribol. Int. 2011, 44, 859–867. [Google Scholar] [CrossRef]
  40. Greco, A.; Raphaelson, S.; Ehmann, K.; Wang, Q.J. Surface texturing of tribological interfaces using the vibromechanical texturing method. J. Manuf. Sci. Eng. 2009, 131, 1–8. [Google Scholar] [CrossRef]
  41. Kumar, S.; Singh, R.; Singh, T.P.; Sethi, B.L. Surface modification by electrical discharge machining: A review. J. Mater. Processing Technol. 2009, 209, 3675–3687. [Google Scholar] [CrossRef]
  42. Tanvir Ahmmed, K.M.; Grambow, C.; Kietzig, A. Fabrication of Micro/Nano Structures on Metals by Femtosecond Laser Micromachining. Micromachines 2014, 5, 1219–1253. [Google Scholar] [CrossRef]
  43. Uehara, Y.; Wakuda, M.; Yamauchi, Y.; Kanzaki, S.; Sakaguchi, S. Tribological properties of dimpled silicon nitride under oil lubrication. J. Eur. Ceram. Soc. 2004, 24, 369–373. [Google Scholar] [CrossRef]
  44. Fang, S.; Zhao, H.; Zhang, Q. The Application Status and Development Trends of Ultrasonic Machining Technology. J. Mech. Eng. 2017, 53, 22–32. [Google Scholar] [CrossRef]
  45. Parreira, J.G.; Gallo, C.A.; Costa, H.L. New advances on maskless electrochemical texturing (MECT) for tribological purposes. Surf. Coat. Technol. 2012, 212, 1–13. [Google Scholar] [CrossRef] [Green Version]
  46. Natsu, W.; Ikeda, T.; Kunieda, M. Generating complicated surface with electrolyte jet machining. Precis. Eng. 2007, 31, 33–39. [Google Scholar] [CrossRef]
  47. Kern, P.; Veh, J.; Michler, J. New developments in through-mask electrochemical micromachining of titanium. J. Micromech. Microeng. 2007, 17, 1168. [Google Scholar] [CrossRef]
  48. Yang, L.; Ma, W.; Gao, F.; Xi, S. Effect of Different Laser Groove Texture Collation Frequency on Tribological Properties of 0Cr17Ni7Al Stainless Steel. Materials 2022, 15, 4419. [Google Scholar] [CrossRef]
Figure 1. JDGR200T precision carving high-speed machining center.
Coatings 12 01221 g001
Figure 2. Ball end-milling cutter.
Coatings 12 01221 g002
Figure 3. MFT-5000 friction test bench.
Coatings 12 01221 g003
Figure 4. Friction coefficient curves of different samples: (a) untextured surface rotation radius 18 mm, (b) 0.4 mm groove width mechanical texture rotation radius 18 mm, (c) 0.6 mm groove width mechanical texture rotation radius 18 mm, (d) 0.8 mm groove width mechanical texture rotation radius 18 mm, and (e) 1.0 mm groove width mechanical texture rotation radius 18 mm.
Coatings 12 01221 g004
Figure 5. Morphology of wear marks of different samples: (a) untextured rotation radius 18 mm, (b) 0.4 mm groove width mechanical texture rotation radius 18 mm, (c) 0.6 mm groove width mechanical texture rotation radius 18 mm, (d) 0.8 mm groove width mechanical texture rotation radius 18 mm, and (e) 1.0 mm groove width mechanical texture rotation radius 18 mm.
Coatings 12 01221 g005aCoatings 12 01221 g005b
Figure 6. SEM images of the worn plates: (a,b) untextured rotation radius 18 mm, (c,d) 0.4 mm groove width mechanical texture rotation radius 18 mm, (e,f) 0.6 mm groove width mechanical texture rotation radius 18 mm, (g,h) 0.8 mm groove width mechanical texture rotation radius 18 mm, and (i,j) 1.0 mm groove width mechanical texture rotation radius 18 mm.
Coatings 12 01221 g006aCoatings 12 01221 g006b
Figure 7. SEM images of the groove-textured worn plates: (a,b) 0.4 mm groove width mechanical texture rotation radius 18 mm, (c,d) 0.6 mm groove width mechanical texture rotation radius 18 mm, (e,f) 0.8 mm groove width mechanical texture rotation radius 18 mm, and (g,h) 1.0 mm groove width mechanical texture rotation radius 18 mm.
Coatings 12 01221 g007
Figure 8. SEM images of the worn balls: (a,b) untextured friction radius 18 mm, and (c,d) 0.6 mm groove width mechanical texture friction radius 18 mm.
Coatings 12 01221 g008
Table 1. Main parameters of micromachine equipment.
ParametersValueUnit
Spindle speed13,000r/m (s)
Feed speed1000mm/m (F)
Slotting speed100%
Cutting speed100%
Cutting angle0.02mm
Maximum depth of each layer0.009mm
Table 2. Dimensional parameters of the prepared texture specimen.
Specimen NameNumber of Grooves (PCs)Groove Width (mm)Groove Depth (mm)Groove Length (mm)
0.4 mm texture600.40.1512
0.6 mm texture400.60.1512
0.8 mm texture300.80.1512
1.0 mm texture241.00.1512
Table 3. Parameters of the test sample.
Test PieceGeometric DimensionMaterialAccuracySurface RoughnessHardness
Upper test ballØ 9.525 mm9Cr18G50.014 µm64 HRC
Lower test plateØ 50.8 mm × 6.35 mm0Cr17Ni7Al-0.05 µm42 HRC
Table 4. Experimental parameters.
Specimen NameTest Radius
(mm)
Rotation Speed
(r/min)
Load
(N)
Time
(min)
untextured18501020
0.4 mm texture18501020
0.6 mm texture18501020
0.8 mm texture18501020
1.0 mm texture18501020
Table 5. Friction and wear data.
Specimen NameRotation Radius
(mm)
Wear Rate
(10−4 mm3/(N·mm))
Average Friction Coefficient
untextured186.3520.870
0.4 mm183.5840.664
0.6 mm183.3510.632
0.8 mm185.7840.730
1.0 mm184.1310.853
Table 6. Leap parameters for different friction radii.
Specimen NameRotation Radius (mm)Speed (r/min)Number of Grooves per TurnTotal Number of Friction TurnsTime (min)Total Times of Leap
0.4 mm18506010002060,000
0.6 mm18504010002040,000
0.8 mm18503010002030,000
1.0 mm18502410002024,000
Table 7. Mass fraction and chemical composition of the two materials.
Specimen NameMaterialPCCrSMnNiSiAl
Plate0Cr17Ni7Al0.040.0916~180.031.06.5~7.751.00.75~1.5
Ball9Cr180.040.9~1.017~190.030.80.060.8-
Publisher’s Note: MDPI stays neutral with regard to jurisdictional claims in published maps and institutional affiliations.

