
Structural Optimization of Sorghum Straw Powder/ZnO/PVA Nanocomposite Films

Abstract
:1. Introduction
2. Materials and Methods
2.1. Materials and Reagents
2.2. Instruments and Equipment
2.3. Methods
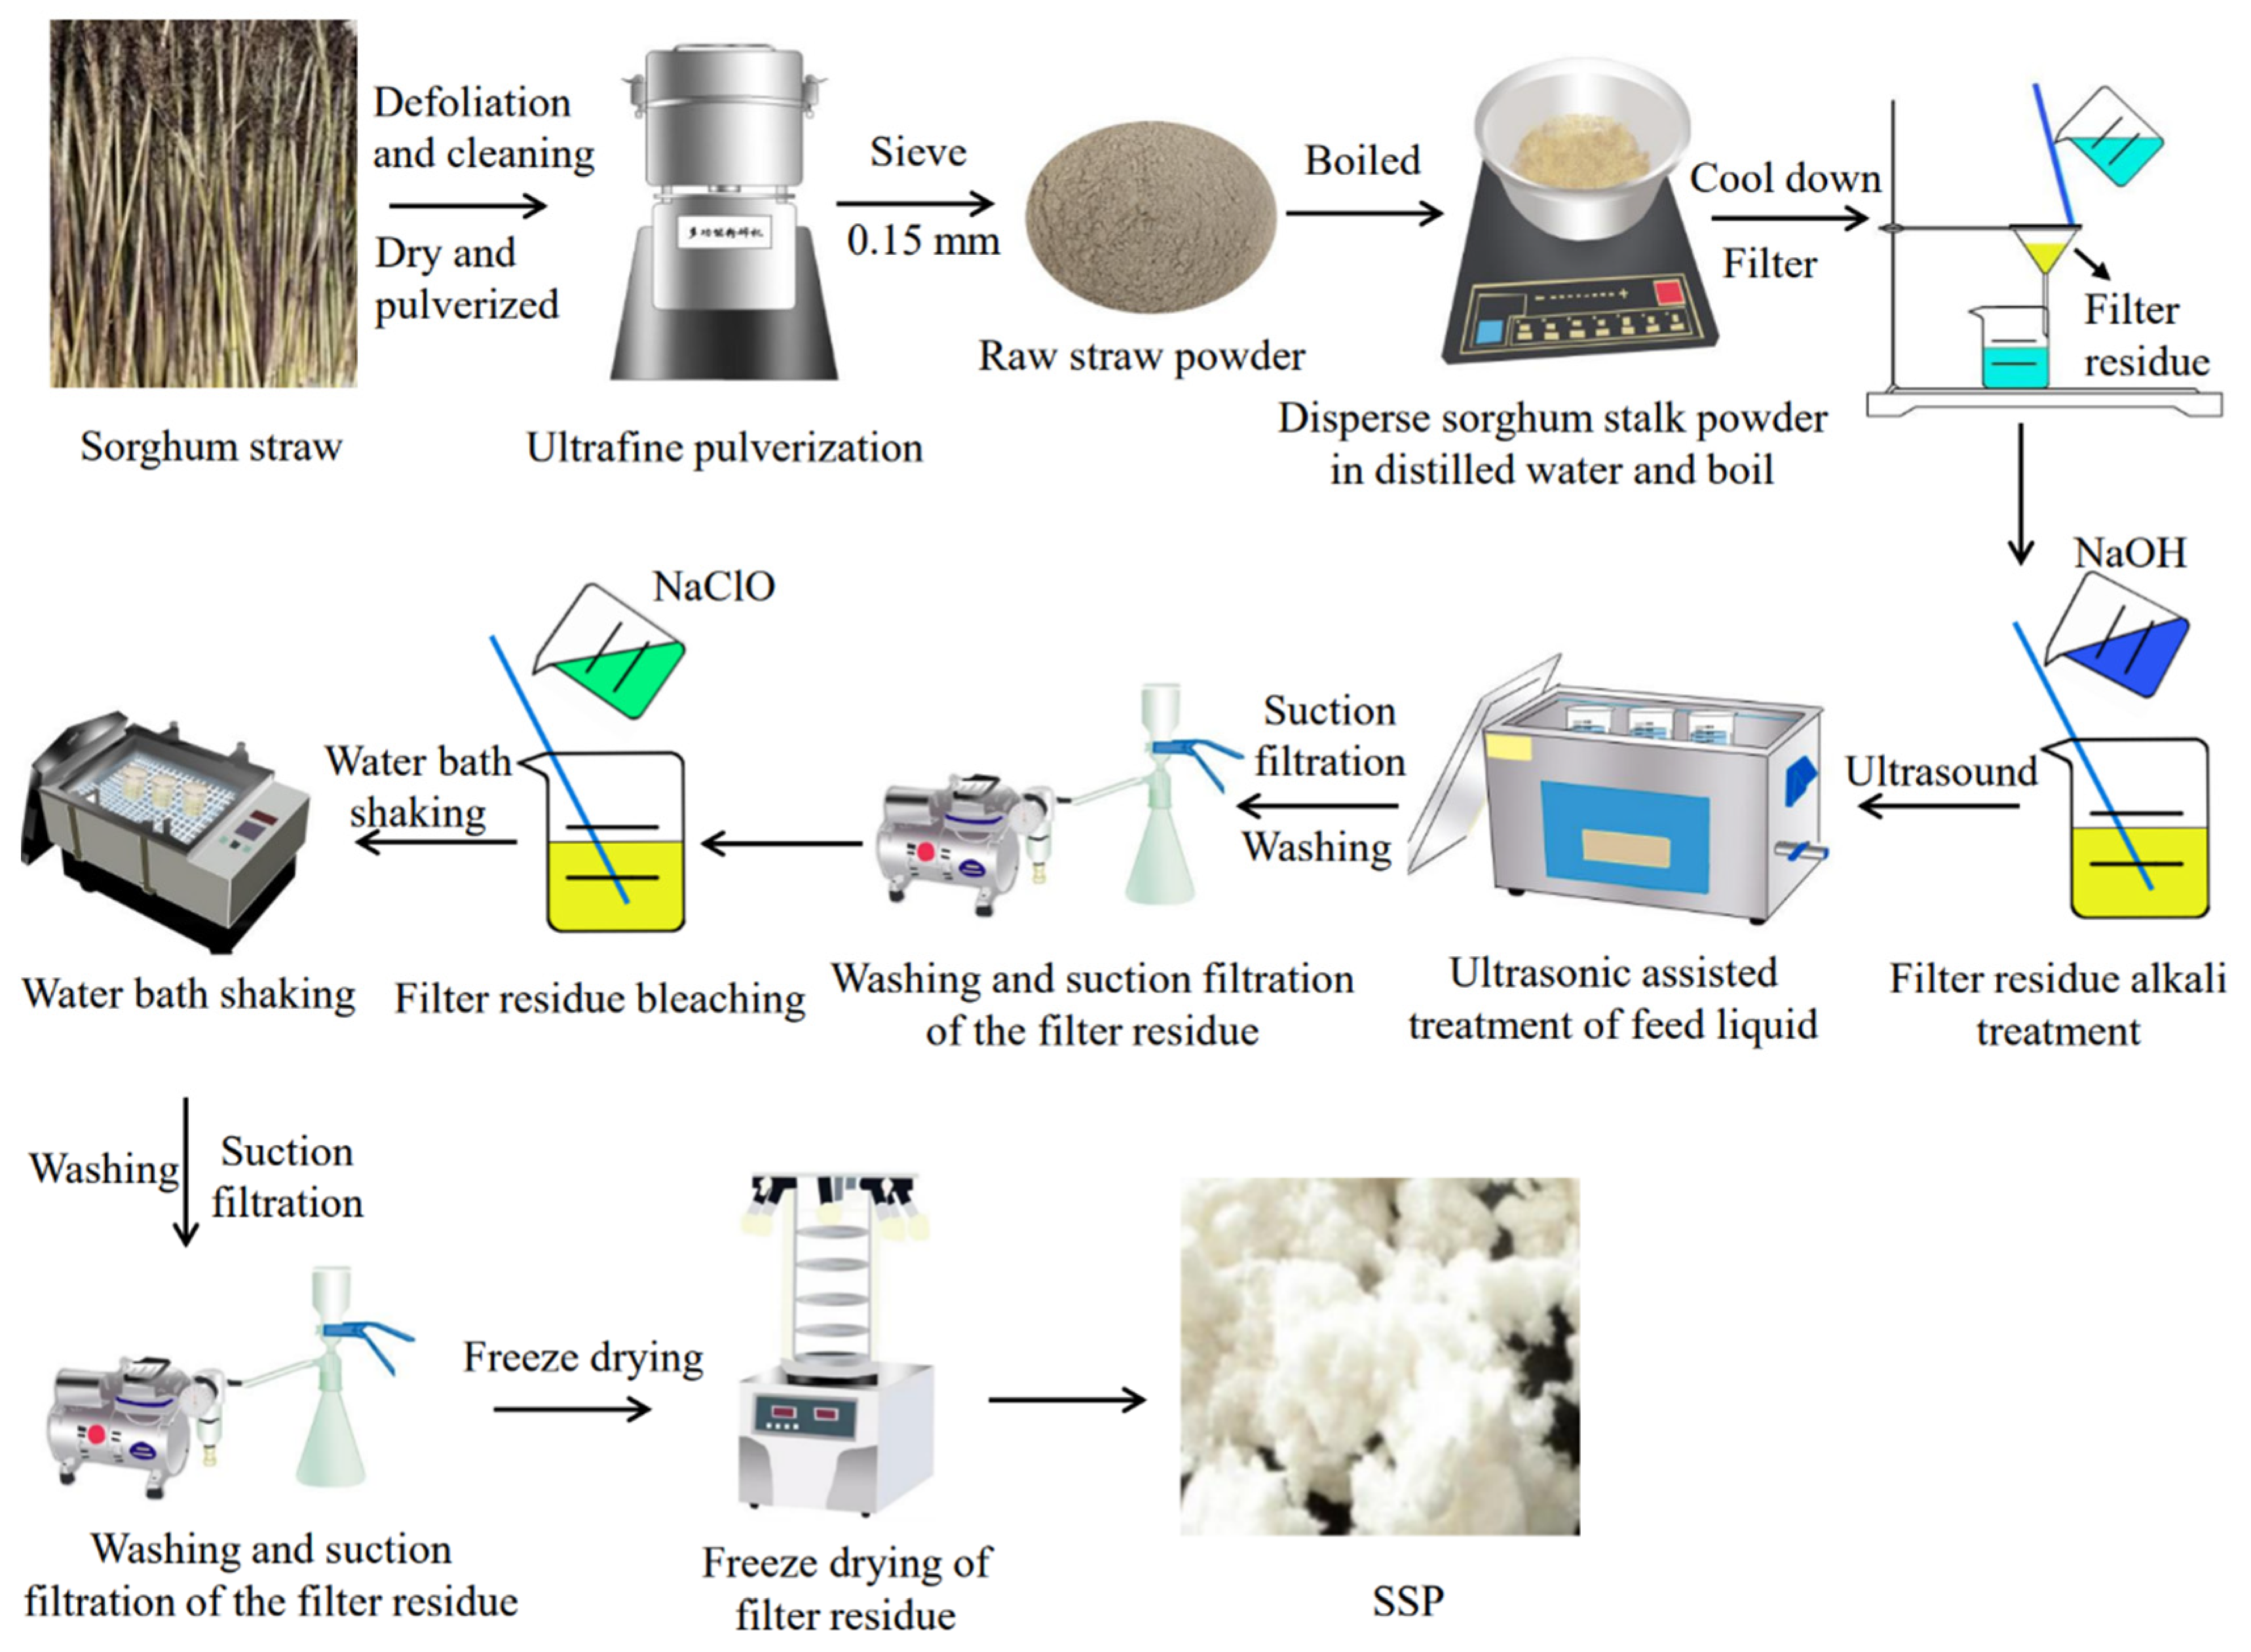
2.3.1. Pretreatment of Sorghum Straw
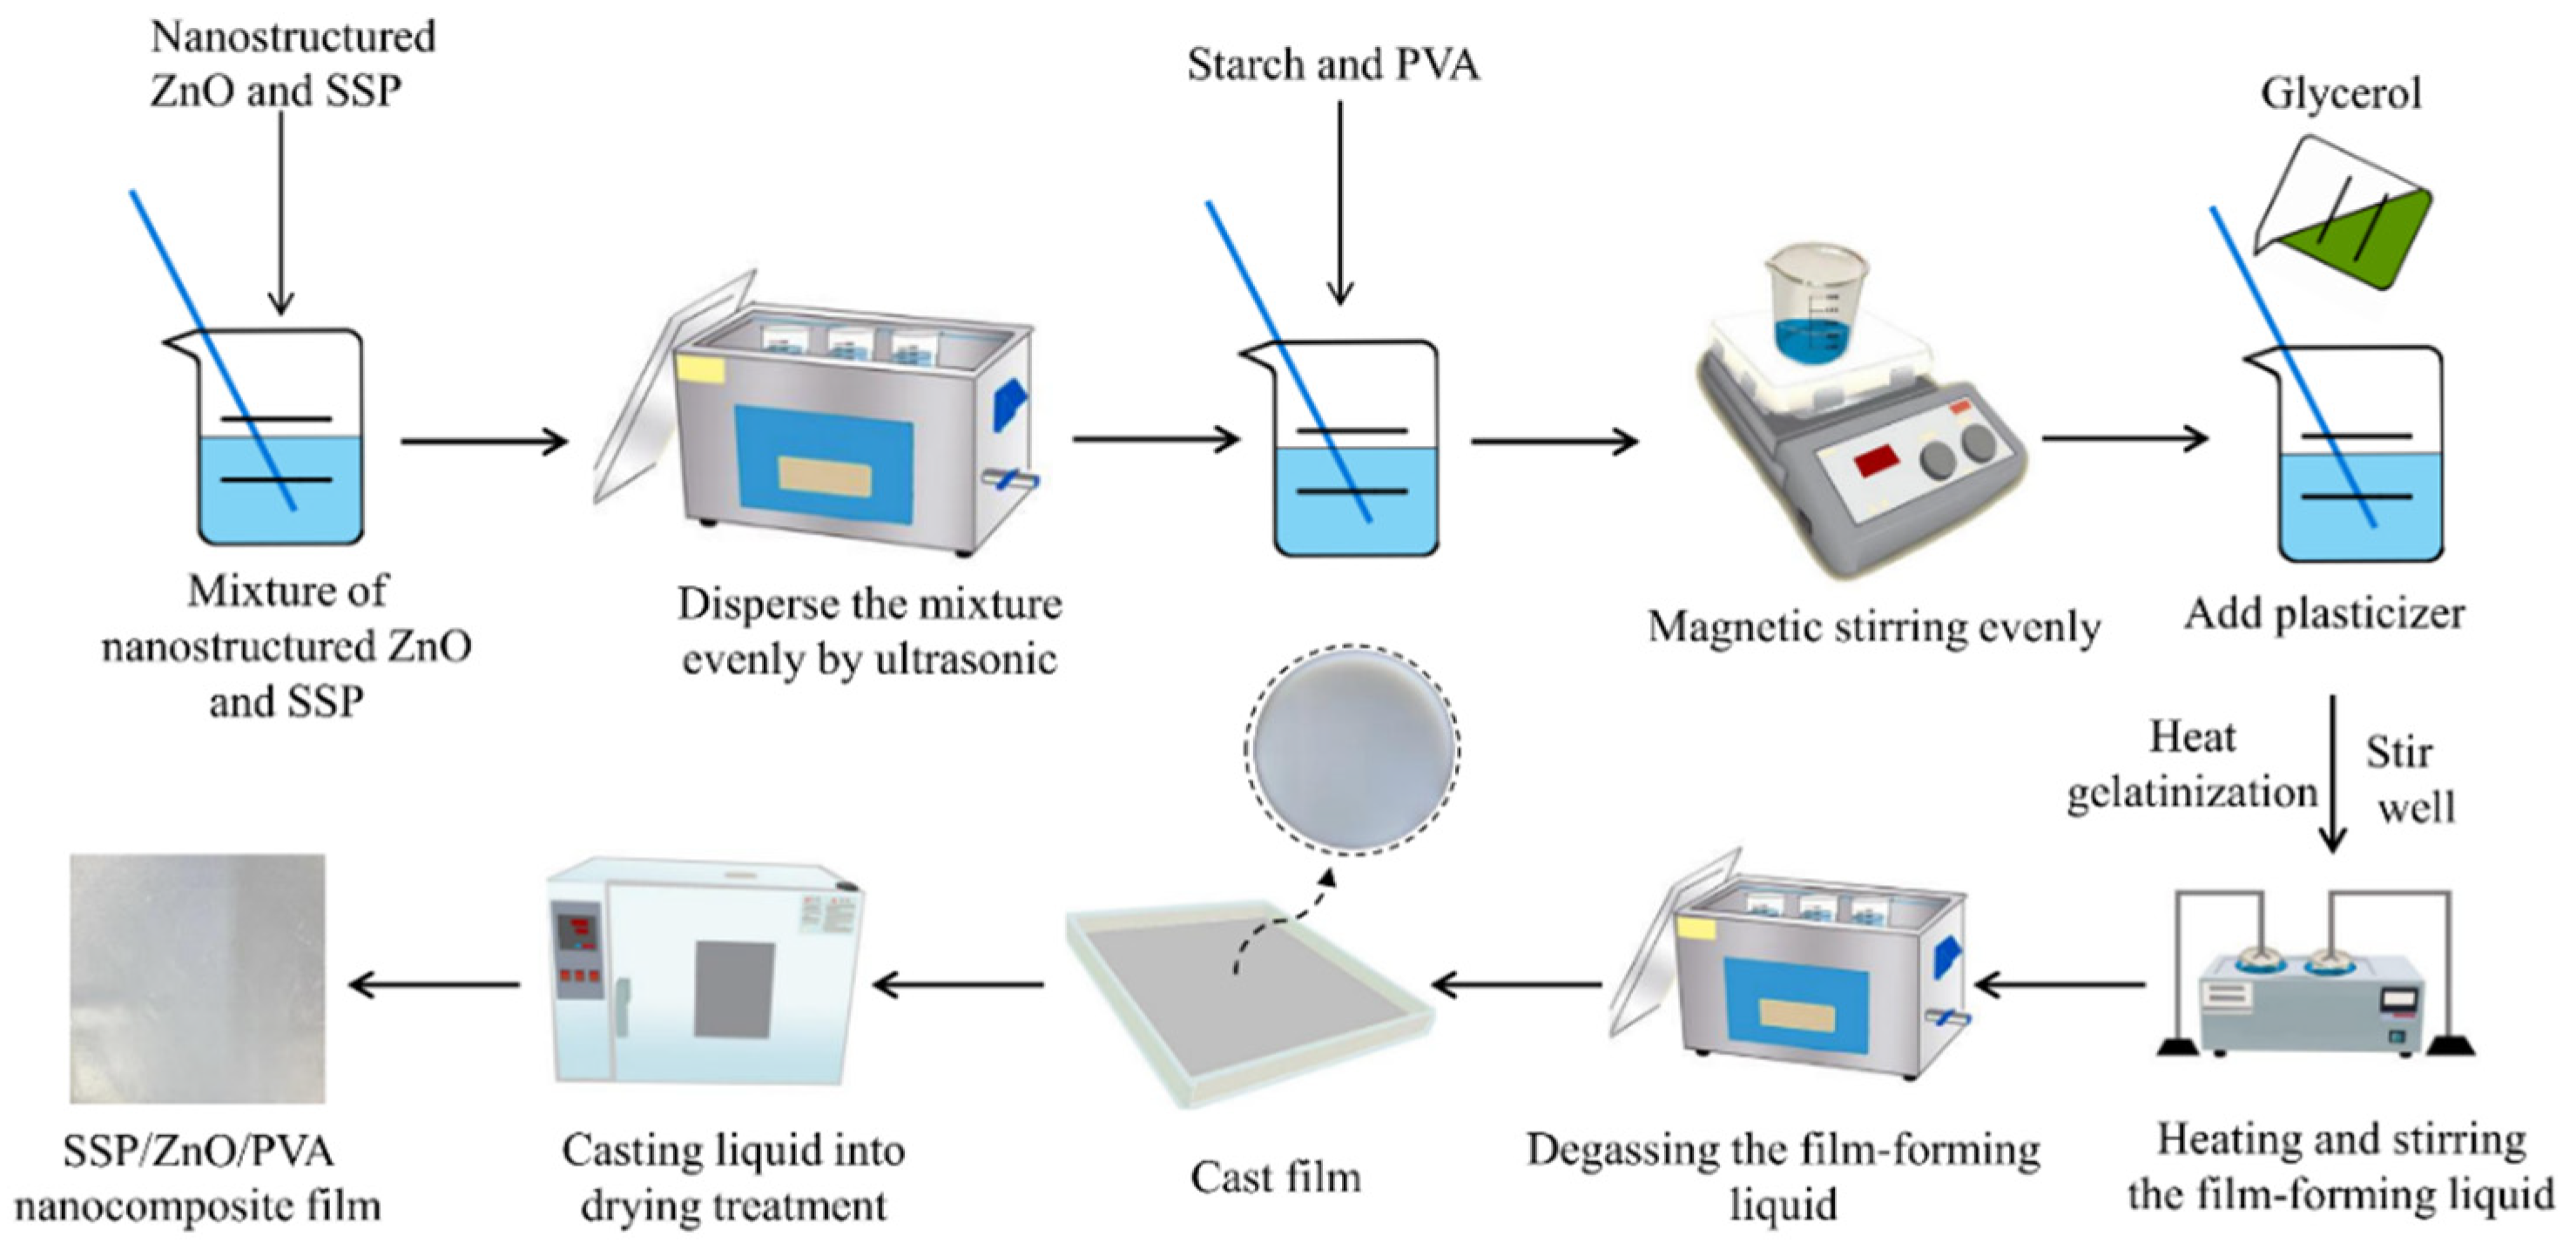
2.3.2. Preparation of SSP/ZnO/PVA Nanocomposite Films
2.3.3. Determination of the Properties of the Nanocomposite Films
Thickness Determination
TS Determination
WVP Determination
2.3.4. Single-Factor Experimental Design
2.3.5. Response Surface Experimental Design
2.3.6. Microstructural Observation and Characterization
SEM
AFM
XRD
FT-IR
TGA
2.4. Statistical Analysis
3. Results and Discussion
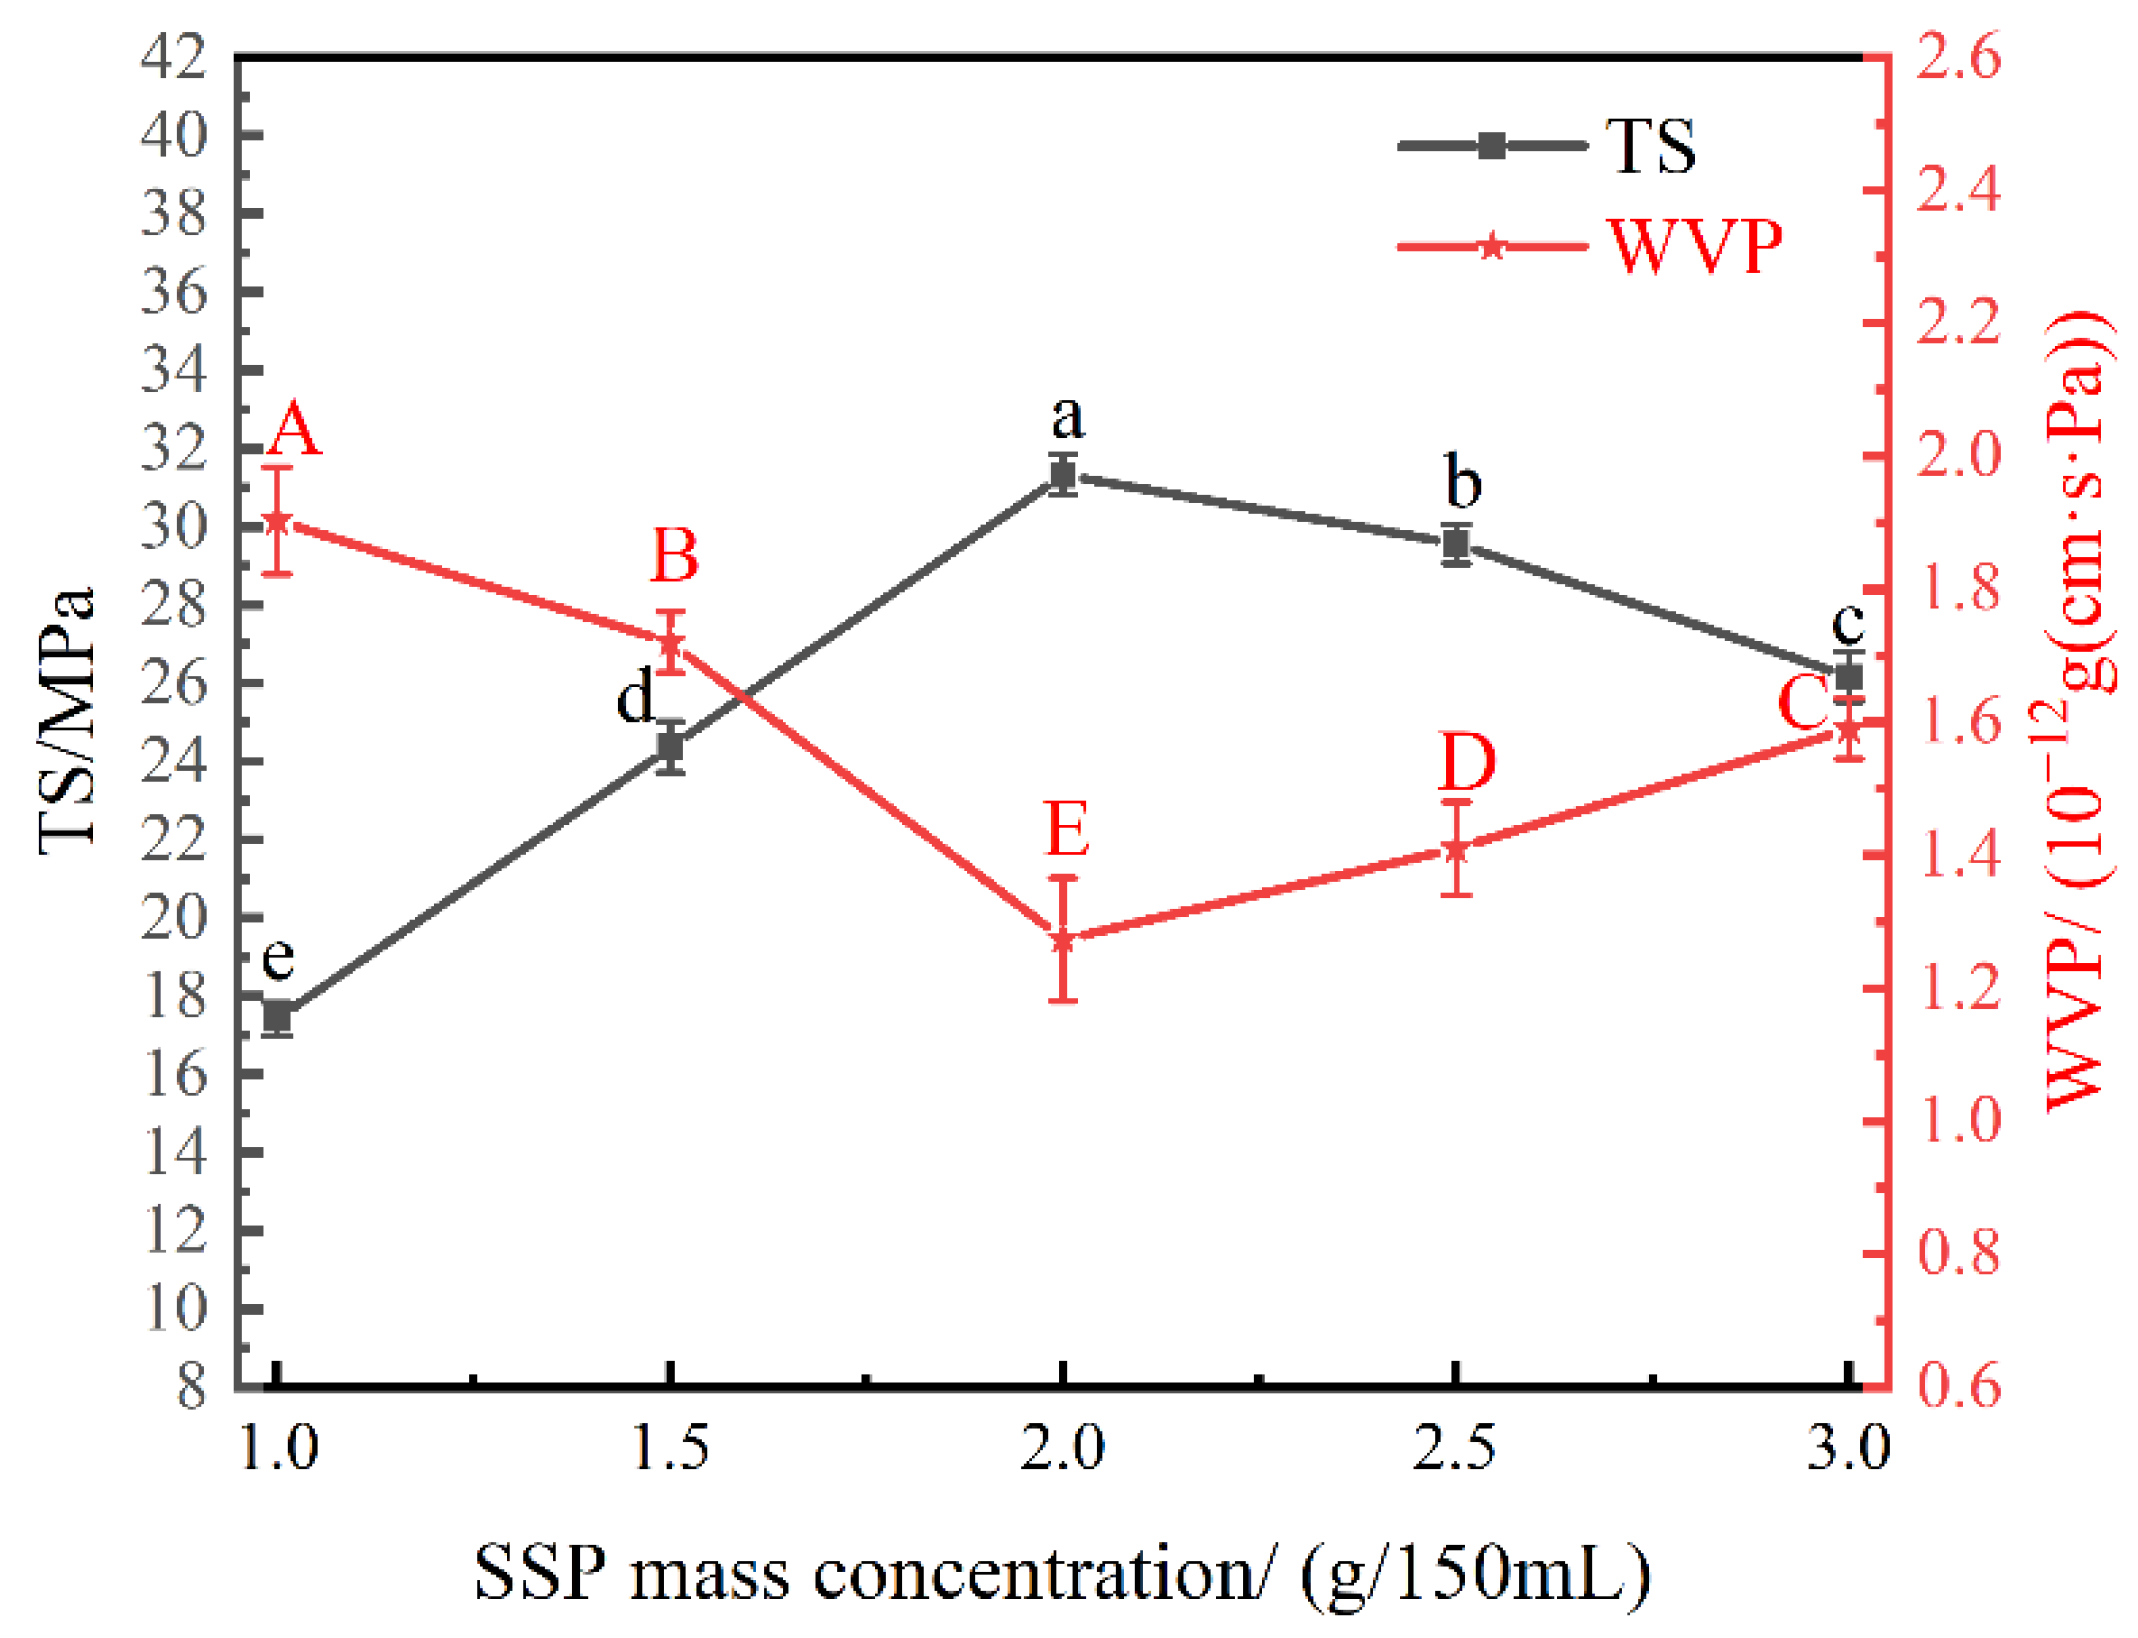
3.1. Effect of SSP Mass Concentration on the Physical Properties of the Nanocomposite Films
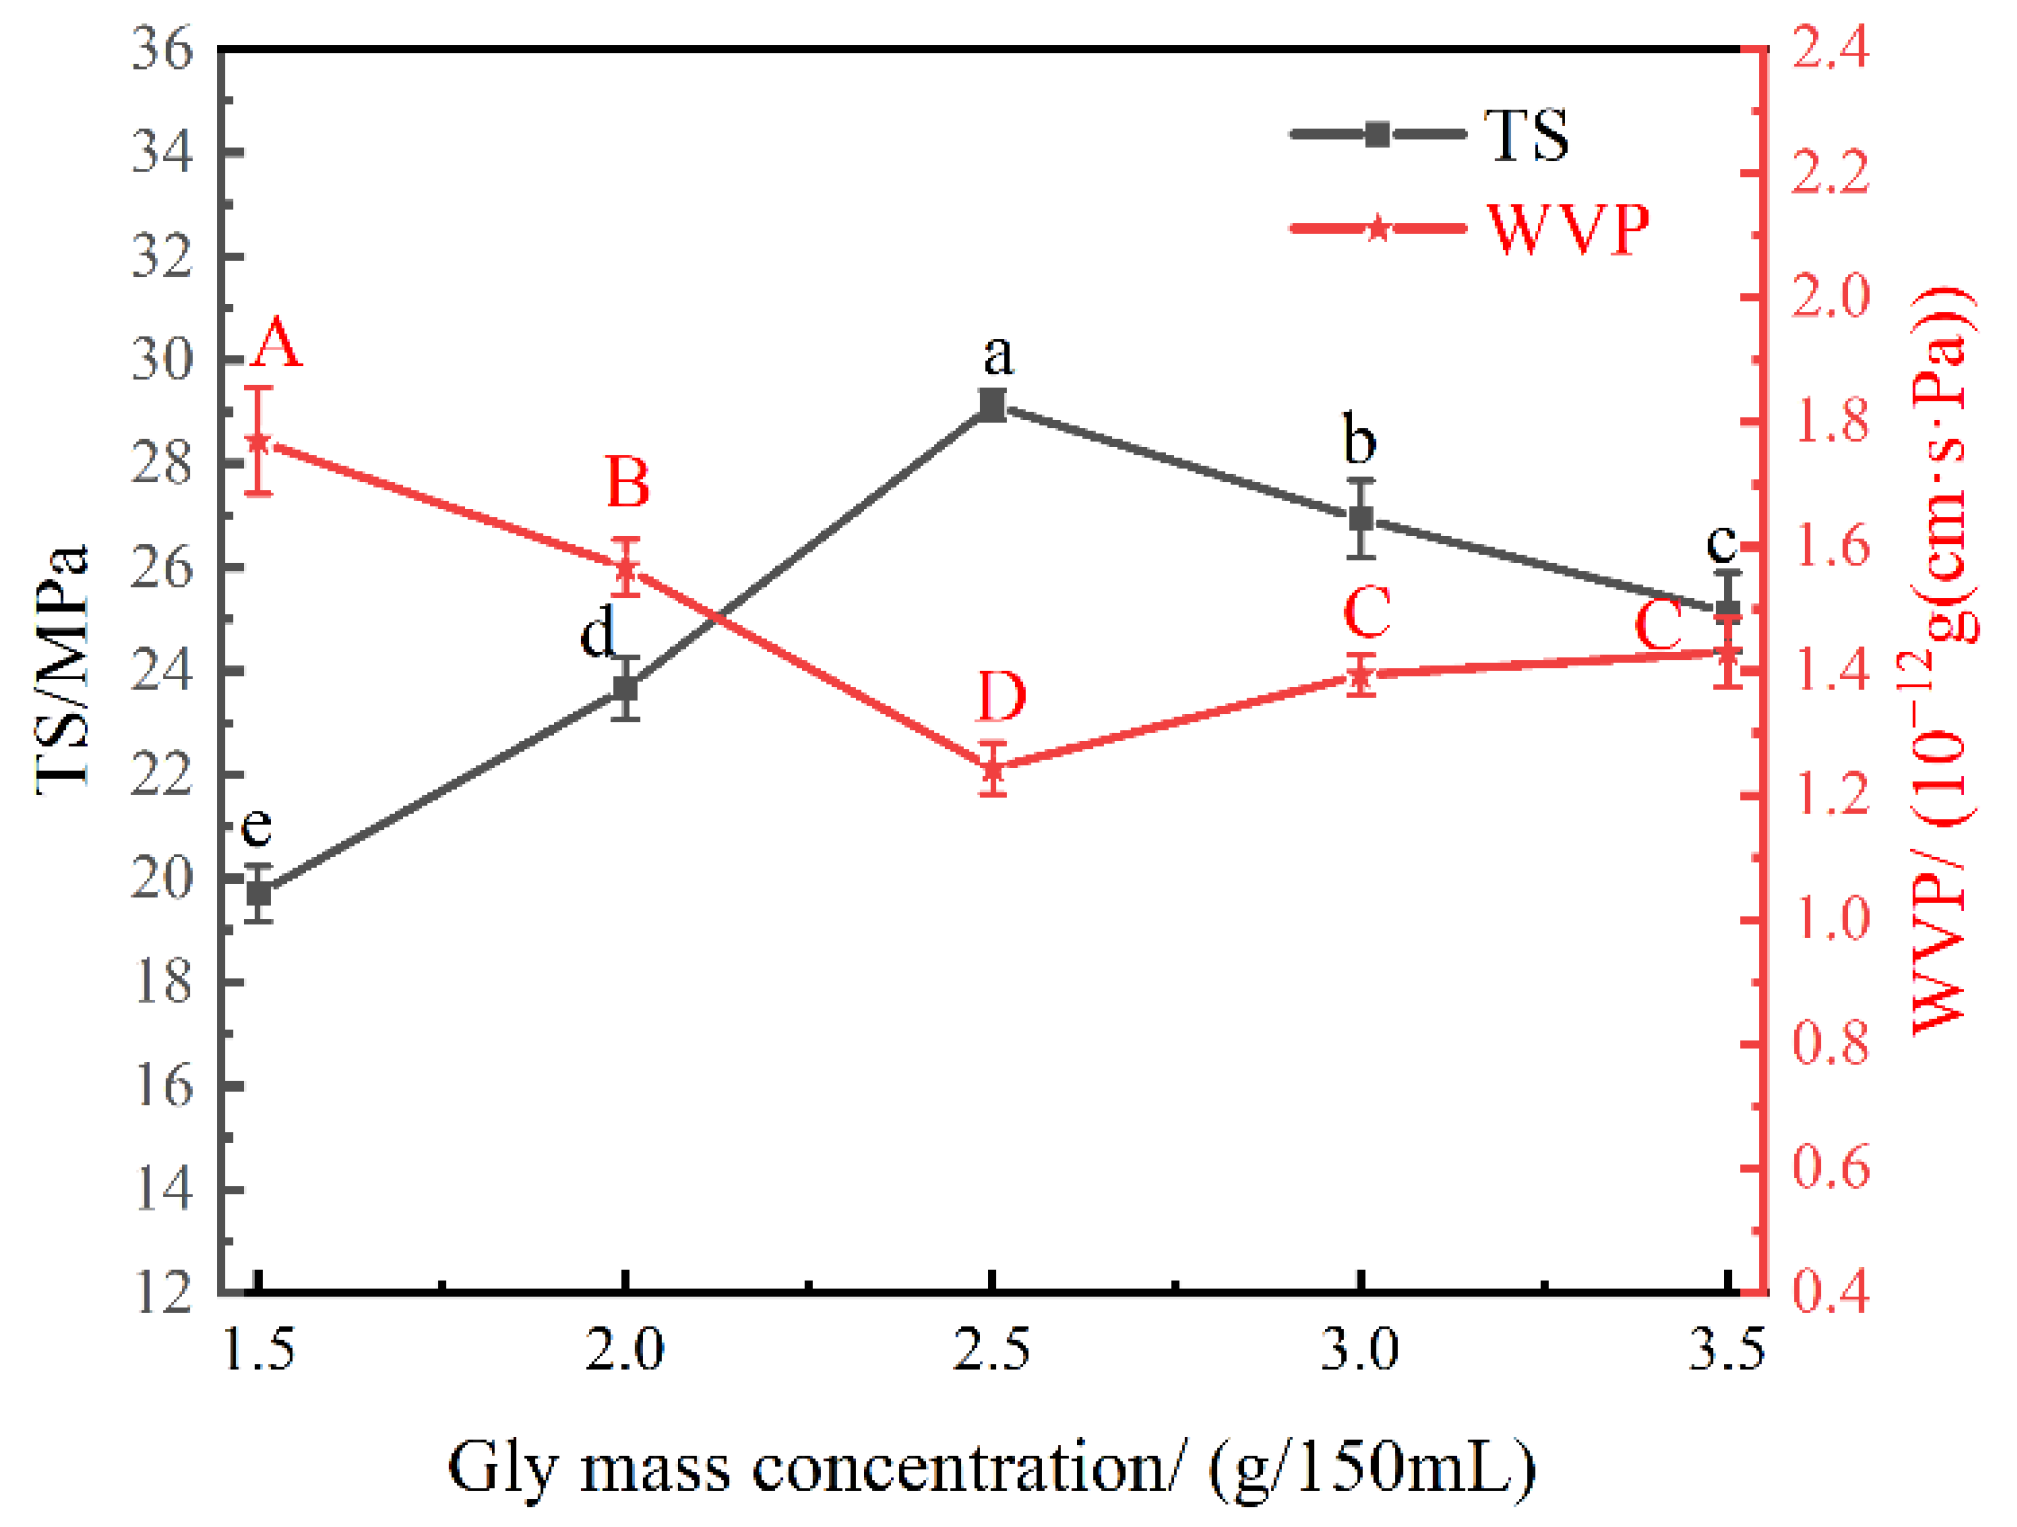
3.2. Effect of Gly Mass Concentration on the Physical Properties of the Nanocomposite Films
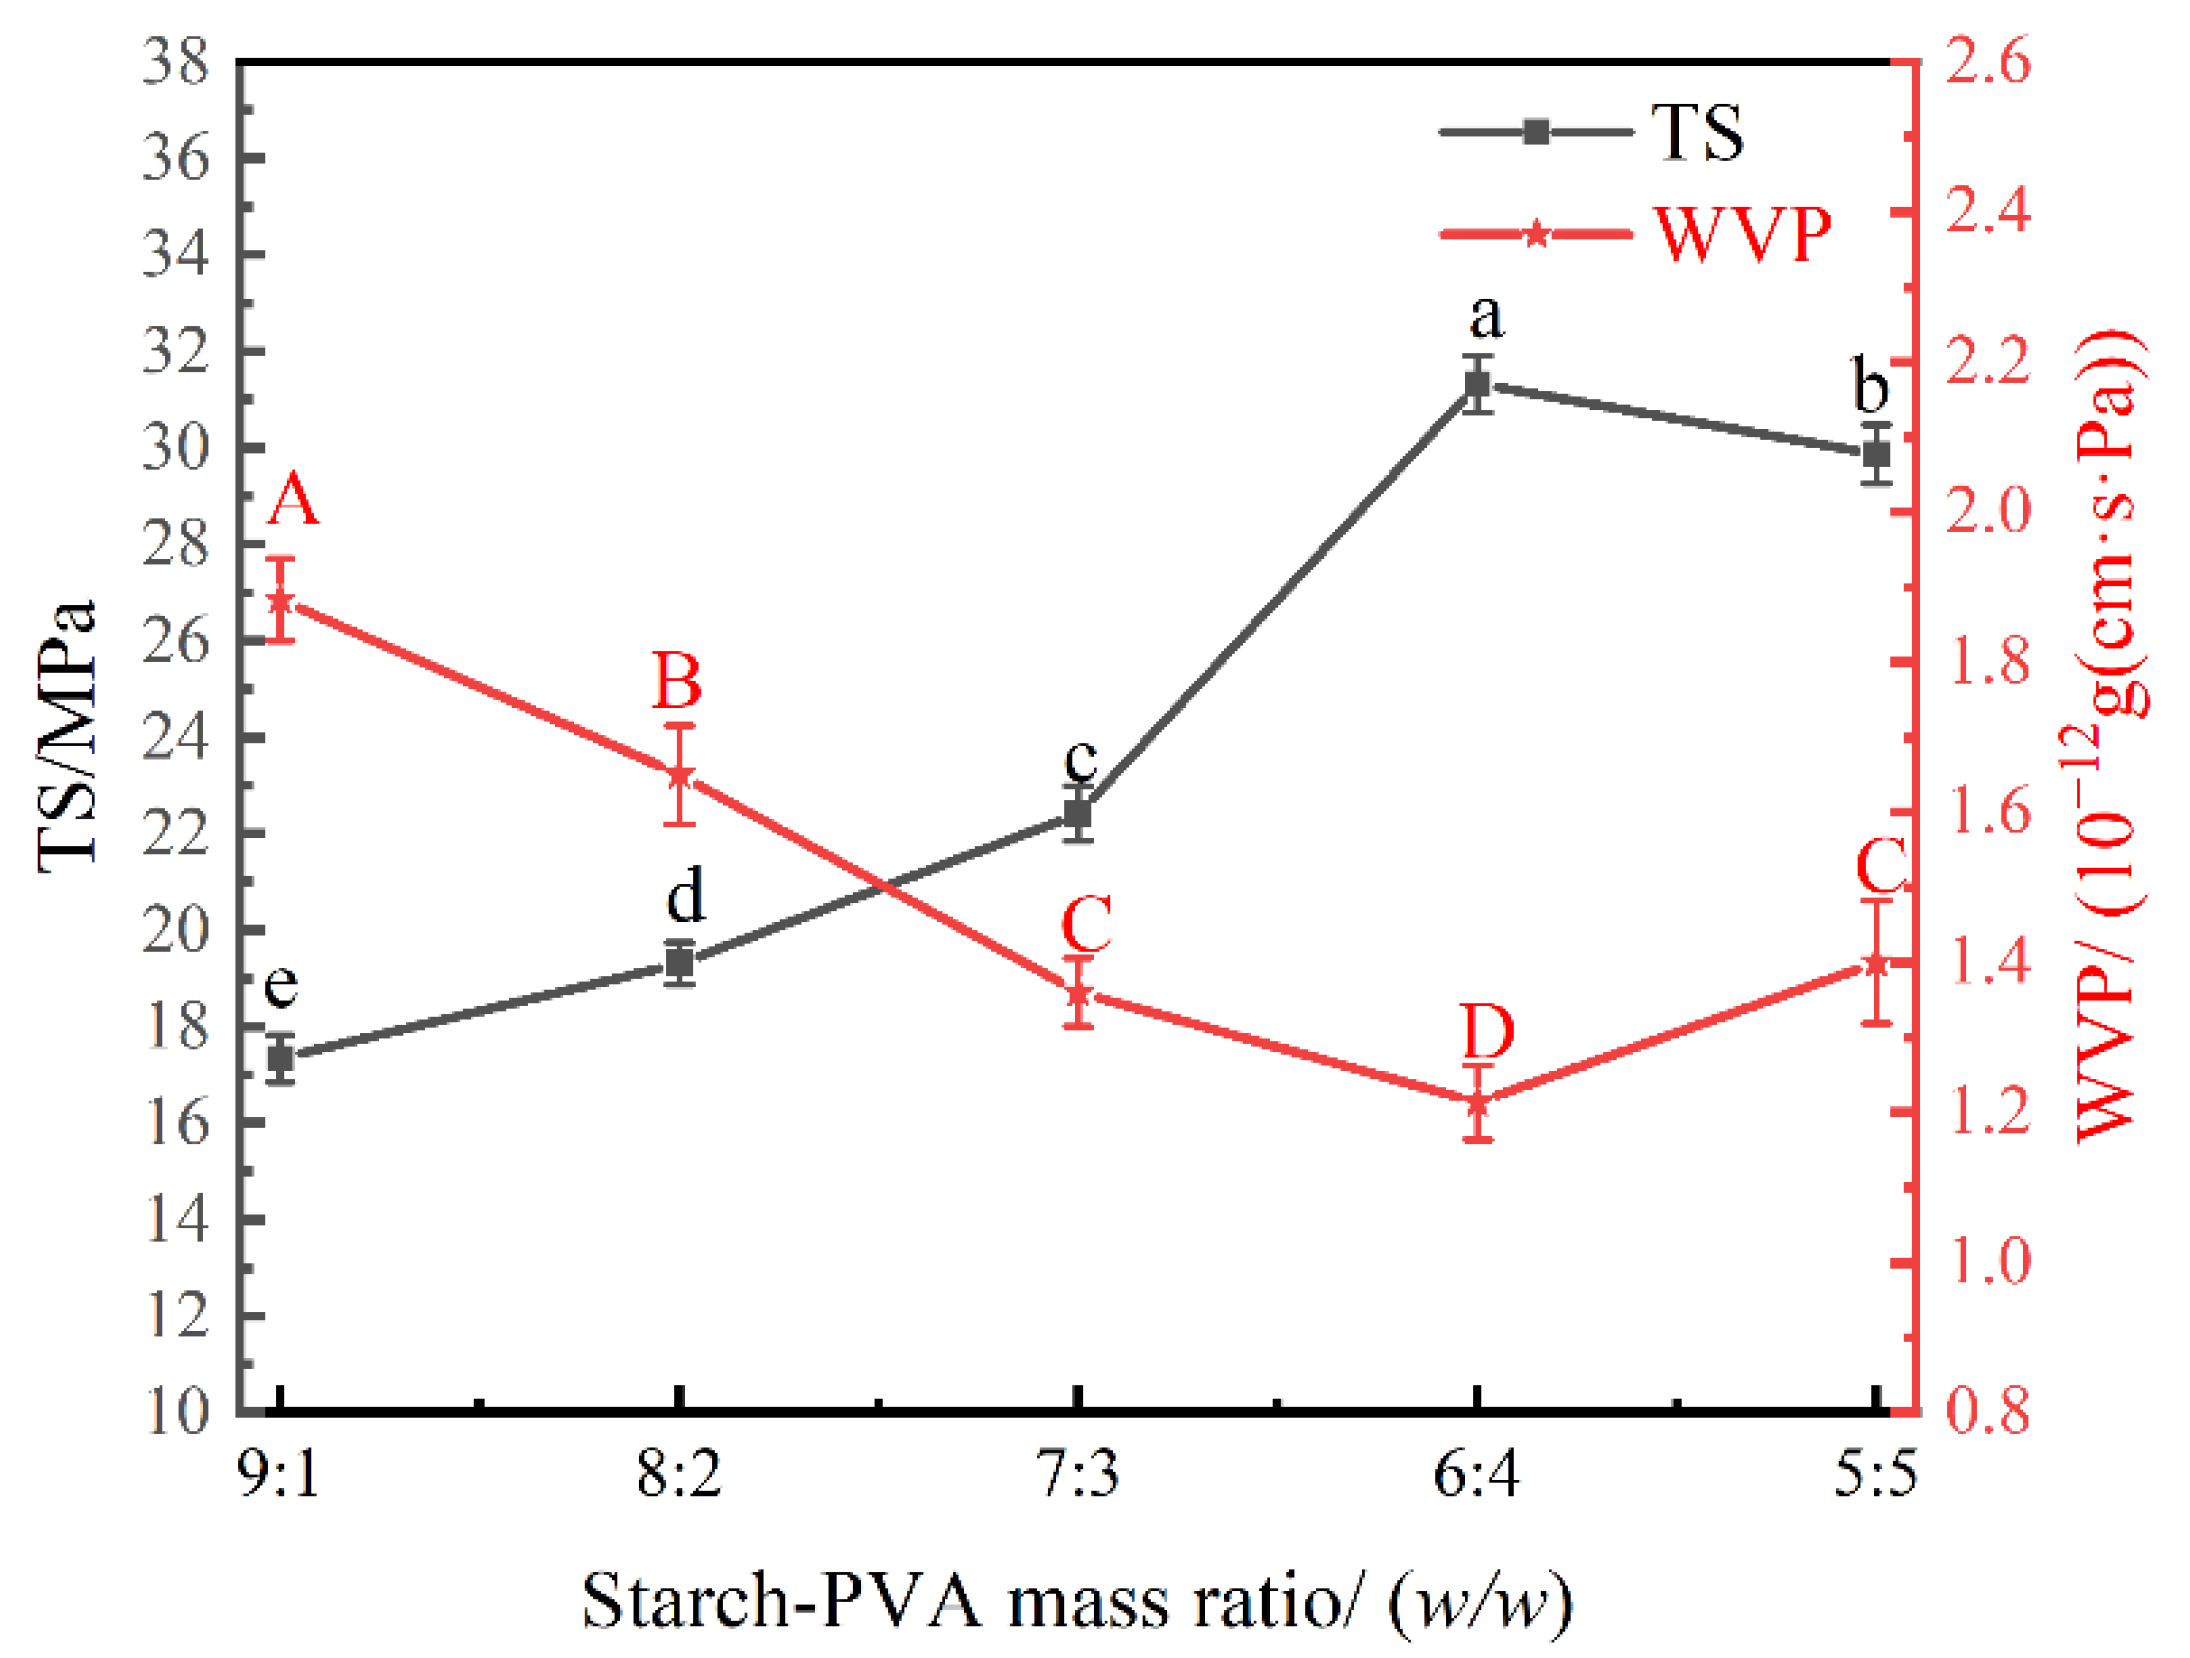
3.3. Effect of Starch–PVA Mass Ratio on the Physical Properties of the Nanocomposite Films
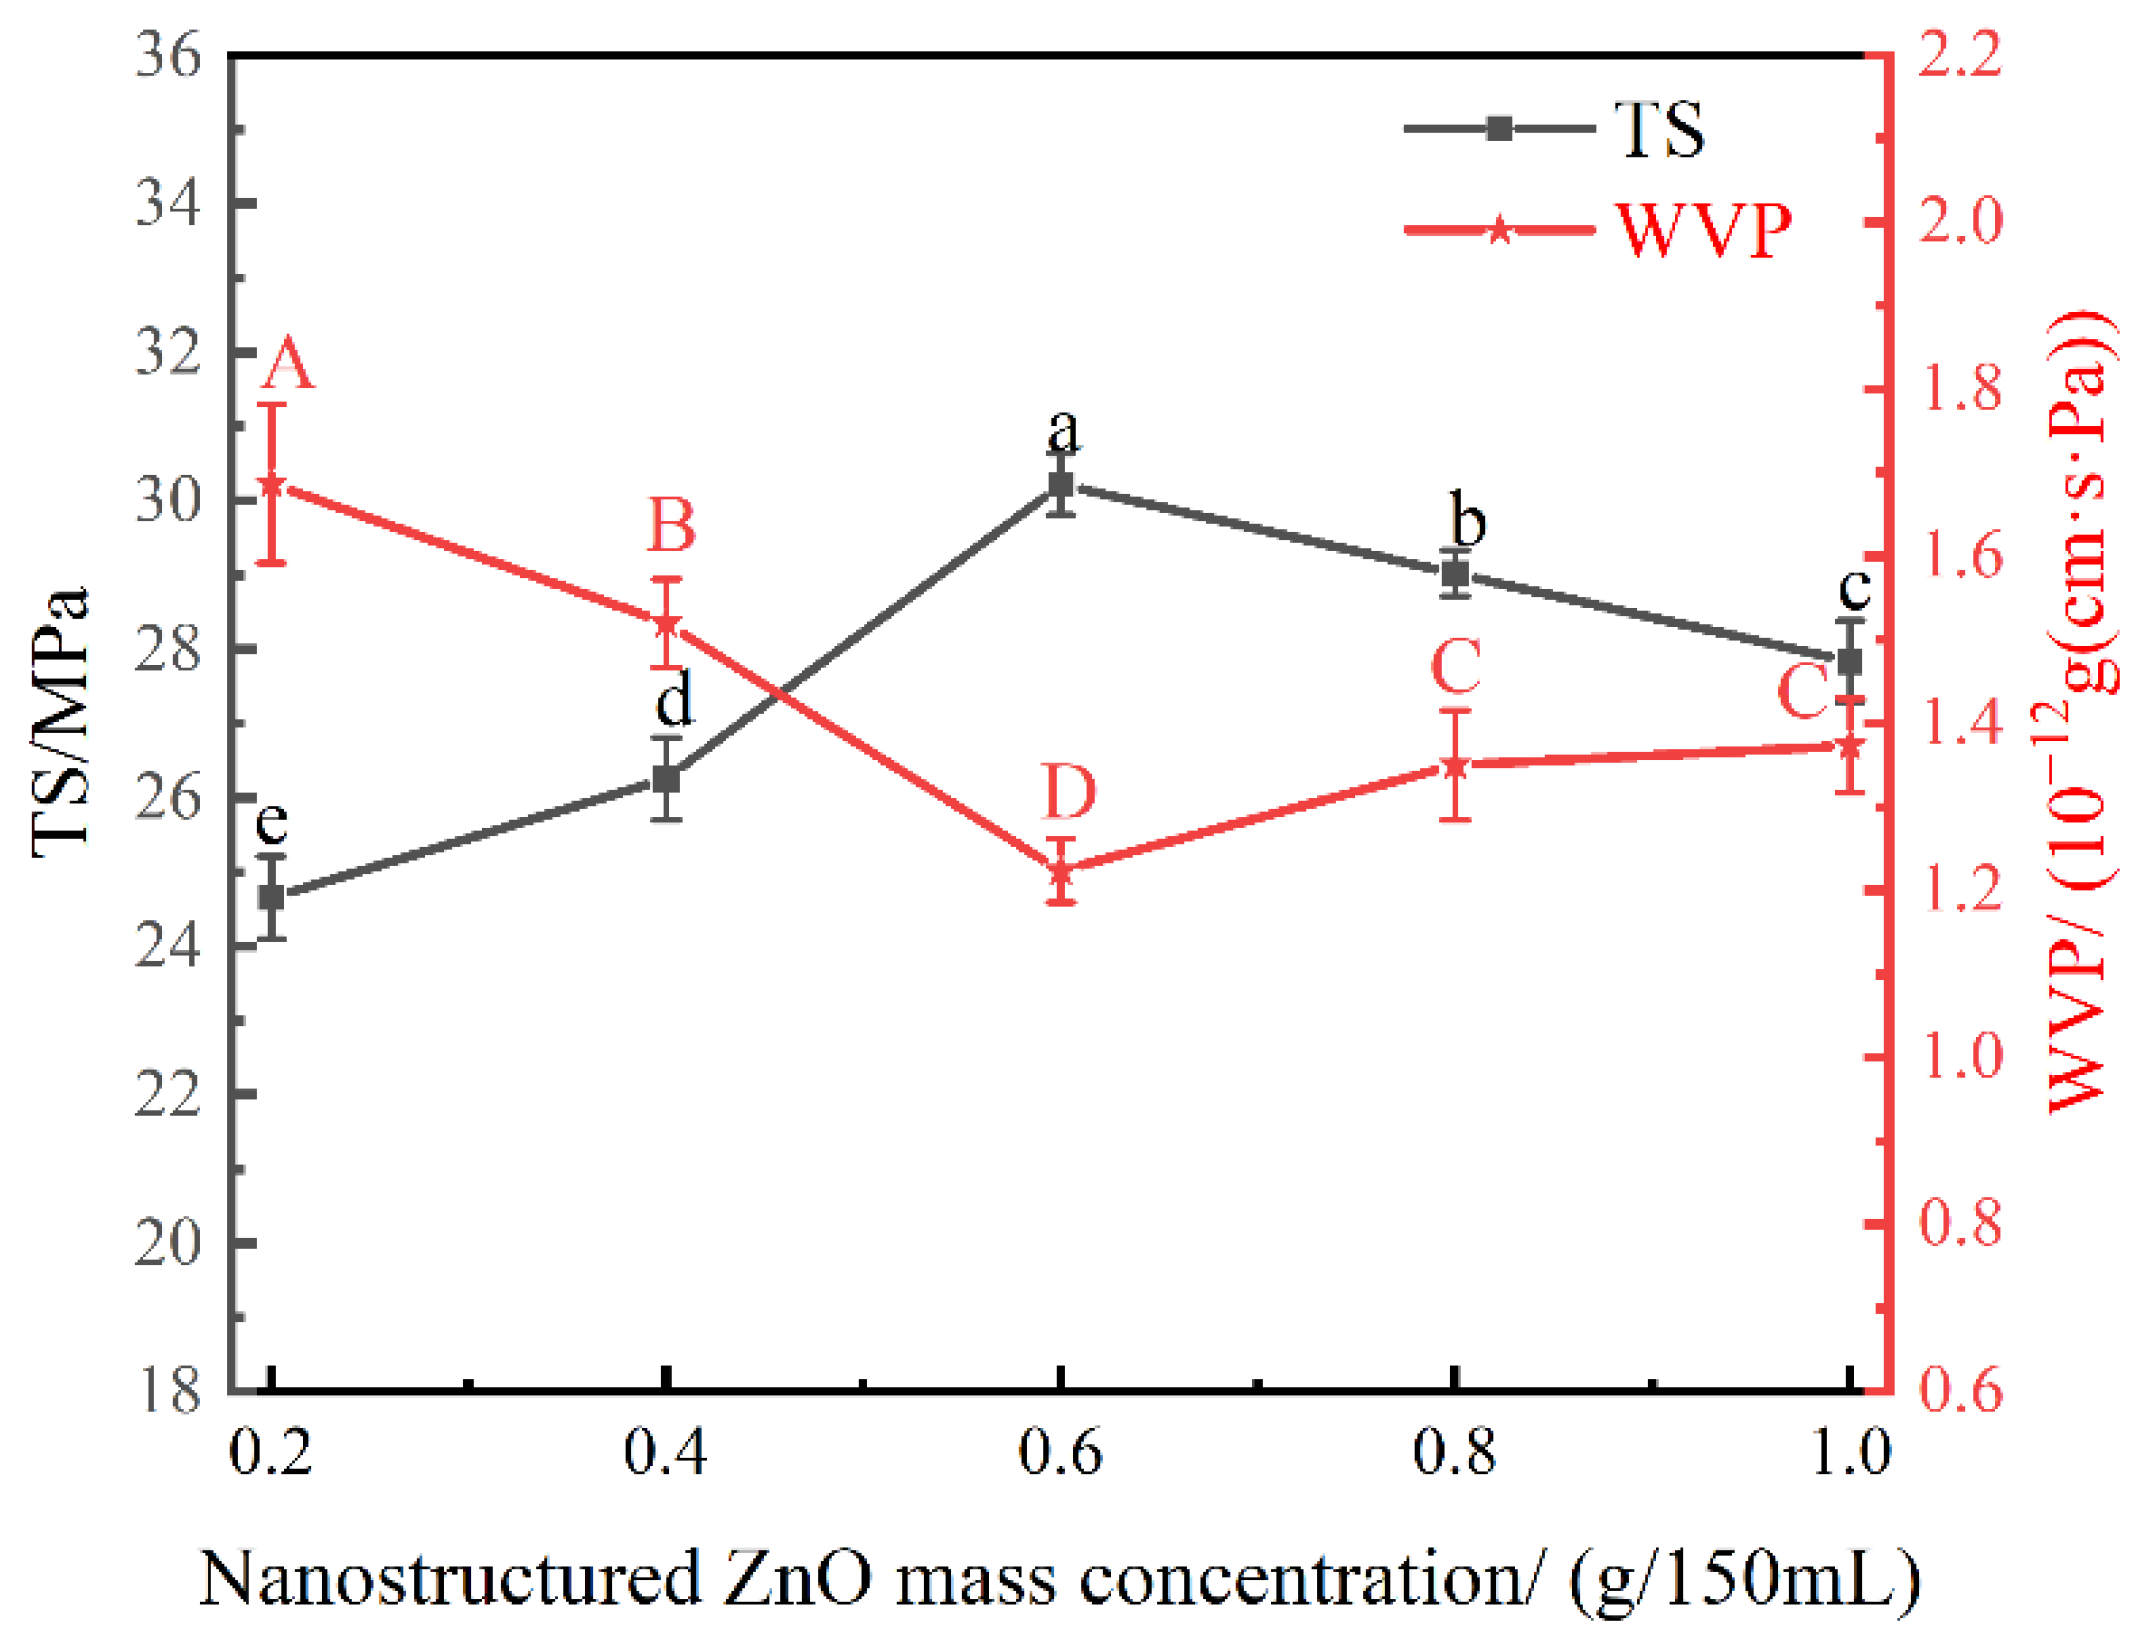
3.4. Effect of Nanostructured ZnO Mass Concentration on the Physical Properties of the Nanocomposite Films
3.5. Response Surface Test Results
3.5.1. Response Surface Test Design and Results
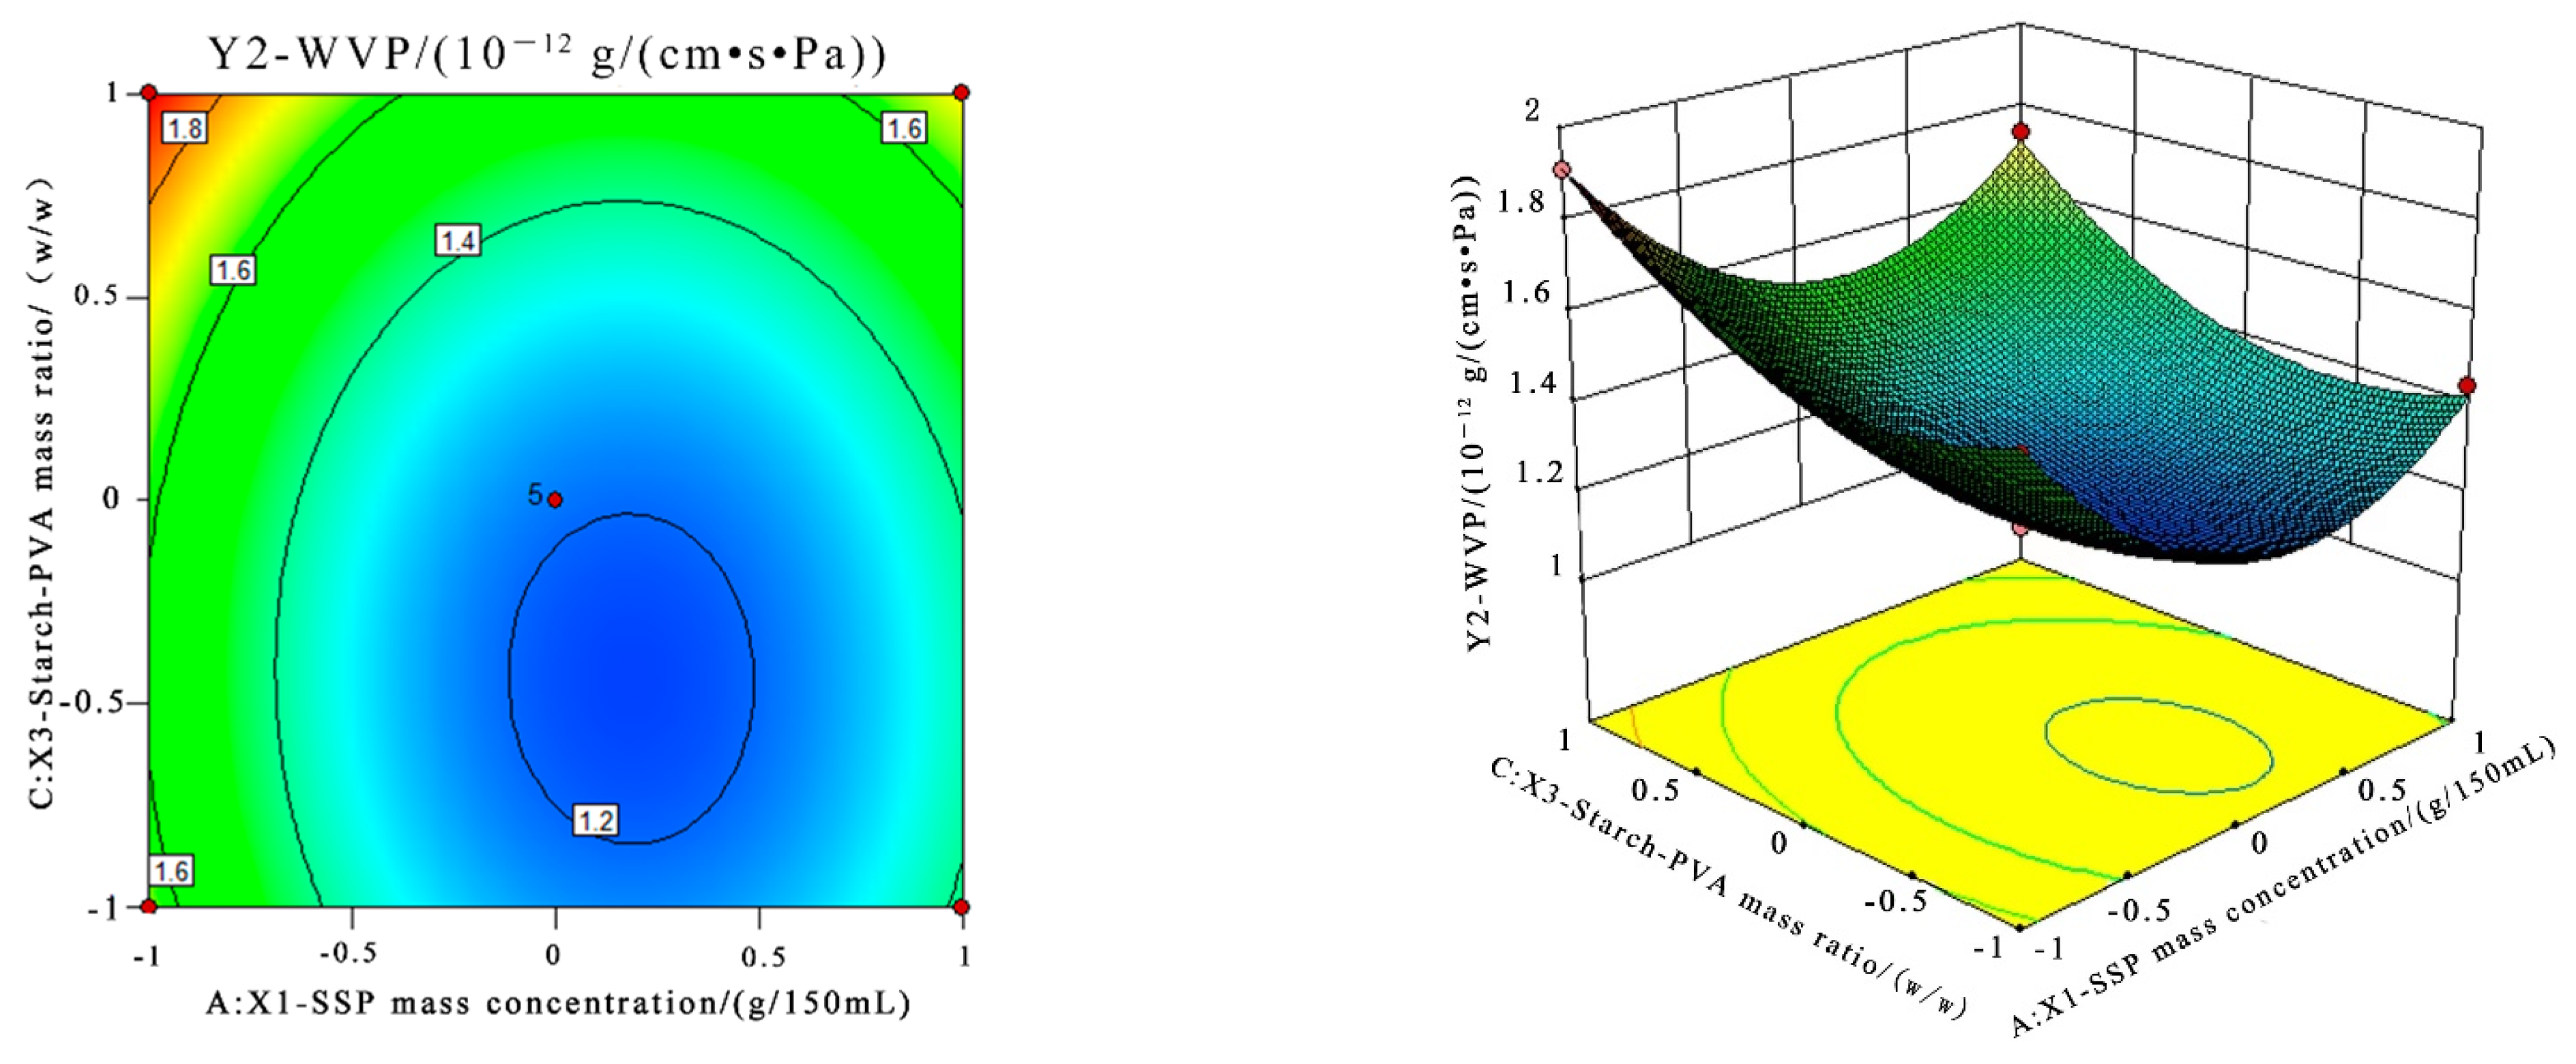
3.5.2. Response Surface Methodology
3.5.3. Optimization and Verification of the Preparation Process of the SSP/ZnO/PVA Nanocomposite Films
3.5.4. Comparison Results
3.6. Structural Characterization of the SSP/ZnO/PVA Nanocomposite Films
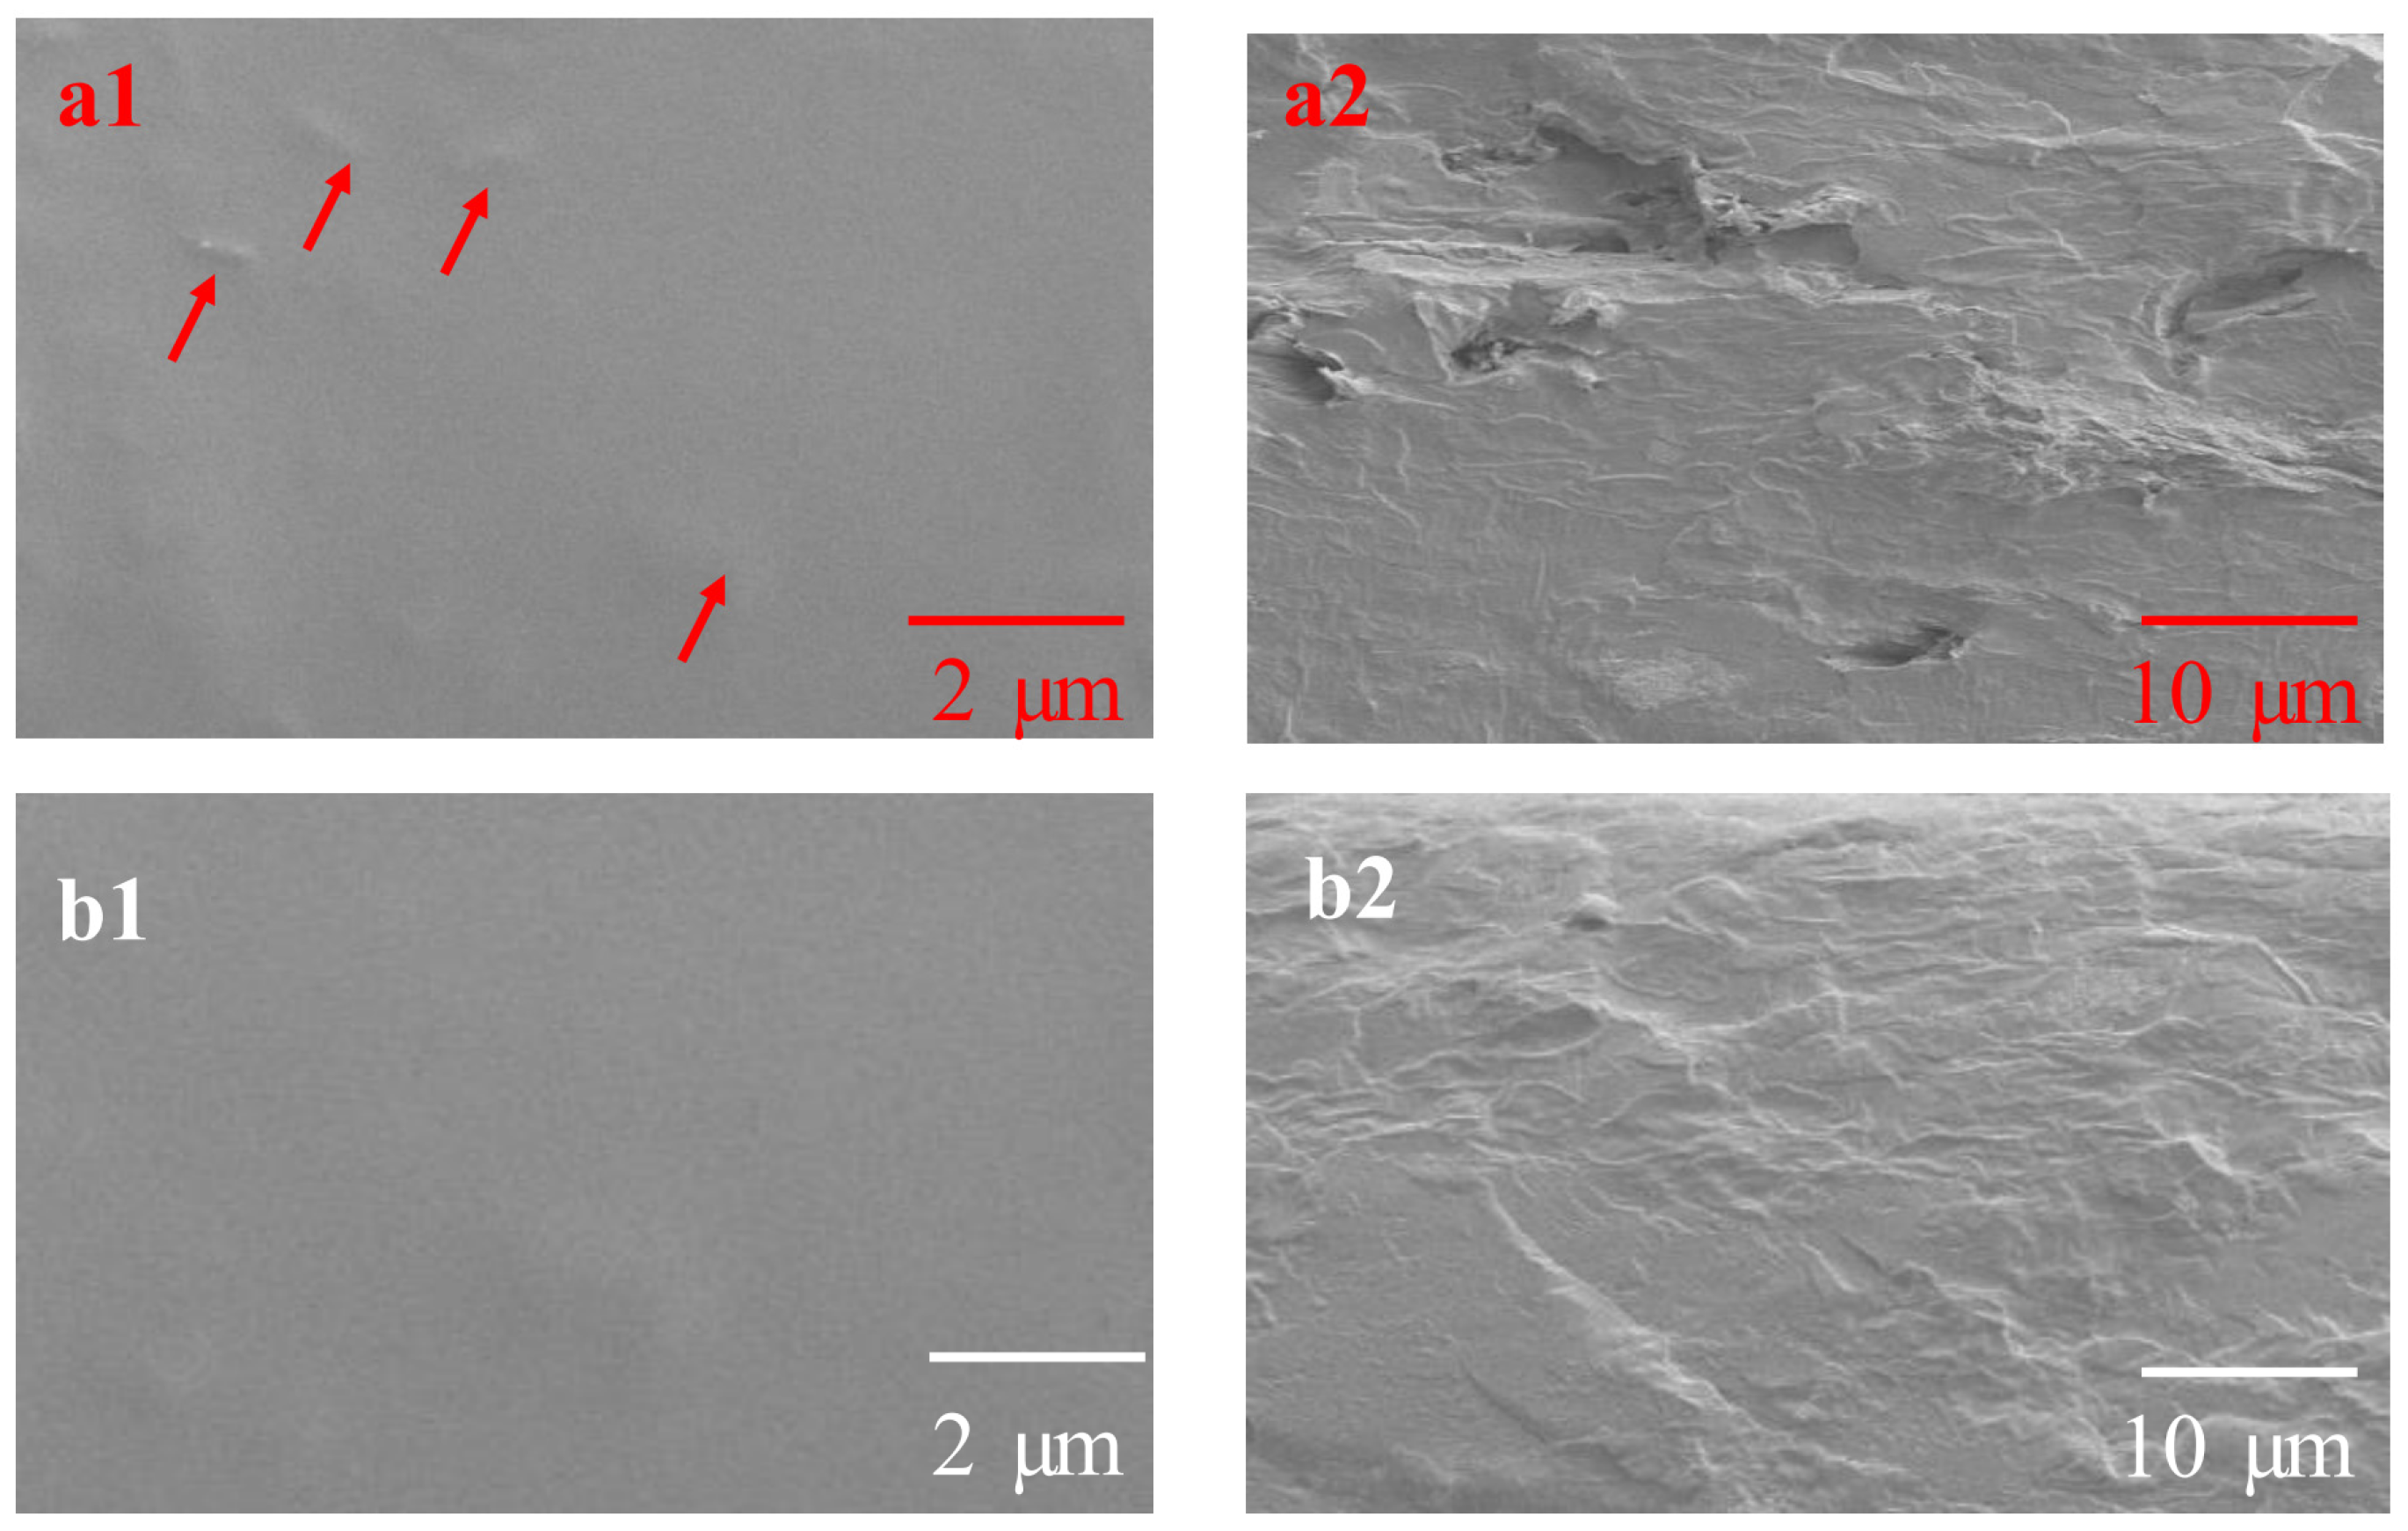
3.6.1. SEM Analysis
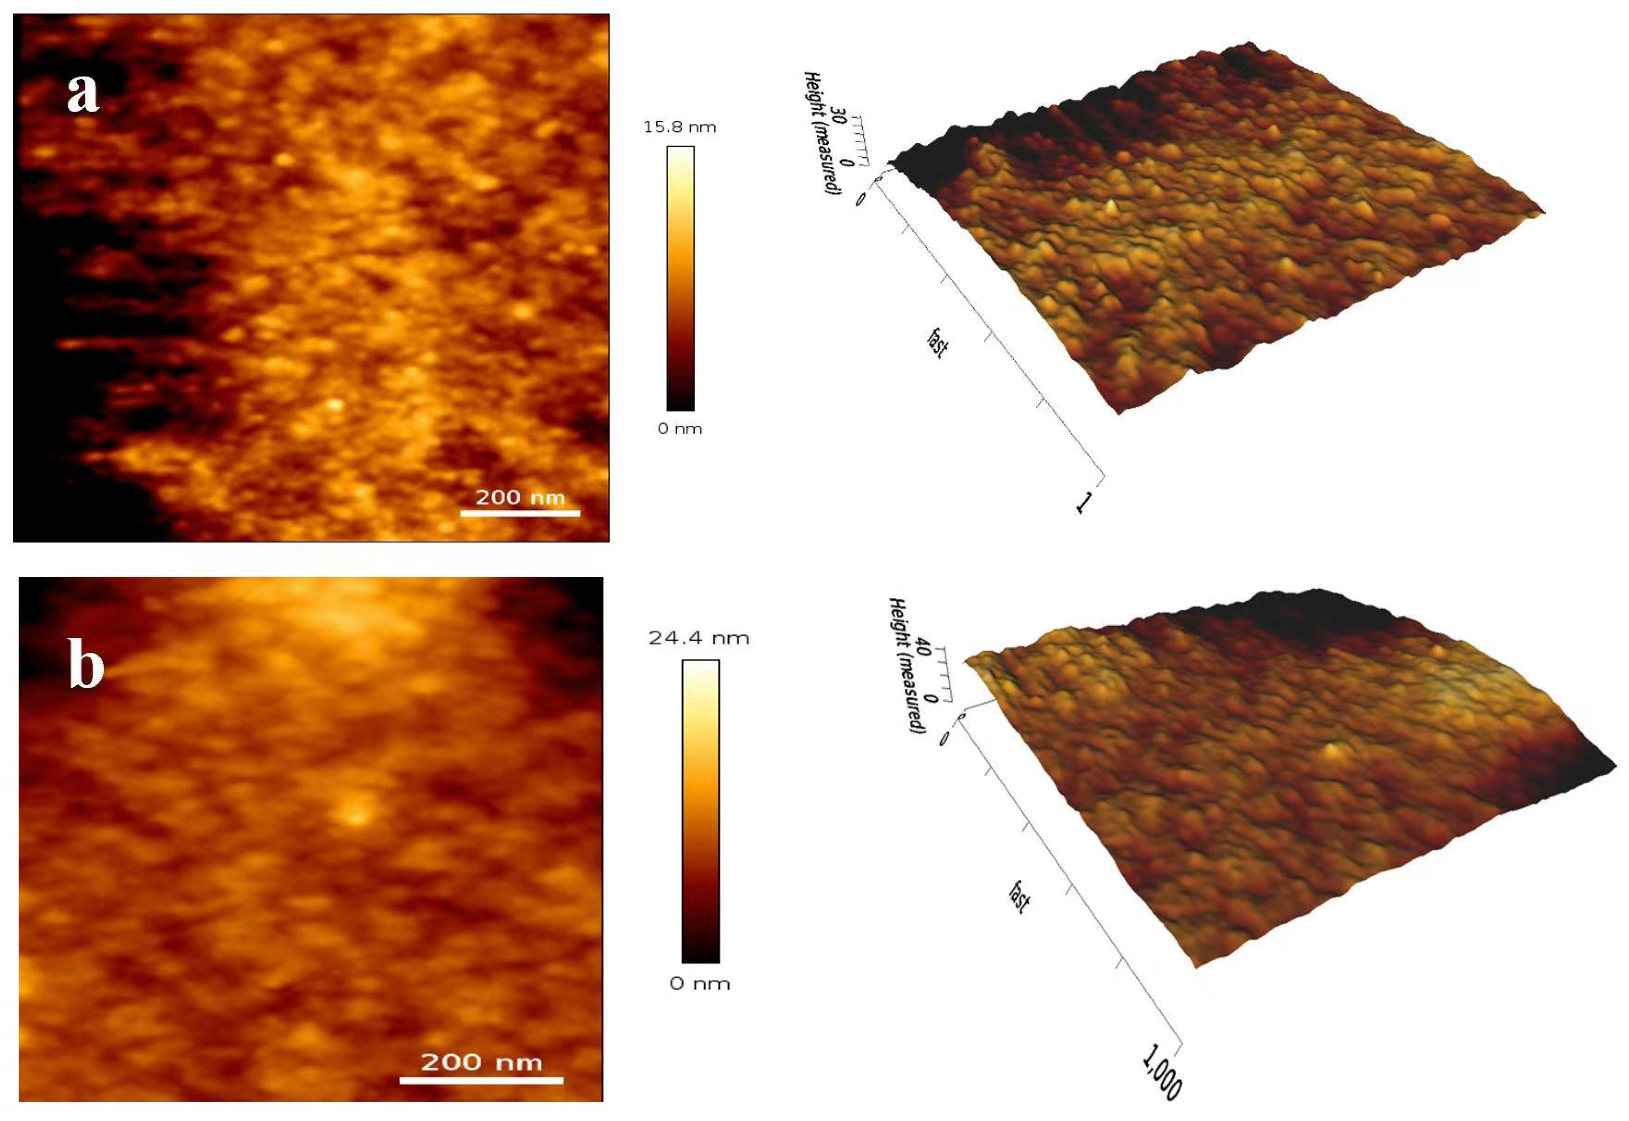
3.6.2. AFM Analysis
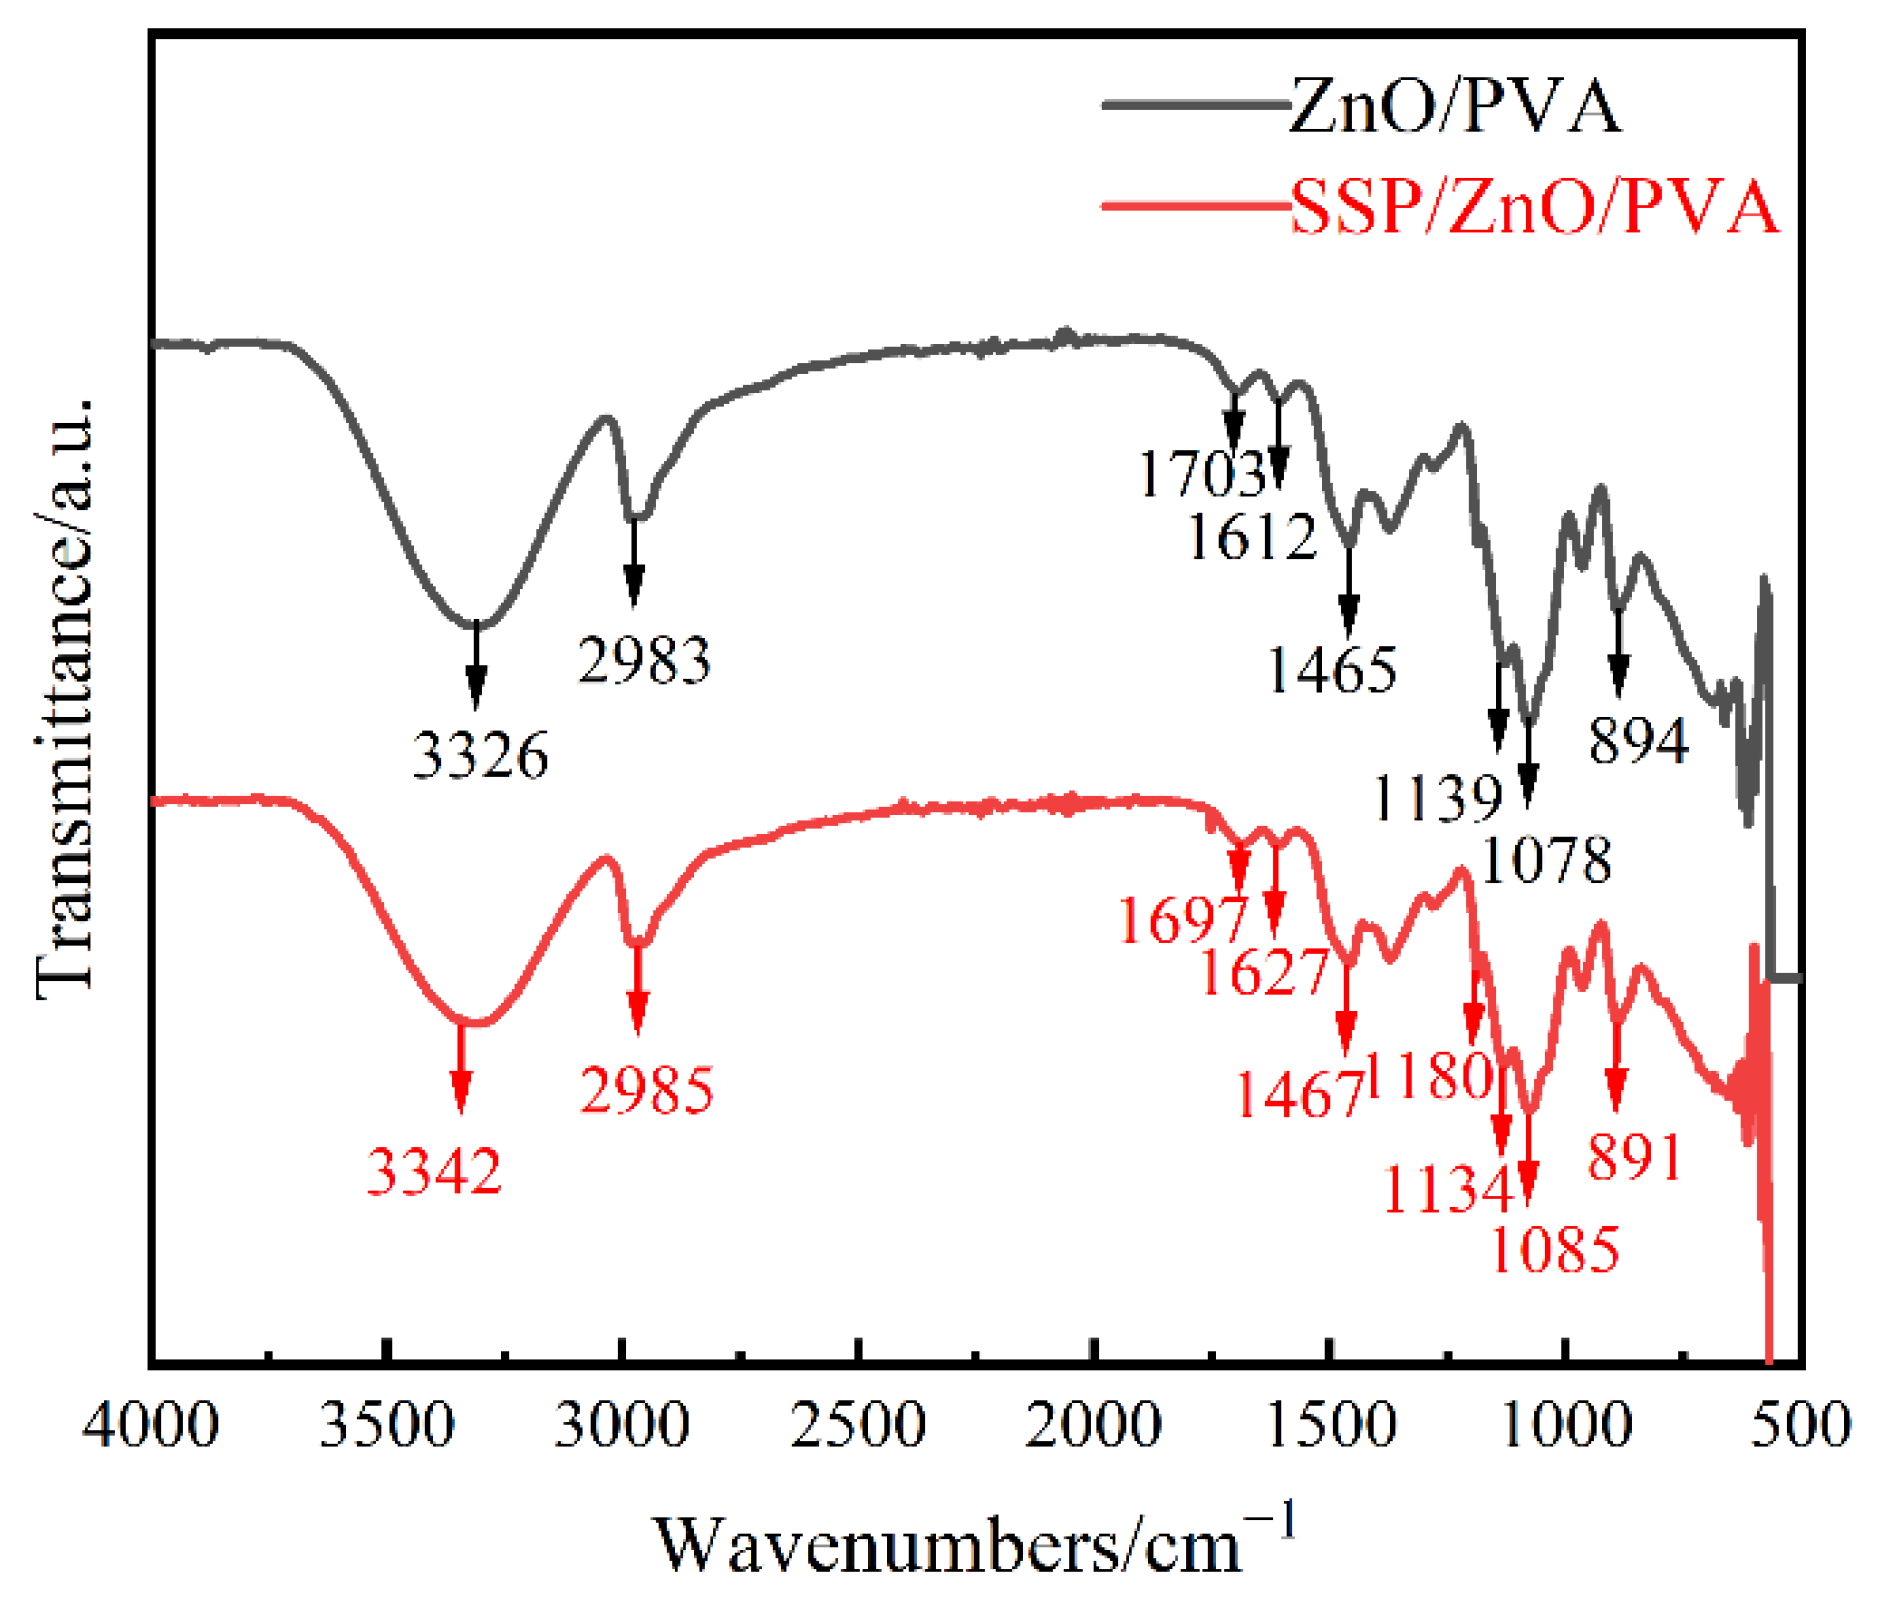
3.6.3. FT-IR Analysis
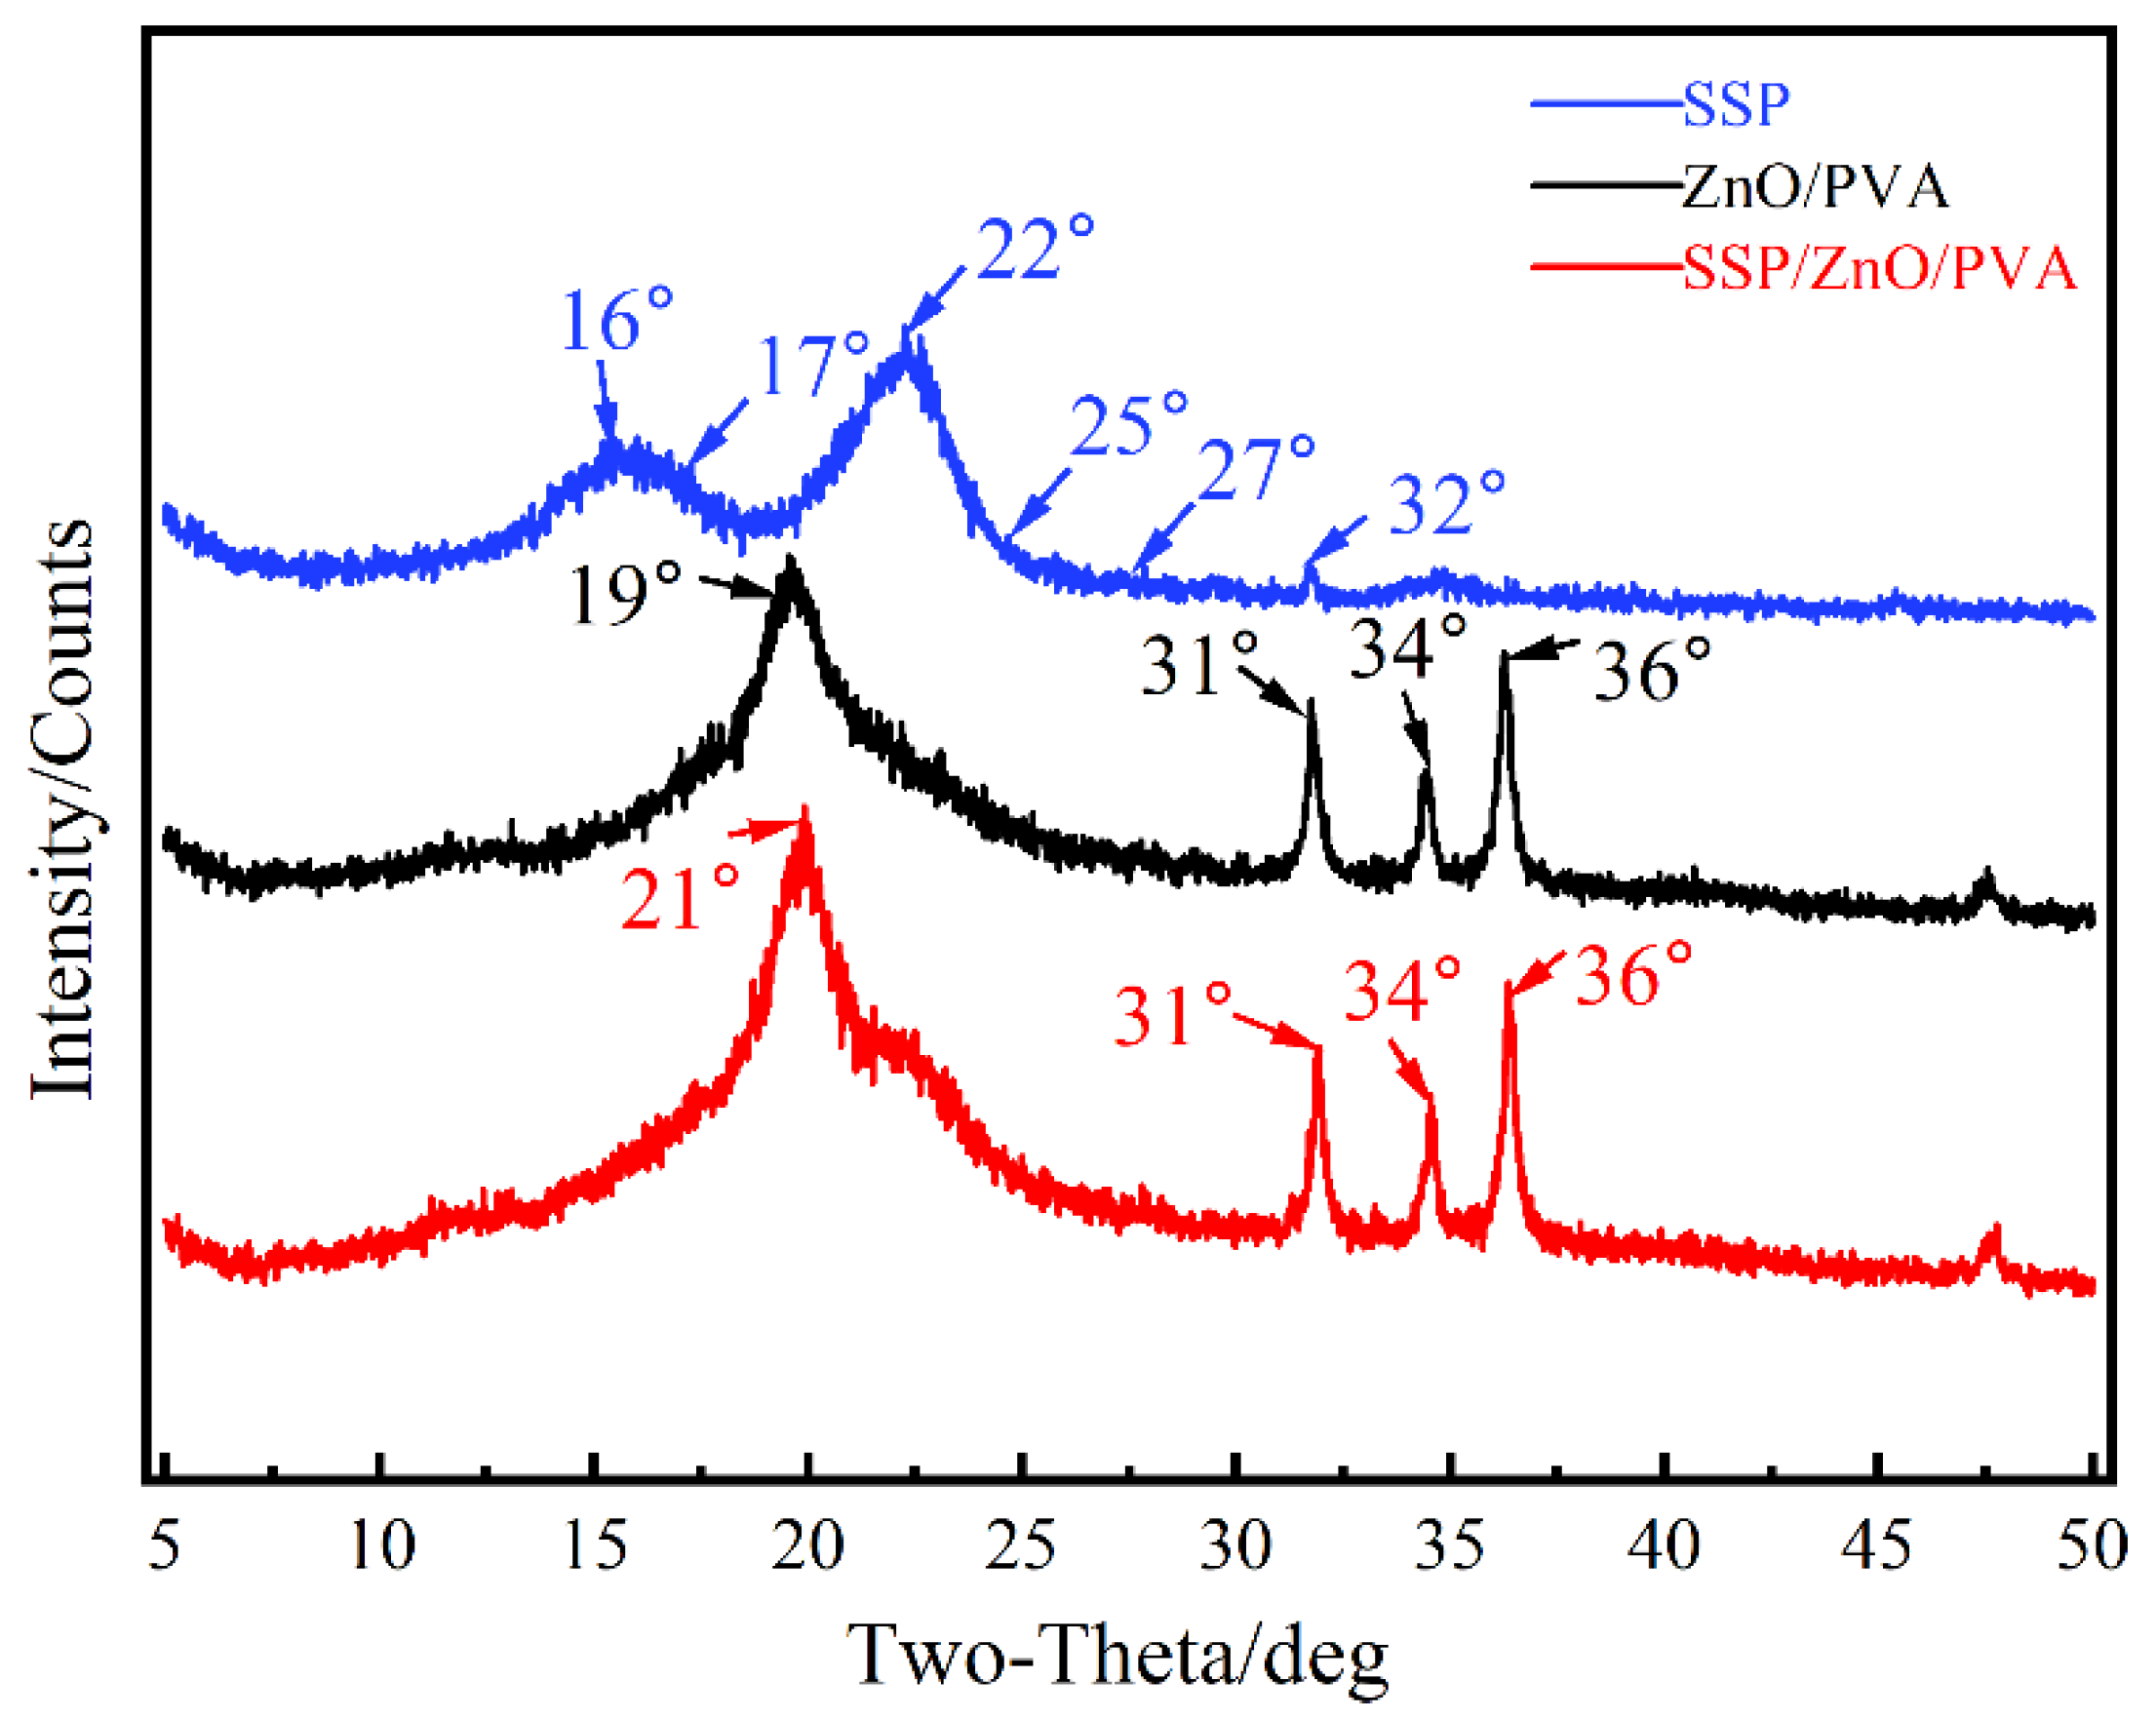
3.6.4. XRD Analysis
3.6.5. TGA
4. Conclusions
Author Contributions
Funding
Institutional Review Board Statement
Informed Consent Statement
Data Availability Statement
Conflicts of Interest
References
- Du, W.; Jiang, T.; Shi, M.; Yang, Z.; Zhang, X. Structure and Properties of Starch/Poly (vinyl alcohol) Film Modificated by Different Inorganic Salts. Chem. Sel. 2019, 4, 600–607. [Google Scholar] [CrossRef]
- Tripathi, S.; Mehrotra, G.K.; Dutta, P.K. Physicochemical and bioactivity of cross-linked chitosan–PVA film for food packaging applications. Int. J. Biol. Macromol. 2009, 45, 372–376. [Google Scholar] [CrossRef] [PubMed]
- Duncan, T.V. Applications of nanotechnology in food packaging and food safety: Barrier materials, antimicrobials and sensors. J. Colloid Interface Sci. 2011, 363, 1–24. [Google Scholar] [CrossRef] [PubMed]
- Azizi Samir, M.A.; Alloin, F.; Dufresne, A. Review of recent research into cellulosic whiskers, their properties and their application in nanocomposite field. Biomacromolecules 2005, 6, 612–626. [Google Scholar] [CrossRef]
- Azeredo, H.M.C.; Rosa, M.F.; Mattoso, L.H.C. Nanocellulose in bio-based food packaging applications. Ind. Crops Prod. 2017, 97, 664–671. [Google Scholar] [CrossRef]
- de Moura, M.R.; Aouada, F.A.; Avena-Bustillos, R.J.; McHugh, T.H.; Krochta, J.M.; Mattoso, L.H.C. Improved barrier and mechanical properties of novel hydroxypropyl methylcellulose edible films with chitosan/tripolyphosphate nanoparticles. J. Food Eng. 2009, 92, 448–453. [Google Scholar] [CrossRef]
- Wang, L.; Mu, R.-J.; Li, Y.; Lin, L.; Lin, Z.; Pang, J. Characterization and antibacterial activity evaluation of curcumin loaded konjac glucomannan and zein nanofibril films. LWT 2019, 113, 108293. [Google Scholar] [CrossRef]
- Delorme, A.E.; Radusin, T.; Myllytie, P.; Verney, V.; Askanian, H. Enhancement of Gas Barrier Properties and Durability of Poly(butylene succinate-co-butylene adipate)-Based Nanocomposites for Food Packaging Applications. Nanomaterials 2022, 12, 978. [Google Scholar] [CrossRef]
- Sanuja, S.; Agalya, A.; Umapathy, M.J. Synthesis and characterization of zinc oxide–neem oil–chitosan bionanocomposite for food packaging application. Int. J. Biol. Macromol. 2015, 74, 76–84. [Google Scholar] [CrossRef]
- Lou, Z.; Wang, Q.; Kara, U.I.; Mamtani, R.S.; Zhou, X.; Bian, H.; Yang, Z.; Li, Y.; Lv, H.; Adera, S.; et al. Biomass-Derived Carbon Heterostructures Enable Environmentally Adaptive Wideband Electromagnetic Wave Absorbers. Nanomicro Lett. 2021, 14, 11. [Google Scholar] [CrossRef]
- Zhang, S.; Xia, C.; Dong, Y.; Yan, Y.; Li, J.; Shi, S.Q.; Cai, L. Soy protein isolate-based films reinforced by surface modified cellulose nanocrystal. Ind. Crops Prod. 2016, 80, 207–213. [Google Scholar] [CrossRef]
- Mahmoud, K.H. Optical properties of hydroxyethyl cellulose film treated with nitrogen plasma. Spectrochim. Acta Part A Mol. Biomol. Spectrosc. 2016, 157, 153–157. [Google Scholar] [CrossRef] [PubMed]
- Morán, J.I.; Alvarez, V.A.; Cyras, V.P.; Vázquez, A. Extraction of cellulose and preparation of nanocellulose from sisal fibers. Cellulose 2008, 15, 149–159. [Google Scholar] [CrossRef]
- Lizundia, E.; Fortunati, E.; Dominici, F.; Vilas, J.L.; León, L.M.; Armentano, I.; Torre, L.; Kenny, J.M. PLLA-grafted cellulose nanocrystals: Role of the CNC content and grafting on the PLA bionanocomposite film properties. Carbohydr. Polym. 2016, 142, 105–113. [Google Scholar] [CrossRef] [PubMed]
- Ounkaew, A.; Kasemsiri, P.; Kamwilaisak, K.; Saengprachatanarug, K.; Mongkolthanaruk, W.; Souvanh, M.; Pongsa, U.; Chindaprasirt, P. Polyvinyl Alcohol (PVA)/Starch Bioactive Packaging Film Enriched with Antioxidants from Spent Coffee Ground and Citric Acid. J. Polym. Environ. 2018, 26, 3762–3772. [Google Scholar] [CrossRef]
- Zanela, J.; Casagrande, M.; Reis, M.O.; Grossmann, M.V.E.; Yamashita, F. Biodegradable Sheets of Starch/Polyvinyl Alcohol (PVA): Effects of PVA Molecular Weight and Hydrolysis Degree. Waste Biomass Valoriz. 2019, 10, 319–326. [Google Scholar] [CrossRef]
- Hou, T.; Jia, Z.; Feng, A.; Zhou, Z.; Liu, X.; Lv, H.; Wu, G. Hierarchical composite of biomass derived magnetic carbon framework and phytic acid doped polyanilne with prominent electromagnetic wave absorption capacity. J. Mater. Sci. Technol. 2021, 68, 61–69. [Google Scholar] [CrossRef]
- Sun, H.; Shao, X.; Ma, Z. Effect of Incorporation Nanocrystalline Corn Straw Cellulose and Polyethylene Glycol on Properties of Biodegradable Films. J. Food Sci. 2016, 81, E2529–E2537. [Google Scholar] [CrossRef]
- Kunanopparat, T.; Menut, P.; Morel, M.-H.; Guilbert, S. Plasticized wheat gluten reinforcement with natural fibers: Effect of thermal treatment on the fiber/matrix adhesion. Compos. Part A Appl. Sci. Manuf. 2008, 39, 1787–1792. [Google Scholar] [CrossRef]
- Dobircau, L.; Sreekumar, P.A.; Saiah, R.; Leblanc, N.; Terrié, C.; Gattin, R.; Saiter, J.M. Wheat flour thermoplastic matrix reinforced by waste cotton fibre: Agro-green-composites. Compos. Part A Appl. Sci. Manuf. 2009, 40, 329–334. [Google Scholar] [CrossRef]
- El Halal, S.L.M.; Colussi, R.; Deon, V.G.; Pinto, V.Z.; Villanova, F.A.; Carreño, N.L.V.; Dias, A.R.G.; da Rosa Zavareze, E.R. Films based on oxidized starch and cellulose from barley. Carbohydr. Polym. 2015, 133, 644–653. [Google Scholar] [CrossRef] [PubMed] [Green Version]
- da Silva, J.B.; Pereira, F.V.; Druzian, J.I. Cassava starch-based films plasticized with sucrose and inverted sugar and reinforced with cellulose nanocrystals. J. Food Sci. 2012, 77, N14–N19. [Google Scholar] [CrossRef] [PubMed]
- Oliveira, T.G.; Makishi, G.L.A.; Chambi, H.N.M.; Bittante, A.M.Q.B.; Lourenço, R.V.; Sobral, P.J.A. Cellulose fiber reinforced biodegradable films based on proteins extracted from castor bean (Ricinus communis L.) cake. Ind. Crops Prod. 2015, 67, 355–363. [Google Scholar] [CrossRef]
- Barthel, S.; Heinze, T. Acylation and carbanilation of cellulose in ionic liquids. Green Chem. 2006, 8, 301–306. [Google Scholar] [CrossRef]
- Feng, L.; Chen, Z.-l. Research progress on dissolution and functional modification of cellulose in ionic liquids. J. Mol. Liq. 2008, 142, 1–5. [Google Scholar] [CrossRef]
- Xu, S.; Jiang, M.; Lu, Q.; Gao, S.; Feng, J.; Wang, X.; He, X.; Chen, K.; Li, Y.; Ouyang, P. Properties of Polyvinyl Alcohol Films Composited with Hemicellulose and Nanocellulose Extracted from Artemisia selengensis Straw. Front. Bioeng. Biotechnol. 2020, 8, 980. [Google Scholar] [CrossRef]
- Zhong, Y.; Song, X.; Li, Y. Antimicrobial, physical and mechanical properties of kudzu starch–chitosan composite films as a function of acid solvent types. Carbohydr. Polym. 2011, 84, 335–342. [Google Scholar] [CrossRef]
- Ortega-Toro, R.; Muñoz, A.; Talens, P.; Chiralt, A. Improvement of properties of glycerol plasticized starch films by blending with a low ratio of polycaprolactone and/or polyethylene glycol. Food Hydrocoll. 2016, 56, 9–19. [Google Scholar] [CrossRef]
- Bedane, A.H.; Eić, M.; Farmahini-Farahani, M.; Xiao, H. Water vapor transport properties of regenerated cellulose and nanofibrillated cellulose films. J. Membr. Sci. 2015, 493, 46–57. [Google Scholar] [CrossRef]
- Anbinder, P.S.; Peruzzo, P.J.; Martino, M.N.; Amalvy, J.I. Effect of antioxidant active films on the oxidation of soybean oil monitored by Fourier transform infrared spectroscopy. J. Food Eng. 2015, 151, 43–50. [Google Scholar] [CrossRef]
- Takechi, S.; Teramoto, Y.; Nishio, Y. Improvement of dielectric properties of cyanoethyl cellulose via esterification and film stretching. Cellulose 2016, 23, 765–777. [Google Scholar] [CrossRef]
- Bishay, I.K.; Abd-El-Messieh, S.L.; Mansour, S.H. Electrical, mechanical and thermal properties of polyvinyl chloride composites filled with aluminum powder. Mater. Des. 2011, 32, 62–68. [Google Scholar] [CrossRef]
- Romani, V.P.; Prentice-Hernández, C.; Martins, V.G. Active and sustainable materials from rice starch, fish protein and oregano essential oil for food packaging. Ind. Crops Prod. 2017, 97, 268–274. [Google Scholar] [CrossRef]
- Mendieta-Taboada, O.; Sobral, P.J.d.A.; Carvalho, R.A.; Habitante, A.M.B.Q. Thermomechanical properties of biodegradable films based on blends of gelatin and poly(vinyl alcohol). Food Hydrocoll. 2008, 22, 1485–1492. [Google Scholar] [CrossRef]
- Bootklad, M.; Kaewtatip, K. Biodegradation of thermoplastic starch/eggshell powder composites. Carbohydr. Polym. 2013, 97, 315–320. [Google Scholar] [CrossRef]
- Espino, E.; Cakir, M.; Domenek, S.; Román-Gutiérrez, A.D.; Belgacem, N.; Bras, J. Isolation and characterization of cellulose nanocrystals from industrial by-products of Agave tequilana and barley. Ind. Crops Prod. 2014, 62, 552–559. [Google Scholar] [CrossRef]
- Wu, C.; Peng, S.; Wen, C.; Wang, X.; Fan, L.; Deng, R.; Pang, J. Structural characterization and properties of konjac glucomannan/curdlan blend films. Carbohydr. Polym. 2012, 89, 497–503. [Google Scholar] [CrossRef]
- Jiang, S.; Liu, C.; Wang, X.; Xiong, L.; Sun, Q. Physicochemical properties of starch nanocomposite films enhanced by self-assembled potato starch nanoparticles. LWT—Food Sci. Technol. 2016, 69, 251–257. [Google Scholar] [CrossRef]
- Rahman, M.M.; Netravali, A.N.; Tiimob, B.J.; Rangari, V.K. Bioderived “Green” Composite from Soy Protein and Eggshell Nanopowder. ACS Sustain. Chem. Eng. 2014, 2, 2329–2337. [Google Scholar] [CrossRef]


| Level | Factor | |||
|---|---|---|---|---|
| SSP Mass Concentration/(g/150 mL) | Gly Mass Concentration/(g/150 mL) | Starch–PVA Mass Ratio/(w/w) | Nanostructured ZnO Mass Concentration/(g/150 mL) | |
| 1 | 1 | 1.5 | 9:1 | 0.2 |
| 2 | 1.5 | 2 | 8:2 | 0.4 |
| 3 | 2 | 2.5 | 7:3 | 0.6 |
| 4 | 2.5 | 3 | 6:4 | 0.8 |
| 5 | 3.0 | 3.5 | 5:5 | 1.0 |
| Factor | Level | ||
|---|---|---|---|
| −1 | 0 | 1 | |
| X1—SSP mass concentration/(g/150 mL) | 1.5 | 2 | 2.5 |
| X2—Gly mass concentration/(g/150 mL) | 2 | 2.5 | 3 |
| X3—starch–PVA mass ratio/(w/w) | 7:3 | 6:4 | 5:5 |
| X4—nanostructured ZnO mass concentration/(g/150 mL) | 0.4 | 0.6 | 0.8 |
| Test Number | X1 | X2 | X3 | X4 | Y1/MPa | Y2/(10−12 g/(cm·s·Pa)) |
|---|---|---|---|---|---|---|
| 1 | −1 | −1 | 0 | 0 | 21.25 | 1.81 |
| 2 | 1 | −1 | 0 | 0 | 26.45 | 1.56 |
| 3 | −1 | 1 | 0 | 0 | 26.19 | 1.73 |
| 4 | 1 | 1 | 0 | 0 | 27.04 | 1.52 |
| 5 | 0 | 0 | −1 | −1 | 18.43 | 1.34 |
| 6 | 0 | 0 | 1 | −1 | 22.95 | 1.62 |
| 7 | 0 | 0 | −1 | 1 | 17.98 | 1.36 |
| 8 | 0 | 0 | 1 | 1 | 29.55 | 1.68 |
| 9 | −1 | 0 | 0 | −1 | 22.75 | 1.72 |
| 10 | 1 | 0 | 0 | −1 | 23.3 | 1.51 |
| 11 | −1 | 0 | 0 | 1 | 22.41 | 1.76 |
| 12 | 1 | 0 | 0 | 1 | 26.85 | 1.54 |
| 13 | 0 | −1 | −1 | 0 | 18.04 | 1.41 |
| 14 | 0 | 1 | −1 | 0 | 22.35 | 1.36 |
| 15 | 0 | −1 | 1 | 0 | 27.29 | 1.68 |
| 16 | 0 | 1 | 1 | 0 | 28.45 | 1.64 |
| 17 | −1 | 0 | −1 | 0 | 17.69 | 1.65 |
| 18 | 1 | 0 | −1 | 0 | 17.38 | 1.44 |
| 19 | −1 | 0 | 1 | 0 | 23.37 | 1.91 |
| 20 | 1 | 0 | 1 | 0 | 27.93 | 1.74 |
| 21 | 0 | −1 | 0 | −1 | 25.52 | 1.49 |
| 22 | 0 | 1 | 0 | −1 | 25.16 | 1.52 |
| 23 | 0 | −1 | 0 | 1 | 25.82 | 1.51 |
| 24 | 0 | 1 | 0 | 1 | 27.15 | 1.47 |
| 25 | 0 | 0 | 0 | 0 | 31.23 | 1.12 |
| 26 | 0 | 0 | 0 | 0 | 31.06 | 1.26 |
| 27 | 0 | 0 | 0 | 0 | 31.35 | 1.15 |
| 28 | 0 | 0 | 0 | 0 | 29.98 | 1.29 |
| 29 | 0 | 0 | 0 | 0 | 31.02 | 1.25 |
| Source | TS | WVP | ||
|---|---|---|---|---|
| F Value | p Value | F Value | p Value | |
| Model | 71.69 | <0.0001 ** | 39.23 | <0.0001 ** |
| X1—mass concentration/(g/150 mL) | 37.06 | <0.0001 ** | 67.78 | <0.0001 ** |
| X2—Gly mass concentration/(g/150 mL) | 22.71 | 0.0003 ** | 2.03 | 0.1757 |
| X3—starch–PVA mass ratio/(w/w) | 360.21 | <0.0001 ** | 122.88 | <0.0001 ** |
| X4—nanostructured ZnO mass concentration/(g/150 mL) | 21.51 | 0.0004 ** | 0.61 | 0.4496 |
| X1X2 | 9.00 | 0.0096 ** | 0.20 | 0.6602 |
| X1X3 | 11.28 | 0.0047 ** | 0.20 | 0.6602 |
| X1X4 | 7.20 | 0.0179 * | 0.013 | 0.9122 |
| X2X3 | 4.72 | 0.0475 * | 0.013 | 0.9122 |
| X2X4 | 1.36 | 0.2633 | 0.62 | 0.4450 |
| X3X4 | 23.64 | 0.0003 ** | 0.2 | 0.6602 |
| X12 | 191.72 | <0.0001 ** | 288.86 | <0.0001 ** |
| X22 | 34.80 | <0.0001 ** | 72.05 | <0.0001 ** |
| X32 | 352.09 | <0.0001 ** | 88.70 | <0.0001 ** |
| X42 | 133.10 | <0.0001 ** | 51.86 | <0.0001 ** |
| Lack of Fit | 2.07 | 0.2525 | 0.10 | 0.9983 |
Publisher’s Note: MDPI stays neutral with regard to jurisdictional claims in published maps and institutional affiliations. |
© 2022 by the authors. Licensee MDPI, Basel, Switzerland. This article is an open access article distributed under the terms and conditions of the Creative Commons Attribution (CC BY) license (https://creativecommons.org/licenses/by/4.0/).
Share and Cite
Li, J.; Zhang, G.; Zhang, D. Structural Optimization of Sorghum Straw Powder/ZnO/PVA Nanocomposite Films. Coatings 2022, 12, 1226. https://doi.org/10.3390/coatings12081226
Li J, Zhang G, Zhang D. Structural Optimization of Sorghum Straw Powder/ZnO/PVA Nanocomposite Films. Coatings. 2022; 12(8):1226. https://doi.org/10.3390/coatings12081226
Chicago/Turabian StyleLi, Juan, Guantao Zhang, and Dongjie Zhang. 2022. "Structural Optimization of Sorghum Straw Powder/ZnO/PVA Nanocomposite Films" Coatings 12, no. 8: 1226. https://doi.org/10.3390/coatings12081226
APA StyleLi, J., Zhang, G., & Zhang, D. (2022). Structural Optimization of Sorghum Straw Powder/ZnO/PVA Nanocomposite Films. Coatings, 12(8), 1226. https://doi.org/10.3390/coatings12081226