Article

A FCEEMD Energy Kurtosis Mean Filtering-Based Fault Feature Extraction Method

1
The Laboratory of Pattern Recognition and Artificial Intelligence, Kunming 650500, China
2
School of Information Science and Technology, Yunnan Normal University, Kunming 650500, China
*
Authors to whom correspondence should be addressed.
Coatings 2022, 12(9), 1337; https://doi.org/10.3390/coatings12091337
Submission received: 29 July 2022 / Revised: 6 September 2022 / Accepted: 8 September 2022 / Published: 14 September 2022

Abstract

:
Aiming at the problem that fault feature extraction is susceptible to background noises and burrs, we proposed a new feature extraction method based on a new decomposition method and an effective intrinsic mode function (IMF) selection method. Firstly, pairs of white noises with opposite signs were introduced to neutralize the residual noises in ensemble empirical mode decomposition (EEMD) and suppress mode mixing. Both the reconstruction error (1.8445 × 10⁻¹⁷) and decomposition time (0.01 s) were greatly reduced through fast, complementary ensemble empirical mode decomposition (FCEEMD). Secondly, we integrated the energy and kurtosis of the IMF and proposed an effective IMF selection method based on energy kurtosis mean filtering, and the background noise of the signal was greatly suppressed. Finally, the periodic impacts were extracted from the IMF reconstruction signal by multipoint optimal minimum entropy deconvolution adjusted (MOMEDA). The fault frequencies were extracted from the periodic impacts through Hilbert demodulation, and the relative errors between the measured values and the theoretical values were all less than 0.05. The experimental results show that the proposed method can extract fault features more efficiently and provide a novel method for the fault diagnosis of rotating machinery.

1. Introduction

Bearing is widely used in metallurgy, electric power and the machinery manufacturing industry [1]. Bearing failure affects the normal operation and production efficiency of equipment and even causes a serious loss of life and property [2]. Therefore, bearing fault diagnosis is important. The running process of the bearing is complicated, and the vibration signal is a nonlinear and non-stationary signal, which brings great challenges to fault diagnosis.
Hilbert envelope demodulation is the commonly used feature extraction method [3], which can identify the vibration shock contained in the modulated signals. Envelope demodulation is effective when used for a single frequency modulation and amplitude modulation (AM-FM) signal [4]. However, modulation signals are often mixed with carrier signals and noises. In order to obtain the AM-FM signal, the original signal needs to be decomposed before demodulation [5]. The commonly used decomposition algorithms include empirical mode decomposition (EMD) [6] and variational mode decomposition (VMD) [7], etc. The results of VMD depend on the setting of its two parameters. The intrinsic mode functions (IMFs) obtained by EMD have an endpoint effect problem and are mixed with each other. To solve the problems, ensemble empirical mode decomposition (EEMD) [8] and complementary ensemble empirical mode decomposition (CEEMD) [9] are proposed. Gao decomposed the bearing signal into several IMFs through EEMD, and selected the effective IMFs by the correlation coefficient and root mean square [10]. Although EEMD can suppress mode mixing to a certain extent, the added white noises cannot be eliminated completely [11]. In the CEEMD, white noises are added in pairs to the original signal to generate two sets of ensemble IMFs. CEEMD can eliminate the residue of added white noises totally no matter how many noises it contains [9]. Gu decomposed the bearing signal through CEEMD and selected the effective IMFs with a large correlation coefficient [11]. Li decomposed the underwater acoustic signals by complete ensemble empirical mode decomposition with adaptive noise (CEEMDAN) and identified noisy IMFs through the minimum mean square variance criterion [12]. Li decomposed warship radio noise signals by CEEMDAN and used a duffing chaotic oscillator to accurately detect the linear spectrum frequency of low-frequency IMFs [13], which can better suppress mode mixing. However, EEMD and CEEMD based on auxiliary noises have high computational complexity and low efficiency [14]. Wang proposed fast ensemble empirical mode decomposition (FEEMD) [15], which is gradually used in wind speed forecasting. Chegini decomposed the vibration signal into several IMFs by FEEMD and selected effective IMFs by autocorrelation function [16]. Sun determined the effective IMFs through FEEMD and correlation coefficient and improved the accuracy of wind speed forecasting [17]. The results show that the speed of FEEMD is fast, and the decomposition error is smaller than that of EEMD.
The IMFs obtained by EEMD and FEEMD contain carrier signals, impact components and noises, so it is important to select IMFs. Many scholars use energy, kurtosis and the correlation coefficient to select effective IMFs. If a selection method based on a single index is used, the IMFs related to the fault impact may be removed, and the IMFs related to noise may be retained. Xia decomposed the signal by VMD and selected effective IMFs with the maximum correlation coefficient and kurtosis [18]. Most of the noises can be removed by reconstructing the effective IMFs. However, there are still some noises in the reconstructed signal, which causes the impacts related to faults to be submerged in the noises. Therefore, the fault impacts need to be enhanced and extracted from the reconstructed signal, which can be regarded as a deconvolution process [19] and can be achieved by minimum entropy deconvolution (MED) and maximum correlation kurtosis deconvolution (MCKD), etc. He proposed an adaptive MED based on autocorrelation energy ratio, which makes it possible that recover a single random pulse when the filter length is not improper [20]. However, MED can only extract a single impact from the signal. Zhang selected effective IMFs through the weighted kurtosis index and then extracted the periodic impacts based on MCKD [21]. Cui decomposed the signal by VMD, finally selecting the sensitive mode through kurtosis and extracting periodic shocks [22] by MCKD. Although MCKD can extract a series of impacts, it cannot extract the complete periodic impacts [23]. Li decomposed the signal through the Hankel matrix and obtained various forms of noises, then extracted the periodic impacts of the reconstructed signal through multipoint optimal minimum entropy deconvolution adjusted (MOMEDA) [24]. Zhou decomposed the bearing signal through VMD and selected effective IMFs through the average of kurtosis, then extracted the periodic impacts through MOMEDA [25]. Xiao optimized the filter length of MOMEDA, then enhanced the periodic impacts and extracted the bearing fault frequencies [26]. Many studies have shown that the method combining MOMEDA with a decomposition algorithm can not only extract the periodic impacts contained in the noisy signal but also suppress the noise to a certain extent. In addition to the above methods, some very classic and useful methods are also worthy of our reference. Bayram [27] calculated the energy of the noisy and noise-free signal and obtained the wavelet coefficients that were used in classifying, proposing a feature extraction method based on the wavelet coefficient. Kaya [28] proposed a new feature extraction method based on co-occurrence matrices for bearing vibration signals, and the correlation, energy, homogeneity and contrast features were extracted from the co-occurrence matrices. To solve the spectral segmentation defect of the empirical wavelet transform (EWT) and improve its ability to extract fault features, Liu [29] proposed a new algorithm based on maximum envelope fitting and proposed a sensitive IMFs assessing index to obtain the characteristics of the time–frequency domain and amplitude domain to extract fault information. KAYA [30] proposed a technique based on continuous wavelet transform (CWT) and two dimensional (2D) convolutional neural networks (CNN) to detect the fault size from vibration data of various bearing failure types. Kuncan [31] proposed a bearing fault diagnosis method combined with one-dimensional local binary pattern and gray relational analysis, and the fault identification accuracy was shown to reach 99.3%. Han [32] extracted five feature vectors through freeman chain codes, then online diagnosis was achieved through an improved brainstorm optimization (BSO) algorithm.
However, some new problems can be found in fault feature extraction. Although FEEMD improves the decomposition efficiency, the white noises added to FEEMD cannot be eliminated completely, which leads to mode mixing. Secondly, the effective IMFs selection methods based on a single index cannot easily retain the IMFs related to vibration and shock, and the effect of noise suppression is also poor. Thirdly, the iterative of MED and MCKD is complicated, and the resulting filter is not necessarily a global optimal filter [24], which makes it difficult to extract periodic impacts effectively.
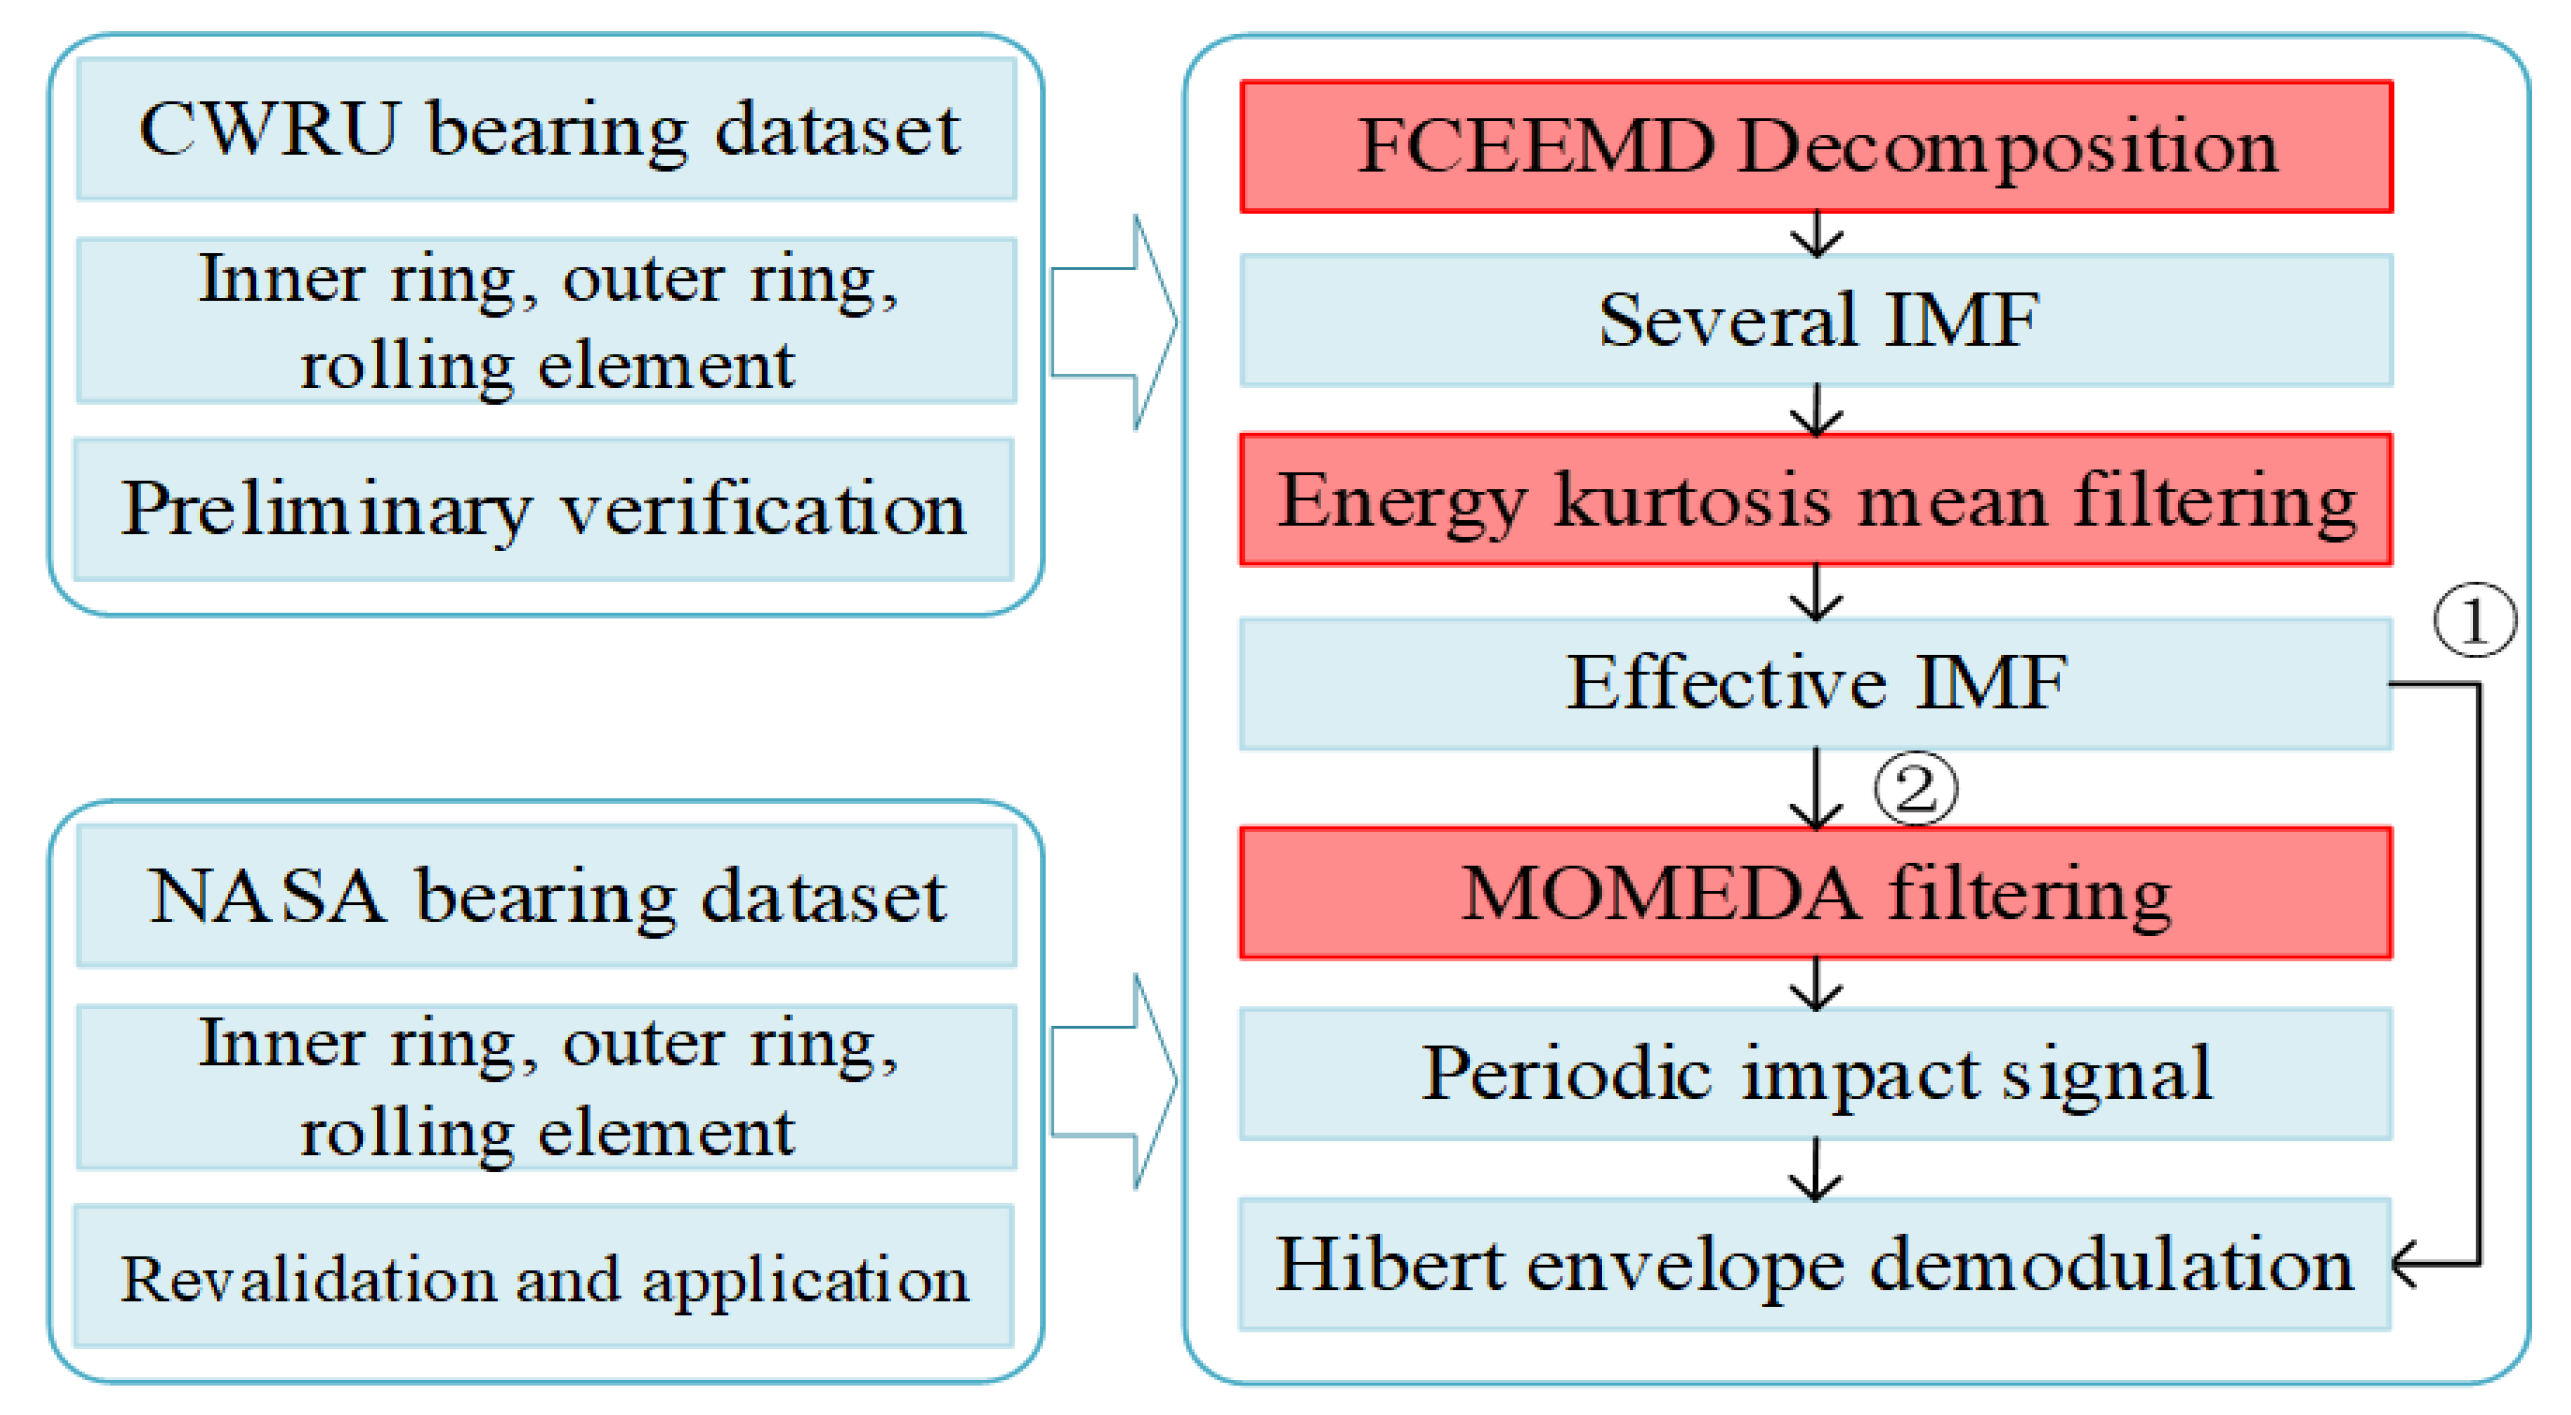
In view of the above problems, the contributions and innovations of the paper are as follows. To eliminate the mode mixing in FEEMD, pairs of white noises with opposite signs are added to the signal before each round of decomposition. To select the effective IMFs related to faults, the energy and kurtosis of each IMF are assigned a weight, respectively, and fused into an index, which is called the energy kurtosis weighted index. The average of all weighted indices is used as a threshold to select effective IMFs, called energy kurtosis mean filtering. The selected IMFs are reconstructed into a reconstructed signal. Finally, MOMEDA [23] is used to extract the periodic impacts in the reconstructed signal, and the fault frequencies can be extracted by Hilbert envelope demodulation. In summary, the proposed method can extract bearing fault features effectively, and it provides technical guidance for fault diagnosis.
The remainder of this paper is organized as follows. In Section 2, the methodology of the proposed feature extraction method is introduced in detail. In Section 3, the validity of the proposed method is verified through the Case Western Reserve University (CWRU) bearing datasets. In Section 4, the proposed method is applied to analyze the NASA bearing datasets, and the validity of the method is verified again. In Section 5, the superiority of the proposed method is validated by comparing various methods. The conclusions are summarized in Section 6.

2. The Proposed Feature Extraction Method

2.1. Fast Complementary Ensemble Empirical Mode Decomposition

FCEEMD is inspired by FEEMD [15] and CEEMD [9], which inherit the high efficiency of FEEMD and the low reconstruction error and weak mode mixing of CEEMD. If a set of signals is X t = [ x 1 ,   x 2 , ,   x n ] , the steps of FCEEMD are as follows.
(1)
Initializing the amplitude of the added white noises, the number of ensemble trials I and the current ensemble trial number i = 1
(2)
Pairs of white noises ± n i ( t ) , i = 1 , 2 , , n with opposite signs are added to the original signal x ( t ) to generate two noise-added signals, P i ( t ) and N i ( t ) .
P i ( t ) = x ( t ) + n i ( t ) N i ( t ) = x ( t ) n i ( t ) . ,
where x ( t ) represents the original signal and n i ( t ) represents white noises.
(3)
Decompose the noise-added signals P i ( t ) and N i ( t ) into a series of IMFs.
P i ( t ) = j = 1 q c j , i 1 ( t ) , N i ( t ) = j = 1 q c j , i 2 ( t ) . ,
where c j , i 1 ( t ) and c j , i 2 ( t ) represent the j-th IMF in the i-th trial, and q represents the number of IMFs.
(4)
If i < I , then repeat steps (2) and (3) with i = i + 1 , and add different white noises with opposite signs ± n i ( t ) , i = 1 , 2 , , n each time.
(5)
Calculate the ensemble means of the 2 I trials for each IMF as the results.
c j ( t ) = 1 2 I i = 1 I ( c j , i 1 + c j , i 2 ) . ,
where c j ( t ) is the j-th IMF obtained by FCEEMD. To compare the decomposition performance of the EEMD-based methods under the same parameter conditions, the parameters of all methods are set according to the EEMD parameter criteria ε n = ε / N [9], where N is the number of trials used to derive the ensemble IMFs, ε is the RMS amplitude of added noises and ε n is the final standard deviation of error. To minimize ε n , we refer to the parameter settings of CEEMD in references [11,33]. The amplitude of white noises is 0.2, and the number of ensemble trials is 50 × 2 [34]. In addition, the FCEEMD also has the following processing procedures.
(6)
Stopping criteria in EEMD and CEEMD is replaced with the rule of fixed screening times, which reduces the quantities of computation while guaranteeing the EMD’s second-order filter characteristics.
(7)
In the process of spline interpolation, the popular Thomas algorithm, a simplified form of Gaussian elimination and the most efficient way to solve tridiagonal linear equations, is used to solve the tridiagonal matrices [35], which optimizes the time complexity and space complexity.
(8)
In optimized programs, these files have file types of mexw32 or mexw64, which has the advantage of fast calculating speed.
FCEEMD has the same fundamentals as CEEMD, which can remove the residual white noises in FEEMD and EEMD by adding pairs of white noises ± n i ( t ) , i = 1 , 2 , , n . It improves the efficiency of FCEEMD by optimizing the calculation procedure and program coding of the CEEMD; it can be applied to real-time signal processing and have increasingly extensive application prospects.

2.2. The Proposed Energy Kurtosis Mean Filtering

Suppose { x 1 ( t ) , x 2 ( t ) , x N ( t ) } is N IMFs obtained by FCEEMD, the energy E i and kurtosis K i of the i-th IMF are as follows.
E i = j = 1 M | x i j ( t ) | 2 . ,
K i = 1 M i = 1 M x i j ( t ) μ σ 4 . ,
where x i j ( t ) ( i = 1 , 2 , , N ,   j = 1 , 2 , , M ) represents the j-th data point in the i-th IMF, N represents the total number of IMFs and M is the data length. μ and σ represent the mean and standard deviation of x i ( t ) , respectively. The energy E i and kurtosis K i of the i-th IMF can be calculated by the formulas above.
The energy can characterize the signal strength of different frequency bands. Kurtosis is independent of bearing speed, size and load, and it is sensitive to the impact signal. Different types of faults cause different changes in energy and kurtosis in different frequency bands. If only energy is used as the selection criterion for effective IMFs, a series of IMFs related faults may be ignored. If only kurtosis is used as the selection criterion for effective IMFs, the energy information of the signal may be lost. Therefore, the signal characteristics need to be considered comprehensively when selecting the IMFs. For the energy sequence { E 1 , E 2 , , E N } and the kurtosis sequence { K 1 , K 2 , , K N } obtained above, we introduced an effective weighting method to integrate them. The obtained index is called the energy kurtosis weighted index.
(1)
The regularized energy sequence E n i and kurtosis sequence K n i can be obtained by Formulas (6) and (7).
E n i = ( E i min E i ) i = 1 N / ( max E i i = 1 N min E i ) i = 1 N . ,
K n i = ( K i min K i ) i = 1 N / ( max K i i = 1 N min K i ) i = 1 N . ,
where N represents the total number of IMFs, and E i and K i are the energy and kurtosis of the i-th IMF, respectively.
(2)
The mean μ e and mean square error σ e of E n i are calculated by Formulas (8) and (9), and the mean μ k and mean square error σ k of K n i are calculated by Formulas (10) and (11).
μ e = 1 N i = 1 N E n i . ,
σ e = 1 N i = 1 N ( E n i u e ) 2 . ,
μ k = 1 N i = 1 N K n i .
σ k = 1 N i = 1 N ( K n i u k ) 2 . ,
where N represents the number of IMFs, and μ e , σ e , μ k and σ k can be obtained by the formulas.
(3)
The energy weight coefficient W e is calculated by Formula (12), and the kurtosis weight coefficient is W k = 1 W e . The energy kurtosis weighted index E K i and its mean λ E K can be calculated as follows.
W e = σ e σ e + σ k . ,
E K i = W e E n i + W k K n i . ,
λ E K = 1 N i = 1 N E K i . ,
where E n i and K n i are the regularized energy and kurtosis sequences of the i-th IMF, respectively, and N represents the number of IMFs.
The more obvious the fault impacts contained in the IMF, the greater the energy kurtosis weighted index. We calculated the mean of E K i and took it as a threshold. If the energy kurtosis weighted index of an IMF is smaller than the threshold, it is considered that the IMF does not contain a stable impact component and will be removed; otherwise, the IMF is selected as an effective IMF.
The reconstructed signal can be obtained by bit-by-bit accumulation of each effective IMF. Suppose x is the reconstructed signal, y is the impact component and h is the transfer function and e is the noise, then,
x = h y + e .
The fault impact y can be extracted from x , and the process can be regarded as a deconvolution process [19]. MOMEDA [23] is a deconvolution algorithm, and its purpose is to find the optimal FIR filter in a non-iterative way and reset y through x . Multi D-Norm is proposed to deconvolute multiple impulses at a determined location, and its maximum problem is as follows.
M u l t i D N o r m = M D N ( y , t ) = 1 | | t | | t T y | | y | | . ,
M O M E D A = max f M D N ( y , t ) = max f t T y | | y | | . ,
where t represents a constant vector, and it describes the position and weight of the target impact. y represents impact vector. The optimal filter can be obtained by solving the maximum of the D-norm.
To measure the position of the fault-related maximum pulse point accurately, Multipoint Kurtosis is introduced.
M K u r t = ( n = 1 N L t n 2 ) 2 n = 1 N L ( t n y n ) 4 / ( n = 1 N L t n 8 ( n = 1 N L y n 2 ) 2 ) .
To compare the results, the default parameters of MOMEDA are considered, the filter length is 500 (L = 500), and the period range is T = [ 10 : 0.1 : 300 ] . More information about MOMEDA can be found in ref. [23]. After obtaining the fault impacts, the Hilbert envelope demodulation can extract the fault features more easily and effectively.

2.3. The FCEEMD Energy Kurtosis Mean Filtering Based Fault Feature Extraction Method

Aiming at the defects of the existing methods, a FCEEMD energy kurtosis mean filtering-based fault feature extraction method is proposed, and the method is used to analyze the CWRU and NASA datasets, as shown in Figure 1.
(1)
To suppress mode mixing and improve the decomposition efficiency, the proposed FCEEMD is used to decompose bearing signals into several IMFs.
(2)
To select the effective IMFs related to the fault impact and reduce the reconstruction error, the energy kurtosis weighted index of each IMF is calculated. If the energy kurtosis weighted index of an IMF is greater than the mean of all indexes, it indicates that the IMF contains the main information of failure, so it is chosen as an effective IMF. All effective IMFs can be obtained this way, and their cumulative sum is used as the reconstructed signal.
(3)
To suppress the interference frequencies and extract the fault frequencies effectively, the periodic impacts in the reconstructed signal are extracted by MOMEDA, and the fault frequencies are extracted by Hilbert envelope demodulation.
Firstly, the inner ring, outer ring and rolling element signals of CWRU bearing are analyzed to verify the validity of the proposed method, as shown in Figure 1.
Secondly, to verify the universality and application ability of the proposed method, the method is used to extract the fault features of the inner ring, outer ring and rolling element signals in the NASA dataset, as shown in Figure 1.
Finally, to verify the superiority of the proposed method, the method is compared with a variety of feature extraction methods in the case of rolling element feature extraction, as shown in Figure 2.
(1)
To verify the superiority of the FCEEMD-based method, the rolling element signal is decomposed by EEMD, FEEMD and FCEEMD, and the decomposition results and feature extraction effects are compared and evaluated.
(2)
To verify the superiority of FCEEMD energy kurtosis mean filtering, the extraction results of this method are compared with those of the method in [36].
(3)
To verify the superiority of the MOMEDA-based method, the proposed method is compared with the MED and MCKD-based methods.

3. Experimental Verification Based on CWRU Bearing Data

To verify the validity of the proposed method, the CWRU dataset [36] is analyzed. The specification of the bearing is 6205-2RSJEMSKF, the motor speed is 1797 rpm, and the rotational frequency is 1797/60 Hz = 29.95 Hz. The parameters are shown in Table 1.
Sensors are installed on the drive motor, and the vibration signals under different damage diameters are collected. The sampling frequency is 12 kHz, and the experimental data length is 2048. The signals of the inner ring, outer ring and rolling element with a damage diameter of 0.007 inches are used for experimental analysis. According to the parameters and the formulas in refs. [37,38], the fault frequencies can be obtained as shown in Table 2. The experimental environment is Intel (R) Core (TM) i5-5200u CPU @ 2.20 GHz.

3.1. Inner Ring Fault Feature Extraction

The time and frequency domain waveforms of the inner ring fault signal are shown in Figure 3. Due to the influence of noises and interferences, it is difficult to extract fault frequency directly from the frequency domain waveform. Therefore, the inner ring signal is decomposed by FCEEMD, and the effective IMFs are selected by energy kurtosis mean filtering. In all subsequent experiments, all parameters of the FCEEMD algorithm are consistent, where the number of IMFs is 9, the number of screening iterations maxSift is 10 and the rest of the parameters are default values.
As shown in Figure 4a, the energy of the IMFs decreases gradually, the IMF1 contains most of the energy and the change in the kurtosis has no obvious regularity. According to the proposed method, the IMFs whose energy kurtosis weighted index is less than the threshold are regarded as noises and removed. Therefore, the effective IMFs include IMF1, IMF4 and IMF6, and the envelope demodulation of the effective IMFs reconstruction signal is shown in Figure 4b.
As shown in Figure 4b, the envelope spectrum shows an obvious peak at 164.1 Hz, and the peak frequency is close to the theoretical value of 162.1852 Hz of fault frequency of the inner ring. Meanwhile, the peak frequency 322.3 Hz is close to the double frequency 324.3704 Hz, and the peak frequency 58.59 Hz is close to the double frequency 59.9 Hz of the rotating frequency. Due to the influence of noises and interferences, the absolute error between the measured value and theoretical values of the inner ring fault frequency is 164.1 Hz − 162.1852 Hz = 1.9148 Hz, and the relative error is 0.0118. The results show that the method based on FCEEMD energy kurtosis mean filtering is effective. However, there are still many peaks at 263.7 Hz and other unrelated frequencies, and these peaks have an impact on the results. Therefore, we extract the periodic impacts from the effective IMFs reconstruction signal through MOMEDA, and the results are shown in Figure 5a,b. In MOMEDA, the filter size L is 500, the window function is a rectangular window (ones (1,1)) and the remaining parameters are default parameters used in all subsequent experiments.
As shown in Figure 5b, the MOMEDA extracts the periodic impacts in the effective IMFs reconstructed signal and weakens the frequencies unrelated to the fault impact. It is noteworthy that the peaks appear at 162.5 Hz, 324 Hz, 486.6 Hz and 648.7 Hz, etc. These peaks correspond to the inner ring fault frequency 162.1852 Hz and its double frequency 324.3704 Hz, triple frequency 486.5556 Hz, quadruple frequency 648.7408 Hz and so on. After adding MOMEDA, the absolute error between the measured value and theoretical value is 162.5 Hz − 162.1852 Hz = 0.3148 Hz, and the relative error is 0.0019, which greatly reduces the frequency error and improves the fault detection accuracy.

3.2. Outer Ring Fault Feature Extraction

The time and frequency domain waveforms of the outer ring fault signal are shown in Figure 6a. The fault frequency is submerged by the complex frequency components. Therefore, the outer ring signal is decomposed by FCEEMD, and the effective IMFs are selected by energy kurtosis mean filtering.
As shown in Figure 7a, the energy of the IMFs decreases gradually, and IMF1 contains most of the energy. The kurtosis of IMF6 is the largest, and the kurtosis of other IMF shows no regularity in variation. According to energy kurtosis mean filtering, the effective IMFs include IMF1 and IMF6, and the envelope demodulation of the reconstruction signal is shown in Figure 7b.
The outer ring fault can be accurately diagnosed by combining the FCEEMD with energy kurtosis mean filtering. It is noteworthy that the peaks appear at 105.5 Hz, 216.8 Hz, 322.3 Hz and 427.7 Hz, etc. These peaks correspond to the outer ring fault frequency 107.3648 Hz and its double frequency 214.7296 Hz, triple frequency 322.0944 Hz, quadruple frequency 429.4592 Hz and so on. The results show that the method based on FCEEMD energy kurtosis mean filtering is extremely effective. Due to the influence of the parameter error and transmission path, the absolute error between the measured value and theoretical value is 107.3648 Hz − 105.5 Hz = 1.8648 Hz, and the relative error is 0.0174. Therefore, we extract the periodic impacts from the reconstruction signal through MOMEDA. The results are shown in Figure 8a,b.
MOMEDA effectively extracts the periodic impacts in the effective IMFs reconstructed signal and weakens the frequencies unrelated to the fault impacts. The absolute error between the measured value and theoretical value is 107.3648 Hz − 106.2 Hz = 1.1648 Hz, and the relative error is 0.0108. Compared with the results before MOMEDA filtering, MOMEDA reduces the deviation between the measured value and the theoretical value of the fault frequency. The outer ring fault frequency harmonics are obvious, and the outer ring fault can be diagnosed accurately. The results show that the proposed method is quite lightweight and efficient, and the precision of fault recognition is therefore improved.

3.3. Rolling Element Fault Feature Extraction

The time and frequency domain waveforms of the rolling element signal are shown in Figure 9a. Compared with the inner ring and the outer ring signals, the periodic impacts of the rolling element signal are not obvious. Moreover, the fault frequency is submerged by complex frequency components, and it is difficult to extract fault frequency from the frequency domain waveform. Therefore, the rolling element signal is decomposed by FCEEMD, and the effective IMFs are selected by energy kurtosis mean filtering.
As shown in Figure 10a, the energy of the IMFs decreases gradually; the IMF1 contains most of the energy. The kurtosis of the IMF increases gradually; the kurtosis of IMF6 is the largest, and then the kurtosis decreases gradually. If only the effective IMFs are selected based on energy, a lot of impact information will be lost. The selection of effective IMFs based on a single index will lead to incomplete fault information. It also shows that it is necessary to select IMF by energy kurtosis mean filtering. The effective IMFs include IMF1, IMF4, IMF5, IMF6, IMF7 and IMF8. The envelope demodulation of the reconstruction signal is shown in Figure 10b.
As shown in Figure 10b, the envelope spectrum shows a peak at 140.6 Hz, which is close to the rolling element fault frequency of 141.1693 Hz. However, there is a large deviation between the peak frequency 263.7 Hz and the double frequency 282.3386, and many irrelevant frequencies appear in the envelope spectrum. The non-stationary components contained in the rolling element signal are numerous and complex. These irrelevant components make it extremely difficult to extract fault features. We extracted the periodic impacts from effective IMFs reconstruction signal through MOMEDA, and the results are shown in Figure 11a,b.
In Figure 11b, although the impact characteristics of the rolling element signal are not obvious, MOMEDA can still extract the periodic impacts in the reconstructed signal effectively and weaken the frequencies unrelated to the faults. It is noteworthy that the peaks appear at 140.6 Hz, 281.3 Hz and 421.9 Hz, etc. These peaks correspond to the rolling element fault frequency 141.1693 Hz and its double frequency 282.3386 Hz, triple frequency 423.5079 Hz and so on. Due to the influence of noises and interferences, there are some deviations between the measured value and the theoretical value.

4. Method Verification and Application

To verify the reliability of the proposed method, the NASA bearing dataset is analyzed. The experimental platform [39] is shown in Figure 12a, and four Rexnord ZA-2115 bearings are mounted on the same spindle. The rotational speed of the spindle is 2000 rpm in the motor drive, and the rotating frequency (Fs) of the bearing is 33.33 Hz (fr = 2000/60 = 33.33 Hz). The PCB353B33 sensors are installed on the bearing housing, and the signal is collected by the DAQ-6062E acquisition card. The sampling frequency is 20 kHz, and the length of each set of data is 20480. The inner ring signal from the Bearing 3 of the No.1 dataset, the outer ring signal from the Bearing 1 of the No.2 dataset, the rolling element signal from Bearing 3 of the NO.1 dataset and the data length is 2048.
According to the formulas of fault frequency in ref. [38] and the parameters in Table 3, the fault frequencies of NASA bearing are shown in Table 4. The important frequencies mainly include the ball pass frequency of the inner race (BPFI), the ball pass frequency of the outer race (BPFO), the ball spin frequency (BSF) and rotating frequency (Fs).

4.1. Inner Ring Fault Feature Extraction Application

The time and frequency domain waveforms of the inner ring signal are shown in Figure 13a. The signal contains some impact components. However, the period of these impact signals is not significant compared with the inner ring signal of the CWRU dataset. The fault frequency of the inner ring is submerged by a series of complex frequencies, which makes it particularly difficult to extract the fault feature. Therefore, the signal is decomposed by FCEEMD, and the effective IMFs are selected by energy kurtosis mean filtering.
As shown in Figure 14a, the energy of the IMFs decreases gradually, and IMF1 contains most of the energy. The kurtosis of the IMF3 is the largest, and the kurtosis of other IMFs shows no regularity in variation. The IMFs whose energy kurtosis weighted index is less than the threshold are regarded as false components and removed. Therefore, the effective IMFs include IMF1, IMF2 and IMF3, and the envelope demodulation of the effective IMF reconstruction signal is shown in Figure 14b.
As shown in Figure 14b, the envelope spectrum shows an obvious peak at 293 Hz, which is close to the fault frequency of 296.9035 Hz. Meanwhile, the rotating frequency Fs = 33.33 Hz and its frequency multiplication appear in the low-frequency part. The modulation frequencies of inner ring fault frequency (BSFI) and rotating frequency (Fs) also appear in the envelope spectrum. Because of the influence of noises, there is some deviation between the theoretical and the measured value. The experimental results show the effectiveness of the method based on FCEEMD energy kurtosis mean filtering. However, the envelope spectrum still contains frequencies unrelated to the faults. These frequencies interfere with the identification of the fault frequency. We extract the periodic impacts from the reconstructed signal through MOMEDA.
As shown in Figure 15b, MOMEDA effectively extracts the periodic impacts in the reconstructed signal and weakens the frequencies unrelated to the faults. It is noteworthy that peaks appear at 293 Hz, 585.9 Hz, 878.9 Hz and 1172 Hz, etc. These peaks correspond to the inner ring fault frequency 296.91 Hz and its double frequency 593.82 Hz, triple frequency 890.73 Hz, quadrupled frequency 1187.64 Hz and so on. Because of the influence of noises, there is some deviation between the theoretical value and the measured value. The inner ring fault can be identified accurately according to the characteristic frequency.

4.2. Outer Ring Fault Feature Extraction Application

The time and frequency domain waveforms of the outer ring signal are shown in Figure 16a. There are many interference frequencies in the frequency domain diagram, and the fault frequency is not obvious. Therefore, the outer ring signal is decomposed by FCEEMD, and the effective IMFs are selected by energy kurtosis mean filtering.
As shown in Figure 17a, the changing trend of the energy and kurtosis of the IMFs is irregular. According to the proposed method, the effective IMFs include IMF4 and IMF5, and the envelope demodulation of the effective IMFs reconstruction signal is shown in Figure 17b. Two obvious spectrum peaks appear at 61.59 Hz and 459 Hz. The two peaks correspond to the double frequency of the rotating frequency (2Fs = 66.66 Hz) and the double frequency of the outer ring fault frequency (472.8 Hz). The envelope spectrum shows three obvious peaks in the low-frequency part, and the three peaks correspond to the rotating frequency 33.33 Hz and its double frequency 66.66 Hz, with frequency quintupling at 166.65 Hz. Moreover, a peak appears at 224.6 Hz, which is close to the fault frequency of 236.4 Hz of the outer ring. The modulation frequencies of the outer ring fault frequency (BSFO) and rotating frequency (Fs) also appear in the envelope spectrum. Because of the influence of noises, the absolute error between the measured value and theoretical value is 236.4 Hz − 224.6 Hz = 11.8 Hz, and the relative error is 0.0499. Although the envelope spectrum contains clear fault frequencies, there are still many interference frequencies, and the fault features are not easy to be extracted. We extract the periodic impacts from the reconstructed signal through MOMEDA. The results are shown in Figure 18a,b.
MOMEDA effectively extracts the periodic impacts in the reconstructed signal and weakens the frequency components unrelated to faults. It is noteworthy that peaks appear at 234.4 Hz, 474.6 Hz, 709 Hz and 943.4 Hz, etc. These peaks correspond to the outer ring fault frequency 236.4 Hz and its double frequency 472.8 Hz, triple frequency 709.2 Hz, quadrupled frequency 945.6 Hz and so on. After adding MOMEDA, the absolute error between the measured value and theoretical value is 236.4 Hz − 234.4 Hz = 2 Hz, and the relative error is 0.0085, which greatly reduces the frequency error and improves the fault detection accuracy.

4.3. Rolling Element Fault Feature Extraction Application

The time and frequency domain waveforms of the rolling element fault signal are shown in Figure 19a. Compared with the vibration signals of the inner ring and the outer ring, the periodic impacts of the rolling element signal are not obvious. Moreover, the fault frequency is almost submerged by complex frequencies, and it is difficult to extract fault frequency from the frequency domain. Therefore, the rolling element signal is decomposed by FCEEMD, and the effective IMFs are selected by energy kurtosis mean filtering. The results are shown in Figure 19b and Figure 20a.
The changes in the energy and kurtosis of the IMFs are not regulated, and the energy and kurtosis of the IMFs in the high-frequency band and the low-frequency band are relatively large. According to the energy kurtosis mean filtering, the effective IMFs include IMF1, IMF7, IMF8 and IMF9, and the envelope demodulation of the effective IMFs reconstruction signal is shown in Figure 20b.
Two obvious spectrum peaks appear at 136.7 Hz and 273.4 Hz, which correspond to the rolling element fault frequency 139.9 Hz and its double frequency 279.8 Hz. Due to the influence of noises, the absolute error between the measured value and theoretical value is 139.9 Hz − 136.7 Hz = 3.2 Hz, and the relative error is 0.0229. Furthermore, there are several peaks in the low-frequency part of the envelope spectrum, which correspond to the rotating frequency (Fs = 33.33 Hz) and its frequency multiplication. However, there are not only the modulation signals of fault frequency and rotating frequency in the envelope spectrum but also many interference frequencies, which can cause difficulty in extracting the fault feature. Therefore, we extracted the periodic impacts from the reconstructed signal through MOMEDA. The results are shown in Figure 21a,b.
Although the impacts of the rolling element vibration signal are not obvious, MOMEDA can still effectively extract the periodic impacts in the reconstructed signal and weaken the frequencies unrelated to the faults. It is noteworthy that the peaks appear at 140.6 Hz, 281.3 Hz, 421.9 Hz and 562.5 Hz, etc. These peaks correspond to the rolling element fault frequency 139.9 Hz and its double frequency 279.8 Hz, triple frequency 419.7 Hz, quadrupled frequency 559.6 Hz and so on. After adding MOMEDA, the absolute error between the measured value and theoretical value is 140.6 Hz − 139.9 Hz = 0.7 Hz, and the relative error is 0.005, which greatly reduces the frequency error. This means the rolling element fault can be diagnosed accurately.

5. Comparison Analysis of Different Feature Extraction Methods

By analyzing and summarizing the results above, we can draw a preliminary conclusion that the fault feature extraction of the rolling element is more difficult compared with the inner ring and outer ring. According to the theory of ref. [40], the frequency spectrum contains the second harmonic of the spin frequency when the rolling element fails. The spin frequency of the rolling element is generated by impacting the inner ring or the outer ring through the rolling element. In general, the rolling element rotates once and produces two impacts. Therefore, the fault frequency of the rolling element is easily submerged by interference frequencies. Most existing methods can achieve better results in feature extraction of the inner ring and outer ring, but they have a poor effect on the feature extraction of the rolling element. These facts prove that the feature extraction of the rolling element is difficult, but the proposed method can achieve good results in the feature extraction of the rolling element.
To verify the superiority of the proposed method, a variety of methods were compared through the rolling element data of the CWRU dataset. In the comparative experiments, the data length was 2048.

5.1. Comparative Analysis of Feature Extraction Methods Based on Different Decomposition Methods

To verify the effectiveness of the MOMEDA demodulation method based on the decomposition method, we compared the method without signal decomposition with the methods based on several signal decomposition strategies. As shown in “MOMEDA” in Figure 22, the envelope spectrum obtained by MOMEDA without signal decomposition contained a large amount of noise. The rolling element envelope spectrum obtained alone by DOMEDA contained many burrs and was coarse, so signal decomposition and noise reduction were indispensable and important processing links. Therefore, we decomposed the rolling element signals by EEMD, FEEMD and FCEEMD. In EEMD, the ratio of the standard deviation of the added noise and original signal (Nstd) was 0.2, and the ensemble member was 10. In FEEMD and FCEEMD, Nstd was 0.2, the number of IMF was 9, the number of screening iterations maxSift was 10 and the rest of the parameters were default values. For the IMFs obtained by each decomposition algorithm, the reconstruction error, root mean square error (RMSE), time-consuming (Time) and standard deviation (SD) are shown in Figure 22a and Table 5. The reconstruction error refers to the deviation between the original signal and the reconstructed signal of all IMFs.
As shown in Figure 22a, both the reconstruction errors of the EEMD and FEEMD are large, while the reconstruction error (10−16) of the FCEEMD can be neglected. The results show that the FCEEMD can decompose the signal into several IMFs completely, there is no energy leakage and RMSE also demonstrates this advantage of FCEEMD. In terms of being time-consuming, the decomposition efficiency of FEEMD and FCEEMD was high compared with EEMD, so they were suitable for real-time data processing. From the standard deviation of the reconstructed signal, the decomposed signals were stable and reliable. Therefore, FCEEMD had the characteristics of rapidity and high accuracy.
Similarly, we selected the effective IMFs by energy kurtosis mean filtering and extracted the periodic impacts in the effective IMFs reconstructed signal through the MOMEDA. The envelope demodulations of the periodic impacts are shown in Figure 22b. All three methods obtained the fault frequencies of the rolling element and its harmonics. It is noteworthy that the amplitude of the envelope obtained by the EEMD method was small, and the spectrum peaks of the high-frequency band were hardly recognized. The spectrum peaks obtained by FEEMD and FCEEMD were relatively obvious, and the spectrum peaks of the high-frequency band were easily identified. In addition, the envelope spectrum obtained by FCEEMD was cleaner than that obtained by FEEMD, and the interference frequencies were less. Therefore, the feature extraction method based on FCEEMD was more efficient than others.

5.2. Comparative Analysis of Feature Extraction Methods Based on Different Effective IMFs Selection Methods

In the second experiment, the proposed method was compared with the method in ref. [36]. Firstly, the rolling element signal was decomposed by EEMD, and then the IMFs that had a large correlation with the original signal were selected as effective IMFs, including IMF1, IMF2, IMF3, IMF4, IMF5 and IMF6. The results are shown in Figure 23a and Table 6.
Then, the impacts contained in the reconstruction signal of IMF1~IMF6 were extracted by MOMEDA. The envelope spectrum of the impacts was compared with that obtained by the proposed method, as shown in Figure 23b.
Compared with the proposed method, the results of the method based on EEMD, and correlation coefficient were not good, the envelope spectrum was affected by many interference frequencies and the characteristic frequencies of high-frequency bands were almost submerged by irrelevant components. The effective IMFs were selected by the correlation coefficient in the method, and those IMFs which had a strong correlation with the original signal were included in the reconstructed signal. Therefore, interference noises and fault signals may be included in the reconstructed signal. In addition, EEMD is time-consuming, and the selection of the correlation threshold is based on experience, which leads to a lack of adaptability. By introducing the energy kurtosis weighted index, the proposed method considered the signal strength and fault impact characteristics of the IMF synthetically. Meanwhile, the mean of the energy kurtosis weighted indices of all IMFs was used as the threshold. The determination of the threshold was adaptive, and the results show that energy kurtosis mean filtering was more effective than the correlation coefficient method.

5.3. Comparative Analysis of Feature Extraction Methods Based on Different Deconvolution Methods

In the third experiment, the influence of different deconvolution methods on the results was studied. Firstly, the rolling element signal was decomposed by FCEEMD. Then, the effective IMFs were selected by energy kurtosis mean filtering. Finally, the impacts contained in the reconstructed signals were extracted by MED, MCKD and MOMEDA, respectively. The filter length and iteration number of MED and MCKD were 500 and 30, respectively, and the period of the MCKD was Tb = fs/fb = 12,000/141.1693 = 85.004 [21]; the number of iterations was 30. The time domain diagram and envelope spectrum of the impact signals obtained by the three methods are shown in Figure 24a,b.
The impact signal extracted by MED contained only one impact, which led to the loss of the periodic impacts. Therefore, the fault frequency of the rolling element was submerged in the interference frequencies, and the fault could not be identified. The impact signal extracted by MCKD contained a series of impacts, but these impacts did not have continuous periodicity. Moreover, the envelope spectrum obtained by MCKD contained a lot of interference frequencies, which affected the results. The impact signal extracted by MOMEDA was one of the periodic impacts, and the envelope spectrum contained many clear spectrum peaks. Therefore, MOMEDA can extract the periodic impacts of the reconstructed signal more effectively compared with MED and MCKD. Through the analysis above, the superiority of the proposed method was verified.

5.4. Noise Robustness Analysis of Feature Extraction Method

In the fourth experiment, we analyzed the feature extraction performance of the method under different noise levels. First, four levels of Gaussian white noise with signal-to-noise ratio (SNR) of 10 dB, 15 dB, 20 dB, and 25 dB were added to the rolling element vibration signal, respectively, and four rolling element signals with different degrees of noise pollution were obtained. The time-domain and frequency-domain waveforms of four rolling element signals with different noise levels are shown in Figure 25. Many irregular points and burrs were added to both the time and frequency domain waveforms, and the difficulty of extracting fault feature frequencies was also increased.
In order to verify the noise robustness of the proposed method, we analyzed the rolling element vibration signal under different levels of noise by the proposed method. The feature extraction results are shown in Figure 26. Overall, the envelope curves obtained by feature extraction at four different noise levels were very clear, with very few noise points and burrs. In addition, the rolling element faults characteristic frequencies, and their high multipliers were very obvious under four different noise levels, and the types of rolling element faults were accurately identified. Therefore, under different noise levels, the proposed fault feature extraction method can effectively extract the rolling element fault feature frequency. Our experimental results show that the proposed feature extraction method has good noise robustness.

5.5. Comparison of the Obtained Results with Literature

Similar to the fault feature extraction results listed in reference [41], it is particularly important to compare the results obtained from different literature. Table 7 shows the studies on bearing fault feature extraction. Very few metrics can be used to evaluate the quality of the envelope demodulation effect, so we qualitatively classified the envelope demodulation effect into “very obvious”, “obvious” and “general” according to the envelope waveform. In all the literature, the method we proposed achieved good results, and the envelope demodulation result was defined as “very obvious”. As can be seen from Table 7, the proposed method was more successful than methods in other pieces of literature.

6. Conclusions

Bearings are easily damaged in harsh industrial environments, so the study of bearing fault feature extraction methods is particularly important. To solve the problems of low efficiency and residual noise in EEMD and FEEMD and extract the fault frequencies on the basis of obtaining effective IMFs, a fast, complementary ensemble empirical mode decomposition (FCEEMD) energy kurtosis mean filtering-based fault feature extraction method was proposed. By analyzing the CWRU and NASA bearing datasets, the validity and superiority of the proposed method were proved, and the following conclusions can be drawn.
(1)
In most signal noise reduction processes, EMD, EEMD and VMD are the most commonly used decomposition methods, which are not only too slow in the decomposition process but also make it difficult to select parameters. Compared with EEMD and FEEMD, the proposed FCEEMD had the smallest reconstruction error, the lowest time consumption and the most stable intrinsic mode functions (IMF), which indicates that the introduced pairs of white noise with opposite signs can completely neutralize the residual white noise in FEEMD and suppress the mode aliasing between IMF.
(2)
Among most of the existing IMF selection methods, the correlation coefficient or kurtosis is the most commonly used method. Compared with the IMF selection methods based on a single index such as correlation coefficient, energy or kurtosis, the reconstructed signal obtained by the proposed method contained more fault-related shock signals and less noise, which shows that the proposed energy kurtosis mean filtering can comprehensively consider the fault impact and signal strength.
(3)
In most of the deconvolution methods based on minimum entropy deconvolution (MED) and maximum correlation kurtosis deconvolution (MCKD), the decomposition module and the effective IMF selection module are not added to the method. Although these methods have achieved good results in the feature extraction of the inner and outer rings, the rolling element fault feature extraction effect is not very good. Compared with the feature extraction methods based on MED and MCKD, the proposed MOMEDA-based method can obtain periodic impact signals of rolling elements, and the fault feature frequency is more obvious and precise, which shows that the combined method based on MOMEDA can extract complex fault frequency characteristics more effectively.
The proposed method has good efficiency and reliability, and it is expected to be applied to the feature extraction of rotating machinery in actual production. It is worth noting that the proposed method has a relatively long process, which is not conducive to improving the real-time reliability of fault detection. In future production, the simplification of the process and the improvement of reliability will be new research points.

Author Contributions

Conceptualization, C.Z. and L.X.; methodology, C.Z.; software, L.X.; validation, Y.J., S.W. and Z.Z.; formal analysis, C.Z.; investigation, C.Z.; resources, L.X.; data curation, C.Z.; writing—original draft preparation, Y.J.; writing—review and editing, C.Z.; visualization, C.Z.; supervision, Y.J. and S.W.; project administration, L.X.; funding acquisition, L.X. All authors have read and agreed to the published version of the manuscript.

Funding

This work is supported by the National Natural Science Foundation of China (No. 51765022 and No. 41971392), the Ph.D. research startup foundation of Yunnan Normal University (No. 01000205020503131), the Fundamental Research Program of Yunnan Province (No. 202201AU070055) and the Project of Educational Commission of Yunnan Province of China.

Institutional Review Board Statement

Not applicable.

Informed Consent Statement

Informed consent was obtained from all subjects involved in the study.

Data Availability Statement

The data used to support the findings of this study are available from the corresponding author upon request.

Acknowledgments

The authors sincerely thank the team for their guidance and thank the Case West Reserve University and the University of Cincinnati for their bearing datasets. The authors also sincerely thank the reviewers for their comments and suggestions, which contributed to the improvement of the paper.

Conflicts of Interest

The authors declare no conflict of interest.

References

  1. Cheng, J.; Yang, Y.; Li, X.; Cheng, J. Adaptive periodic mode decomposition and its application in rolling bearing fault diagnosis. Mech. Syst. Signal Process. 2021, 161, 107943. [Google Scholar] [CrossRef]
  2. Chen, Z.; Guo, L.; Gao, H.; Yu, Y.; Wu, W.; You, Z.; Dong, X. A fault pulse extraction and feature enhancement method for bearing fault diagnosis. Measurement 2021, 182, 109718. [Google Scholar] [CrossRef]
  3. Ge, B.; Wang, Z.-C.; Ding, Y.-J.; Mo, Y. Hilbert square demodulation and error mitigation of the measured nonlinear structural dynamic response. Mech. Syst. Signal Process. 2021, 160, 107935. [Google Scholar] [CrossRef]
  4. Liu, Z.; Peng, D.; Zuo, M.J.; Xia, J.; Qin, Y. Improved Hilbert–Huang transform with soft sifting stopping criterion and its application to fault diagnosis of wheelset bearings. ISA Trans. 2021, 125, 426–444. [Google Scholar] [CrossRef]
  5. Laval, X.; Mailhes, C.; Martin, N.; Bellemain, P.; Pachaud, C. Amplitude and phase interaction in Hilbert demodulation of vibration signals: Natural gear wear modeling and time tracking for condition monitoring. Mech. Syst. Signal Process. 2021, 150, 107321. [Google Scholar] [CrossRef]
  6. Huang, N.; Shen, Z.; Long, S.; Wu, M.L.C.; Shih, H.; Zheng, Q.; Yen, N.-C.; Tung, C.-C.; Liu, H. The empirical mode decomposition and the Hilbert spectrum for nonlinear and non-stationary time series analysis. Proc. R. Soc. Lond. Ser. A Math. Phys. Eng. Sci. 1998, 454, 903–995. [Google Scholar] [CrossRef]
  7. Dominique, K.; Zosso, D. Variational Mode Decomposition. IEEE Trans. Signal Processing A Publ. IEEE Signal Processing Soc. 2014, 62, 531–544. [Google Scholar]
  8. Wu, Z.; Huang, N. Ensemble empirical mode decomposition: A noise-assisted data analysis method. Adv. Adapt. Data Anal. 2009, 1, 1–41. [Google Scholar] [CrossRef]
  9. Yeh, J.R.; Shieh, J.S.; Huang, N.E. Complementary ensemble empirical mode decomposition: A novel noise enhanced data analysis method. Adv. Adapt. Data Anal. 2010, 2, 135–156. [Google Scholar] [CrossRef]
  10. Gao, K.; Xu, X.; Li, J.; Jiao, S.; Shi, N. Weak fault feature extraction for polycrystalline diamond compact bit based on ensemble empirical mode decomposition and adaptive stochastic resonance. Measurement 2021, 178, 109304. [Google Scholar] [CrossRef]
  11. Gu, J.; Peng, Y. An improved complementary ensemble empirical mode decomposition method and its application in rolling bearing fault diagnosis. Digit. Signal Process. 2021, 113, 103050. [Google Scholar] [CrossRef]
  12. Li, Y.-X.; Wang, L. A novel noise reduction technique for underwater acoustic signals based on complete ensemble empirical mode decomposition with adaptive noise, minimum mean square variance criterion and least mean square adaptive filter. Def. Technol. 2020, 16, 543–554. [Google Scholar] [CrossRef]
  13. Li, Y.; Wang, L.; Li, X.; Yang, X. A novel linear spectrum frequency feature extraction technique for warship radio noise based on complete ensemble empirical mode decomposition with adaptive noise, duffing chaotic oscillator, and weighted-permutation entropy. Entropy 2019, 21, 507. [Google Scholar] [CrossRef] [PubMed]
  14. Zhang, J.; Feng, F.; Marti-Puig, P.; Caiafa, C.F.; Sun, Z.; Duan, F.; Solé-Casals, J. Serial-EMD: Fast empirical mode decomposition method for multi-dimensional signals based on serialization. Inf. Sci. 2021, 581, 215–232. [Google Scholar] [CrossRef]
  15. Wang, Y.-H.; Yeh, C.-H.; Young, H.-W.V.; Hu, K.; Lo, M.-T. On the computational complexity of the empirical mode decomposition algorithm. Phys. A Stat. Mech. Its Appl. 2014, 400, 159–167. [Google Scholar] [CrossRef]
  16. Chegini, S.N.; Manjili, M.J.H.; Bagheri, A. New fault diagnosis approaches for detecting the bearing slight degradation. Meccanica 2020, 55, 261–286. [Google Scholar] [CrossRef]
  17. Sun, N.; Zhou, J.; Liu, G.; He, Z. A hybrid wind speed forecasting model based on a decomposition method and an improved regularized extreme learning machine. Energy Procedia 2019, 158, 217–222. [Google Scholar] [CrossRef]
  18. Xia, J.; Zhao, L.; Bai, Y.; Yu, M.; Wang, Z. Feature extraction for rolling element bearing weak fault based on MCKD and VMD. J. Vib. Shock. 2017, 36, 78–83. [Google Scholar]
  19. Duan, R.; Liao, Y.; Yang, L.; Xue, J.; Tang, M. Minimum entropy morphological deconvolution and its application in bearing fault diagnosis. Measurement 2021, 182, 109649. [Google Scholar] [CrossRef]
  20. He, Z.; Chen, G.; Hao, T.; Liu, X.; Teng, C. An optimal filter length selection method for MED based on autocorrelation energy and genetic algorithms. ISA Trans. 2021, 109, 269–287. [Google Scholar] [CrossRef]
  21. Zhang, Y.; Lv, Y.; Ge, M. Time–frequency analysis via complementary ensemble adaptive local iterative filtering and enhanced maximum correlation kurtosis deconvolution for wind turbine fault diagnosis. Energy Rep. 2021, 7, 2418–2435. [Google Scholar] [CrossRef]
  22. Cui, H.; Guan, Y.; Chen, H. Rolling element fault diagnosis based on VMD and sensitivity MCKD. IEEE Access 2021, 9, 120297–120308. [Google Scholar] [CrossRef]
  23. McDonald, G.L.; Zhao, Q. Multipoint optimal minimum entropy deconvolution and convolution fix: Application to vibration fault detection. Mech. Syst. Signal Process. 2017, 82, 461–477. [Google Scholar] [CrossRef]
  24. Li, Y.; Cheng, G.; Liu, C. Research on bearing fault diagnosis based on spectrum characteristics under strong noise interference. Measurement 2021, 169, 108509. [Google Scholar] [CrossRef]
  25. Zhou, X.; Li, Y.; Jiang, L.; Zhou, L. Fault feature extraction for rolling bearings based on parameter-adaptive variational mode decomposition and multi-point optimal minimum entropy deconvolution. Measurement 2021, 173, 108469. [Google Scholar] [CrossRef]
  26. Xiao, C.; Tang, H.; Ren, Y.; Xiang, J.; Kumar, A. Adaptive MOMEDA based on improved advance-retreat algorithm for fault features extraction of axial piston pump. ISA Trans. 2022, 128, 503–520. [Google Scholar] [CrossRef] [PubMed]
  27. Bayram, S.; Kaplan, K.; Kuncan, M.; Ertunc, H.M. The effect of bearings faults to coefficients obtaned by using wavelet transform. In Proceedings of the 2014 22nd Signal Processing & Communications Applications Conference, Trabzon, Turkey, 23–25 April 2014. [Google Scholar]
  28. Kaya, Y.; Kuncan, M.; Kaplan, K.; Minaz, M.R.; Ertunç, H. A new feature extraction approach based on one dimensional gray level co-occurrence matrices for bearing fault classification. J. Exp. Theor. Artif. Intell. 2021, 33, 1735530. [Google Scholar] [CrossRef]
  29. Liu, Q.; Yang, J.; Zhang, K. An improved empirical wavelet transform and sensitive components selecting method for bearing fault. Measurement 2022, 187, 110348. [Google Scholar] [CrossRef]
  30. Kaya, Y.; Kuncan, F.; ErtunÇ, H.M. A new automatic bearing fault size diagnosis using time-frequency images of CWT and deep transfer learning methods. Turk. J. Electr. Eng. Comput. Sci. 2022, 30, 1851–1867. [Google Scholar] [CrossRef]
  31. Kuncan, M. An Intelligent Approach for Bearing Fault Diagnosis: Combination of 1D-LBP and GRA. IEEE Access 2020, 8, 137517–137529. [Google Scholar] [CrossRef]
  32. Han, Y.; Li, K.; Ge, F.; Wang, Y.A.; Xu, W. Online fault diagnosis for sucker rod pumping well by optimized density peak clustering. ISA Trans. 2022, 120, 222–234. [Google Scholar] [CrossRef] [PubMed]
  33. Zheng, J.; Tong, J.; Ni, Q.; Pan, H. Partial ensemble approach to resolve the mode mixing of extreme-point weighted mode decomposition. Digit. Signal Process. 2019, 89, 70–81. [Google Scholar] [CrossRef]
  34. Lin, B.; Zhang, C. A novel hybrid machine learning model for short-term wind speed prediction in inner Mongolia, China. Renew. Energy 2021, 179, 1565–1577. [Google Scholar] [CrossRef]
  35. Xue, X.; Zhou, J. A hybrid fault diagnosis approach based on mixed-domain state features for rotating machinery. ISA Trans. 2017, 66, 284–295. [Google Scholar] [CrossRef]
  36. Wang, Z.; Wang, J.; Zhang, J.; Zhao, Z.; Kou, Y. Fault diagnosis of gearbox based on improved MOMEDA. J. Vib. Meas. Diagn. 2018, 38, 176–181. [Google Scholar]
  37. Guo, Y.; Zhao, X.; Shangguan, W.-B.; Li, W.; Lü, H.; Zhang, C. Fault characteristic frequency analysis of elliptically shaped bearing. Measurement 2020, 155, 107544. [Google Scholar] [CrossRef]
  38. Li, Z.; Ma, J.; Wang, X.; Li, X. An Optimal Parameter Selection Method for MOMEDA Based on EHNR and Its Spectral Entropy. Sensors 2021, 21, 533. [Google Scholar] [CrossRef]
  39. Yang, C.; Ma, J.; Wang, X.; Li, X.; Li, Z.; Luo, T. A novel based-performance degradation indicator RUL prediction model and its application in rolling bearing. ISA Trans. 2021, 121, 349–364. [Google Scholar] [CrossRef]
  40. Kulkarni, V.V.; Khadersab, A. Spectrum analysis of rolling element bearing faults. Mater. Today Proc. 2021, 46, 4679–4684. [Google Scholar] [CrossRef]
  41. Kaplan, K.; Kaya, Y.; Kuncan, M.; Mïnaz, M.R.; Ertunç, H.M. An improved feature extraction method using texture analysis with LBP for bearing fault diagnosis. Appl. Soft. Comput. 2020, 87, 106019. [Google Scholar] [CrossRef]
  42. Yin, C.; Wang, Y.; Ma, G.; Wang, Y.; Sun, Y.; He, Y. Weak fault feature extraction of rolling bearings based on improved ensemble noise-reconstructed EMD and adaptive threshold denoising. Mech. Syst. Signal Process. 2022, 171, 108834. [Google Scholar] [CrossRef]
  43. Li, H.; Liu, T.; Wu, X.; Li, S. Research on test bench bearing fault diagnosis of improved EEMD based on improved adaptive resonance technology. Measurement 2021, 185, 109986. [Google Scholar] [CrossRef]
  44. Han, T.; Liu, Q.; Zhang, L.; Tan, A.C.C. Fault feature extraction of low speed roller bearing based on Teager energy operator and CEEMD. Measurement 2019, 138, 400–408. [Google Scholar] [CrossRef]
  45. Wang, C.; Li, H.; Ou, J.; Hu, R.; Hu, S.; Liu, A. Identification of planetary gearbox weak compound fault based on parallel dual-parameter optimized resonance sparse decomposition and improved MOMEDA. Measurement 2020, 165, 108079. [Google Scholar] [CrossRef]
Figure 1. The experimental verification of the proposed method.
Coatings 12 01337 g001
Figure 2. Comparison of feature extraction methods.
Coatings 12 01337 g002
Figure 3. CWRU inner ring fault signal and its decomposition results. (a) Time and frequency domain analysis of inner ring signal. (b) FCEEMD decomposition result of inner ring fault signal.
Coatings 12 01337 g003
Figure 4. The result of energy kurtosis means filtering. (a) Energy kurtosis weighted index of the CWRU inner ring IMFs. (b) Envelope demodulation of CWRU inner ring reconstruction signal.
Coatings 12 01337 g004
Figure 5. MOMEDA filtered output of CWRU inner ring signal and its envelope demodulation. (a) Time and frequency domain analysis of MOMEDA filtered output for inner ring signal. (b) Envelope demodulation of MOMEDA filtered output for inner ring signal.
Coatings 12 01337 g005
Figure 6. CWRU outer ring fault signal and its decomposition results. (a) Time and frequency domain analysis of outer ring signal. (b) FCEEMD decomposition result of outer ring fault signal.
Coatings 12 01337 g006
Figure 7. The result of energy kurtosis mean filtering. (a) Energy kurtosis weighted index of the CWRU outer ring IMF components. (b) Envelope demodulation of CWRU outer ring reconstruction signal.
Coatings 12 01337 g007
Figure 8. MOMEDA filtered output of CWRU outer ring signal and its envelope demodulation. (a) Time and frequency domain analysis of MOMEDA filtered output for outer ring signal. (b) Envelope demodulation of MOMEDA filtered output for outer ring signal.
Coatings 12 01337 g008
Figure 9. CWRU rolling element fault signal and its decomposition results. (a) Time and frequency domain analysis of rolling element signal. (b) FCEEMD decomposition result of rolling element fault signal.
Coatings 12 01337 g009
Figure 10. The result of energy kurtosis means filtering. (a) Energy kurtosis weighted index of the CWRU rolling element IMF components. (b) Envelope demodulation of CWRU rolling element reconstruction signal.
Coatings 12 01337 g010
Figure 11. MOMEDA filtered output of CWRU rolling element signal and its envelope demodulation. (a) Time and frequency domain analysis of MOMEDA filtered output for rolling element signal. (b) Envelope demodulation of MOMEDA filtered output for rolling element signal.
Coatings 12 01337 g011
Figure 12. Illustration of the bearing experiment platform. (a) Bearing experiment platform. (b) Sensor layout.
Coatings 12 01337 g012
Figure 13. NASA inner ring fault signal and its decomposition results. (a) Time and frequency domain analysis of inner ring signal. (b) FCEEMD decomposition result of inner ring fault signal.
Coatings 12 01337 g013
Figure 14. The result of energy kurtosis means filtering. (a) Energy kurtosis weighted index of the NASA inner ring IMF components. (b) Envelope demodulation of NASA inner ring reconstruction signal.
Coatings 12 01337 g014
Figure 15. MOMEDA filtered output of NASA inner ring signal and its envelope demodulation. (a) Time and frequency domain analysis of MOMEDA filtered output for inner ring signal. (b) Envelope demodulation of MOMEDA filtered output for inner ring signal.
Coatings 12 01337 g015
Figure 16. NASA outer ring fault signal and its decomposition results. (a) Time and frequency domain analysis of outer ring signal. (b) FCEEMD decomposition result of outer ring fault signal.
Coatings 12 01337 g016
Figure 17. The result of energy kurtosis means filtering. (a) Energy kurtosis weighted index of the NASA outer ring IMF components. (b) Envelope demodulation of NASA outer ring reconstruction signal.
Coatings 12 01337 g017
Figure 18. MOMEDA filtered output of NASA outer ring signal and its envelope demodulation. (a) Time and frequency domain analysis of MOMEDA filtered output for outer ring signal. (b) Envelope demodulation of MOMEDA filtered output for outer ring signal.
Coatings 12 01337 g018
Figure 19. NASA rolling element fault signal and its decomposition results. (a) Time and frequency domain analysis of rolling element signal. (b) FCEEMD decomposition result of rolling element signal.
Coatings 12 01337 g019
Figure 20. The result of energy kurtosis mean filtering. (a) Energy kurtosis weighted index of the NASA rolling element IMFs. (b) Envelope demodulation of NASA rolling element reconstruction signal.
Coatings 12 01337 g020
Figure 21. MOMEDA filtered output of NASA rolling element signal and its envelope demodulation. (a) Time and frequency domain analysis of MOMEDA filtered output for rolling element signal. (b) Envelope demodulation of MOMEDA filtered output for rolling element signal.
Coatings 12 01337 g021
Figure 22. Comparative analysis of feature extraction methods based on different decomposition methods. (a) Reconstruction errors of different decomposition methods. (b) Envelope spectrums obtained by different decomposition methods.
Coatings 12 01337 g022
Figure 23. EEMD decomposition results of the rolling element fault signal and envelope spectrum of the two methods. (a) EEMD decomposition results of rolling element fault sign. (b) Envelope spectrum of the two methods.
Coatings 12 01337 g023
Figure 24. The time domain diagram and envelope spectrum of the impact signals obtained by the three methods. (a) Time domain diagram of three groups of impact signals. (b) Envelope demodulation of three groups of impact signals.
Coatings 12 01337 g024
Figure 25. The time-domain and frequency-domain waveforms of four rolling element signals with different noise levels.
Coatings 12 01337 g025
Figure 26. The envelope spectrum obtained by the proposed method under different noise levels. (a) Envelope spectrum at noise level SNR = 10 dB. (b) Envelope spectrum at noise level SNR = 15 dB. (c) Envelope spectrum at noise level SNR = 20 dB. (d) Envelope spectrum at noise level SNR = 25 dB.
Coatings 12 01337 g026
Table 1. The structure parameters of SKF 6205 bearing.
Ball Diameter (d)Number of Balls (N)Pitch Diameter (D)Contact Angle (α)
7.938 mm939 mm0
Table 2. Fault characteristic frequency (unit: Hz).
Inner Ring FaultOuter Ring FaultRolling Element Failure
162.1852107.3648141.1693
Table 3. The bearing structure factor of Rexnord ZA-2115.
Ball Diameter (d)Number of Balls (Z)Pitch Diameter (D)Contact Angle (α)
8.407 mm1671.501 mm15.17
Table 4. Fault characteristic frequency (unit: Hz).
Inner Ring Fault (BPFI)Outer Ring Fault (BPFO)Rolling Element Failure (BSF)
296.91236.4139.9
Table 5. The performance indexes of decomposition methods.
MethodRMSETime (s)SD
EEMD0.00277.8063700.1336
FEEMD0.00270.0167440.1338
FCEEMD 1.8445 × 10 17 0.0134810.1337
Table 6. Correlation coefficient of IMF components.
IMF1IMF2IMF3IMF4IMF5IMF6IMF7IMF8
0.9990.9480.2230.2330.1110.0770.0100.005
Table 7. The reported studies on the bearing fault.
AuthorModelDatasetFault Frequency Waveform
Yin [42]Improved ensemble noise reconstructed EMDXJTU-SY, IMSobvious
Li [43]Improved EEMD based on improved adaptive resonance technologyCWRU, Experimental of authorsobvious, general
Han [44]Teager energy operator and CEEMDWind turbine experimental test riggeneral
Zhou [25]Adaptive VMD and MOMEDACWRU, IMSvery obvious
Xiao [26]Adaptive MOMEDA and Teager energy operatorExperimental of authorsvery obvious
Wang [45]Resonance sparse decomposition and improved MOMEDAExperimental of authorsvery obvious
Li [24]Hankel matrix, signal spectrum is reconstructed, MOMEDACWRUobvious
Authors of this articleFCEEMD Energy Kurtosis Mean Filtering, MOMEDACWRU, IMSvery obvious
Publisher’s Note: MDPI stays neutral with regard to jurisdictional claims in published maps and institutional affiliations.

