Abstract
Nickel-based alloys are considered promising materials for primary circuits of high-temperature gas reactors (HTGRs), specifically for gas turbines. The primary helium (He) coolant in the gas-turbine-based HTGRs is expected to reach temperatures of up to 900 °C; therefore, the selected materials should adequately perform over a long service life at such an environment. A promising manufacturing method in the production of reactor components is precision casting, where the content of revert (recyclate) material in the alloy differs and can influence the material behavior. In our study, Inconel alloy 738 was manufactured by casting 50% and 100% of revert material and tested in HTGR conditions to examine the influence of helium coolant on the material’s properties. Tensile specimens were exposed at 900 °C for 1000 h in helium containing a specified amount of gaseous impurities. Scanning electron microscopy (SEM) with energy dispersive spectroscopy (EDS), in combination with X-ray diffraction (XRD) and nano-, microhardness methods, were used for material characterization after performing the tensile tests at room temperature. The presence of three types of layers was observed: a thin layer formed by aluminum and chromium oxides on the surface; non-uniform surface oxides Ti3O5 with inner (Al,Cr)2O3; and the inner fine-grained Inconel Cr-enriched phase (approx. 10–20 µm below the surface), which can act as a protective surface layer. Mechanical properties of both revert materials decreased after exposure to HTGR conditions but did not show a significant difference as a result of the content of the revert material. The increase of nano-hardness in line profiles throughout the specimen’s cross-section was observed locally at the surface oxides and in the precipitates and grain boundaries. After exposure, Rp0.2 values decreased by 20% and 17.7%, and Rm values by 12.3% and 20.8% in samples with 50 and 100% revert content, respectively. Furthermore, a decrease in microhardness values (HV0.1) was detected by 4.98% in longitude and 5.80% in cross-section for samples with 50% revert material and by 3.85% in longitude and 7.86% in cross-section for samples with 100% revert material. It can be concluded that both revert materials have similar corrosion resistance in HTGR conditions. The presented results complement the knowledge about the degradation of alloys in the coolant environment of advanced gas-cooled reactors.
1. Introduction
Advanced energy systems, which include generation IV nuclear reactors, are, in most cases, designed for higher temperatures of the working medium than existing energy systems. The working medium/coolant differs according to the type of system. Among the considered coolants, helium will work with a temperature of up to 900 °C or higher. These high temperatures place higher demands on the corrosion and mechanical resistance of the used structural materials. Helium is applied due to its high thermal conductivity and chemical inertness allowing a higher operating temperature. However, gaseous impurities (H2, H2O, CH4, CO, CO2, and O2) found in the HTGR primary circuit contaminate the helium coolant. Depending on the ratio of the partial pressures of these admixtures, this environment can cause carburization, decarburization, or oxidation in alloys, and that affects their properties [1,2,3].
Nickel–chromium-based alloys are highly promising for application in Generation IV nuclear reactors due to their strength, creep resistance, and corrosion resistance at high temperatures. For example, components located outside the reactor’s active zone could be created from these alloys. Some gas-cooled reactor concepts include a gas turbine located directly in the primary circuit. This solution has not yet been implemented on a real device. However, it should bring greater efficiency and simplification to the entire system [2,3,4,5,6,7,8]. Inconel alloys are considered for use in the primary circuit components, mainly for blades and discs in gas turbines out of the reactor´s active zone [9,10]. It was found that in an oxidizing environment, Inconel alloys form a passivating oxide layer, protecting the components from additional corrosion at high temperatures [11]. Alloy 230 has been shown to form chromium oxide layers on the surface at 950 °C [11,12] and aluminum oxide internally [11]. A comparison of the corrosion rates between irradiated and non-irradiated Inconel 718 at 900 °C shows that irradiation accelerates the growth of a denser scale of Cr2O3 as well as the inner oxide layers of Al2O3 and TiO2, and improves the material’s resistance to oxidation [13]. Inconel 617’s creep behavior was investigated in air and helium environments at high temperatures. A shorter creep rupture time was found in He than in air at 900 and 950 °C, mostly due to the thicker protective oxide grown on the material in He [14]. Given its excellent corrosion resistance and strength at high temperatures, Inconel 738 has been extensively studied [15,16,17,18,19,20,21,22,23,24,25,26,27,28,29,30]. The dispersion of gamma prime γ’ particles was characterized as a function of the solidification rate, where the morphology of the particles transformed from round to cluster-like with a decreasing cooling rate, displaying different behavior in the inter-dendritic areas [31]. The high oxidation resistance of Inconel 738 was because of the dense surface of Cr oxide and inner alumina layers [25].
Current gas turbine materials are commonly produced by casting from virgin and revert materials. The precision casting method can be used especially in the production of blades and discs of gas turbines, or other components for advanced energy systems. In production using this method, a large amount of waste alloy, the so-called revert, is produced, which is returned to production, melted, and mixed with fresh (virgin) alloy. Virgin alloy is produced by melting pure elements (Ni, Co, Cr, Mo, W, Ti, Al) [10,32]. It is known that using revert material can influence material properties [32], especially tensile strength. A company involved in the production of high-temperature components using the precision casting method was also involved in a research program in the Czech Republic focused on advanced gas-cooled reactors. This foundry uses several types of nickel alloys for production, mainly Inconel 738. One of the goals of joint research with the participation of the mentioned foundry was to find out how the presence of revert in the material will affect its mechanical properties and microstructure under the specific high-temperature helium environment.
2. Materials and Methods
2.1. Test Material
The test material was a nickel-based alloy, Inconel 738 (IN738), chosen in cooperation with a precision-casting foundry that uses this alloy for most of its production. In the production of a so-called fusible model using the precision casting method, a large amount of waste alloy is produced. This alloy is returned to production (revert), where it is mixed with a new alloy (virgin material) in a certain ratio. According to various research and empirical findings (obtained in a specific foundry), in order to maintain a stable quality of production, it is necessary to maintain the content of virgin material in the alloy at a level of at least 20% (i.e., the revert content max. 80%). IN738 contains 60% nickel, 16% chromium, 8.5% cobalt, and a lower concentration of molybdenum, aluminum, titanium, tungsten, tantalum, niobium, and zirconium. The alloy was purchased from Bibus Metals s.r.o. in the shape of a rod profile with a circle diameter of 10 mm, which was then machined into tensile specimens with a shaft diameter of 6.35 mm. The composition of the virgin IN738 is shown in Table 1. Two IN738 rods were prepared using 50–100% of revert material. The IN738 alloy passed the so-called solution annealing by heating to 950 °C under vacuum (without holding), then annealing was performed under argon atmosphere at 1120 °C for 120 min, followed by aging at 843 °C under vacuum for 24 h. The test materials were named according to the proportion of virgin/revert material used: 50R consisted of a mixture of 50% virgin and 50% revert material and 100R was 100% revert material.

Table 1.
Chemical composition of virgin and revert IN738 by producer [wt.%].
2.2. Exposure to He Gas
The mechanical and microstructure properties of IN738 tensile samples 50R and 100R were verified under conditions simulating an HTGR primary circuit. The device used during exposure to high-temperature helium consists of a silicon retort furnace with a high-temperature vacuum tube, gas lines with a moisture sensor, and pressure cylinders (Figure 1).
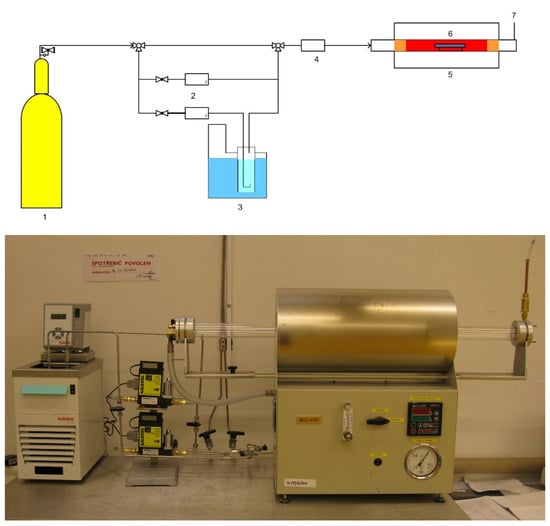
Figure 1.
Scheme (top) of high-temperature helium in the test system and the real facility (bottom): 1. Gas cylinder; 2. Two mass flow controllers; 3. Unit for controlled gas humidification; 4. Moisture analyzer (Hygrometer); 5. Tube furnace with a metal retort; 6. Sample holder; 7. Gas outlet/gas sampling point.
Tensile specimens of 50R and 100R materials were made from the rod profile and were given threaded ends. The specimens were exposed to high-temperature helium at 900 °C and 0.5 MPa pressure, with a flow of 50–100 mL/min for 1000 h, followed by tensile testing at room temperature. The helium environment contained specific gaseous impurities (Table 2) that simulated the gas coolant of the HTGR.
Table 2.
Gaseous composition of the helium coolant.
2.3. Mechanical Testing
Tensile tests were performed on as-received and exposed round bar-type samples (ČSN EN ISO 6892-1) up to rupture at room temperature using the Instron 1362 with strain rate 7.10−5 s−1 and maximal load between 25–32 kN. The tensile tests were followed by Vickers microhardness HV0.1, which was performed using the DuraScan 70 G5 in a matrix of 5 × 5 indents on longitudinal and cross-sections of the metallographic samples. Changes in local mechanical properties were described by nanoindentation performed in hardness line profiles through the specimen’s cross-section. Nanoindentation measurements were performed on the Bruker TI 950 TriboIndenter with a Berkovich-type diamond indenter tip calibrated on a fused silica standard. A line of 50 indents with 2 µm spacing near the edge of each longitudinal sample was used as a depth profile measurement. Each indent was performed using a load-controlled single-cycle mode at a 5 mN indentation load. Hardness values were evaluated from individual load-displacement curves using the Oliver–Pharr [33] method according to ISO 14577.
2.4. Microstructure Investigation
A microstructure investigation was performed after tensile testing. Samples gauge sections were cut in cross-sectional and longitudinal view, then hot drenched into conductive resin Polyfast (phenolic conductive resin with carbon filler). Metallographic cuts were prepared by automatic grinding and polishing. Automatic grinding of samples was performed on a grinding wheel with a grain size of 220, wetting agent water, rotation speed 300 rpm, pressure 40 N/1 sample, for 03:00 min. Then, grinding and fine polishing were performed on MD-Largo and MD-Dac wheel, wetting agents were diamond suspensions Allegro/Largo 9 µm and DiaPro Dac 3 µm, 1 µm, rotation speed 150 rpm, pressure 30 N/1 sample, each step for 05:00 min. Finally, chemical polishing was performed on MD-Chem wheel (a wheel with a special surface for chemical polishing), wetting agent OP-S NonDry 0.04 µm (colloidal silica for final polishing), rotation speed 150 rpm, pressure 15 N/1 sample, for 02:00 min. After individual steps, the samples were cleaned with water in a Lavamin ultrasonic cleaner from Struers. Grinding and polishing were performed on an automatic metallographic grinder and polisher Tegramin 25 from Struers.
The microstructure was evaluated using SEM methods with an SEM TESCAN Lyra3 GMU equipped with a field emission gun, and energy dispersive X-ray spectroscopy (EDX) for chemical microanalysis and electron backscatter diffraction (EBSD) both from Oxford Instruments, to determine the crystallographic orientation of grains in cross-sectional and longitudinal directions, as well as close to the surface. Secondary electrons (SE) were used to observe fractures, backscatter electrons (BSE) for chemical contrast, and EBSD for crystallographic analysis. SEM results were completed by XRD for phase identification. A grazing incidence X-ray diffraction (GIXRD) pattern was collected from the 100R sample using an Empyrean third-generation diffractometer (Malvern-PANalytical) that was equipped with a Co X-ray tube (X-ray wavelength 0.1789 nm, 40 kV, 40 mA), focusing the X-ray mirror for Co-radiation, a 5-axis cradle, and a multichannel detector, PIXcel3D (1D mode). During the measurement, the incident angle (ω) was fixed to 1°, while the diffraction angle, 2θ, varied from 20 to 100° with a step size of 0.026°. Before measurements were taken, height and tilt were calibrated for the sample. The identification of crystalline phases was performed using High Score Plus software (PANalytical) which includes the PDF-4+ database.
3. Results
3.1. Crystallographic Analysis by SEM–EBSD
EBSD measurements were used to compare the crystallographic structure before and after exposure to high temperature, specifically the structure of grains after tensile testing and the misorientation inside the grains close to the fracture surface. Figure 2a–d displays the EBSD maps in Euler angles of both materials in the cross-section and longitudinal directions of the sample in low magnification.
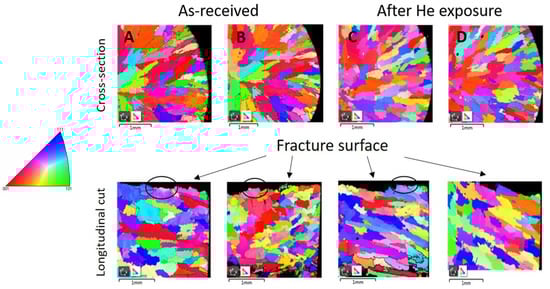
Figure 2.
EBSD mapping of IN738 after tensile testing in Euler angles: (A) as-received 50R, cross-section (up), longitudinal (down); (B) as-received 100R, cross-section (up), longitudinal (down); (C) after He exposure, cross-section (up), longitudinal (down); (D) after He exposure, cross-section (up), longitudinal (down). Recrystallized structure is marked by black ellipses. On the left is a legend for IPF coloring.
The EBSD maps of the as-received materials after tensile testing show large grains elongated in the radial direction of the cross-section with a decrease in grain sizes towards the specimen’s surface. The maps of the exposed materials after tensile testing show a similar grain structure. No significant extension of the grains was observed along the longitudinal direction after tensile testing, whereas a dendritic fracture was observed. In addition, the recrystallized structure was observed in the grains near the fracture surface in the longitudinal cut, marked by black ellipses in Figure 2.
Detailed EBSD maps close to the surface area in the cross-section show some fine-grained crystalline structure which is marked by arrows in Figure 3b,d. This fine-grained layer was formed on the entire surface of material during exposure to high-temperature He, because it was not observed on the as-received samples.
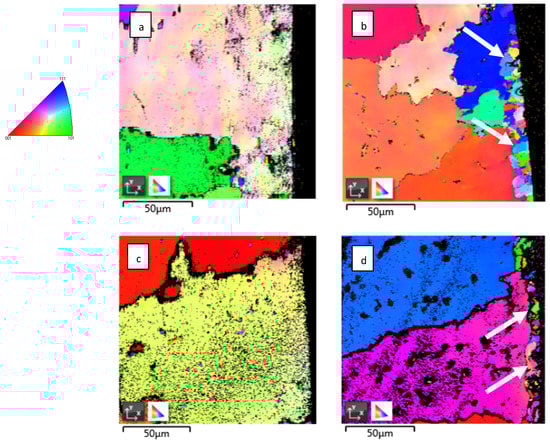
Figure 3.
Detailed EBSD mapping of IN738: (a) as-received 50R; (b) 50R after He exposure; (c) as-received 100R; (d) 100R after He exposure. Fine grains are marked by white arrows. On the left is a legend for IPF coloring.
3.2. Microstructure and Chemical Change Evaluation by SEM-EDX
SEM–BSE imaging showed that the subsurface microstructures of both the 50R and 100R were visibly changed after exposure to the He conditions. The microstructure of both materials in the as-received state is seen in Figure 4a,c. The Inconel microstructure shows an austenitic matrix with γ’ precipitates consisting of (Ti, Cr) based particles marked with ellipses.
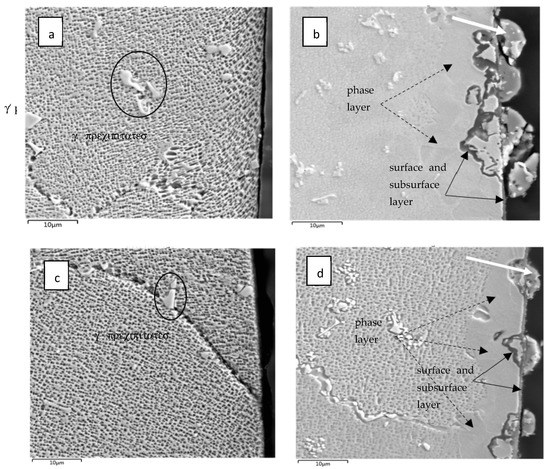
Figure 4.
Microstructure of IN738 cross-sections close to the sample surface: (a) as-received 50R; (b) after He exposure; (c) as-received 100R; (d) after He exposure. γ’ precipitates are marked with ellipses on the left. The surface is on the right; the dashed arrows mark the phase layer, and full-line arrows mark the surface and subsurface layers.
After He exposure, a 10–20 µm thick layer was observed close to the surface and is marked with black dashed arrows in Figure 4b,d. This layer is probably a new phase that likely arose during the exposure of the virgin material, as shown in the EDX analysis Figure 5, Figure 6 and Figure 7. The layer has an obviously distinct microstructure from the inner regions of the material. Apparently, this layer experienced the dissolution of the γ‘ precipitates. Further, surface protrusions marked with white arrows and a thin surface layer marked with full-line black arrows were probably formed by the interaction of the material with gaseous impurities in high-temperature He.
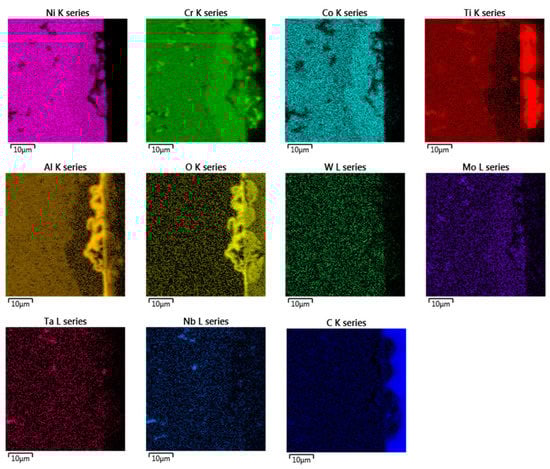
Figure 5.
EDX chemical mapping of IN738—50R after exposure to He.
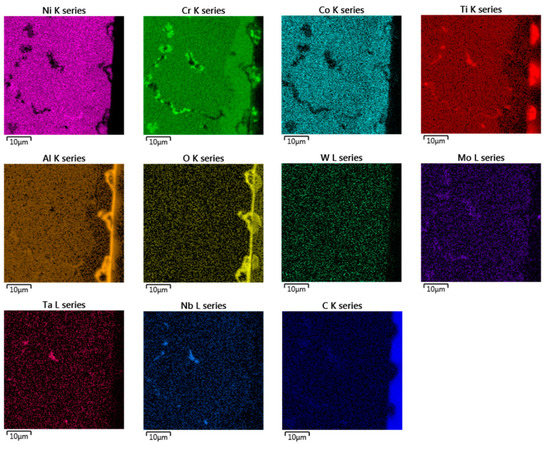
Figure 6.
EDX chemical mapping of IN738—100R after exposure to He.
In the EDX analysis, the chemical mapping of the samples after the 50R and 100R materials were exposed to He can be seen in Figure 5 and Figure 6, respectively. The fine-grained layer at the surface (Figure 4, marked with dashed arrows) is enriched with Cr, Co, Mo and depleted of Ni, Ti and Al elements (see Figure 5 and Figure 6). Such inner phase of similar composition does not occur in common nickel-based alloys, which do not contain Co [11,14]. The surface protrusions (Figure 4, marked with white full-line arrows) are Ti, Cr and Al-containing oxides. The thin surface layer (Figure 4, marked with black full-line arrows) is likely Al-based oxide scale. Al-oxide-rich regions are also found below the surface protrusions. Particles (Ti, Nb, Ta)C are visible in Figure 5 and Figure 6d, and probably Cr23C6 is seen at the grain boundaries on Figure 6.
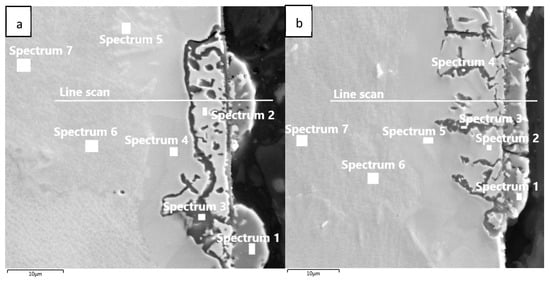
The chemical composition from the quantitative measurement by EDX point analysis is shown in Figure 7, Diagram 1 and Diagram 2. Surface protrusions (marked with white arrows and a thin surface layer marked with full-line black arrows in Figure 4) were identified as oxides.
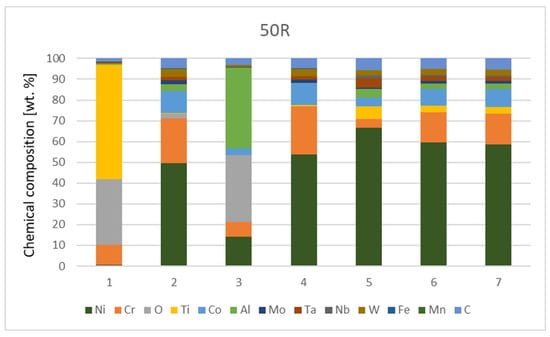
Diagram 1.
Chemical composition [wt.%] of IN738—50R after He exposure.
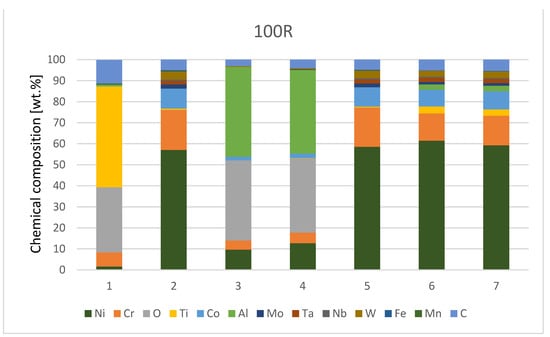
Diagram 2.
Chemical composition [wt.%] of IN738—100R after He exposure.
The contents of Fe and Mn elements are supposedly exfoliated material from the furnace with a metal retort. The higher content of C is due to the EDS measuring technique, which is unable to determine the exact amount of this element and underestimates its amount.
Chemical composition was also measured using EDX line scans to perform the distribution of elements through the individual surface and subsurface layers (Diagram 3 and Diagram 4).
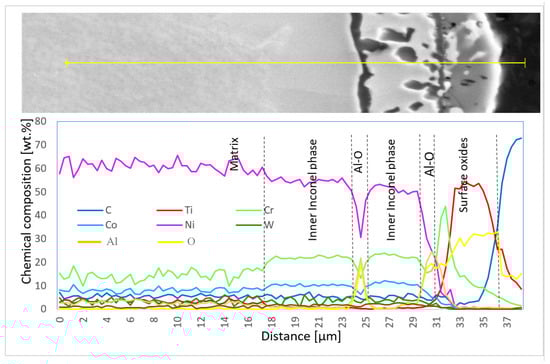
Diagram 3.
Chemical composition (wt.%) of elementary lines on the 50R sample after He exposure.
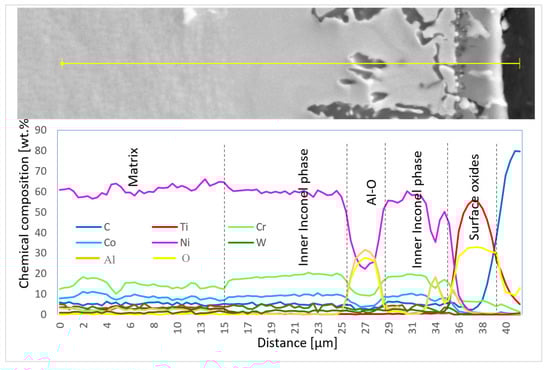
Diagram 4.
Chemical composition (wt.%) of elementary lines on the 100R sample after He exposure.
3.3. Microstructure and Chemical Change Evaluation by X-ray Diffraction Measurements
SEM results were followed by XRD measurements to perform phase identification. The oxides formed on the surface of the 100R sample after exposure to high-temperature He were analyzed by GIXRD (Figure 8). The main phases identified are the base Inconel alloy, aluminium-chromium oxide (Al,Cr)2O3 and titanium oxide Ti3O5, with Ti3O5 as the outermost layer and (Al,Cr)2O3 the layer underneath it (Figure 9). Minor phases are aluminium chromium AlCr2 and niobium titanium TixNby. The presence of Cr2O3 could not be confirmed because of the overlapping of major phase peaks. A closer view of the diffraction lines for Inconel shows the presence of a second Inconel-like phase with a higher lattice constant (a = 3.586 Å) than that of the base Inconel (a = 3.579 Å). The increase in lattice constant conforms to the substitution of Ni atoms with Cr atoms, given the bigger atomic radius of chromium (1.85 Å) compared to nickel (1.62 Å). Looking back to Figure 4d and Diagram 2 (100R), we can conclude that the 10–20 µm thick layer (the inner Inconel phase) is a Cr and Co-enriched Inconel phase. There is a 1 µm thick (Al,Cr)2O3 layer on the surface, adjacent to the Inconel phase, which is usually formed when Inconel is heated above 800 °C. The fact that Cr is present across the Al2O3 oxide is a clear indication that slow Cr diffusion is happening [34]. XRD measurements were not performed on 50R as it was assumed that both materials have the same chemical composition and, therefore, the same layer-forming mechanism.
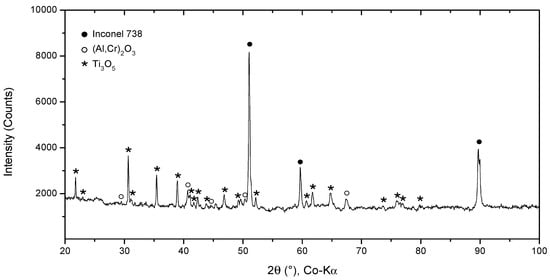
Figure 8.
XRD pattern of IN738 100R after He exposure.
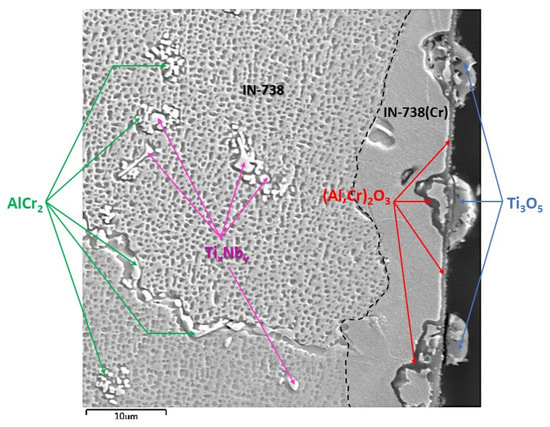
Figure 9.
SEM–BSE image of IN738 100R after He exposure showing phases, layers and particles, with the composition identified by XRD.
3.4. Mechanical Testing
3.4.1. Tensile Tests
The yield strength (YS) and ultimate tensile strength (UTS) of IN738 decreased after exposure to He. The effect of He exposure was more significant in the 100R material than in the 50R material. The decrease in YS was similar in both materials: 20% for 50R and 17.7% for 100R. However, the decrease in UTS was very different: 12.3% for 50R and 20.8% for 100R, Diagram 5.
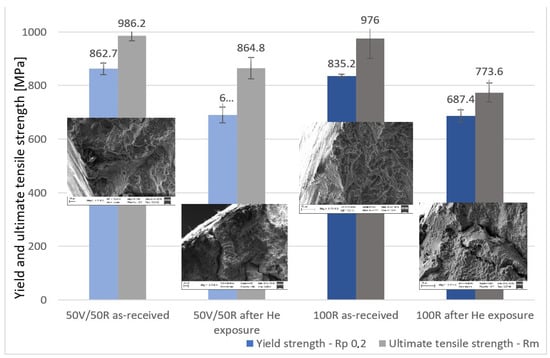
Diagram 5.
Yield strength and ultimate tensile strength of the two IN738 materials: as-received material and after He exposure.
The fracture surfaces of the samples after tensile testing at room temperature were observed by SEM. The images are shown in Figure 10a–f. A dendritic fracture typical for cast Inconel alloys was observed in both 50R and 100R specimens. Another important aspect of the fracture was the presence of shrinkage-cavities that developed along the dendrites in the center of the material (Figure 10e,f, imaged in BSE). It appeared that more shrinkages were found in the center of the 100R specimen than in the 50R specimen.
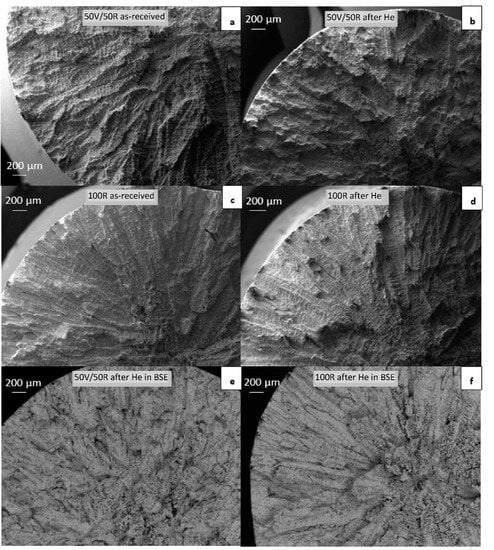
Figure 10.
SEM–BSE micrographs of fractures in tensile specimens: (a) 50R as-received; (b) 50R after He exposure; (c) 100R as-received; (d) 100R after He exposure; (e) 50R after He exposure in BSE; (f) 100R after He exposure in BSE contrast.
3.4.2. Vickers Microhardness Testing
Vickers microhardness HV0.1 was measured after the tensile tests on a longitudinal and cross-sectional plane from the edge across the center of the sample in five lines, each line with five indents. Table 3 shows the average values, where a slight decrease of microhardness after He exposure is observed along the cross-section and longitudinal direction on both 50R and 100R specimens. However, a higher scatter of values should still be considered (Diagram 6).
Table 3.
Vickers microhardness HV0.1 in the longitudinal direction and cross-section of specimens before and after He exposure.
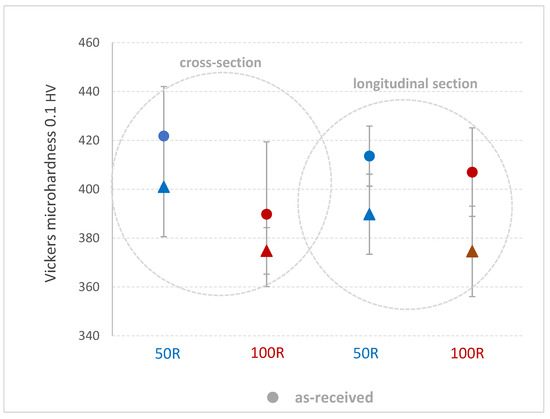
Diagram 6.
Comparison of Vickers microhardness 0.1 HV in the longitudinal direction and cross-sections of specimens before and after He exposure.
3.4.3. Nanoindentation Measurements
Nanoindentation performed in a cross-sectional plane on as-received samples 50R and 100R showed a linear increase in values towards the surface of both materials (Figure 11). Occasional oscillations in hardness were caused by precipitates and grain boundaries. An increase in hardness was observed on the surface of both materials after exposure to He, showing microstructure changes specifically in the oxides (Al,Cr)2O3 and Ti3O5, in an area of thickness of around 10 µm.
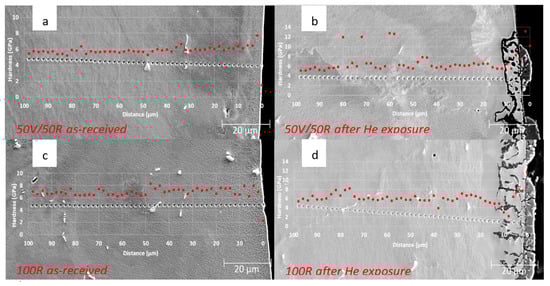
Figure 11.
Nanoindentation performed in the cross-section: (a) as-received 50R; (b) 50R after He exposure; (c) as-received 100R; (d) 100R after He exposure.
4. Discussion
SEM (EDX, EBSD) and XRD were used to characterize the microstructural changes of IN738 after tensile testing the as-received and exposed specimens of 50R and 100R materials. SEM analysis showed similar dendritic structures in both materials. However, detailed EDX analysis found subsurface and surface changes.
After exposure, three types of layers appeared on the surface, characterized as: (i) an inner mainly Cr-enriched Inconel fine-grained phase with a thickness of 10–20 µm, formed by the diffusion of the Cr element during HTGR exposure; (ii) inner (Al,Cr)2O3 as products of the reaction with gaseous impurities that penetrated the fine-grained phase; (iii) a non-uniform surface oxide, Ti3O5. The inner Inconel phase is mostly Cr-, Co-enriched and occurs along the sample close to the surface (up to 20 µm thick) after high-temperature He exposure. In contrast, this phase is depleted of Al and Ti that subsequently formed oxides on the surface with a high probability in order Al ˃ Ti ˃ Cr, as proposed in Ellingham’s diagram [35]. The oxide Al2O3 originated as a layer on the surface (with a thickness of about 1 µm) and also penetrated the Inconel phase. Subsequently, Ti diffused from the Inconel Cr-enriched phase and reacted with gaseous impurities from the He medium to create islands of Ti3O5 on the surface. The content of aluminum was probably completely consumed and the amount was insufficient to create a thicker layer. Furthermore, the presence of chromium reduced the protective properties of the aluminum layer and, thus, allowed the formation of titanium oxide [36]. In the structure, molybdenum, tungsten, tantalum, and niobium strengthened the matrix with a solid solution, while titanium and aluminum increased the strength by age hardening. Higher strengthening comes from the precipitation of the γ’ and Ni3(Al,Ti) particles at high temperatures. Zirconium improves both the creep properties and malleability of the material [3].
EBSD maps through the longitudinal view show that no significant extension of grains occurred during tensile testing where the dendritic fracture was examined. This method showed a fine-grained structure in the Inconel Cr-enriched phase, which was created on both 50V/50R and 100R after exposure to He. The fact that there is no significant elongation of grains probably points to low material plasticity; however, the misorientation inside some grains near the fracture surface (marked by ellipses in Figure 2A–C, down) shows that the material reacts plastically to the tension.
The mechanical properties of Inconel 738 decreased significantly after exposure to high-temperature He. The decrease in ultimate tensile strength was 12.3% in the 50R material and 20.8% in the 100R material; the decrease in yield strength was 20% in the 50R revert material and 17.7% in the 100R material, which is not a significant difference owing to the content of the revert material. The Vickers microhardness test showed a decrease in values of the exposed specimens.
The initiation of the fracture during the tensile tests may be explained by the following mechanisms. The fracture along dendrites, which is typical for a dendritic structure, occurs because dendritic segregation creates heterogeneous material that concentrates stress in preferential regions where cracks initiate [5,31,37,38,39]. These shrinkages originated during solidification in the casting process. The initiation of fracture caused by shrinkage cavities was also observed elsewhere [5,14,40]. Therefore, the higher content of revert material may decrease YS and UTS of as-received materials, as well as exposed materials, whereas, in the case of exposed materials, the high temperature should play the main role.
An increase of nano-hardness performed by line profiles was observed in the oxides at the surface of both materials after exposure to high-temperature He, showing that the microstructure changes and scatter of values were measured at grain boundaries and precipitates.
5. Conclusions
Inconel alloy 738, manufactured by casting from 50 and 100% revert materials, was exposed in simulated primary HTGR conditions at 900 °C. New knowledge about the microstructure and mechanical properties after high-temperature helium exposure with gaseous impurities were obtained. No significant difference was confirmed between the material behavior of 50V/50R and 100R.
Microscopic techniques proved the origin of the new-formed compact inner Inconel Cr-enriched phase with a fine-grained structure, which signifies the reinforcement of the surface of the material in primary HTGR conditions. On the other hand, diffused elements in combination with the products of gaseous impurities caused a surface inhomogeneity as a non-uniform layer from oxide Ti3O5 and Al2O3, which penetrated about 10 µm into the Cr-rich Inconel phase. The surface microstructure inhomogeneity, as well as a significant decrease in mechanical properties, can be a risk for crack initiation and, therefore, for operation under extreme HTGR conditions.
The mentioned methodology can also be applied to other alloys, especially those used in casting production, for example to material IN713 that has also been tested and will be evaluated in the next study.
Author Contributions
Formal analysis, D.M., C.A., O.L. and M.V.; writing—original draft preparation, D.M.; writing—review and editing, D.M., J.B., C.A.C. and P.G. All authors have read and agreed to the published version of the manuscript.
Funding
The presented work was realized with Institutional Support from the Ministry of Industry and Trade of Czech Republic.
Institutional Review Board Statement
Not applicable.
Informed Consent Statement
Not applicable.
Data Availability Statement
Not applicable.
Conflicts of Interest
The authors declare no conflict of interest. The funders had no role in the design of the study; in the collection, analyses, or interpretation of data; in the writing of the manuscript; or in the decision to publish the results.
References
- Was, G.S.; Petti, D.; Ukai, S.; Zincle, S. Materials for future nuclear energy systems. J. Nucl. Mater. 2019, 527, 151837. [Google Scholar] [CrossRef]
- Yvon, P.; Carré, F. Structural materials challenges for advanced reactor systems. J. Nucl. Mater. 2009, 385, 217–222. [Google Scholar] [CrossRef]
- Natesan, K.; Purohit, A.; Tam, S.W. Materials Behavior in HTGR environments, Argonne. 2003. Available online: www.ntis.gov (accessed on 5 December 2022).
- IAEA. Gas turbine power conversion systems for modular HTGRs. In Proceedings of the Report of a Technical Commitee Meeting, Palo Alto, CA, USA, 14–16 November 2000; pp. 21–44. [Google Scholar]
- World Nuclear Association. Generation IV Systems, (n.d.). Available online: https://www.world-nuclear.org/information-library/nuclear-fuel-cycle/nuclear-power-reactors/generation-iv-nuclear-reactors.aspx (accessed on 5 December 2022).
- Berka, J.; Matcha, J.; Černý, M.; Víden, I.; Sus, F.; Hájek, P. New experimental device for VHTR structural material testing and helium coolant chemistry investigation—High-temperature helium loop in NRI Řež. Nucl. Eng. Des. 2012, 251, 203–207. [Google Scholar] [CrossRef]
- Berka, J.; Hlinčík, T.; Víden, I.; Hudský, T.; Vít, J. The design and utilization of a high-temperature helium loop and other facilities for the study of advanced gas-cooled reactors in the Czech Republic. Prog. Nucl. Energy 2015, 85, 156–163. [Google Scholar] [CrossRef]
- Generation IV International Forum, GIF R&D outlook for Generation IV nuclear energy. Nucl. Energy 2009. Available online: https://www.gen-4.org/gif/upload/docs/application/pdf/2013-09/gif_rd_outlook_for_generation_iv_nuclear_energy_systems.pdf (accessed on 5 December 2022).
- Ford, D.A. The Development of Gas Turbine Materials, 1st ed.; Applied Science Publishers Ltd.: London, UK, 1981. [Google Scholar] [CrossRef]
- De Barbadillo, J.J. Nickel-base superalloys; physical metallurgy of recycling. Metall. Trans. A 1983, 14, 329–341. [Google Scholar] [CrossRef]
- Cabet, C.; Duprey, B. Long-term oxidation resistance of alloys for gas-cooled reactors. Nucl. Eng. Des. 2012, 251, 139–145. [Google Scholar] [CrossRef]
- Christ, H.J.; Künecke, U.; Meyer, K.; Sockel, H.G. High-temperature corrosion of the nickel-based alloy Inconel 617 in helium containing small amounts of impurities. Mater. Sci. Eng. 1987, 87, 161–168. [Google Scholar] [CrossRef]
- Wan, H.; Ding, Z.; Wang, J.; Yin, Y.; Guo, Q.; Gong, Y.; Zhao, Z.; Yao, X. Effects of helium ion irradiation on the high-temperature oxidation resistance of Inconel 718 alloy. Surf. Coat. Technol. 2019, 363, 34–42. [Google Scholar] [CrossRef]
- Kim, W.G.; Park, J.Y.; Lee, G.G.; Hong, S.D.; Kim, Y.W. Temperature effect on the creep behavior of alloy 617 in air and helium environments. Nucl. Eng. Des. 2014, 271, 291–300. [Google Scholar] [CrossRef]
- El-Awadi, G.A.; Abdel-Samad, S.; Elshazly, E.S. Hot corrosion behavior of Ni-based Inconel 617 and Inconel 738 superalloys. Appl. Surf. Sci. 2016, 378, 224–230. [Google Scholar] [CrossRef]
- Davydov, D.I.; Kazantseva, N.V.; Vinogradova, N.I.; Ezhov, I.V.; Stepanova, N.N. Analysis of the grain boundary microstructure and degradation in a gas turbine blade. Int. Sci. J. Sci. Tech. Union Mech. Eng. 2017, 3, 126–129. [Google Scholar]
- Ojo, O.A.; Chaturvedi, M.C. On the role of liquated γ′ precipitates in weld heat-affected zone microfissuring of a nickel-based superalloy. Mater. Sci. Eng. A 2005, 403, 77–86. [Google Scholar] [CrossRef]
- Ramakrishnan, A.; Dinda, G.P. Direct laser metal deposition of Inconel 738. Mater. Sci. Eng. A 2019, 740–741, 1–13. [Google Scholar] [CrossRef]
- Wangyao, P.; Polsilapa, S.; Promboopha, A.; Srigiofun, P.; Srihakulung, O. Effect of Al addition in cast nickel-base superalloys, Inconel-738 on microstructures and oxidation behaviors at 900 °C and 1000 °C. Key Eng. Mater. 2015, 656–657, 39–44. [Google Scholar] [CrossRef]
- Wei, J.; Ye, Y.; Sun, Z.; Liu, L.; Zou, G. Control of the kerf size and microstructure in Inconel 738 superalloy by femtosecond laser beam cutting. Appl. Surf. Sci. 2016, 370, 364–372. [Google Scholar] [CrossRef]
- Kazantseva, N.; Davidov, D.; Vinogradova, N.; Ezhov, I.; Stepanova, N. Analysis of phase transformations in Inconel 738C alloy after regenerative heat treatment. IOP Conf. Ser. Mater. Sci. Eng. 2018, 324, 012001. [Google Scholar] [CrossRef]
- Ola, O.T.; Ojo, O.; Wanjara, P.; Chaturvedi, M. Crack-free welding of IN738 by linear friction welding. Adv. Mater. Res. 2011, 278, 446–453. [Google Scholar] [CrossRef]
- Ola, O.T.; Ojo, O.A.; Chaturvedi, M.C. Role of filler alloy composition on laser arc hybrid weldability of nickel-base IN738 superalloy. Mater. Sci. Technol. 2014, 30, 1461–1469. [Google Scholar] [CrossRef]
- Bozza, F.; Bolelli, G.; Giolli, C.; Giorgetti, A.; Lusvarghi, L.; Sassatelli, P.; Scrivani, A.; Candeli, A.; Thoma, M. Diffusion mechanisms and microstructure development in pack aluminizing of Ni-based alloys. Surf. Coat. Technol. 2014, 239, 147–159. [Google Scholar] [CrossRef]
- Cade, B.G.; Caley, W.F.; Richards, N.L. Comparison of oxidation performance of two nickel-base superalloys for turbine applications. Can. Metall. Q. 2014, 53, 460–468. [Google Scholar] [CrossRef]
- Mueller, F.; Scholz, A.; Berger, C. Creep crack behaviour of a coarse grain nickel-base superalloy. Mater. High Temp. 2011, 28, 103–108. [Google Scholar] [CrossRef]
- Štamborská, M.; Losertová, M.; Galacz, R.; Konečná, K.; Horsák, L. Influence of hydrogen on the strains distribution of in 738 LC superalloy. In Proceedings of the Metal 2014—23rd International Conference on Metallurgy and Materials, Brno, Czech Republic, 21–23 May 2014; pp. 1375–1380. [Google Scholar]
- Steven, R.A.; Flewitt, P.E.J. Microstructural changes which occur during isochronal heat treatment of the nickel-base superalloy IN-738. J. Mater. Sci. 1978, 13, 367–376. [Google Scholar] [CrossRef]
- Zhang, X.; Chen, H.; Xu, L.; Xu, J.; Ren, X.; Chen, X. Cracking mechanism and susceptibility of laser melting deposited Inconel 738 superalloy. Mater. Des. 2019, 183, 108105. [Google Scholar] [CrossRef]
- Linn, S.; Scholz, A.; Oechsner, M.; Berger, C.; Luesebrink, O. Evaluation of property scatter of Ni-base alloy in 738 LC. Mater. Sci. Eng. A 2011, 528, 4676–4682. [Google Scholar] [CrossRef]
- Rosenthal, D.R.; West, R. Continuous γ′ precipitation in directionally solidified IN738 LC alloy. Mater. Sci. Technol. 1999, 15, 1387–1394. [Google Scholar] [CrossRef]
- Graham, L.W. Corrosion of metallic materials in HTR-helium environments. J. Nucl. Mater. 1990, 171, 76–83. [Google Scholar] [CrossRef]
- Oliver, W.C.; Pharr, G.M. An improved technique for determining hardness and elastic modulus using load and displacement sensing indentation experiments. J. Mater. Res. 1992, 7, 1564–1583. [Google Scholar] [CrossRef]
- Dressler, M.; Nofz, M.; Dorfel, I.; Saliwan-Neumann, R. Diffusion of Cr, Fe, and Ti ions from Ni-base alloy Inconel-718 into a transition alumina coating. Thin Solid Films 2012, 520, 4344–4349. [Google Scholar] [CrossRef]
- Ellingham, H.J.T. Reducibility of oxides and sulphides in metallurgical processes. J. Soc. Chem. Ind. 1944, 63, 125. [Google Scholar] [CrossRef]
- Gleeson, B. 1.09—Thermodynamics and Theory of External and Internal Oxidation of Alloys. In Shreir’s Corrosion; Elsevier: Amsterdam, The Netherlands, 2010; Volume 1, pp. 180–194. [Google Scholar] [CrossRef]
- Sidhu, R.K.; Ojo, O.A.; Chaturvedi, M.C. Weld cracking in directionally solidified Inconel 738 superalloy. Can. Metall. Q. 2007, 46, 415–424. [Google Scholar] [CrossRef]
- Luer, K.; DuPont, J.; Marder, A.; Skelonis, C. Corrosion fatigue of alloy 625 weld claddings in combustion environments. Mater. High Temp. 2001, 18, 11–19. [Google Scholar] [CrossRef]
- DuPont, J.N. The influence of solid-state diffusion on microstructural development during solidification. Defect Diffus. Forum 2007, 266, 157–169. [Google Scholar] [CrossRef]
- Zýka, J.; Andršová, I.; Podhorná, B.; Hrbáček, K. Mechanical properties and microstructure of IN738LC nickel superalloy castings. Mater. Sci. Forum 2014, 782, 437–440. [Google Scholar] [CrossRef]


Disclaimer/Publisher’s Note: The statements, opinions and data contained in all publications are solely those of the individual author(s) and contributor(s) and not of MDPI and/or the editor(s). MDPI and/or the editor(s) disclaim responsibility for any injury to people or property resulting from any ideas, methods, instructions or products referred to in the content. |
© 2022 by the authors. Licensee MDPI, Basel, Switzerland. This article is an open access article distributed under the terms and conditions of the Creative Commons Attribution (CC BY) license (https://creativecommons.org/licenses/by/4.0/).