Article

Surface Roughness Analysis of Microchannels Featuring Microfluidic Devices Fabricated by Three Different Materials and Methods

by
José M. Acosta-Cuevas
1,
Mario A. García-Ramírez
2,
Gabriela Hinojosa-Ventura
1,
Álvaro J. Martínez-Gómez
1,
Víctor H. Pérez-Luna
3 and
Orfil González-Reynoso
1,*
1
Chemical Engineering Department, University Center for Applied Science and Enginnering (CUCEI), Universidad de Guadalajara, Blvd. Marcelino García Barragán 1421, esq Calzada Olímpica, Guadalajara 44430, Mexico
2
Electronics Department, University Center for Applied Science and Enginnering (CUCEI), Universidad de Guadalajara, Blvd. Marcelino García Barragán 1421, esq Calzada Olímpica, Guadalajara 44430, Mexico
3
Department of Chemical and Biological Engineering, Illinois Institute of Technology, 10 West 33rd Street, Chicago, IL 60616, USA
*
Author to whom correspondence should be addressed.
Coatings 2023, 13(10), 1676; https://doi.org/10.3390/coatings13101676
Submission received: 21 August 2023 / Revised: 20 September 2023 / Accepted: 20 September 2023 / Published: 25 September 2023

Abstract

:
In recent years, the utilization of microfluidic devices for precise manipulation of small flows has significantly increased. The effective management of microfluidics is closely associated with microchannel fabrication. The fabrication method employed for microfluidic devices directly impacts the roughness of the microchannels, consequently influencing the flows within them. In this study, the surface roughness of microchannels was investigated through three different fabrication processes: PDMS lithography, PLA printing, and UV resin printing. This research compared and analyzed the surface roughness of the microchannels fabricated using these methods. Furthermore, supported by a dynamic fluid simulator, the impact of surface roughness on flow behavior was shown. Results reveal varying degrees of roughness prominence in curved regions. Comparing microfluidic device fabrication techniques is crucial to optimize the process, control roughness, analyze flow rates, and select a proper material to be used in the development of microfluidic devices.

Graphical Abstract

1. Introduction

In the past decade, microfluidic devices (MFDs) have found widespread applications in various fields, including micro-mixing, micro-reactors, and micro-thermal dissipators [1,2,3,4,5,6]. These devices typically comprise microchannels with hydraulic diameters smaller than 1 mm, serving as conduits for fluid manipulation. The reduction in channel size leads to an increased surface-to-volume ratio, resulting in pronounced surface effects [7]. This increased surface area allows for enhanced interaction between the fluid and the channel walls, influencing the mixing. The interactions between the fluid and the microchannel walls can facilitate catalytic reactions or promote adsorption and desorption processes, depending on the nature of the fluids and the surface properties [8,9]. Several fabrication methods, such as multilayer lithography, smoothed lithography printing, ultrasonic processes, filament extrusion, and laser cutting technology, are available for producing MFDs. Commonly, to manufacture MFDs, the materials used are monomer chemistries including vinyl and acrylates, epoxy resins, thiol–enes, polyurethanes, and siloxanes. Vinyl monomers contain carbon–carbon double bonds, with the simplest vinyl polymer, polyethylene (PE), originating from the ethylene monomer. Polymerization of the carbon–carbon double bond in the vinyl group is initiated by a radical, transforming the monomer into a radical and facilitating radical polymerization to create the polymer. It is worth noting that vinyl chlorides and similar variants are hazardous and challenging to handle. In contrast, acrylates, a category of vinyl polymers derived from the prop-2-enoyl (also known as acryloyl, acrylyl, or acryl) monomer, are generally simpler to synthesize than pure vinyl polymers. Acrylates are well-suited for surface modification through both chemical methods (activation using nitric acid) and physical surface treatments (such as plasma activation and corona discharge). Epoxy resins with epoxy groups are crosslinked by compounds that can bond with them, such as amines, amino acids, and thiols, and are capable of initiating the curing process of the epoxy monomer. Even these groups can react to ultraviolet (UV) light and other chemical stimuli. Thiol–ene chemistry, which involves the reaction of a thiol (containing sulfur–hydrogen groups) and an alkene to produce a thioether, has gained importance as a material for microfluidic devices. It is important to note that, in microfluidics, unreacted thiol groups could lead to non-specific interactions with target molecules. Siloxanes have a polymer backbone consisting of alternating silicon and oxygen atoms. The most commonly used siloxane is polydimethylsiloxane (PDMS), which is widely employed in the creation of microfluidic devices through a casting approach [10,11,12,13]. However, the quality of MFDs and the precision of their microchannels are directly influenced by the fabrication process [14].
Methods such as laser-induced backside wet etching, two-photon polymerization, and laser ablation show improved quality and precision in their MFD fabrication processes. Laser-induced backside wet etching (LIBWE), a single setup process suitable for working with transparent materials, has garnered attention as a potential solution to address challenges in glass micromachining. LIBWE is a technique that indirectly processes transparent materials by heating a liquid absorbent located on the rear side using a laser. Nevertheless, despite its promise, LIBWE still faces practical challenges when applied to a range of glass applications, primarily due to issues like crack formation and imprecise final geometry, and it is also limited to transparent materials [15,16,17].
Over the past two decades, the direct laser writing technique based on two-photon polymerization (TPP) has undergone significant advancements. Its exceptional features, including 3D capabilities, subdiffraction-level resolution, material adaptability, and gentle processing conditions, have rendered it highly suitable for numerous applications in photonics and biosciences. TPP has found extensive use in the development of technological devices, owing to its diverse range of advantages. This technique harnesses high-intensity pulse lasers, enabling the observation of nonlinear optical effects within the irradiated sample. Furthermore, the polymerization process occurs in a small volume, limited to the vicinity of the focal spot, resulting in exceptionally fine resolution for the sculpted structures. While this technique has advantages such as high resolution and non-contact printing, it also has disadvantages such as low printing speed and specific material selection for printing [18,19,20].
Finally, laser ablation is a materials processing technique that involves using a high-energy laser beam to remove or etch material from a solid surface. The method consists of a high-energy laser beam focused on a target material’s surface. Then, the intense energy of the laser causes the material to vaporize or sublimate rapidly. As the material is removed, it forms a plasma plume of ionized particles. Laser ablation is used to create microstructures and patterns on various materials, including metals, ceramics, and polymers. This technique has advantages such as precision, minimal heat zones, and a non-contact process. However, it requires safety precautions due to the high-energy lasers involved, has material compatibility issues, and has a high cost due to the high-powered lasers [21,22].
Controlling the surface quality of MFDs at such small scales poses significant challenges. Studies by Dai and Li (2014) have demonstrated that the surface topography of microfluidic devices affects the flow behavior within them. Dharaiya and Kandlikar (2013) have highlighted the beneficial role of microscopic surface irregularities in heat and mass transfer. Yuan and Tao (2016) have reported that surface roughness influences the pressure distribution along microchannels, which is directly proportional to the mass flow rate of the fluid [23,24,25].
The roughness of microchannel surfaces is key to the performance of MFDs, impacting the resistance or friction factor between the microchannels and the flowing fluid [26]. The friction factor represents the pressure loss within a pipeline, resulting from the interaction between the fluid and the surface (Figure 1a). Higher roughness values correspond to increased friction factors and more irregular and agitated flow (Figure 1b) [23]. Conversely, lower roughness values yield lower friction factors, with less impact on the flow (Figure 1c). The transition from laminar to turbulent flow occurs at a critical Reynolds number of R e = 2300 [25].
R e = ρ u x D μ ,
where ρ is the fluid density with units of ( K g m 3 ), u x is the speed flow ( m s ) , D is hydraulic diameters (m), and μ is the fluid dynamic viscosity with units of ( P a · s ). Hence, the design, geometry, and roughness of MFDs are key in their characteristics and system functionalities [27]. Given the inherent roughness of microchannel surfaces across various manufacturing methods, it is important to investigate roughness effects on flow behavior for the many applications in which microfluidic devices can be employed [28].
Our research group aims to develop microfluidic devices (MFDs) for the production of hydrogel microparticles using polyethylene glycol diacrylate (PEGDA) [29,30,31,32], which find extensive applications across various fields. The choice of MFD fabrication methods significantly influences the size, stability, and homogeneity of these microparticles. Therefore, our primary research objective is to analyze three different fabrication methodologies for MFDs and evaluate their impact on topography and surface roughness.
The three fabrication methods under investigation are as follows: (1) PDMS (polydimethylsiloxane) lithography, (2) PLA (polylactic acid) printing, and (3) UV (ultraviolet) resin printing. We employ image analysis techniques to characterize the topography of specific microfluidic device areas. Additionally, computational fluid dynamics analysis is utilized to assess the effect of surface roughness on flow behavior within the microchannels. By systematically comparing the fabrication methods and analyzing the resulting topography, our study aims to provide insights into the relationship between MFD fabrication techniques and surface roughness. The findings will contribute to optimizing the production of hydrogel microparticles and enhancing their performance in various applications.
Overall, our research focuses on investigating the impact of different MFD fabrication methodologies on surface roughness, and, subsequently, understanding their influence on flow behavior within the microchannels, in addition to implementing a PLA filament for the PDMS lithography method instead of the conventionally used SU-8 for the fabrication of an MFD. This analysis will enable us to advance the development of MFDs for the production of hydrogel microparticles with improved size control, stability, and monodispersity.

2. Materials and Methods

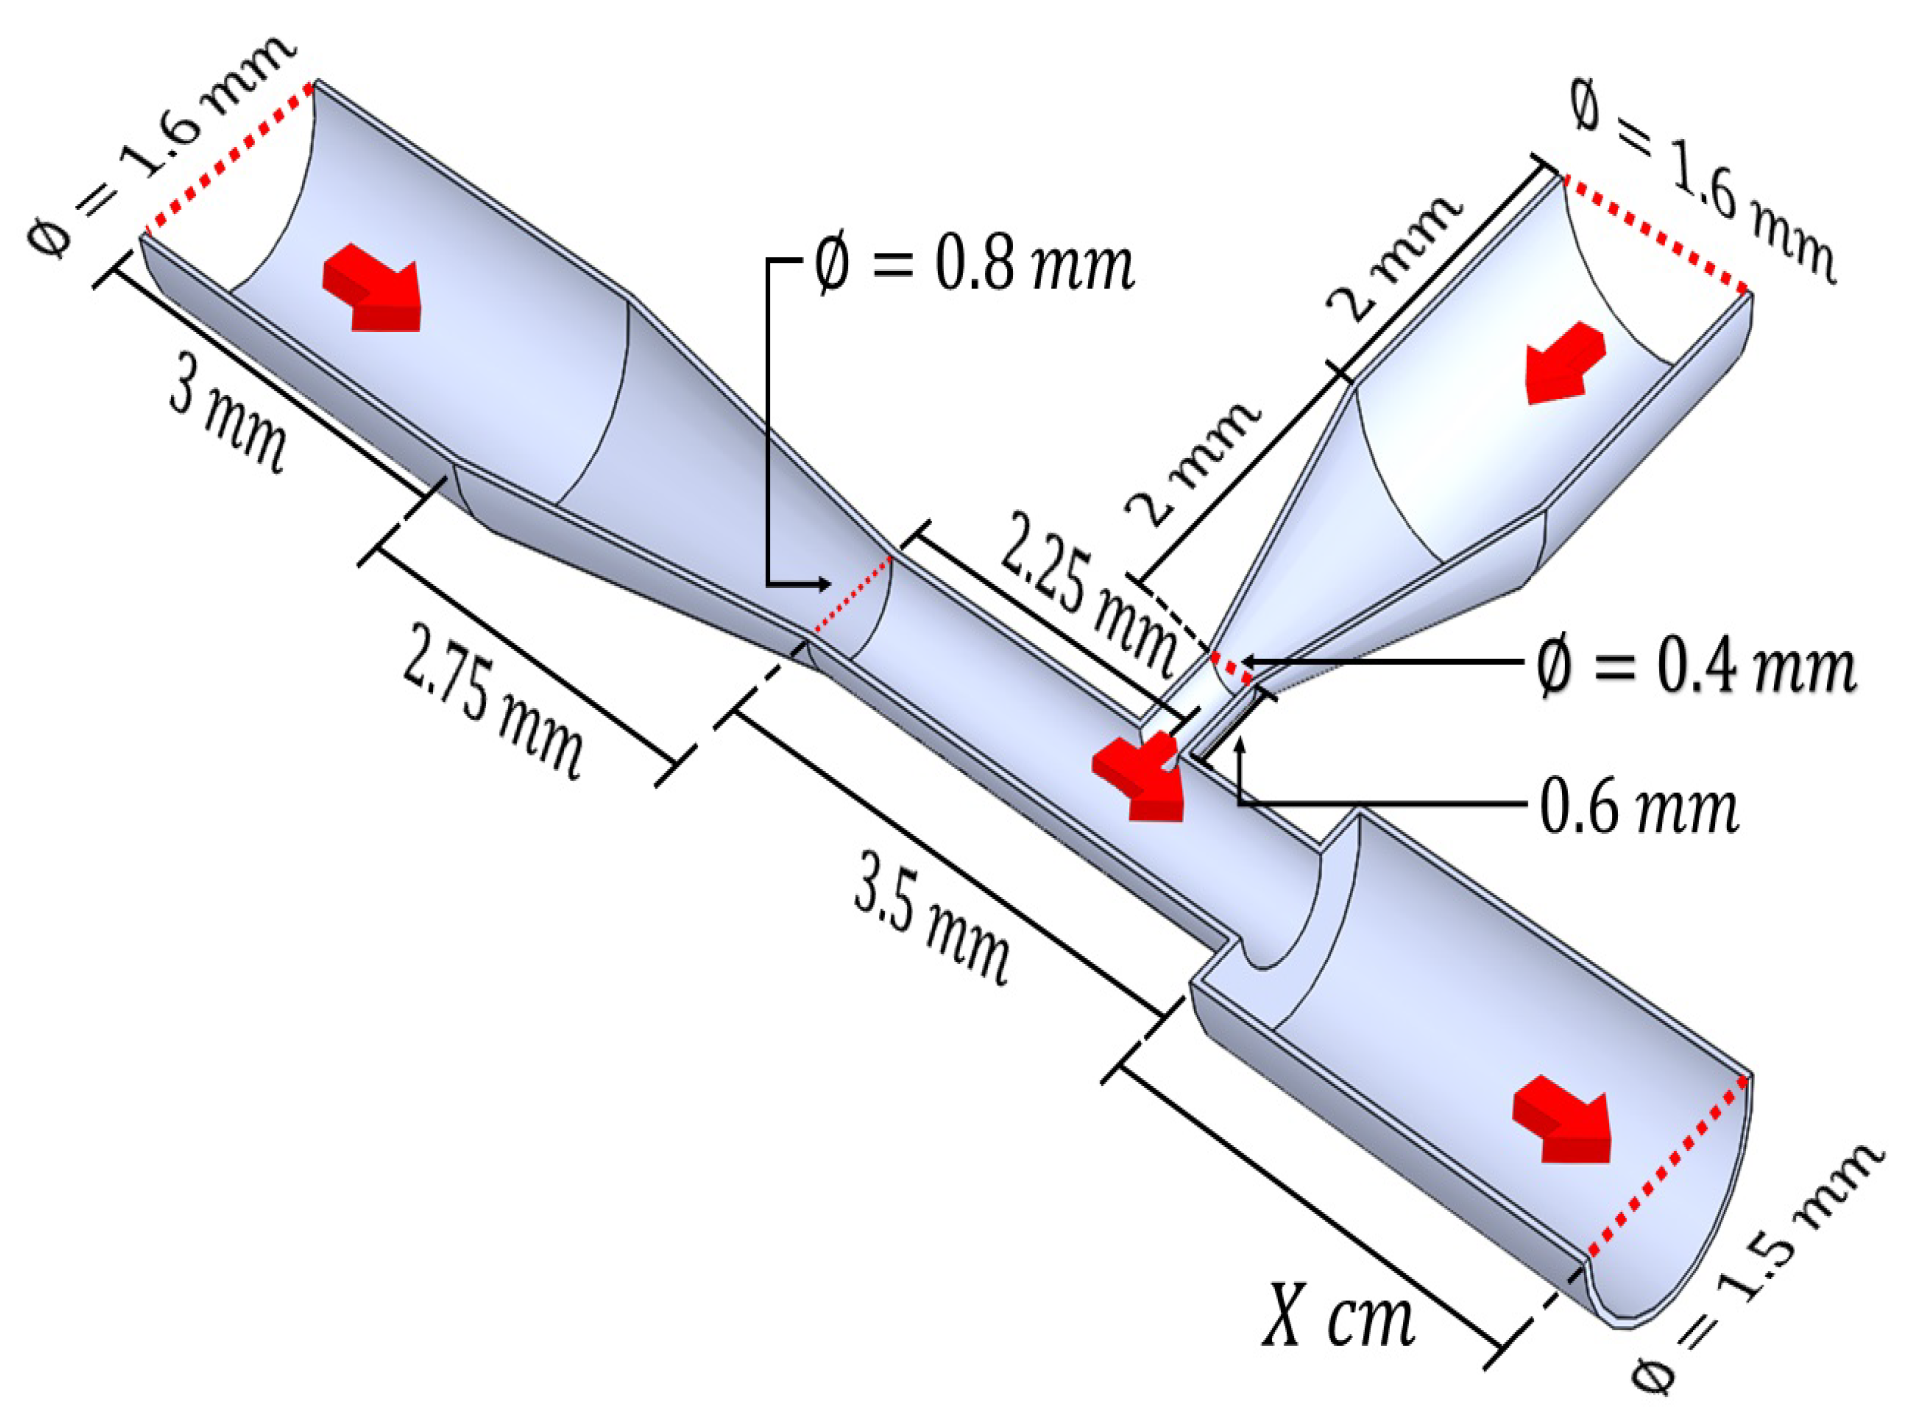
2.1. Microfluid Device Design

The microfluidic device used for the production of PEGDA microparticles is divided into four zones, as shown in Figure 2a. I. Inlet zone: in this zone, the microchannels are designed with similar diameters to the injection tubes in order to avoid pressure variation. II. Droplet generation zone: a T-junction is used, as shown in Figure 2b. The microchannels have a diameter ration of 1:2 for dispersed phase flow ( ϕ Q d ) and continuous phase flow ( ϕ Q c ), respectively. III. Photopolymerization zone: the polymerization zone length is designed according to the required time to reach a short gelation time [33]. IV. The outlet zone: in this zone, the final diameter is enlarged to provide an easy way to collect the hydrogel microparticles.

2.2. MFD Fabrication Materials and Methods

There are several methods for microfluidic device fabrication. Three of them are analyzed in the present work, for ease of manufacturing in the Bioinformatics and Metabolic Engineering Laboratory at the Universidad de Guadalajara. The microfluidic device used in this analysis features the same design for the 3 different fabrication methods (Figure 3).

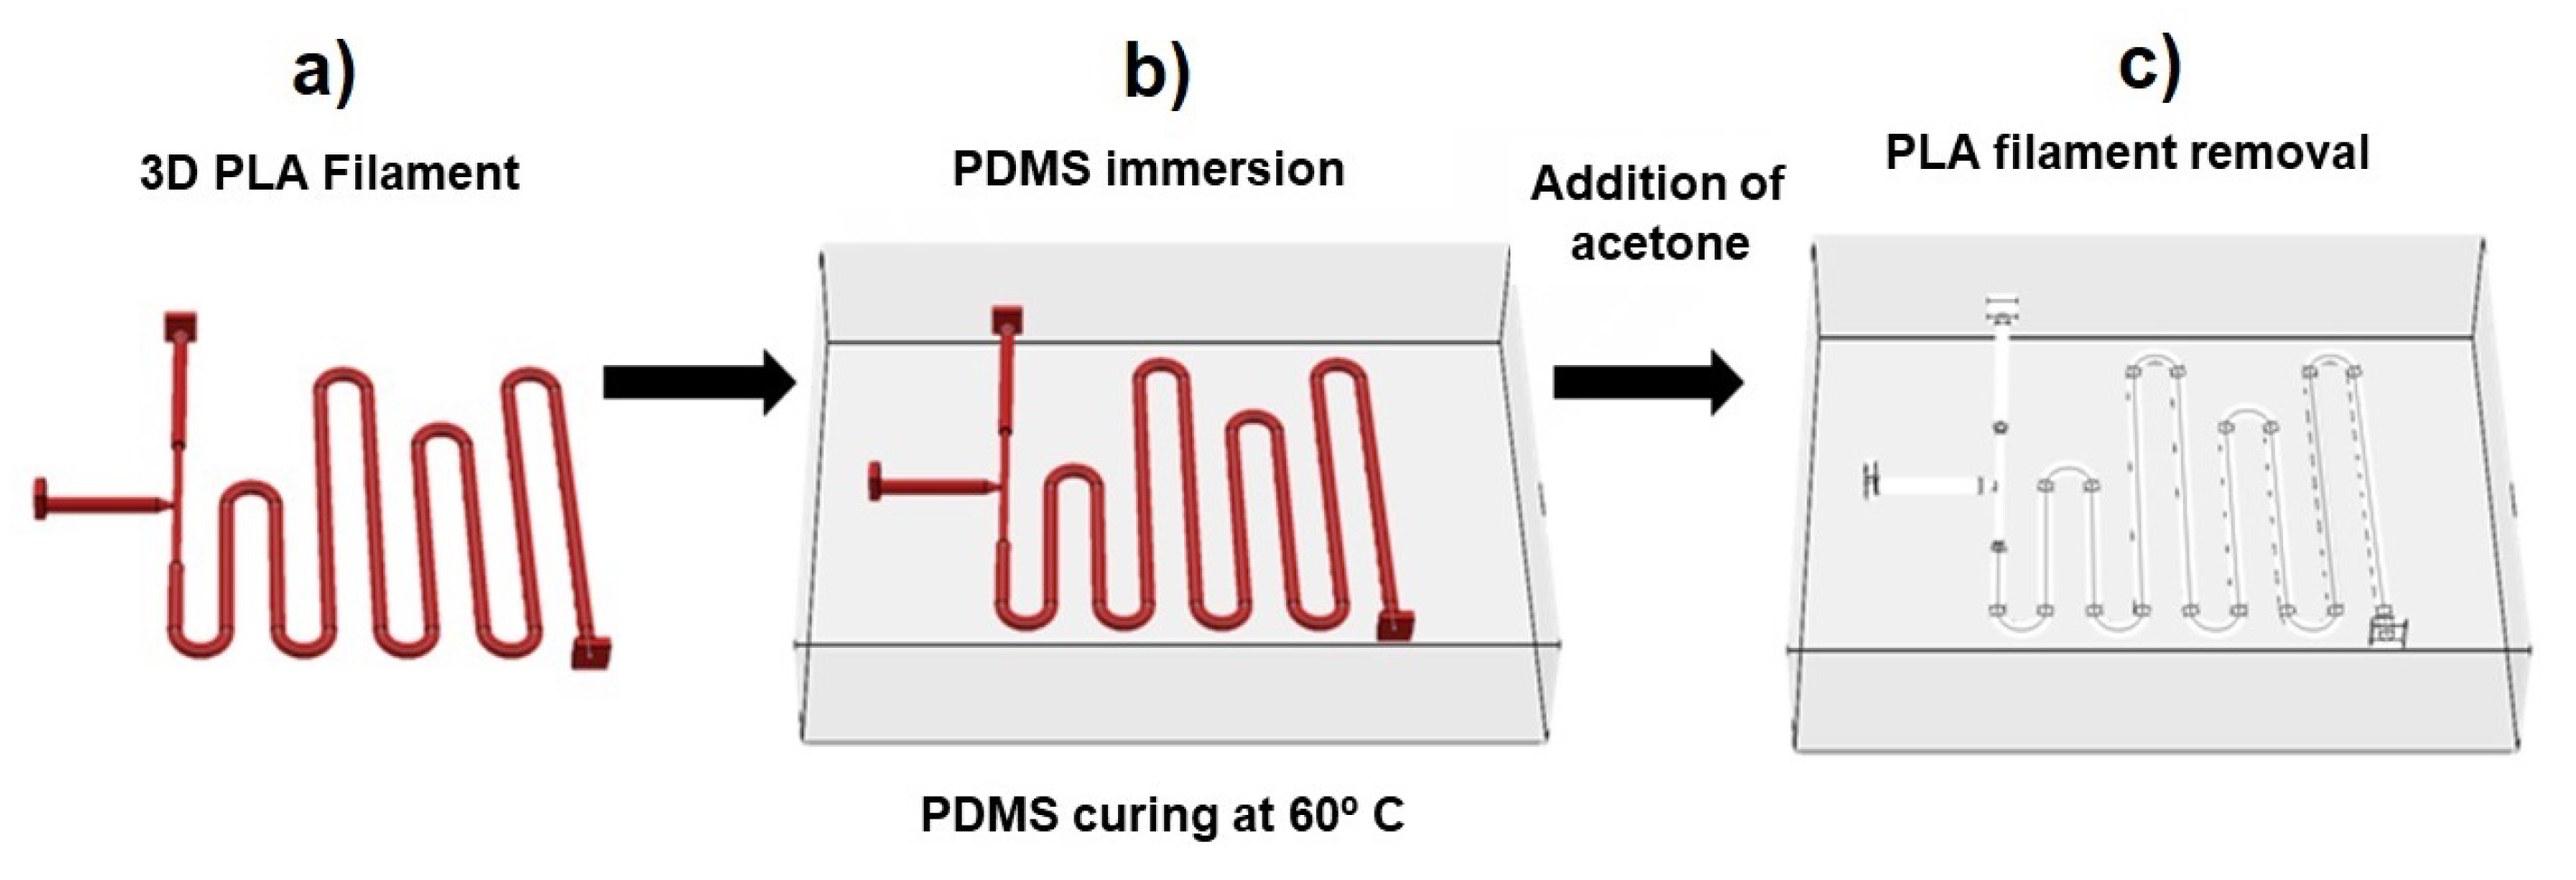
2.2.1. Fabrication Method Using Polydimethylsiloxane (PDMS)

PDMS is an inert, transparent, and hydrophobic polymer used for fabrication of MFDs [6]. It requires a curing agent in order to be able to gel. In this research, a ratio of 1:10 of curing agent volume and PDMS was used [34]. These were purchased from Sigma Aldrich as the SYLGARD 182 Silicone Elastomer Kit. The geometry inside the PDMS to obtain the MFD was generated using a PLA filament, which is soluble in acetone (Figure 4a).
The geometry design was carried out using a dedicated design program. Two inlets and one outlet were designed as shown in Figure 3. A path for the microchannel was traced in the shape of a serpentine, with four 2 cm straight lines and five 4 cm straight lines connected by nine 180° curves. A PLA filament was chosen, Polymaker brand, transparent, and red PolySmooth color, with a density of 1.24 g/cm 3 and a diameter of 1.75 mm. It was chosen to work with this filament because it is easy to obtain in the laboratory, easy to work with, biodegradable, and visually appreciable. The printer used a 0.4 mm diameter jetting needle and was configured with a printing temperature of 230 °C and a bed temperature of 45 °C, a print-retraction speed of 60 mm/s, and a minimum FAN speed of 70%. The printing profile used was a medium quality one, consisting of a layer height of 0.2 mm, and 4 base layers at the start and end of printing. The fill density was changed to 50% and a zigzag pattern was used.
Once the PDMS solution is prepared, the geometry is completely submerged in it, as show in Figure 4b. Subsequently, the container with the geometry submerged in PDMS is placed in a vacuum camera for 24 h, using a vacuum pump with a capacity of 0.80 m 3 /h and 100 mbar to eliminate all bubbles in the solution. The next step is to heat the container immersed in PDMS to 60 °C in an oven for 6 h to accelerate the curing process. Finally, once the PDMS is solid, it is immersed in acetone to start the filament removal process. Additionally, it was decided to use a stir plate to speed up the process. Once the filament is completely removed, the MFD is ready, as show in Figure 4c.

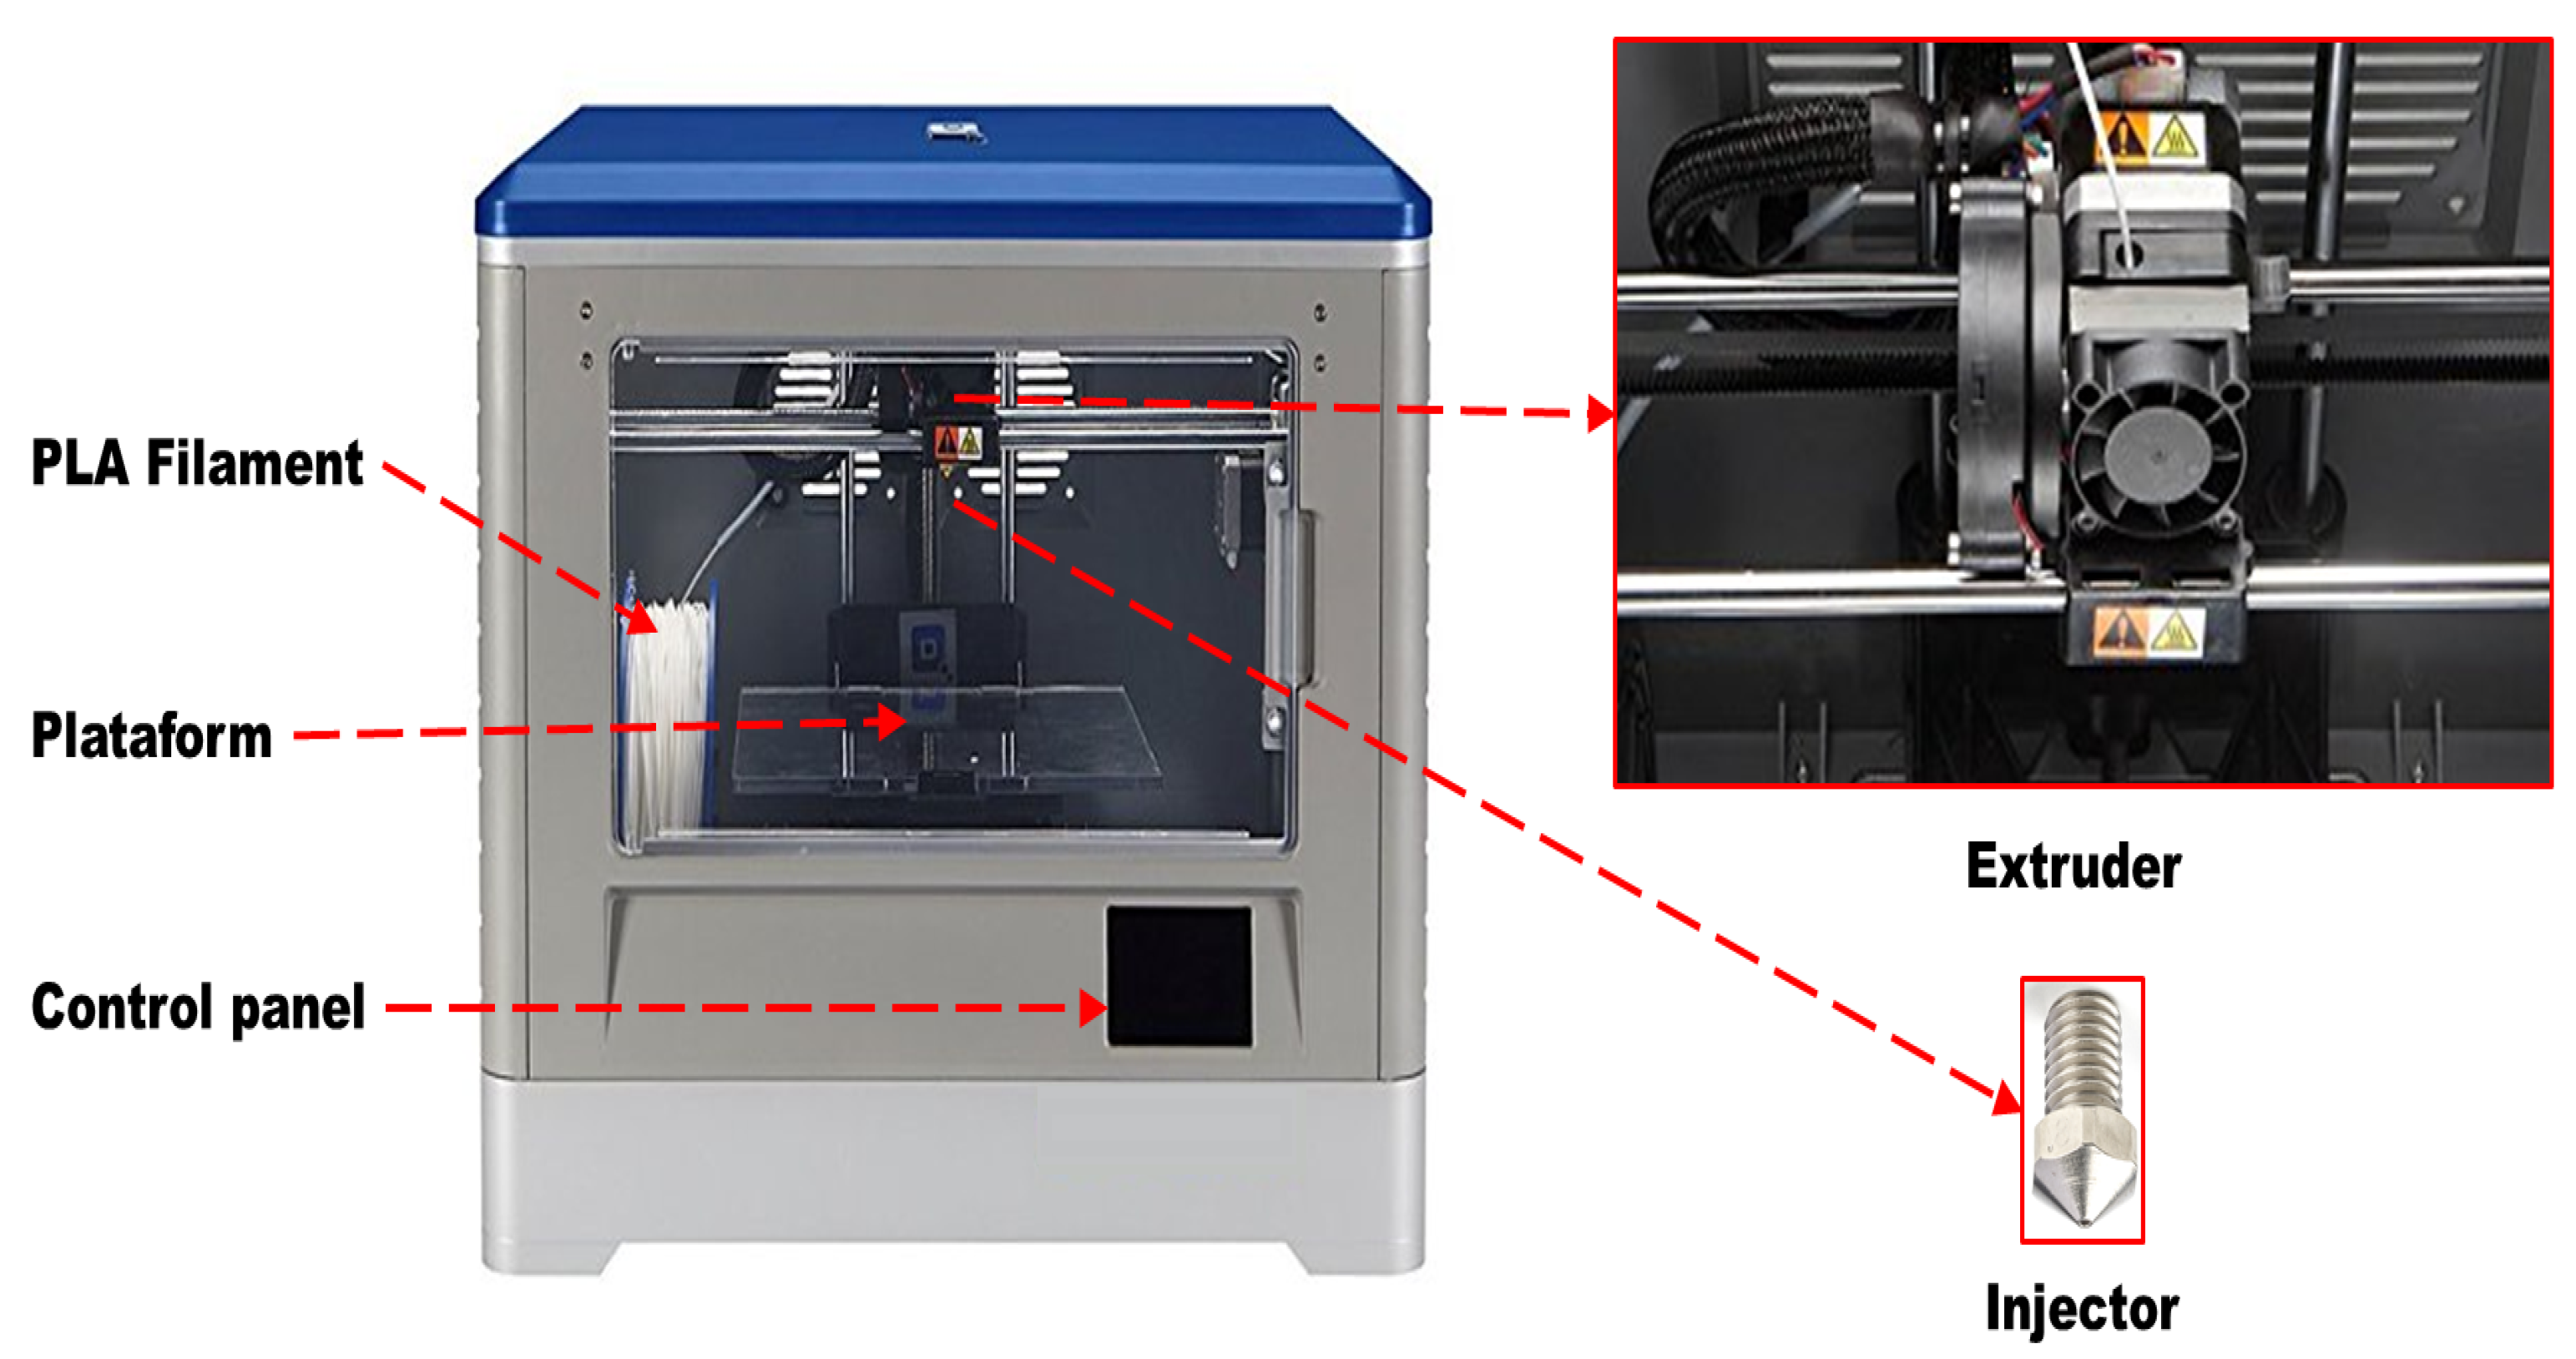
2.2.2. Fabrication Method Using a PLA Filament

An alternative method used for the microfluidic systems generation is through 3D printing using the extrusion technique of a polymeric filament (Figure 5). A PLA (polylactic acid) filament is a natural, recyclable, and biodegradable thermoplastic polyester derived from renewable resources [35]. It is used in a Dremel model 3D20 printer with a transparent PLA filament. The printer is set up for diagonal traces and loaded with the designed MFD model (Figure 3). Once the printing is finished, the MFD obtained is treated with ethyl alcohol. Ethyl alcohol is sprayed with an atomizer on both sides of the MFD and 1 mL of ethyl alcohol is injected into each of the inlets to clean and remove any impurities that may remain inside the channels. Finally, the device is left to dry at room temperature and air is injected for 10 min to eliminate the alcohol residues inside the channels.

2.2.3. Fabrication Method Using Photopolymerizable Resin

The MFD manufacturing process has gone as far as printing in 3D. In this research, an Elegoo Mars Pro printer and Anycubic transparent resin were used to print the MFD model.
The Elegoo Mars Pro printer used is a LCD-based stereolithography (SLA) 3D printer, with a build area of 115 × 65 × 150 mm. This printer has an XY resolution of 47 microns and the layer thickness set in the Z-Axis is 30 μ m. Its printing speed ranges from 20 to 30 mm/h and it uses an integrated UV light source of 405 nm wavelength. The resin used is a transparent color 3D-printing UV-sensitive basic resin Anycubic brand. This resin has a viscosity of 552 MPa, shrinkage of 7.1%, tensile strength of 23.4 MPa, elongation at break of 14.2% and a cure time of 3–15 s.
The Elegoo printer is configured with 8 s exposure time for the resin used and a 0.03 mm thick layer printing. To perform the printing, the designed model shown in Figure 3 is edited and saved in an appropriate printing format. Before starting the impression, the printing platform of the Elegoo printer is calibrated and the resin container is filled with 100 mL of Anycubic resin (Figure 6). At the end of the printing, the platform is dismounted from the equipment and all the resin excess is removed. To eliminate the resin inside the MFD channels, isopropyl alcohol is injected through both inlets until the resin is completely expulsed. Once the resin excess has been removed from the channels, air is injected for 10 min to ensure that no liquid remains inside and the microfluid device is ready to use.
The three devices obtained with different fabrication methods are shown in Figure 7. The devices are compared for analysis in the following sections.

2.3. Modeling

According to Figure 3, the MFD has 2 inputs for the injection of the Q c and Q d flows and one output for the collection of the microparticles generated. The MFD was designed with a diameter of 1.6 mm for each input, and a channel length of 3 mm for the Q c and 2 mm for the Q d . A conical reduction is applied for each channel decrease, with a length of 2.75 mm and a new diameter of 0.8 mm for the Q c line, while the reduction length is 2 mm with a new diameter of 0.4 mm for the Q d . The microchannels with new diameters for the Q c and Q d flows continue for 3.5 mm and 0.6 mm, respectively. The T-junction microchannels crossing occurs at 2.25 mm along the length of the Q c line. Just 1.25 mm after the generation zone (T-junction), the microchannels expand immediately to a diameter of 1.5 mm in order to avoid handling high pressures once the microparticles are formed (Figure 8). The channel with the new diameter and 30 cm length forms the photopolymerization zone. This zone has 4 turns with a 180° angle. Additionally, adaptations were added to each input and outlet of the MFD with a length of 5 mm, as shown in Figure 3, in order to couple the injection tubes and avoid leaks. The design used in the present research proved to be useful, in a simulated and practical way, for the microparticles generation, and therefore the model was selected to carry out the three MFD fabrication methods comparison.
For a better MFD microchannel surface roughness analysis and its effect on the generation of macroparticles, a series of simulations were performed with Computational Fluid Dynamics (CFD) Software COMSOL 5.6. In order to achieve greater certainty in the analysis, the actual properties of each fluid used are presented in Table 1.
The flow rates for the continuous and dispersed phase flows were 0.25 mL/min and 0.025 mL/min, respectively. These values were obtained experimentally according to the continuous microparticles generation.
Two interfaces are used in the study, one for laminar flow and the other for level adjustment. Due to the flow study nature in the microparticles generation using two immiscible fluids, Navier–Stokes Equations (2) and (4) are used. In Equation (2), the F s t term represents the surface tension force between the two immiscible fluids (mineral oil and PEGDA prepolymeric solution) with a value of 36 mN/m [36]. When working with immiscible fluids, a level adjustment (Equation (3)) is necessary to adjust the level set variable, ϕ , which takes values between 0 and >0.5 for the continuous phase and <0.5 to 1 for the dispersed phase [37,38,39].
ρ u t + ρ ( u · ) u = · [ p I + μ ( u + ( u ) T ) ] + F s t ,
ρ ϕ t + u · ϕ = γ · ( ϵ ϕ ϕ ( 1 ϕ ) ϕ | ϕ | ) .
· u = 0 ,
where:
  • u = velocity (m/s);
  • t = time (s);
  • P = pressure (Pa);
  • F s t = interfacial tension force (mN/m);
  • I = identity square matrix (order 3);
  • T = matrix transposition;
  • ϕ = level set function;
  • γ = reset parameter;
  • ϵ = thickness control parameter.
As can be observed, the equations of each interface require, in addition, different parameters necessary to adjust and control the operating conditions that must be specified for the correct simulation of the generation of mps. One of these parameters is the level set function, which is represented by Equations (5) and (6), which acquires different values depending on the fluid to which it refers.
ϕ 0 = 1 1 + e D w i ϵ
where D w i is the distance to the initial interface. Thus, at the beginning of the simulation, when the flows are not yet mixed to form the droplet, D w i can be considered a large value. Typically, therefore, fluid 1 is given a value of ϕ = 0, being then the mobile (oily) phase, while fluid 2 has a value of ϕ = 1, being the dispersed (aqueous) phase.
Other parameters required for the simulation are density and dynamic viscosity. Although the fluids are immiscible and have different densities and/or viscosities, the simulation requires a modified value for the level set function to define the boundary conditions between the two liquids. Equations (7) and (8) are used to obtain the modified value of the density and dynamic viscosity of each fluid by the program. In this way, the density and viscosity of fluid 1 or 2 will have a minimal but real alteration on the surface of the formed mps considered in the simulation calculations.
ρ = ρ 1 + ( ρ 2 ρ 1 ) ϕ
μ = μ 1 + ( μ 2 μ 1 ) ϕ
Finally, the surface tension force parameter is affected by the curvature that is generated when the two fluids come into contact, and the mobile phase begins to drag the dispersed phase until the microdroplet is generated. In addition, this process is also influenced by the surface gradient factor since the initial contact surface of the dispersed phase is smaller than the contact surface of the generated microdroplet. Thus, Equation (9) represents the surface tension force plus the interface of the dispersed phase and the mobile phase with respect to the curvature of the microdroplet.
F s t = σ δ k n + δ s σ
s = ( I n n T )
δ = 6 | ϕ | | ϕ ( 1 ϕ ) |
σ = 2 2 3 λ ϵ
k = · n
where:
  • σ = coefficient of surface tension (N/m);
  • n = unit normal to the interface;
  • k = curvature;
  • δ = delta of Dirac located at the interface (m 1 );
  • s = gradient surface operator.
Additionally, a schematic diagram demonstrating the application of the government equation and boundary conditions for the simulations is shown below (Figure 9). The level set function will hold the boundaries of Q d according to the conditions and characteristics processed by the above equations. Once the boundary conditions are obtained, the program performs a series of iterations to obtain the Q d magnitude in interaction with the Q c . Finally, due to the boundaries processed by the level set function in interaction with continuous fluids governed by the Navier–Stokes Equation (2), spherically delineated interfaces are obtained due to the nature of the fluids. The advantage of the level set method is that numerical calculations involving curves and surfaces can be performed on a fixed Cartesian grid without having to parameterize these objects, which makes it useful for this continuum system.

3. Results

Images of the microfluidic device sections fabricated with the different methods were obtained using an optical microscope and scanning electron microscopy (SEM). Three significant sections in the MFD were selected for the analysis: the T-junction, curved section, and straight section. Each one of the MFD segments was cut in half after being printed. Halved samples were sonicated in distilled water for SEM analysis. Additionally, Figure 10 shows the cut of the front section of the microchannel fabricated with the three methods mentioned above.
The layers of the microchannel fabricated by the UV resin method are abundant and consistent, with small irregularities on the surface. The PLA filament method shows few layers with a considerable thickness (greater than 100 μ m), generating large rungs between steps and irregularities in the layers. The proposed PDMS lithography method using a PLA filament for the generation of the microchannel reveals an excellent coupling of the PDMS to the PLA filament; however, the generated microchannel exposes large irregularities on its surface due to the deposition of the PLA filament used, generating a jagged geometry on the walls of the microchannel.
The scanning electron microscope was adjusted to use values of 15.0 kV for the accelerating voltage for the electrons (HV), 30 mm for focal length of the objective lens (WD), 1.2 to 6 mm for the field of view, and 50× to 180× for the magnification scale. The optical microscope objective lenses used were 4.0×/ 0.10 and 10×/0.25 with brightfield (BF) contrast illumination.

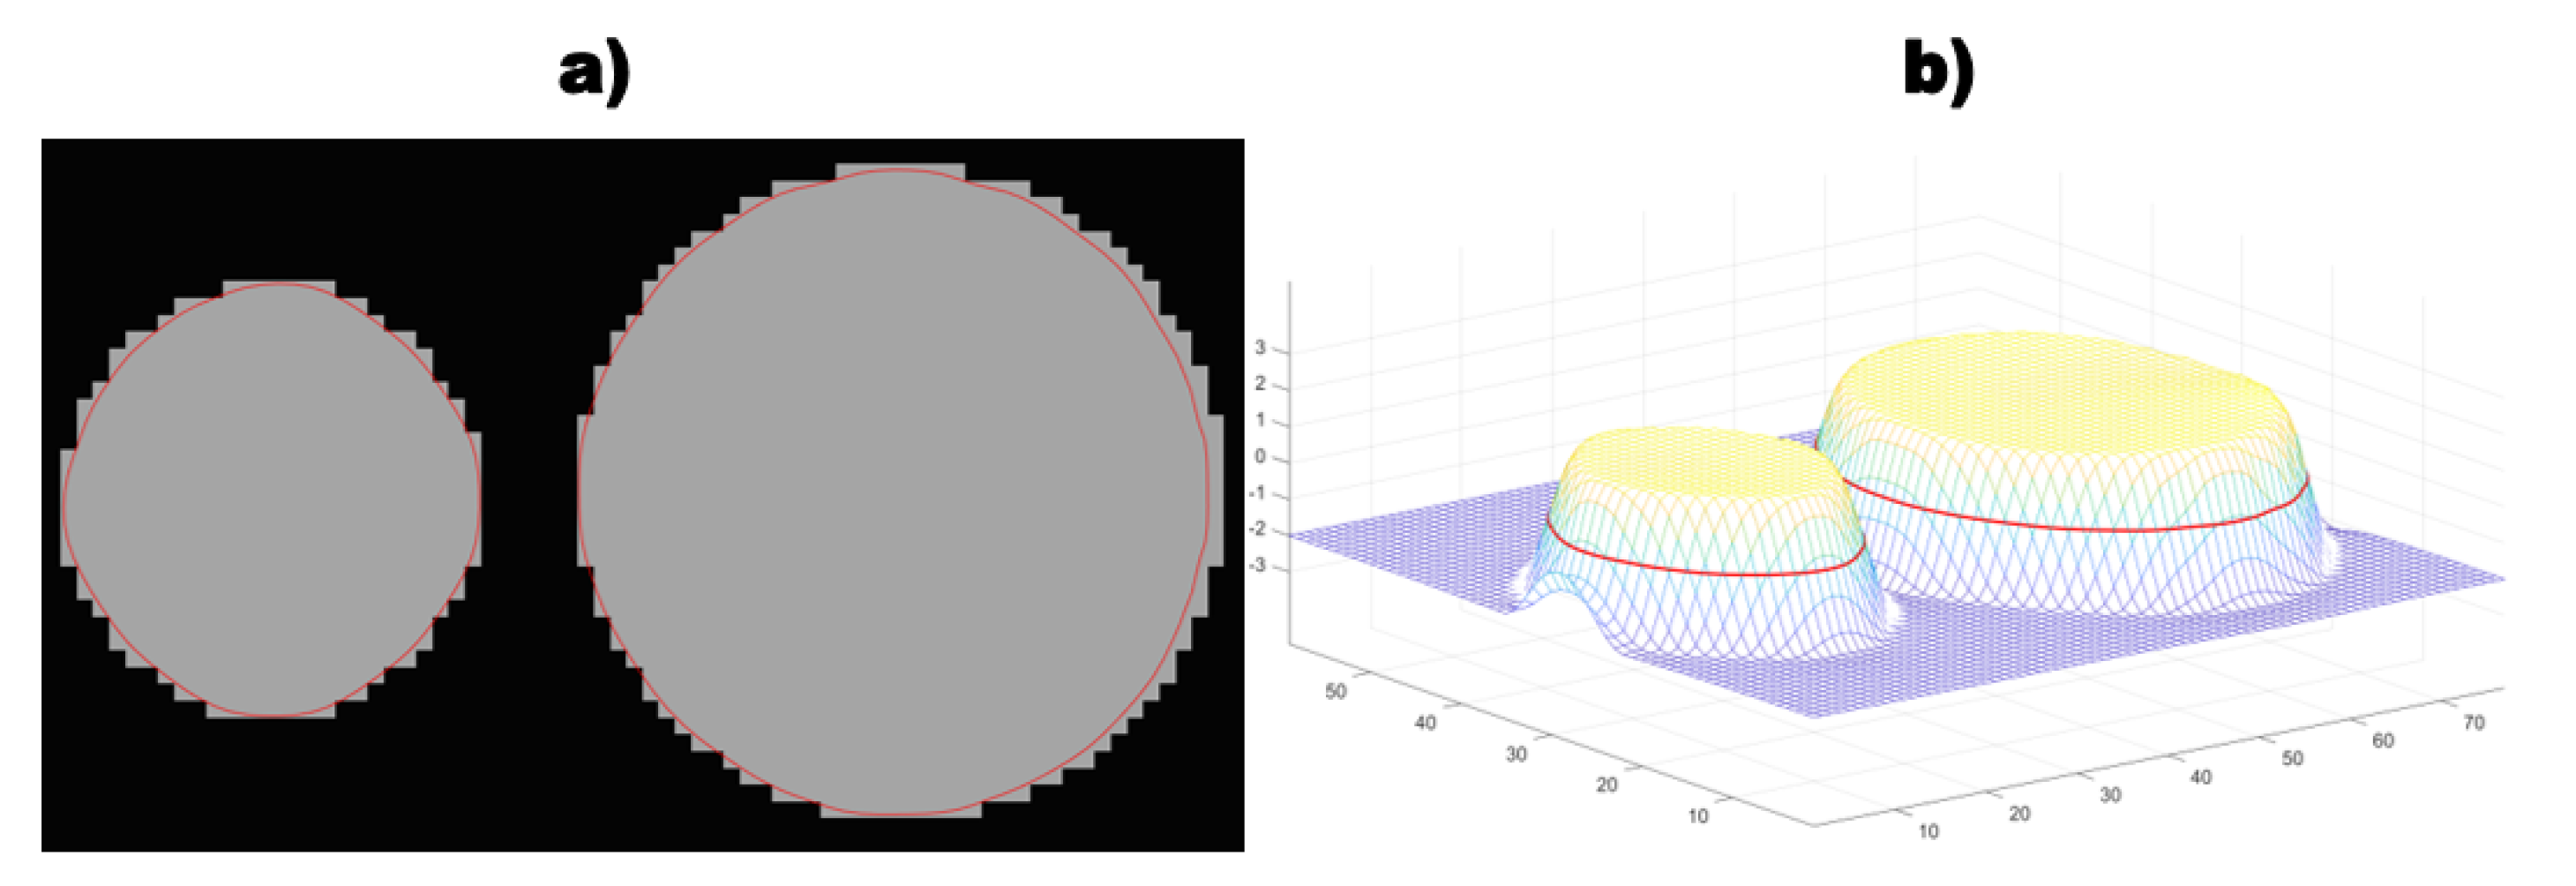
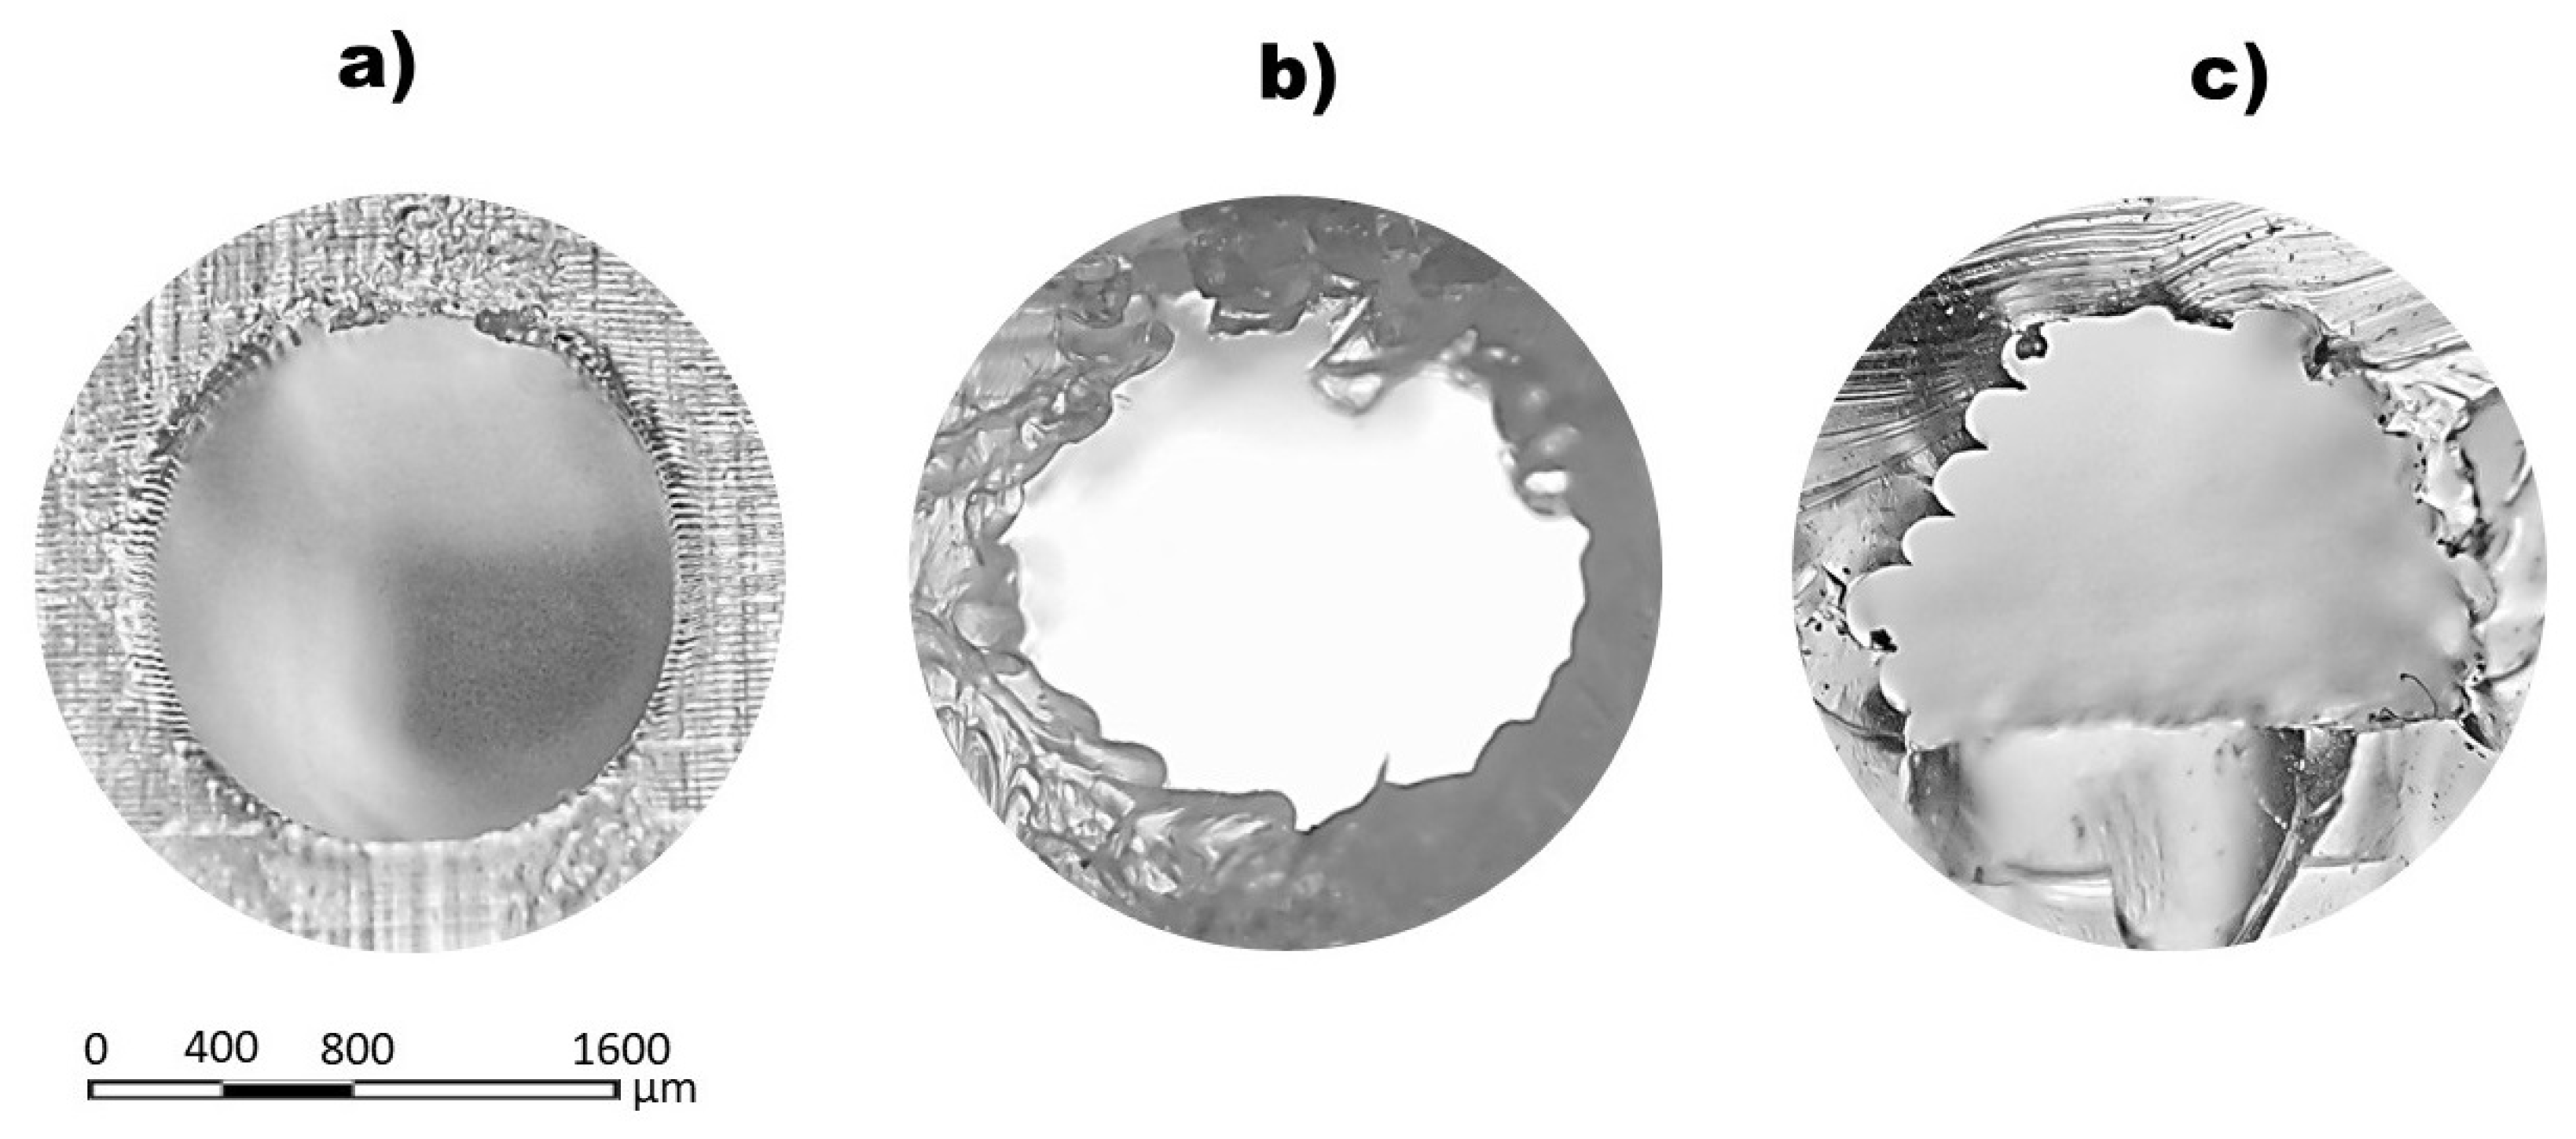
3.1. PDMS Image Analysis

The T-junction section for the PDMS-fabricated MFD shows a lack of symmetry and inconsistency in the conical reduction (Figure 11a). The surface shows a large step in conical reduction, and, furthermore, it shows a discontinuous stepwise tapering. The MFD curved section is an area that presents considerable roughness related to the fabrication method implemented. The PDMS-fabricated MFD shows a stepped surface relief (Figure 11b), where each step does not seem to present a considerable roughness. However, it shows how the surface conserves a continuous roughness over the entire fabricated section. The MFD straight section roughness is lower than the previous sections since the geometry is not complex for its fabrication. The PDMS microfluidic device relief is stepped; however, on this occasion, Figure 11c does not show outstanding roughness on the microchannel surface. Irregularity and imperfections are observed on the microchannel surface; nevertheless, compared with previous sections, the roughness is apparently minor.

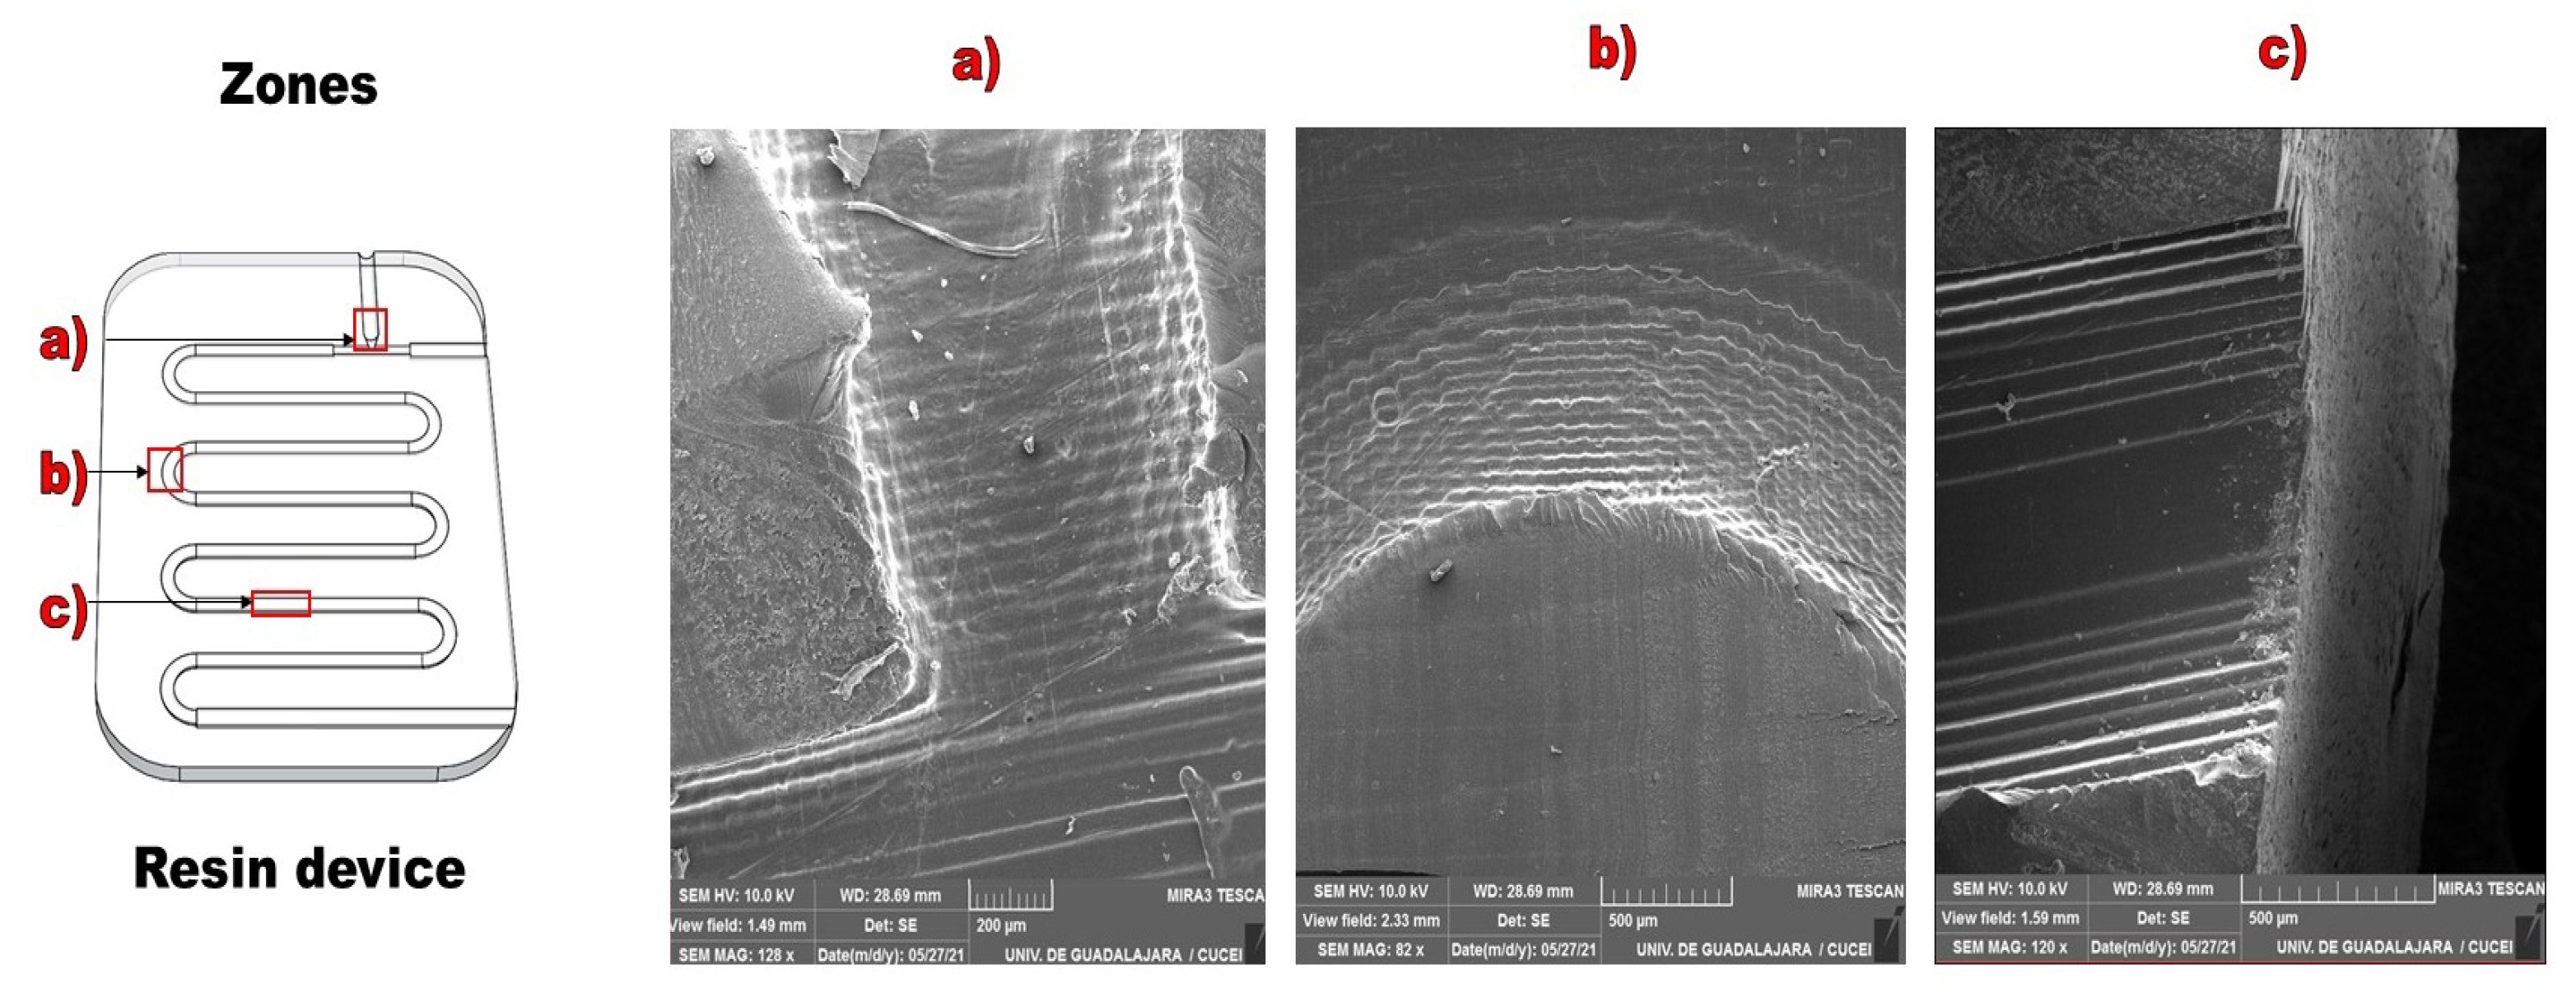
3.2. PLA Image Analysis

The MFD fabricated with PLA shows overlapping layers forming the microchannels. The conical reduction was successfully printed; however, the T-junction should have straight edges forming a 90° angle without a curved union between microchannels, as show in Figure 12a. A T-junction with such pronounced curvature at the microchannels intersection will lead to problems in flow manipulation. The MFD manufactured with PLA shows a uniform geometry in the upper layers; however, the lower layers that form the microchannel base show irregularities and deficiencies in the PLA filament deposition (Figure 12b). The microchannel surface observed at higher magnification exposes its roughness, showing small grooves and irregular relief. The greater consistency in the upper layers of the PLA MFD is a flow advantage; however, the lower layers still show irregularities (Figure 12c). It is possible to appreciate a cavity between each filament PLA layer. This cavity is constant along the entire MFD microchannel.

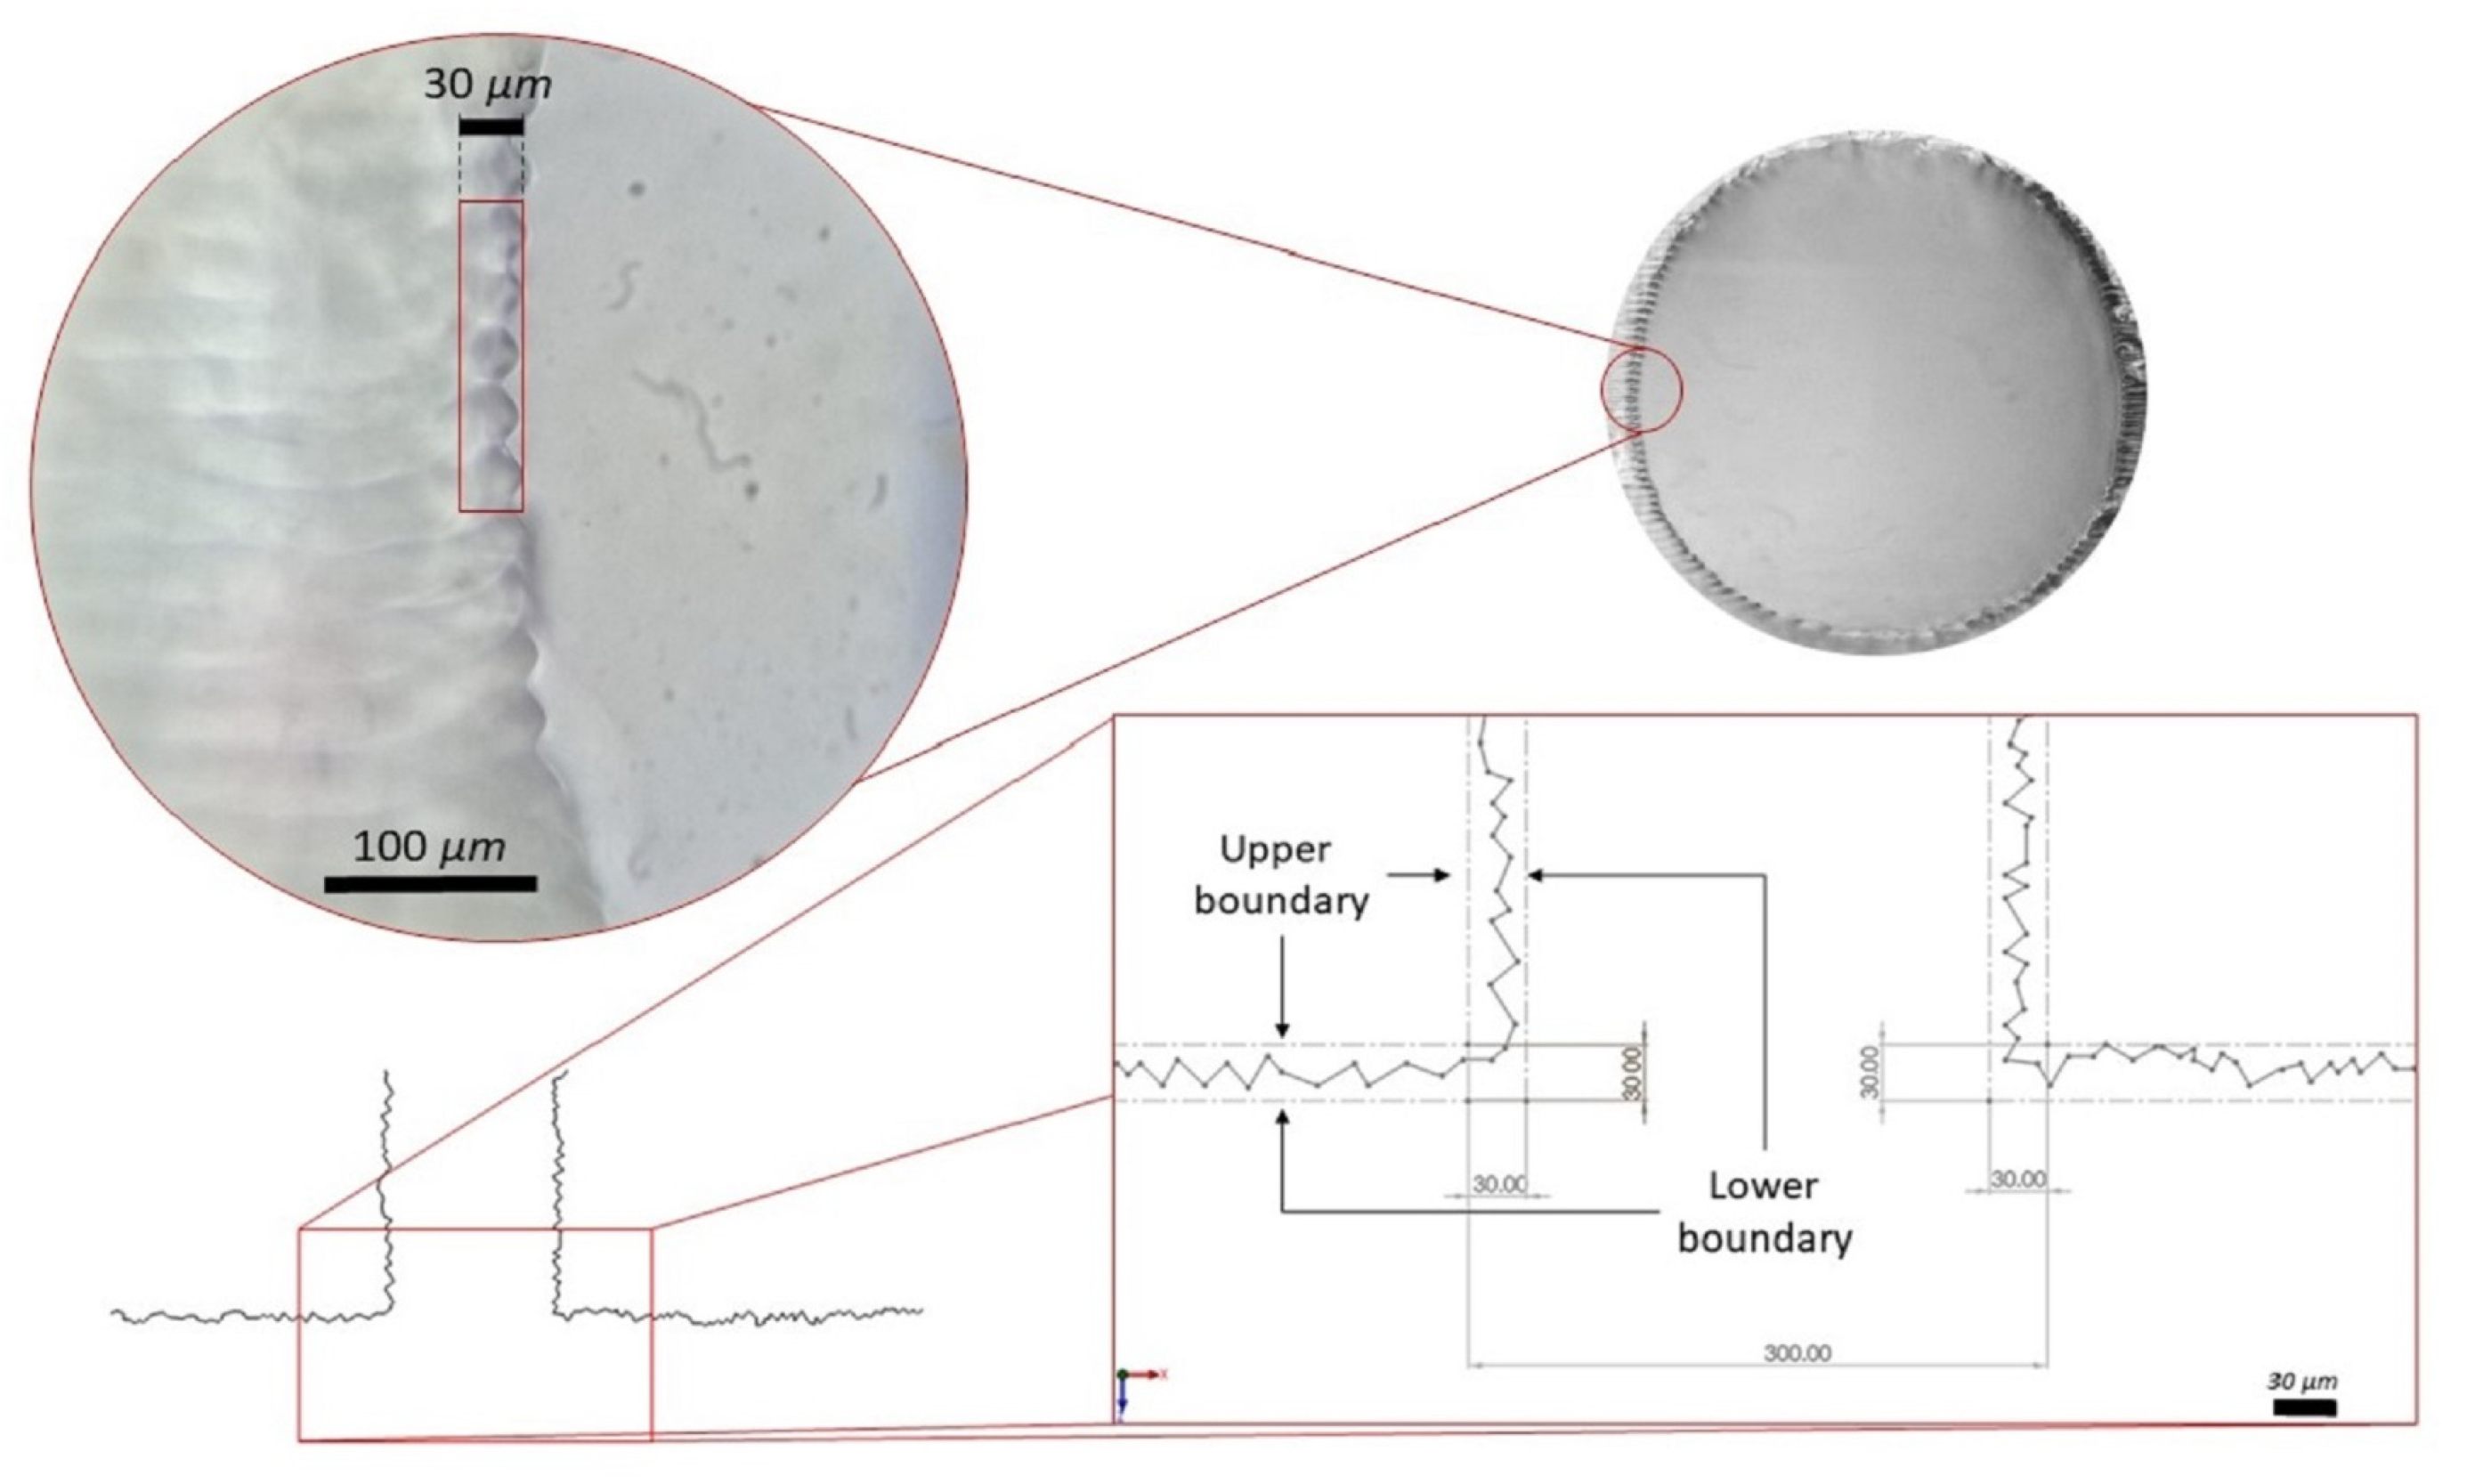
3.3. UV Resin Image Analysis
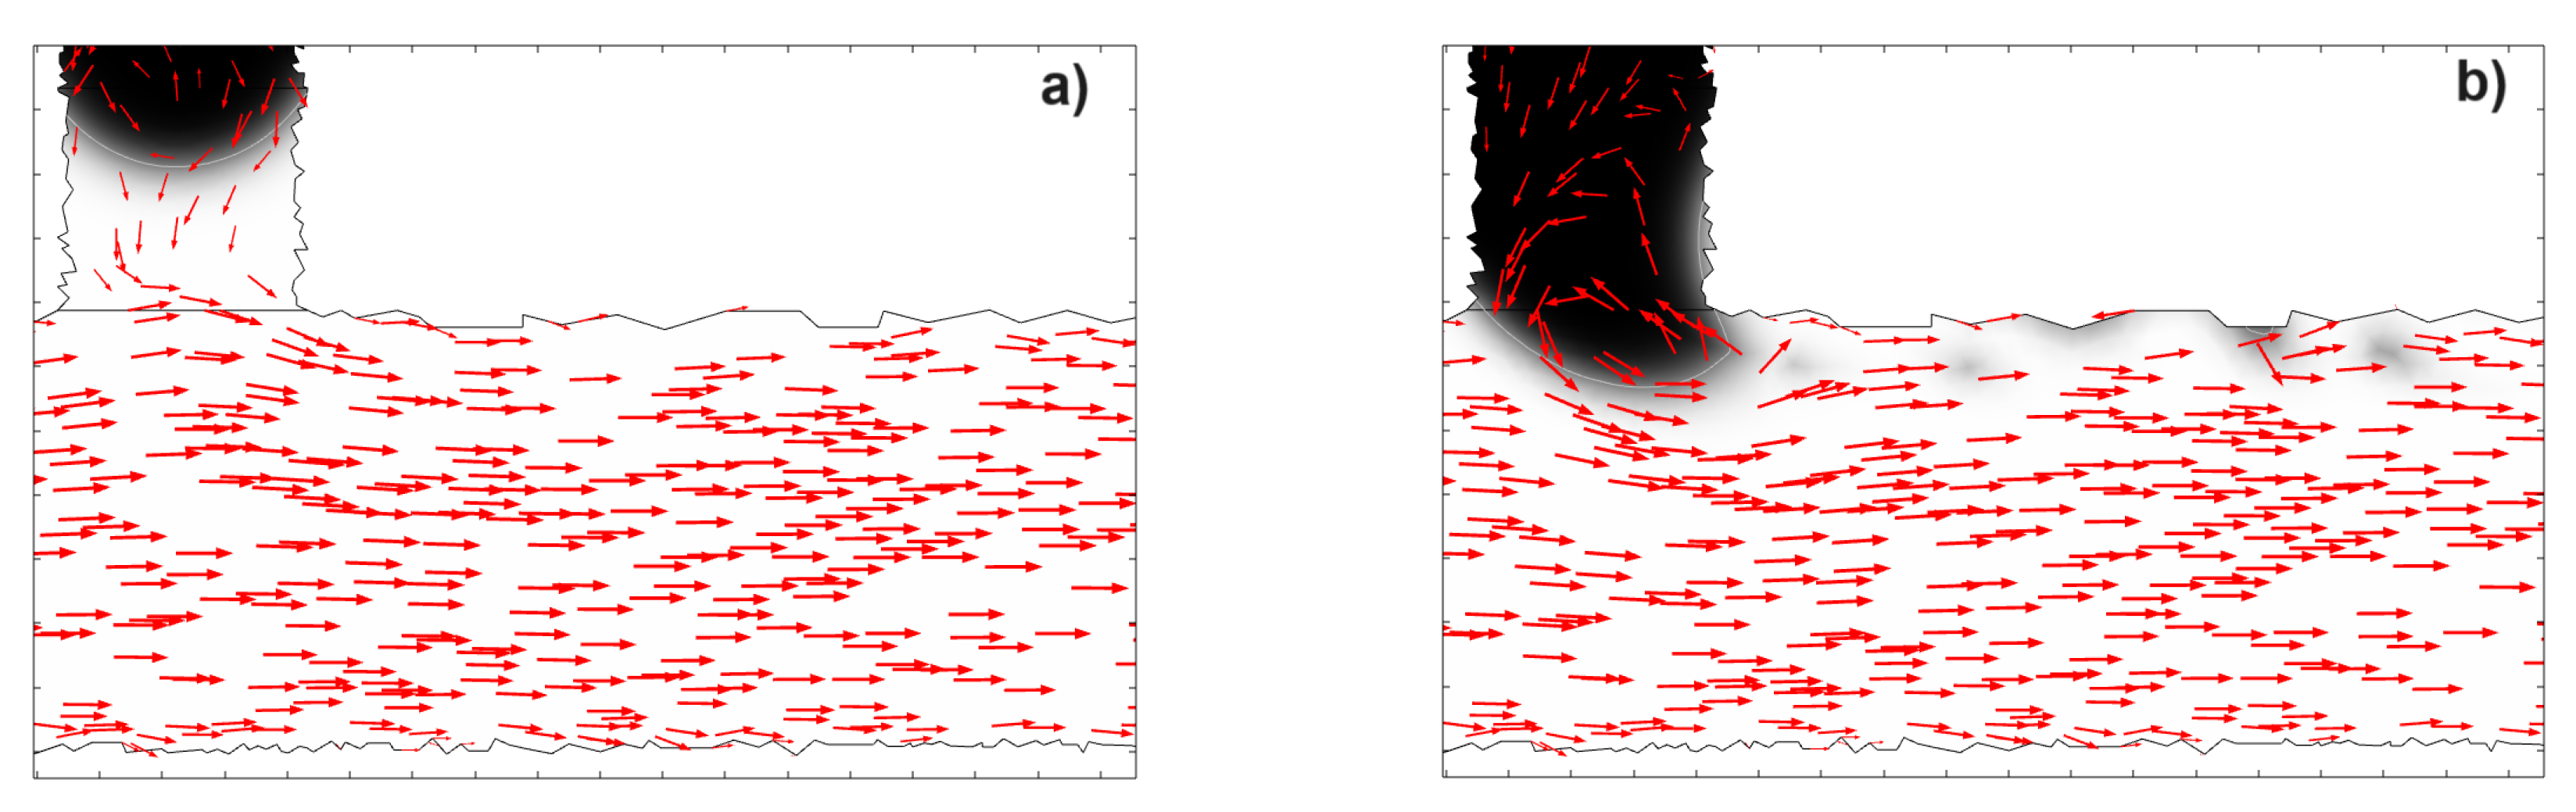
The MFD with UV resin shows a continuous conical reduction without irregularities (Figure 13a). The T-junction between microchannels show partially straight edges that allow the formation of a 90° angle. The microchannel surface observed shows layers overlapping on top of it, such as steps, which generate roughness for both microchannels. The UV resin microchannel shows a greater number of layers than the other two methods above (Figure 13b). The curved section demonstrates a greater amount of irregularities and roughness. Each of the layers that make up the curvature is unequal and its contour presents a serrated geometry. Finally, the MFD fabricated with UV resin shows consistency in the printed layers, observed in Figure 13c, which represents lineal and uniform strokes. Figure 13c shows that there is no cavity between the layers, and the microchannel surface has no prominent roughness or irregularities. Although the layers show a stepped impression, each layer surface does not present a significant roughness in this section.
The roughness shown in the MFD fabricated with PDMS is attributed to the type of filament used for microchannel generation inside the MFD and to its printing quality. This filament is used for device fabrication by PLA extrusion; therefore, the roughness shown by it is not only related to printing quality but also to the cooling time between layers and filament malleability. The MFD manufactured with resin shows stepped sections as a result of the printing method, which overlaps layers to generate the structure. These layers overlapping implies a reduction in the smoothness that can be found between each printed edge.

3.4. Simulation

The simulation reported in the present work was performed using COMSOL 5.6 multiphysics software. The geometry applied for the computational model is shown as a T-junction used in the microparticles generation. The simulated section diameters and lengths have the same dimensions as the T-junction designed for the present investigation (Figure 8). The T-junction was simulated from the microchannel reduction edge to use the smaller diameters. The simulations presented in this research were performed with a surface roughness based on the printer resolution of the UV resin method used, as shown in Figure 14. Therefore, the simulated roughness was represented by superficial alterations with a maximum average value of 30 μ m. A lower limit and an upper limit with a separation of 30 μ m were used. These limits delimited the area where the traces were made to draw the model used in the simulation.
Flow analysis for the T-junction MFD demonstrates immiscible phase behavior when two phases interact. Figure 15, Figure 16 and Figure 17 represents the flow simulation using red arrows pointing in the flow direction. The higher the density of arrows is, the higher the flow velocity and pressure are. Figure 15a shows the simulation beginning at 0.05 s, when both phases start to move, and a small flow gradient can be appreciated by the amount of arrows accumulated near the microchannel walls. Figure 15b illustrates how the Q d starts to behave as a spiral flow and is entrained by the Q c at 0.18 s.
At 0.32 s, the Q d invades the Q c microchannel, increasing velocity at the microchannel walls and developing the Q d spiral flow, as shown in Figure 16a. The velocity increases, especially in the sections with surface roughness that block the phase free flow. Figure 16b, at 0.39 s, illustrates how the Q c detaches small droplets from the Q d . It is possible to appreciate how the microchannel wall roughness stagnates droplets detached from the Q d . Stagnations caused by microchannel roughness generate spirals in flow and velocity gradients.
The microparticles’ detachment occurs at 0.45 s, and Figure 17a reveals an increase in flow velocity in the Q d microchannel bottom right part. This increase in velocity is related to the shear stress that is necessary for detachment and microparticle formation. In Figure 17b, at 0.47 s, a spiral flow increase inside the Q d is observed, while it decreases in detached microparticles. On the other hand, it is possible to observe that microchannel roughness causes detachment of the Q d and two small fractions stagnation just after its detachment.
In all three figures, it is possible to observe how the density of arrows remains close to the microchannel walls. This is caused by the microchannel roughness obstructing the flow, causing slight stagnation that must be displaced, resulting in an increase in flow velocity.

4. Discussion

The observations drawn from this analysis of microchannel fabrication methods highlight the complexities associated with each method. Examination of the microchannel structures and surface irregularities resulting from these various methods provides valuable perspectives on the potential advantages and limitations of each technique. In PDMS-fabricated MFDs, the roughness can be attributed to both the PLA filament type employed for microchannel generation and the quality of printing. The filament used for PLA extrusion affects roughness due to printing quality, cooling time between layers, and filament malleability. In contrast, MFDs manufactured with resin exhibit stepped sections due to the layer-overlapping printing method, impacting the smoothness between each printed edge. To improve the print quality of the PLA filament, a smaller needle tip could be used in order to make the channel traces obtained fit better to the circular shape of the microchannel. On the other hand, the PLA filament is biodegradable and could be treated with solvents such as acetone or alcohol to smooth out the roughness of the print before being immersed in PDMS. A wide variety of extrusion or resin 3D printers are available today with useful enhancements and options with which finer prints could be achieved. Another option is to change the orientation of the printing, and, depending on the design, the printed layers and line or layer tracing could reduce the roughness. Again, a post-treatment by injecting solvents that abrade the surface of the microchannels is a good option. However, to use these treatments, the initial diameter of the MFD just printed and the final diameter post-treatment should be taken into account since the idea is to abrade the walls of the microchannel. In summary, the analysis of MFD sections crafted using diverse methods unravels a spectrum of structural intricacies and roughness patterns. These observations highlight the interplay between fabrication techniques, materials, and resulting surface characteristics, underlining the need for careful selection and optimization of methods for specific MFD applications. The simulation analysis explores the complex flow dynamics within the microfluidic T-junction device. The study reveals the complex behaviors, stagnations, and influences of surface irregularities on flow patterns and microparticle detachment within the microchannel system. This can cause problems with microparticle monodispersity, deformation, and blockage in the microchannels. On the other hand, the roughness presented by these manufacturing methods could be useful for those systems, such as microreactors, in which mixing efficiency is required or the monodispersion of mps is not important.

5. Conclusions

This research investigated microchannel surface roughness using three fabrication methods: PDMS, filament extrusion, and 3D photopolymerizable resin printing. PDMS resulted in continuous roughness, PLA filament extrusion showed uniform indentations, and resin printing decreases roughness but had lingering effects. It is important to note that the PDMS lithography method using the PLA filament, as opposed to the conventional SU-8 method, significantly influenced the final roughness of the device. However, the use of PLA can be a more economical and environmentally friendly approach for MFD (microfluidic device) fabrication. It is possible that the surface roughness of the microchannel fabricated with this method could be improved by using a thinner and more precisely printed PLA filament. Flow simulations indicated roughness-induced disturbances and resistance, mainly at the microchannel bottom. Spiral flows from obstructions impacted velocity and direction, affecting microparticle generation. To optimize the performance of microfluidic devices (MFDs), it is vital to consider roughness. Future research should refine fabrication, explore new techniques, and minimize roughness effects on MFD flow behavior.

Author Contributions

Conceptualization, O.G.-R. and J.M.A.-C.; methodology, J.M.A.-C. and M.A.G.-R.; software, J.M.A.-C.; validation, O.G.-R., M.A.G.-R. and Á.J.M.-G.; formal analysis, O.G.-R. and V.H.P.-L.; investigation, J.M.A.-C.; resources; data curation, O.G.-R. and G.H.-V.; writing—original draft preparation, J.M.A.-C.; writing—review and editing, O.G.-R. and M.A.G.-R.; visualization, J.M.A.-C. and G.H.-V.; supervision, O.G.-R.; project administration, O.G.-R. and Á.J.M.-G. All authors have read and agreed to the published version of the manuscript.

Funding

This research was funded by Conacyt and the Doctoral Program of Science in Biotechnological Processes at the University of Guadalajara with the scholarship number 835528.

Institutional Review Board Statement

Not applicable.

Informed Consent Statement

Not applicable.

Data Availability Statement

No external data are generated.

Conflicts of Interest

The authors declare no conflict of interest.

Abbreviations

The following abbreviations are used in this manuscript:
MFDMicrofluidic device
PEGDAPolyethylene glycol diacrylate
PDMSPolydimethylsiloxane
PLAPolylactic acid
UVUltraviolet light
SU-8Bisphenol A novolac epoxy
Q d Dispersed phase flow
Q c Continuous phase flow
CFDComputational fluid dynamics
SEMScanning electron microscopy

References

  1. Cortelezzi, L.; Ferrari, S.; Dubini, G. A scalable active micro-mixer for biomedical applications. Microfluid. Nanofluidics 2017, 21, 1–16. [Google Scholar] [CrossRef]
  2. Zhu, Y.; Fang, Q. Analytical detection techniques for droplet microfluidics—A review. Anal. Chim. Acta 2013, 787, 24–35. [Google Scholar] [CrossRef] [PubMed]
  3. Mohammed Adham, A.; Mohd-Ghazali, N.; Ahmad, R. Thermal and hydrodynamic analysis of microchannel heat sinks: A review. Renew. Sustain. Energy Rev. 2013, 21, 614–622. [Google Scholar] [CrossRef]
  4. Moreira, A.; Carneiro, J.; Campos, J.B.; Miranda, J.M. Production of hydrogel microparticles in microfluidic devices: A review. Microfluid. Nanofluidics 2021, 25, 1–24. [Google Scholar] [CrossRef]
  5. Lopez-Juárez, B.P.; Garcia-Ramirez, M.A.; Perez-Luna, V.H.; Gonzalez-Reynoso, O. Formation of PEG-DA polymerized microparticles by different microfluidics devices: A T-junction device and a flow focusing device. Mater. Today Proc. 2019, 13, 374–378. [Google Scholar] [CrossRef]
  6. M, K.R.; Chakraborty, S. PDMS microfluidics: A mini review. J. Appl. Polym. Sci. 2020, 137, 48958. [Google Scholar] [CrossRef]
  7. Tullius, J.F.; Vajtai, R.; Bayazitoglu, Y. A review of cooling in microchannels. Heat Transf. Eng. 2011, 32, 527–541. [Google Scholar] [CrossRef]
  8. Cheng, S.; Wu, Z. Microfluidic electronics. Lab A Chip 2012, 12, 2782–2791. [Google Scholar] [CrossRef]
  9. Zhang, Y. On Study of Application of Micro-reactor in Chemistry and Chemical Field. IOP Conf. Ser. Earth Environ. Sci. 2018, 113. [Google Scholar] [CrossRef]
  10. Singh, R.K.; Kumar, A.; Kant, R.; Gupta, A.; Suresh, E.; Bhattacharya, S. Design and fabrication of 3-dimensional helical structures in polydimethylsiloxane for flow control applications. Microsyst. Technol. 2014, 20, 101–111. [Google Scholar] [CrossRef]
  11. Sackmann, J.; Burlage, K.; Gerhardy, C.; Memering, B.; Liao, S.; Schomburg, W.K. Review on ultrasonic fabrication of polymer micro devices. Ultrasonics 2015, 56, 189–200. [Google Scholar] [CrossRef] [PubMed]
  12. Chen, X.; Li, T.; Fu, B. Surface roughness study on microchannels of CO2 laser fabricating PMMA-based microfluidic chip. Surf. Rev. Lett. 2017, 24, 1–7. [Google Scholar] [CrossRef]
  13. Scott, S.M.; Ali, Z. Fabrication methods for microfluidic devices: An overview. Micromachines 2021, 12, 319. [Google Scholar] [CrossRef] [PubMed]
  14. Chen, X.; Zhang, L. Review in manufacturing methods of nanochannels of bio-nanofluidic chips. Sens. Actuators B Chem. 2018, 254, 648–659. [Google Scholar] [CrossRef]
  15. Kwon, K.K.; Song, K.Y.; Seo, J.M.; Chu, C.N.; Ahn, S.H. Precise glass microstructuring with laser induced backside wet etching using error-compensating scan path. J. Mater. Process. Technol. 2021, 291, 117046. [Google Scholar] [CrossRef]
  16. Gottmann, J.; Hermans, M.; Repiev, N.; Ortmann, J. Selective laser-induced etching of 3D precision quartz glass components for microfluidic applications-up-scaling of complexity and speed. Micromachines 2017, 8, 110. [Google Scholar] [CrossRef]
  17. Niino, H.; Kawaguchi, Y.; Sato, T.; Narazaki, A.; Kurosaki, R. Surface microstructures of silica glass by laser-induced backside wet etching. In Proceedings of the SPIE, San Jose, CA, USA, 19–24 January 2008; Volume 6879, p. 68790C. [Google Scholar] [CrossRef]
  18. Otuka, A.J.; Tomazio, N.B.; Paula, K.T.; Mendonça, C.R. Two-photon polymerization: Functionalized microstructures, micro-resonators, and bio-scaffolds. Polymers 2021, 13, 1994. [Google Scholar] [CrossRef]
  19. Desponds, A.; Banyasz, A.; Montagnac, G.; Andraud, C.; Baldeck, P.; Parola, S. Microfabrication by two-photon lithography, and characterization, of SiO2/TiO2 based hybrid and ceramic microstructures. J. Sol.-Gel Sci. Technol. 2020, 95, 733–745. [Google Scholar] [CrossRef]
  20. Butkutė, A.; Jonušauskas, L. 3d manufacturing of glass microstructures using femtosecond laser. Micromachines 2021, 12, 499. [Google Scholar] [CrossRef]
  21. Ackerl, N.; Fisch, G.; Auerswald, J.; Wegener, K. Evolution of microstructures on stainless steel induced by ultra-short pulsed laser ablation. SN Appl. Sci. 2020, 2, 652. [Google Scholar] [CrossRef]
  22. Gower, M.C.; Davies, E.; Holmes, A.S. Optical modeling of laser ablation for microstructure fabrication. J. Laser Micro Nanoeng. 2013, 8, 56–64. [Google Scholar] [CrossRef]
  23. Dai, B.; Li, M.; Ma, Y. Effect of surface roughness on liquid friction and transition characteristics in micro- and mini-channels. Appl. Therm. Eng. 2014, 67, 283–293. [Google Scholar] [CrossRef]
  24. Dharaiya, V.V.; Kandlikar, S.G. A numerical study on the effects of 2d structured sinusoidal elements on fluid flow and heat transfer at microscale. Int. J. Heat Mass Transf. 2013, 57, 190–201. [Google Scholar] [CrossRef]
  25. Yuan, X.; Tao, Z.; Li, H.; Tian, Y. Experimental investigation of surface roughness effects on flow behavior and heat transfer characteristics for circular microchannels. Chin. J. Aeronaut. 2016, 29, 1575–1581. [Google Scholar] [CrossRef]
  26. Ranjan, P. Investigations on the flow behaviour in microfluidic device due to surface roughness: A computational fluid dynamics simulation. Microsyst. Technol. 2019, 25, 3779–3789. [Google Scholar] [CrossRef]
  27. Jia, J.; Song, Q.; Liu, Z.; Wang, B. Effect of wall roughness on performance of microchannel applied in microfluidic device. Microsyst. Technol. 2019, 25, 2385–2397. [Google Scholar] [CrossRef]
  28. Chakaneh, J.; Javid, M. Surface roughness effect on droplet impact characterization: Experimental and theoretical study. J. Mech. Eng. Sci. 2019, 13, 5104–5125. [Google Scholar] [CrossRef]
  29. Daly, A.C.; Riley, L.; Segura, T.; Burdick, J.A. Hydrogel microparticles for biomedical applications. Nat. Rev. Mater. 2020, 5, 20–43. [Google Scholar] [CrossRef]
  30. Li, W.; Zhang, L.; Ge, X.; Xu, B.; Zhang, W.; Qu, L.; Choi, C.H.; Xu, J.; Zhang, A.; Lee, H.; et al. Microfluidic fabrication of microparticles for biomedical applications. Chem. Soc. Rev. 2018, 47, 5646–5683. [Google Scholar] [CrossRef]
  31. Liu, Y.; Wang, S.; Xia, H.; Tan, X.; Song, S.; Zhang, S.; Meng, D.; Chen, Q.; Jin, Y. The potential applications of microparticles in the diagnosis, treatment, and prognosis of lung cancer. J. Transl. Med. 2022, 20, 404. [Google Scholar] [CrossRef]
  32. Sherstneva, A.A.; Demina, T.S.; Monteiro, A.P.; Akopova, T.A.; Grandfils, C.; Ilangala, A.B. Biodegradable Microparticles for Regenerative Medicine: A State of the Art and Trends to Clinical Application. Polymers 2022, 14, 1314. [Google Scholar] [CrossRef] [PubMed]
  33. Acosta-Cuevas, J.M.; Gonzalez-Garcaa, J.; Garcia-Ramirez, M.; Perez-Luna, V.H.; Cisneros-Lopez, E.O.; Gonzalez-Nuñez, R.; González-Reynoso, O. Generation of photopolymerized microparticles based on pegda using microfluidic devices. Part 1. initial gelation time and mechanical properties of the material. Micromachines 2021, 12, 293. [Google Scholar] [CrossRef] [PubMed]
  34. Dow Corning. Sylgard® 182 Silicone Elastomer Datasheet. In Silicone Elastomer Technical Data Sheet; 2018; pp. 1–5. Available online: https://www.dow.com/es-es/document-viewer.html?docPath=/content/dam/dcc/documents/en-us/productdatasheet/11/11-12/11-1251-01-sylgard-182-silicone-elastomer.pdf (accessed on 15 September 2023).
  35. Bowman, A.T.; Metters, K.A. Fundamental studies of a novel, biodegradable PEG-b-PLA hydrogel. J. Biomed. Mater. Res. Part A 2000, 91, 3993–4005. [Google Scholar] [CrossRef]
  36. Peters, F.; Arabali, D. Interfacial tension between oil and water measured with a modified contour method. Colloids Surfaces A Physicochem. Eng. Asp. 2013, 426, 1–5. [Google Scholar] [CrossRef]
  37. Katopodes, N.D. Level Set Method. Free-Surface Flow 2019, 13, 804–828. [Google Scholar] [CrossRef]
  38. COMSOL. Microfluidics Interfaces: The Level Set Method. In COMSOL Multiphysics User’s Guide; CMU Guide: Burlington, MA, USA, 2016; pp. 203–211. [Google Scholar]
  39. Wong, V.L.; Yau, K.H.; Loizou, K.; Lau, P.L.; Richard, S.; Hewakandamby, B.N. Numerical Study of Shear-Thinning Droplet Breakup Dynamics at Microfluidics T-Junction using Level-Set Method. SEGi Univ. 2015, 1, 23. [Google Scholar]
Figure 1. Schematic diagram that features the flow effect inside a pipeline. (a) In a microscale, where δ x is the boundary layer thickness parameter and ε is the surface roughness; (b) in rough walls where plug flow is enhanced by surface roughness; and (c) in smooth walls where the flow moves with lighter friction caused by the channel walls without obstructing its direction. Even in smooth pipes, the friction factor is not zero. It does suggest that there will be a loss in flow velocity no matter how smooth the surface is. Nevertheless, the flow improves the velocity profile when the wall is less rough.
Coatings 13 01676 g001
Figure 2. Schematic diagram of MFD to microparticle generation and approach to T-junction. (a) The MFD zones can be incorporated into a single device or can be separated into two devices: one of them is associated with the inlet and the droplet generation zone while the other is constituted by the photopolymerization and outlet zone. (b) The continuous phase flow microchannel diameter ( Q c ) must be larger than the dispersed phase flow diameter ( Q d ) to obtain the formation of a microparticle. Green LEDs are under the transparent MFD.
Coatings 13 01676 g002
Figure 3. Schematic diagram of the designed microfluidic device. The model consists of two inputs, one output, a T-junction, and a microchannel running through the entire device.
Coatings 13 01676 g003
Figure 4. Fabrication process of an MFD using PDMS. The process is shown as: (a) printing of the required geometry for the microchannels, (b) immersion of the geometry in a container with PDMS and then heating to 60 °C, and (c) filament removal with a solvent solution.
Coatings 13 01676 g004
Figure 5. Fabrication process of an MFD using a polymer filament (PLA). The filament is fed through the extruder, which increases its temperature to deposit, through a needle, a thinner strand of PLA on a printing platform. The extruder moves over the printing platform to complete the design to be printed.
Coatings 13 01676 g005
Figure 6. Fabrication process of the MFD by 3D printing. The Elegoo Mars Pro printer performs its printing (I) by immersing its printing platform in the resin until it touches the transparent film, (II) shading starts on the LCD screen to allow only the resin layer with the UV-illuminated area shape to solidify, (III) the printing platform rises to allow the resin to cover the transparent film again completely, (IV) once again the printing platform descends back down to above the last cured resin layer, (V) it starts printing the second resin layer onto the previously printed one, and (VI) the printing process is repeated until all layers of the design have been printed.
Coatings 13 01676 g006
Figure 7. MFD fabricated by three different methods. The microfluidic device (a) printed with resin shows similar transparency to the MFD printed with PDMS, while the MFD (b) printed with PLA shows the lowest transparency compared with both the others. On the other hand, the PDMS-printed MFD (c) has the highest transparency among the three methods employed.
Coatings 13 01676 g007
Figure 8. Flow direction and dimensions for T-junction used. There is an increase in the microchannel diameter, from 800 μ m to 1.5 mm, once the T-junction section ends. The X represents the photopolymerization zone with a 30 cm length.
Coatings 13 01676 g008
Figure 9. An example use for level set function: (a) represents the limits determined by the program calculations dependent on the values provided by the user (material features), while (b) represents the boundary or interface development between the materials used for the simulation.
Coatings 13 01676 g009
Figure 10. Frontal cut made to the microchannels fabricated with the three different methods. (a) The layers in the UV resin method contain small surface irregularities. (b) The PLA filament method generates large jumps between steps. (c) The proposed method of PDMS lithography with PLA exposes large irregularities on the surface.
Coatings 13 01676 g010
Figure 11. Roughness of microchannels manufactured with the PDMS method. (a) T-junction showing discontinuity in its surface and in the reduction of its junction. (b) Curved section showing a stepped surface with appreciable roughness. (c) Straight section of microchannel showing an improvement in the reduction of roughness but still presenting a stepped relief.
Coatings 13 01676 g011
Figure 12. Roughness of microchannels manufactured using the PLA method. (a) T-junction showing a cracked surface and irregularities in the extrusion of the layers, causing a notorious roughness. (b) The curved section of the microchannel shows a good placement of the upper layers, reducing its roughness; however, the bottom shows a considerable roughness. (c) The straight section of the microchannel shows good results in the upper layers but presents the same problem in the lower layers as the curved section.
Coatings 13 01676 g012
Figure 13. Roughness of microchannels manufactured using the UV resin method. (a) The T-junction shows a minor and stepped roughness; however, the steps are hardly noticeable. (b) The curved section in contrast shows a pyramidal surface structure, which causes an even more prominent roughness in the upper layers. (c) The straight microchannel section shows a bottom with no apparent roughness and a stepped surface that keeps its surfaces smooth, so it is the section with the least roughness.
Coatings 13 01676 g013
Figure 14. Microchannel wall roughness. The schematic representation forming the T-junction was designed with surface disturbances to replicate the surface roughness. All disturbances maintain a value between 0 and 30 μ m.
Coatings 13 01676 g014
Figure 15. Simulation in 0.0 to 0.20 s time. Velocity at the lower Q c microchannel walls increases in both cases. (a) Initiation, flow injection. It is possible to appreciate a flow increase in Q d . (b) Reveals the Q d dragging by the Q c and the spiral flow generation for the Q d . The arrows indicate a one-way parallel flow of liquids that transforms into vortices that recede or stagnate mainly on the surface (wall) of the microchannel and inside the generated mps.
Coatings 13 01676 g015
Figure 16. Simulation at 0.30 to 0.40 s. Numerical analysis results shows the flow behavior, as in (a) displays an increasing Q d spiral flow tendency, and (b) is a microchannel extension in which droplet stagnation is detached from the Q d and the velocity gradient caused by the flow interacting with them can be appreciated. The arrows indicate a one-way parallel flow of liquids that transforms into vortices that recede or stagnate mainly on the surface (wall) of the microchannel and inside the generated mps.
Coatings 13 01676 g016
Figure 17. Simulation at 0.45 to 0.50 s. Results show that (a) there is a Q c invasion in the Q d microchannel lower left part, which causes a shear stress between both phases, while in (b) there is a decrease in the flow velocity in the Q c microchannel lower part due to a decrease in pressure by the Q d . The arrows indicate a one-way parallel flow of liquids that transforms into vortices that recede or stagnate mainly on the surface (wall) of the microchannel and inside the generated mps.
Coatings 13 01676 g017
Table 1. Basic material properties used for flow analysis.
Basic Material Characteristics [COMSOL]
Feature Hydrogel Solution Mineral Oil
μ (Pa · s)8.9 × 10 4 3.0 × 10 2
ρ (kg/m 3 )1.0 × 10 3 8.7 × 10 2
Thermal conductivity (W/m k)0.5980.106
Thermal capacity (J/kg k)41841670
Adiabatic expansion coefficient1.01.17
Disclaimer/Publisher’s Note: The statements, opinions and data contained in all publications are solely those of the individual author(s) and contributor(s) and not of MDPI and/or the editor(s). MDPI and/or the editor(s) disclaim responsibility for any injury to people or property resulting from any ideas, methods, instructions or products referred to in the content.

