Article

Co-Optimization of the Preparation Process of Ni-Based Self-Lubricating Coatings by Magneto-Thermal-Assisted Laser Cladding

1
School of Mechanical Engineering, Shaanxi University of Technology, Hanzhong 723000, China
2
Shaanxi Province Key Laboratory of Industrial Automation, Shaanxi University of Technology, Hanzhong 723000, China
*
Author to whom correspondence should be addressed.
Coatings 2023, 13(10), 1749; https://doi.org/10.3390/coatings13101749
Submission received: 5 September 2023 / Revised: 26 September 2023 / Accepted: 28 September 2023 / Published: 10 October 2023

Abstract

:
To reduce the metallurgical defects that are prone to occur in the preparation of nickel-based self-lubricating coatings, a method of process co-optimization for magneto-thermal-assisted laser cladding of nickel-based self-lubricating coatings is proposed in this paper. The laser energy density, preheating temperature, and electromagnetic intensity are selected as input factors; the prediction models of coating dilution rate, porosity and microhardness are established by the CCD test method; the interactive effects of the magnetic-thermal-assisted cladding process on the coating response are analyzed, and the optimal process parameter combinations are obtained by using the optimization method of MOPSO-AE-TOPSIS. Finally, the coatings under the parameters are successfully prepared. The results show that the optimal process parameter combinations obtained are laser energy density of 56.8 J/mm2, preheating temperature of 350 °C, electromagnetic intensity of 49.1 mT, and the error of the experimental results with this parameter is less than 3% from the algorithm optimization results. When the microstructure of unassisted and magneto-thermal-assisted fields are analyzed by comparison, it is found that the tissues are more homogeneous and finer, and the distribution of graphite is more homogeneous, which proves the effectiveness of the optimization method.

1. Introduction

The nickel-based alloy coatings are extensively utilized in the re-manufacturing of key components in extreme fields such as aerospace, shipbuilding, and military equipment due to their excellent high-temperature mechanical properties [1,2,3]. However, the growing demands of modern industry continue to push the limits of component service under severe operating conditions such as high temperatures, high pressures, and heavy loads, resulting in a large number of components failing due to severe wear and fatigue [4,5,6]. To enhance the wearing resistance of nickel-based alloy coatings, the preparation of self-lubricating coatings by adding lubricating phases such as graphite [7,8], molybdenum disulfide (MoS2) [9], tungsten disulfide (WS2) [10], and Argentum (Ag) [11] has become a suitable method.
In recent years, scholars have made many attempts to prepare nickel-based self-lubricating coatings by using different surface strengthening techniques, such as thermal spraying [12], sintering [13], electrodeposition [14], and laser cladding [15,16]. Among these preparation techniques, laser cladding technology provides an effective solution to realize the preparation of functional coatings owing to its advantages such as fast cooling rate, high efficiency, and high automation [17,18,19]. However, the cladding process is affected by the coupling of light, gas, and solid phases, and the solidification conditions of the molten pool are complicated, which is prone to the formation of metallurgical defects such as cracks, porosity, or uneven distribution of the lubrication phase [20,21,22], which seriously hinders the industrial application of laser cladding of nickel-based self-lubricating coatings. As modern technology progresses, the introduction of external physical field-assisted cladding to improve the coating quality has become a focus of research at home and abroad. Pellizzari et al. [23] prepared H13 steel coatings on CuBe alloy substrates and found that the hardness and wear resistance of H13 coatings prepared at a preheating temperature of 150 °C were superior to those of the substrate. Wang et al. [24] found that preheating can help to improve the uniformity of elemental distribution within the coating. Zhuang et al. [25] systematically investigated the effect of ultrasonic vibration on the distribution pattern and properties of TiC in laser-melting coated CrMnFeCoNi coatings. The results show that the increase of ultrasonic vibration leads to a gradual increase of TiC content in the coating, and thus, the wear resistance of the coating is significantly improved. Huo et al. [26] prepared In718/WC composite coatings using electromagnetic field-assisted laser melting. It was found that the composite electromagnetic field-induced amperage enhanced the Marangoni convection in the melt pool, which contributed to the uniformity of WC particle distribution and refined the microstructure. Chen et al. [27] and Shi et al. [28], when investigating the effect of EMF on the microstructure, microhardness and wear resistance of coatings, both found that EMF contributes to the refinement of grains and the increase of microhardness. Zhang et al. [29] introduced a hybrid ultrasonic and electromagnetic-assisted preparation of In718/WC composite coatings. It was shown that the WC particles were distributed more uniformly. The successful application of these studies provides a good solution to improve the quality of nickel-based self-lubricating coatings. To further expand the research on the preparation of coatings assisted by applied physical fields, a new process of magneto-thermal-assisted fusion cladding of nickel-based self-lubricating coatings is proposed in this study. However, the magnetic-thermal-assisted process introduced increases the complexity of the coupling effect of the cladding parameters, and the multi-objective optimization of the process is an effective way to solve this problem, which can provide important theoretical guidance for the preparation of high-quality self-lubricating coatings by the multi-physical field-assisted cladding [30,31].
Therefore, a process co-optimization method for magneto-thermal-assisted laser cladding of nickel-based self-lubricating coatings is proposed in this study. The prediction model of coating dilution rate, porosity, and microhardness variation with input factors was derived by using the laser energy density, the preheating temperature, and the electromagnetic intensity as input factors, and the influence law of multi-field parameters on the response of the fusion-coated coatings was explored. Then, the response model is optimized simultaneously using the multi-objective particle swarm optimization (MOPSO) algorithm to obtain the Pareto optimal solution set, and the combined subjective and objective weights are obtained through the analytic hierarchy process (AHP) and entropy weight method (EWM), which are assigned to the technique for order preference by similarity to an ideal solution (TOPSIS) method to obtain the optimal process parameters. Finally, the microstructures of the unassisted and magneto-thermal-assisted fields are analyzed by comparison to reveal the mechanism of coating formability enhancement under magnetic-thermal synergistic assistance.

2. Experimentation and Optimization Strategies

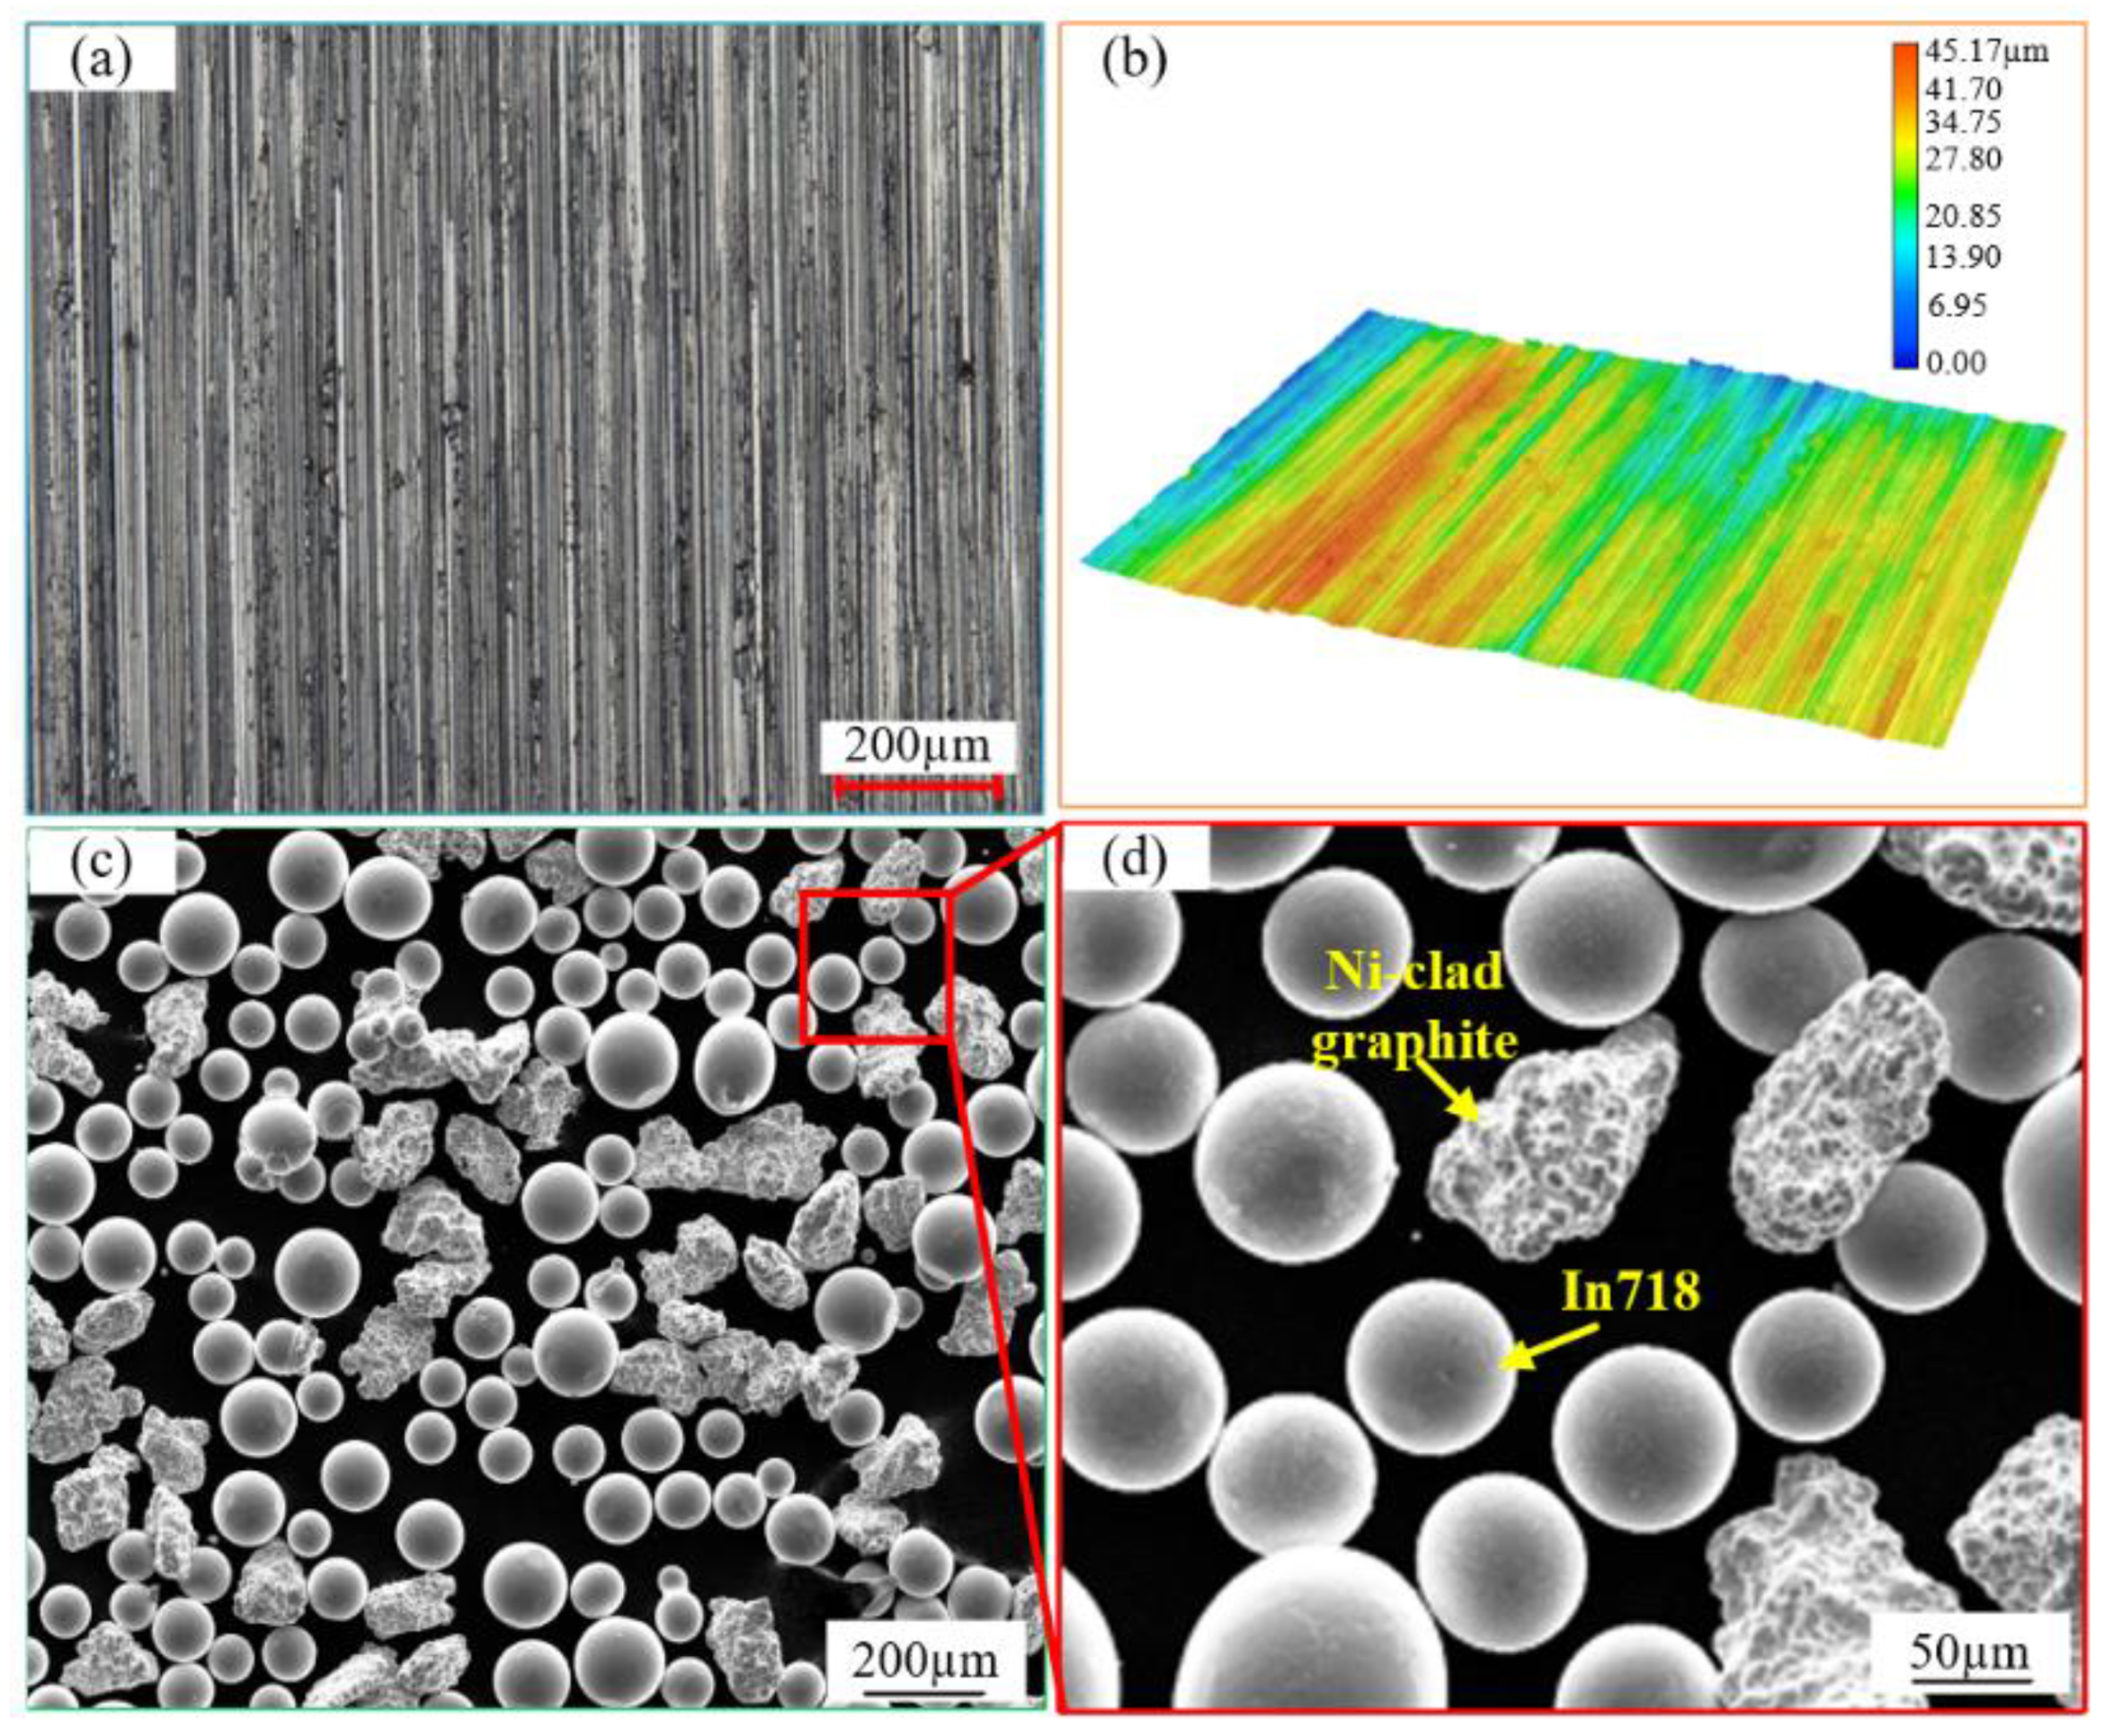
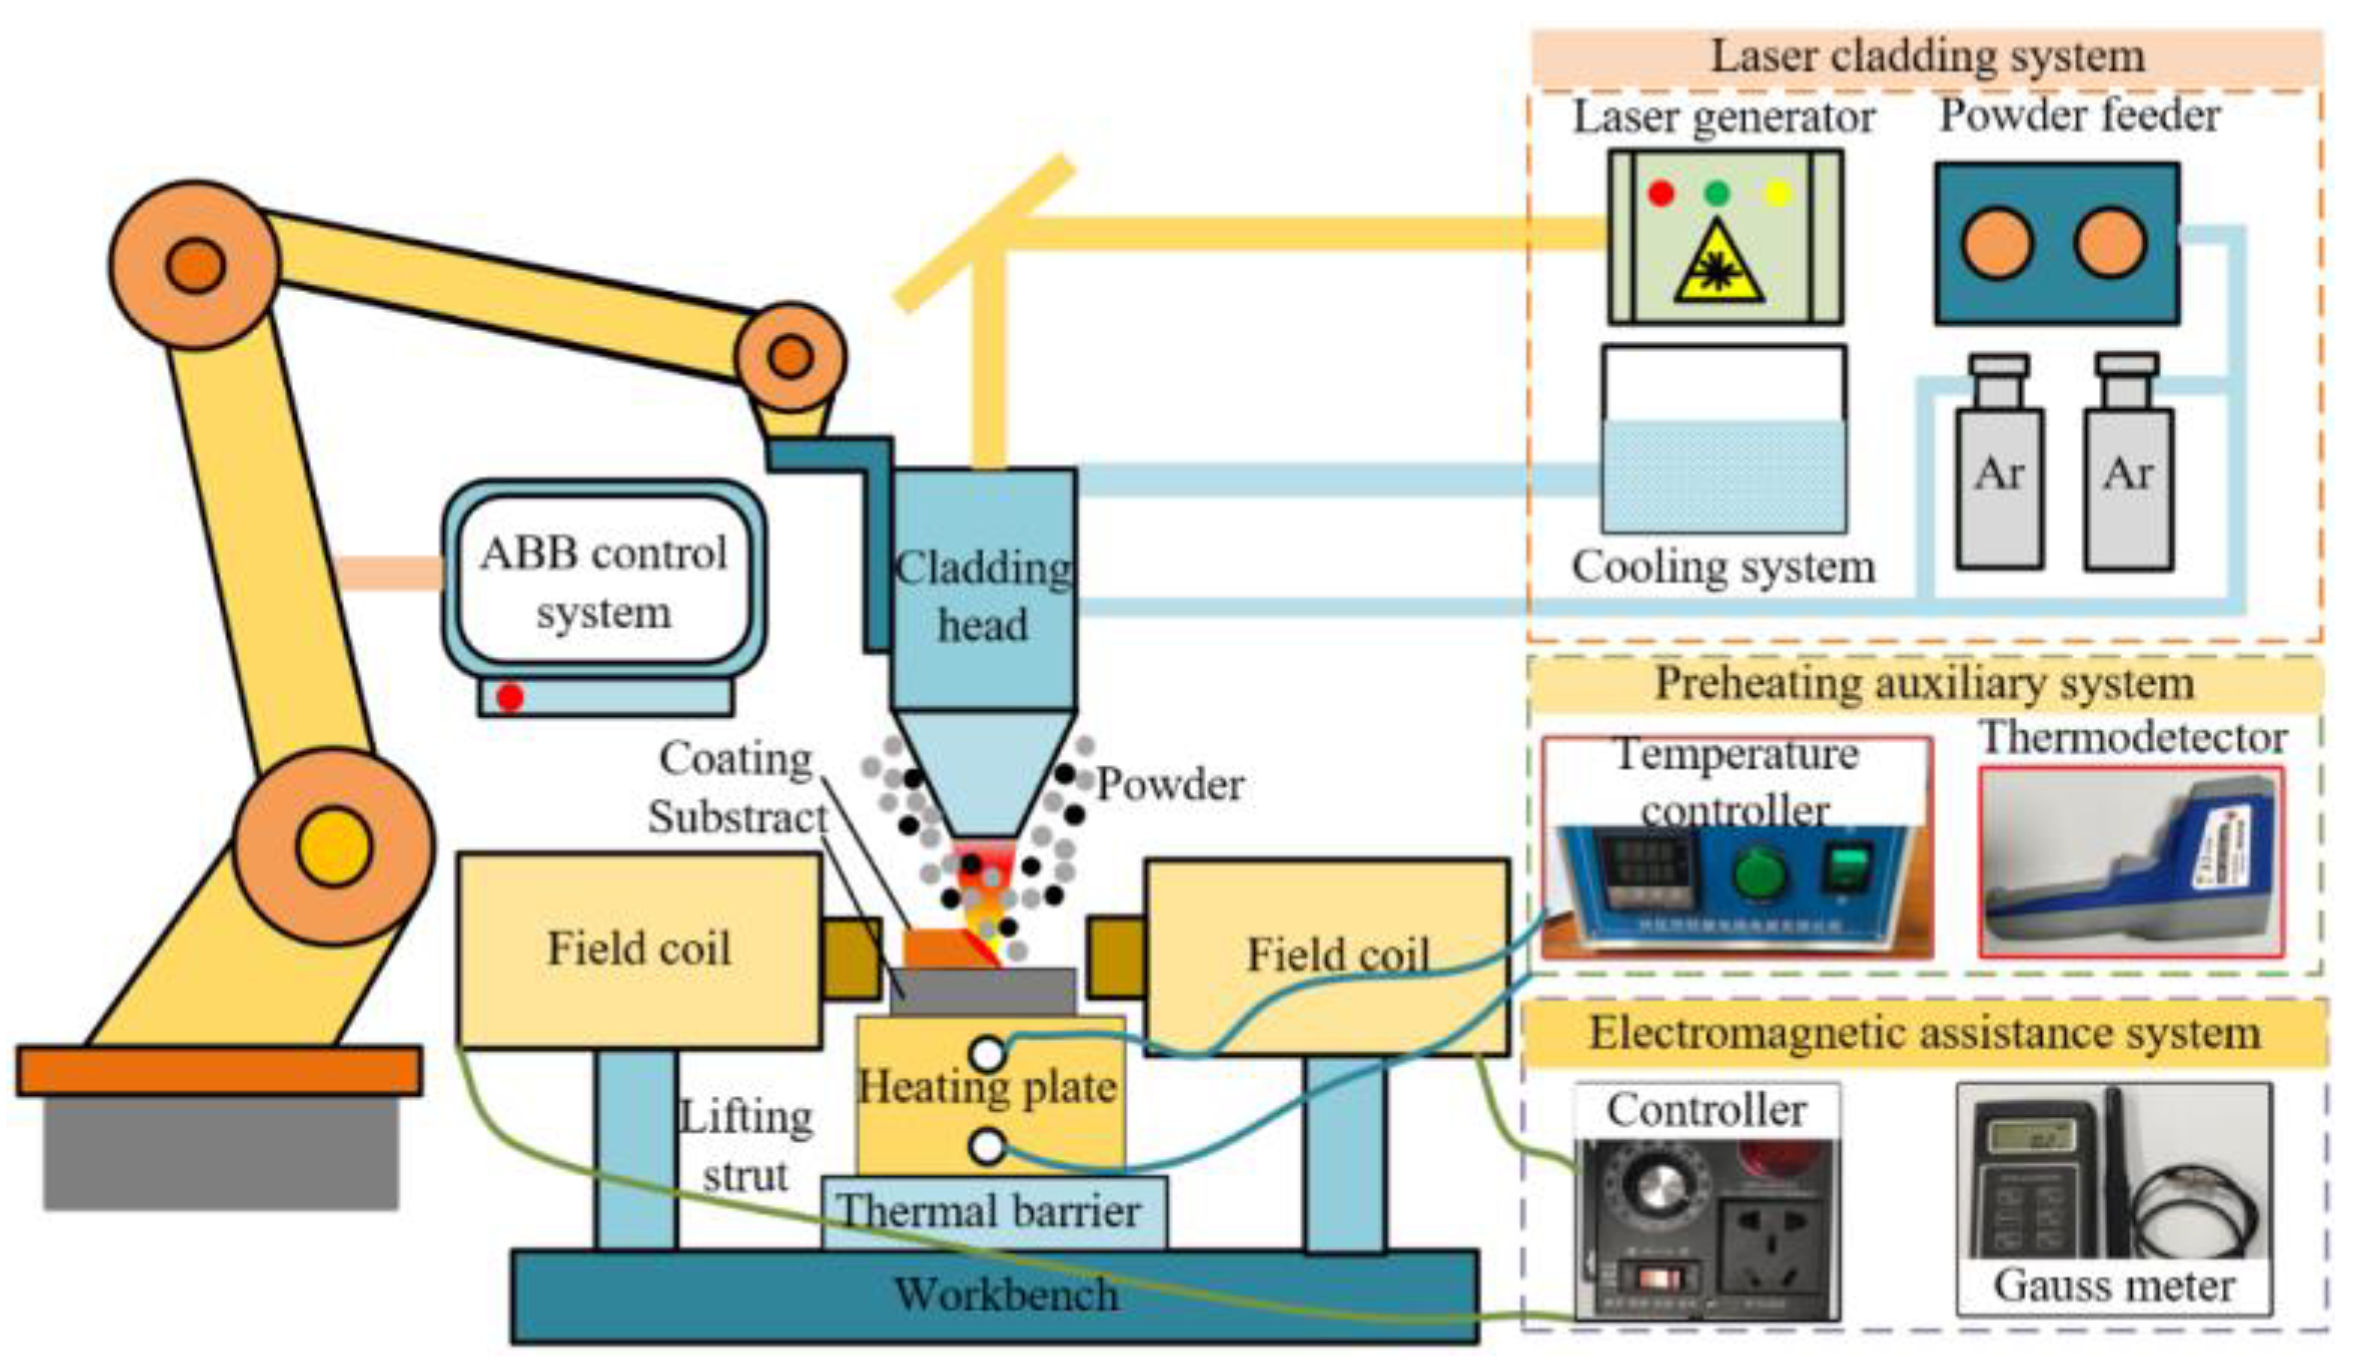
2.1. Materials and Equipment

As a substrate material, 42CrMo steel with dimensions of 50 mm × 20 mm × 10 mm was used; see Table 1 for the chemical composition of the substrate material. Before cladding, the surface was polished with 800 mesh, 1200 mesh, 1500 mesh, and 2000 mesh sandpaper in sequence to remove impurities from the surface of the substrate. The nickel-based self-lubricating powders (Table 2) used for the tests were mixed from In718 powder with a mass fraction of 89.35% and nickel-coated graphite with a mass fraction of 10.65%. The size of the mixed powders was 45–136 μm. The morphology of the substrate and the powders is shown in Figure 1.
Figure 2 shows the schematic diagram of the magnetic-thermal-assisted laser cladding system, which is mainly composed of three parts. The laser cladding system is composed of an RFL-A3000D fiber laser system, ABB robotic control system, dual-compartment synchronous powder feeding system, and CWFL-3000 water-cooled system, which adopts the coaxial powder feeding method and uses argon as the protective gas. The electromagnetic auxiliary system is placed perpendicular to the cladding direction on both sides of the specimen, which consists of a pair of electromagnetic coils (magnetic field strength range: 0–100 mT), a PW-4000W single-phase AC speed controller, and an SJ700 AC Gaussmeter. The preheating auxiliary system is placed under the specimen, the model is BLT-WKDRB, produced by Xinghua Xuankang Electric Heating and Electrical Appliances Co., Ltd. in Taizhou City, China, which is mainly composed of an intelligent thermostatic heating controller (the temperature control range of 0–600 °C, the control accuracy of ±1 °C, the average heating rate of 2 s/°C), a cast copper heating plate, and an industrial infrared pyrometer.

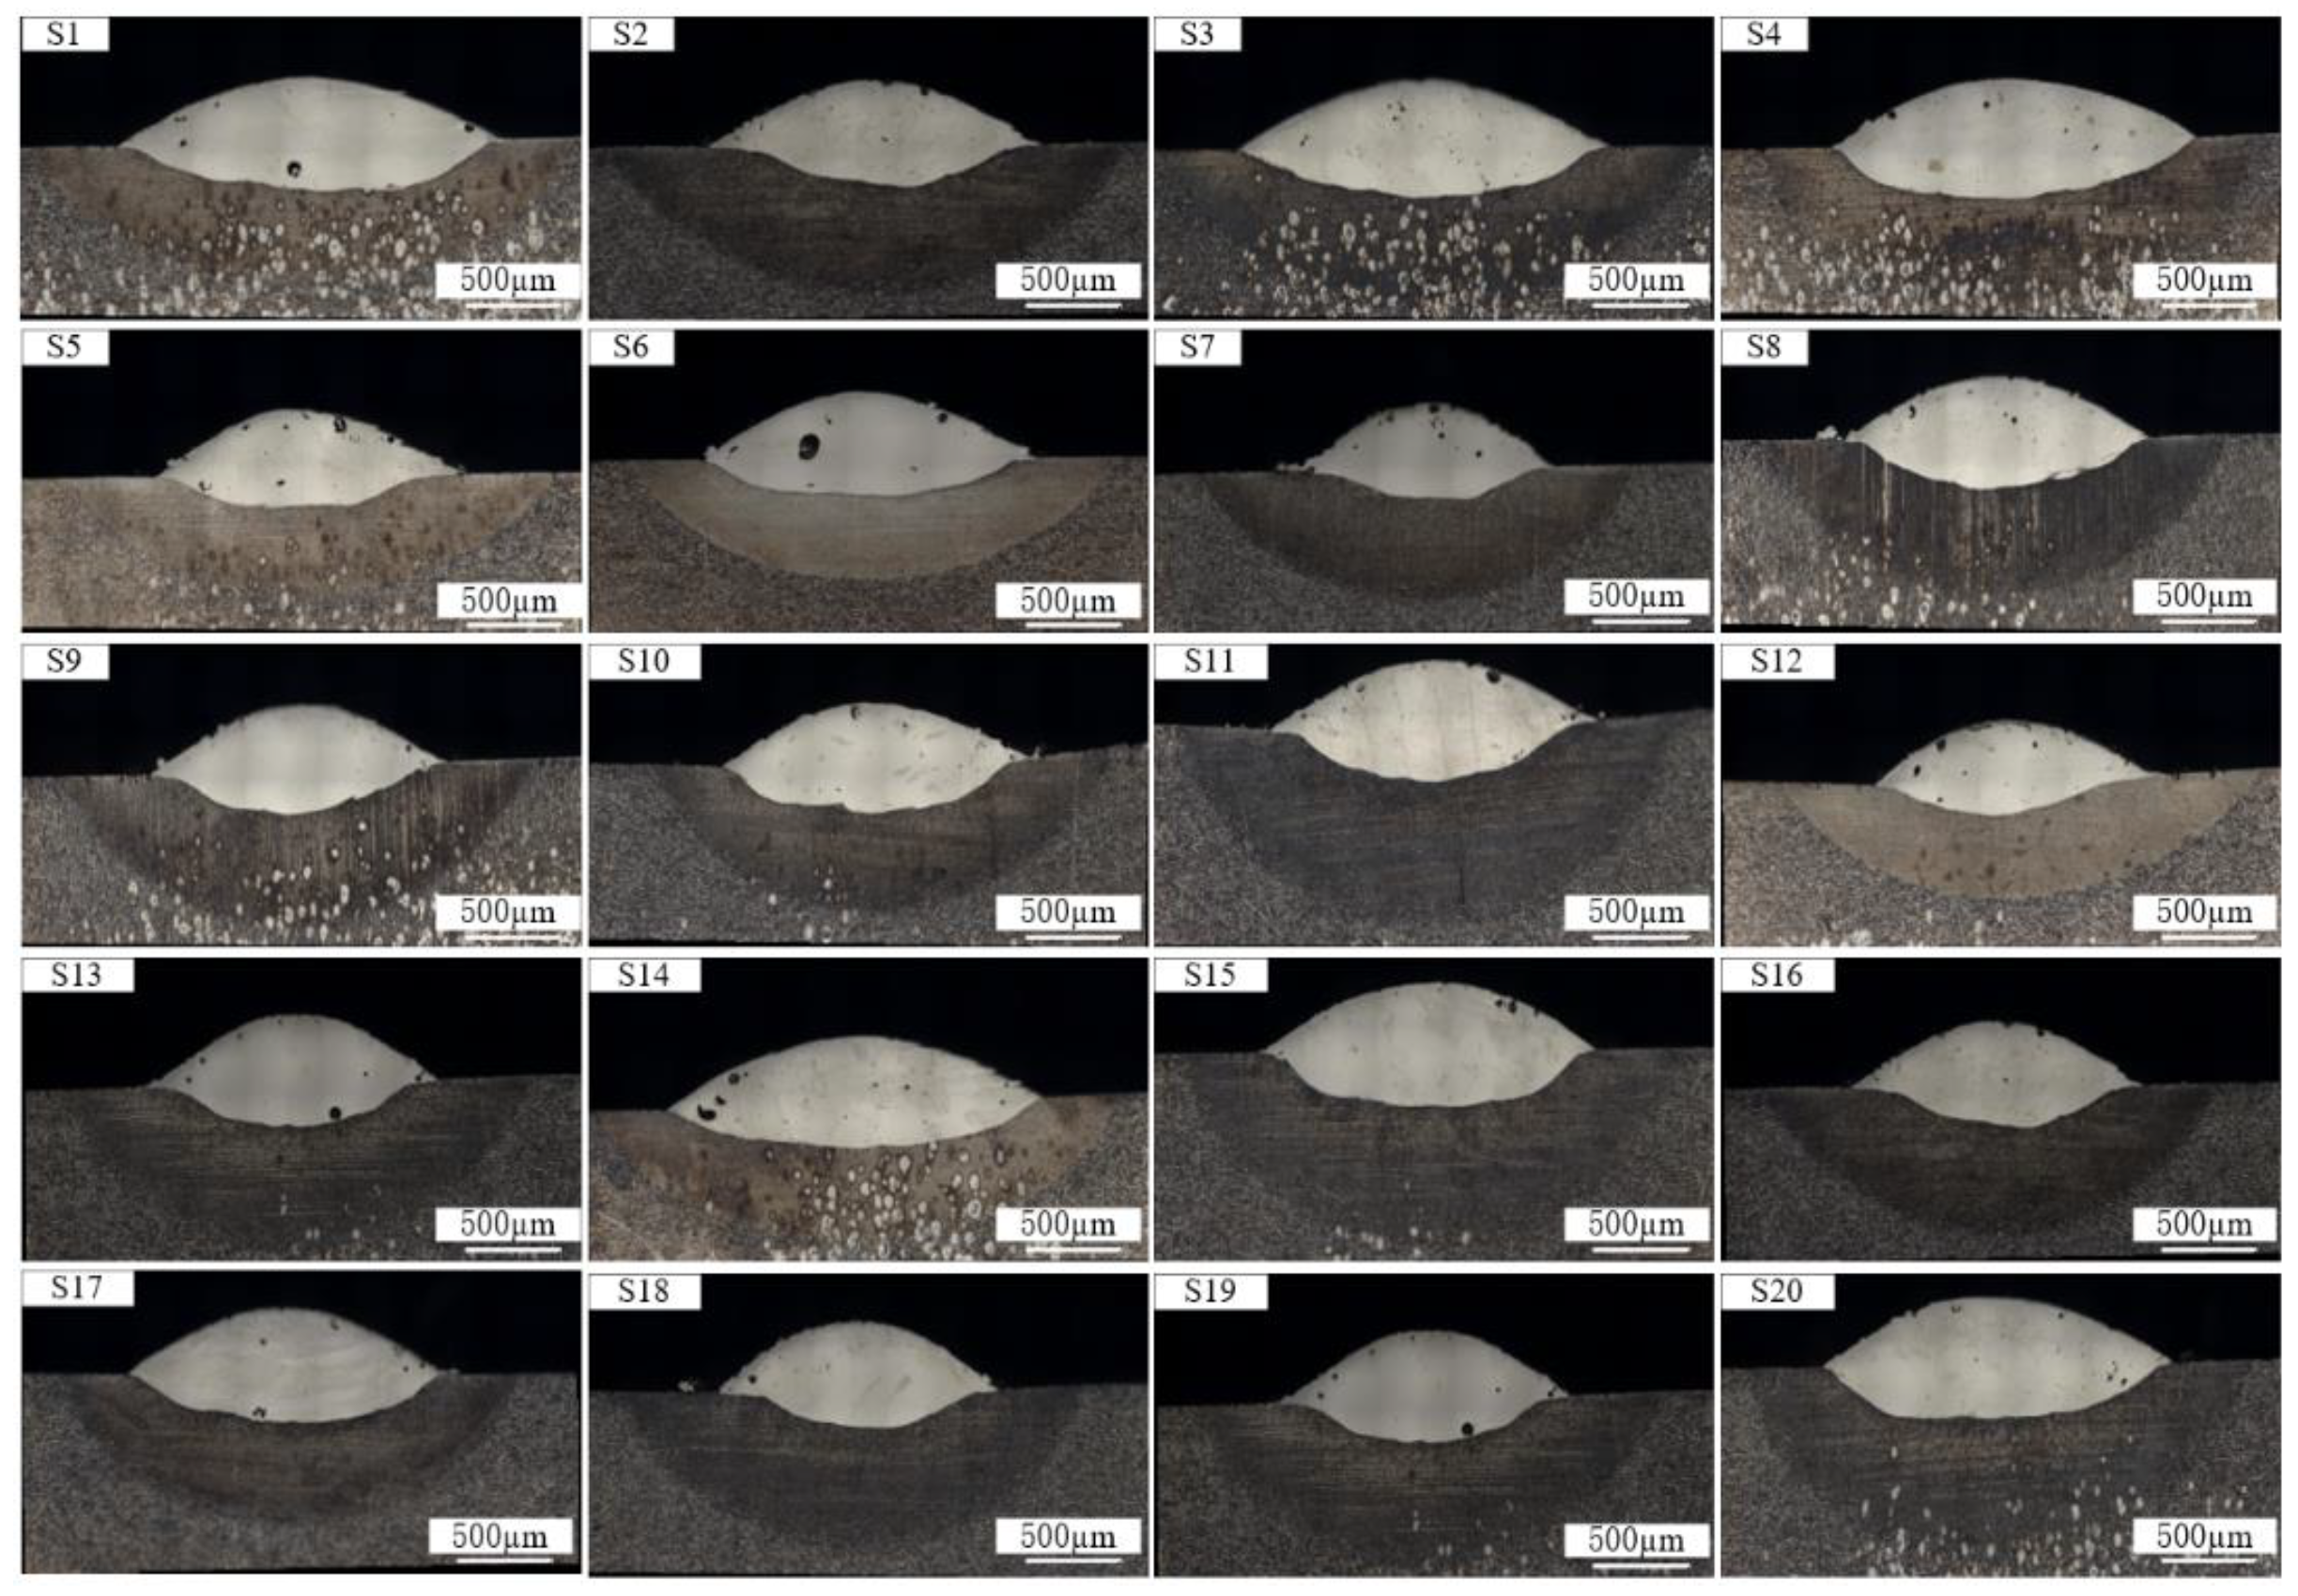
2.2. Experimental Dessign

The magneto-thermal-assisted laser cladding is a multi-factor and multi-response complex process with mutual coupling between cladding parameters and external field parameters, which often leads to unpredictable experimental results. Therefore, it is essential to analyze and optimize the process of the magneto-thermal synergistic-assisted laser cladding system. The three main factors that have a large influence on this system considered in this study, which are the laser energy density (A), the preheating temperature (B), and the electromagnetic intensity (C), were chosen as constant values for the powder feeding speed and defocusing amount, which were 1.5 g/min, 0 mm, respectively. The laser energy density E = laser power/(scanning speed*spot diameter), the laser power as a variable is, respectively, 1497 W, 1650 W, 1875 W, 2100 W, 2253 W, and the scanning speed and spot diameter keep constant, respectively, 10 mm/s and 3 mm. The ranges of these process parameters were determined through previous experimental study by the group [32,33].
The morphology and properties of the coating synergistically regulated by the multi-energy field process is an important criterion to measure the quality of the coating; the dilution rate, porosity, and microhardness of the coating were selected as the output response for the experiment. To investigate the composite nonlinear relationship between the multi-energy field process and the coating formability response, a 3-factor and 5-level experimental table was designed using the central composite design of experiments (CCD), as shown in Table 3. The modeling of the prediction between the input factors and the output response is constructed from Equation (1).
y i = α 0 + i = 1 k α i x i + i k j k α i j x i x j + i = 1 k α i i x i 2
where k is the number of variables in the input, α0 is the constant coefficient, xi and xj denote the encoded values of the variables, and αi, αij, and αii denote the regression coefficients for linear, interaction, and quadratic effects, respectively. yi denotes the dilution rate, the porosity, and the microhardness, respectively.
The specimens used for testing were taken from the center of the cladded specimens, which were sandpapered until bright and smooth, and corroded with nitric acid alcohol, and then placed under the super depth-of-field microscope to measure geometric features such as the acreage of the coating (Ah), the acreage of the melt pool (As), and the acreage of the pore (Ap), which measurements will be used for calculating the output response of the coating such as the dilution rate (DR) and the porosity (P). The microhardness of the coating was measured using a HV-1000 Vickers hardness tester with an applied force of 500 gf and a holding time of 10 s. Three points were tested at equal intervals and the average value was taken. Figure 3 displays the measured and calculated formula for the response of the coating.

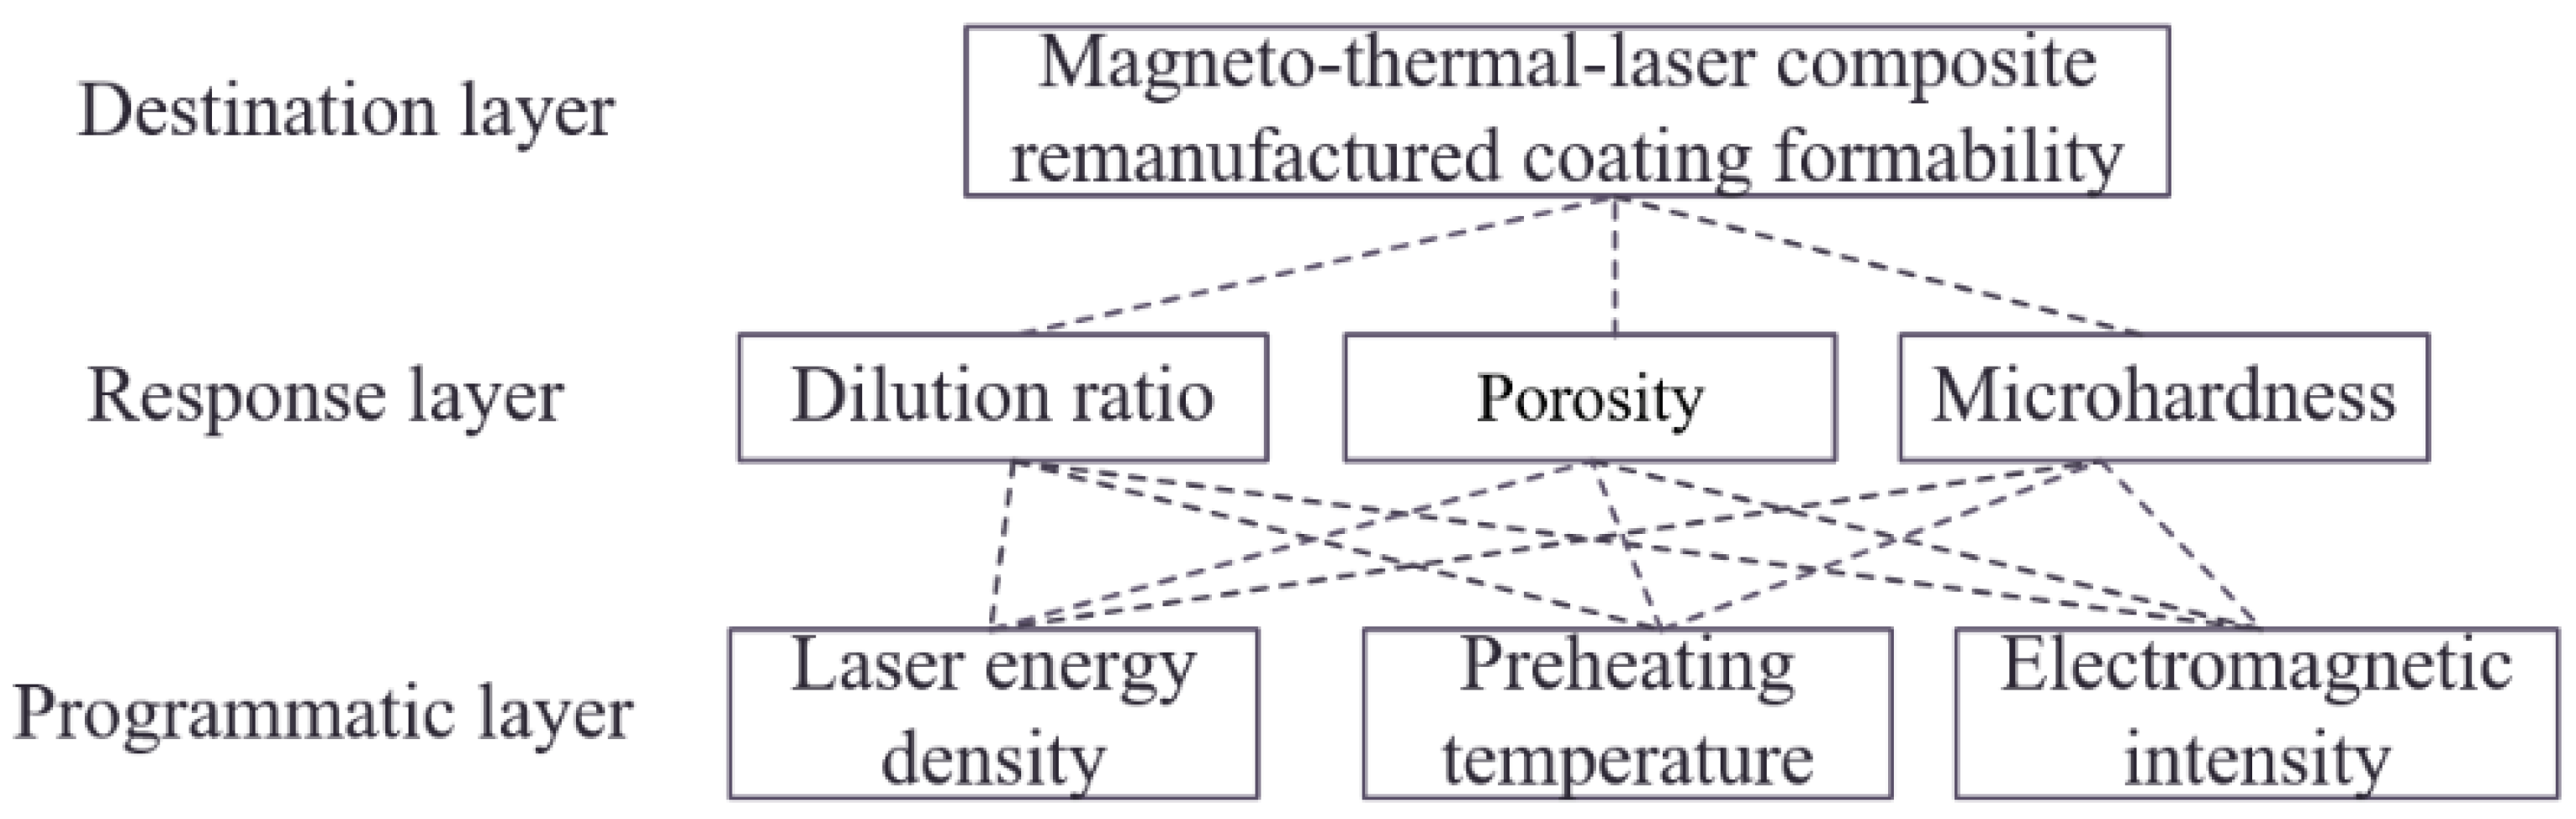
2.3. Optimized Strategies

Figure 4 illustrates the established process co-optimization strategy flowchart. The MOPSO algorithm is used first to realize process parameter optimization and obtain solution sets for Pareto optimization. The AE-TOPSIS decision-making method is used to rank the solutions that are optimal for Pareto, where AE refers to the combined AHP and EWM, which is used to solve the weights required for the comprehensive sorting. This can better balance the subjectivity of the decision maker and the objectivity of the data, to obtain more suitable weights.

2.3.1. Optimization of MOPSO

The MOPSO algorithm can be used to solve multi-objective optimization problems effectively by introducing the notions of non-dominated ordering and congestion distance [34]. In MOPSO, each particle is viewed as a potentially optimal combination of process parameters Xi = (Ai, Bi, Ci), and the optimal Pareto solution for this population is found by iteratively updating in space at speed vi according to the fitness function values. The equations for adjusting the velocity and position of the particles are shown in Equation (2) [35].
{ v i ( t + 1 ) = w v i ( t ) + c 1 r 1 ( t ) ( P b e s t , i ( t ) x i ( t ) ) + c 2 r 2 ( t ) ( G b e s t , i ( t ) x i ( t ) ) x i ( t + 1 ) = x i ( t ) + v i ( t + 1 )
where w is the inertia weight; t is the current iteration number; vi(t + 1) and vi(t) are the velocity values of the i-th particle at (t + 1) and t iterations, respectively, and xi(t + 1) and xi(t) are the position values of the i-th particle at (t + 1) and t iterations, respectively; Pbest,i(t) is the optimal position of the individual; Gbest,i(t) is the optimal position of the population; c1, c2 are the learning coefficients; r1, r2 are random constants between (0,1).
To effectively balance the global and local search ability of the MOPSO algorithm, an adaptive strategy is applied to adjust the inertia weights, which makes for a stronger global search in the early stage and a progressively stronger local convergence as the number of iterations increases, as shown in Equation (3) [36].
w t + 1 = w t × w d a m p
where wt+1 is the inertia weight at the (t + 1) iteration; wt is the inertia weight at the t-th iteration; and wdamp is the decay rate of the inertia weight.

2.3.2. Decision Analysis with AE-TOPSIS

According to the process shown in Figure 4, the following are the specific steps of the hierarchical analysis method, entropy weight method, and TOPSIS decision-making.
(1) AHP for subjective weights
The AHP can subjectively and qualitatively determine the importance of each response to obtain the weight value of the response. The main steps for solving the weight values are as follows.
Step 1: Construct a hierarchical model of coating quality response, as shown in Figure 5 for the affiliation between the selected process and the coating formability response index.
Step 2: Construct the judgment matrix. The importance of each response is analyzed using a 1–9 scale, which will minimize the problem of the different nature of the factors making them difficult to describe quantitatively, as shown in Table 4.
Step 3: Consistency test of the matrix. The judgment matrix constructed in Step 2 is highly influenced by subjective factors, and a consistency test must be performed to ensure that the error is within tolerance before using it to find weights. Equations (4) and (5) are the consistency test formulas.
C I = λ max n n 1
where CI is the consistency index; λmax is the maximum eigenvalue of the judgment matrix; n is the number of responses.
C R = C I R I
where CR is the consistency ratio, when CR < 0.1, the consistency of the matrix is acceptable, and vice versa, it is unacceptable; RI is the random consistency index, which is related to n, after checking the table to take RI = 0.58.
Step 4: Calculate the subjective weight coefficients. The weight coefficients of each response are calculated by using the arithmetic mean method, where the column elements of the judgment matrix are first normalized, and then the elements of each row are processed by summing and taking the mean, and the final mean is taken as the weight coefficient of each response. The formula for solving the weight coefficient matrix is shown in Equation (6).
ω i = 1 n j = 1 n r i j k = 1 m r i j         ( I = 1 ,   2 ,   m )
(2) Entropy weighting method for objective weights
The EWM is used to obtain the information entropy of each response, and the information entropy is used to calculate the index of each response. The main calculation steps are as follows:
Step 1: Constructing the data matrix G for the response. Build the m × n order matrix of i factors and j responses as shown in Equation (7).
G = [ g i j ] m × n = [ g 11 g 12 g 1 n g 21 g 22 g 2 n g m 1 g m 2 g m n ]
where gij is the value of the i-th factor under the j-th response.
Step 2: Normalization of the matrix. Owing to the different magnitudes of the response values of the coating formability, it needs to be standardized before the calculation of the weights.
Step 3: Calculate the entropy value H for each response.
H = i = 1 m g i j i = 1 n g i j ln ( g i j i = 1 n g i j ) / ln m
Step 4: Calculate the objective weighting factors for each response.
ω j = 1 H j j = 1 n ( 1 H j )
The weight coefficients of the analytic hierarchy process and entropy weight method coupled by applying Equation (10) to obtain a comprehensive subjective and objective empowerment model, in which the values of coefficients a and b are determined according to the actual significance. In this thesis, to balance the decision-making influence of subjective and objective, a and b are chosen to be 0.5, respectively.
{ ω = a ω i + b ω j a + b = 1
(3) Integrated decision-making for TOPSIS
The TOPSIS method is used to accurately reflect the gaps between evaluation programs by fully utilizing the data information from the response values and combining it with the weighting factors.
Step 1: Data normalization and normalization. The result is shown in Equation (11).
T = [ t 11 t 12 t 1 n t 21 t 22 t 2 n t m 1 t m 2 t m n ]
Step 2: Calculation of relative closeness. In the normalized matrix, the maximum and minimum values of each response are selected to form the positive ideal solution matrix T+ and the negative ideal solution matrix T, i.e., T+= ( t 1 + , t 2 + ,…, t n + ) and T = ( t 1 , t 2 ,…, t n ), respectively. Then the distances D i + and D i between each response value and the positive and negative ideal solutions are calculated as shown in Equation (12). Finally, the comprehensive decision on the response values is made based on the closeness Si (0 ≤ Si ≤ 1), as shown in Equation (13), and the larger the value of Si, the higher the relative closeness, the smaller D i + , and the closer the response values are to the ideal solution.
{ D i + = j = 1 n ω j ( t j + t i j ) 2 D i = j = 1 n ω j ( t j t i j ) 2
S i = D i D i + + D i

3. Results and Discussion

Table 5 shows the results of the experimental measurements and Figure 6 shows the cross-sectional morphology of the corresponding 20 groups.

3.1. ANOVA and Predictive Modeling

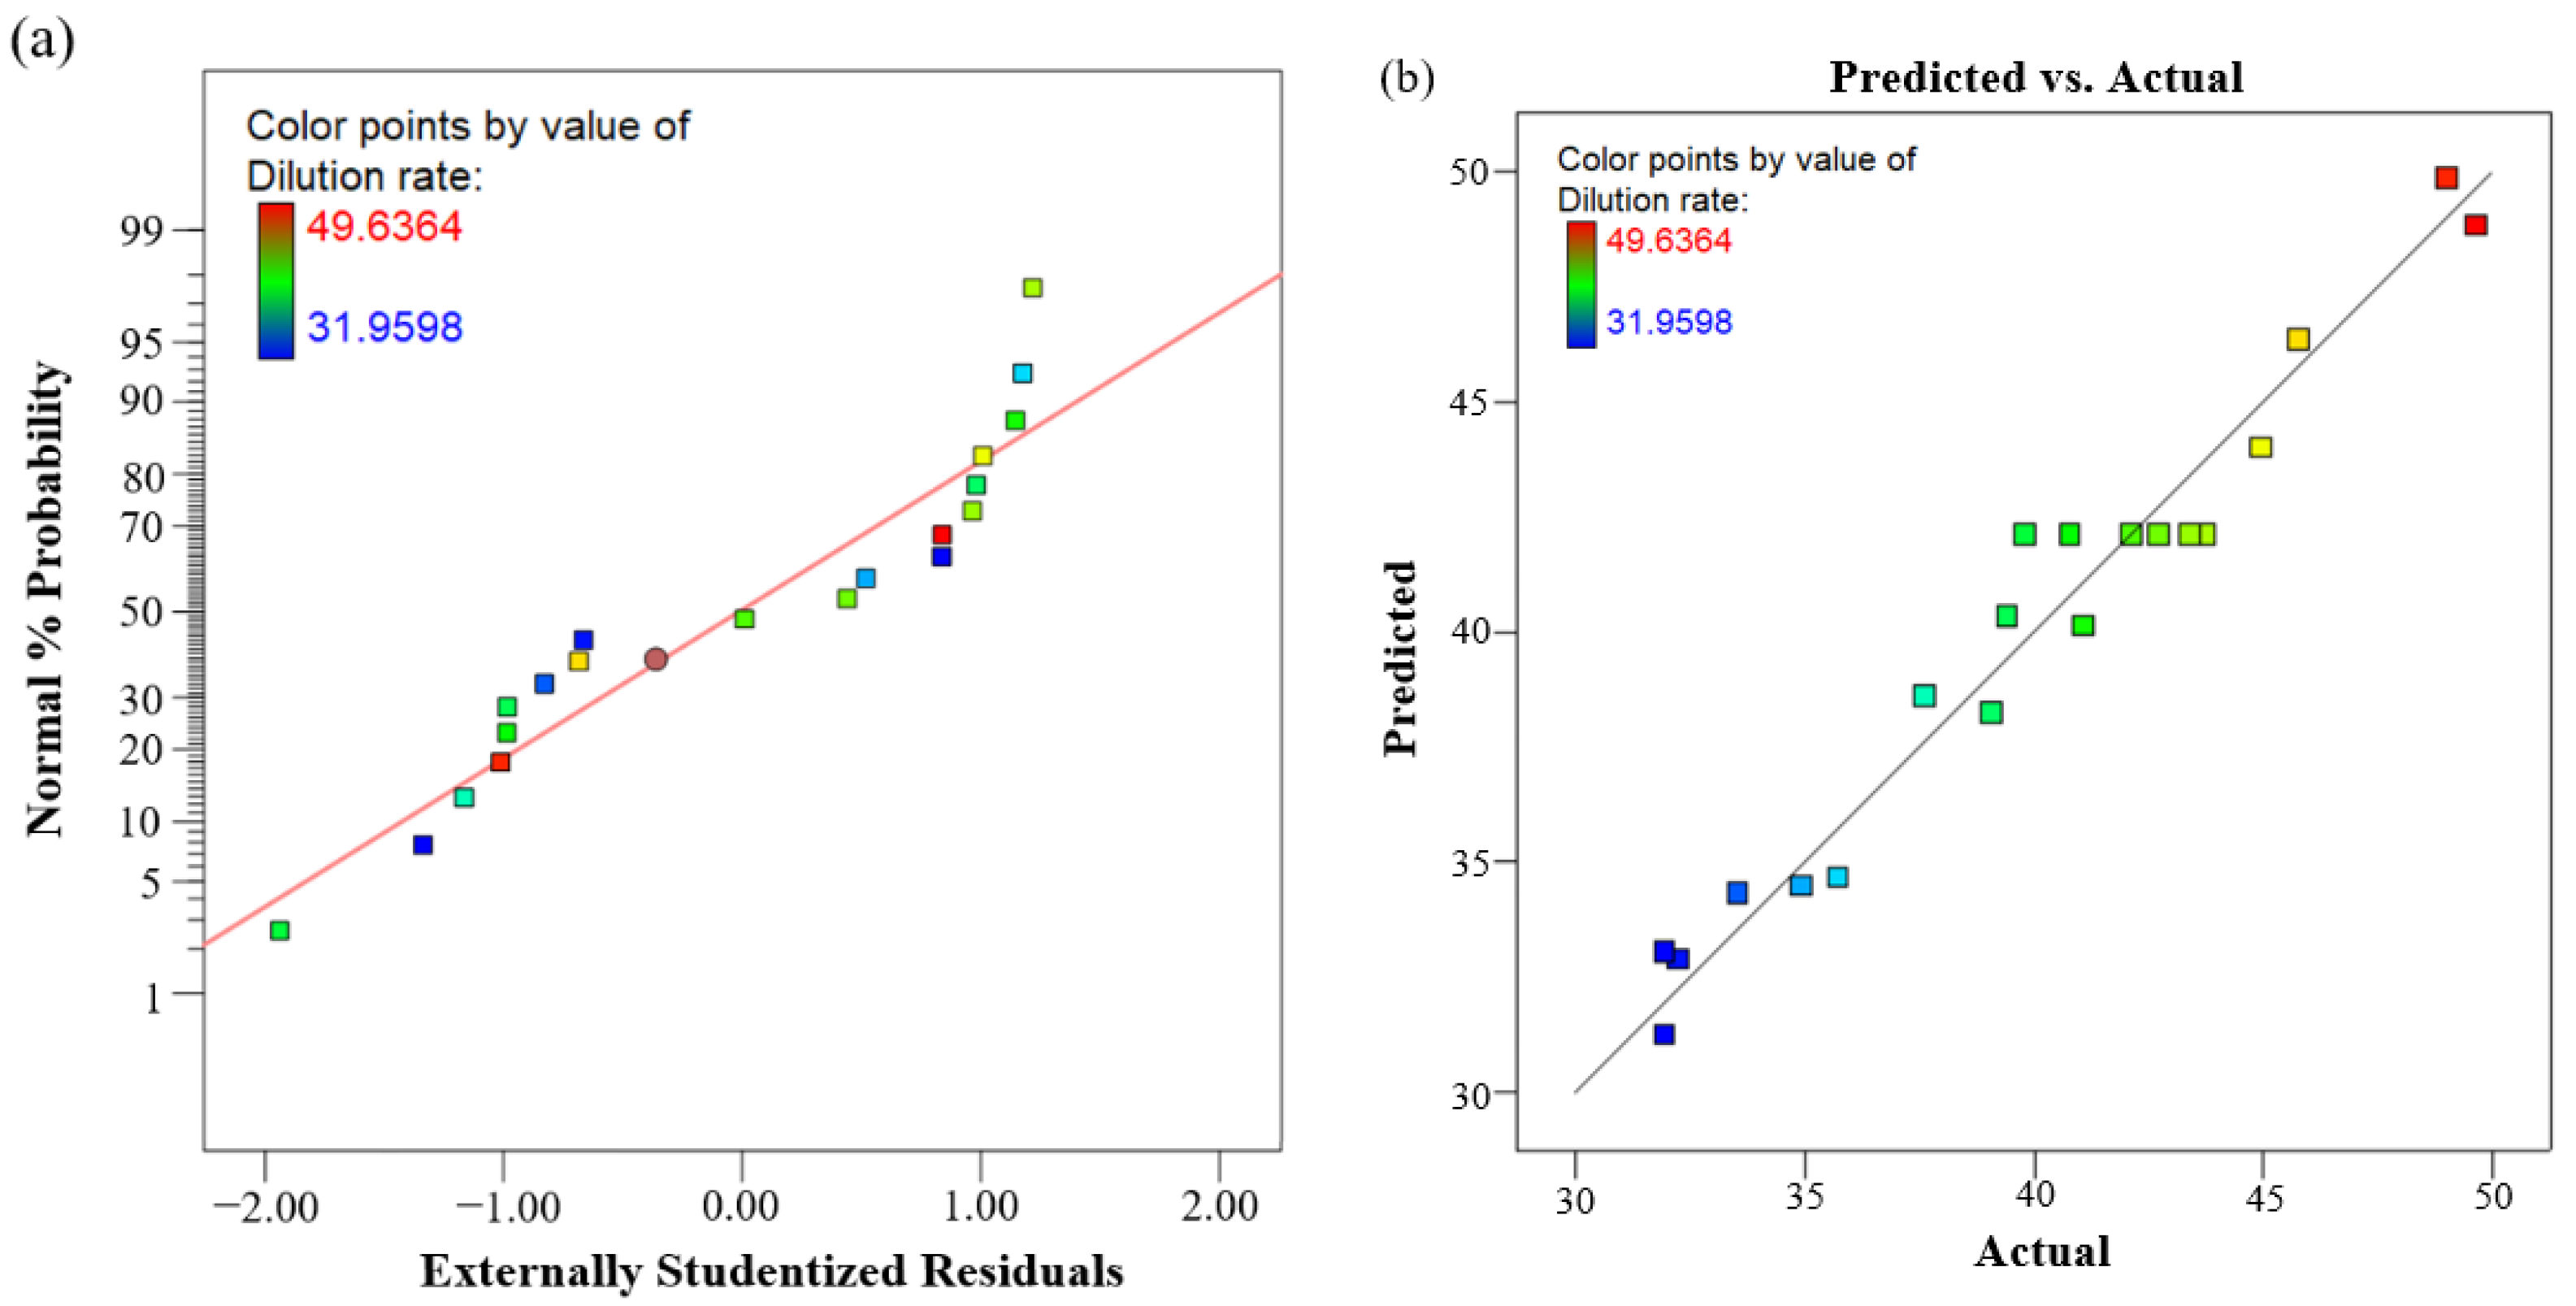
3.1.1. Dilution Ratio
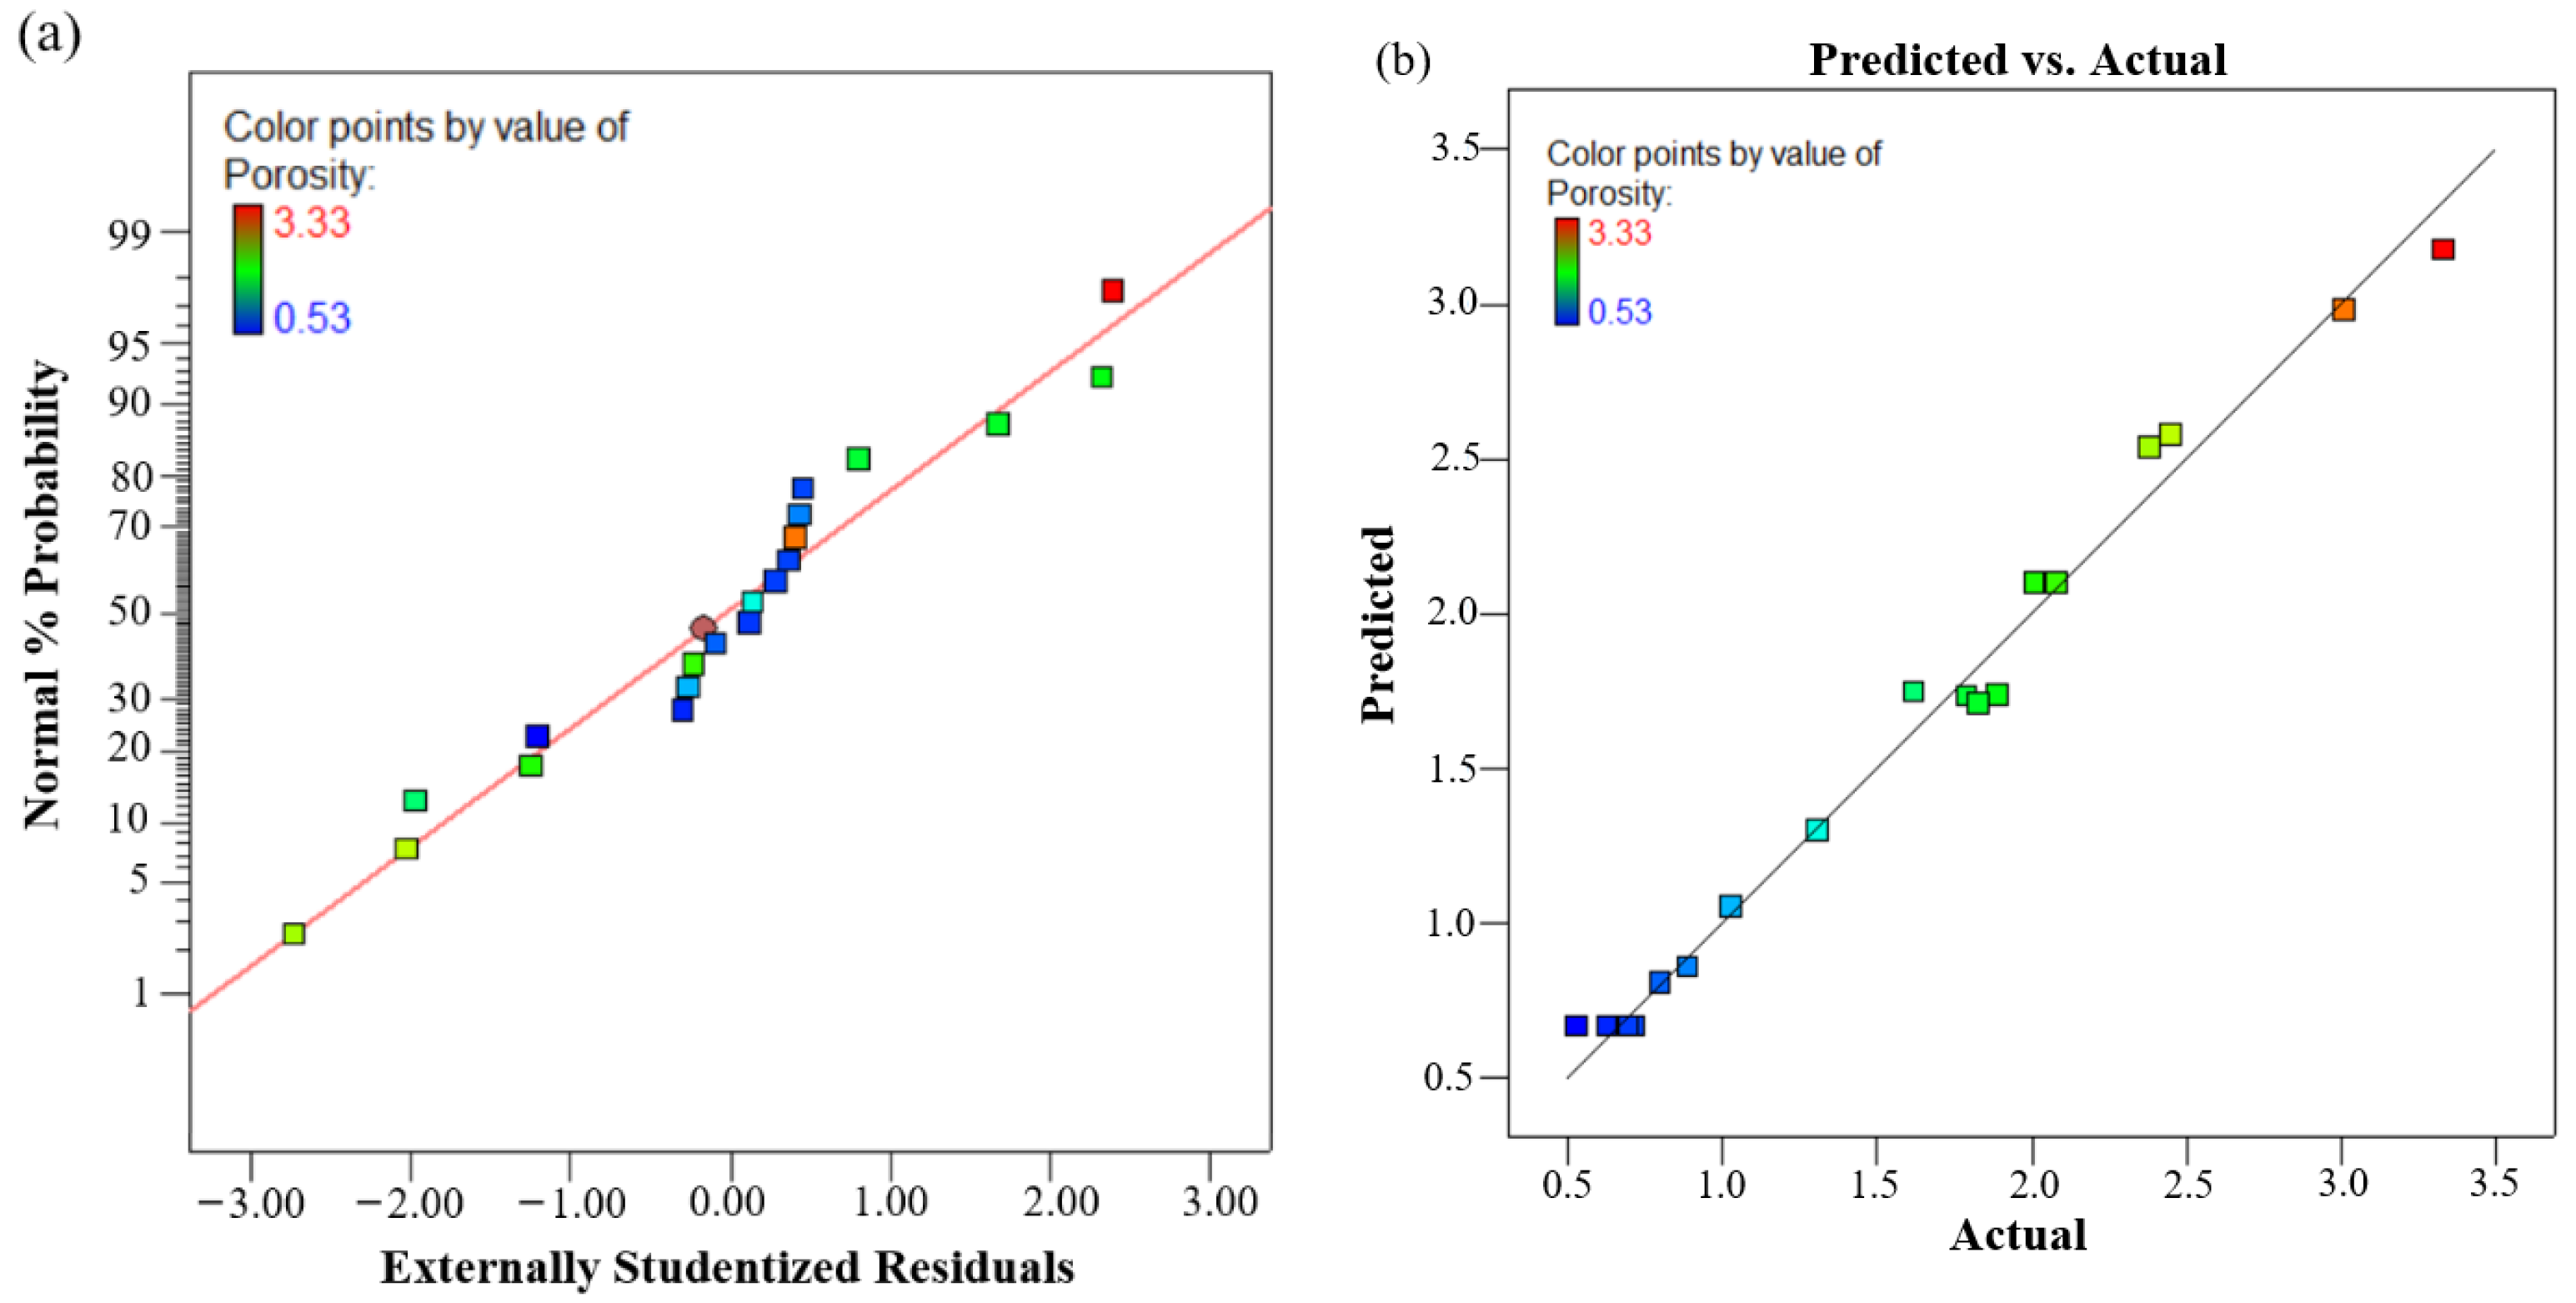
Table 6 displays the analysis of variance for dilution rate; the F-value of the model is 27.27 and the p-value is less than 0.0001, which indicates that the model is significant. In this case, the p-values of the input factors A (laser energy density), B (preheating temperature), C (electromagnetic intensity), AB (laser energy density*preheating temperature), B2 (preheating temperature*preheating temperature), and C2 (electromagnetic intensity*electromagnetic intensity) are all less than 0.05. The misfit term of the model is 0.85, which is greater than 0.1, indicating that the model fits better. In addition, the values of R2, Adj-R2, and Pre-R2 also illustrate the fitting effect of the model; the R2 is 0.9609, and the difference between Adj-R2 and Pre-R2 is less than 0.2, which indicates that the actual value of the model is highly correlated with the predicted value. The Adequate Precision is used to measure the credibility of the model, and the expected value is generally greater than 4. The signal-to-noise ratio of the model is 17.906, which indicates that the model has a high degree of credibility and can respond to the experimental results. Thus, the model used to model the prediction between process parameters and dilution rate is shown in Equation (14).
y 1 = 42.11 + 4.75 A + 2.88 B 1.69 C + 1.49 A B 1.04 B 2 1.63 C 2
The model validation plots for the dilution rate are shown in Figure 7a,b. All points of the residuals of the dilution rate are distributed along both sides of the straight line in Figure 7a, which indicates that the distribution of the residuals conforms to the normal distribution. The comparison between the actual values and the predicted values is carried out in Figure 7b, and the two values are distributed in the annex of the straight line, which can be considered as a good correlation. In general, the model can be used as a constraint function.

3.1.2. Porosity

Table 7 presents the ANOVA for stomatal rate; the F value of the model was 94.24 with a p value less than 0.0001, which indicates that the model is significant. From the results, it can be seen that the p-values of the input factors A (laser energy density), B (preheating temperature), C (electromagnetic intensity), AB (laser energy density*preheating temperature), BC (preheating temperature*electromagnetic intensity), A2 (laser energy density*laser energy density), B2 (preheating temperature*preheating temperature), and C2 (electromagnetic intensity*electromagnetic intensity) are all less than 0.05, which indicates that these model terms are significant. The misfit term of the model is greater than 0.1, which indicates that its fitting effect is better, and the misfit term of the model is 5.13. The difference between the Adj-R2 of 0.9779 and the Pre-R2 of 0.9204 is 0.0575, which is less than 0.2, which is small, and the R2 of the model is 0.9833, which indicates that the degree of fitting is high. The Adequate Precision was 28.167, indicating that the model has enough signal to be used to build a prediction model for stomatal rate, as shown in Equation (15).
y 2 = 0.67 0.11 A 0.63 B 0.12 C + 0.12 A B 0.33 B C + 0.44 A 2 + 0.51 B 2 + 0.30 C 2
To further validate the reliability of the porosity model, the model validation plot shown in Figure 8 is utilized. Figure 8a depicts the distribution of the residuals of the porosity, which can be found to be normally distributed. Figure 8b depicts the comparison of the actual values with the predicted values, which indicates a good correlation. In conclusion, it shows that the model of porosity is reliable.

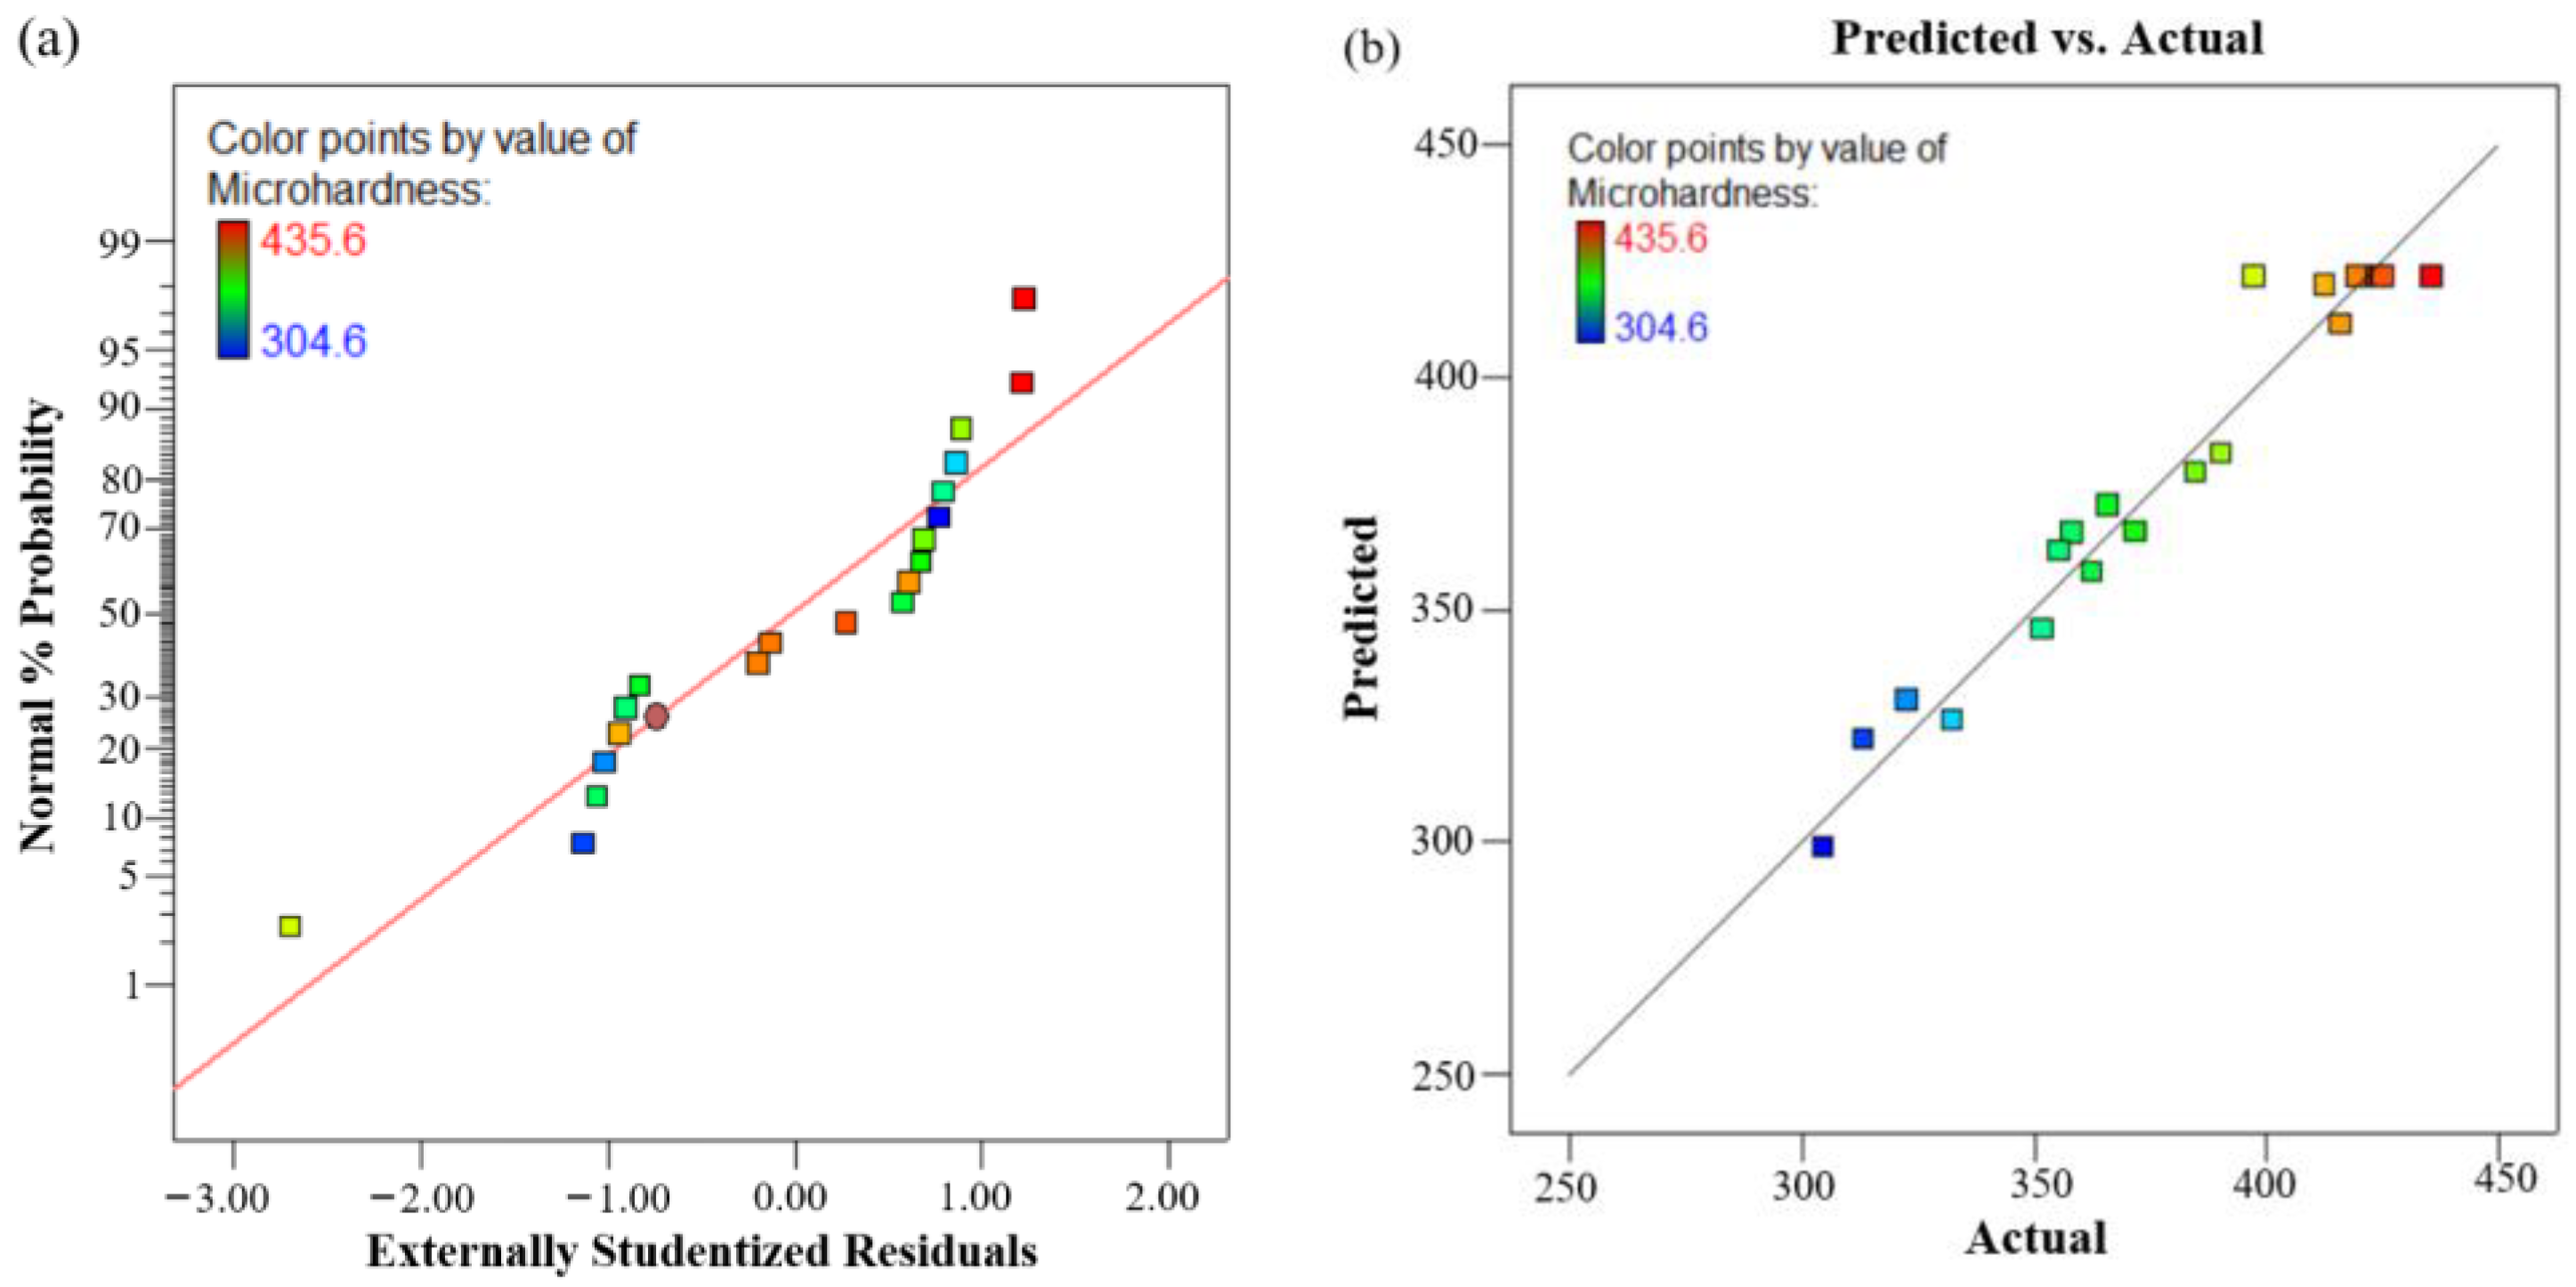
3.1.3. Microhardness

Table 8 shows the ANOVA for microhardness, the F value of the model is 21.23, which indicates that the model is significant, but due to the effect of noise on the model, there is only a 0.01% chance that it can produce such a large F. Based on the data shown in the table, it can be determined that the terms that have a more significant effect on the model are A (laser energy density), B (preheating temperature), BC (preheating temperature* electromagnetic intensity), A2 (laser energy density*laser energy density), B2 (preheating temperature*preheating temperature), and C2 (electromagnetic intensity*electromagnetic intensity). This model has a misfit term of 0.61, indicating that it can be used to reflect real experimental results. Based on the model showing R2, Adj-R2, and Pre-R2 values of 0.9503, 0.9055, and 0.8128, respectively, it can be concluded that the model fits well. The Adequate Precision of 13.720 indicates that the model has an appropriate signal and can be used for modeling microhardness prediction. The prediction model between process parameters and microhardness is shown in Equation (16).
y 3 = 421.76 14.96 A + 26.57 B + 11.05 B C 26.32 A 2 16.42 B 2 20.21 C 2
Figure 9 presents the model validation plot for microhardness. From the residual plot of microhardness Figure 8a, it can be seen that the points are distributed along the linearity, indicating that the residuals of the model conform to the normal distribution. According to the comparison between the predicted value and the actual value Figure 8b, it can be found that the two coincide with each other to a higher degree, which can prove that the model of microhardness has a high degree of accuracy.

3.2. Interaction of Process Parameters

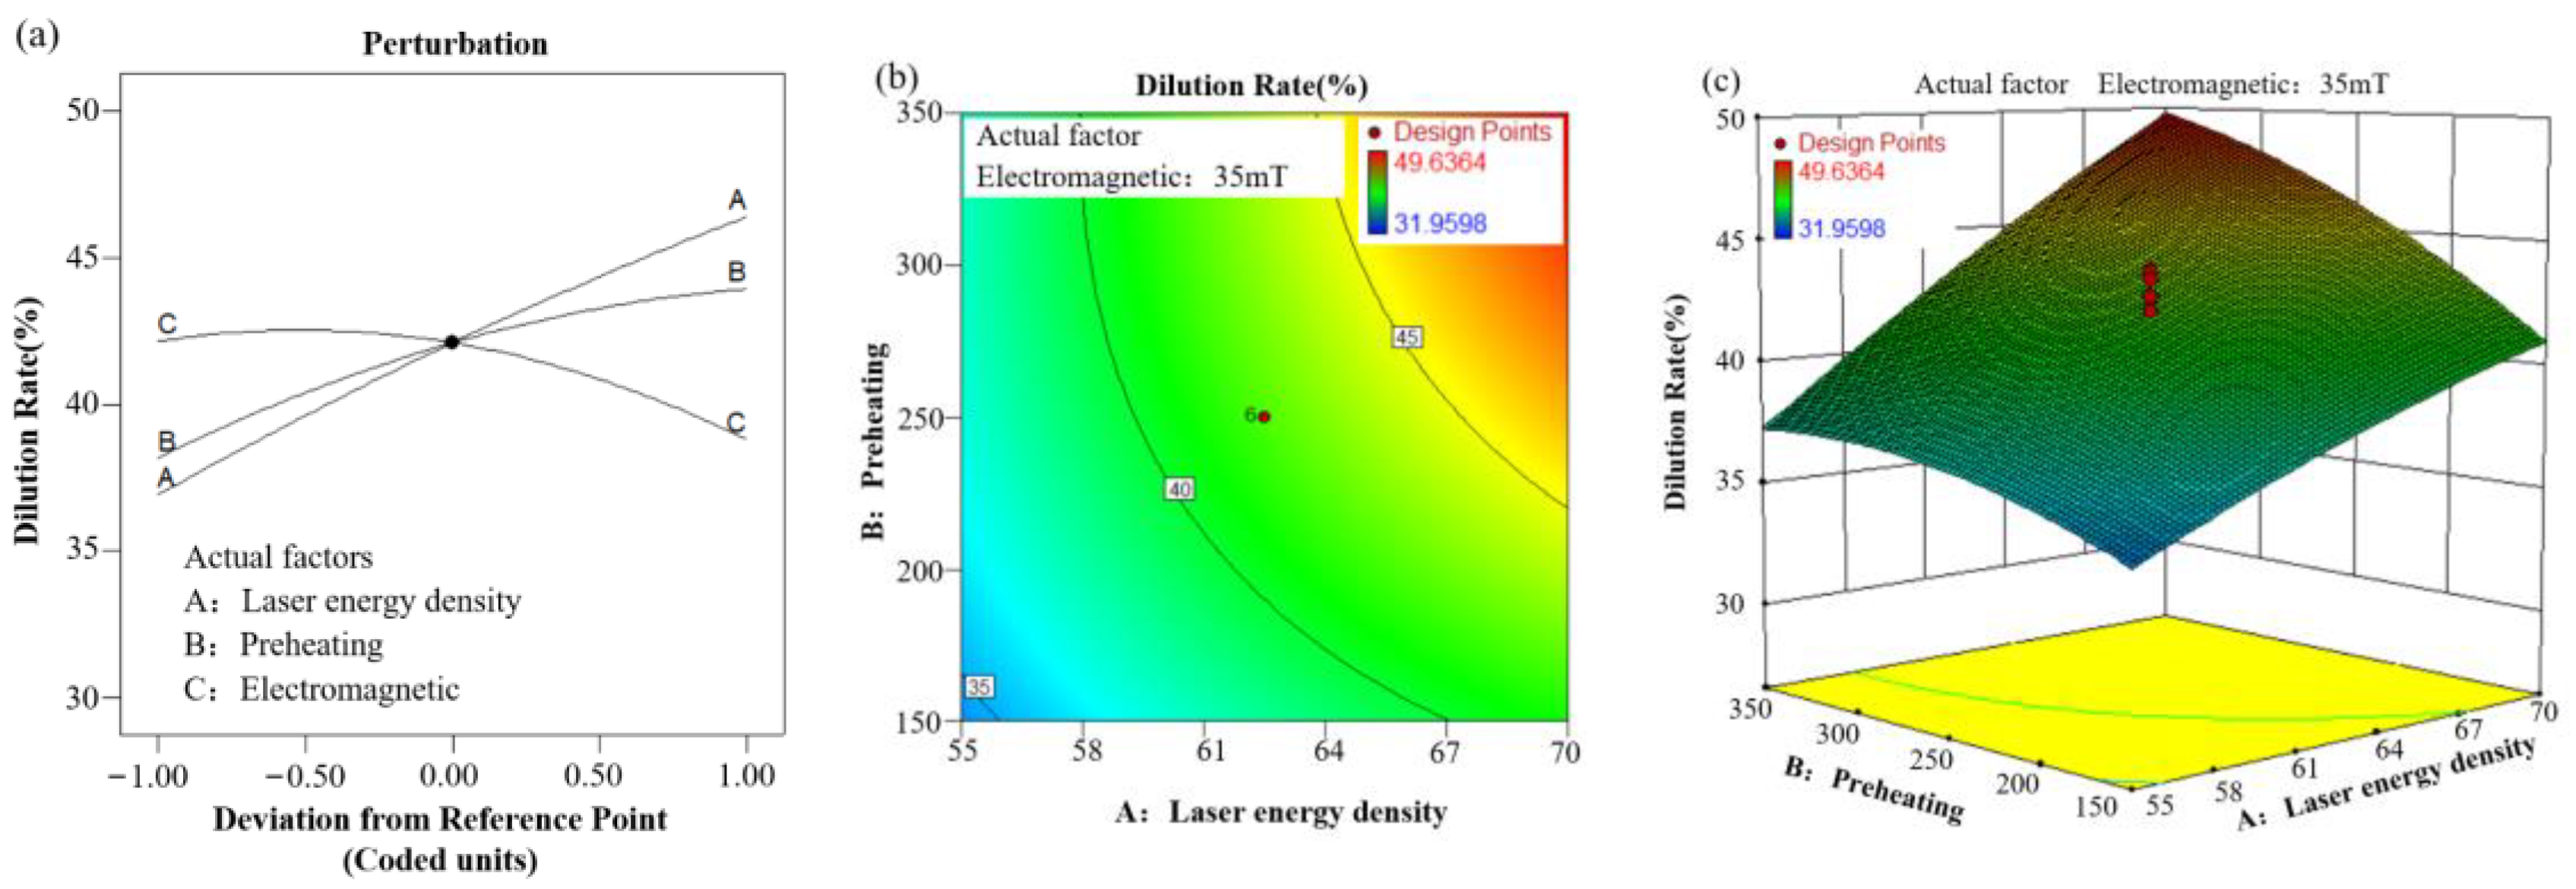
3.2.1. Dilution Ratio

Figure 10 shows a plot of the interaction effect of parameters on the coating dilution rate. According to the display of the uptake curves shown in Figure 10a, the electromagnetic strength suppresses the increase in dilution rate, and this law has a similarity with the study of Zhai et al. [37]; the change in electromagnetic intensity is inversely proportional to the change in dilution rate. The laser energy density and preheating temperature are directly proportional to the dilution rate. Both laser energy density and preheating temperature tend to increase the absorption of laser light by the substrate, increase the temperature of the molten pool, and promote the Marangoni convection effect in the molten pool [38,39]. Since the transient melt pool of the fusion coating is in the liquid state, the increase in dilution rate is further explained by combining the equation of the dynamic viscosity of the liquid and the equation of the laser absorption rate as shown in Equations (17) and (18) [30,40].
μ = 16 15 m k T γ
where m is the atomic mass, k is Boltzmann’s constant, T is the temperature, and γ is the surface tension of the liquid.
l a = 1 l r = 4 n μ ( n + μ ) 2 + k 2
where n is the refractive index of the substrate; µ is the magnetic permeability, which is normally 1 for most materials, and is taken as µ = 1 in this thesis; k is the energy absorption index; where n and k normally increase with increasing substrate temperature.
From Equation (17) above, it can be seen that when the temperature of the liquid increases, the dynamic viscosity of the liquid decreases, which allows the liquid to diffuse, resulting in a low-melting-high coating. Of course, the dynamic viscosity should not be too low, otherwise undesired microscopic defects will occur, which means a suitable heat input. According to Equation (18), when both preheating and laser energy are applied to the substrate, a significant increase in the substrate temperature is induced, which increases the absorption rate of the laser, resulting in a larger size of the fusion depth. The combined effect of Equations (17) and (18) on the molten pool shows that the melting height decreases and the melting depth increases, which will inevitably cause an increase in the dilution rate. Combining Figure 10b,c, it can be seen that when the electromagnetic intensity is 35 mT, the proper laser energy density and preheating temperature have a positive effect on the overall performance of the molten pool, and it has been shown in the literature that too high or too low a dilution rate reduces the overall performance of the coating [41].

3.2.2. Porosity

Figure 11 shows the interaction effect of parameters on coating porosity. According to Figure 11a, the preheating reduces the coating porosity; this is because preheating helps to change the cooling rate of the molten pool, which will affect the rate of escape of the porosity, which can be better explained by combining with the cooling rate equation as shown in Equation (19). It can be seen that increasing the preheating temperature Tc, when all other conditions remain constant, will result in a lower cooling rate of the molten pool, thus ensuring that the air holes have sufficient time to escape under the action of the Marangoni convection in the molten pool [42].
q = d T d t = 2 π λ ( T c T 0 ) E
where T0 is the initial temperature of the substrate, q is the instantaneous cooling rate of the melt pool, Tc is the instantaneous temperature at the desired cooling temperature, and E is the energy density of the laser.
In addition, from Figure 11a it can also be observed that the porosity shows a tendency to decrease, followed by an increase with the increase of laser energy density and electromagnetic intensity. Combined with Equation (19), it can be discovered that an increase in laser energy density causes a decrease in the cooling of the molten pool, which facilitates the escape of the pores, but too large a laser energy density can trigger cracks [43]. According to Hu et al. [44], the optimal condition for the escape of air holes is that the air holes are subjected to a downward Lorentz force, whereas an increase in the strength of the alternating magnetic field triggers both upward and downward Lorentz forces, which undoubtedly hinders the smooth escape of air holes. Combining the interactive effects of the factors on the coating porosity shown in Figure 11b,c, it can be noticed that when the value of the electromagnetic intensity is 35 mT, a larger preheating temperature and a lower laser energy density contribute to the escape of the air holes.

3.2.3. Microhardness

Figure 12 shows the interaction effect of parameters on coating microhardness. From the regression diagram shown in Figure 12a, it can be shown that the preheating temperature promotes the improvement of the microhardness of the coatings, while the increase of electromagnetic intensity and laser energy density caused the microhardness to undergo an increase and then a decrease. The increase in microhardness by these factors can be explained in conjunction with the Hall-Petch theory, as shown in Equation (20).
σ = σ 0 + k d 1 / 2
where σ is the tensile or yield strength, σ0 and k are material constants, and d is the average grain size of the material.
From the above equation, it can be known that the increase in microhardness is proportional to the root square of the reciprocal of the grain size, i.e., when the grain size is smaller, the higher is the microhardness exhibited. The preheating of the substrate reduces the temperature gradient during the solidification of the molten pool, and in combination with the ratio of the temperature gradient to the cooling rate, it can be found that smaller- sized grains can be formed inside the coating. In addition, the coating is also affected by the applied electromagnetic force, and the Marangoni convection is more intense, increasing the stirring of the molten pool and allowing further grain refinement. From Figure 12b,c, it can be found that a lower laser energy density and a larger preheating temperature contribute to the hardness, which is the same pattern found in the above analysis of the effect on porosity.

3.3. Optimized Implementation

3.3.1. Multi-Objective Process Optimization

The objective of the multi-objective optimization of the process carried out in this study was to obtain the best combination of magnetic-thermal-assisted cladding processes to prepare self-lubricating coatings with good formability. The requirement of good formability of the coating is to ensure the minimum dilution rate, minimum porosity, and maximum microhardness within the specified constraints; the optimization model, i.e., the fitness function of MOPSO is shown in Equation (14), Equation (15), and Equation (16), respectively, and the constraints of the model are shown in Equation (21).
{ 55   J / m m 2 A 70   J / m m 2 150   ° C B 350   ° C 20   m T C 50   m T
The algorithm programming of MOPSO is implemented based on MATLAB, and the main parameter settings are the following: the population size is 200, the maximum number of iterations of the population is 300, the individual learning coefficients and global learning coefficients are 1.5, the inertia weights w and the inertia weight decay rate wdamp are 0.9 and 0.99, respectively, and the Pareto solution set obtained by the optimization consists of 30 non-dominated individuals. Figure 13 shows the Pareto solution set, where different colored data points represent different solutions.

3.3.2. Integrated Decision-Making Based on IAE-TOPSIS

For the Pareto solution set obtained by the above optimization, the subjective weight coefficients obtained by using AHP are ω i = (0.11,0.41,0.48)T, and the objective weight coefficients obtained by EWM are ω j = (0.34,0.31,0.34)T. After combining both of them by using Equation (16), the combined subjective-objective weight coefficients of ω = (0.23,0.36,0.41)T are obtained. Then the subjective and objective weighting coefficients are assigned in TOPSIS, and the relative closeness, i.e., the comprehensive score, of each group of Pareto solutions is calculated according to Equations (12) and (13), and the comprehensive evaluation ranking table is obtained, as shown in Table 9 for the first ten groups of the Pareto solution sets of the comprehensive evaluation ranking.

3.4. Verification

To verify the reliability of the optimization results of the algorithm, the optimal group in the Pareto solution set was verified by using an experimental method. The results indicate the optimal process combination: the laser energy density of 56.8 J/mm2, the preheating temperature of 350 °C, the electromagnetic intensity of 49.1 mT, the dilution rate of 35.6%, the porosity of 0.62%, and the microhardness of 416.29 HV0.5 are obtained. The error is less than 3% compared to the results of the algorithm optimization, which are obtained by the dilution rate of 36.17%, the porosity of 0.64%, and the microhardness of 420.59 HV0.5, which shows the effectiveness of the algorithm in parameter optimization.
To further investigate the mechanism of magnetic-thermal-assisted synergistic effect on the coating, the cross-sectional morphology and micro-morphology under the process without assisted field (the laser energy density of 56.8 J/mm2) and the optimal process of magnetic-thermal-assisted cladding were analyzed, as shown in Figure 14. From the macroscopic morphology shown in Figure 14a,d, it can be observed that the porosity is significantly improved and the dilution rate is changed from 13.53% to 35.6%. For the magnification of any position in the middle of the coating morphology, it can be observed that under the magneto-thermal-assisted field, the tissue of the coating (Figure 14b,e) is shorter and more homogeneous, and changes from the larger dendritic crystals to the shorter dendritic crystals and some of the cellular-like dendrite, and the distribution of the graphite (black grain) morphology inside the coating (Figure 14c,f) tends to be more homogeneous as well. The main reason for the above changes is that under the magnetic-thermal-assisted field (Figure 14g), the preheating can effectively increase the speed of the escape of the internal pores [45], and under the action of the alternating magnetic field, the electromagnetic force can be triggered inside the coating (Equation (22)) [46], which can be divided into left-right varying magnetic force and up-down varying induced Lorentz force. The coarse columnar crystals are interrupted under the sufficient stirring of the electromagnetic force, which makes the tissues refined. As for graphite, it will be floated up and down by the induced Lorentz force under the electromagnetic force, which promotes the homogenization of graphite, which is also conducive to the better performance of graphite in wear reduction and wear resistance [47,48].
F = J × B = 1 μ [ ( Δ × B ) × B ] = Δ ( 1 2 μ B 2 ) + 1 μ ( B Δ ) B
where J is the induced current; µ is the metallic permeability; is the Hamiltonian operator; and B is the magnetic induction.

4. Conclusions

In this study, a co-optimization method of magneto-thermal-assisted cladding process is proposed, and meanwhile, the future development trend of this method is also summarized based on the general background of artificial intelligence. The details are as follows.
(1) A reliable predictive model of the coating’s response has been developed. The main influences on the dilution rate were found to be the laser energy density and the preheating temperature, the porosity was strongly influenced by the preheating temperature, and the microhardness was enhanced by the combined effect of magneto-thermal;
(2) The MOPSO-AE-TOPSIS optimization method was applied to achieve the optimal selection of multi-objective process parameters. The optimal process combination was the laser energy density of 56.8 J/mm2, the preheating temperature of 350 °C, and the electromagnetic intensity of 49.1 mT. And the response values for this parameter were the dilution of 35.6%, the porosity of 0.62%, and the microhardness of 416.29 HV0.5. The mechanism of magnetic-thermal assistance on the enhancement of wear resistance of coatings is revealed from a microscopic point of view;
(3) The optimization method proposed in this paper still has the problem of large computational workload, which should be followed up by the development of intelligent hybrid algorithms and the establishment of an intelligent process database to provide a more convenient operation for process optimization.

Author Contributions

The author contributions are as follows: J.G. contributed to the editing of the manuscript and the analysis of the data, L.S. contributed to the conception and design, C.Z. contributed to the operation of the experiments, J.Q. contributed to the construction of the experimental platform, W.H. contributed to the analysis of the microstructure, and A.L. contributed to the handling of the specimens. All authors have read and agreed to the published version of the manuscript.

Funding

This research was funded by the National Natural Science Foundation of China (No. 52075544), Shaanxi Qinchuangyuan “Scientist + Engineer” Team Construction Project (No. 2023KXJ-123), Shaanxi Provincial Department of Education General Special Scientific Research Program Project (No. 22JK0312), Shaanxi University of Technology Graduate Student Innovation Fund Project (No. SLGYCX2311), and Shaanxi University of Technology Scientific Research Program (No. SLGKYXM2306).

Institutional Review Board Statement

Not applicable.

Informed Consent Statement

Not applicable.

Data Availability Statement

Not applicable.

Conflicts of Interest

The authors declare no conflict of interest.

References

  1. Ding, Z.C.; Fang, Z.Y.; Wang, G.Y.; Wu, C.C.; Yang, S. Microstructure and properties of Mo-Si-B-Y2O3 composite coating on nickel-based alloy by laser cladding. Opt. Laser. Technol. 2023, 164, 109473. [Google Scholar] [CrossRef]
  2. Sun, Y.; Gao, J.; Wang, K.N.; Song, Q.; Cui, H.Z.; Li, W.S.; Wang, C.M. The effect of multi-element alloying on the structure and properties of laser cladding nickel-based coatings. Surf. Coat. Technol. 2023, 454, 129174. [Google Scholar] [CrossRef]
  3. Yong, Y.W.; Fu, W.; Zhang, X.; Deng, Q.L.; Yang, J.G. In-situ Synthesis of WC/TaC Reinforced Nickel-Based Composite Alloy Coating by Laser Cladding. Rare Metal. Mater. Eng. 2017, 46, 3176–3181. [Google Scholar] [CrossRef]
  4. Liu, X.B.; Liu, H.Q.; Meng, X.J.; Sun, C.F.; Wang, M.D.; Qi, L.H.; Shi, G.L.; Wu, S.H. Effects of aging treatment on microstructure and tribological properties of nickel-based high-temperature self-lubrication wear resistant composite coatings by laser cladding. Mater. Chem. Phys. 2014, 143, 616–621. [Google Scholar] [CrossRef]
  5. Kumar, R.; Torres, H.; Aydinyan, S.; Antonov, M.; Varga, M.; Hussainova, I.; Rodriguez Ripoll, M. Tribological behavior of Ni-based self-lubricating claddings containing sulfide of nickel, copper, or bismuth at temperatures up to 600 °C. Surf. Coat. Technol. 2023, 456, 129270. [Google Scholar] [CrossRef]
  6. Zhao, Y.; Feng, K.; Yao, C.W.; Nie, P.L.; Huang, J.; Li, Z.G. Microstructure and tribological properties of laser cladded self-lubricating nickel-base composite coatings containing nano-Cu and h-BN solid lubricants. Surf. Coat. Technol. 2019, 359, 485–494. [Google Scholar] [CrossRef]
  7. Xu, T.Z.; Zhang, S.; Wang, Z.Y.; Zhang, C.H.; Zhang, D.X.; Wang, M.; Wu, C.L. Wear behavior of graphite self-lubricating Babbitt alloy composite coating on 20 steel prepared by laser cladding. Eng. Fail. Anal. 2022, 141, 106698. [Google Scholar] [CrossRef]
  8. Liu, Q.X.; Pang, M.; Chen, J.; Liu, G.; Zhang, L.J. Microstructure and properties characterization of Ti-containing Ni60/Graphite self-lubricating composite coatings applied on 300M ultra-high strength Steel by Laser Cladding. Mater. Chem. Phys. 2021, 266, 124554. [Google Scholar] [CrossRef]
  9. Yan, H.; Chen, Z.F.; Zhao, J.; Zhang, P.L.; Yu, Z.S.; Lu, Q.H. Enhancing tribological properties of WS2/NbC/Co-based self-lubricating coating via laser texturing and laser cladding two-step process. J. Mater. Res. Technol. 2020, 9, 9907–9919. [Google Scholar] [CrossRef]
  10. Yuan, J.H.; Yao, Y.G.; Zhuang, M.X.; Du, Y.Y.; Wang, L.; Yu, Z.S. Effects of Cu and WS2 addition on microstructural evolution and tribological properties of self-lubricating anti-wear coatings prepared by laser cladding. Tribol. Int. 2021, 157, 106872. [Google Scholar] [CrossRef]
  11. Torres, H.; Caykara, T.; Rojacz, H.; Prakash, B.; Rodríguez Ripol, M. The tribology of Ag/MoS2-based self-lubricating laser claddings for high temperature forming of aluminum alloys. Wear 2019, 442–443, 203110. [Google Scholar] [CrossRef]
  12. Liu, Q.; Wang, Y.; Bai, Y.; Li, Z.D.; Bao, M.Y.; Zhan, H.; Liu, N.; Chang, Z.D.; Ma, Y.S. Microstructural optimization and anti-wear performance of supersonicatmospheric plasma sprayed nickel based self-lubricating coatings under heavy load. Surf. Coat. Technol. 2021, 421, 127383. [Google Scholar] [CrossRef]
  13. Zhen, J.M.; Li, F.; Zhu, S.Y.; Ma, J.Q.; Qiao, Z.H.; Liu, W.M.; Yang, J. Friction and wear behavior of nickel-alloy-based high temperature self-lubricating composites against Si3N4 and Inconel 718. Tribol. Int. 2014, 75, 1–9. [Google Scholar] [CrossRef]
  14. Chen, Z.; Wagner, J.; Turq, V.; Hillairet, J.; Taberna, P.L.; Laloo, R.; Duluard, S.; Bernard, J.M.; Song, Y.; Yang, Q.; et al. Surfactant-assisted electrodeposition of Au–Co/WS2 self-lubricating coating from WS2 suspended cyanide electrolyte. J. Alloys Compd. 2020, 829, 154585. [Google Scholar] [CrossRef]
  15. Torres, H.; Panaitescu, I.; Gangl, R.; Hubmann, R.; Scheerer, M.; Rodríguez Ripoll, M. Laser metal deposition of self-lubricating alloys on selective laser melting maraging tools for the high temperature forming of aluminium. Wear 2023, 545–525, 204883. [Google Scholar] [CrossRef]
  16. Chen, L.; Chen, W.G.; Li, D.Y.; Jing, P.Y.; Yin, H.Z.; Wu, H.J.; Xie, Y.; Wang, X.N. Effect of nano-La2O3 doping on the tribological behavior of laser cladded WC-12Co coating on 65Mn steel under water lubrication condition. Tribol. Int. 2022, 169, 107428. [Google Scholar] [CrossRef]
  17. Lei, K.Y.; Qin, X.P.; Liu, H.M.; Ni, M. Analysis and modeling of melt pool morphology for high power diode laser cladding with a rectangle beam spot. Opt. Lasers Eng. 2018, 110, 89–99. [Google Scholar] [CrossRef]
  18. Wu, S.; Liu, Z.H.; Gong, Y.; Liang, X.B.; Wu, Y.F.; Zhao, X. Analysis of the sequentially coupled thermal–mechanical and cladding geometry of a Ni60A-25 %WC laser cladding composite coating. Opt. Laser Technol. 2023, 167, 109595. [Google Scholar] [CrossRef]
  19. Cui, G.J.; Feng, X.G.; Han, W.P.; Liu, Y.P.; Kou, Z.M. Microstructure and high temperature wear behavior of in-situ synthesized carbides reinforced Mo-based coating by laser cladding. Surf. Coat. Technol. 2023, 467, 129713. [Google Scholar] [CrossRef]
  20. Feng, Y.L.; Feng, K.; Feng, Y.Q.; Li, Z.G. Influence of residual stress on the cracking of the laser-cladded high-hardness coating. Mater. Lett. 2023, 349, 134715. [Google Scholar] [CrossRef]
  21. Cen, L.; Du, W.B.; Gong, M.C.; Lu, Y.; Zhang, C.; Gao, M. Effect of high-frequency beam oscillation on microstructures and cracks in laser cladding of Al-Cu-Mg alloys. Surf. Coat. Technol. 2022, 447, 128852. [Google Scholar] [CrossRef]
  22. Liu, Y.C.; Zhan, X.H.; Yi, P.; Liu, T.; Liu, B.L.; Wu, Q. Research on the transformation mechanism of graphite phase and microstructure in the heated region of gray cast iron by laser cladding. Opt. Laser Technol. 2018, 100, 19–86. [Google Scholar] [CrossRef]
  23. Pellizzari, M.; Zhao, Z.; Bosetti, P.; Perini, M. Optimizing direct laser metal deposition of H13 cladding on CuBe alloy substrate. Surf. Coat. Technol. 2022, 432, 128084. [Google Scholar] [CrossRef]
  24. Wang, H.Z.; Cheng, Y.H.; Yang, J.Y.; Liang, X.B. Microstructure and properties of Fe based amorphous coatings deposited by laser cladding under different preheating temperatures. J. Non-Cryst. Solids 2023, 602, 122081. [Google Scholar] [CrossRef]
  25. Zhuang, D.D.; Tao, W.W.; Ni, H.M.; Wang, A.Z.; Du, B.; Zhang, S.H.; Lian, X.L.; Wang, D.; Feng, Y.J. TiC distribution and properties of TiC-CrMnFeCoNi coating fabricated by laser cladding with ultrasound. Surf. Coat. Technol. 2023, 468, 129744. [Google Scholar] [CrossRef]
  26. Huo, K.; Zhou, J.Z.; Dai, F.Z.; Xu, J.L. Particle distribution and microstructure of IN718/WC composite coating fabricated by electromagnetic compound field-assisted lasercladding. Appl. Surf. Sci. 2021, 545, 149078. [Google Scholar] [CrossRef]
  27. Chen, Y.B.; Zhou, J.Z.; Li, P.F.; Huo, K.; Meng, X.K. Effect of Electromagnetic Field on Wear Resistance of Fe901/Al2O3 Metal Matrix Composite Coating Prepared by Laser Cladding. Materials 2022, 15, 1531. [Google Scholar] [CrossRef] [PubMed]
  28. Shi, Y.J.; Zhou, X.Y.; Wang, X.G.; Feng, X.T.; Peng, L.D. Effects of Electromagnetic Fields on the Microstructure of Laser Cladding. Materials 2022, 12, 4198. [Google Scholar] [CrossRef]
  29. Zhang, T.; Zhou, J.Z.; Wang, J.Z.; Meng, X.K.; Li, P.F.; Huang, S.; Zhu, H. Effect of hybrid ultrasonic-electromagnetic field on cracks and microstructure of Inconel 718/60%WC composites coating fabricated by laser cladding. Ceram. Int. 2022, 48, 33901–33913. [Google Scholar] [CrossRef]
  30. Nyadongo, S.T.; Olakanmi, E.O.; Pityana, S.L. Experimental and numerical analyses of geometrical and microstructural features of Tribaloy T-800 composite coating deposited via laser cladding-assisted with pre-heat (LCAP) process. J. Manuf. Process. 2021, 69, 84–111. [Google Scholar] [CrossRef]
  31. Li, Z.Q.; Du, Y.B.; He, G.H.; Liang, Q. Parameters optimization for single-track laser cladding based on MPA-SVR and A-NSGA-III. Opt. Laser. Technol. 2024, 169, 110069. [Google Scholar] [CrossRef]
  32. Cang, X.Y.; Shu, L.S.; Li, P.Y.; Zhou, J.; Hu, N.; Yu, H.L. Establishment and experimental verification of a three-dimensional finite element model for residual stress in surface processing of Inconel 718 alloy by laser cladding. Mater. Today. Commun. 2023, 37, 107008. [Google Scholar] [CrossRef]
  33. Shu, L.S.; Wu, H.; Heng, Z.; Li, J.H.; Cang, X.Y. Optimization, Microstructure, and Properties of Ti-6Al-4 V Coatings Fabricated by Laser Cladding. J. Mater. Eng. Perform. 2023, 32, 7946–7959. [Google Scholar] [CrossRef]
  34. Dehdarinejad, E.; Bayareh, M. Performance analysis of a novel cyclone separator using RBFNN and MOPSO algorithms. Powder Technol. 2023, 426, 118663. [Google Scholar] [CrossRef]
  35. Tian, Z.N.; Zhang, Z.Q.; Zhang, K.W.; Tang, X.M.; Huang, S.L. Statistical modeling and multi-objective optimization of road geopolymer grouting material via RSM and MOPSO. Constr. Build. Mater. 2021, 271, 121534. [Google Scholar] [CrossRef]
  36. SELLAMI, R.; SHER, F.; NEJI, R. An improved MOPSO algorithm for optimal sizing & placement of distributed generation: A case study of the Tunisian offshore distribution network (ASHTART). Energy Rep. 2022, 8, 6960–6975. [Google Scholar] [CrossRef]
  37. Zhai, L.L.; Ban, C.Y.; Zhang, J.W.; Yao, X.Y. Characteristics of dilution and microstructure in laser cladding Ni-Cr-B-Si coating assisted by electromagnetic compound field. Mater. Lett. 2019, 243, 195–198. [Google Scholar] [CrossRef]
  38. Farahmand, P.; Kovacevic, R. Laser cladding assisted with an induction heater (LCAIH) of Ni–60%WC coating. J. Mater. Process. Technol. 2015, 222, 244–258. [Google Scholar] [CrossRef]
  39. Liu, L.C.; Wang, G.; Ren, K.; Di, Y.L.; Wang, L.P.; Rong, Y.M.; Wang, H.D. Marangoni flow patterns of molten pools in multi-pass laser cladding with added nano-CeO2. Addit. Manuf. 2022, 59, 103156. [Google Scholar] [CrossRef]
  40. Volpp, J. Laser beam absorption measurement at molten metal surfaces. Measurement 2023, 209, 112524. [Google Scholar] [CrossRef]
  41. Zhang, T.; Zhou, J.Z.; Lv, J.; Meng, X.K.; Li, P.F.; Huang, S. A novel hybrid ultrasonic and electromagnetic field assisted laser cladding: Experimental study and synergistic effects. J. Mater. Process. Technol. 2022, 307, 117658. [Google Scholar] [CrossRef]
  42. Wu, Z.P.; Li, T.; Li, Q.; Shi, B.W.; Li, X.B.; Wang, X.L.; Lu, H.T.; Zhang, H.C. Process optimization of laser cladding Ni60A alloy coating in remanufacturing. Opt. Laser. Technol. 2019, 120, 105718. [Google Scholar] [CrossRef]
  43. Luu, D.N.; Zhou, W.; Nai, S.M.L. Mitigation of liquation cracking in selective laser melted Inconel 718 through optimization of layer thickness and laser energy density. J. Mater. Process. Technol. 2022, 299, 117374. [Google Scholar] [CrossRef]
  44. Hu, Y.; Wang, L.; Yao, J.H.; Xia, H.C.; Li, J.H.; Liu, R. Effects of electromagnetic compound field on the escape behavior of pores in molten pool during laser cladding. Surf. Coating. Technol. 2020, 383, 125198. [Google Scholar] [CrossRef]
  45. Zhou, S.; Huang, Y.; Zeng, X. A study of Ni-based WC composite coatings by laser induction hybrid rapid cladding with elliptical spot. Appl. Surf. Sci. 2008, 254, 3110–3119. [Google Scholar] [CrossRef]
  46. Wang, L.; Yao, J.; Hu, Y.; Zhang, Q.; Sun, Z.; Liu, R. Influence of electric-magnetic compound field on the WC particles distribution in laser melt injection. Surf. Coat. Technol. 2017, 315, 32–43. [Google Scholar] [CrossRef]
  47. Ding, H.; Dai, J.W.; Dai, T.; Sun, Y.W.; Lu, T.; Li, M.; Jia, X.J.; Huang, D.S. Effect of preheating/post-isothermal treatment temperature on microstructures and properties of cladding on U75V rail prepared by plasma cladding method. Surf. Coat. Technol. 2020, 399, 126122. [Google Scholar] [CrossRef]
  48. Torres, H.; Podgornik, B.; Jovičević-Klug, M.; Rodríguez Ripoll, M. Compatibility of graphite, hBN and graphene with self-lubricating coatings and tool steel for high temperature aluminum forming. Wear 2022, 490–491, 204187. [Google Scholar] [CrossRef]
Figure 1. Morphology of the substrate and the powders (a) 2D diagram of the substrate; (b) 3D diagram of the substrate; (c) the SEM morphology of the powders; (d) the magnified topography of the powders.
Coatings 13 01749 g001
Figure 2. Schematic diagram of electromagnetic-preheating-assisted laser cladding system.
Coatings 13 01749 g002
Figure 3. Measurement and formulas for calculation of response.
Coatings 13 01749 g003
Figure 4. Process co-optimization strategy flowchart.
Coatings 13 01749 g004
Figure 5. Hierarchical model of the quality response of the coatings.
Coatings 13 01749 g005
Figure 6. Cross-sectional morphology.
Coatings 13 01749 g006
Figure 7. Validation plots of the model for the dilution rate; (a) Plot of the normal distribution of the residuals; (b) Plot of the predicted values versus the actual values.
Coatings 13 01749 g007
Figure 8. Validation plots of the model for the porosity; (a) Plot of the normal distribution of the residuals; (b) Plot of the predicted values versus the actual values.
Coatings 13 01749 g008
Figure 9. Validation plots of the model for the microhardness; (a) Plot of the normal distribution of the residuals; (b) Plot of the predicted values versus the actual values.
Coatings 13 01749 g009
Figure 10. Interaction of parameters on the dilution rate of the coating; (a) Regression plot; (b) Contour plot; (c) 3D response surface curve.
Coatings 13 01749 g010
Figure 11. Interaction of parameters on the porosity of the coating; (a) Regression plot; (b) Contour plot; (c) 3D response surface curve.
Coatings 13 01749 g011
Figure 12. Interaction of parameters on the microhardness of the coating; (a) Regression plot; (b) Contour plot; (c) 3D response surface curve.
Coatings 13 01749 g012
Figure 13. The Pareto solution set.
Coatings 13 01749 g013
Figure 14. Morphology and mechanism analysis of coatings; (a) macroscopic morphology without auxiliary field; (b) magnified tissue in any region; (c) magnified image of SEM; (d) macroscopic morphology without auxiliary field; (e) magnified tissue in any region; (f) magnified image of SEM; (g) mechanism of magnetic-thermal synergistic effect on coatings.
Coatings 13 01749 g014
Table 1. Chemical composition of matrix materials (mass fraction, wt.%).
ElementCrMnCSiMoFe
42CrMo0.980.640.4380.270.18Bal.
Table 2. Chemical composition of powders (mass fraction, wt.%).
ElementNiCrNbMoTiAlCFe
In71852.618.755.253.030.970.350.04Bal.
Ni-clad graphite75-----25-
Table 3. Level table of CCD test factors.
Level of FactorLaser Energy Density (J/mm2)Preheating Temperature (°C)Electromagnetic Intensity (mT)
149.9829.8
25515020
362.525035
47035050
575.141860.2
Table 4. 1–9 Scaling methods.
ScaleElement
1i is as important as j
3i is slightly more important than j
5i is significantly more important than j
7i is more strongly important than j
9i is more important than j
2, 4, 6, 8Judgment of importance between the above
ReciprocalContrary to the above level of importance
Table 5. Experimental results.
Run OrderProcess ParametersResponse
A
(J/mm2)
B
(°C)
C
(mT)
Dilution Rate (%)Porosity (%)Microhardness (HV0.5)
170.01502041.092.01332.50 ± 9.76
262.52506035.731.31358.23 ± 9.85
362.52503542.140.70419.40 ± 12.95
475.12503549.641.89313.30 ± 20.35
555.01505031.963.01351.73 ± 19.88
662.5823533.543.33322.59 ± 23.23
749.92503532.262.08365.80 ± 19.14
862.52503542.740.63420.26 ± 19.78
962.52503539.810.53435.60 ± 17.81
1062.52503543.420.72397.33 ± 18.00
1162.54183544.951.03412.52 ± 17.89
1255.01502034.942.45362.53 ± 10.37
1370.01505037.642.38304.60 ± 9.43
1462.52503543.720.71425.13 ± 22.52
1570.03505045.770.89390.25 ± 22.46
1662.52501039.431.83355.47 ± 18.34
1762.52503540.800.68435.50 ± 12.26
1855.03505031.960.80416.08 ± 6.61
1955.03502039.081.79384.80 ± 24.94
2070.03502049.021.62371.83 ± 23.53
Table 6. ANOVA of dilution rate.
SourceSum of SquaresdfMean SquareF-Valuep-Value
Model531.29959.0327.27<0.0001Significant
A307.541307.54142.07<0.0001
B113.594113.5952.47<0.0001
C38.78138.7817.920.0017
AB17.74117.748.200.0169
B215.67115.677.240.0227
C238.39138.3917.730.0018
Residual21.65102.16
Lack of Fit9.9651.990.850.5677Not significant
R20.9609 Pre-R20.8260
Adj-R20.9256 Adequate Precision17.906
Table 7. ANOVA of Porosity.
SourceSum of SquaresdfMean SquareF-Valuep-Value
Model13.4691.5094.24<0.0001Significant
A0.1610.169.970.0102
B5.4445.44342.77<0.0001
C0.2010.2012.790.0050
AB0.1210.127.720.0195
BC0.8810.8855.33<0.0001
A22.8312.83178.10<0.0001
B23.7712.83237.88<0.0001
C21.2611.2679.63<0.0001
Residual0.16100.016
Lack of Fit0.1350.0275.130.0485Not significant
R20.9883 Pre-R20.9204
Adj-R20.9779 Adequate Precision28.167
Table 8. ANOVA of microhardness.
SourceSum of SquaresdfMean SquareF-Valuep-Value
Model30668.4293407.6021.23<0.0001Significant
A3054.8613054.8619.030.0014
B9640.2519640.2560.05<0.0001
BC976.821976.826.08<0.0001
A29986.1419986.1462.20<0.0001
B23886.6913886.6924.210.0006
C25884.6115884.6136.66<0.0001
Residual1605.3910160.54
Lack of Fit610.235122.050.610.6977Not significant
R20.9503 Pre-R20.8128
Adj-R20.9055 Adequate Precision13.720
Table 9. Comprehensive evaluation ranking of Pareto solution sets.
RankA
(J/mm2)
B
(°C)
C
(mT)
DRPorosityMicrohardness
(HV0.5)
Synthesis Score
156.835049.136.170.64420.590.867
258.435048.537.670.52425.730.859
356.434250.035.580.69417.010.854
457.835047.537.490.55426.120.852
558.532248.937.580.55422.950.851
659.835050.038.360.45424.710.847
757.335045.937.580.58427.150.845
858.835047.238.430.48428.500.843
956.434545.137.030.66424.940.837
1056.535044.637.190.66425.770.832
Disclaimer/Publisher’s Note: The statements, opinions and data contained in all publications are solely those of the individual author(s) and contributor(s) and not of MDPI and/or the editor(s). MDPI and/or the editor(s) disclaim responsibility for any injury to people or property resulting from any ideas, methods, instructions or products referred to in the content.

