Article

Research on Simulation of Coating Fusion and Solidification Process in Electro-Spark Deposition

1
School of Mechanical Engineering, Dalian Jiaotong University, Dalian 116028, China
2
Qingdao Metro Operation Co., Ltd., Qingdao 266000, China
*
Author to whom correspondence should be addressed.
Coatings 2023, 13(11), 1865; https://doi.org/10.3390/coatings13111865
Submission received: 25 September 2023 / Revised: 19 October 2023 / Accepted: 24 October 2023 / Published: 31 October 2023

Abstract

:
As a surface-strengthening technology, electro-spark deposition (ESD) is widely used in the strengthening and repair of key components of high-end equipment. In this paper, a fusion and solidification model of ESD coating is established. The method of heat–fluid–solid interaction is adopted to simulate the material’s flow and fusion process in the droplet dropping into the molten pool. The distribution law of the coating-matrix material inside the coating was studied. Through the heat transfer between the molten material and the matrix material, the condensation and solidification process of the coating-matrix material is simulated, the temperature change in the coating area during the solidification process is analyzed, and the solidification law of the molten material is studied. The results show that the deposition time reaches 80 μs, and the content of electrode material at the bottom of the molten pool reaches 4.5%. The content of electrode material in the upper region of the material gushing out of the molten pool is higher than that in the bottom region. The material outside the molten pool solidifies first, and the molten material in the molten pool gradually solidifies from the bottom up; the shape of the solidification interface is similar to the boundary of the molten pool. Through the single-point deposition experiment of electro-spark deposition, the surface morphology of the deposition point was observed. The depth of the concave part of the contour can reach 16 μm. The difference between the two contour curves in the horizontal direction is not much; the error of the diameter is about 4%. The element distribution of the surface and the section of the deposition point are analyzed. The diffusion distance in the depth direction of the coating is about 4μm, and the transverse diffusion distance inside the coating is 364 μm. The error is 7.6% compared with the experimental results. The cross-section structure of the deposition point was observed, and the error between the experimental results and the simulation results in diameter is about 11%. It was found that the material distribution in the sedimentary area is basically consistent with the simulation results, and the simulation results are verified from the side.

1. Introduction

In many fields, such as rail transportation, aerospace, metallurgy, etc., some essential parts often have surface failure problems, such as local wear and corrosion due to high-temperature and high-pressure working environments for long durations [1,2]. In order to achieve the lowest repair cost and the best repair effect, surface repairs of these surface failure parts are more economical than using new parts, and surface-strengthening technology plays a huge role. Through surface-strengthening technology, parts can be locally strengthened or repaired to make them reach or even exceed the original part’s quality and usage performance; this re-manufacturing technology has increasingly become a hot spot for people [3,4]. ESD is a surface-strengthening technology in which the electrode material is infiltrated into the matrix material by a pulse discharge of the power supply. The ESD coating and matrix material are metallurgically and closely bonded and have the characteristics of small heat input, a small heat-affected zone, and low repair costs, and has gradually become a widely used process method in the field of surface strengthening [5,6,7]. At present, ESD has been widely used in the repair of key components, such as generator rotors, aero-engine blades, and engine blocks. At the same time, researchers at home and abroad have prepared high-performance coatings such as cemented carbide coatings, cermet coatings, and amorphous alloy coatings through ESD technology, which significantly improves the wear resistance, corrosion resistance, and oxidation resistance of materials so as to meet the needs of equipment development in different fields [8,9]. However, the single-pulse discharge time is short, the energy is significant, and the deposition process is complex. The mechanism of ESD is not well understood. The material transition, fusion, and solidification process strongly impact the ESD deposition’s efficiency and the deposited layer’s quality; however, the lack of understanding of this microscopic process hinders the further widespread application of ESD techniques.
There are different understandings of the process of transition of electrode materials to the surface of the matrix material during the deposition process. Samsonov [10] believed that the material transfer between the electrode tip and the matrix occurs in the liquid state. Johnson and Sheldon [11] discovered two material transfer mechanisms: spherical mass transfer and jet mass transfer. When the gap gas forms a plasma with high thermal conductivity, it is mainly spherical mass transfer; the end of the electrode forms a droplet, which is accelerated to the matrix material by plasma flow, and the droplet hits the matrix material to form a typical sputter-like morphology. Jet mass transfer occurs in a plasma with low thermal conductivity, and the electrode material is transferred to the matrix material in the form of a fine spray in the plasma stream. Lešnjak and Tušek et al. [12] believed that when deposited, the electrode is in contact with the matrix material, the current is conducted between the two, the electrode tip and part of the matrix material reach the melting point, and during the process of heating and vibration of the electrode, part of the electrode material is separated in the form of droplets and transferred to the surface of the matrix material. Tušek et al. [13] estimated the size of the droplet using the weight of the droplet transition per unit time, and the average diameter of the WC droplet was about 80μm, and the average mass was about 40 μg. Liu et al. [14] established a physical model for the formation of single-pulse deposition points of rotating electrodes based on the theory of contact discharge: the huge energy when the two poles are in contact melts and vaporizes the material at the contact point, forming a narrow gap. The heat input intensifies the ionization of the gas, which meets the requirements of ESD under low voltage conditions, and the ESD causes the electrode and the matrix material to form droplets and molten pools, respectively. The droplet is accelerated during movement, hits the molten pool, and splashes outward. The rotation of the electrode also causes the molten metal to splash out of the molten pool. In terms of mass transition law, the electrode material is partially lost in the form of a solid phase, liquid phase, and gas phase during the transition process, so the reduced mass of the electrode is not equal to the mass obtained by the matrix [15,16]. Galinov and Luban [17] derived the approximate calculation formula for the melting and gasification mass of the two poles under single-pulse discharge based on the surface heat-source theory.
In order to explore the bonding process of ESD coatings, scholars all over the world have studied the microscopic surface morphology and interface behavior of coatings. Thamer et al. [18] found that the sedimentation trajectory is composed of a splash-and-steam-affected zone, overlap zone, and sedimentary zone, and the degree of overlap of the sedimentary sublayer is determined by the movement speed of the electrode relative to the matrix material. Due to the change in the matrix material’s surface topography by the deposition process, the increment of the thickness of the subsequently deposited coating is less than that of the first deposition. Ebrahimnia et al. [19] found that the boundary of the sedimentation point showed quasi-periodic inhomogeneity, and the material of the sedimentation point splashed outward, forming a narrow sediment at the edge of the sedimentation point, breaking during the process of splashing outward along the surface or towards the air, forming secondary droplets. The droplet hits the surface at a very high speed, and the impact force causes the center of the sedimentation point to form a valley shape. At the same time, because the sedimentation point solidifies instantaneously, there is no time for the impact waveform to decay to form a smooth surface, and finally, the sedimentary point forms an irregular shape. Kovacik et al. [20] deposited TiB2 on the surface of Ti6Al4V. They found that there was diffusion bonding between the matrix material and the sedimentary layer through element distribution, and part of the aluminum melted and diffused to the upper layer to form Al-Ti oxide; the vanadium in the matrix material also entered the TiB2 coating, but the concentration of both elements was relatively small. Chandrakant et al. [21] prepared a high-entropy alloy on the surface of AISI 410 stainless steel, observed the elemental distribution at the coating–matrix interface, and found that the Al, Co, and Ni elements of the high-entropy alloy were uniformly diffused into the matrix material. The concentration of the three elements gradually decreased with an increase in depth, and the decrease in microhardness indicated that there was an interface region and a diffusion region, and the diffusion of the elements led to solid-solution strengthening at the interface.
In conclusion, scholars have conducted certain research on the transfer and interface behaviors of ESD coating materials. They mainly studied the interface behavior of the coating through experimental research. However, due to the complexity of the ESD process, there is no unified conclusion on the material transfer process of ESD, and few people study the fusion and solidification of ESD coating and matrix materials through microscopic process simulation analysis so as to intuitively describe the material flow and distribution law of this process. There is a lack of research on the flow and distribution law of material that intuitively describes this process. The reliability of the combination of a coating and matrix will be reduced if the coating and matrix materials are not sufficiently fused. The study of the ESD coating fusion and solidification process plays a theoretical guiding role in the analysis and control of the ESD coating quality. In this paper, considering the effect of the diffusion phenomenon, the fusion and solidification process of ESD coating under the combined action of a plasma flow force and surface tension force is simulated, which provides research ideas and a basis for scholars to further explore ESD. Therefore, the fusion and solidification model of ESD coating is established in this paper, the method of thermal fluid–structure interaction is adopted, and the molten material’s fusion and solidification process in the flow process is simulated. The fusion law of the material in the coating is studied, the temperature change in the solidification process is analyzed, and the solidification law of the molten material is studied.

2. Coating Fusion and Solidification Process Model of Single-Pulse ESD

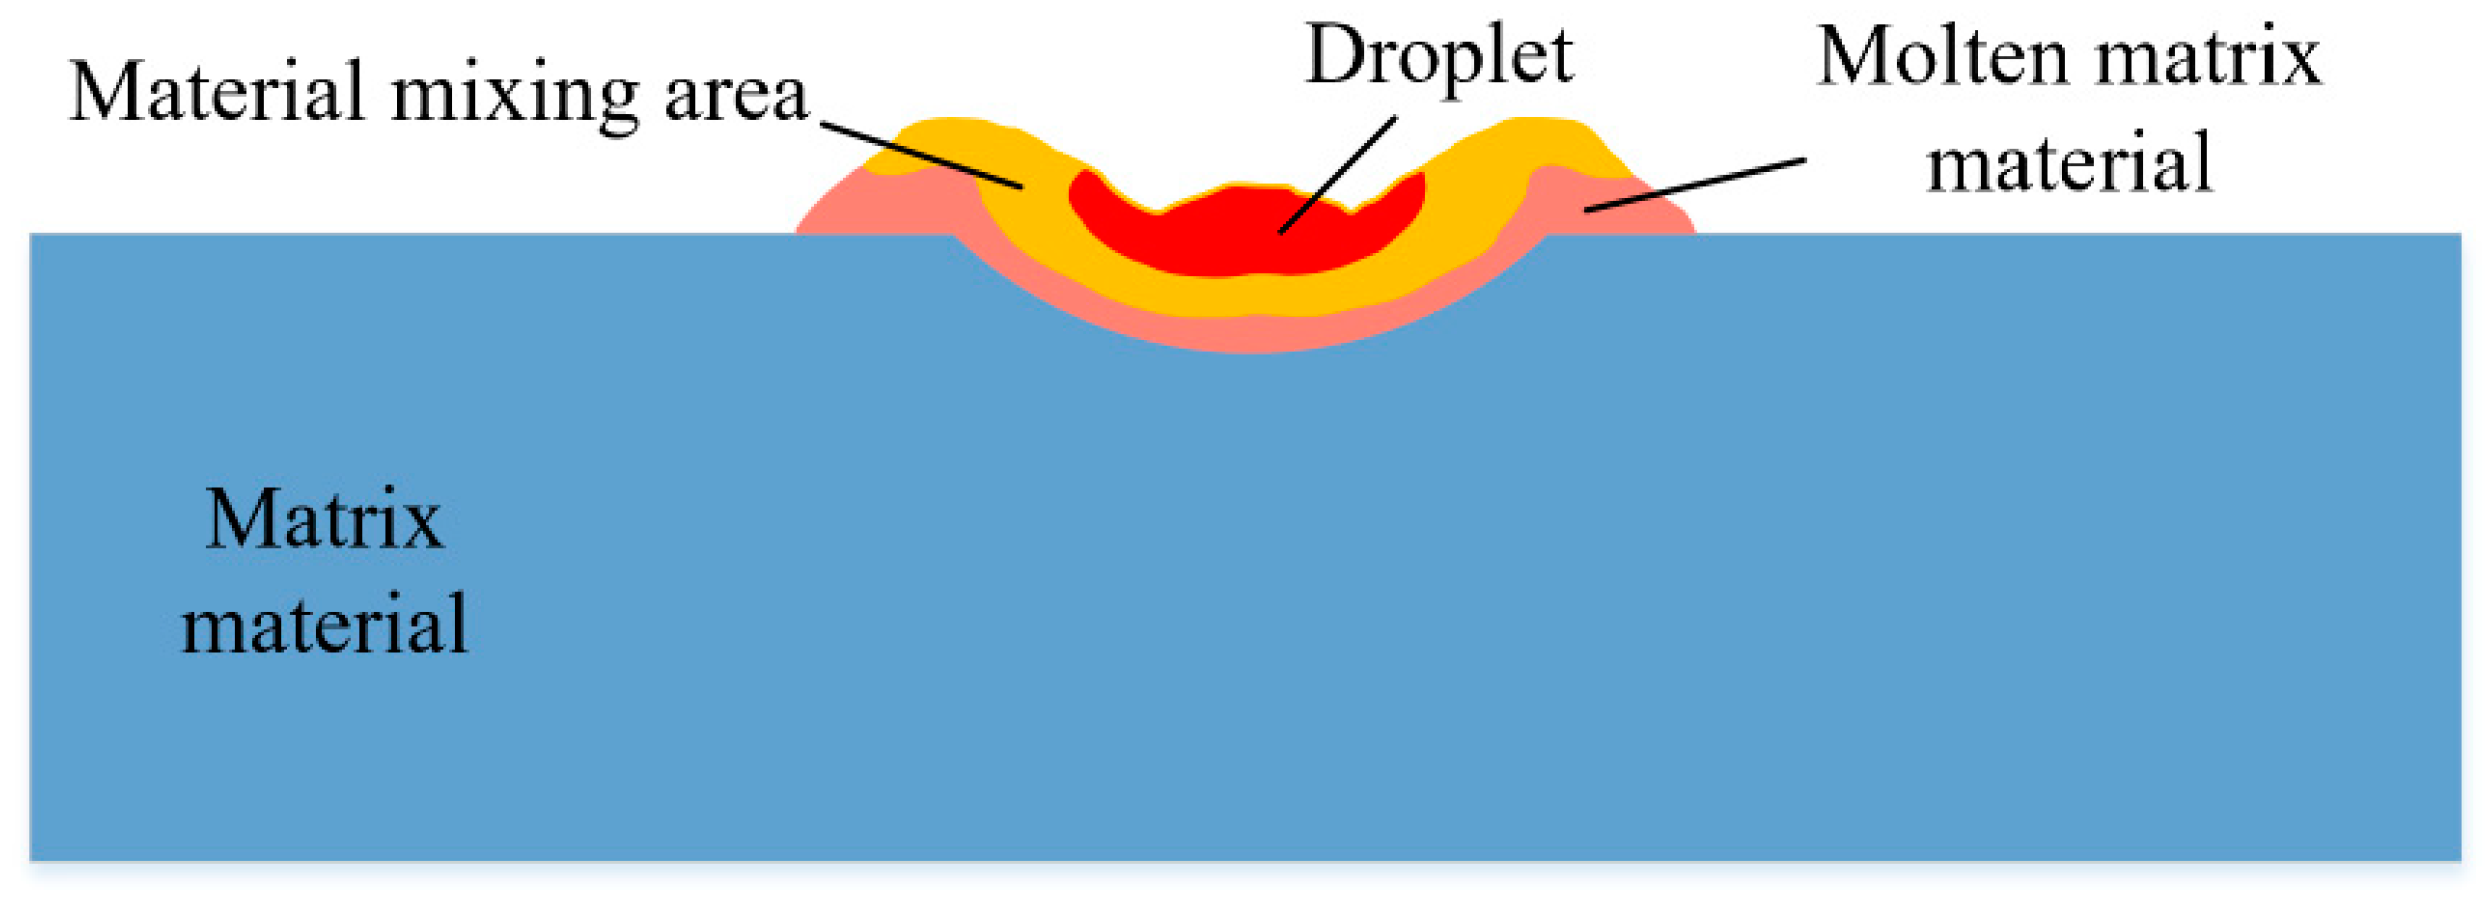
2.1. Analysis of Coating Fusion and Solidification Process

During the ESD process, the molten droplets fall into the molten pool on the surface of the matrix material and impact the materials in the molten pool so that the materials in the molten pool begin to move from the center to the edge [14]. The matrix material in the molten pool plays a buffering role for the falling droplets; the droplet speed decreases, and the droplet material covers the surface of the matrix material [18]. Figure 1 is a schematic diagram of the coating-the-matrix material fusion process. The molten electrode material contacts the molten matrix material, and the liquid metal material diffuses at the contact area. Due to the short pulse time of ESD, the molten metal material starts to cool down rapidly, resulting in a short diffusion time between the electrode material and the matrix material. The elements of the electrode and the matrix material diffuse at the junction, and finally, a very narrow transition zone compared with the deposition layer is formed. The element diffusion of the two materials in the transition zone provides the deposited layer with good metallurgical bonding properties.
After the droplet is transferred to the substrate surface, it still has a high temperature. The molten material has good fluidity at high temperatures. Therefore, after impacting the molten pool of the matrix material, the molten droplets quickly splash around and spread on the surface of the matrix material. Compared with the matrix material, the micro discharge area is very tiny. When the droplet falls on the surface of the matrix material, the area outside the vicinity of the molten pool in the matrix basically maintains at room temperature. Therefore, during the spreading of the molten droplet material, part of the heat carried by the coating is carried away by the gas medium between the electrodes, and most of the heat is transferred into the substrate through the surface. The high-temperature area caused by the deposition discharge is minimal compared to the whole substrate. With the spreading and splashing of the molten material on the substrate surface, the contact area between the molten material and the substrate increases rapidly, the molten material’s heat is rapidly taken away, and the molten material solidifies rapidly in a short time.

2.2. Theoretical Model

Considering the mixing and solidification of materials, the flow of molten materials on the substrate surface is a complex process. To facilitate the simulation calculation, it is necessary to make certain assumptions about the simulation model: (1) liquid metal materials are incompressible; (2) before the droplet enters the molten pool, the temperature of the droplet remains unchanged; (3) before the droplet enters the molten pool, the temperature distribution in the molten pool is generated by a Gaussian heat source; (4) ignoring the vaporization loss of the base material, the material inside the molten pool is a liquid-based material; (5) the molten droplet material is the same as the electrode material, and one molten droplet is fused with one molten pool; (6) and the mixing process between materials is considered as the mixing process between different components in the same-phase materials.
Due to the mixing of materials, the density of materials at different times and at different mixing regions is not the same. The mass conservation equation and momentum conservation equation of the fluid can be expressed as [22]:
ρ t + · ρ v = 0
t ρ v + · ρ v v = p + · μ v + v T + ρ g + F
where p is the pressure acting on the microfluid element, μ is the viscosity, v is the velocity vector of the fluid, and ρg and F are the volume force of gravity and the external force. ∇ is a Hamiltonian operator, which is a computational symbol.
The fusion process can be regarded as the mutual movement between the two components in the molten metal. When the two materials are mixed, there are different proportions of material components in the region. The density of the mixture can be calculated by the weighted mixing:
ρ = 1 i Y i ρ i
where Yi is the mass fraction of the ith material, and ρi is the density of the ith material.
The change in temperature in the deposition area affects the solidification process of the material. When energy exchange is involved in the flow process, energy conservation is the essential condition of calculation. The energy equation can be expressed as [23]:
t ρ E + · v ρ E + p = · k T j h j J j + S T
where k is the thermal conductivity; E is energy, which may be expressed by Equation (5); Jj is the diffusion flux of the jth component; and ST is viscous dissipation.
E = h p ρ + v 2 2
where h is the sensible enthalpy.
When different component mixing occurs in the molten material, the transportation between components requires that each component satisfies the conservation equation. In the system, the change rate of components with time equals the sum of the diffusion amount on the interface and the productivity of the chemical reaction. Considering that, in this paper, we only simulate the mixing of different liquid components and do not involve the chemical reaction between materials, the conservation equation of components can be expressed as [24]:
t ρ Y i + · ρ v Y i = · ρ D i , m Y i + S i
where Di,m is the mass diffusion coefficient and thermal diffusion coefficient of the ith component, and Si is the user-defined generation rate of the source term in the discrete phase.

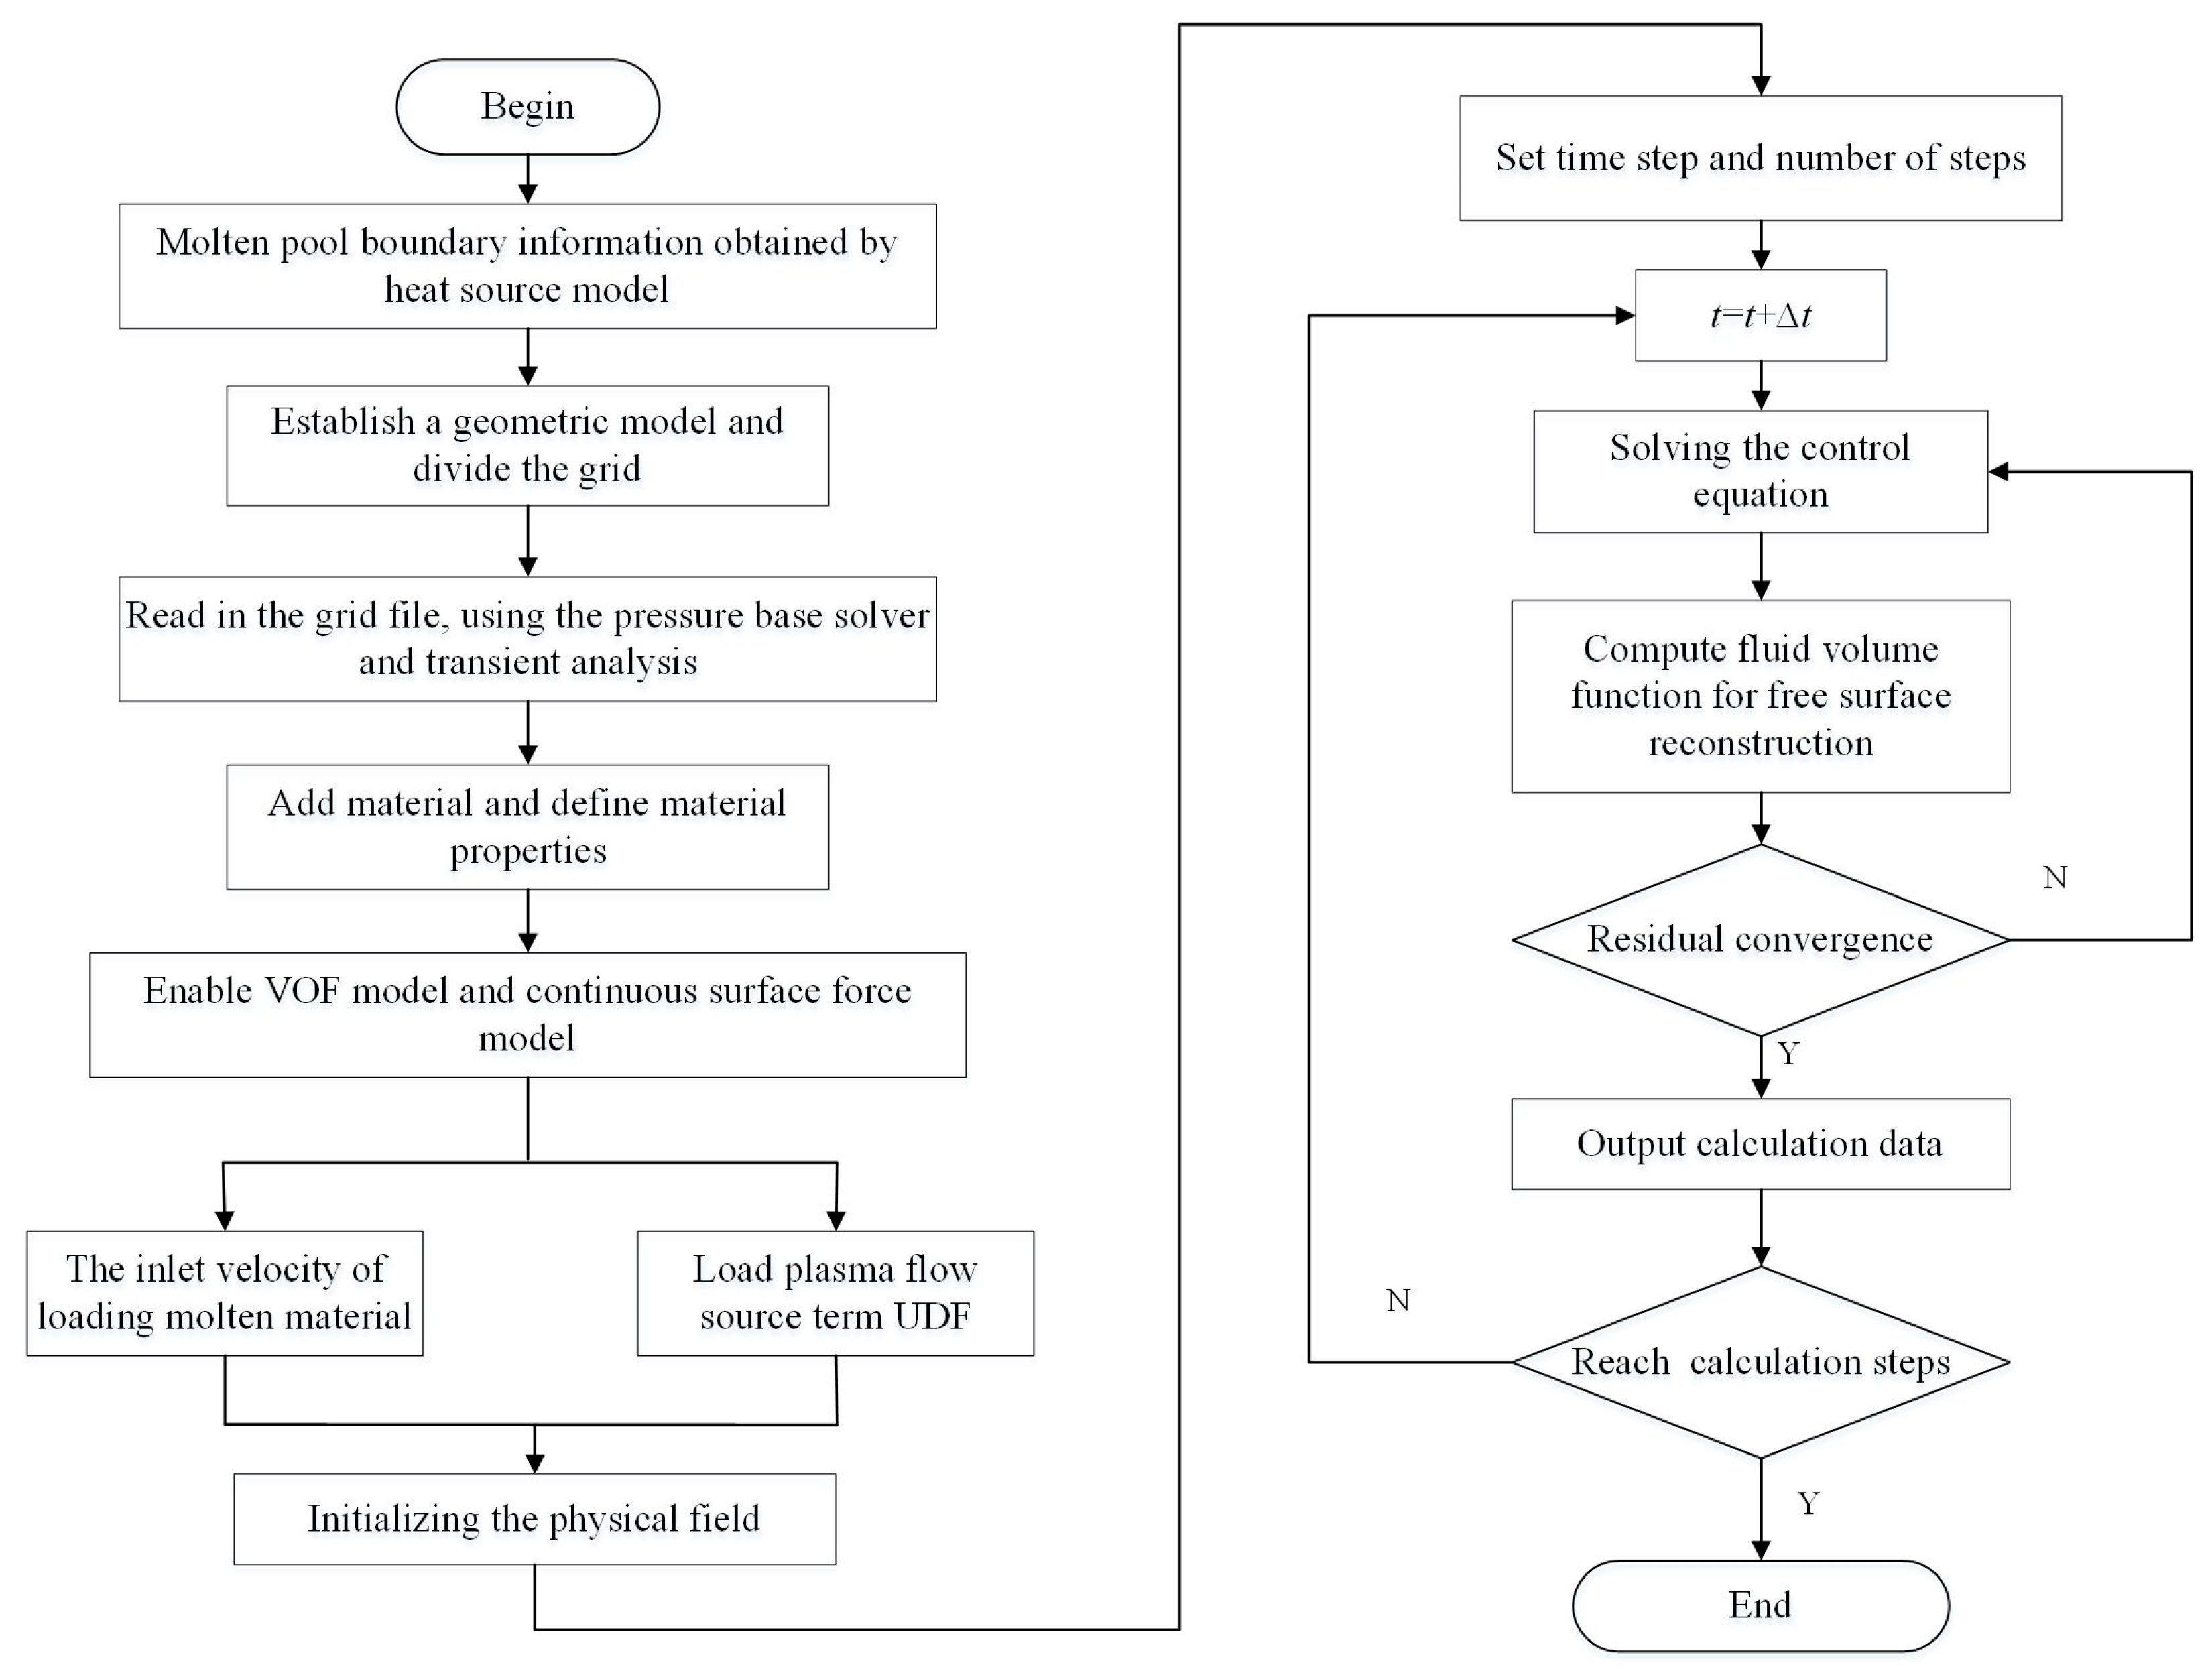
2.3. Simulation Model and Boundary Conditions

Figure 2 is a schematic diagram of the simulation model of the coating fusion and solidification process. The model is mainly composed of three regions: the gap between the two electrodes, the molten pool, and the matrix material. The radius of the molten pool area is 58 μm, the depth is 22 μm, and the length of the setting gap area is 900 μm. In the actual deposition process, the gap distance when a spark discharge occurs is changed, and the gap distance is related to the discharge parameters and the properties of the gap medium. In order to facilitate simulation, the height of the gap area is set to 150 μm. The molten pool is filled with the molten matrix material, and the gap area is filled with a gaseous medium between the edges. The boundary opposite the molten pool at the center above the gap area is the velocity inlet boundary, and the electrode material enters the interstitial area through the velocity inlet to simulate the formation process of electrode droplets after melting. Both sides of the gap area are set to the pressure outlet boundary condition, and as the electrode material flows in, excess gas in the gap area can flow out of the boundary through the pressure outlet. The boundary connecting with the molten pool below the gap area is set as the “interface” boundary, and the boundary connecting with the base area above the molten pool area is also set as the “interface” boundary, and the droplets dripping above can enter the molten pool area through the interface boundary. The gap and the rest of the boundary of the molten pool area are set to the “wall” boundary. The boundary conditions for the entire computational domain are listed in Table 1. The whole simulation model is mainly divided by quadrilateral mesh, the gap area is divided by the “Map” method, and the molten pool area and the matrix area are divided by the “pave” method. The two sides of the bipolar gap area are set as pressure outlets, and the gas medium flows out of the gap through the pressure outlets. The molten pool area is a flat bowl shape, and the molten pool area is connected with the gap and the base area simultaneously. The molten pool’s upper surface and the molten pool’s bottom are set as the interface. The liquid droplet material can enter the molten pool through the upper surface. The liquid material in the molten pool cannot enter the matrix through the bottom of the molten pool but can transfer heat into the matrix. The boundary between the matrix and the gap is the interface. This can ensure heat transfer and, meanwhile, avoid the mass non-conservation caused by the material passing through the interface. Table 2 shows the main physical parameters required in the above numerical simulation process.
Before the simulation starts, the data of the molten pool area needs to be obtained through the simulation of the melting process of the matrix material. As shown in Figure 3, because the distribution of the charged particles in the discharge channel is a decreasing Gaussian distribution on the edges of the center concentration, and the charged particles hit the surface of the material to convert kinetic energy into thermal energy, the melting process of the edges uses a Gaussian heat source, and the Gaussian heat source can be written by using the DEFINE_PROFILE macro, and the Gaussian heat source expression loaded on the surface of the matrix material is:
q r = 3 π R 2 t η U I exp 3 r 2 R 2 t
where r is the distance from the center of discharge; q(r) is the heat flux density at r; U is the deposition gap voltage; I is the peak current; η is the energy distribution coefficient, the value is 0.2; and R(t) is the radius of the discharge channel at t time.
During the melting of ESD materials, when the distance from the discharge center exceeds the radius of the discharge channel, the surface of the material is also subjected to thermal convection [23]:
Q = h c ( T T 0 )
where hc is the comprehensive convective heat transfer coefficient, T is the surface temperature of the matrix material, and T0 is the gap medium temperature.
Dibitono et al. [25] experimented to find the relationship between the peak current I and the optimal pulse width tb. The equation between the two can be obtained by data fitting:
t b = 0.00001552 I 4 + 0.002343 I 3 0.004692 I 2 + 2.581 I + 2.142
Lou Leming [26,27] obtained the equation of the discharge channel radius through optimization analysis on the basis of the test data of Jie Inoue:
R t = 2.85 I 0.53 t 0.38 , t < t b 2.85 I 0.53 t b 0.38 , t t b
where tb is the optimal pulse width; t is the pulse duration.
The establishment of the dripping transition model should not only meet the basic control equations but also use other models to add different roles to the transition process. The volume of fluid (VOF) model calculates the fluid volume occupied by each phase fluid in the unit and simulates the interface changes between different fluids. The unsolidified coating after fusion is also affected by surface tension. On the basis of enabling the VOF model, the continuous-surface force model can be determined by the equation:
F vol = p a i r s i , i < j σ i j α i ρ i κ j α j + α j ρ j κ i α i 1 2 ρ i + ρ j
where αi represents the volume fraction of the ith phase, ρi represents the density of the ith phase, and σij represents the coefficient of surface tension between the ith and jth phases. κ represents the surface curvature, where the surface curvature is calculated by a local gradient perpendicular to the surface of the interface.
The user-defined function is used to realize the effect of plasma flow force on the droplet, the corresponding source term function is written through the DEFINE_SOURCE macro, and finally, the function of the plasma flow force is loaded into the gap region, where the droplet is affected by the plasma flow force during the transition process. When a spark discharge occurs, the local area of the electric pole instantaneously melts when heated, and the formed droplets rush to the matrix under the accelerated action of plasma. The droplet under plasma acceleration can be seen as a ball submerged in the water flow, the plasma around the droplet can be seen as a homogeneous fluid, and the force on the droplet can be expressed by the equation [28]:
F p = C d A p ρ f v f 2 2
where Cd is the plasma flow coefficient, Ap is the projection area of the droplet part affected by the plasma flow in a plane perpendicular to the plasma flow direction, ρf is the density of the plasma flow—here, the plasma density of argon is 0.06 kg/m3vf is the velocity of the plasma flow, and the size is 100 m/s.
The projected area Ap can be obtained by the equation:
A p = π R 2 r 2
where R is the radius of the droplet and r is the radius of the necked part of the droplet.
Cd is related to the Reynolds number of the plasma flow, and when the Reynolds number is less than 200,000, it can be calculated by the formula:
C d = 24 Re + 6 1 + Re + 0.4
where Re is the Reynolds number of the plasma stream.
When dealing with problems involving melting and solidification, the liquid metal material begins to solidify when the temperature falls below the melting point. The solidification process of the material can be regarded as a motion boundary problem of the growth of the solidification layer. To address this, introduce a control equation that can distinguish between solidified and unsolidified regions. Solve this equation to track the points or lines where it is met at any time and connect the solution results to form a solidification interface. Temperature is a physical property parameter directly related to solidification, so the control equation is a function of temperature. For the meshed calculation area, the element liquid-phase volume fraction β can be defined as:
β = The   volume   occupied   by   the   liquid   phase   in   the   cell Unit   volume
Solidification only occurs in the region where the molten material is present. β is a grid of parameters defined for the entire calculation area—the agreed gap gas and the area occupied by the liquid material—and the element liquid-phase volume fraction β is 1. Since the matrix material is below the melting point, the liquid-phase volume fraction is 0. The volume fraction of the liquid phase inside a specific molten material is defined as
β = 0 T < T s 1 T > T l T T s / T l T s T s < T < T l
where Ts is the solidus temperature, and Tt is the liquidus temperature.
When processing the solidification of ESD coating materials, the release of the latent heat of the material during the solidification process is treated by the enthalpy method, and the enthalpy of the material can be expressed as [29]:
H = h + Δ H
where H represents the enthalpy of the material, h is sensible enthalpy, and ∆H is the latent heat; where the sensible enthalpy of the material can be expressed as:
h = h r e f + T r e f T c p d T
The latent heat can be calculated from the liquid-phase fraction.
Δ H = β L
where L is the latent heat of the liquid phase of the material.
When dealing with latent heat problems, enthalpy as the variable of the energy equation can reduce the number of variables and facilitate calculation. Therefore, the equation for the conservation of energy for the solidification process can be modified to:
t ρ H + · ρ v H = · k T + S
where ρ is the density, H is the enthalpy of the fluid, v is the velocity vector, k is the thermal conductivity of the fluid, and S is the source term of energy. After the droplets enter the molten pool, mixing occurs between the materials. Due to the different compositions, there are different solids and liquids in the materials in the fusion region. For the component fusion region, the solidus and liquid lines can be expressed as:
T s = T m + s o l u t e s m i Y i / K i
T l = T m + s o l u t e s m i Y i
where Tm is the solidification temperature of the pure solvent, mi is the liquidus slop, Yi is the mass fraction of the ith solute, and Ki is the composition coefficient of the ith solute.
For solidification processes of multi-component mixtures, updating the liquid-phase volume fraction using the liquid-phase volume fraction equation can lead to numerical errors and convergence difficulties, so it is iteratively calculated by Equation (23):
β n + 1 = β n λ a p T T * Δ t ρ V L a p Δ t T * β
where the superscript n represents the number of iterations; λ is the relaxation factor, the default value is 0.9; ap is the element matrix coefficient; ∆t is the time step; T is the temperature of the current mesh; and T* is the interface temperature.
The interface temperature can be expressed as:
T * = T m + i = 0 N s 1 m i Y i K i + β 1 K i
where Ns is the number of components.
The flow diagram of the simulation process of the droplet-dripping transition process of ESD is shown in Figure 4. Firstly, the geometric model of the simulation area is established using Gambit. Next, the area is meshed to generate a model file that Fluent can recognize. This model file is then imported into Fluent, where the pressure-based solver is selected, and transient analysis is performed. The VOF model and continuous-surface force model are commenced because the plasma flow force and surface tension have an important influence on the flow deformation of the material during the droplet-dripping process. The implicit volumetric force can be used for treatment, which improves the convergence by considering the balance between the pressure gradient and surface tension in the momentum equation. Additionally, materials should be added, material parameters modified, plasma flow source programs loaded into the model, the simulation time step set, and finally, the model should be initialized to commence the simulation calculation.
Since the fusion between materials is regarded as the flow between different components in the molten material, in some positions of the molten material—both the electrode material and the matrix material—the specific heat capacity and thermal conductivity of the materials in the fusion region are converted into parameters that vary with the composition change through mass fraction-weighted mixing law. Nickel and 45 steel are used as electrode and matrix materials, respectively. The main physical parameters required in the above numerical simulation process are shown in Table 3, Table 4 and Table 5 [30,31].

3. Analysis of Simulation Results

3.1. Material Distribution during Fusion Process

Figure 5 shows the distribution of electrode materials in the coating at different times. When the deposition time is 65 μs, the droplet contacts the molten pool’s surface, an arc-shaped interface appears at the contact area, and the coating and the base material begin to diffuse each other. It can be seen from the figure that the area the electrode material covers at 70 μs is significantly larger than that at 65 μs, the diffusion area is around the droplet area, and the content of the electrode material at the edge of the diffusion area is the least. After leaving the electrode, the molten droplets rush to the molten pool at high speed. The base material in the molten pool plays a specific buffer role for the molten droplets. Therefore, the contact boundary between the molten droplets and the base material gradually becomes smooth. The molten droplet’s downward movement causes the molten pool’s base material to flow to the edge. The accumulated material forms projections on the edges of the molten droplet, and the electrode material also diffuses to the edges with the flow of the material. When the deposition time reaches 75 μs, the droplets ultimately enter the molten pool and begin to fuse with the base material in the molten pool. The upper end of the droplet has reached the original position on the surface of the molten pool, and the diffused liquid electrode material has also approached the bottom of the molten pool. The electrode materials in the molten pool move toward the edges with the overall flow of the molten material. The electrode materials at the edges of the molten pool have been diffused outside the molten pool.
At the deposition time of 80 μs, the molten electrode material has diffused to the bottom of the molten pool. The rapid diffusion of the electrode material to the bottom of the molten pool is caused by two reasons. On the one hand, the material in the molten pool is still in the liquid state, and the electrode material and the matrix material are still diffusing each other. On the other hand, after entering the molten pool, the droplet still maintains a high speed, and the electrode material continuously moves to the bottom of the molten pool, pushing the original material out of the molten pool. Therefore, a small amount of electrode material appears at the bottom of the molten pool. When the deposition time reaches 85 μs, the droplet has fused together with the matrix material in the molten pool, and the surface of the molten material in the molten pool is lower than the surface of the matrix material. The diffusion area of the electrode material is further increased, the electrode material’s mass fraction at the coating’s edge reaches 0.19, and the electrode material’s mass fraction at the bottom of the molten pool reaches 0.25. With the fusion of the materials, the diffusion area of the electrode materials increases continuously, and the droplets entering the molten pool are continuously diluted. When the deposition time is 90 μs, the area with high electrode material in the molten pool is significantly reduced compared to when the molten droplets enter the pool. The electrode material’s mass fraction at the bottom of the molten pool reaches 0.56. Under the droplet’s impact, the total amount of the molten material in the molten pool is significantly reduced compared with that before, and most of the material splashes onto the surface outside the molten pool. In the coating on the substrate surface, the content of the electrode material is less at the position farther from the molten pool, and the content of the electrode material is less at the position closer to the substrate surface. It can be seen that the content of the electrode material in the coating is related to the state of the molten droplet entering the molten pool. The entry of the molten droplet causes the molten material to splash to the edges, and the electrode material also diffuses to the edges. The molten droplet is generally located above the base material. Among the materials flowing out of the molten pool, the content of the electrode material in the upper layer is higher than that at the bottom near the base.

3.2. Distribution of Electrode Materials in the Molten Pool

Figure 6 shows the simulation results drawn by the simulation calculation and statistics. By deriving the data of Ni elements at different reaction times and further processing the data, the mass fraction curves of Ni at different depths in the molten pool center at different times were obtained. In the molten pool, the mass fraction of Ni at different depths is obtained along the depth direction of the molten pool center. As seen from the figure, at the deposition time of 70 μs, the mass fraction of the electrode material decreases continuously along the depth direction, and the slope of the curve increases first and then decreases gradually. At this time, nearly half of the molten droplet has just entered the molten pool, and the mass fraction of Ni at the surface of the molten pool is 1. Before the depth exceeds 5 μm, the mass fraction changes little, so it can be seen that the closer to the place where the droplet gathers, the smaller the diffusion degrees. The electrode material diffusion gradient at the edge of the droplet is large, and the slope of the curve increases with the depth increase. When the deposition time is 70 μs, the diffusion depth of the electrode material reaches about 15 μm, but only the first half of the distance has a high mass fraction. When the deposition time reaches 75 μs, the droplet ultimately enters the molten pool. The edge of the droplet is just near the surface of the molten pool, and the electrode material content on the surface of the droplet is far less than that inside the droplet, so at the front end of the curve of the mass fraction of Ni, it suddenly increases with the increase in depth. After the depth reaches 10 μm, the curve begins to drop, and the electrode material begins to diffuse. With the downward movement of the droplet, the diffused area moves downward as a whole. Therefore, in the depth direction, the electrode material can diffuse to a depth of nearly 20 μm.
It also can be seen in the figure that after the deposition time of 80 μs, the mass fraction of Ni is 0 before reaching a certain depth. At this time, the impact of the molten droplet on the molten pool causes the material in the molten pool to flow out of the molten pool, causing the height of the molten material to drop continuously. The electrode material at the center also begins to diffuse to the surrounding, so the mass fraction curve rises to a maximum and then begins to decline. When the deposition time is 80 μs, the Ni content at the bottom of the molten pool reaches 4.5%. With the further flow of the material, the maximum value of the mass fraction begins to decrease after 80 μs, and the dilution degree of the electrode material in the depth direction is further intensified. When the deposition time is 90 μs, the depth of the region with a high Ni content is 1.8 μm deeper than that at 85 μs. At the end of the curve, the mass fraction of the material at the end of the curve reaches 0.4 at 90 μs, and the electrode material in the molten pool approaches the bottom. With the increase in time, the material in the molten pool begins to solidify, and the electrode material’s diffusion degree is slowed to a certain extent. Therefore, the slope of the curve when the mass fraction decreases is reduced compared with that before.

3.3. Temperature Distribution of Coating Solidification Process

Figure 7 is the nephogram of the temperature distribution at different times during the solidification process of the coating. When the deposition time is 70 μs, there are three high-temperature regions in the molten pool, and the temperature of the high-temperature region can reach about 2590 K. The temperature near the surface of the molten pool is the highest before the droplet falls into the molten pool. After the molten droplet enters the molten pool, on the one hand, the matrix material flows to the bottom of the molten pool under the influence of the molten droplet. The matrix material flows to the edges of the molten pool, resulting in the temperature distribution shown in the figure. When the deposition time reaches 80 μs, the droplet fuses with the material in the molten pool. During the fusion process, heat is transferred to each other in the molten liquid metal material so that the temperature distribution in the coating becomes continuous, and there is no longer a separate high-temperature area. The heat of the molten material is introduced into the matrix through the bottom of the molten pool and the surfaces at the edges. The liquid material is in contact with the bottom of the molten pool for a longer time, and the heat transfer to the bottom of the molten pool is more than the heat transfer to the edges. The molten material itself still has a certain temperature gradient. The distribution of the high-temperature area in the center of the molten pool is similar to the distribution of the electrode material. The reason for this phenomenon is that the original matrix material in the molten pool has flowed to both sides outside the molten pool, and the electrode materials dominate the interior. The maximum temperature of the molten material in the molten pool is 2152 K, and the temperature at the bottom of the molten pool drops to 1858 K.
It can be seen from the figure that when the deposition time is 90 μs, the high-temperature area in the molten pool further expands with the flow of the molten material and the maximum temperature drops to 1872 K. The temperature gradient in the matrix material below the molten pool is large—at the position of 30 μm below the molten pool, the temperature has dropped to 769 K. The thermal conductivity of the matrix material at room temperature is higher than that of the molten material, so heat is transferred to the matrix material faster than to the molten material. When the deposition time reaches 100 μs, the area with the highest temperature is divided into two parts. The main reason is that the molten material has splashed on the edges of the molten pool at this time. There is only a tiny amount of molten material in the center of the bottom of the molten pool, and the high-temperature area is mainly concentrated in the molten material. The maximum temperature near the boundary of the molten pool also gradually dropped to 1783 K; the highest temperature in the material gushing out of the molten pool can reach 1680 K; and the temperature at the edge of the molten material dropped to 667 K. Under the continuous flow of the material, the molten material at this time is transformed into a flat shape that is close to the surface of the substrate. The contact area between the molten material and the gas in the gap and the surface of the substrate is further increased so that the temperature of the material surging on the surface of the matrix material declines fast. When the deposition time reaches 110 μs, the area of temperature distribution becomes larger, and the material with the highest temperature is transferred to the edges of the molten pool with the flow of material, and the temperature drops to 1632 K. The highest temperature is located in the molten material; however, the area with a high temperature is not limited to the coating material. The upper surface of the substrate is directly in contact with the coating material, and part of the interelectrode medium also has a high temperature. It can be seen from the change in temperature distribution that the overall temperature continues to decrease, the position of the highest temperature continues to move with the flow of the material, and the temperature of the material splashed on the surface of the substrate drops faster, causing the temperature at the edge to be much lower than that in the molten pool than that of other materials.

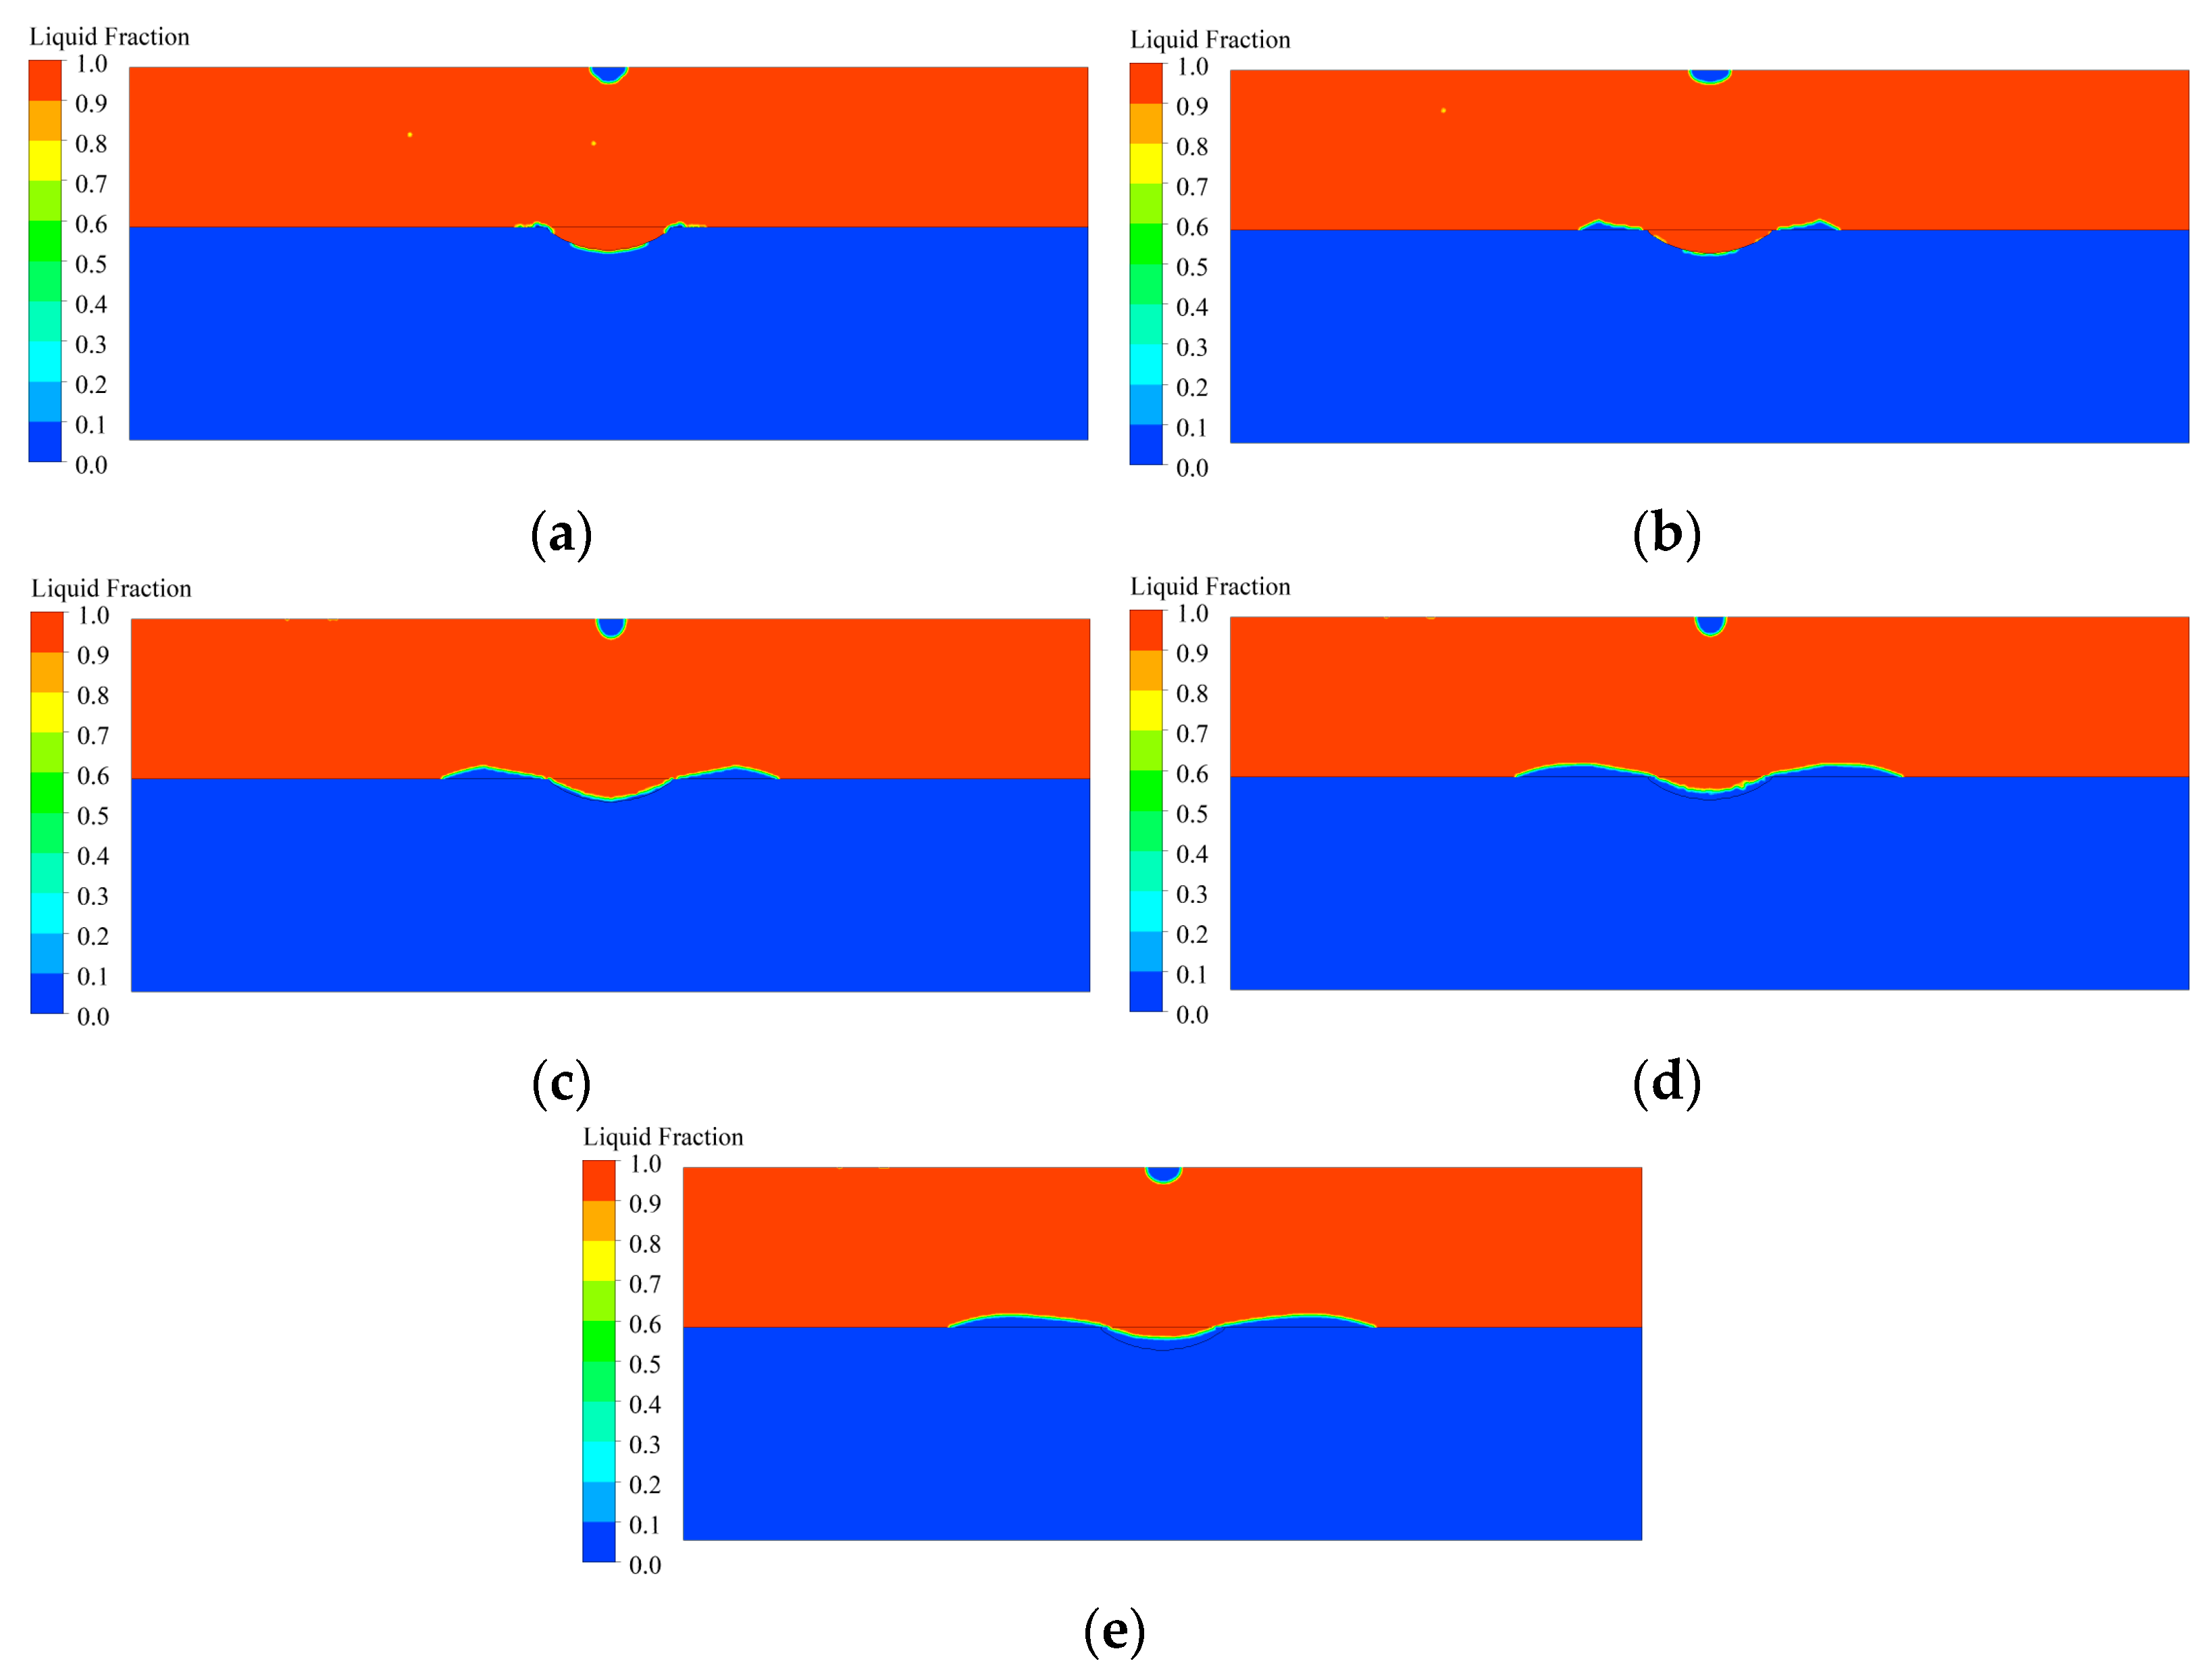
3.4. Analysis of the Coating Solidification Process

Figure 8 is a cloud diagram of the liquid fraction change during the solidification of the molten material on the surface of the matrix. When the droplet enters the molten pool, the material inside the molten pool has not yet begun to solidify, and only a small amount of solidified material appears at the edges of the molten pool. When the deposition time reaches 80 μs, the solidified material appears on the surface of the substrate, and the molten material close to the surface of the substrate solidifies first. When the molten material splashes on the edges of the molten pool, it is far away from the area with a high temperature, and the heat is transmitted into the substrate below through the surface. This causes the material on the edges of the substrate surface to solidify first because the temperature of the material in the molten pool is very high; it is difficult for the dissipated heat to make the material in the molten pool start to solidify at this time. When the deposition time is 90 μs, the material at the bottom of the molten pool begins to solidify, and the solidified area in the material pouring out of the molten pool increases—it can be seen from the figure that the material solidifies upwards from the bottom of the molten pool, forming a thin layer of the solidified region along the border of the molten pool. When the deposition time reaches 100 μs, the solidification interface of the material is similar to that at 90 μs; however, the shape of the interface is more continuous and smoother. As the heat dissipates, the solidified area further increases, and the solidified interface of the material continuously moves from the edges to the center. The hot molten material flows to the edges of the molten pool, keeping the nearby material unsolidified. When the deposition time is 110 μs, the surface of the substrate and the molten material in the molten pool have all solidified. From the change in the solidification interface, it can be seen that the material in the molten pool gradually solidifies upward from the bottom. Due to the flow of the material, the solidification interface in the molten pool is similar to the shape of the bottom of the molten pool. The area where the edge of the coating material surfacing on the matrix material is in contact with the surface of the substrate solidifies first, then the solidification process progresses gradually from the outside to the inside, and finally, the upper surface of the material completes the final solidification.
Figure 9 shows the proportion of the solidified portion in the molten material in different regions. It can be seen from the figure that the proportion of the solidified area in the molten material outside the molten pool is higher than that in the molten pool. The proportion of solidified areas outside the molten pool continued to increase, and the increased speed decreased slightly after 100 μs. The proportion of solidified areas inside the molten pool begins to increase rapidly after 80 μs. During the deposition process, the heat on the surface of the substrate is concentrated in the molten pool, and the temperature outside the molten pool is much lower than that in the molten pool. After the molten material flows out of the molten pool, it directly contacts the surface of the substrate, resulting in a higher solidification speed in the areas outside the molten pool. When the deposition time is 80 μs, the temperature in the molten pool is relatively high. Only a tiny amount of material solidifies at the molten pool’s edge. The flow of molten material causes part of the solidifying material at the edge to pour out of the molten pool, resulting in a slight decrease in the solidified material proportion in the molten pool. After a deposition time of 100 μs, only a small amount of molten material has not yet solidified, so the increased amplitude in the proportion of the solidified area decreases. It can be seen that the material outside the molten pool solidifies continuously at a stable rate. As part of the molten material pours out of the molten pool, the shape of the material in the molten pool gradually tends to be stable. After this, the material in the molten pool solidifies rapidly, and finally, the proportion of the solidified area is close to the proportion outside the molten pool at 100 μs, about 100%.

4. Experimental Verification

4.1. Experimental Conditions

In order to verify the validity of the ESD droplet transfer simulation model, an HB-06-type Electric spark surfacing welding machine was used to carry out a single-point deposition experiment on the surface of 45 steel. By observing the surface morphology, element distribution, section morphology, and section element distribution of a single deposition point and comparing the experimental and simulation results, the accuracy of the simulation is analyzed.
In the experiment, 45 steel, with a size of 20 mm × 15 mm × 10 mm, was used as the workpiece. ERNi-1 nickel wire of 50 mm × φ3 mm was used for the deposition electrode. The main components of the ERNi-1 electrode were provided to us by the manufacturer at the time of material purchase, as shown in Table 6.
To facilitate the observation of the morphology and microstructure of the surface and the cross-section of the specimen after deposition, the specimens were cut with a wire electric discharge machine. Since there was still a small amount of surface damage on the surface, the deposited surface was ground and polished using anhydrous ethanol to clean the surface of the polished specimen to remove oil and impurities on the surface and blow-drying the surface after cleaning.
During the deposition experiment, the electrode was first lowered to a suitable height, which controls the micro-feeding. When the discharge spark was found, the feeding was stopped automatically, and the electrode was withdrawn immediately to achieve single-point deposition on the surface of the workpiece. The deposition torch is connected to argon during deposition, and the deposition parameters for specific processing are shown in Table 7. Considering that the deposition point needs to be observed at different viewing angles, the rotation of the electrode causes an unstable deposition state between the two electrodes. Therefore, multiple sets of single-point deposition were carried out under the same discharge parameters.

4.2. Analysis of Deposition Experimental Results

In this paper, the Alicona optical 3D surface topography measuring instrument is used to photograph the 3D surface topography of the specimen deposition area. Figure 10 is the three-dimensional topography and contour curve of the deposition point. It can be seen from the three-dimensional morphology of Figure 11a that there is a concave area in the center of the deposition point, and the height of the material around the center is higher than that of other places. After the molten droplets enter the molten pool, they impact the matrix material in the molten pool, and the fused molten material pours out of the molten pool or splashes around, forming a shape with a low center and a high circumference. During the deposition process, multiple discharge occurs between the two electrodes. The deposition point forms a deposition layer on the material’s surface. On the surface of the deposition area, the profile of the coating material extracted from the centerline of the deposition point is compared with the results of the simulation. It can be seen in Figure 10b that the simulation result is smoother, and the fluctuation degree of the profile curve obtained by the experiment is larger than that of the simulation result. There is a section on the edges of the experimental profile curve that is higher than the simulation results. The reason for this phenomenon is that the material cools faster than in the simulation, and the locally molten material solidifies and loses fluidity before reaching the equilibrium position, eventually forming a shape with slightly raised edges and a slightly lower center. The maximum error of the two curves in the depth direction is 13 μm, and the average error is about 4 μm. Although the center part of the contour curve fluctuates greatly, the two contour curves have the same variation tendency, and their diameter error is about 4%. The fluctuation degree of the middle part of the simulated profile curve of the surface topography is smaller than that of the experimental profile. At the edges of the coating point, the simulation results in Figure 10 are consistent with the experimental profile.
Figure 11 shows the surface topography of the deposition point and the distribution of Ni elements in the region. It can be seen from the figure that the molten material rushes from the center of the deposition point to the periphery, the material accumulates at the edge of the deposition point, and apparent traces of material splashing can be observed at the edge. The large discharge energy during deposition also causes a small amount of material to splash far away from the edge of the deposition point. The distribution of the sputtered material is not uniform, and the material in the upper part of the figure is slightly more than that in the lower part; this may be because of the effect of the deposition angle of the electrode and the rotation of the electrode during the deposition process. From the distribution of Ni on the surface, it can be seen that Ni mainly distributes surrounding the deposition point, and the area where the Ni is concentrated is consistent with the area where the material is stacked. It can be seen that there is a large amount of electrode material in the surface portion of the material splashed onto the surface of the substrate. In the fusion and solidification simulation, although there is a certain amount of electrode material in the center of the molten pool, the main electrode materials are finally splashed to the periphery of the edges of the molten pool, which is consistent with the results of the experimental observation. The surface material distribution of the deposition point is similar to the simulation result. The simulated situation is an ideal situation under certain assumptions. There are certain differences between the two; however, it shows that the simulation results are generally consistent with the characteristics of the actual deposition point.
Figure 12 shows the elemental distribution of the cross-section of the deposition point. It can be seen from the figure that a large number of nickel elements are gathered above the matrix material, and the nickel element decreases with the increase in depth. A small amount of Ni elements in the matrix area presents the characteristics of uniform distribution. In the horizontal direction, there is more of the Ni element in the center of the coating, and at the edges, the Ni element on the edges is slightly reduced. With the droplet transition, the molten material on the surface of the substrate begins to flow around, the material at the junction is fused, and part of the electrode material is transferred to both sides with the flow of the material. Although some materials at the junction are fused, the content of Ni elements at the edges is smaller than that in the central area. As the heat is transferred to the substrate, the material below solidifies rapidly, resulting in insignificant diffusion of the Ni elements below. It can be seen from the element distribution of the cross-section that the Ni element diffuses at a distance of about 19 μm in the depth direction of the coating. The simulation coating thickness is slightly smaller than the experimental results. Therefore, the diffusion degree of the electrode material is also slightly smaller than that of the experiment, and the diffusion distance in the depth direction differs by about 4 μm. In the lateral direction, the electrode material has diffused to the edges of the molten material in the simulation. Still, the distribution of the electrode material at the edges is low. The lateral diffusion distance of the electrode material inside the coating is 364 μm in the simulation, and the error compared with the experimental results is 7.6%. Because the effect of the transition force of the material is very complex, the difference between the experimental results and the actual results may be that only a few main forces are considered in the simulation. The influence of the formation of the coating may have neglected subtle forces that lead to the formation of errors. The distribution of Ni elements at the interface of the deposition point is consistent with the results of the fusion simulation of the coating and the matrix material. The simulation result is verified.
The cross-sectional microstructure diagram of the deposition area was observed by a Leica DMi8 A Inverted metallographic microscope, as shown in Figure 13. The section of the specimen should be polished before observation, and the base material should be corroded with a nitric acid solution. The upper white area in the figure is the electrode material deposited on the surface of the substrate, and the lower black and white area is the etched matrix material. The boundary line between the electrode material and the base material presents an undulating shape with a lower middle and higher sides, which is consistent with the molten pool boundary formed by the surface melting under the action of a Gaussian heat source in the simulation. There is a layer of an area similar to the shape of the molten pool boundary in the coating material above the molten pool boundary. In this area, there are some strips similar to those contained in the matrix. After the molten electrode material enters the molten pool, it fuses with the matrix material in the molten pool. The electrode material and the base material diffuse, and the iron element in the fusion zone forms the shape shown in the figure under the action of the corrosive liquid. The situation considered in the simulation is ideal, and the contour of the coating after solidification is relatively flat. In the actual deposition process, part of the incompletely melted electrode material may adhere to the coating surface with the contact of the droplet, causing a convex shape similar to the figure in Figure 13. Ignoring the convex caused by adhesion, the surface profile shape obtained from the simulation is basically consistent with the experimental results, and the error in diameter is about 11%. The edge of the molten pool in the experimental results is more undulating, and the depth of the center of the molten pool differs by about 6μm. Due to the existence of convex, the diffusion area of the material in the experimental results is about 13 μm wider than the simulation results. Overall, the material morphology of the deposition point section is basically consistent with the simulation results of droplet contact.

5. Conclusions

In view of the lack of a direct description of the flow and fusion process of the material during the formation of ESD deposition coating, the fusion and solidification model of coating-matrix material is established in this paper. The distribution of electrode material in the deposition area at different times was analyzed, and the fusion law of coating-matrix material was explored. Considering the influence of the matrix on the molten material, the temperature change during the flow process was analyzed, and the solidification law of the molten material on the surface was studied. Finally, the nickel-based electrode was used to conduct the ESD deposition experiment, and the surface morphology, element distribution and cross-sectional morphology of the deposition area were analyzed, and the following conclusions were drawn:
(1)
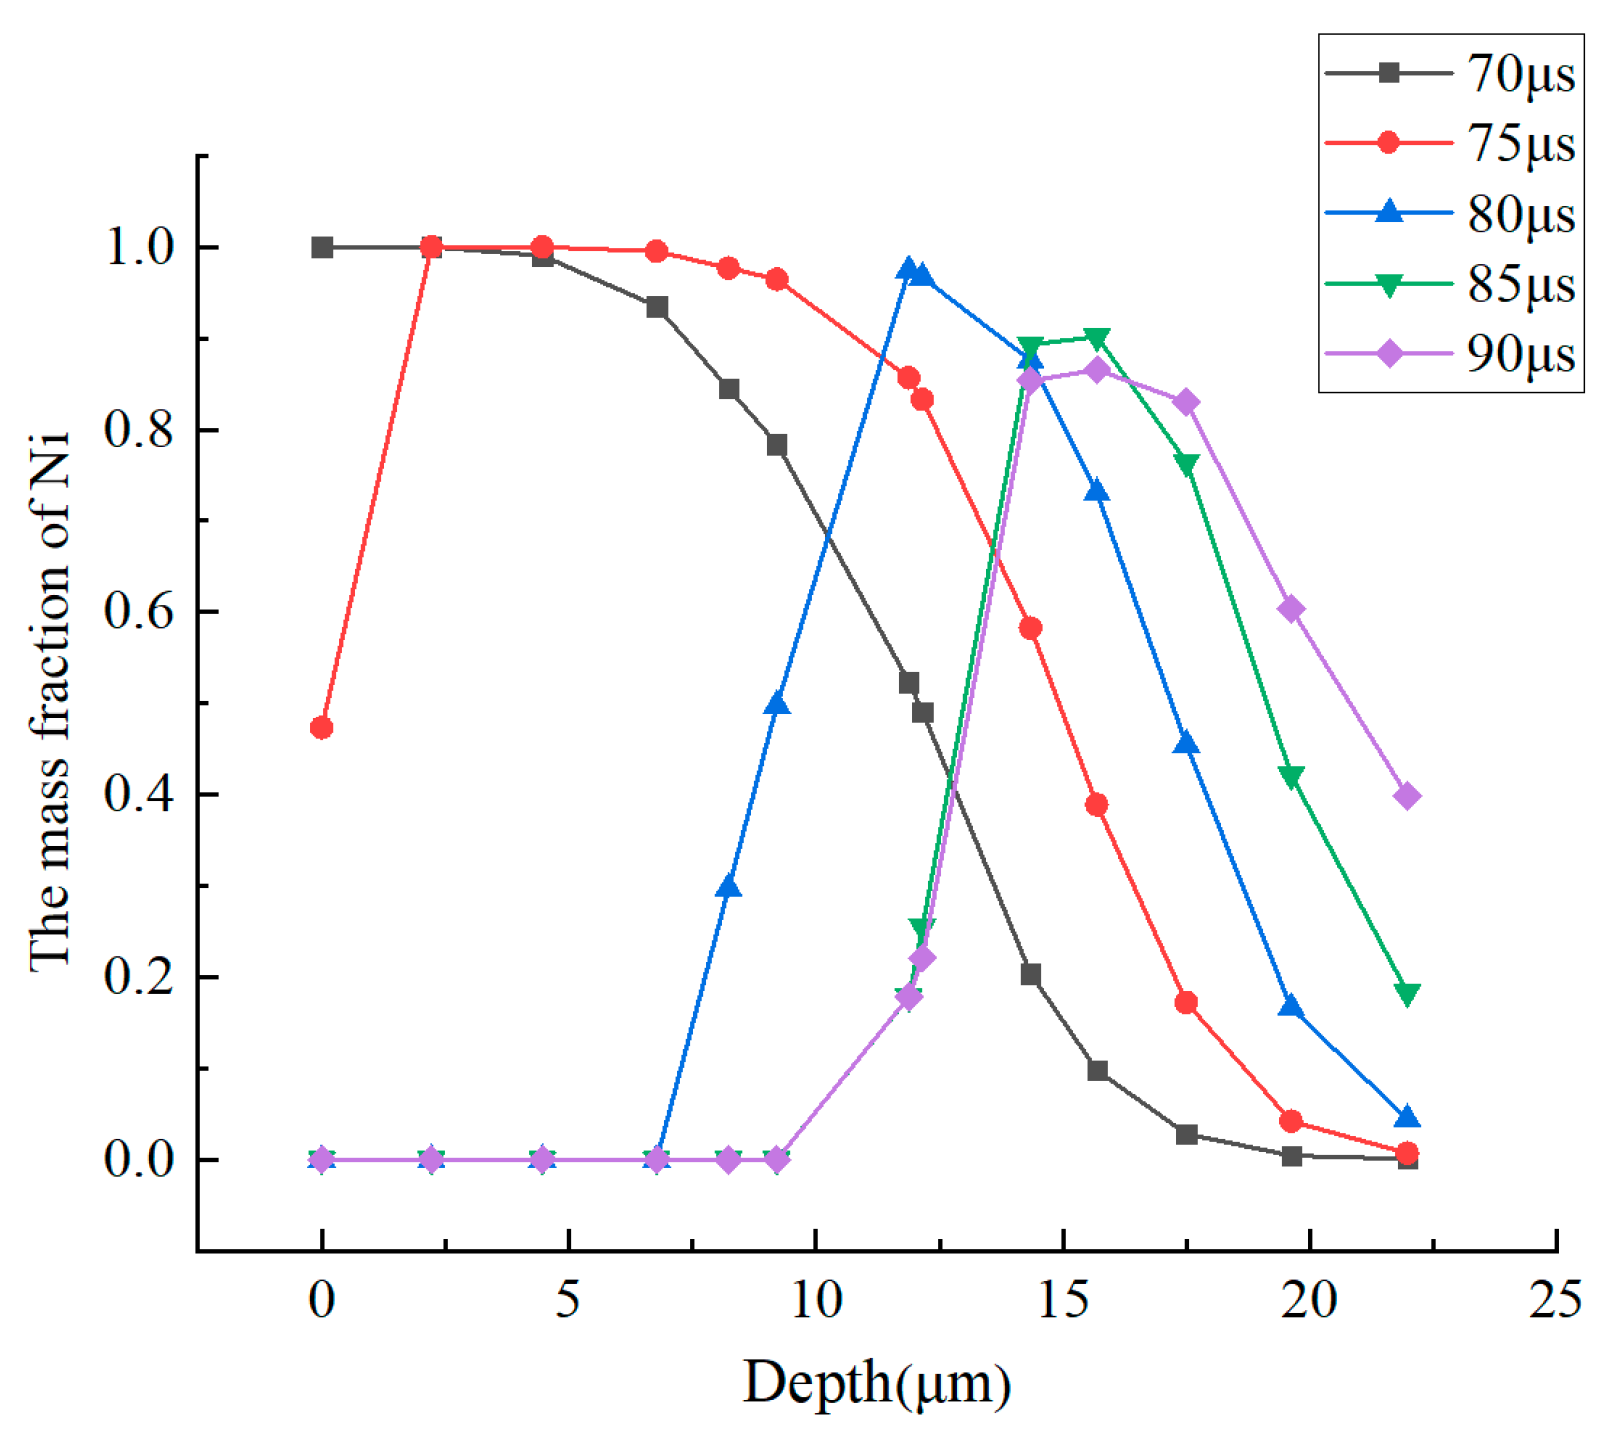
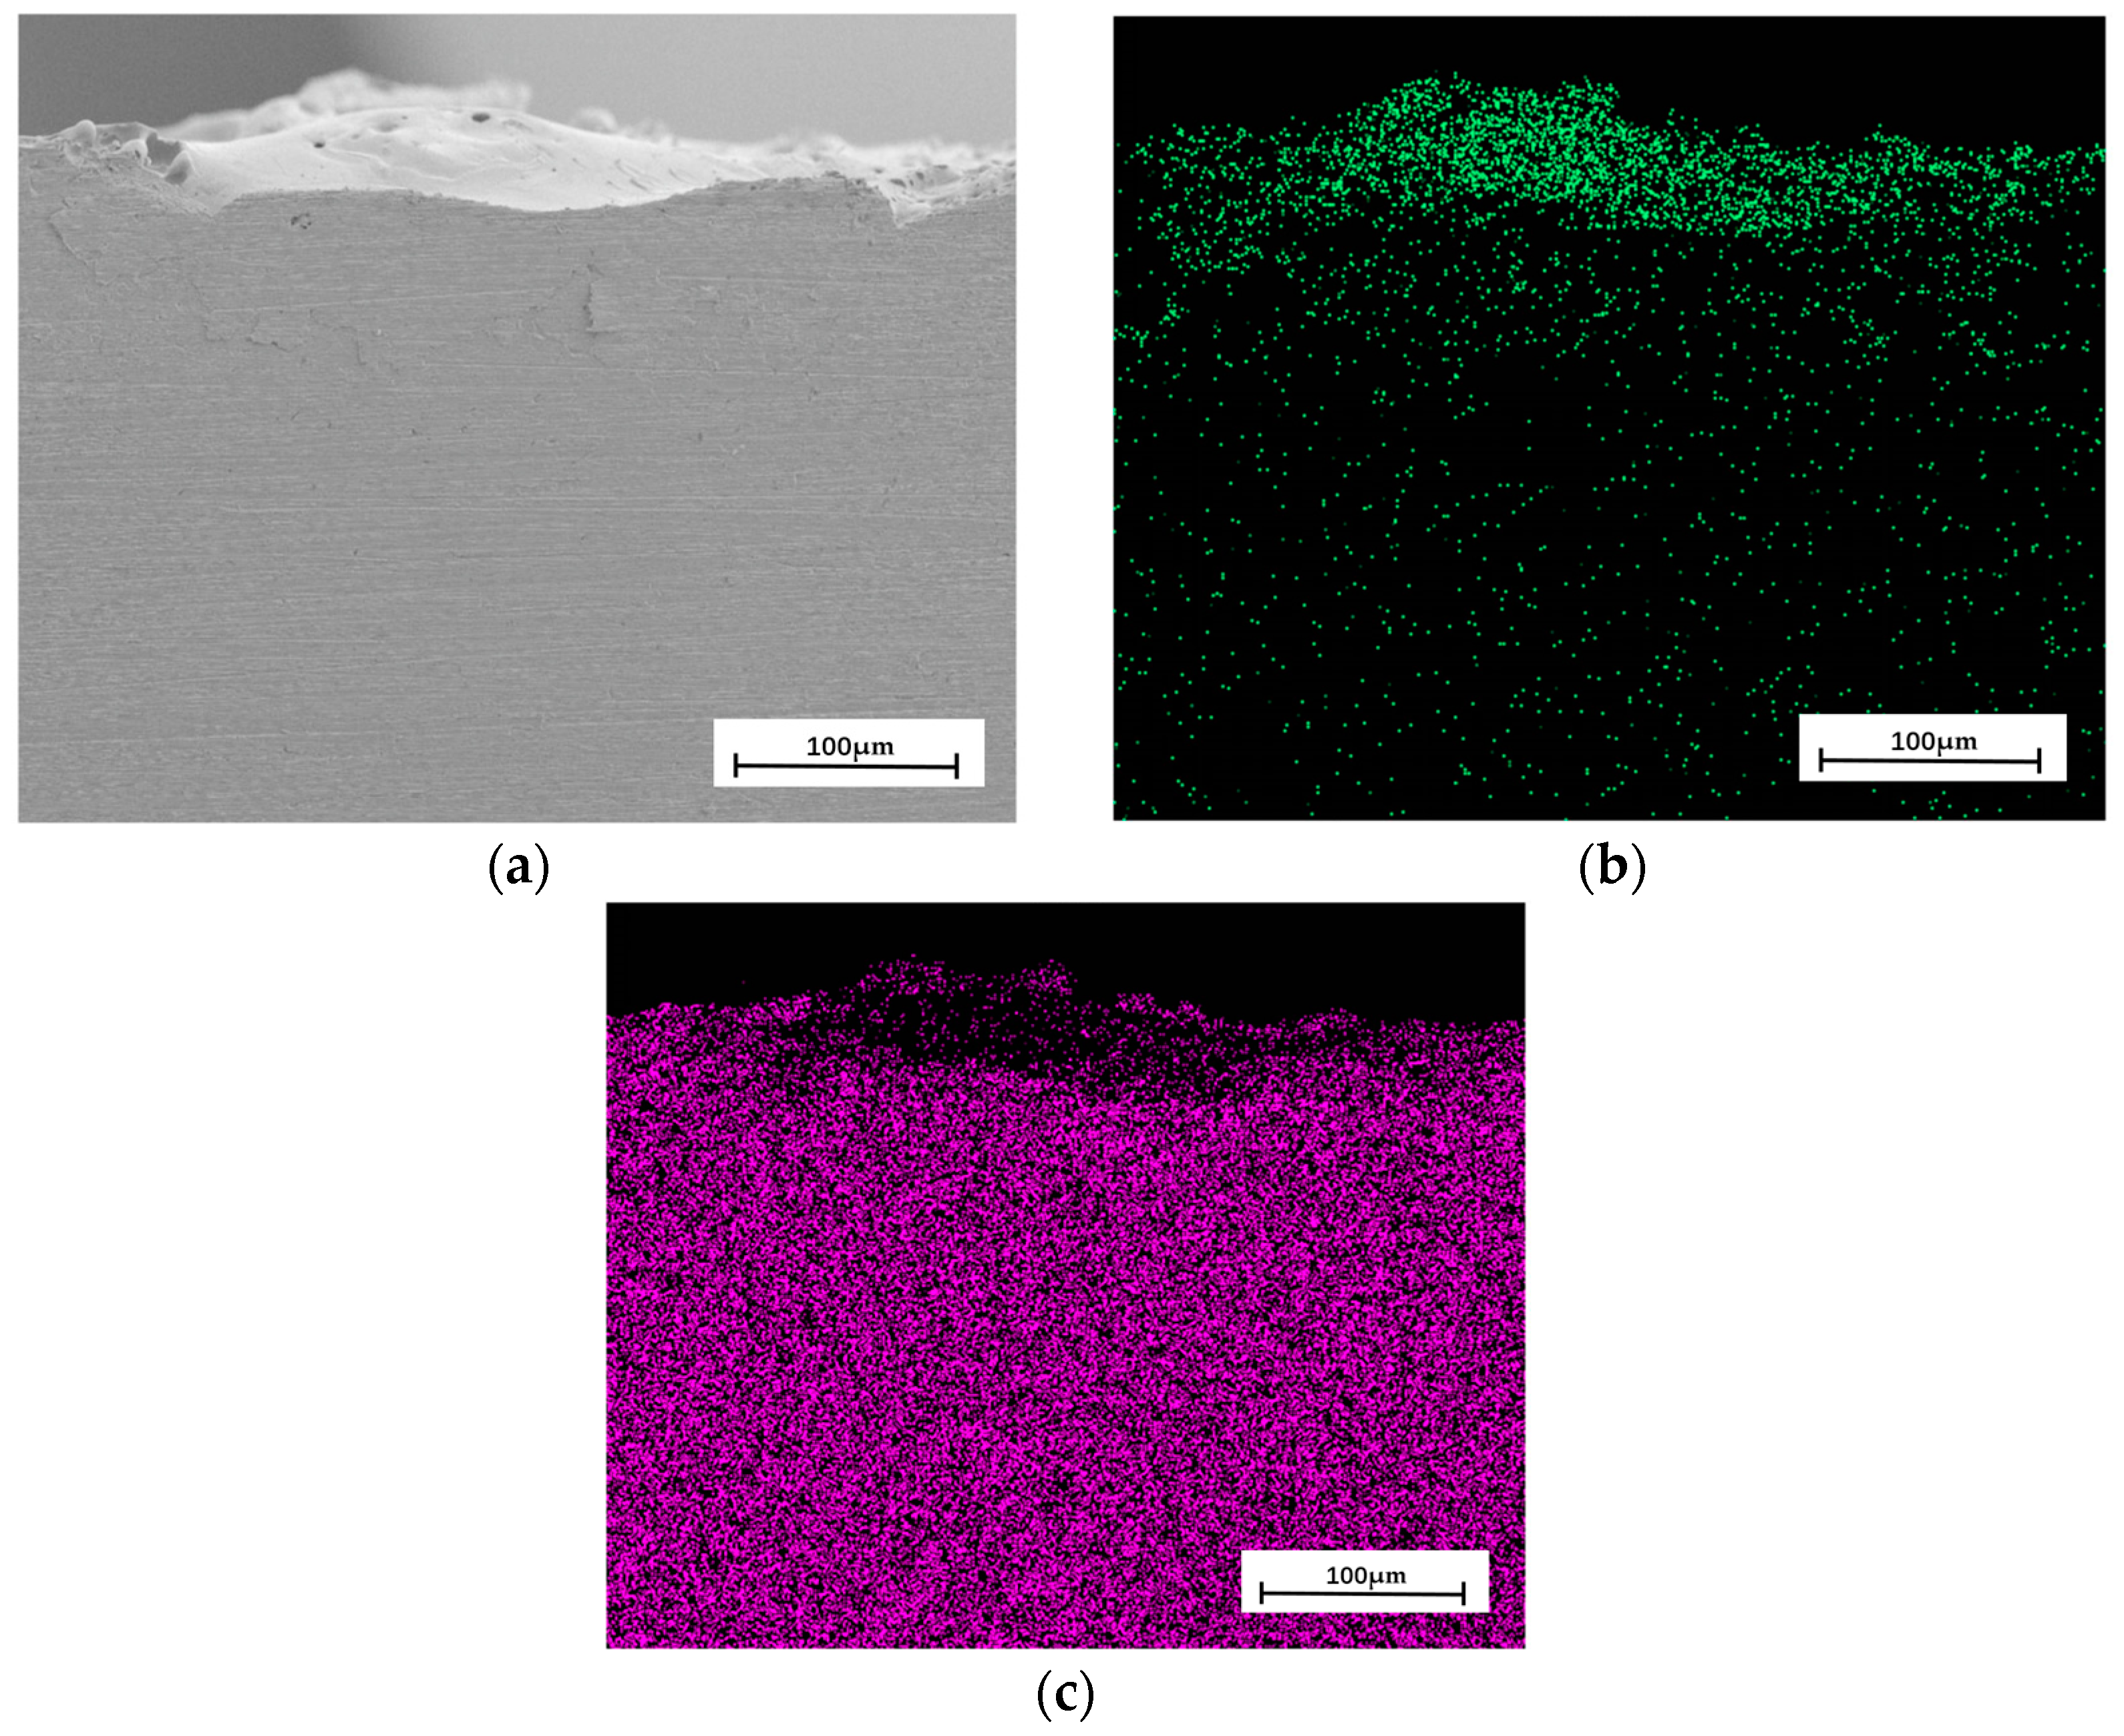
In the deposition area, the content of electrode material decreases rapidly from the droplet to the bottom of the molten pool. When the deposition time reaches 80 μs, the content of electrode material at the bottom of the molten pool reaches 4.5%. In the material gushing out of the molten pool, the content of electrode material in the upper region is higher than that in the bottom region.
(2)
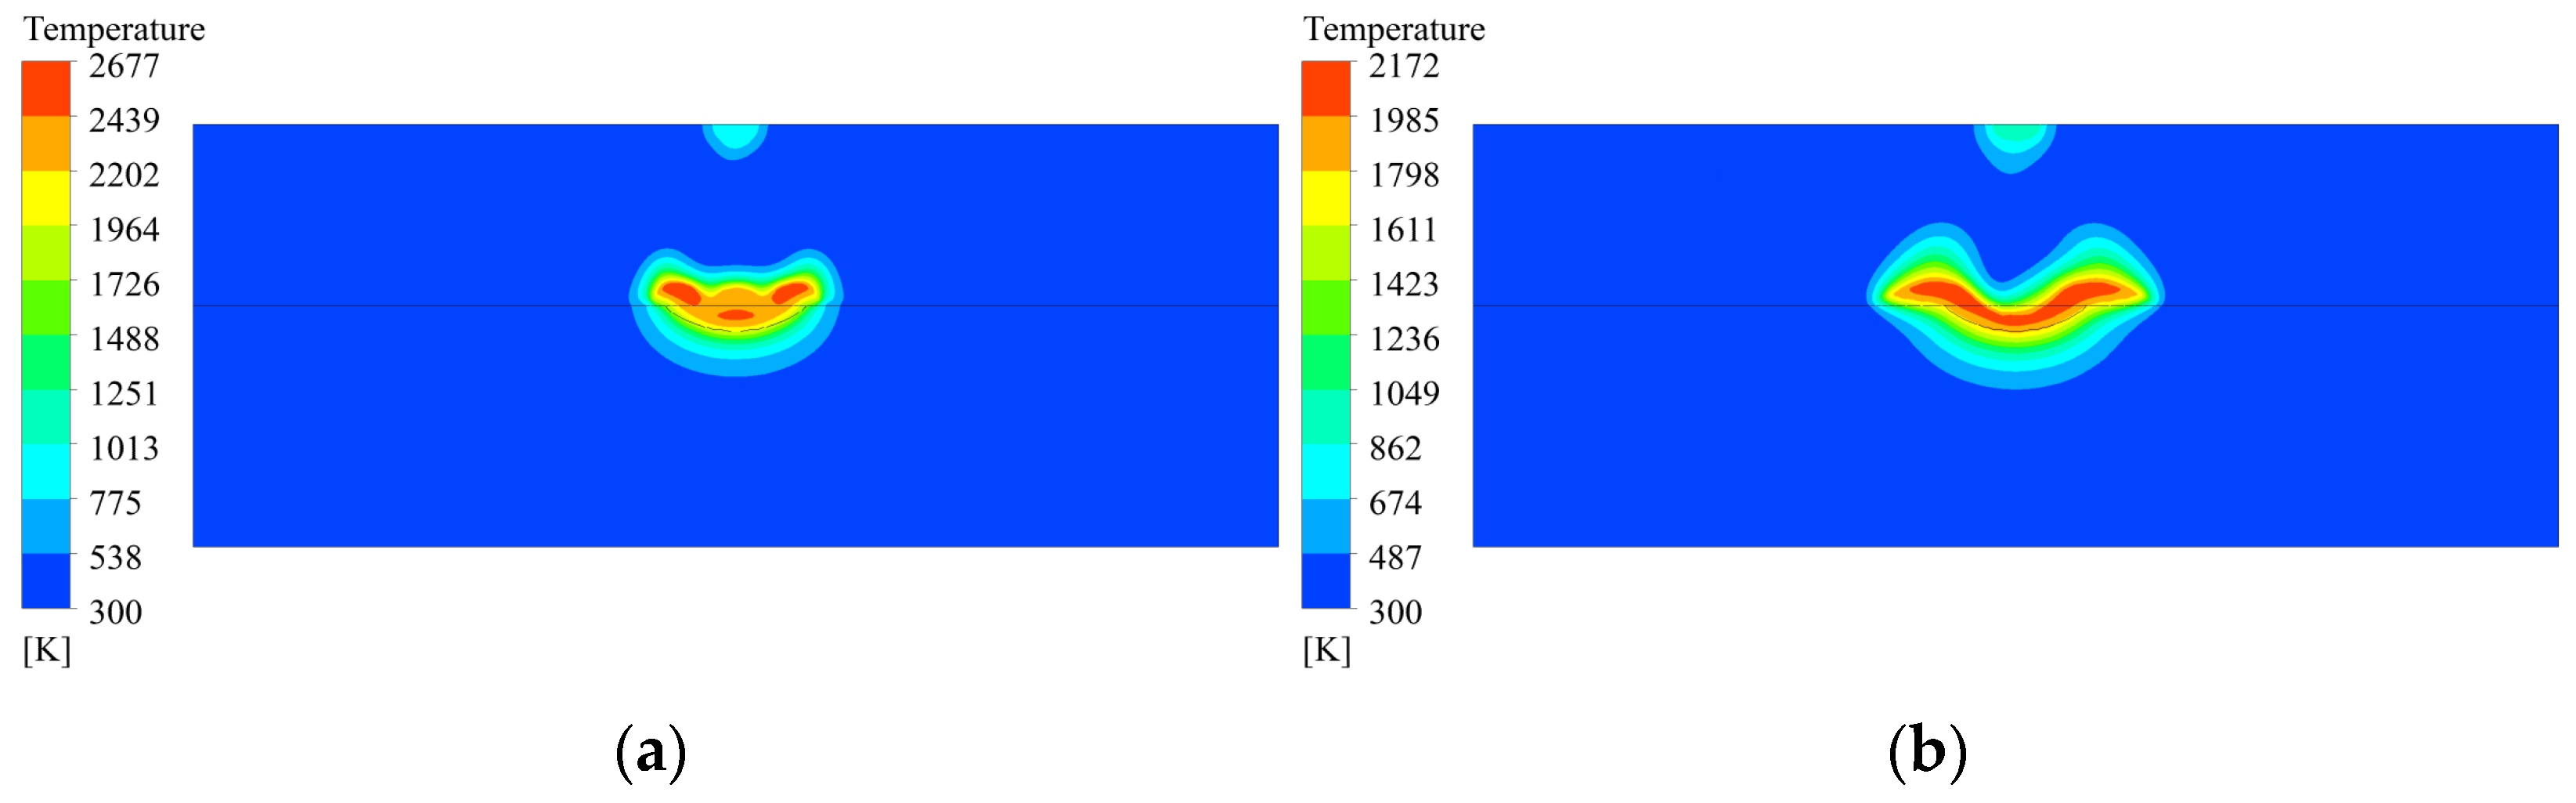
In the deposition area, the high-temperature area moves from the center of the molten pool to the edges as the material flows, and the temperature of the molten material decreases as a whole. The material outside the molten pool solidifies first, and in the molten pool, the material gradually solidifies from the bottom upwards to the surface. The shape of the solidification interface is similar to that of the molten pool boundary, and the molten material at the surface finally solidifies.
(3)
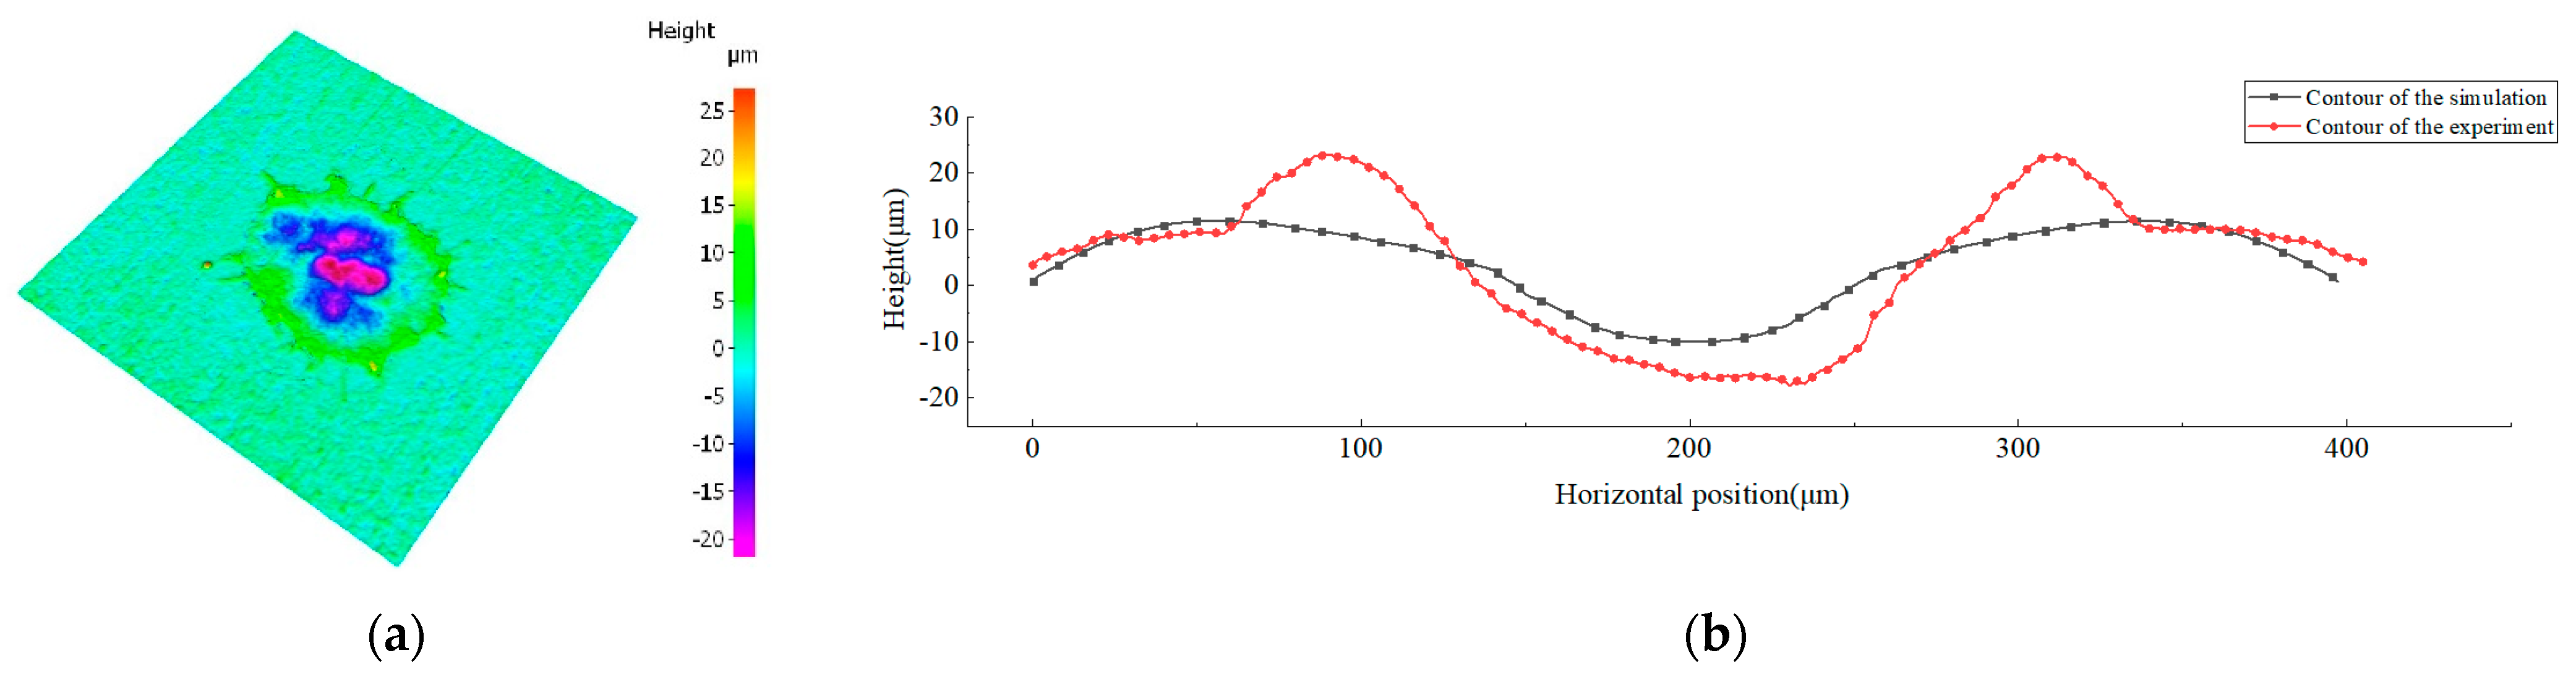
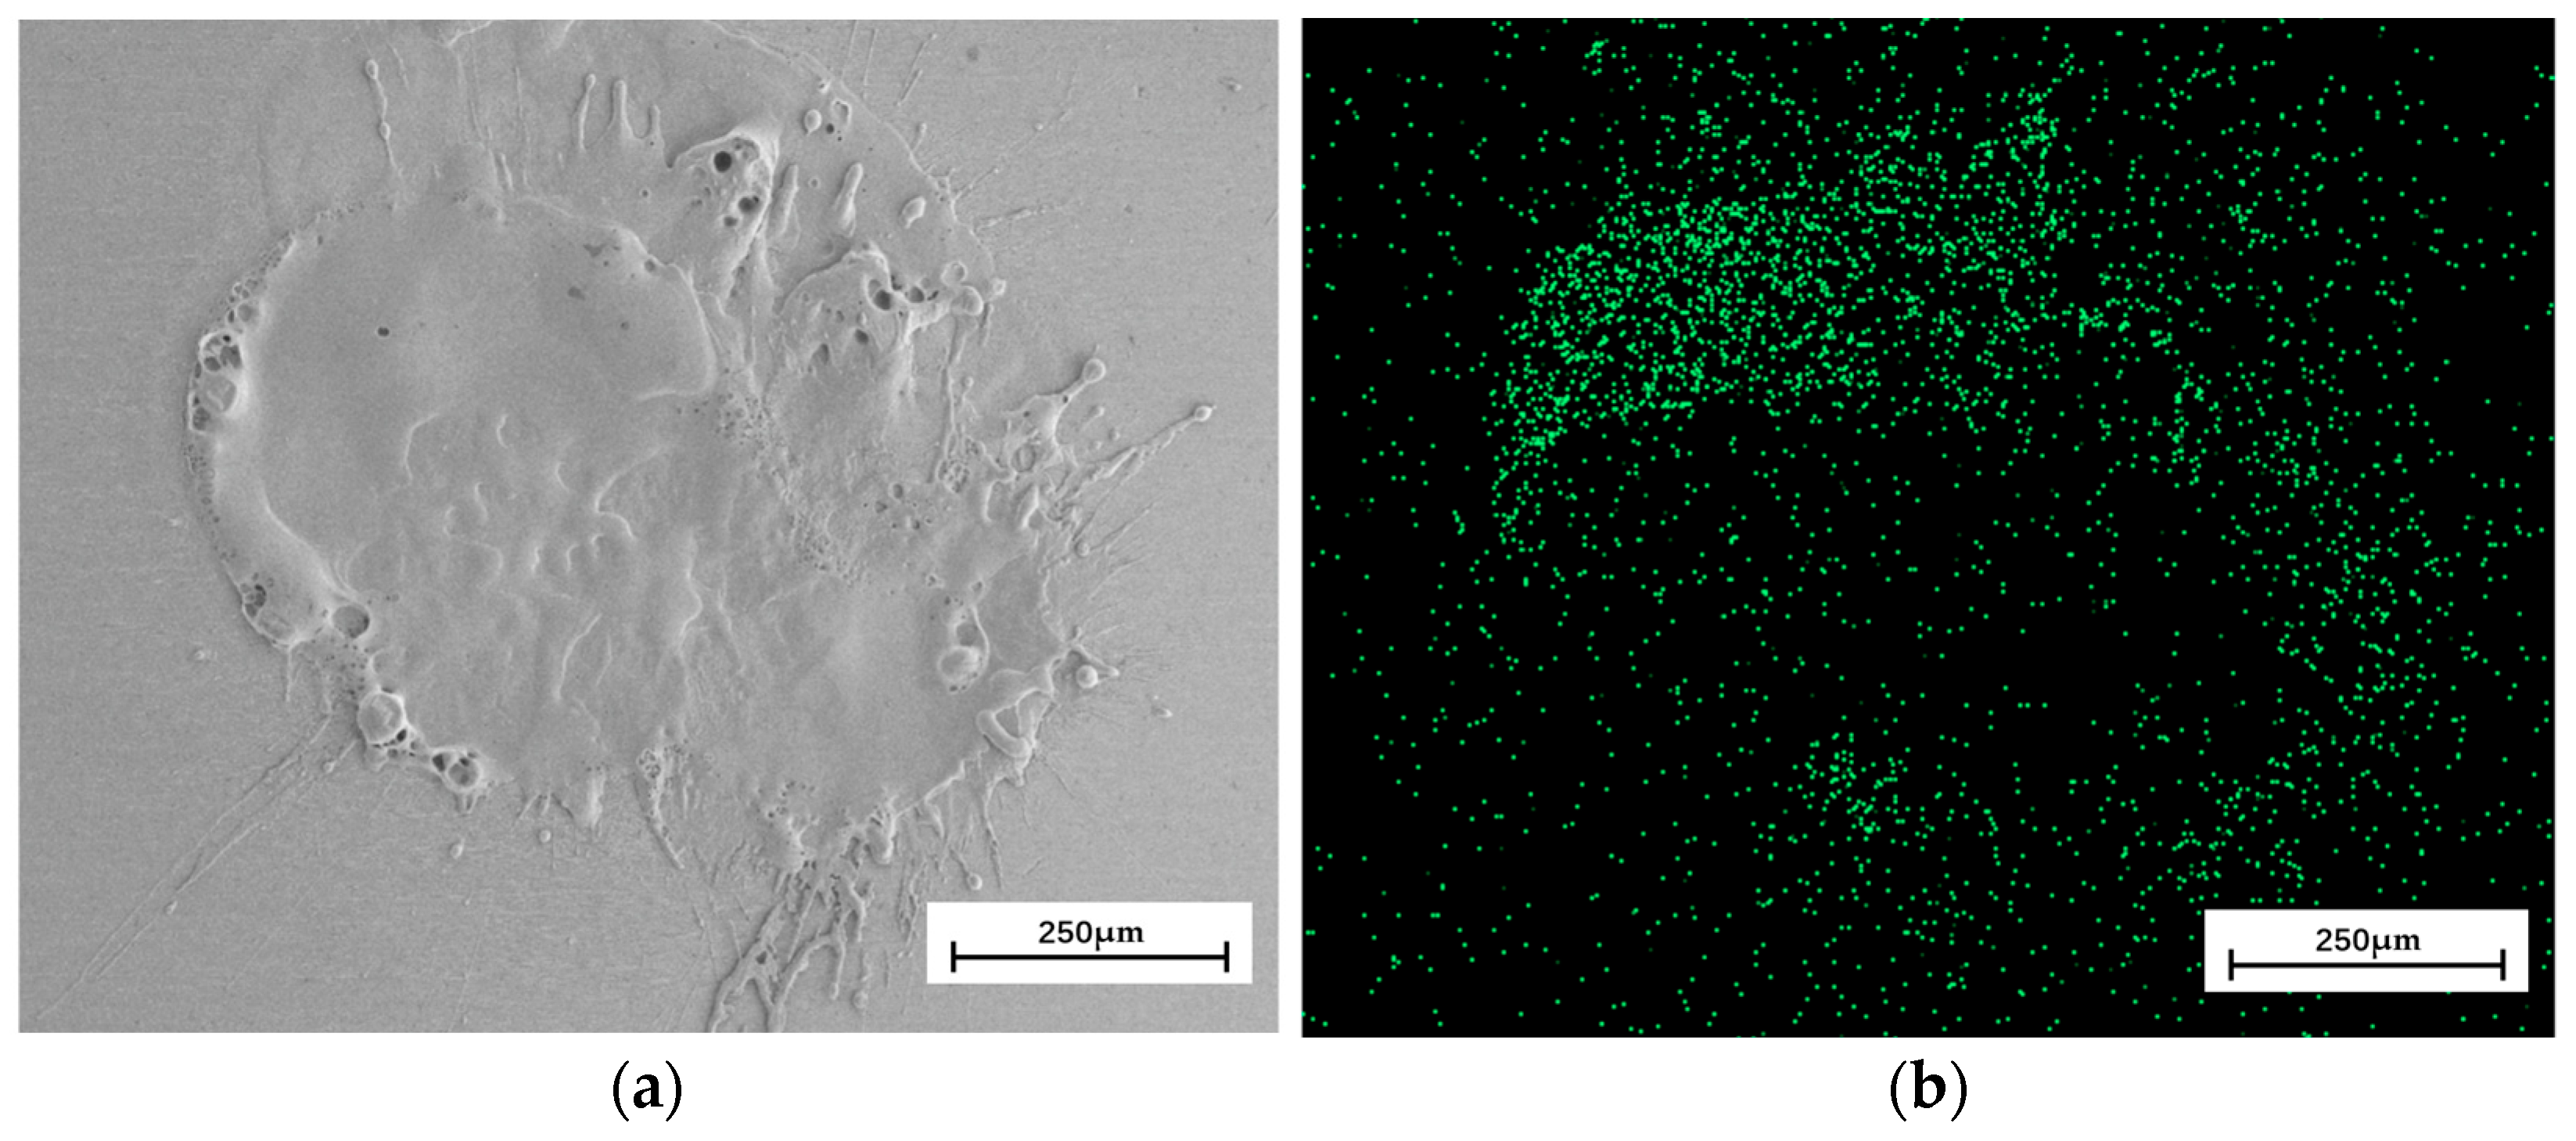
Comparing the simulation results and experiment results, the fluctuation degree of the central part of the simulated contour curve is smaller than that of the experimented one. The average error in the depth direction is 4 μm, the diameter error is about 4%, and the element comparison analysis shows that the element diffusion distance in the depth direction is 4 μm, while the lateral diffusion distance reaches 364 μm, with an average error of 7.6%. The cross-section structure comparison analysis shows that the surface profile shape obtained from the simulation is basically consistent with the experimental results, and the error in diameter is about 11%.

Author Contributions

Conceptualization, J.Q.; Funding acquisition, Y.L.; Investigation, S.Z. (Shiqi Zhang); Methodology, Y.L.; Resources, S.Z. (Shengfang Zhang); Software, Q.S.; Supervision, S.Z. (Shengfang Zhang); Writing—original draft, Q.S.; Writing—review and editing, Y.L. All authors have read and agreed to the published version of the manuscript.

Funding

Financial support was received from the General Program of the Natural Science Foundation of Liaoning Province under grant no. 2022-MS-340, the Liaoning BaiQianWan Talents Program under grant no. 2021921025, and the Natural Science Basic Research Project of the Education Department of Liaoning Province under grant no. JDL2020009 and are acknowledged.

Institutional Review Board Statement

Not applicable.

Informed Consent Statement

Not applicable.

Data Availability Statement

Not applicable.

Conflicts of Interest

The authors declare no conflict of interest.

References

  1. Sychev, A.P.; Kolesnikov, I.V.; Sycheva, M.A. Extending the life of frictional components in freight cars by hybrid electrospark deposition. Russ. Eng. Res. 2022, 42, 49–52. [Google Scholar] [CrossRef]
  2. Enrique, P.D.; Peterkin, S.; Zhou, N.Y. Parametric Study of Automated Electrospark Deposition for Ni-Based Superalloys. Weld. J. 2021, 100, 239–248. [Google Scholar] [CrossRef]
  3. Senin, P.V.; Velichko, S.A.; Martynov, A.V.; Martynova, E.G. Increasing the wear resistance of forged tools by electrospark deposition. Russ. Eng. Res. 2020, 40, 427–430. [Google Scholar] [CrossRef]
  4. Tarelnyk, V.B.; Gaponova, O.P.; Myslyvchenko, O.M.; Sarzhanov, B.O. Electrospark deposition of multilayer coatings. Powder Metall. Met. Ceram. 2020, 59, 76–88. [Google Scholar] [CrossRef]
  5. Holubets, V.M.; Pashechko, M.I.; Borc, J.; Tisov, O.V.; Shpuliar, Y.S. Wear resistance of electrospark-deposited coatings in dry sliding friction conditions. Powder Metall. Met. Ceram. 2021, 60, 90–96. [Google Scholar] [CrossRef]
  6. Burkov, A.A. Improvement of Ti6Al4V-alloy wear resistance by electric-spark hafnium carbide coatings. Frict. Wear 2020, 41, 543–548. [Google Scholar] [CrossRef]
  7. Salmaliyan, M.; Ghaeni, F.M.; Ebrahimnia, M. Effect of electro spark deposition process parameters on WC-Co coating on H13 steel. Surf. Coat. Technol. 2017, 321, 81–89. [Google Scholar] [CrossRef]
  8. Feng, X.R.; Cui, X.F.; Zheng, W.; Lu, B.W.; Dong, M.L.; Wen, X.; Zhao, Y.; Jin, G. Effect of the protective materials and water on the repairing quality of nickel aluminum bronze during underwater wet laser repairing. Opt. Laser Technol. 2019, 114, 140–145. [Google Scholar] [CrossRef]
  9. Theimer, S.; Graunitz, M.; Schulze, M.; Gaertner, F.; Klassen, T. Optimization adhesion in cold spraying onto hard substrates: A case study for brass coatings. J. Therm. Spray Technol. 2019, 28, 124–134. [Google Scholar] [CrossRef]
  10. Samsonov, G.V.; Verkhoturov, A.D.; Sychev, V.S.; Bezykornov, A.I. Investigation of some of thelaws governing the formation of a hardened layer during the process of electro-spark alloying. Fiz.-Khimicheskaya Mekhanika Mater. 1974, 7, 3–6. [Google Scholar]
  11. Johnson, R.N.; Sheldon, G.L. Advances in the electrospark deposition coating process. J. Vac. Sci. Technol. A Vac. Surf. Film. 1986, 4, 2740–2746. [Google Scholar] [CrossRef]
  12. Lešnjak, A.; Tušek, J. Some characteristics of electrospark deposition. Int. J. Mater. Res. 2003, 94, 1260–1266. [Google Scholar] [CrossRef]
  13. Tušek, J.; Kosec, L.; Lešnjak, A.; Muhič, T. Electrospark deposition for die repair. Metalurgija 2012, 51, 17–20. [Google Scholar]
  14. Liu, J.; Wang, R.; Qian, Y. The formation of a single-pulse electrospark deposition spot. Surf. Coat. Technol. 2005, 200, 2433–2437. [Google Scholar] [CrossRef]
  15. Chen, C.; Wang, M.; Liu, Y.; Wang, D.; Jin, R. Mass transfer trends and the formation of a single deposition spot during high-energy micro-arc alloying of AZ31 Mg alloy. J. Mater. Process. Technol. 2008, 198, 275–280. [Google Scholar]
  16. Renna, G.; Leo, P.; Casavola, C. Effect of electrospark process parameters on the WE43 Magnesium Alloy Deposition Quality. Appl. Sci. 2019, 9, 4383. [Google Scholar] [CrossRef]
  17. Galinov, I.V.; Luban, R.B. Mass transfer trends during electrospark alloying. Surf. Coat. Technol. 1996, 79, 9–18. [Google Scholar] [CrossRef]
  18. Thamer, A.D.; Hafiz, M.H.; Mahdi, B.S. Mechanism of building-up deposited layer during electro-spark deposition. J. Surf. Eng. Mater. Adv. Technol. 2012, 2, 258–263. [Google Scholar] [CrossRef]
  19. Ebrahimnia, M.; Malek Ghaini, F.; Xie, Y.J.; Shahverdi, H. Microstructural characteristics of the built up layer of a precipitation hardened nickel based superalloy by electrospark deposition. Surf. Coat. Technol. 2014, 258, 515–523. [Google Scholar] [CrossRef]
  20. Kovacik, J.; Baksa, P.; Emmer, Š. Electro spark deposition of TiB2 layers on Ti6Al4V alloy. Acta Metall. Slovaca 2016, 22, 52–59. [Google Scholar] [CrossRef]
  21. Chandrakant; Reddy, N.S.; Panigrahi, B.B. Electro spark coating of AlCoCrFeNi high entropy alloy on AISI410 stainless steel. Mater. Lett. 2021, 304, 130580. [Google Scholar] [CrossRef]
  22. Anderson, J.D. Fundamentals of Aerodynamics; McGraw-Hill Education: New York, NY, USA, 2017. [Google Scholar]
  23. Yunus, A.C.; Michael, A.B. Thermodynamics: An Engineering Approach, 8th ed.; McGraw-Hill Education: New York, NY, USA, 1989. [Google Scholar]
  24. DiGiovanni, C.; Kalashami, A.G.; Biro, E.; Zhou, N.Y. Liquid metal embrittlement transport mechanism in the Fe/Zn system: Stress-assisted diffusion. Materialia 2021, 18, 101153. [Google Scholar] [CrossRef]
  25. DiBitonto, D.D.; Eubank, P.T.; Patel, M.R.; Barrufet, M.A. Theoretical models of the electrical discharge machining process. I. A simple cathode erosion model. J. Appl. Phys. 1989, 66, 4095–4103. [Google Scholar] [CrossRef]
  26. Lou, L. Computer Simulation of EDM. Ph.D. Thesis, Shanghai Jiao Tong University, Shanghai, China, 2000. [Google Scholar]
  27. Kiyoshi, I. The Principle of Electric Discharge Machining—Mold Processing Technology; National Defense Industry Press: Beijing, China, 1983; pp. 72–83. [Google Scholar]
  28. Kim, Y.S.; Eagar, T.W. Analysis of metal transfer in gas metal arc welding. Weld. J. 1993, 72, 269–278. [Google Scholar]
  29. Chhabra, R.; Shankar, V. Coulson and Richardson’s Chemical Engineering, 7th ed.; Butterworth-Heinemann: Oxford, UK, 2017. [Google Scholar]
  30. Fran, C. ASM Ready Reference: Thermal Properties of Metals; ASM International: Materials Park, OH, USA, 2002. [Google Scholar]
  31. Zhang, J.R.; Zhao, T.Y. Manual of Thermophysical Properties of Substances Commonly Used in Engineering; National Defense Industry Press: Beijing, China, 1987. [Google Scholar]
Figure 1. Schematic diagram of coating fusion and solidification process.
Coatings 13 01865 g001
Figure 2. Fusion and solidification simulation model.
Coatings 13 01865 g002
Figure 3. Schematic diagram of Gaussian heat source.
Coatings 13 01865 g003
Figure 4. Simulation setup of droplet transfer process.
Coatings 13 01865 g004
Figure 5. Electrode material distribution at different times: (a) 65 μs; (b) 70 μs; (c) 75 μs; (d) 80 μs; (e) 85 μs; and (f) 90 μs.
Coatings 13 01865 g005
Figure 6. The variation in Ni mass fraction at different depths.
Coatings 13 01865 g006
Figure 7. Temperature change during coating solidification: (a) 70 μs; (b) 80 μs; (c) 90 μs; (d) 100 μs; and (e) 110 μs.
Coatings 13 01865 g007aCoatings 13 01865 g007b
Figure 8. Solidification process of coating material at different times: (a) 70 μs; (b) 80 μs; (c) 90 μs; (d) 100 μs; and (e) 110 μs.
Coatings 13 01865 g008
Figure 9. The proportion of the solidified part of the molten material in different regions.
Coatings 13 01865 g009
Figure 10. Three-dimensional morphology and contour of deposition points: (a) three-dimensional morphology; (b) contour of deposition points.
Coatings 13 01865 g010
Figure 11. Surface morphology and element distribution of deposition point. (a) Surface morphology of deposition point; (b) Ni element distribution.
Coatings 13 01865 g011
Figure 12. Cross-section morphology and element distribution of deposition point. (a) Cross-section morphology of deposition point; (b) Ni element distribution; and (c) Fe element distribution.
Coatings 13 01865 g012
Figure 13. Deposition point cross-section organization.
Coatings 13 01865 g013
Table 1. Boundary conditions.
No.BoundaryTemperatureVelocity
1MN300 K2 m/s
2AM, BN300 K0
3AF, BC q n = 0 ( ρ u ) r = 0
4EF, CDEquation (8)0
5DEEquation (8)0
6FG, CH
Arc GH
Equation (8)
Equation (24)
0
0
Table 2. Main physical parameters of simulation.
Inlet Speed
v/(m·s−1)
Electrode Material Loading Time
t/μs
Gap Voltage
U/(V)
Peak Current
I/(A)
Acceleration due to Gravity
g/(m·s−2)
Surface Tension Coefficient
σ/(N·m−1)
2204559.811
Table 3. Thermo-physical property parameters of Ni.
Temperature (K)Specific Heat Capacity
(J·kg−1·K−1)
Thermal Conductivity (W·m−1·K−1)
293456.8992.28
373469.8682.52
573502.0863.92
773529.2861.6
973550.258.11
1273571.1256.95
1573585.7655.21
Table 4. Thermophysical property parameters of 45 steel.
Temperature (K)Diffusion Coefficient (cm2/S)Specific Heat Capacity
(J·kg−1·K−1)
Thermal Conductivity (W·m−1·K−1)
2930.12047247.68
3730.11348043.53
4730.10449840.44
5730.09552438.13
6730.08656036.02
7730.07761534.16
8730.06870031.96
9730.06285428.66
10280.060106425.14
10730.05980626.49
11730.06163725.92
12730.06360224.02
Table 5. Thermo-physical properties of steel and argon gas.
NomenclatureSymbolUnitSteelArgon
Specific heatCp(J·kg−1·K−1)Cp (T)510
Thermal conductivityk(W·m−1·K−1)k (T)0.08
Density       ρ (kg·m−3)72001.78
Dynamic viscosity       μ (Kg·m−1·s−1)0.0060.1
Surface tension       γ (N·m−1)1
Latent heat of fusion       L (J·kg−1)2.47 × 10⁵
Solidus temperatureTs(K)1750
Liquidus temperatureTl(K)1800
Melting temperatureTavg(K)1775
EnthalpyH(J)Equation (17)
Liquidus slopemiK·(wt%)−1−7.6
Thermal diffusion coefficientDm(cm2·s−1)0.063
Table 6. Component content of ERNi-1 electrode (wt%).
IngredientsContent
C≤0.15
Mn≤1.0
Fe≤1.0
Si≤0.7
Cu≤0.2
Ni≥92.0
Al≤1.5
Ti2.0~3.5
Table 7. Electro-spark deposition experimental parameters.
ParametersDescription
Electrode materialERNi-1
Workpiece material45 steel
EnvironmentAir
Protective gasArgon
Discharge voltage45 V
Pulse width percentage40%
Disclaimer/Publisher’s Note: The statements, opinions and data contained in all publications are solely those of the individual author(s) and contributor(s) and not of MDPI and/or the editor(s). MDPI and/or the editor(s) disclaim responsibility for any injury to people or property resulting from any ideas, methods, instructions or products referred to in the content.

