Article

Numerical Simulation and Experimental Study on Detecting Effective Prestress of 1860-Grade Strands Based on the Drilling Method

1
School of Civil Engineering, Southwest Forestry University, Kunming 650224, China
2
Yunnan Provincial Key Laboratory of Building Structures and New Materials Enterprise, Kunming 650223, China
3
Yunnan Academy of Building Research, Kunming 650223, China
4
Yunnan Tongqu Engineering Inspection Company Limited, Kunming 650224, China
*
Authors to whom correspondence should be addressed.
Coatings 2023, 13(11), 1869; https://doi.org/10.3390/coatings13111869
Submission received: 29 September 2023 / Revised: 19 October 2023 / Accepted: 21 October 2023 / Published: 31 October 2023
(This article belongs to the Special Issue Microstructure, Fatigue and Wear Properties of Steels, 2nd Edition)

Abstract

:
In this paper, we study the magnitude of the effective prestressing force of steel strands in prestressed reinforced concrete structures. Through the theory of micro-hole release, the functional relationship equation between tensile stress and strain-containing coefficients A and B is established. Then, Midas FEA NX 2022 (v1.1) finite element software is used to establish the stress-release model of strand drilling holes and analyze the influence of parameters such as drilling depth, drilling diameter, hole–edge distance, and tension stress on the amount of stress release. Finally, through a homemade tensioning platform, we verify the reasonableness of the finite element simulation calculation law and determine coefficients A and B. The results of the study show that based on Kirsch’s analytical formula and the theory of microvia release, the axial tension force and axial strain are linearly correlated; the Midas FEA NX finite element software can effectively simulate the force state of strand cross-section; and through the strand-drilled hole model simulation and analysis, it is found that the tension stress value and the stress-release amount are related to the tensile stress value and the tensile stress value. We found that the value of tensile stress and the amount of stress released are positively correlated; with the increase in the hole margin, the amount of stress released gradually decreases; with the increase in the diameter of the hole, the amount of strain released gradually increases; and the greater the depth of the hole, the greater the amount of strain release. Moreover, the use of a hole margin of 3–6 mm, a hole diameter of 1.5 mm and 1.8 mm, and a hole depth of 2.5 mm is more reasonable in the test conditions, as follows. Through the drilling test conditions of 1.5 mm drilling diameter, 2.5 mm drilling depth, and 4 mm hole side distance, we verified the measured strain value of the steel wire and the tensile force value of the linear correlation between the functional relationship and the use of this functional relationship to determine the theoretical derivation of the coefficient to be determined: A is 1.12 and B is 57.84.

1. Introduction

A prestressing strand is a kind of steel wire bundle made of multiple high-strength steel wires helically wound around a central steel wire; it has excellent axial tensile resistance and is widely used in various engineering fields, such as prestressed concrete beams, slings, in vitro prestressing, etc. [1,2]. The stress state of the prestressing strand directly affects the reliability and safety of the structure [3,4], so understanding the existing prestressing strand size is key to evaluating the performance of the structure.
In existing studies, although the nondestructive testing method has the advantages of perfect theory and convenient operation, it has poor accuracy and is unable to visualize the specific loss of existing prestressing force in strands [5,6,7,8]. Moreover, the method of arranging pressure sensors at the anchorage end to measure the loss of prestressing force can only be applied to bridges in progress, and it cannot be applied to in-service prestressed concrete structures. Compared with the nondestructive testing method and the pressure sensor method, the method of detecting the effective prestressing force of the strand by drilling holes in the prestressing strand to release part of the stress is more intuitive and accurate for in-service bridges, and the combination of tests and finite element simulation can effectively analyze the strand force characteristics and detect the stress distribution in the cross-section [9,10].
In recent years, many scholars have conducted more finite element simulations and experimental studies on the drilling method to detect the effective prestressing of steel strands. Zhang Zhiguo [11] and others used finite element simulation and the experimental results of a comparative analysis of stress release—with an increase in the hole side distance and stress release and an increase in the radius of the drill hole—but the model of the test process for the first was as follows: conduct strain gauge pasting, put tension on the strand, and finally record the effective prestressing force value (first paste and then pull). For the in-service pre-stressed concrete beams and other structures, prestressing beams are usually under tension and cannot achieve the “first paste and then pull” test process. Thus, is this test process applicable to the “first paste and then pull” test process? For structures such as in-service prestressed concrete girders, the prestressing beams are usually under tension, and the “post and pull” test procedure cannot be realized. Whether this test procedure applies to in-service prestressed bridges has to be further investigated. Rendle N J [12] analyzed the change in strain variables during the stress-release process of the members according to the strain measurement technique using several tests and then calculated the small dimensions of the prestressing force according to the assumptions of homogeneity, isotropism, and linear elasticity. The residual strain of small-sized drilled members was calculated based on the assumptions of homogeneity, isotropy, and linear elasticity of the material. Chen Chong et al. [13] carried out a finite element simulation of a steel strand using differential geometry theory to analyze the effect of friction on strand cross-section stresses during the elastic phase and found that the distribution of equivalent stresses in the cross-section of steel strands is more in line with the actual situation if the friction between steel wires is considered. Seyed Reza Ghoreishi et al. [14] compared and analyzed the theoretical computational model of the strand test and the 3D finite element model. The results of finite element simulation were obtained by comparing and contrasting; the results of finite element simulation were also obtained by comparing the theoretical calculation model and the 3D finite element model of the strand test. Comparative analysis was conducted and the finite element simulation results matched the theoretical model in the elastic phase, and the error between the plastic phase and the theoretical calculation model was larger; the theoretical analytical model is inaccurate for axial strand stiffness calculation when considering the effect of a twist angle. Wang Biao Cai [15] explored stress release in the concrete and ordinary steel bars of a hollow core slab by combining ANSYS software simulation with test comparative analysis, and it was concluded that the stress-release effect of the ordinary steel bars in the two methods is better, the accuracy of the test results is more accurate, and the test detection accuracy meets the engineering requirements, which is up to more than 90%. Chen Jiguang [16], based on the blind hole method, compared and analyzed the stress release of steel strand-drilled holes in bridges with the finite element model, and considering the stress-release coefficient and the impact of the stress-release volume on the test results, it was concluded that the stress-release coefficient increases with the diameter of the drilled holes, and the larger the stress-release volume, the better the test results. Yuan Qin [17], through the Abaqus finite element model (to establish the strand drilling model) and the drilling test, analyzed the hole diameter, hole depth, tension elastic modulus, and other parameters of the effective prestress test results. The results show that, by taking into account the influence of the factors of the measured results, the numerical simulation results are more in line with the results and the relative error is small. The above study shows that for the detection of effective prestress using the drilling method, the test process of first tensioning the strand, then pasting the strain gauges, and finally recording the value of effective prestress (pulling and then pasting) is still rare. The feasibility of identifying the effective stress of strands based on the drilling method is high. For the numerical simulation of strands, if only focusing on the analysis of the elasticity stage of the strand and not considering the analysis of plasticity, the effect of the results is greater; for the numerical simulation of strands, if not considering the effect of factors such as strand force and elastic modulus, the results are more consistent with the results and the relative error is higher. For the numerical simulation of a steel strand, if we do not consider the influence of the strand twist angle and friction on the cross-section’s stress distribution, it is inconsistent with the actual research results. For the numerical simulation of a steel strand, we must consider the influence of the depth of drilling holes, the size of drilling holes, the measurement position, and the size of pre-tension on its stress release, which is more in line with the actual situation.
In view of this situation, this study first proposes a relationship equation between the tension force and the measured strain value through the theory of microvia release. Then, the elastic–plastic model of the drilled holes of 1860-grade bare strands, which are more commonly used in bridge engineering, is established by Midas FEA NX [18], and the effects of the twist angle of the strand and the friction between wires are considered. This is to analyze the effects of the depth of drilling holes, the size of drilling holes, the measurement position and the amount of pretensioned stresses on the stress and strain releases. Finally, the finite element model is verified using the test procedure of “pull first, stick later”, and the relationship between the tension force and the measured strain value is provided to provide a reference for this kind of similar engineering problem.

2. Microporous Release Theory and Derivation of Coefficients A and B

Kirsch’s resolution is shown in Equation (1), which directly analyzes the micro-hole release stresses, stresses, and initial state structural stresses [19,20]. However, there is still a constraint in the direction of the depth of the drilled wire, and the drilled holes generate heat and stress concentration, which makes the hole–edge stresses greater than the yield strength of the wire; there is also additional plastic compressive strain. Under the influence of hole–edge plasticity, the calibration formula of Kirsch’s theoretical strain-release factor is also no longer applicable. The larger the tensile stress, the larger the error generated by the plastic’s additional strain at the edge of the hole; so, to measure the accuracy, the additional strain at the edge of the hole needs to be taken into account, and the strain-release coefficient can be obtained through the calibration experiment. Then, we can calculate the initial state of the structural stress. Through the analysis of the hole–edge release coefficient for the plastic correction calibration method, it can be seen [21] that the method of using the slopes of the σ1-ε and σ2-ε straight lines to find the strain release coefficients is better for obtaining the strain release coefficients and thus calculating the initial stresses.
ε = r 2 1 + μ σ 1 + σ 2 2 R 1 R 2 E + 2 r 2 R 1 R 2 E 1 + μ R 1 2 + R 1 R 2 + R 2 2 r 2 4 R 1 2 R 2 2 1 σ 1 σ 2 c o s 2 θ
where ε is the strain value per unit measurement distance in the axial direction at the edge of the hole, E is Young’s modulus in Gpa, μ is Poisson’s ratio, parameter r is the radius of the hole in mm, R1 and R2 are the nearest and farthest distances between the sensitive grids of the strain gauges and their centers in mm, θ is the angle of the strain gauges and the principal stresses in radians, and σ1 and σ2 are the principal stresses in orthogonal directions in Mpa.
Although the stress field in the vicinity of the wire borehole cannot be obtained directly from the analytical method, it can be obtained from finite element calculations or calibration tests. The Kirsch solution of the factors affects the strain-release coefficients a and b instead, so
  a = r 2 2 R 1 R 2
b = 1 + μ R 1 2 + R 1 R 2 + R 2 2 r 2 4 R 1 2 R 2 2 1 2 r 2 R 1 R 2
Then, Formula (1) is Formula (4).
ε = 1 + μ E a σ 1 + σ 2 + 1 E b σ 1 σ 2 cos 2 θ
When the strain gauges, hole diameter, and hole depth are certain, the drilling of the hole bit produces an additional plastic compressive strain value of a constant B at the edge of the hole [22]. Then, considering the effect of plastic strain at the hole edge, unidirectional stress is applied along the axial direction, i.e., θ = 0, σ1 = σ, σ2 = 0. Substituting into Equation (4) yields Equation (5).
ε = a 1 + μ + b E σ + B
Equation (5), where σ is the unidirectional stress applied axially along the strand in Mpa and B is the coefficient of determination to be made, so A = a 1 + μ + b E , and Equation (5) is Equation (6).
ε = A σ + B
From Equation (5), it can be seen that under the conditions of strain gage specifications, borehole size, a certain depth of the borehole, and a certain measuring distance, and by ignoring the actual measurement error, the measured strain value is linearly and positively correlated with the axial tensile stress, so σ = F N A S , as in Equation (7).
F N = A S A · ε B A · A S
Equation (7) shows the FN strand effective tension value; AS is the 1860-grade strand cross-sectional area. In summary, under the conditions of strain gauge specifications, drill hole size, certain hole depth, and certain measuring distance, and ignoring the actual measurement error, the measured strain value is linearly and positively correlated with the axial tension. Substituting the measured strain value into Equations (6) and (7), the effective tension value of the strand and the effective prestress value of the strand can be obtained. Therefore, it is urgent to determine the influence of relevant factors such as drilling depth, drilling size, measuring position, and pre-tension stress size on its stress and strain release through finite element simulation.

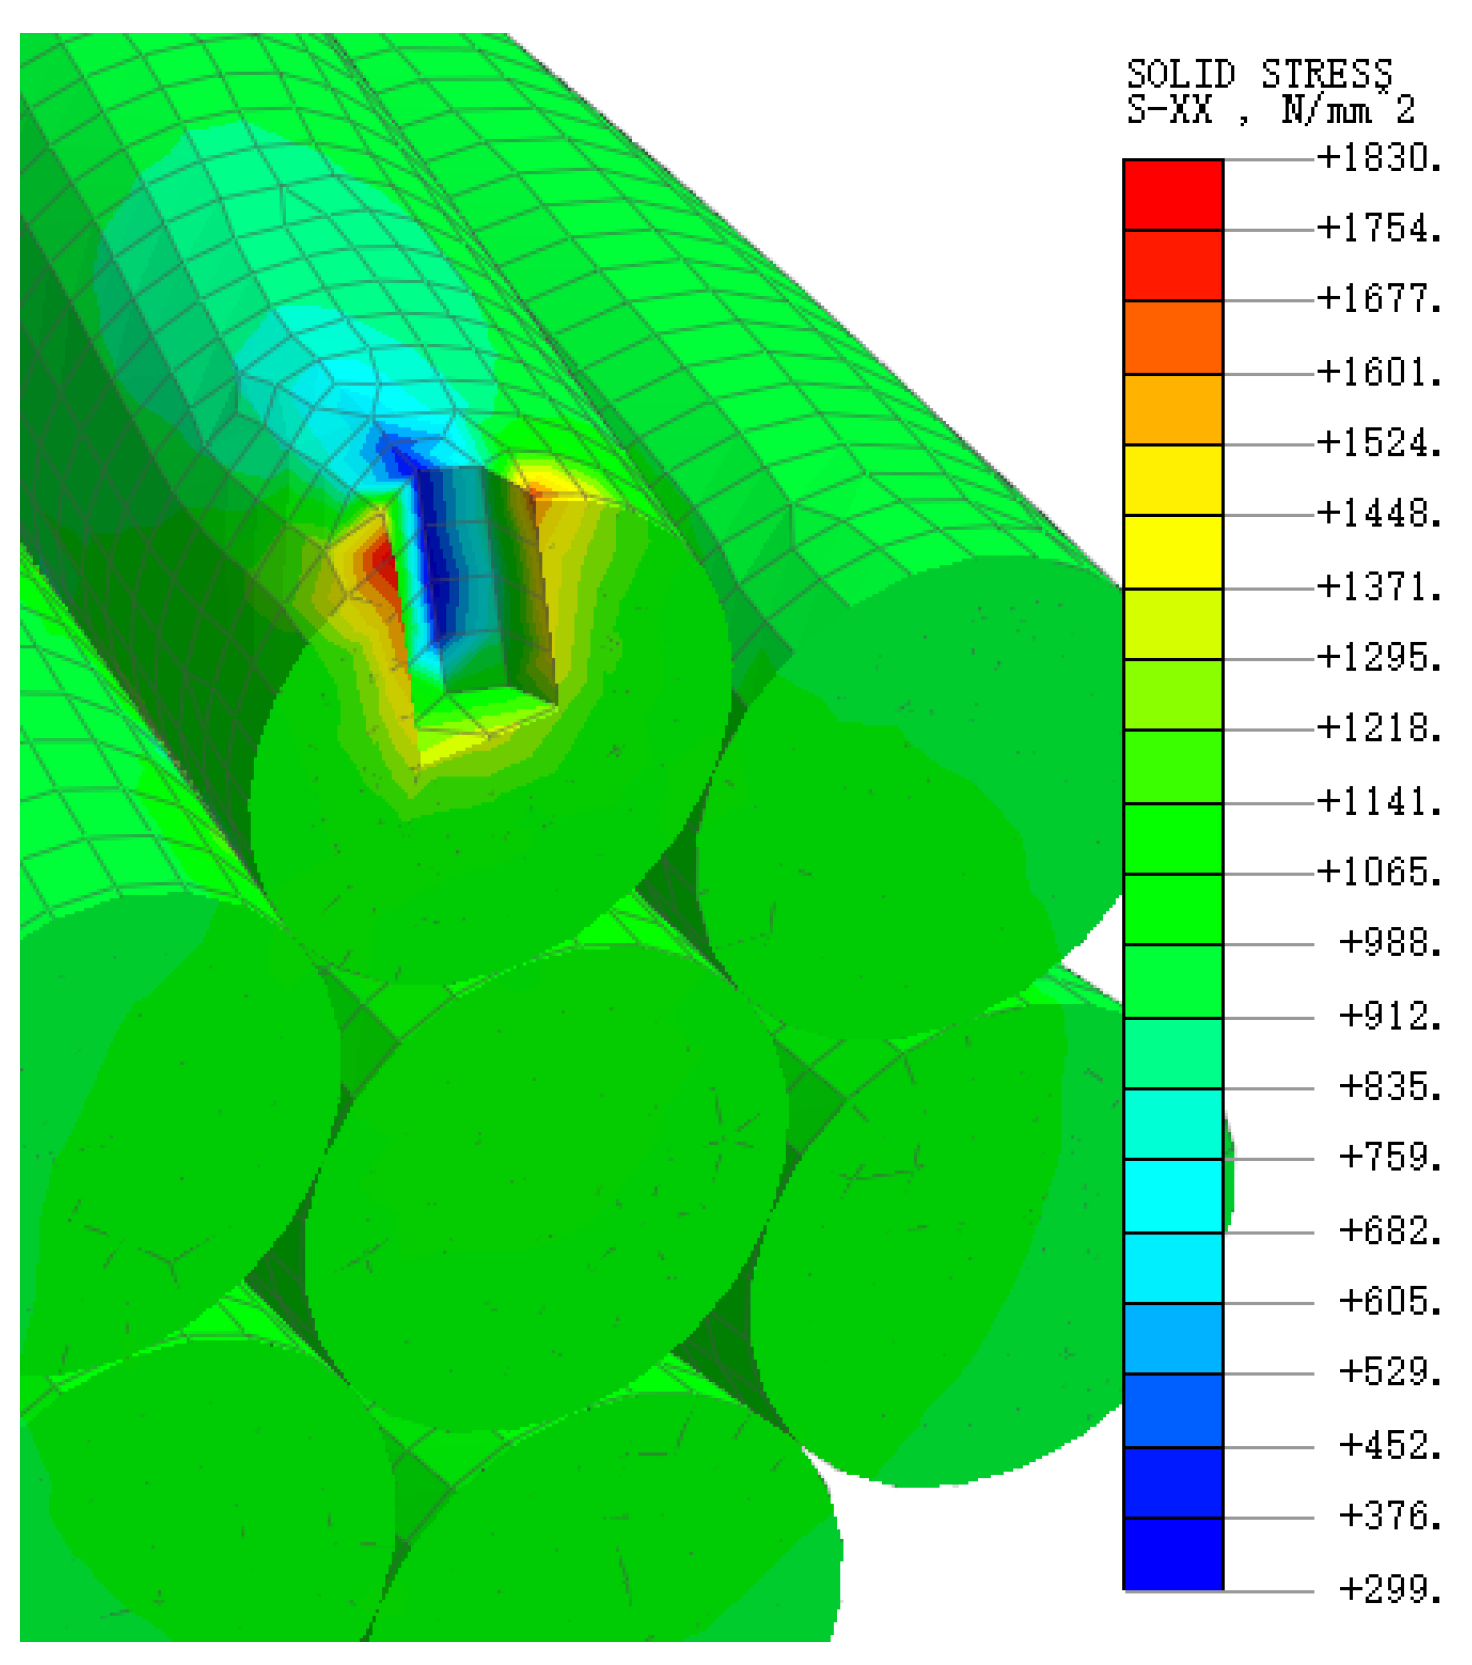
3. Numerical Simulation of Bare Strand Drilling

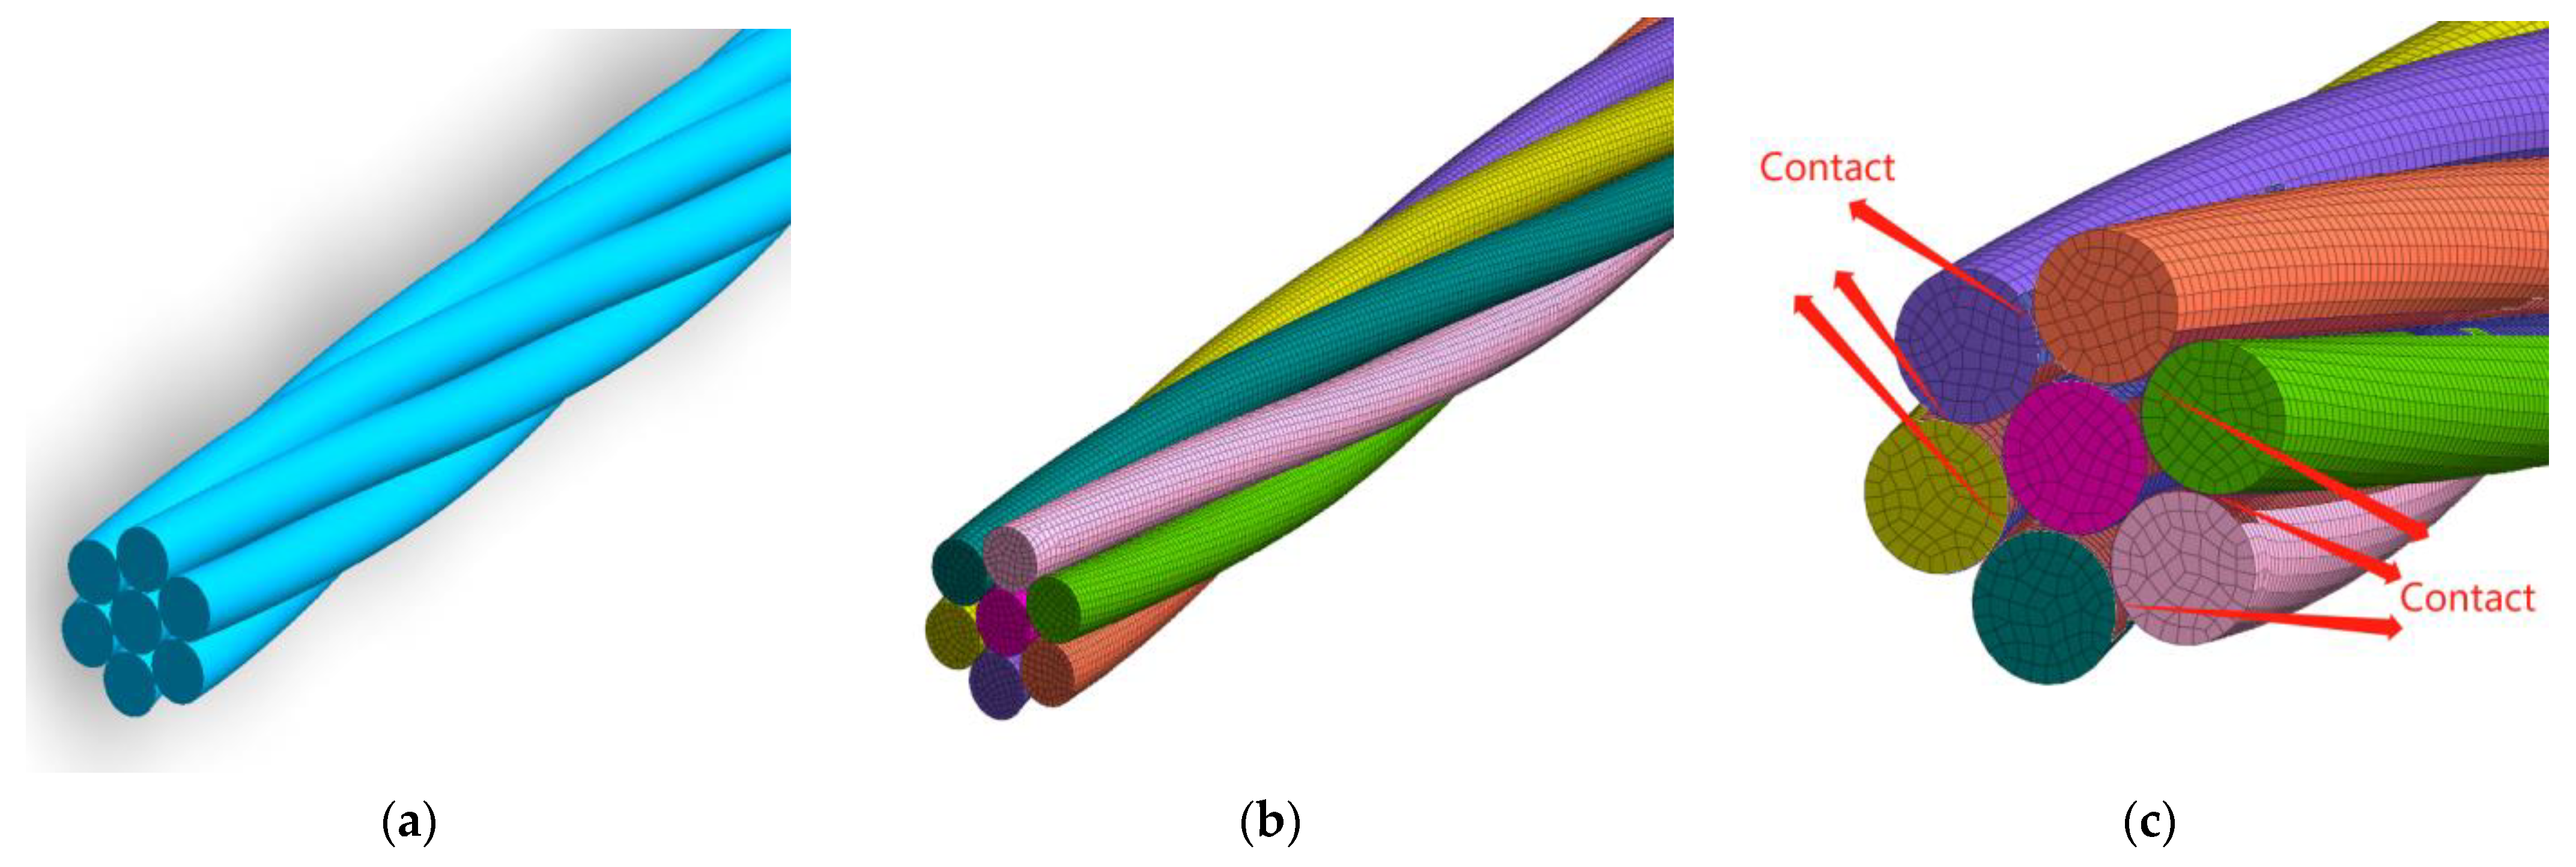
3.1. Establishment of Finite Element Models

The 1860-grade prestressing strand, which is widely used in the engineering field, was used according to the specification described in [23], with parameters as follows: a nominal diameter of 15.20 mm; a twist angle of 8.48°; and a twist distance of 225 mm. Midas FEA NX was used to establish the surface and guiding curve. The surface was scanned along the guiding curve to generate the geometry and move the copy to establish a three-dimensional strand geometric model, as shown in Figure 1a; a nonlinear static solver was used for calculation purposes. To ensure that the calculation effect was not affected by the longitudinal length of the strand, the length of the strand finite element model was taken to be double the twisting distance (225 mm), and an eight-node hexahedral hybrid mesh was used. To ensure the accuracy of the stress calculation, the cells were sown by size control, with an average cell length (width) of 0.5 mm, resulting in a total of 463,880 cells. The finite element mesh division is shown in Figure 1b. Contacts between neighboring side wires, middle wires, and side wires were characterized by roughness, and the coefficient for mutual friction between wires had a value of 0.115 [24,25]; in addition, there were inter-wire cell contacts, as shown in Figure 1c. During loading, a fixed constraint was applied at one end of the model, and the other end was allowed to contract longitudinally. The fixed end caused the outer wire to rotate around the middle wire and the middle wire to rotate; finally, a pressure load was applied at the loading end in the outward direction along the axis.

3.2. Material Parameters

Because of mutual friction within the strand, when drilling to a certain depth, the strand produces a large plastic deformation locally, so the outer-wire drilling simulation must be considered in addition to the elastic–plastic characteristics of the strand. The stress–strain value for the strand was determined using Formula (8). The stress–strain relationship is illustrated in Figure 2. Following [17], the proportionality limit was taken to be 1209 Mpa, and yield strength was taken to be 1581 Mpa. In addition, the elastic modulus of the steel wire was taken to be 195 Gpa, the density was 7.85 ρ/g cm−3, and the Poisson’s ratio value was 0.269 (Table 1). Because we sought to investigate the stress–strain relationship and the elastic–plastic deformation of the borehole section, any fracturing of the steel strand was not considered for the purposes of the present study.
σ = 1.95 × 10 5 ε   ε 6.2 × 10 3   σ = 2.554 × 10 7 ε   2 + 5.12 × 10 5 ε 984.48   6.2 × 10 3 < ε < 10.1 × 10 3    

3.3. Finite Element Model Validation

In order to verify the reasonableness of using Midas FEA NX to simulate the elastic–plastic phase of the strand, pressure loads of 100 Mpa, 200 Mpa, 300 Mpa, 400 Mpa, 500 Mpa, and 600 Mpa were applied successively to the surface of the 3D cell at the loading end of the strand. Table 2 shows calculations of average stresses on the half-twist cross-sections of the outer and middle wires, and Figure 3 shows the stress cloud of the seven-wire cross-sections subdivided by the grid under different tensile stresses. Comparing the calculated results for the average stresses on the half-twisted sections of the outer and middle wires with the theoretical calculations of Feyrer [26], it can be seen that the stresses on the middle wire are greater than those on the outer wire in both cases. Compared with the theoretical calculations of Feyrer, the maximum error for the middle wire is 2.2%, and that for the outer wire is 0.8%. The stress maps calculated for the present study are similar to those previously reported in the literature [27,28,29], so the simulation results may be said to be basically consistent. These results show that the finite element model described in this paper can effectively simulate the stress state of the strand cross-section; it may also be concluded that the model is able to simulate the stress-release law.

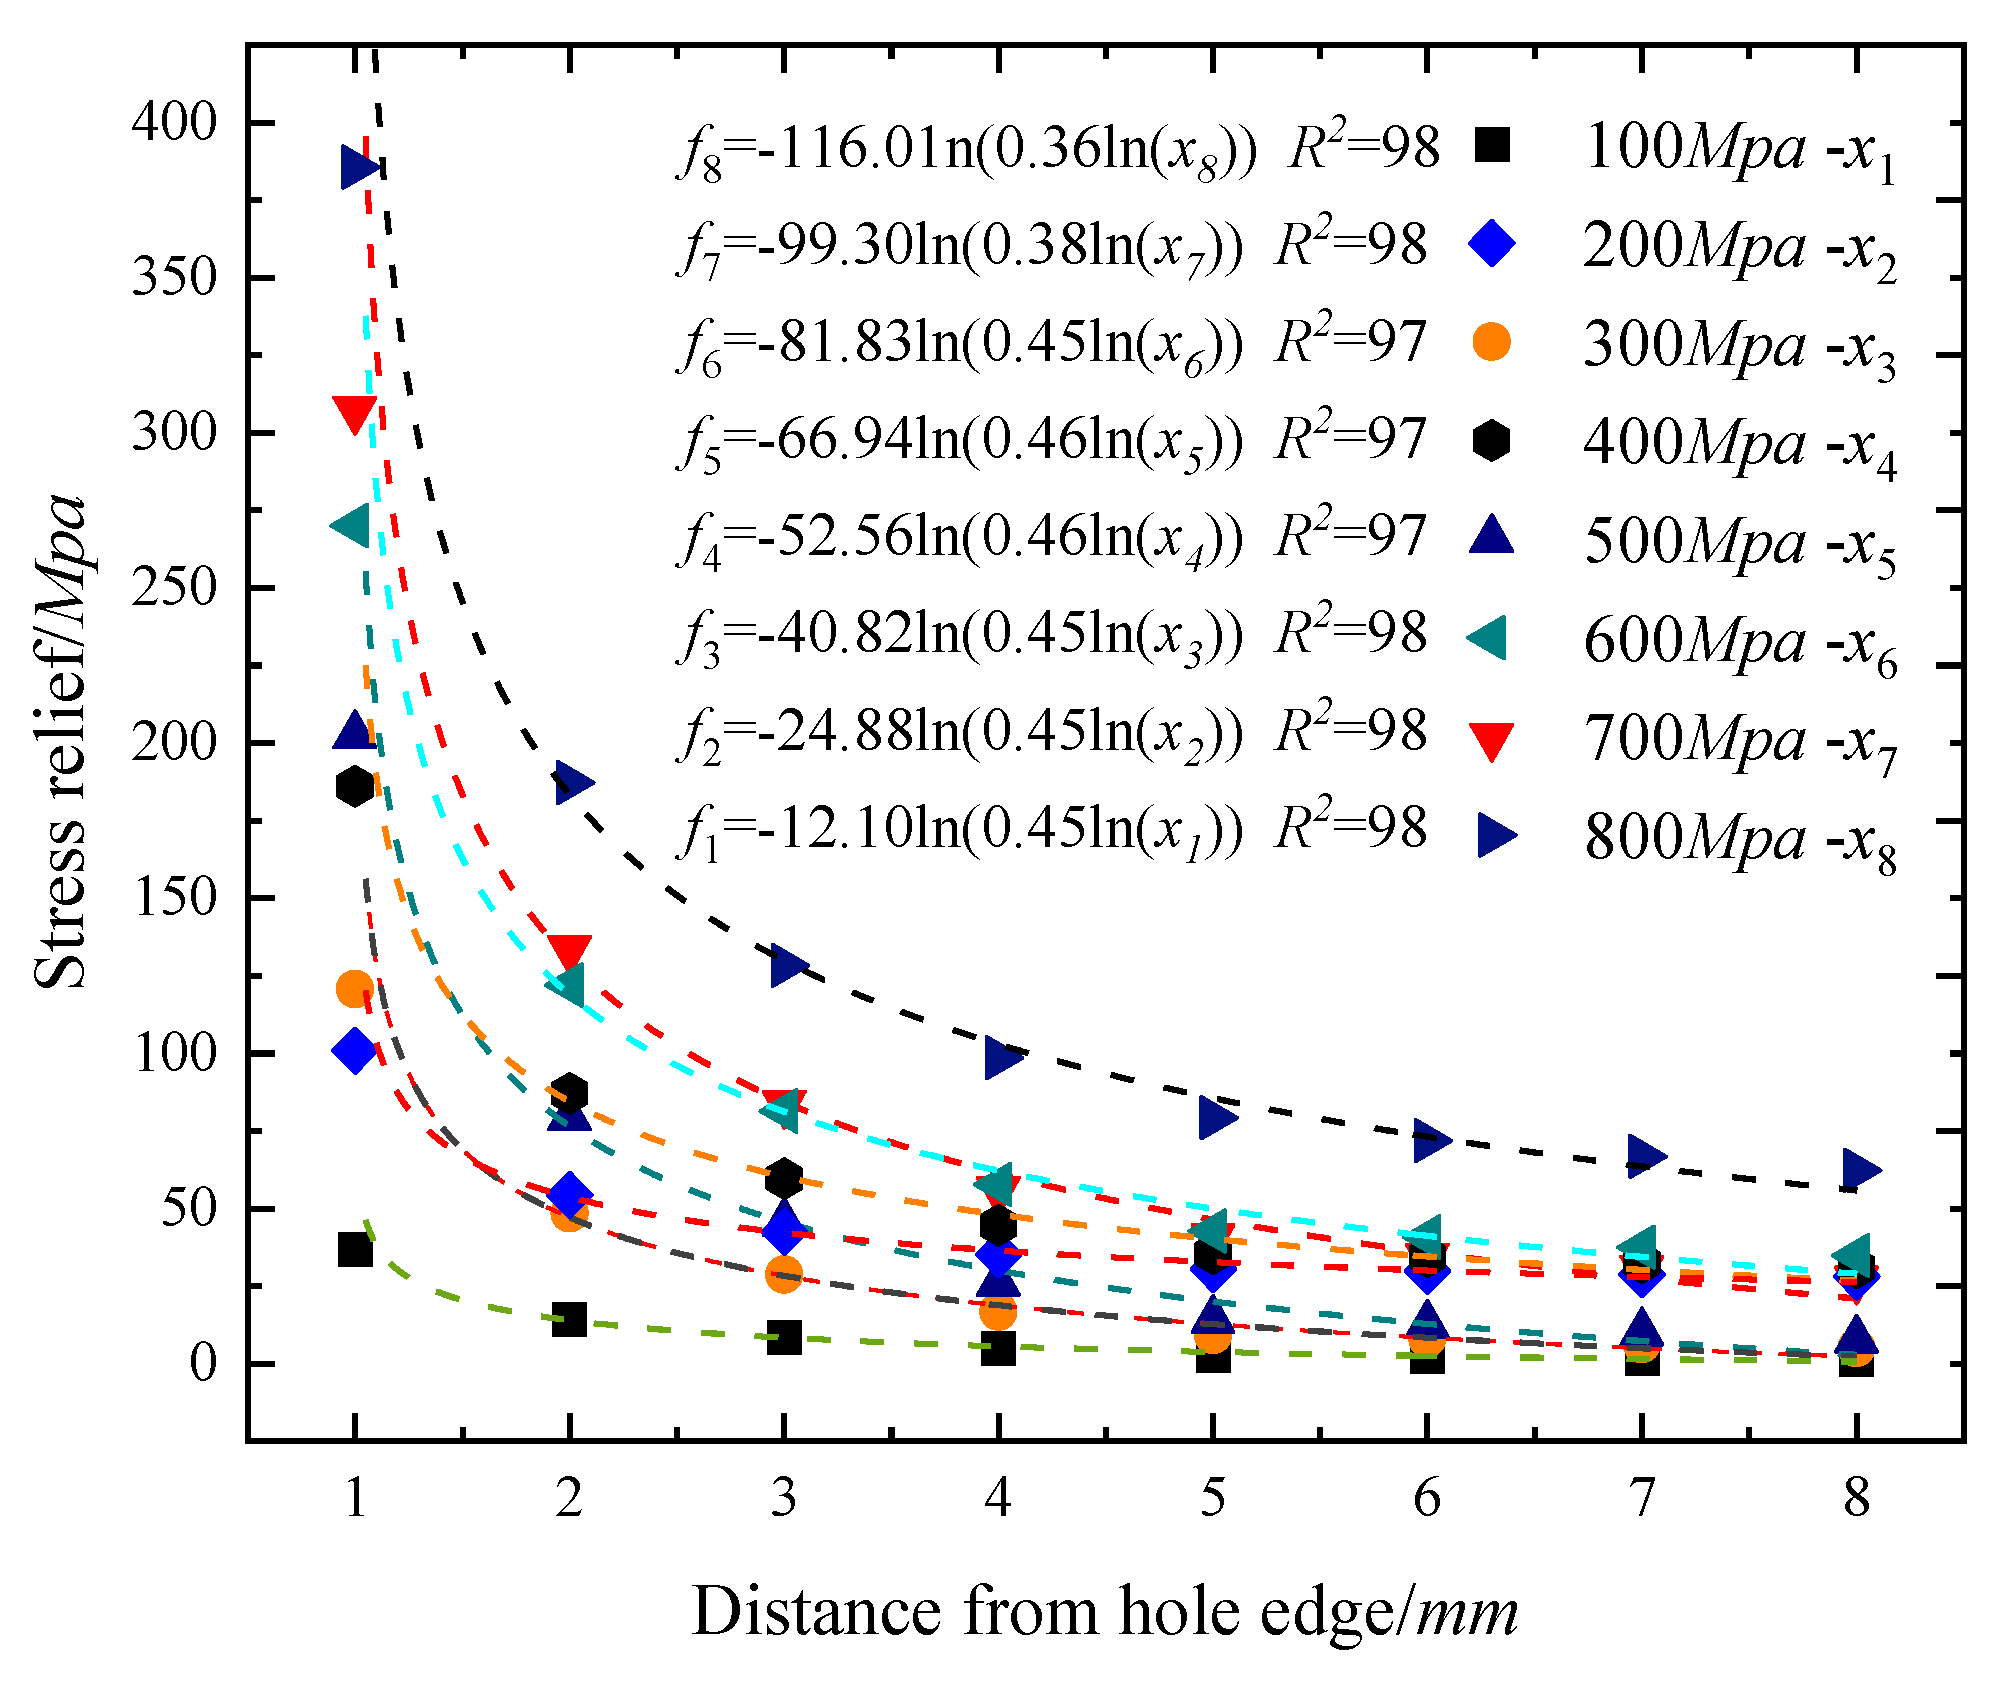
3.4. Effect of Different Tensioning Stresses and Hole Margins on Stress Release from Boreholes

Tension stresses of 100–800 Mpa were successively applied to the axial loading end of the steel strand, with steps of 100 Mpa. The drilling diameter was 1.5 mm, and the drilling depth was 2.5 mm; settings for the remaining force parameters were consistent with previously reported values. The average value of stresses on the surface unit of the drilled steel wire measured axially from the edge of the hole—with a hole–edge distance of 1–8 mm—was taken to be the post-drilling stress value of the unit. The stress cloud for the steel wire hole edge after drilling with 600 Mpa tension stress is shown in Figure 4. Figure 5 shows the varying values for tensile stress under the drilled steel wire axial surface unit stress release (the difference between the left and right nodes of the axial stress before and after drilling the steel wire surface) under the same tensile stress conditions, but with different hole spacings. A Bradley fitting curve obtained using Origin is also shown in Figure 5, and its correlation coefficient is greater than or equal to 0.97. Analysis of Figure 5 reveals the following: (1) when distances are the same, the value for tensile stress is positively correlated with the amount of stress release; (2) the tension stress value is positively correlated with the amount of stress release; (3) when distances are the same, the tension stress value and the amount of stress are both positively correlated with the stress value. Stress release is positively correlated with tensile stress; the larger the axially applied tensile stress, the more obvious the stress-release effect. With increases in the hole–edge distance, the stress-release effect decreases, and the trend of decrease gradually decreases; for different tensile stresses and different hole–edge distances, the basic trend remains the same. Analysis of Figure 6 reveals the following: (1) when the hole–edge distance is in a range of 1–5 mm, the stress-release rate under 100–800 Mpa tensile stress (the ratio of pre-drilling stress and post-drilling stress release at the same node, multiplied by 100%) is in a range of 46.1%–2.7%; (2) under different tensile stresses, the trend of the higher stress-release rate remains basically constant with decreases in hole–edge distance; (3) the higher the tensile stress, the higher the tension stress, and the higher the stress-release rate, so that for tensile stresses of 800 Mpa, 700 Mpa, and 600 Mpa, with a hole–edge distance of 1 mm, the stress-release values were 46.1%, 45.2%, and 43.1%, respectively. Combined with the test feasibility analysis, we may say that when the longitudinal distance (hole margin) is too large, the stress release is small, but when the hole margin is small, strain measurement is more difficult, because the strain gauge has a certain length and it is easy to damage the gauge during drilling, due to drill bit extrusion causing plastic deformation as a result of the additional strain to the hole in the wall. This affects the accuracy of the stress measurement, so that a longitudinal distance of 3–6 mm feasibility may be considered more feasible overall.

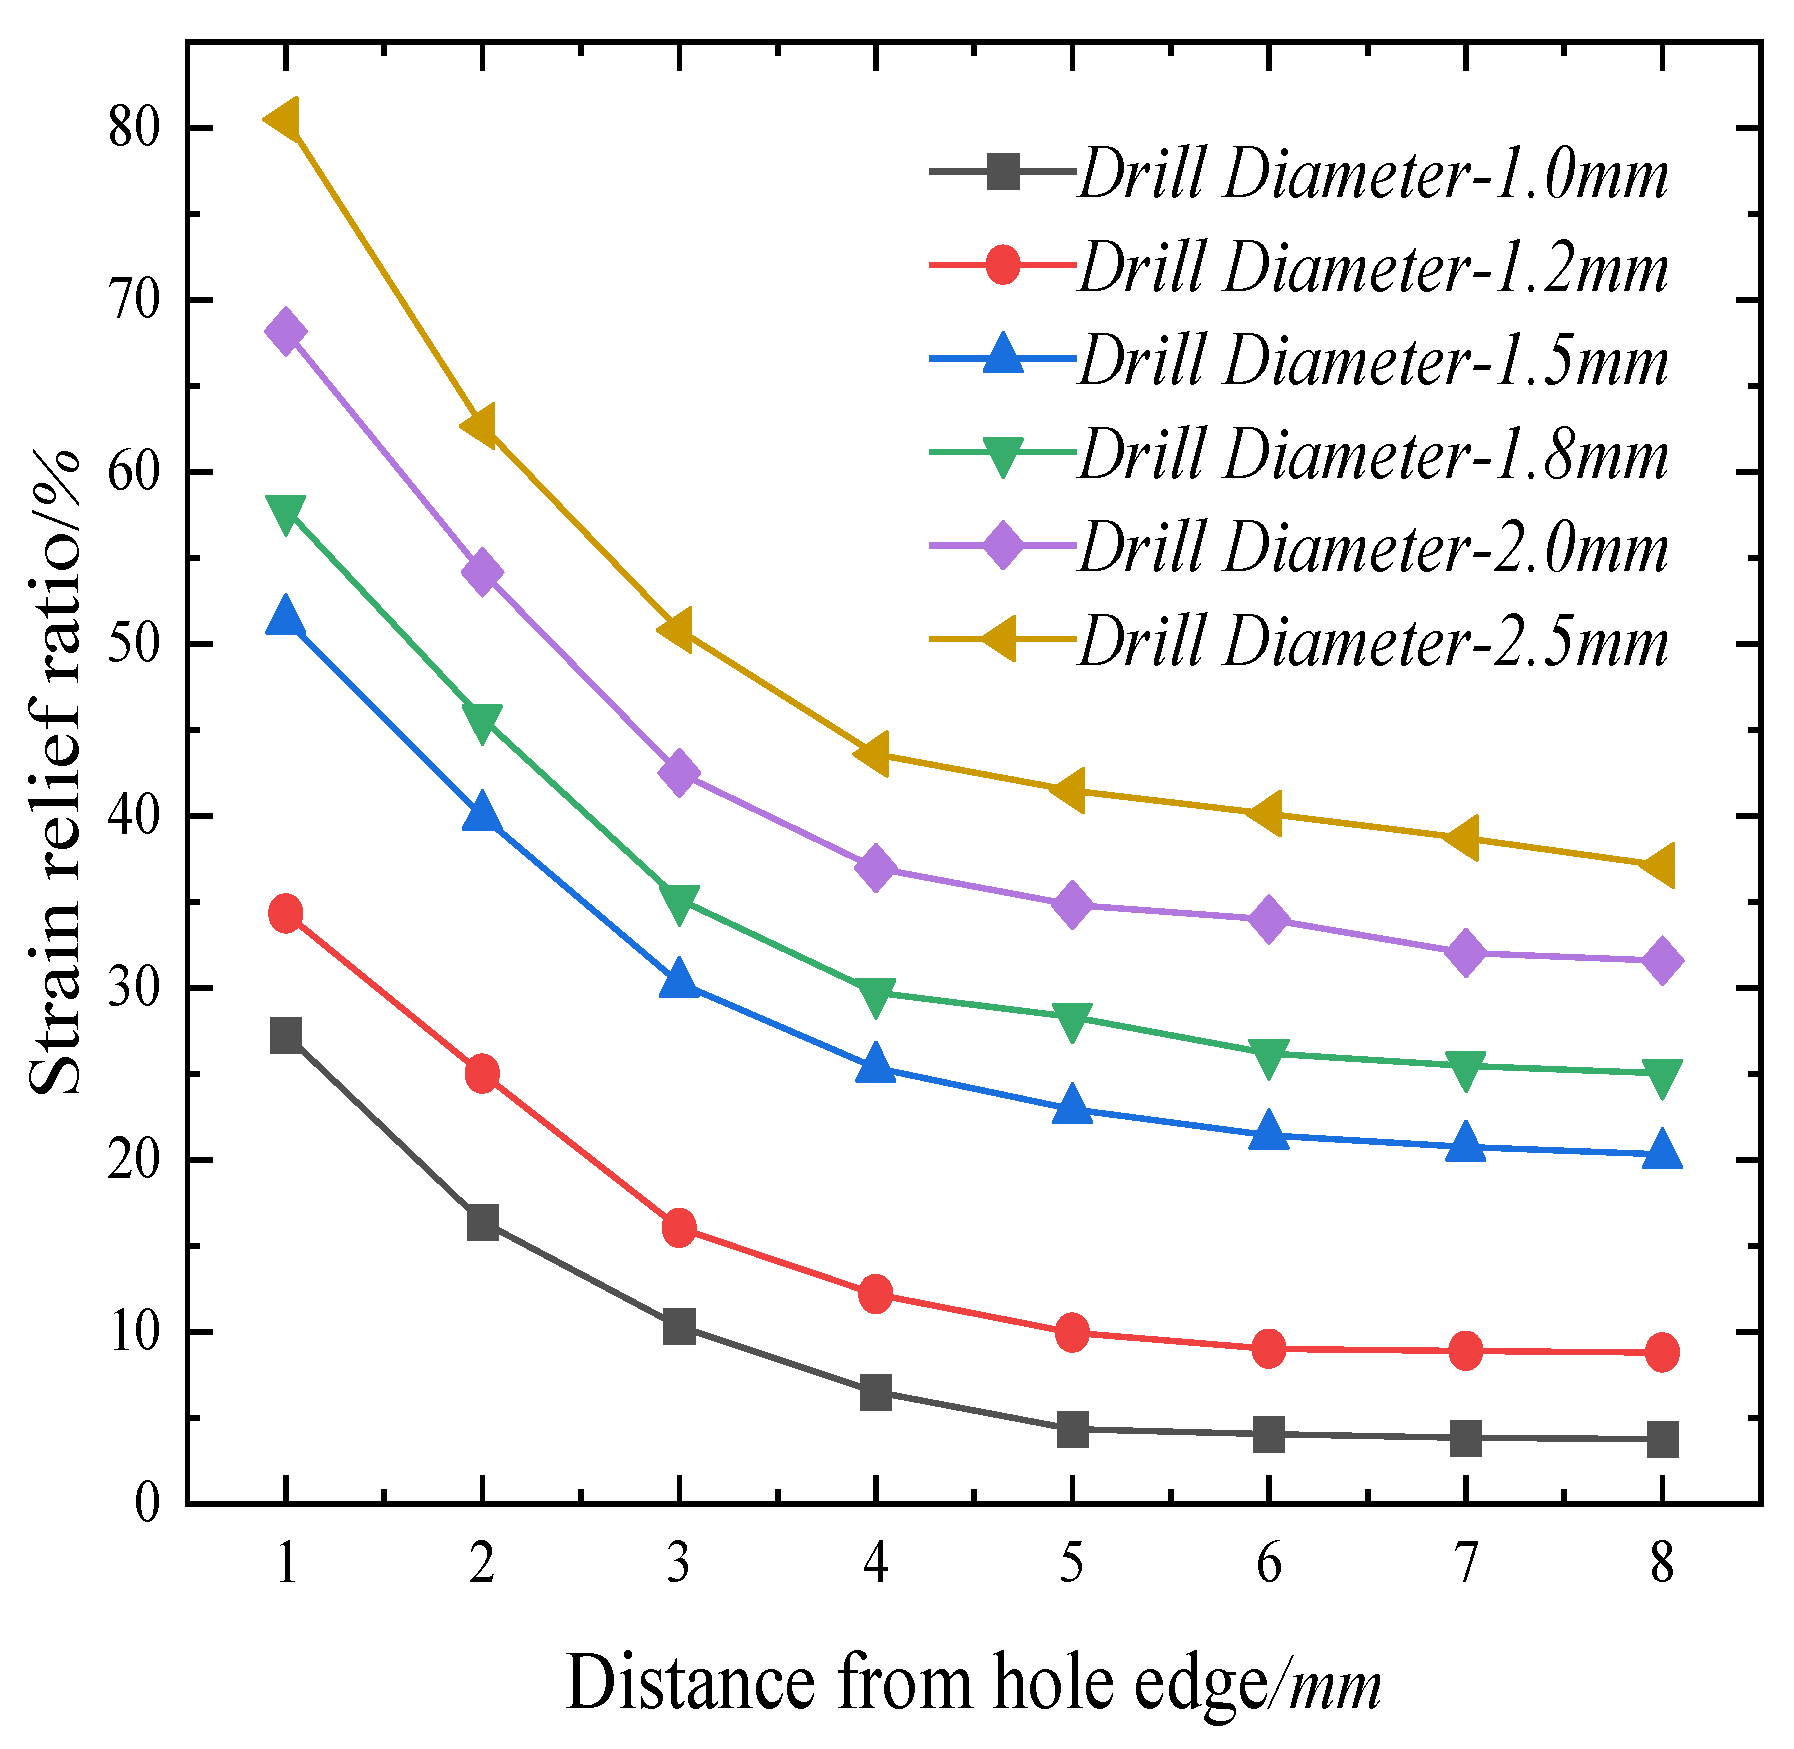
3.5. Effect of Drilled Hole Diameter on Stress Relief

The drilled hole diameters were taken to be 1.0 mm, 1.2 mm, 1.5 mm, 1.8 mm, 2.0 mm, and 2.5 mm. Tensile stress was 700 Mpa and drilling depth was 2.5 mm in all cases; settings for the remaining static–dynamic parameters also remained unchanged. The strain-release values for the axial surface units of the drilled steel wires under different hole margins were fitted using an Origin Allometric1 fitting curve (Figure 7). It can be seen from Figure 7 that the fitting correlation coefficient is greater than or equal to 0.96. It can also be seen that, with increases in the diameter of the borehole, the strain release (before and after drilling, the steel wire surface of the axial strain at the left and right nodes of the drilled holes) gradually increases; with increases in longitudinal ranging, the amount of strain release gradually declines. When the hole–edge distance is in a range of 1–5 mm, the strain release decreases with increases in the hole–edge distance, and the trend of decreasing is more obvious, Figure 8 shows a stress cloud diagram for a unit near a drill hole with a diameter of 2.5 mm, a depth of 2.5 mm, and a tension stress of 700 Mpa. In Figure 9, the following can be seen: when the hole–edge distance is greater than 5 mm, and the drilling diameter is 1.0 mm, the strain-release rate (the ratio of pre-drilling stress and post-drilling stress release at the same node, multiplied by 100%) attains a maximum of 4.1%; when the drilling diameter is 1.2 mm, the strain-release rate attains a maximum of 9.0%; when drilling diameter is 1.5 mm, the strain-release rate attains a maximum of 21.4%; when the drilling diameter is 1.8 mm, the maximum strain-release rate is 26.2%; when the drill diameter is 2.0 mm, the maximum strain-release rate is 34.0%; when the drill diameter is 2.5 mm, the maximum strain-release rate us 40.1%. Combined with the test feasibility analysis, we may say that when the drill diameter is too small, it is easier to break, but when the diameter is too large, strand damage may result [30] (Figure 8). We may say, then, that a comprehensive consideration of measurement accuracy and feasibility yields an optimal drill diameter of 1.5 mm or 1.8 mm.

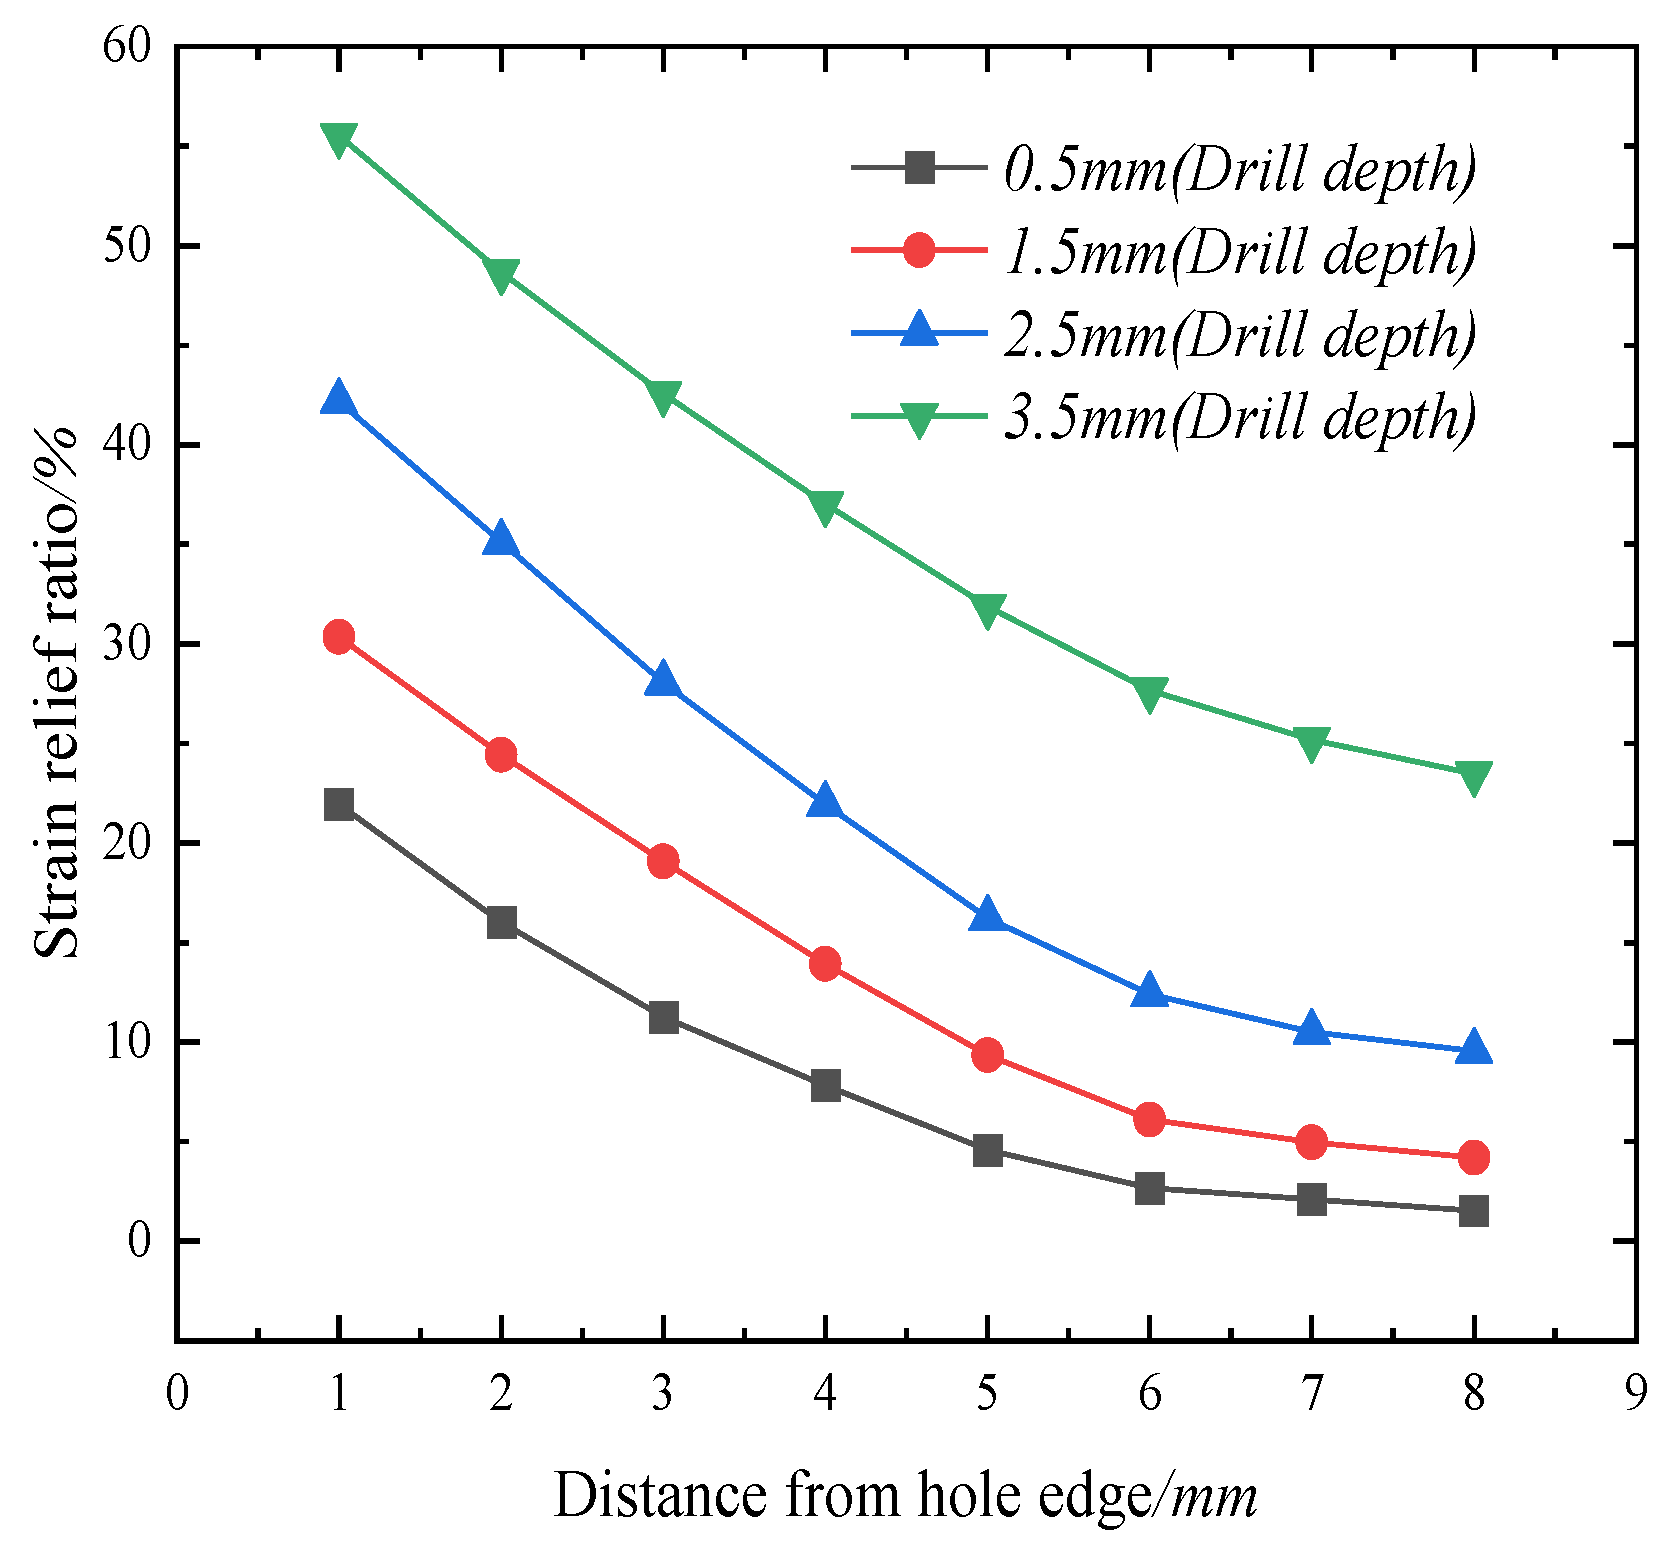
3.6. Effect of Different Drilling Depths on Stress Release

The depth of the drilled hole was then set to 0.5 mm, 1.5 mm, 2.5 mm, and 3.5 mm, successively. Tension stress was 550 Mpa, the drilled hole diameter was 1.5 mm, and settings for the remaining static–dynamic parameters remained unchanged. The Bradley curve fitting method in Origin is shown in Figure 10. It can be seen that the correlation coefficients of the fitted curves are all greater than or equal to 0.95. Analysis of Figure 10 reveals the following: (1) the value of the depth of the borehole is positively correlated with the strain release; (2) the greater the depth of the borehole, the more obvious the effect of the strain release; (3) with increases in distance between the edges of the holes, the effect of the strain release decreases, and the trend of the reduction gradually declines; (4) the amount of stress release in different borehole depths is positively correlated with the size of the hole. Strain release at different drilling depths exhibits a similar trend with respect to changes in hole–edge distance, so that when the hole–edge distance is in a range of 1–8 mm, the strain release is positively related to the drilling depth. Analysis of Figure 11 reveals the following: (1) when the hole–edge distance is in a range of 1–6 mm, the stress-release rate (the ratio of pre-drilling stress and post-drilling stress release at the same node, multiplied by 100%) at a 0.5–3.5 mm drilling depth is in a range of 2.6%–48.6%; (2) under different drilling depths, the trend of the strain-release rate is basically the same as when the hole–edge distance declines, so that the greater the drilling depth, the higher the strain-release rate. At drilling depths of 3.5 mm, 2.5 mm, and 1.5 mm, with a hole–edge distance of 1 mm, the strain release is 24.4%, 35.1%, and 48.6%, respectively. We may say, then, that at drilling depths of 0.5–3.5 mm, with a constant hole–edge distance, strain release is positively correlated with drilling depth. When the drilling depth reaches a level of 2.5–3.5 mm, the amount of stress release increases significantly, indicating that, at such a level, the plastic strain of the steel wire grows significantly, so that a drilling depth of 2.5–3.5 mm may be considered most appropriate.
The bearing capacity of the strand will be greatly reduced after any breakage of the wire [31]. In order to avoid stress concentration or any other factors that might cause fracturing of the drilled steel wire, a 1000 Mpa axial stress load was applied, using a 1.5 mm drill bit, to a depth of 2.5 mm, so that the stress map was located near the drilled hole cross-section, as shown in Figure 12. It can be seen from Figure 12 that the maximum stress at the edge of the drilled hole is 1691 Mpa, and the effect of stress concentration is mainly at the drilled hole cross-section; this effect decreases in the direction of the depth of the drill bit, but is less obvious on the strain measurement surface, and may be neglected under the test ranging. These results show that a drilling depth of 2.5 mm is most effective; this results in the least damage to the bearing capacity of the strand.

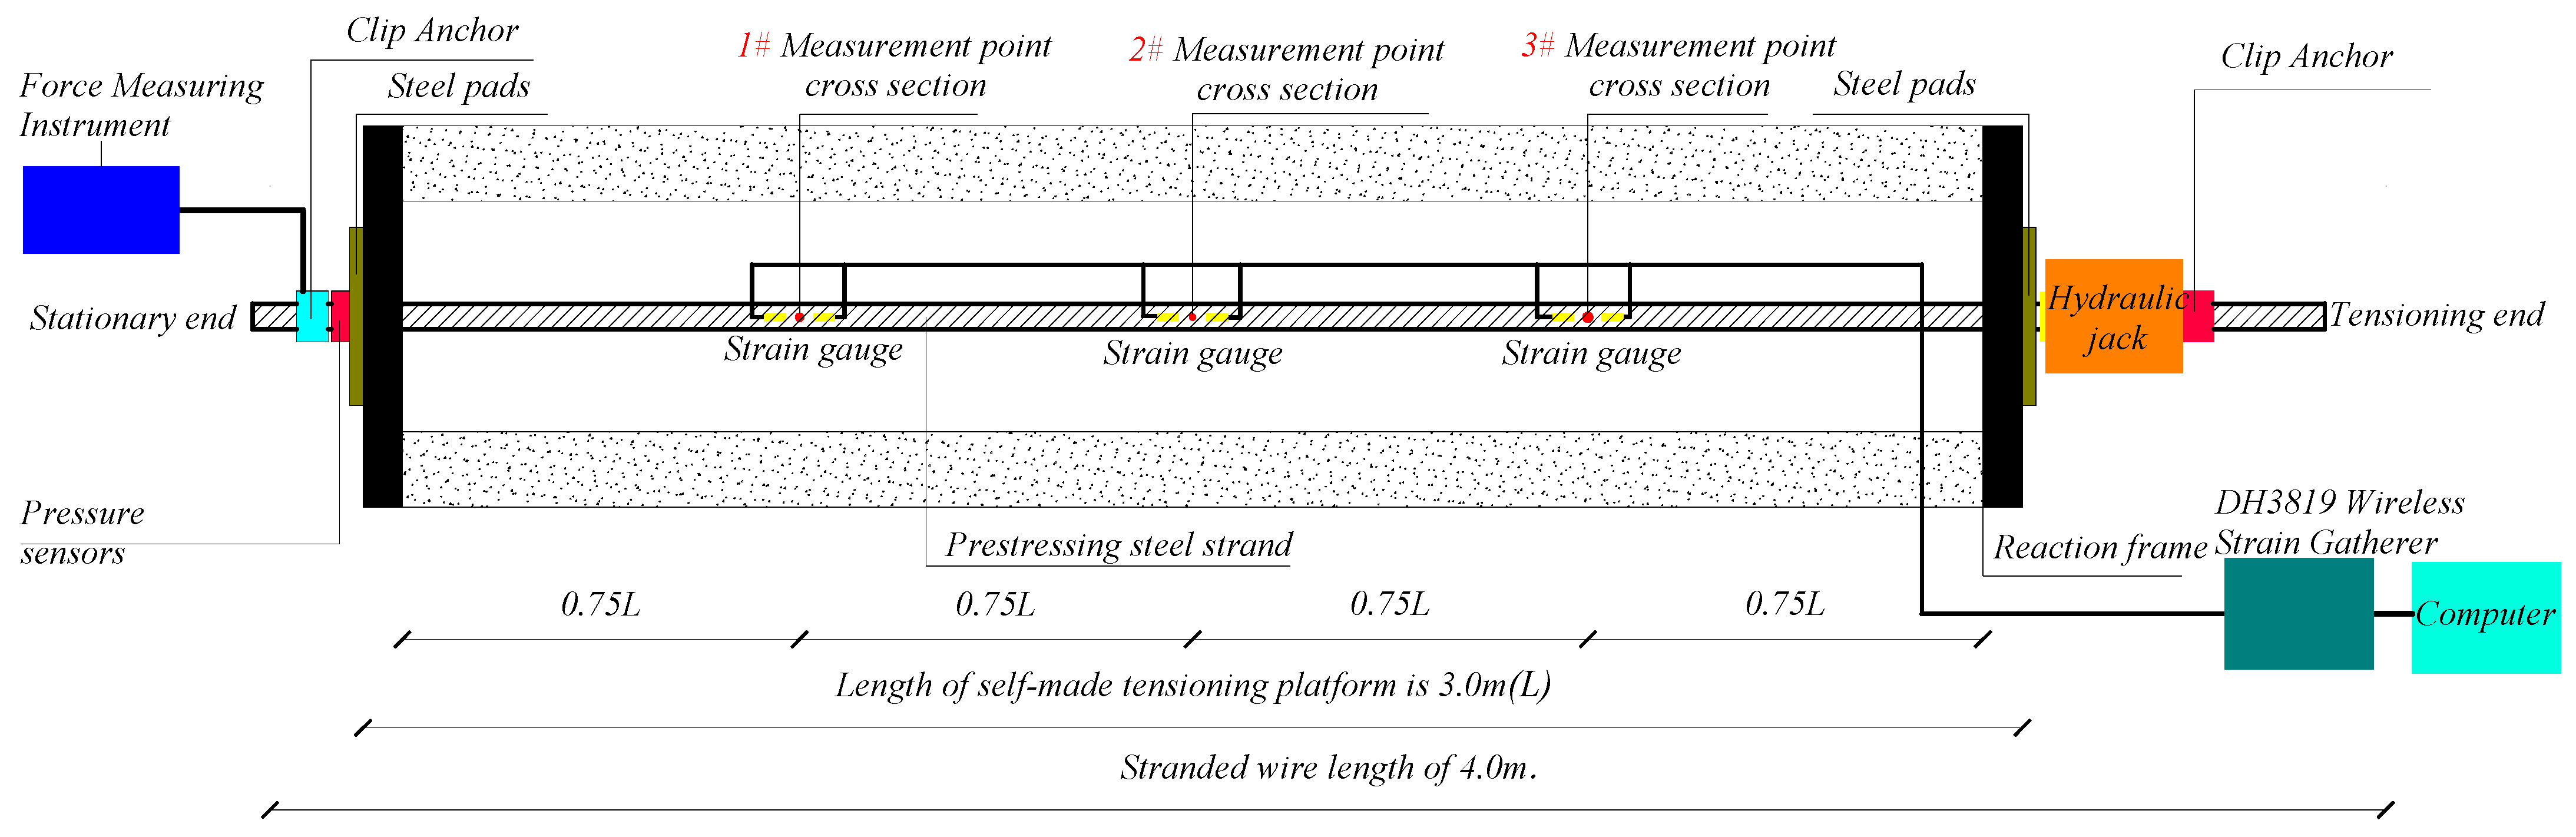
4. Drill Hole Stress Relief Test

4.1. Overview of the Test

To fulfill the requirements of the test, a set of steel strand tensioning platforms was constructed indoors, as shown in Figure 13. The tensioning platform was 3 m long and was mainly composed of a manually separated hollow hydraulic jack, a clip anchorage, a reaction frame, a pad plate, a pressure sensor, and other parts. The instruments and equipment used in this test included a manually separated hollow hydraulic jack, a DH3819 wireless static strain collector produced by China Jiangsu Donghua Testing Technology Co. (Taizhou, China), customized resistance strain gauges, a JMZX-3102AT pressure transducer produced by China Changsha Golden Code Inspection Co. (Changsha, China), and tools such as an electric drill. Due to the stranded steel wire cross-section being small in size with a curved surface, there was a risk that the strain gauge might be damaged in the drilling process, so that release-strain data would not be collected. For this reason, after a variety of comparative analyses of strain gauges and negotiation with the strain gauge manufacturer, we chose to use unidirectional two-piece customized resistance strain gauges (model BFH120-1GB-7.0-D150) with a base length of 14 mm and a base span of 1.5 mm. In line with the manufacturer’s guidelines, we used customized resistance strain gauges to collect the strain gauges. Using factory calibration, we set the sensitivity coefficient of the strain gauge to 2.0, and the resistance value to 120 Ω. A photographic image of the strain gauge is shown in Figure 14. All strands used in this test were from the same manufacturer, and were taken from a single batch, using the same strand for prestressed concrete, with all strands cut to the required length by using a cutting machine for the test. The measured basic parameters of the steel strand are shown in Table 3.

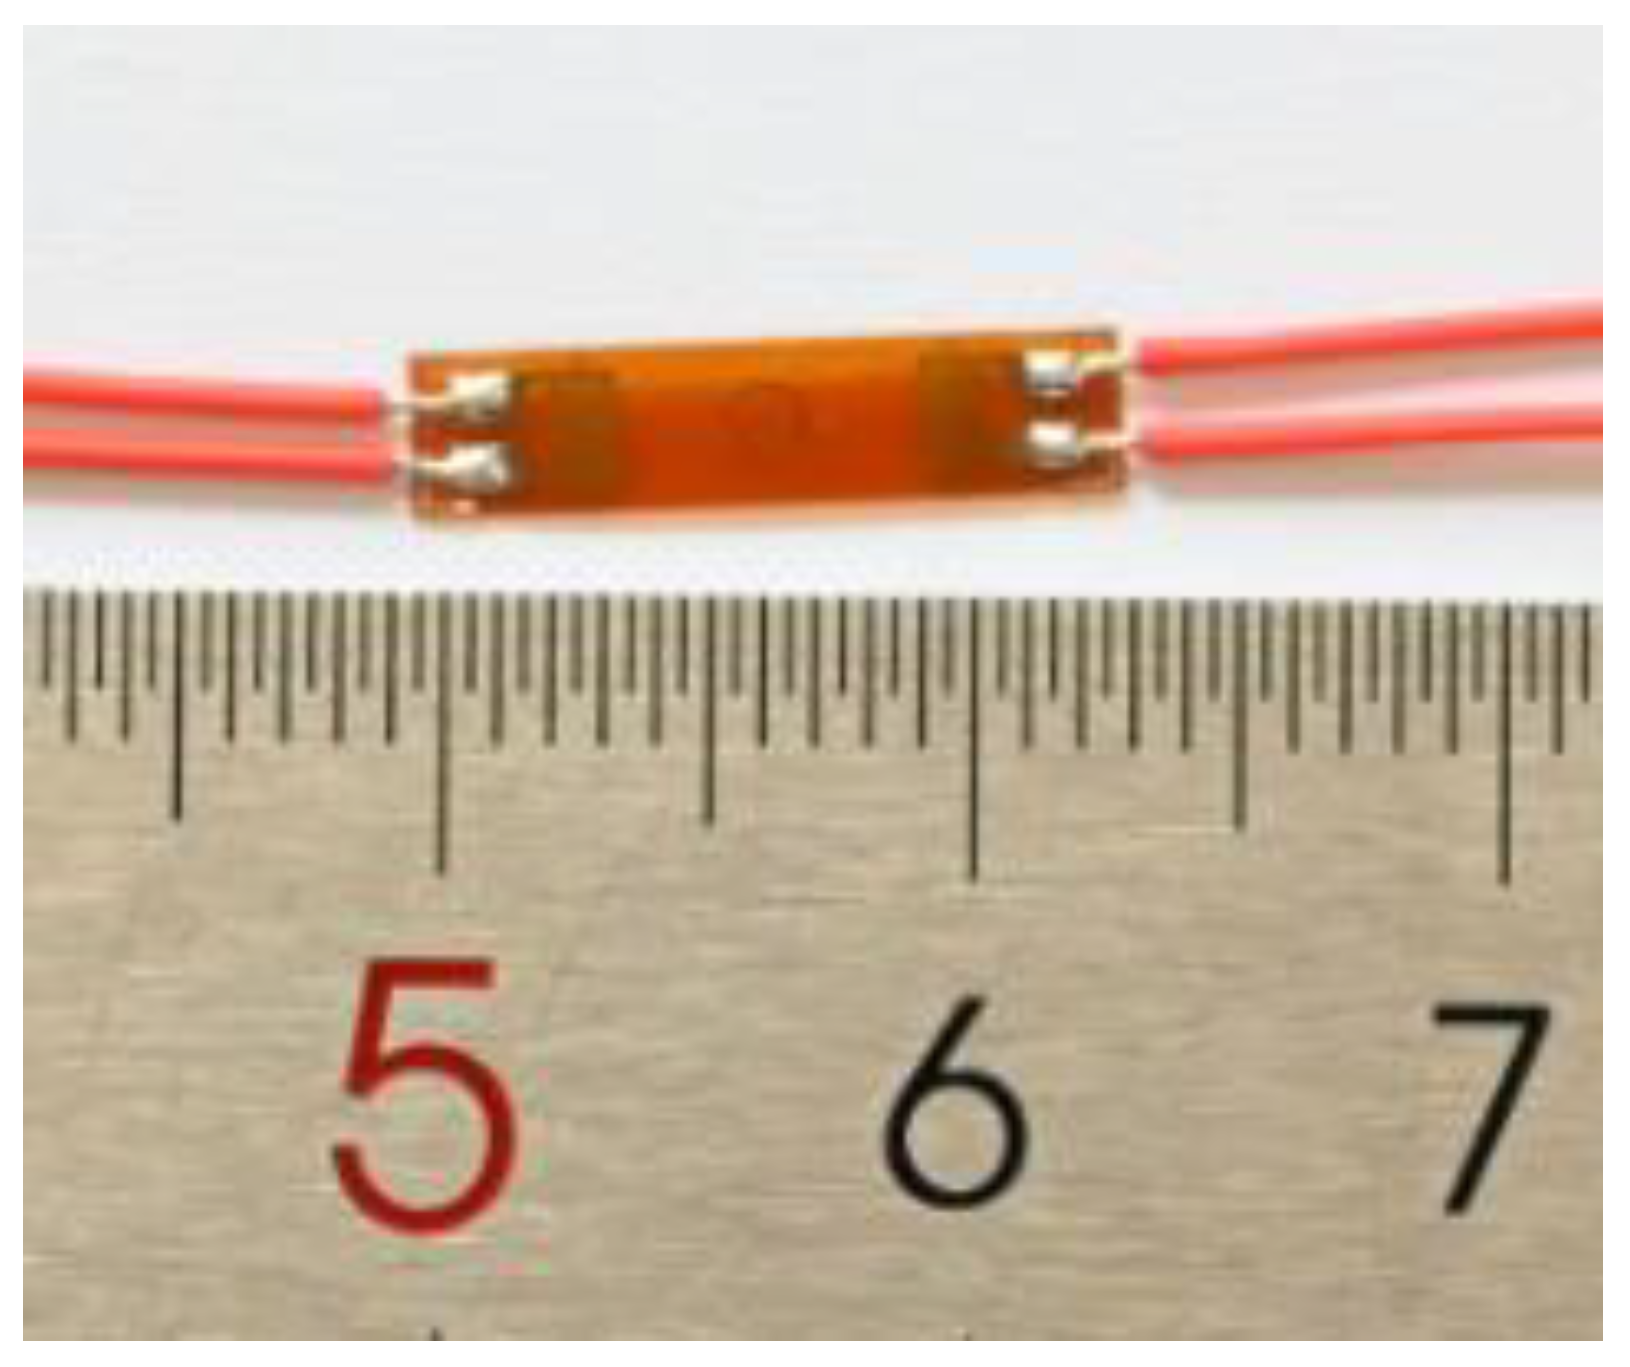
4.2. Bare Stranded Wire Outer Wire Drilling Test

According to the finite element analysis results, with a borehole diameter of 1.5 mm, and a borehole depth of 2.5 mm, the distance of the strain gauge sensitive grid center from the edge of the hole was 4.0 mm. Using the constructed tensioning platform with a length of 3.0 m, and a strand length of 4.0 m, stranded steel was positioned in the platform with three equal cross-sections for the three measurement points, set up axially for two strain gauges. The strand was drilled under the test procedure of “pulling before sticking”. A total of 22 strands of grade 1860 were tensioned in a graded manner, and three measurement points were set in the spiral steel wire on the outer side of each strand. Then, a single customized strain gauge was pasted at each measurement point, and a total of 132 pieces of strain data were measured. The bare steel strand was then subjected to test conditions 2~11, i.e., tension stress loads of 100–1000 Mpa were successively applied, with steps of 100 Mpa. As the strand will produce residual stress in the production process, no tensile stress was added for test condition 1. When using strain gauges to measure structural surface strain, a curved shape results in a certain amount of stress measurement error. An axial line running along the steel wire between the strain gauges can be regarded as the radius of curvature of +∞ (planar) [32]. In addition, because strain gauges are manually pasted at the measurement site, the accuracy of the paste orientation is not guaranteed, directly affecting measurement accuracy. Therefore, prior to pasting, vernier calipers were used to accurately measure the axial and radial orientation, so that any inaccuracy driving from poor paste orientation might be avoided (Figure 15). Finally, because of the mechanical disturbance caused by the use of a hand-held electric drill, and the difficulties arising from drilling a curved surface, we used the same customized strain gauge for two different channels to obtain an average value that was considered to be the point of measurement for the strain-release value. The test results are detailed in Table 4.

4.3. Analyze Test Collection Data

As can be seen in Table 4, the percentage of valid measurement data was 88%. This was because of the mechanical disturbances caused by the use of a hand-held electric drill, and the difficulties arising from drilling a curved surface, as mentioned above. Table 4 also shows that the strand was drilled on the outer steel wire under a test procedure which involved first tensioning the strand and then attaching strain gauges. Strain values at the edge of the hole were then measured using customized strain gauges. The relationship between the test tensile-force value and the measured hole–edge strain value is plotted in Figure 16, and the linear fitting of the tensile stress and the measured strain obtained using Origin is shown in Figure 17. The linear fitting of the tension stress to the measured mean strain was also obtained using Origin, and is shown in Figure 18. From an analysis of Figure 16, Figure 17 and Figure 18, the following may be concluded: (1) the strand tension force, tension stress and measured strain are linearly and positively correlated, thus verifying the reasonableness of the theory of drilled hole releasing stress proposed in this paper; (2) from the values for strand tension, strand average tensile stress, and the measured strain obtained using Formula (9), the correlation coefficients R2 = 0.965 and R2 = 0.967 may be calculated; (3) with increases in the applied force, the strain measured value of the data collected gradually disperses; (4) as shown in Figure 18, using measured values and the Midas FEA NX 2022 (v1.1) software simulation, the two sets of data-fitting results show that tension stress loads and strain values are positively proportional to the results of the limiting element analysis. Results that are comparable with the measured data include the depth of the borehole and the measured strain release under low-stress conditions.
In conclusion, in this study, we utilized a paper test and a finite element numerical simulation to establish a positive correlation between strand tension stress and measured strain. This correlation validates the theory of drilling release stress proposed in this paper. By substituting the coefficients of 1.12 and 57.84 from Formula (9) into Formula (7), the resulting Formula (10) may be used to determine coefficient values A and B of 1.12 and 57.84, respectively.
ε = 1.12 σ + 57.84
F N = A S 1.12 · ε 51.64 · A S  

5. Conclusions

In this paper, we present a method for effectively identifying prestress in prestressed concrete girders, slings, in vitro prestressing, and other structures used in the field of bridge engineering during the in-service stage. The method is based on the existing micro-hole release theory and offers an effective approach to identifying prestress in strands. The key conclusions of the present study were obtained with theoretical derivation, finite element simulation, and analysis of indoor test results; these conclusions may be stated as follows:
(1)
The relationship between measured strain and axial tension can be determined using Kirsch’s analytical formula and microvia release theory. It was observed that there was a linear and positive correlation between the two variables, provided that certain conditions are met, such as strain gauge specification, drilling hole size, the specific depth of the hole, and a disregard for measurement errors. A relationship equation, incorporating coefficients A and B, may be established to represent the connection between strand tension and strain, within a given hole–edge distance.
(2)
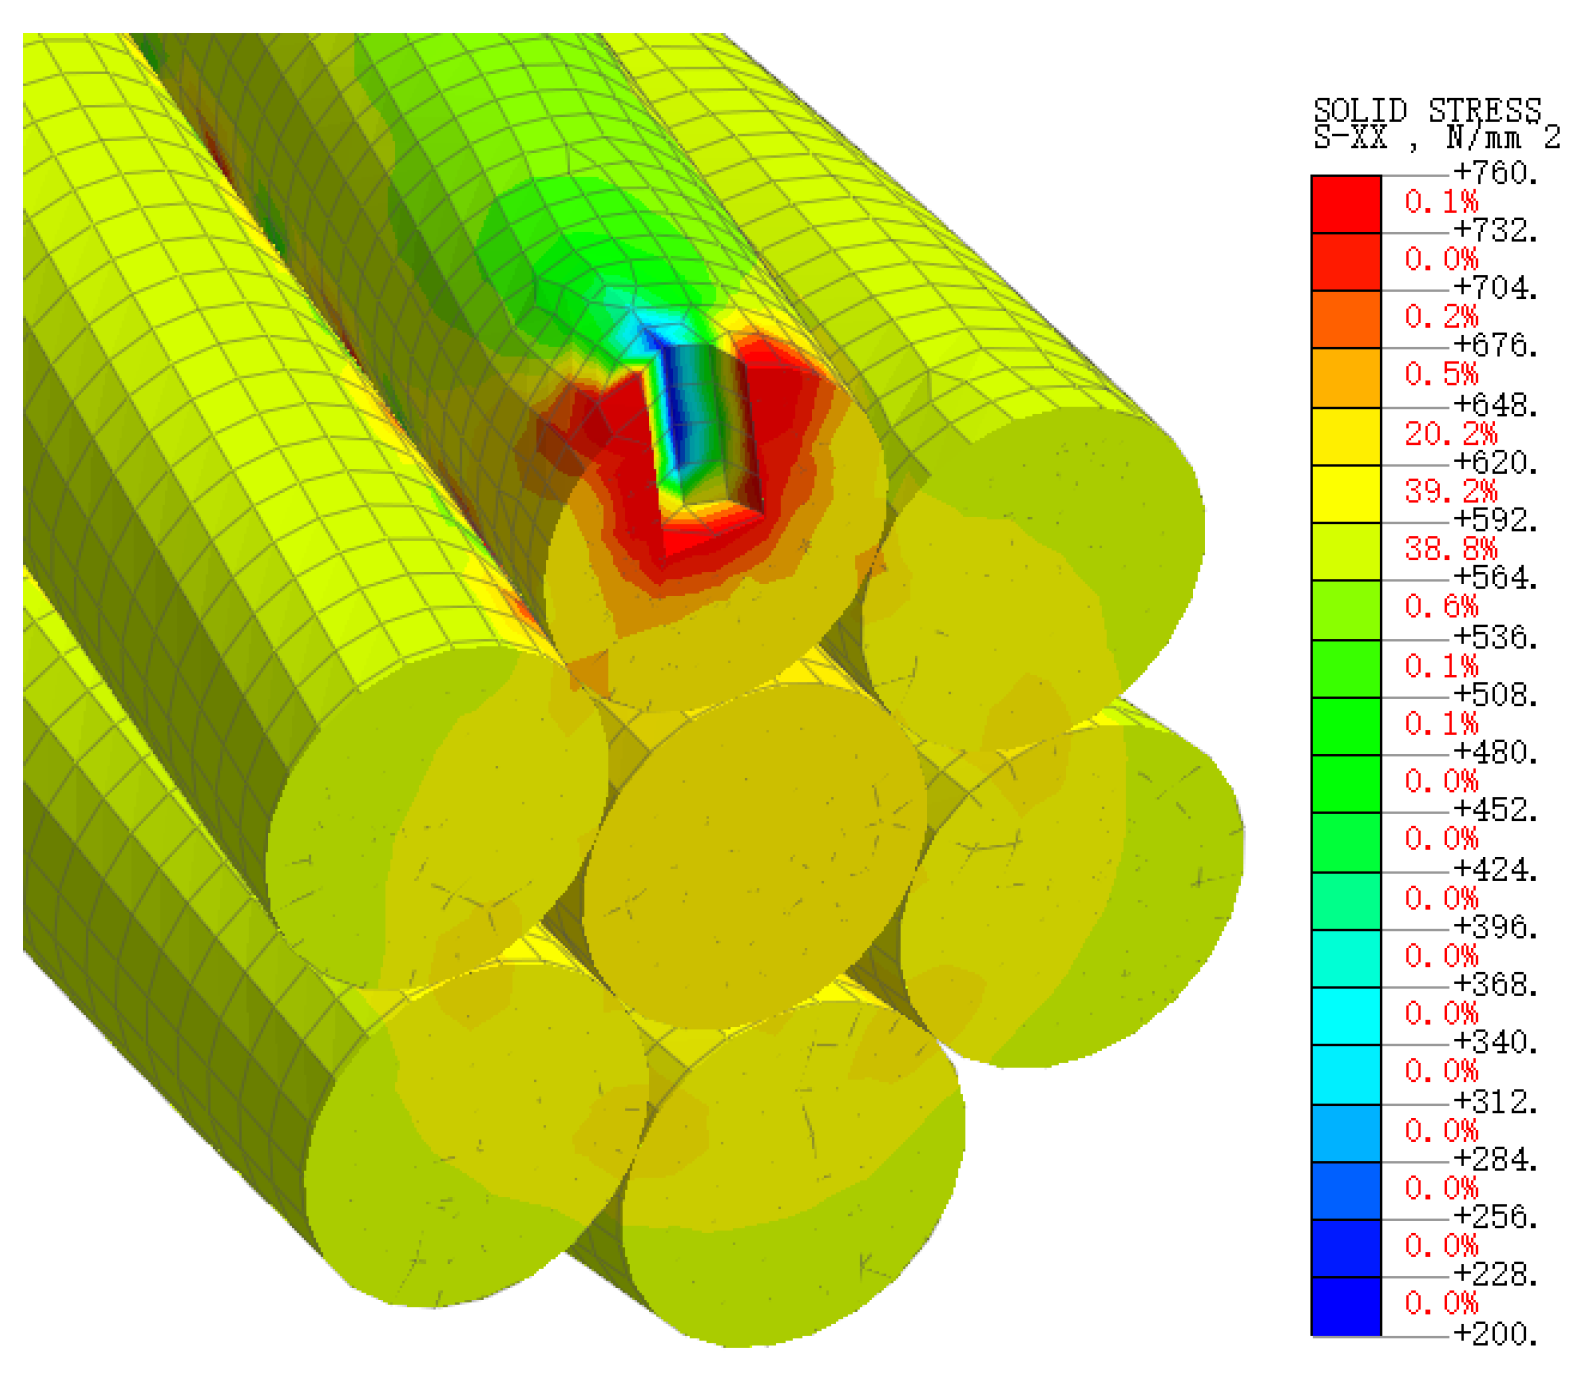
When comparing the results of a simulated strand force condition produced using Midas FEA NX 2022 (v1.1) finite element analysis software with the theoretical calculation results reported by Feyrer, it was found that the maximum error for the central wire was 2.20%, while the maximum error for the side was 0.84%. These results demonstrate that the finite element model is capable of accurately simulating force distribution within the strand cross-section. Furthermore, it may be inferred that the model is capable of simulating the stress-release behavior of the strand-drilled hole.
(3)
The study involved the simulation of a strand drilling model under various conditions, including different hole spacings, tensile forces, drilling diameters, and drilling depths. The findings indicated a positive correlation between the value of tensile stress and the amount of stress released. Additionally, increasing the hole spacing reduced the effectiveness of stress release, with a trend similar to that observed for different tensile stresses. Moreover, as the diameter of the drilling hole increased, there was a gradual increase in the amount of strain released. Finally, it was observed that greater hole depths resulted in a more pronounced effect on strain release. The strain-release effect became increasingly evident as the drilling depth increased.
(4)
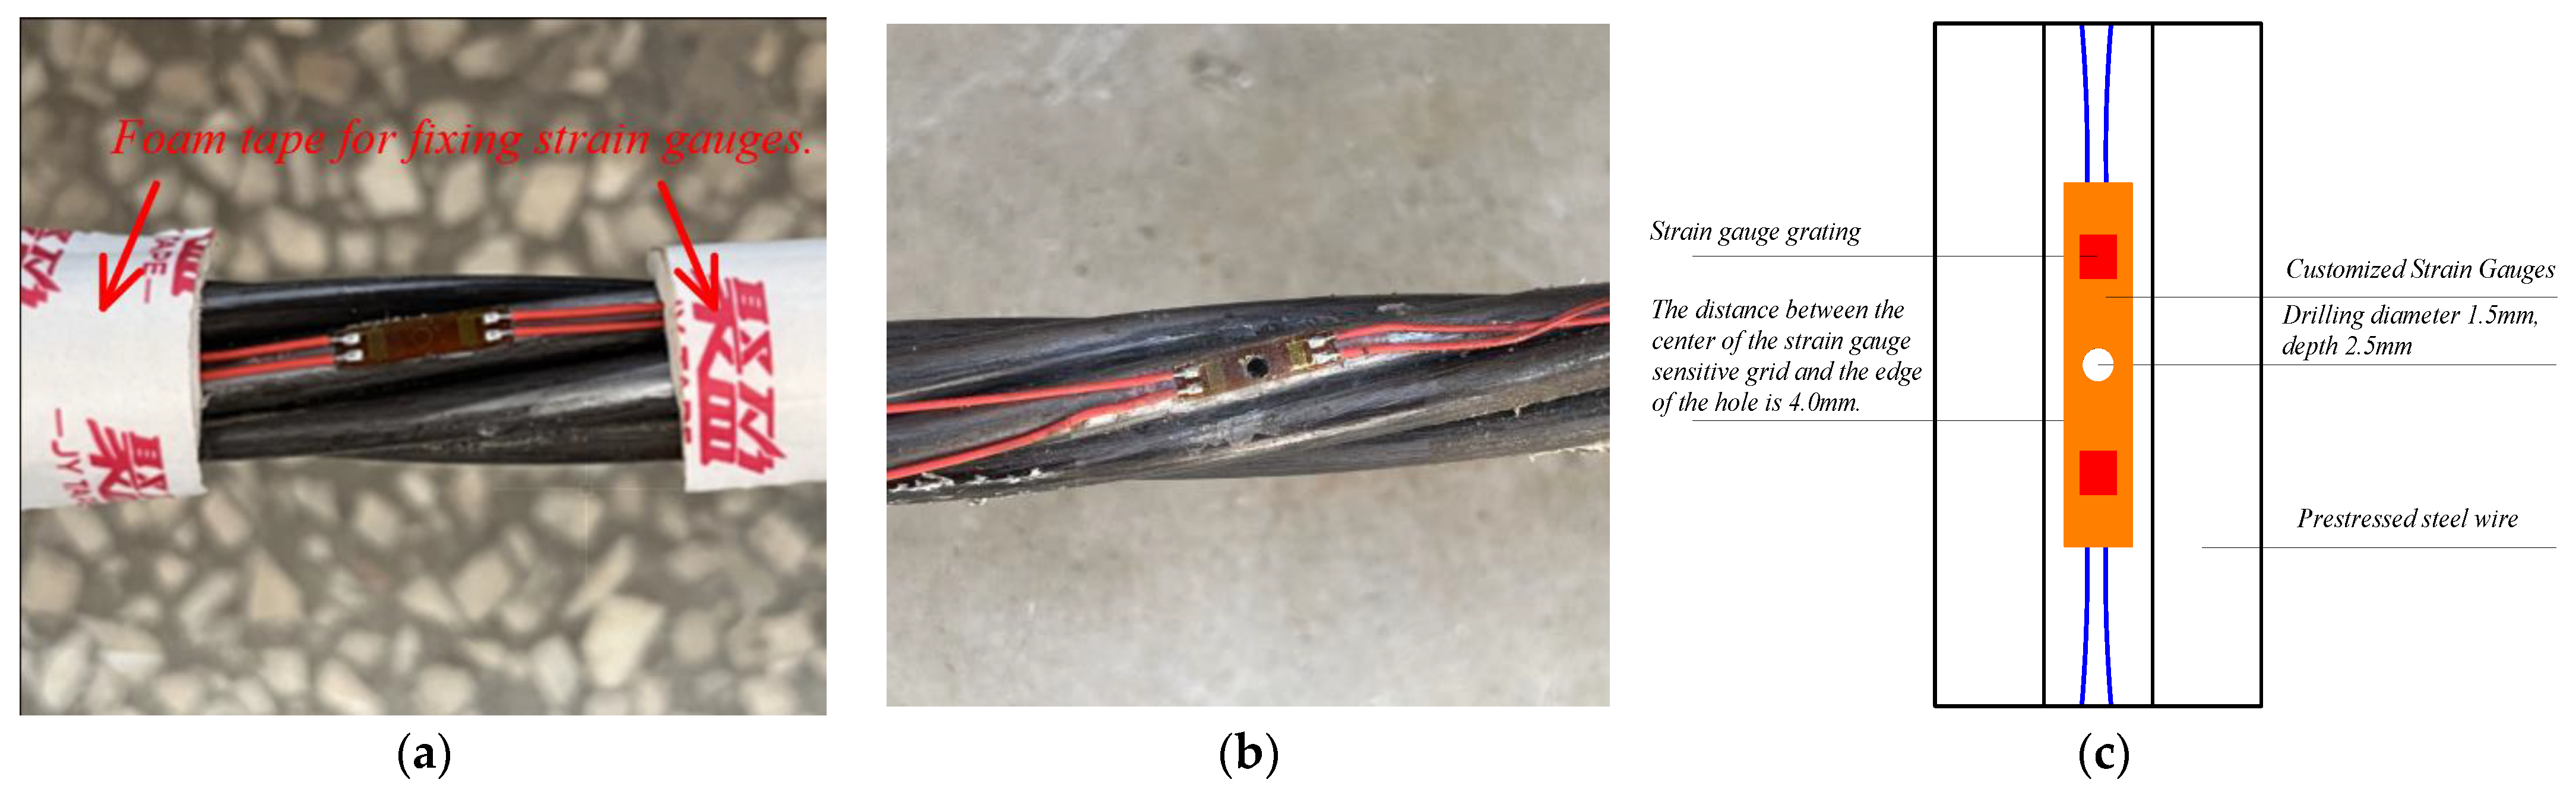
By conducting numerous simulations and feasibility analyses on a strand drilling model, it was determined that a drilling test program incorporating hole–edge distances ranging from 3 to 6 mm with diameters of 1.5 mm and 1.8 mm and a drilling depth of 2.5 mm could most effectively ensure measurement accuracy while minimizing adverse effects on the strand’s bearing capacity.
(5)
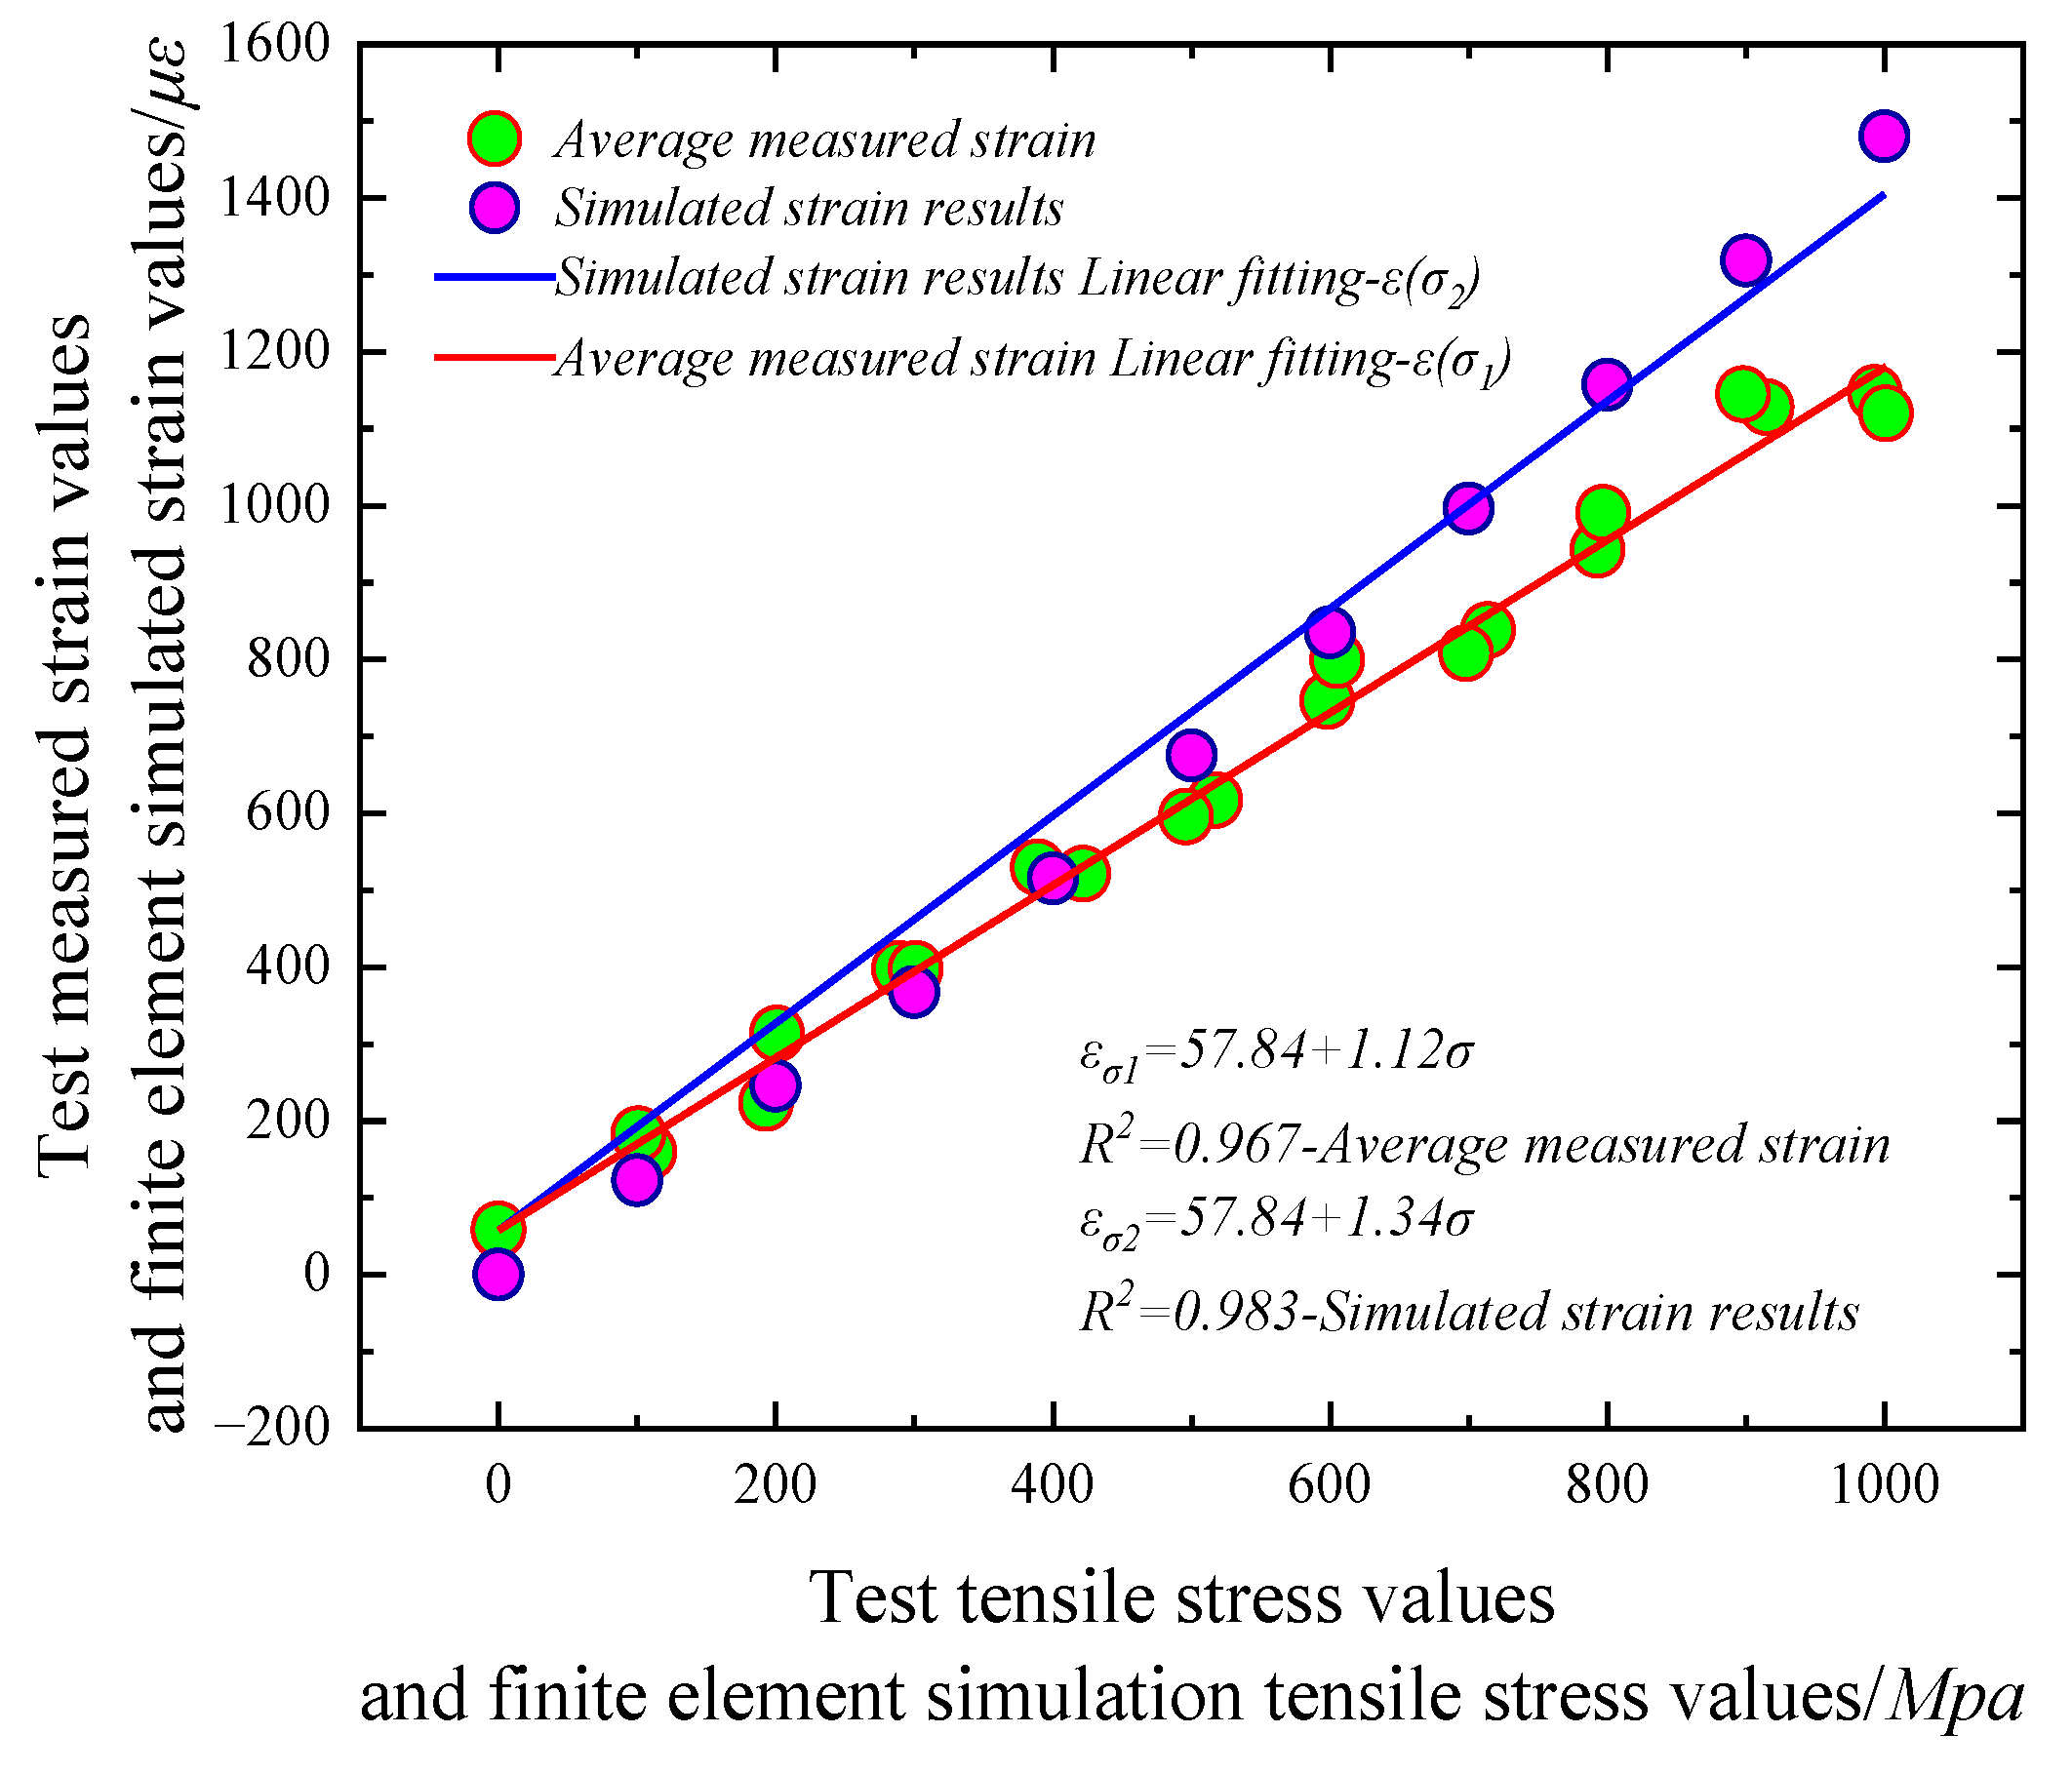
By conducting a comprehensive analysis of measured data for a drilling diameter of 1.5 mm, a drilling depth of 2.5 mm, and a hole–edge distance of 4 mm, and integrating this analysis with findings from finite element analysis, it was discovered that the effective prestressing strain and tension exhibited a linear correlation when the micro-hole release method was employed. Consequently, the measured strain value and tensile value were fitted using Origin software 2023b to establish a functional relationship. A linear correlation analysis was conducted to establish the relationship between the measured strain value and the tension value. The Origin program was employed to fit a function to the data, and the theoretical coefficients A and B were established using a functional equation.
(6)
Through the implementation of a thorough examination of the collected data regarding the dimensions of the drilling process (specifically, a diameter of 1.5 mm, a depth of 2.5 mm, and a hole–edge distance of 4 mm), and combining this with results derived from finite element analysis, a direct relationship was identified between the effective prestressing strain and tension when the micro-hole release technique was employed. As a result, the measured strain value and tensile value were subjected to fitting analysis using Origin software to determine a functional relationship. A linear correlation analysis was performed to determine the association between the measured strain value and the tension value. The Origin software was utilized to carry out a curve-fitting analysis of the data, and the theoretical coefficients A and B were determined by the application of a functional equation.
As a new type of direct testing method, the drilling method to test the effective stress of existing bridge strand wires has recently been exploratory applied in actual engineering by testing units, but no relevant reports on actual engineering testing in the open literature have been retrieved yet. As a new test method, there is still a lot of work worth continuing in-depth research. At present, this paper only carries out relevant verification through simulation and tests and has not yet carried out on-site actual bridge tests. In the future, the theoretical model of the drilling method for testing the effective prestressing of strands will be further improved through the actual bridge inspection test, the data will be accumulated, and a systematic testing and analysis method will be formed, so as to provide a new feasible testing method for the identification of the effective prestressing of prestressed concrete bridges in service.

Author Contributions

Conception, W.W.; Methodology, W.W., S.C. and C.D.; Software, W.W.; Validation, J.Y. and L.N.; Formal analysis, W.P. and L.N.; survey, W.W., C.D. and J.Y.; Data organization, W.W. and C.D.; Writing—original draft preparation, W.W.; Writing—review and editing, W.W., S.C. and W.W.; Supervision, S.C.; Obtaining funding, S.C. and L.N. All authors have read and agreed to the published version of the manuscript.

Funding

Science and Technology Innovation and Demonstration Project of Yunnan Provincial Department of Transportation, China (Yunnan Traffic Science and Education [2020] No. 91).

Institutional Review Board Statement

Not applicable.

Informed Consent Statement

Not applicable.

Data Availability Statement

All data used to support the findings of this study are available from the corresponding author upon request.

Conflicts of Interest

The authors declare that they have no known competing financial interest or personal relationship that could have appeared to influence the work reported in this paper.

Nomenclature

ε Strain per unit of distance in the axial direction at the edge of the hole (με)
σUnidirectional stresses along the strand axial direction (Mpa)
FNValue of effective tension applied to the stranded wire (kN)
AS1860-grade strand cross-sectional area (mm2)
EModulus of elasticity of steel strands (Gpa)
R 1 R 2 Closest and furthest distance from the center of the strain gauge sensitive grid (mm)

References

  1. Yang, J.; Jung, J.; Kim, J. Applicability of 2360 Mpa grade prestressing steel strand: Performance of material, bond, and anchorage system. Constr. Build. Mater. 2021, 266, 120941. [Google Scholar] [CrossRef]
  2. Jacinto, L.; Pipa, M.; Neves, L.A.; Santos, L.O. Probabilistic models for mechanical properties of prestressing strands. Constr. Build. Mater. 2012, 36, 84–89. [Google Scholar] [CrossRef]
  3. Jiang, W.; Warby, K.M.; Henshall, L.J. Statically indeterminate contacts in axially loaded wire strand. Eur. J. Mech./A Solids 2007, 27, 69–78. [Google Scholar] [CrossRef]
  4. Shen, Y.; Ling, J.; Lu, X.; Zhang, Y.; Yan, Z. Steel wire prestress analysis of large section jacking prestressed concrete cylinder pipe (JPCCP): Site experiment and numerical investigation. Thin-Walled Struct. 2023, 184, 110420. [Google Scholar] [CrossRef]
  5. Chaki, S.; Bourse, G. Guided ultrasonic waves for non-destructive monitoring of the stress levels in prestressed steel strands. Ultrasonics 2009, 49, 162–171. [Google Scholar] [CrossRef] [PubMed]
  6. Li, X.; Zhang, B.; Yuan, C.; Tu, C.; Chen, D.; Chen, Z.; Li, Y. An electromagnetic oscillation method for stress measurement of steel strands. Measurement 2018, 125, 330–335. [Google Scholar] [CrossRef]
  7. Kralovanec, J.; Bahleda, F.; Moravcik, M. State of Prestressing Analysis of 62-Year-Old Bridge. Materials 2022, 15, 3583. [Google Scholar] [CrossRef] [PubMed]
  8. Maudi, M.S.; Shields, J.; O’connor, D.; Hutchens, E. Variation of prestress forces in a prestressed concrete bridge during the first 30 months. PCI J. 1996, 41, 66–72. [Google Scholar]
  9. Tinkloh, S.; Wu, T.; Tröster, T.; Niendorf, T. The Effect of Fiber Waviness on the Residual Stress State and Its Prediction by the Hole Drilling Method in Fiber Metal Laminates: A Global-Local Finite Element Analysis. Metals 2021, 11, 156. [Google Scholar] [CrossRef]
  10. Ma, W.; Bai, T.; Li, Y.; Zhang, H.; Zhu, W. Research on Improving the Accuracy of Welding Residual Stress of Deep-Sea Pipeline Steel by Blind Hole Method. J. Mar. Sci. Eng. 2022, 10, 791. [Google Scholar] [CrossRef]
  11. Zhang, Z.; Wu, J.; Zhang, C.; Xu, Q.; Chen, Y.; Wang, Z. Identification of Effective Prestress of Steel Based on Blind-hole Method. J. China Railw. Soc. 2023, 45, 166–175. [Google Scholar]
  12. Rendler, N.J.; Vigness, I. Hole-drilling strain gauge method of measuring residual stresses. Exp. Mech. 1966, 12, 577–586. [Google Scholar] [CrossRef]
  13. Chen, C.; Yuan, X.-f. Fine analysis of section stress of steel strand. J. Zhejiang Univ. 2017, 51, 841–846+878. [Google Scholar]
  14. Ghoreishi, S.R.; Messager, T.; Cartraud, P.; Davies, P. Validity and limitations of linear analytical models for steel wire strands under axial loading, using a 3D FE model. Int. J. Mech. Sci. 2007, 49, 1251–1261. [Google Scholar] [CrossRef]
  15. Wang, B. The Model Test Study on the Existing Stress Detection of Prestressed Hollow Slab Bridges Based on the Stress Releasing Method. Ph.D. Thesis, Chongqing Jiaotong University, Chongqing, China, 2009. [Google Scholar]
  16. Chen, J. Research on Effective Prestress Detection of Bridges Based on Blind Hole Method. Ph.D. Thesis, Harbin Institute of Technology, Harbin, China, 2016. [Google Scholar]
  17. Yuan, Q. Research on the Detection of the Effective Prestress of Prestressed Strands by Using the Blind-Hold Method. Ph.D. Thesis, Harbin Institute of Technology, Harbin, China, 2018. [Google Scholar]
  18. Nx, M.F. Version: FEA NX 2022 (v1.1). 2022. Available online: http://www.product.midasit.cn/index/ (accessed on 15 May 2022).
  19. Andreev, V.I.; Cybin, N.Y. The Inhomogeneous Plate with a Hole: Kirsch’s Problem. Procedia Eng. 2014, 91, 26–31. [Google Scholar] [CrossRef]
  20. Timoshenko, S.P.; Goodier, J. Theorya Uprugosti; Nauka: Moscow, Russia, 1979; 560p. [Google Scholar]
  21. Peng, Y.; Zhao, J.; Chen, L.-S.; Dong, J. Residual stress measurement combining blind-hole drilling and digital image correlation approach. J. Constr. Steel Res. 2021, 176, 106346. [Google Scholar] [CrossRef]
  22. Yan, S.Z.; Yu, X.J.; Wang, Y.M. A new method for calibration of release coefficient in residual stress measurement. J. Jilin Univ. Technol. 1995, 25, 49–54. [Google Scholar]
  23. GB/T5224-2014; General Administration of Quality Supervision, Inspection, and Quarantine of the People’s Republic of China. Steel Strand for Prestressed Concrete. China Standard Press: Beijing, China, 2014. (In Chinese)
  24. Jiang, W.; Yao, M.; Walton, J. A concise finite element model for simple straight wire rope strand. Int. J. Mech. Sci. 1999, 41, 143–161. [Google Scholar] [CrossRef]
  25. Judge, R.; Yang, Z.; Jones, S.; Beattie, G. Full 3D finite element modeling of spiral strand cables. Constr. Build. Mater. 2012, 35, 452–459. [Google Scholar] [CrossRef]
  26. Feyrer, K. Wire Ropes: Tension, Endurance, Reliability; Springer: Berlin, Germany, 2015; pp. 60–67. [Google Scholar]
  27. Jiang, J.; Deng, N.; Guo, X. Finite element simulation of cross-sectional stress of 1860-grade steel strand. Chin. Sci. Technol. Pap. 2021, 16, 193–198+204. [Google Scholar]
  28. Abdullah, A.B.M.; Rice, J.A.; Hamilton, H.R.; Consolazio, G.R. Experimental and Numerical Evaluation of Unbonded Posttensioning Tendons Subjected to Wire Breaks. J. Bridge Eng. 2016, 21, 04016066. [Google Scholar] [CrossRef]
  29. Qian, H.; Zong, Z.; Xie, G.; Liao, J.; Du, M. Refined simulation of elastic-plastic static behavior of grade 1860 strand wires. J. Southeast Univ. 2019, 49, 624–630. [Google Scholar]
  30. Mouhib, N.; Wahid, A.; Sabah, F.; Chakir, H.; Elghorba, M. Experimental characterization and damage reliability analysis of central core strand extracted from steel wire rope. Eng. Fail. Anal. 2020, 120, 105103. [Google Scholar] [CrossRef]
  31. Minaei, A.; Daneshjoo, F.; Goicolea, J.M. Experimental and numerical study on cable breakage equivalent force in cable-stayed structures consisting of low-relaxation seven-wire steel strands. Structures 2020, 27, 595–606. [Google Scholar] [CrossRef]
  32. Ma, X.M.; Ou, Q.Y. Numerical simulation for hole-drilling strain gage method applied on curved surface. J. South China Univ. Technol. 2019, 47, 25–31. [Google Scholar]
Figure 1. Finite element modeling of the bare steel strand. (a) Three-dimensional. (b) Detailed division of drilled. (c) Steel wires in contact with.
Coatings 13 01869 g001
Figure 2. Stress–strain relationship of stranded wire.
Coatings 13 01869 g002
Figure 3. Stress cloud of 100 Mpa and 600 Mpa 1/2 twist section. (a) Stress cloud of 100 Mpa 1/2 twist section. (b) Stress cloud of 600 Mpa 1/2 twist section.
Coatings 13 01869 g003
Figure 4. Stress cloud after drilling 1.5 mm hole diameter, 2.5 mm drilling depth.
Coatings 13 01869 g004
Figure 5. Stress release of drilled wire under different tension stresses and hole margins.
Coatings 13 01869 g005
Figure 6. Stress-release rate of drilled wire under different tensile stresses and hole margins.
Coatings 13 01869 g006
Figure 7. Strain release of drilled wire for different drilling diameters.
Coatings 13 01869 g007
Figure 8. Surface unit stress cloud after drilling 2.5 mm diameter and 2.5 mm depth holes.
Coatings 13 01869 g008
Figure 9. Strain-release rate of drilled wire for different drilling diameters.
Coatings 13 01869 g009
Figure 10. Strain release of drilled wire at different drilling depths.
Coatings 13 01869 g010
Figure 11. Strain-release rate of drilled wire at different drilling depths.
Coatings 13 01869 g011
Figure 12. 1000 Mpa tension stress 1.5 mm drill bit drilled to 2.5 mm, stress diagram near the drilled hole section.
Coatings 13 01869 g012
Figure 13. Homemade strand tensioning platform.
Coatings 13 01869 g013
Figure 14. Customized strain gauge.
Coatings 13 01869 g014
Figure 15. Schematic diagram of stranded wire drilling test. (a) Before drilling of stranded wire. (b) After drilling of stranded wire. (c) Strain gauge paste example.
Coatings 13 01869 g015
Figure 16. Test tension-measured strain relationship diagram.
Coatings 13 01869 g016
Figure 17. Test tensile stress-measured strain relationship plot.
Coatings 13 01869 g017
Figure 18. Test tensile stress-measured average strain relationship graph.
Coatings 13 01869 g018
Table 1. The 1860-grade strand finite element simulation dimensions and material parameters.
StructureHelix Angle/°Spacing/
mm
Nominal Diameter/
mm
Densities/
g·cm−3
Strength Class/MpaYield Strength σc/MpaYoung’s Modulus E/GpaPoisson’s RatioMesh Size/mmNumber of Units
1 × 78.4822515.207.85186015811950.2690.5463,880
Table 2. Comparison of average stress calculation results for 1/2 twist section.
Applied Tension Stress/MpaCalculations in This PaperFeyrer [26] Eq.Relative Error/%
Average Stress in Stranded Wire/MpaAverage Stress on Outer Wire of Steel Strand/MpaAverage Stress in Stranded Wire/MpaAverage Stress on Outer Wire of Steel Strand/MpaRelative Error of Medium Wire StrandRelative Error of Outer Wire Strand
100104.398.9104.199.30.2−0.4
200208.6197.8206.6198.91.0−0.5
300313.4296.8312.1295.10.40.6
400419.9395.4413.0397.81.7−0.6
500526.6493.7515.6489.62.10.8
600633.4592.0619.8596.72.2−0.8
Table 3. Parameters of measured 1860-grade strands.
StructureLose One’s BearingsWeights/kgNominal
Diameter/mm
Strength Class/MpaRelaxation LevelMeasured Cross-Sectional Area/mm2Tensile Strength/Mpa
1 × 7Left107815.201860141 ± 1≥1907
Table 4. Measured strain and effective strain measurement results.
Test
Condition
Tensile/kNTensile Stress/Mpa1# Measuring Point/µε2# Measuring Point/µε3# Measuring Point/µεAverage Strain at 1#~3# Measurement Points/µε
10.0052.158.362.557.6
0.0068.650.157.658.8
215.4109112.2223.3143.8159.8
14.3101127.3179.2240.5182.4
327.2193251.2195.5/223.4
28.4201331/296313.5
440.8289477.2382.5333.3397.7
42.5301405.8/389.7397.8
554.9389/504.7554.1529.4
59.6422579.1481.5503.7521.4
673.0517646.2/587.9617.1
70.0496618.3541.7627.1595.7
784.4598750.1741.8/745.9
85.4605722.2/876.1799.1
8100.8714748.1871.3895.3838.2
98.5698810.5741.7872.1808.1
9111.9793895.31022.4910.9942.9
112.5797991.9929.31050.6990.6
10129.19151008.71102.11274.11128.3
126.78981263.11044.91126.71144.9
11140.19931253.2981.91204.51146.5
141.31001/1204.71035.71120.2
Disclaimer/Publisher’s Note: The statements, opinions and data contained in all publications are solely those of the individual author(s) and contributor(s) and not of MDPI and/or the editor(s). MDPI and/or the editor(s) disclaim responsibility for any injury to people or property resulting from any ideas, methods, instructions or products referred to in the content.

