
Study of Decay Mechanisms and Rules of Recycled Asphalt Pavement via a Full-Scale Experiment


Abstract
:1. Introduction
2. Experimental Background
2.1. Sample Preparation
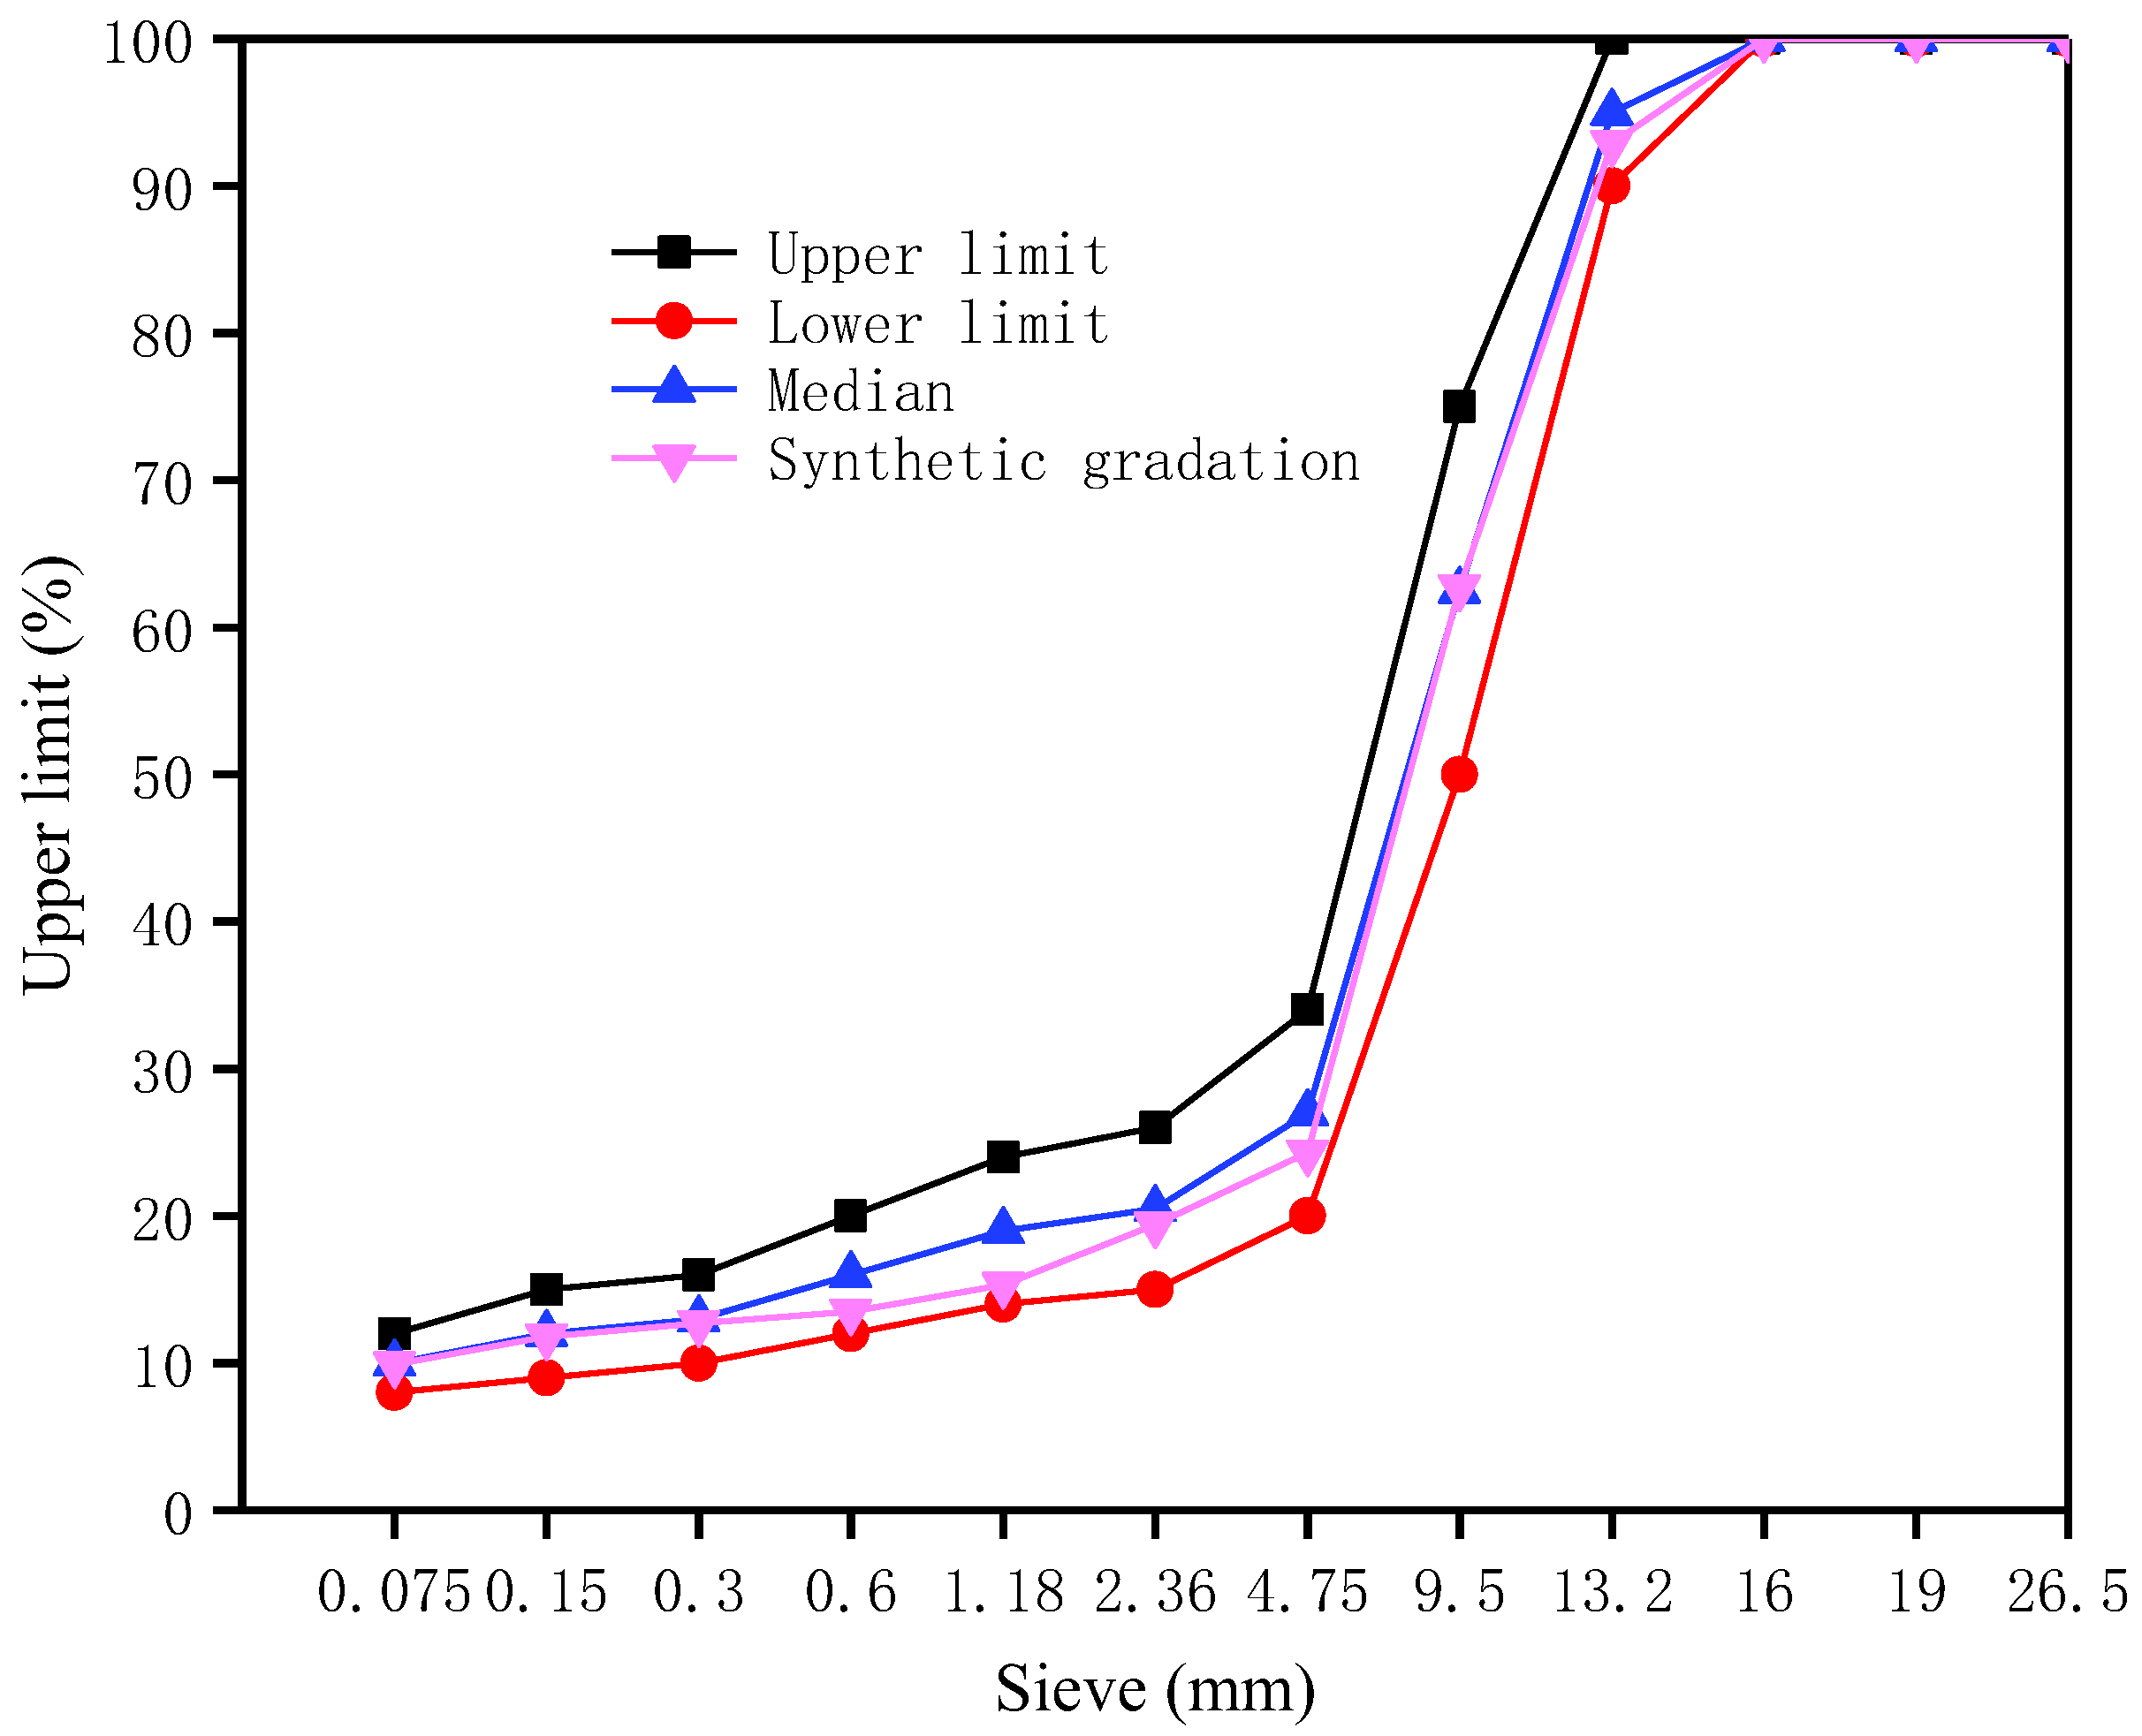
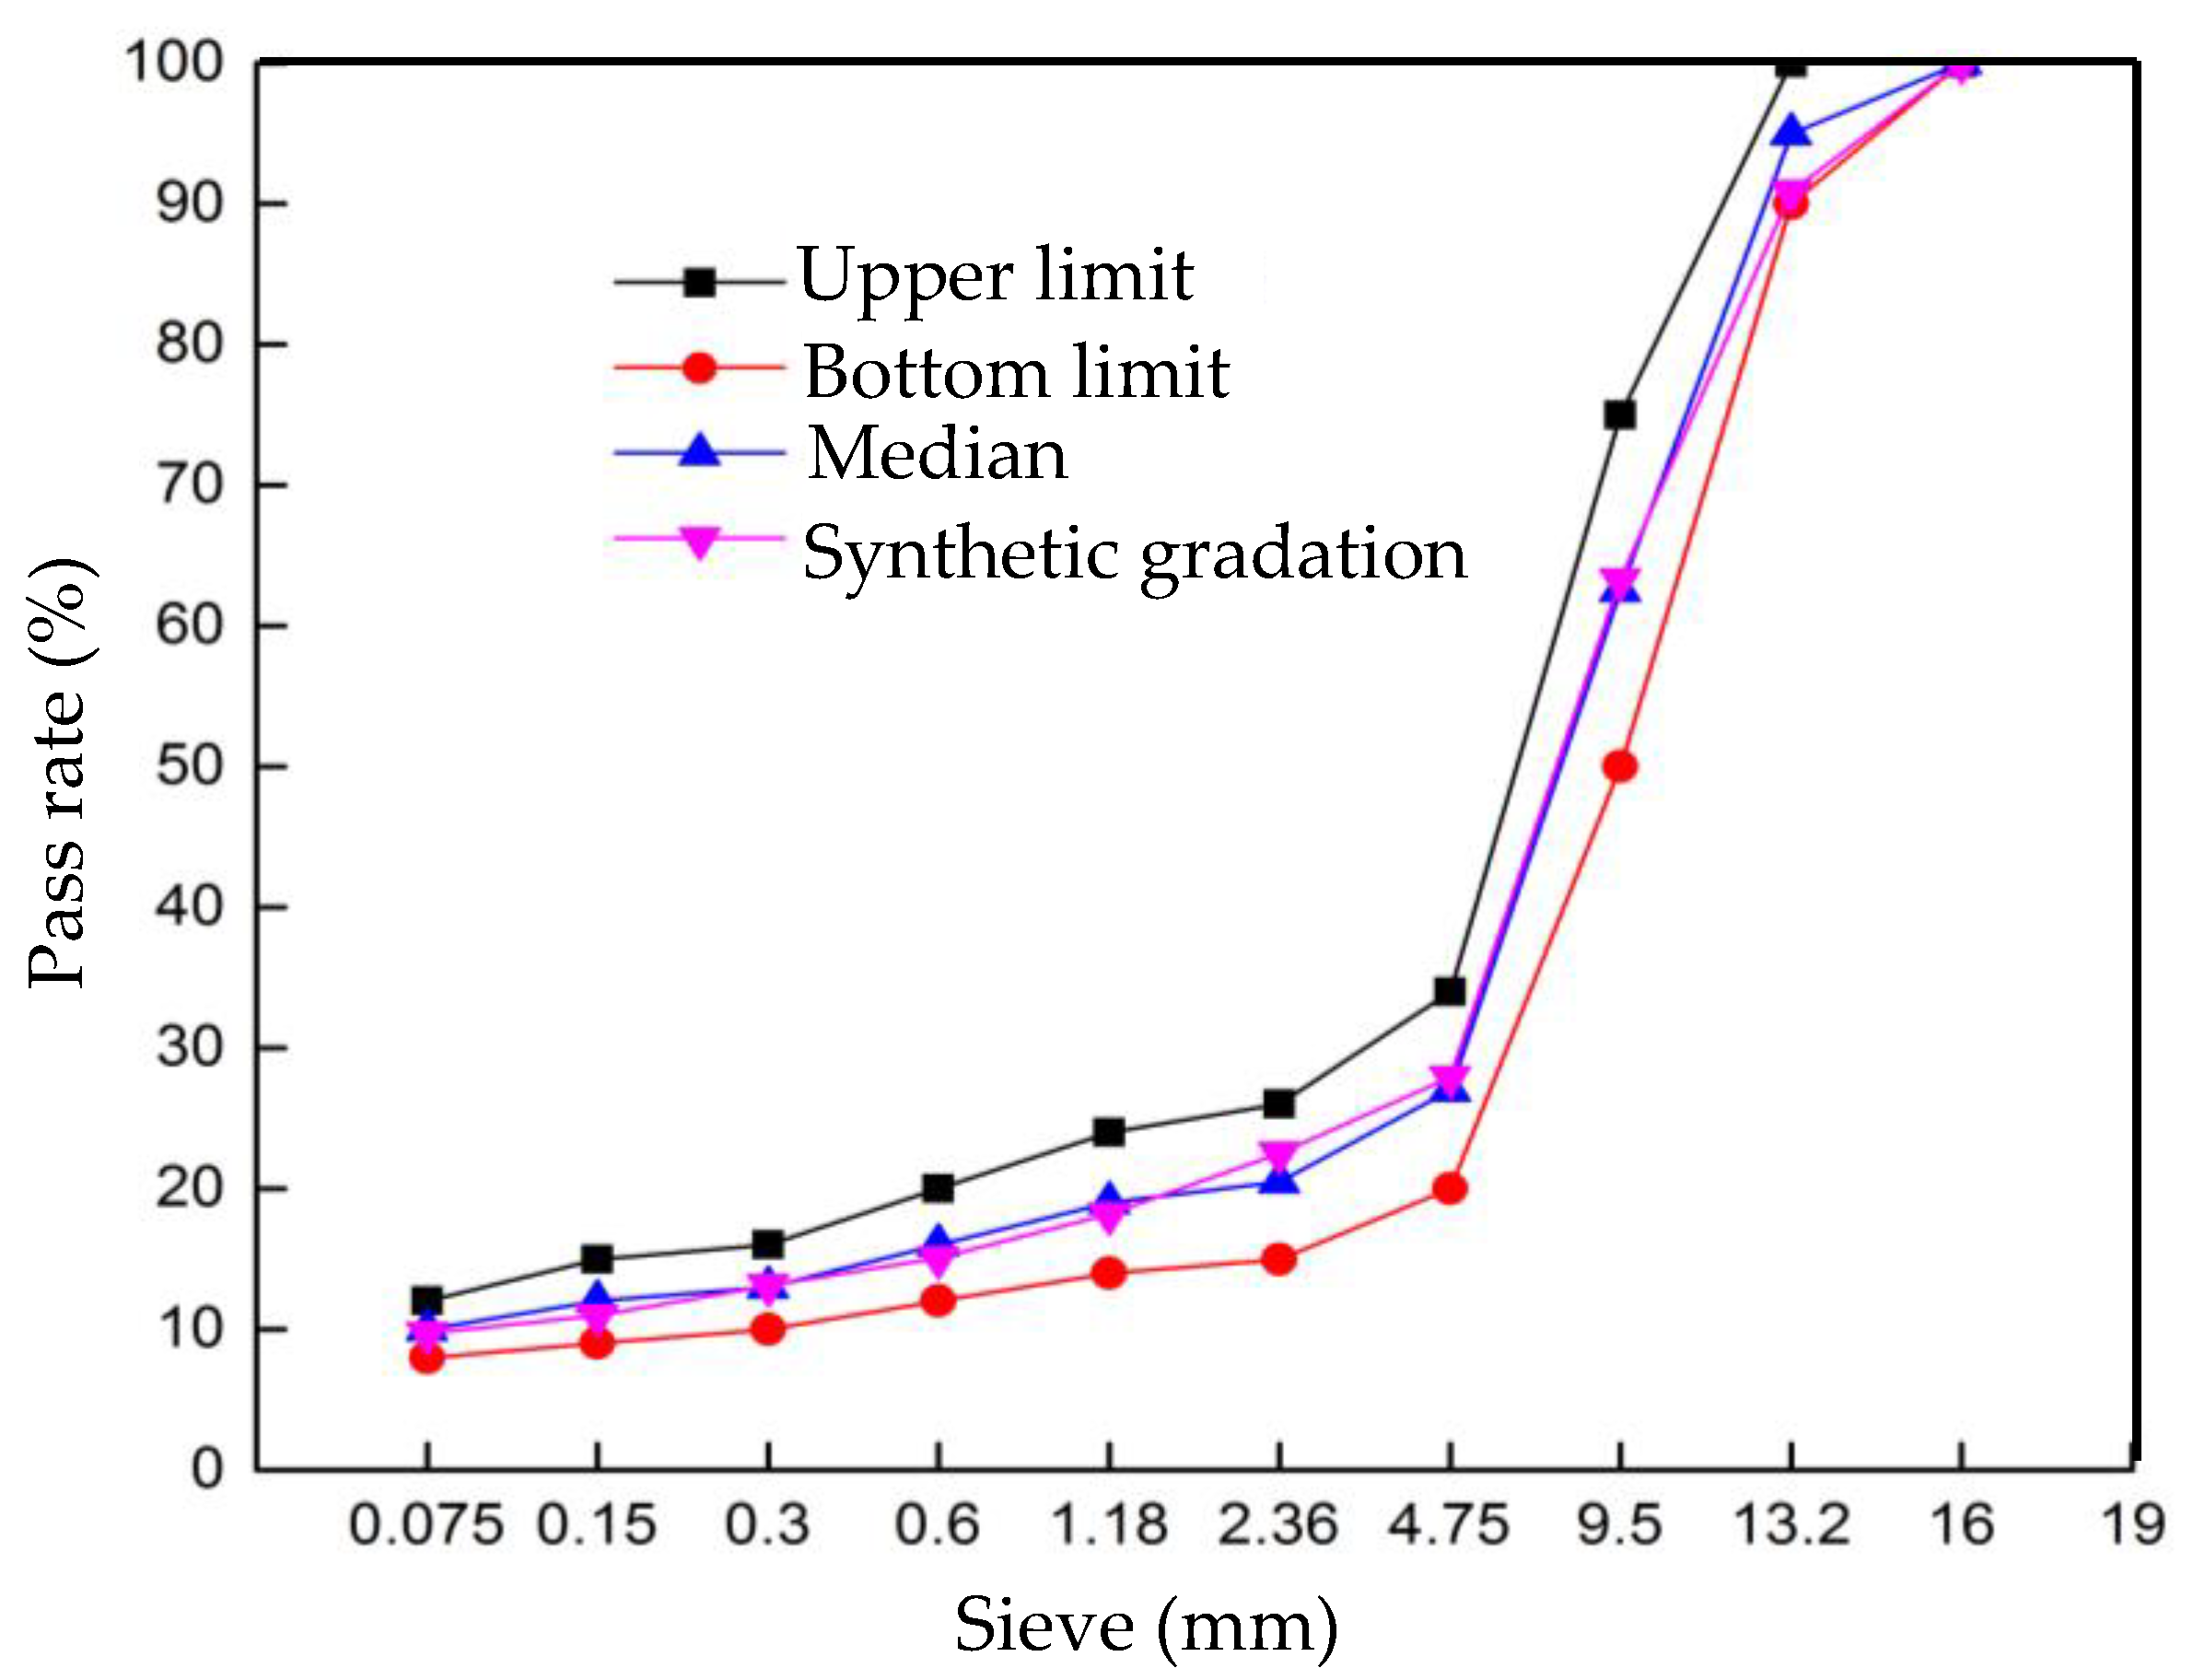
2.1.1. Test Road Surface Material
- SMA-13 ordinary asphalt mixture.
- 2.
- SMA-13 recycled asphalt mixture.
- 3.
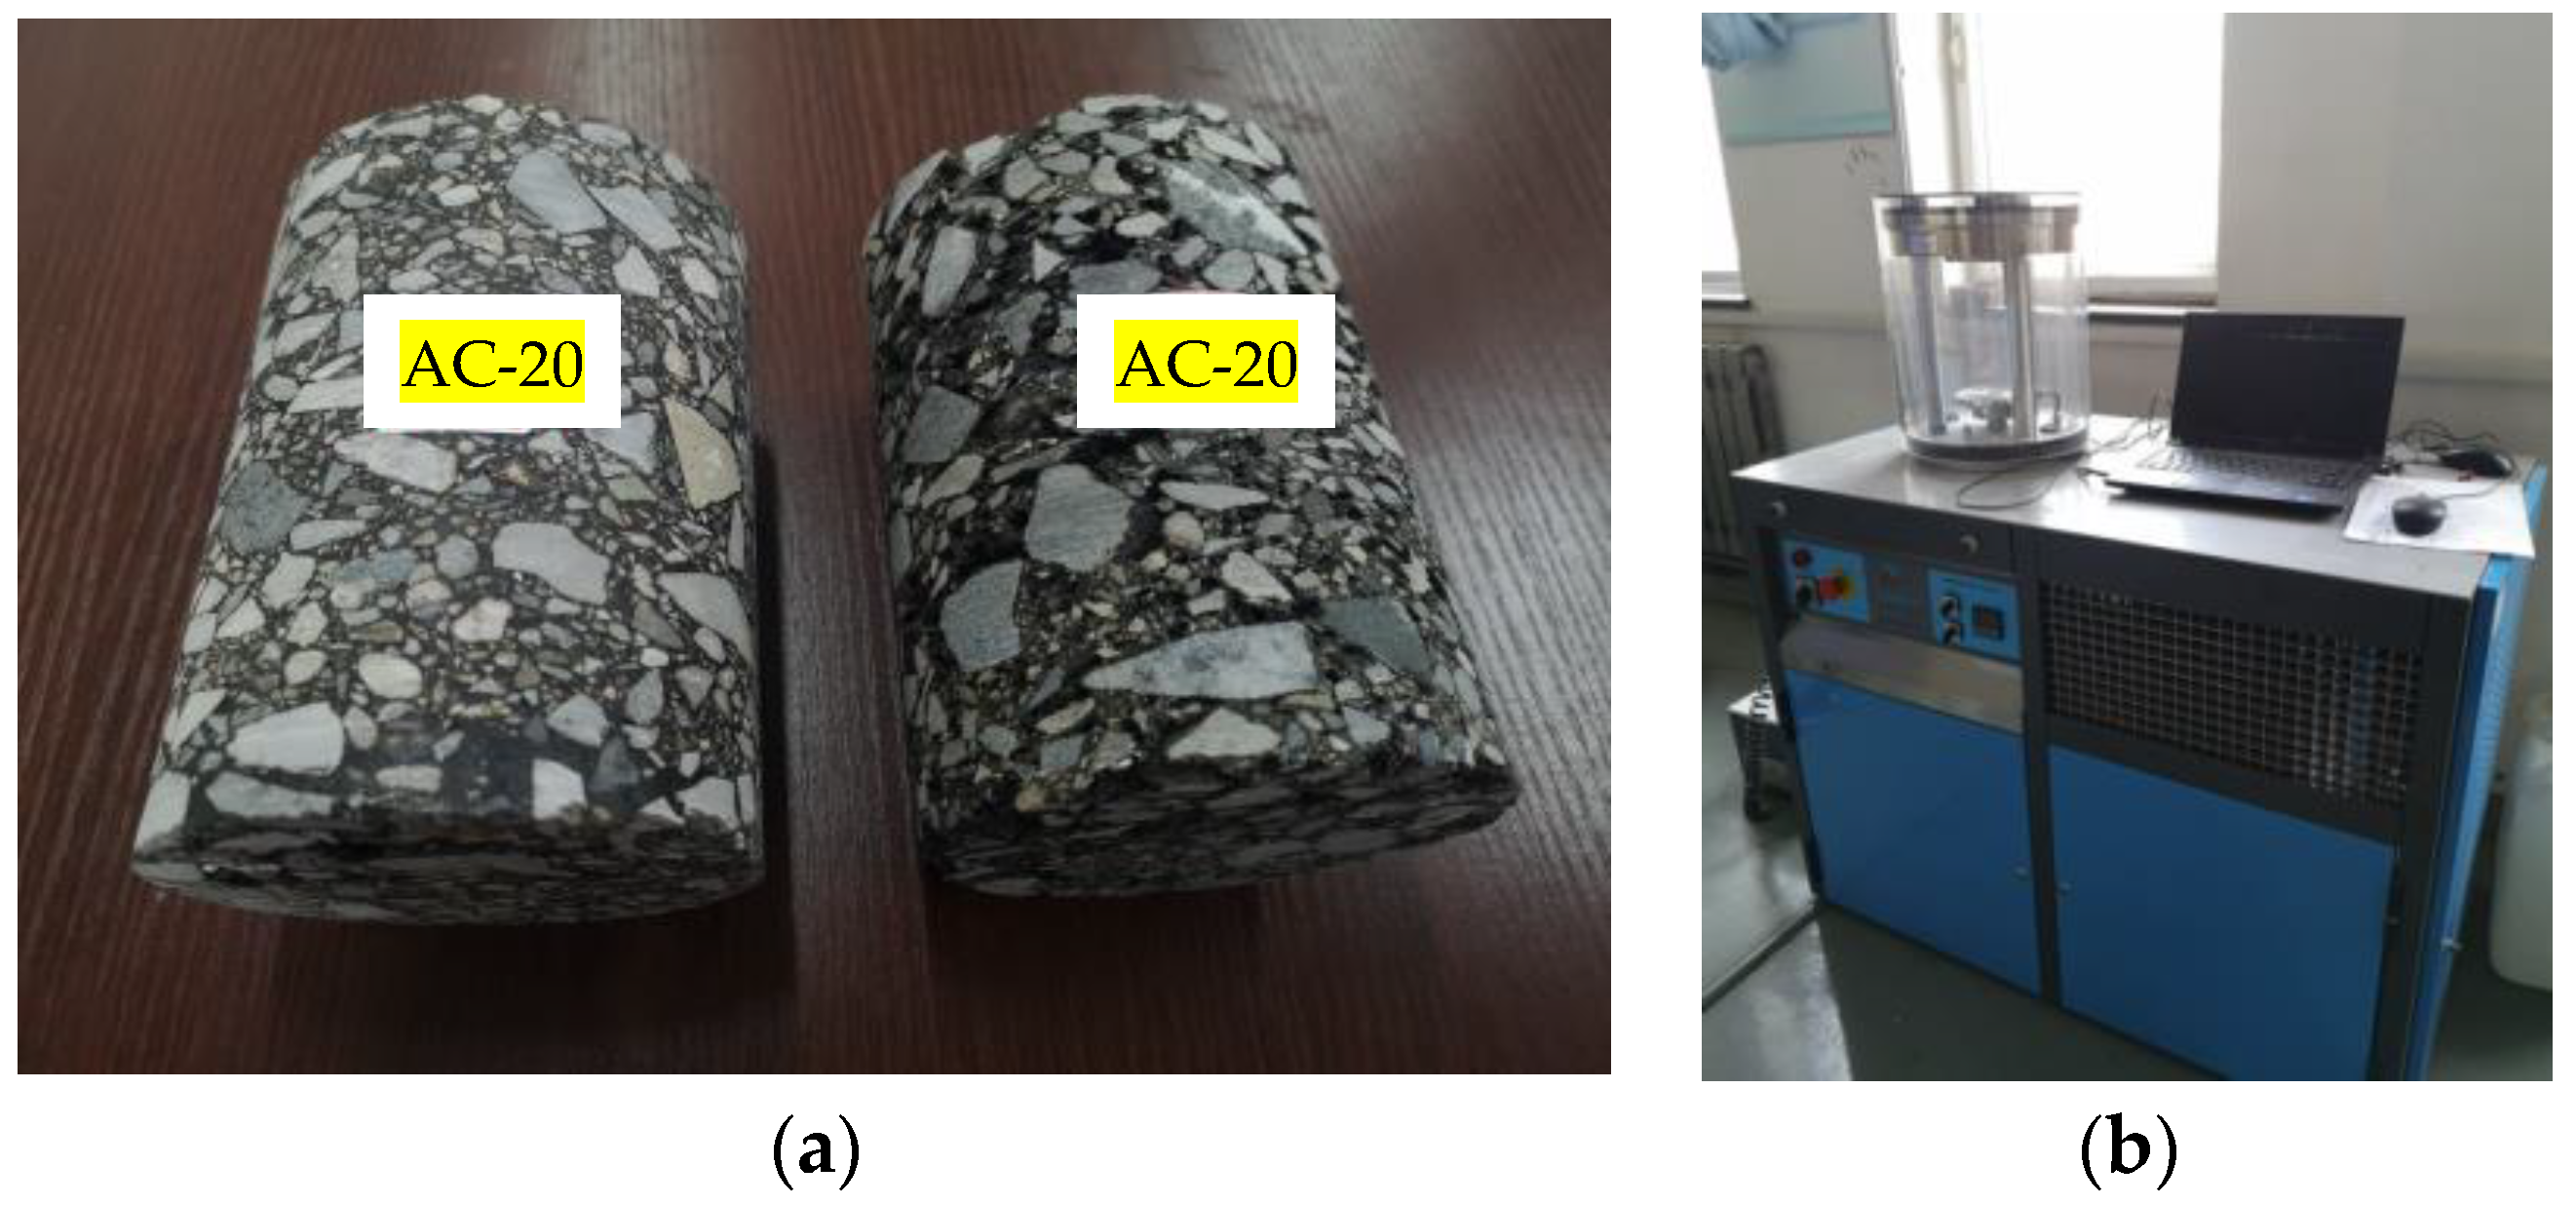
- AC-20 recycled asphalt mixture.
2.1.2. Performance Evaluation
- Water stability.
- 2.
- Rutting resistance.
- 3.
- Low-temperature crack resistance.
2.2. Test Methods and Scheme
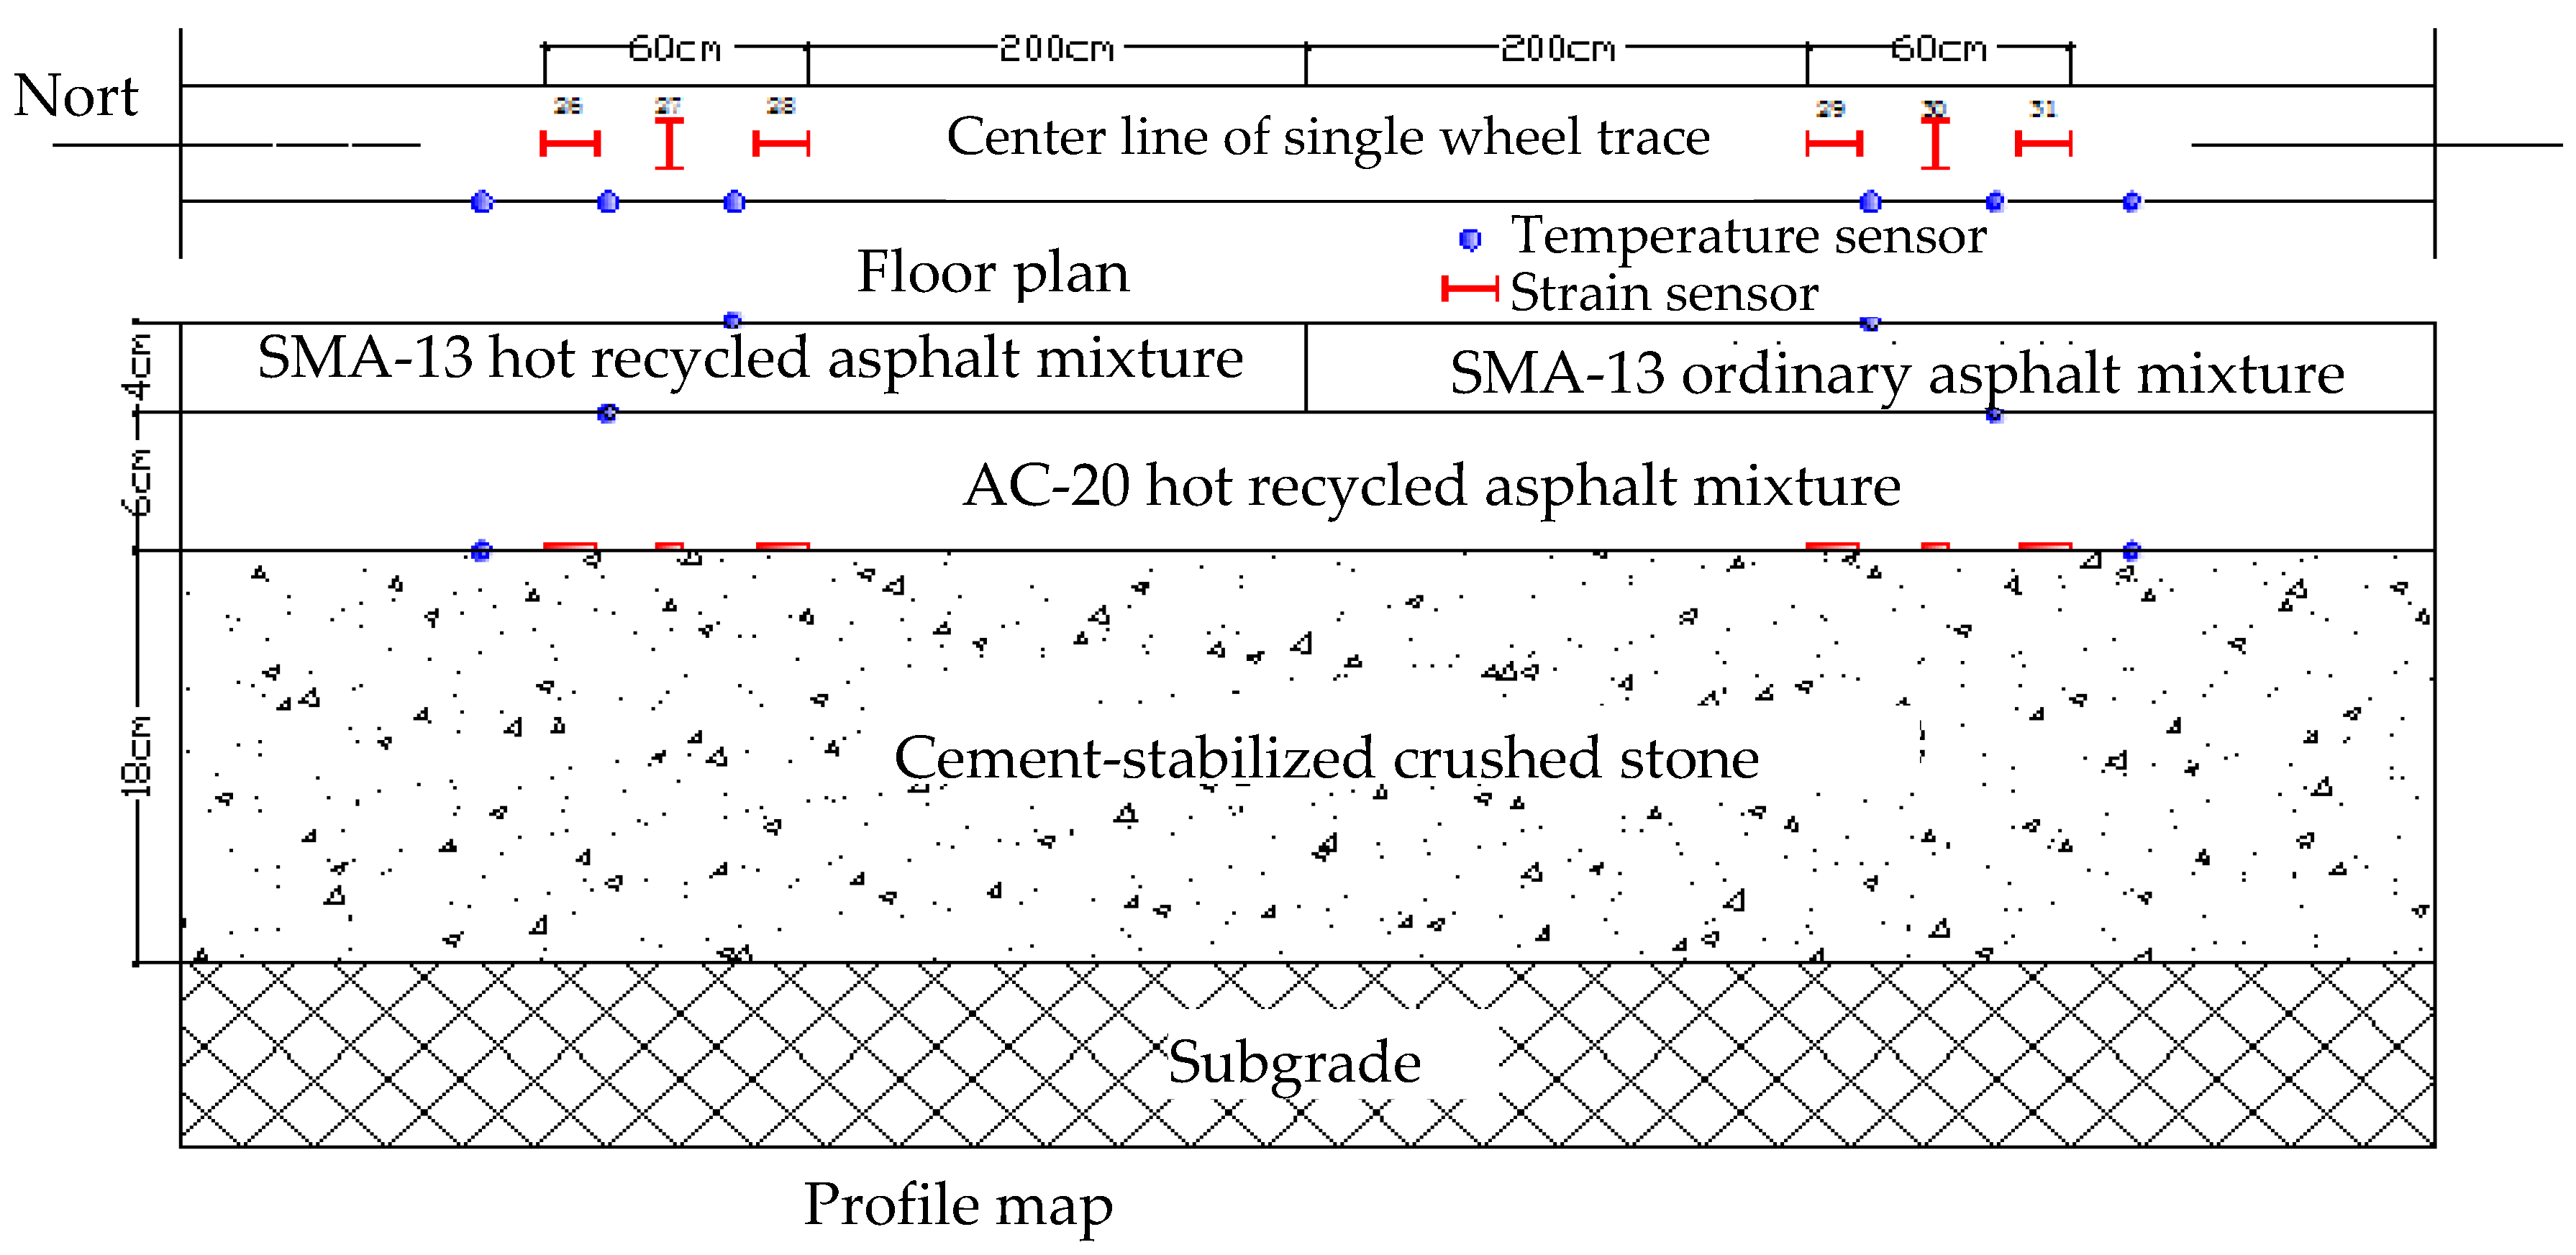
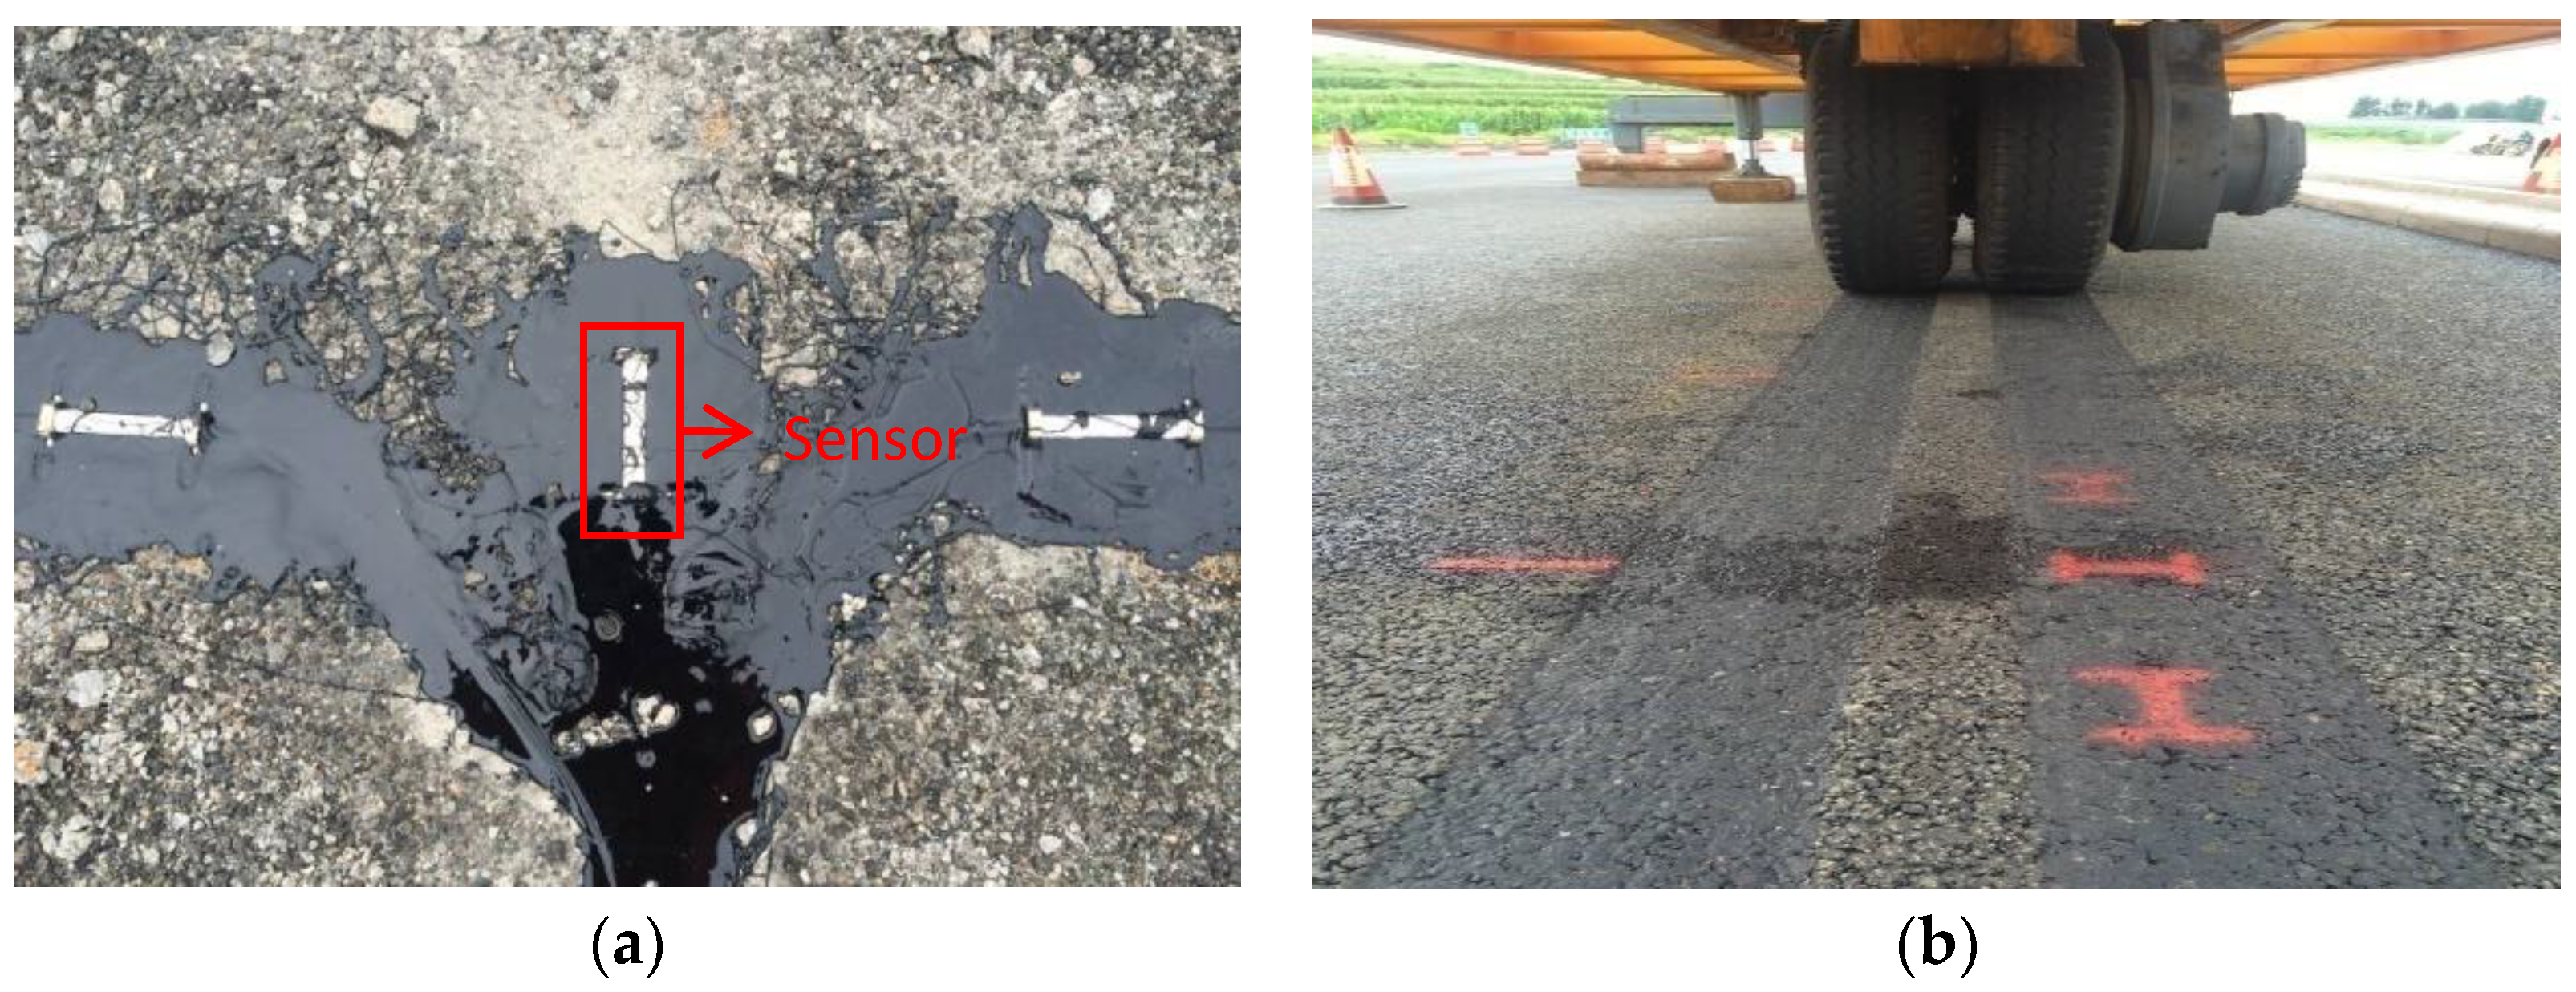
2.2.1. Full-Scale Experiment
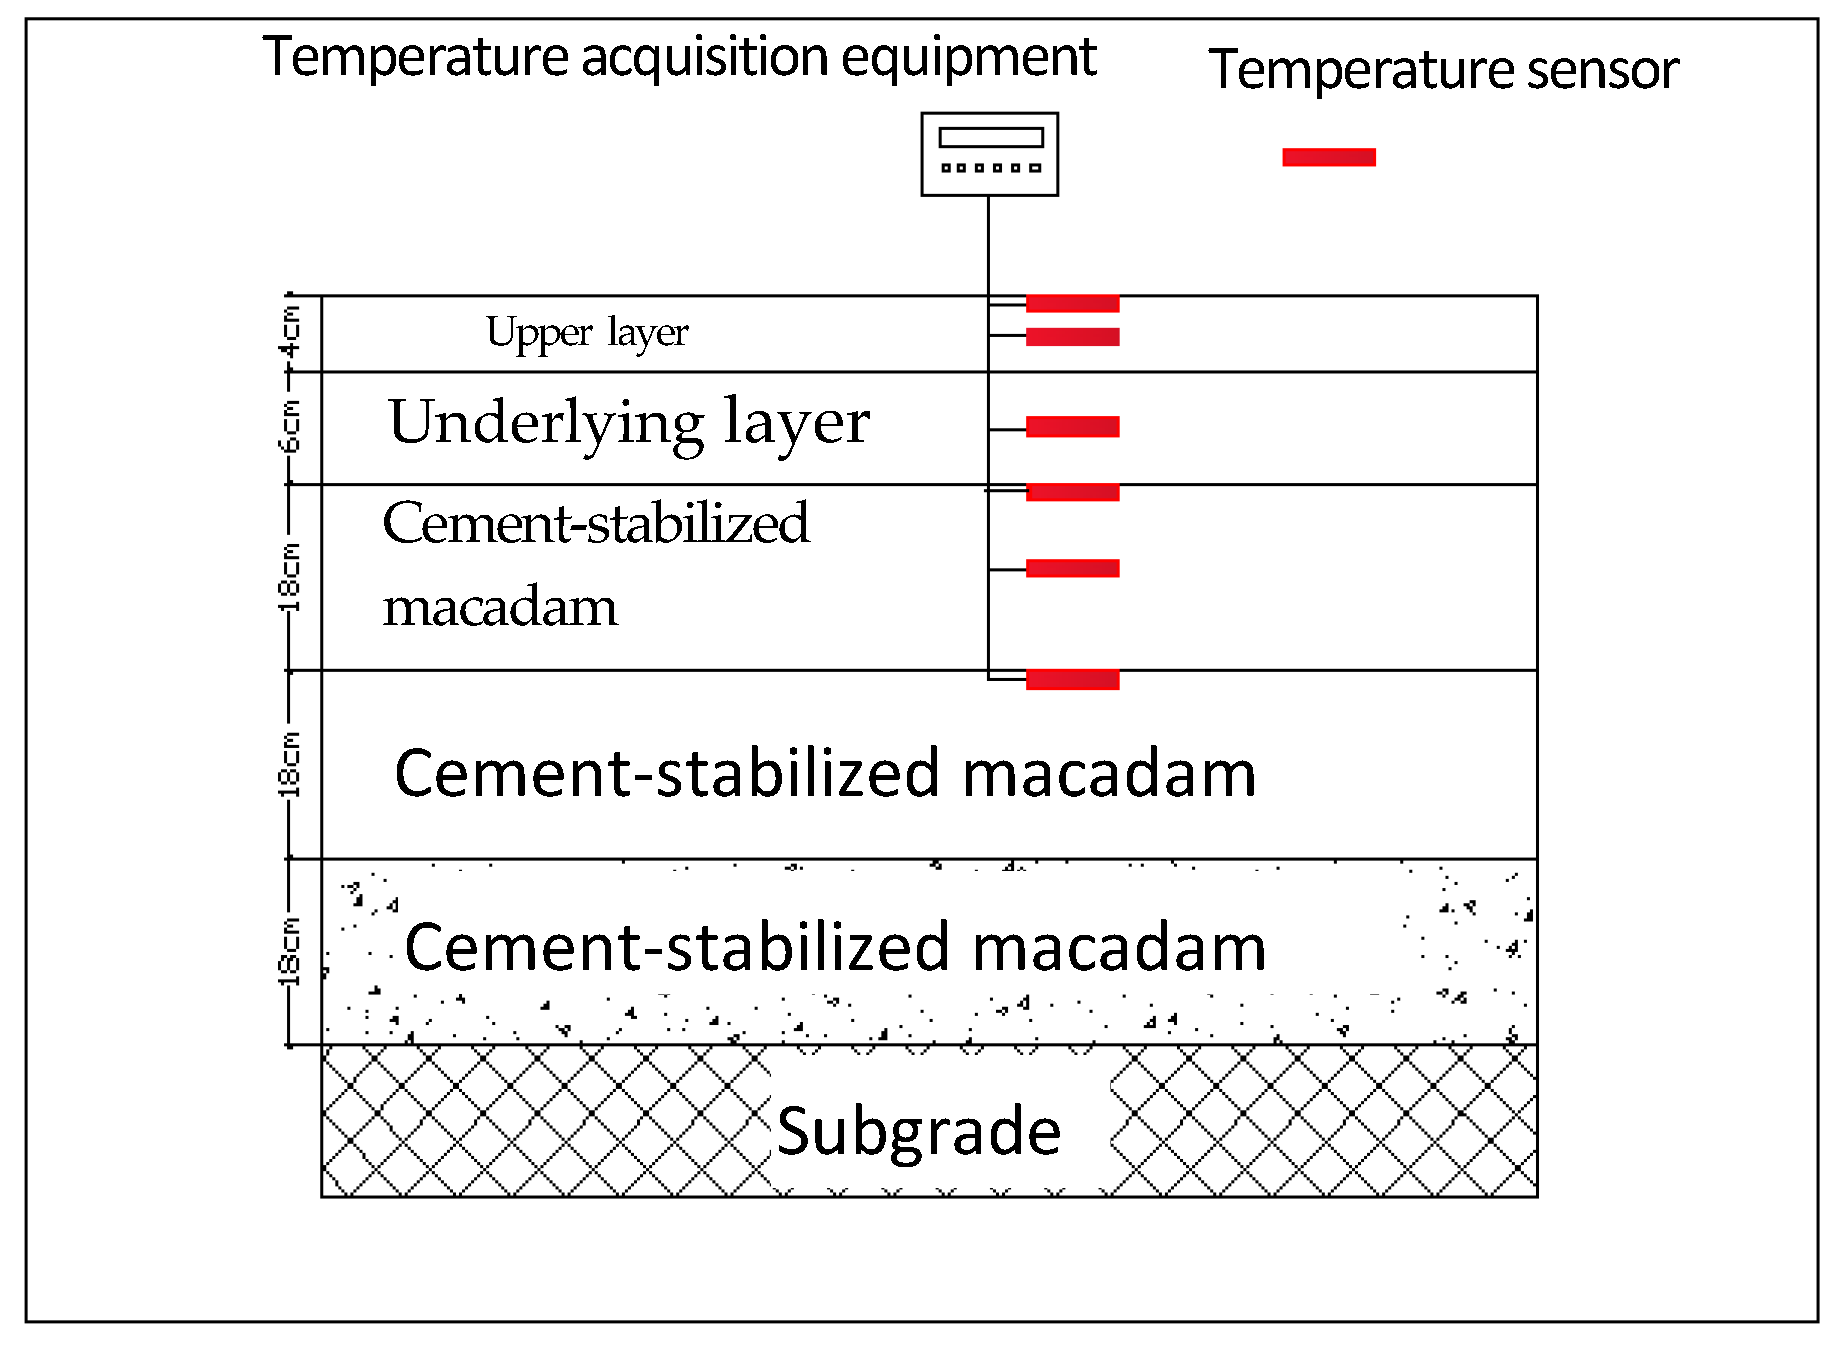
2.2.2. Field Monitoring Method
- Pavement temperature monitoring.
- 2.
- Skid resistance monitoring.
- 3.
- Rut monitoring.
- 4.
- Monitoring of tensile and compressive strain in the asphalt layer bottom.
2.2.3. Trabecular Bending Fatigue Test
- (1)
- The standard specimen is stored in a YDDL 40-440 digital display high- and low-temperature refrigerator (15 °C) for two hours.
- (2)
- The MTS environment chamber regulates the constant temperature (15 °C).
- (3)
- The specimen is placed on the mold.
- (4)
- The initial contact load is set via MTS. The specimen is in contact with the load device.
- (5)
- The load is applied according to the design requirements.
- (6)
- The test data are collected according to the design requirements.
2.2.4. Dynamic Modulus Test
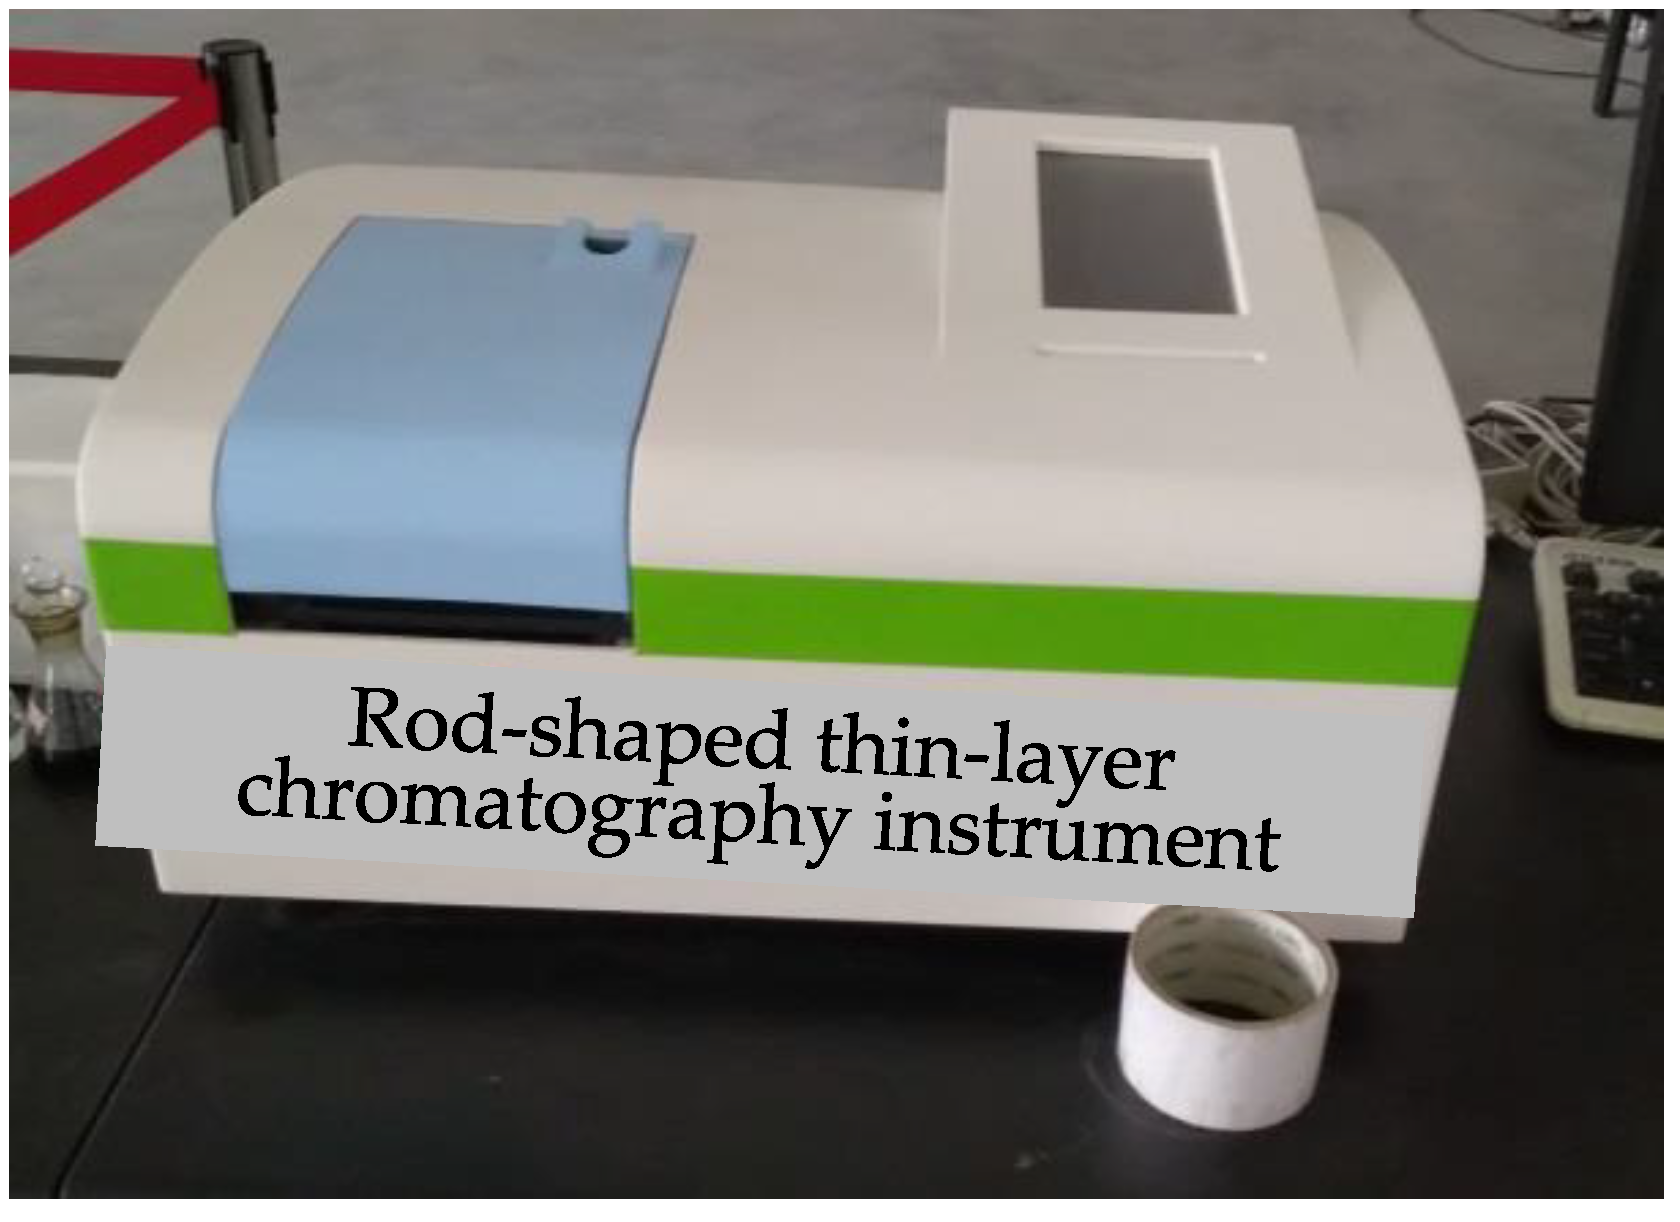
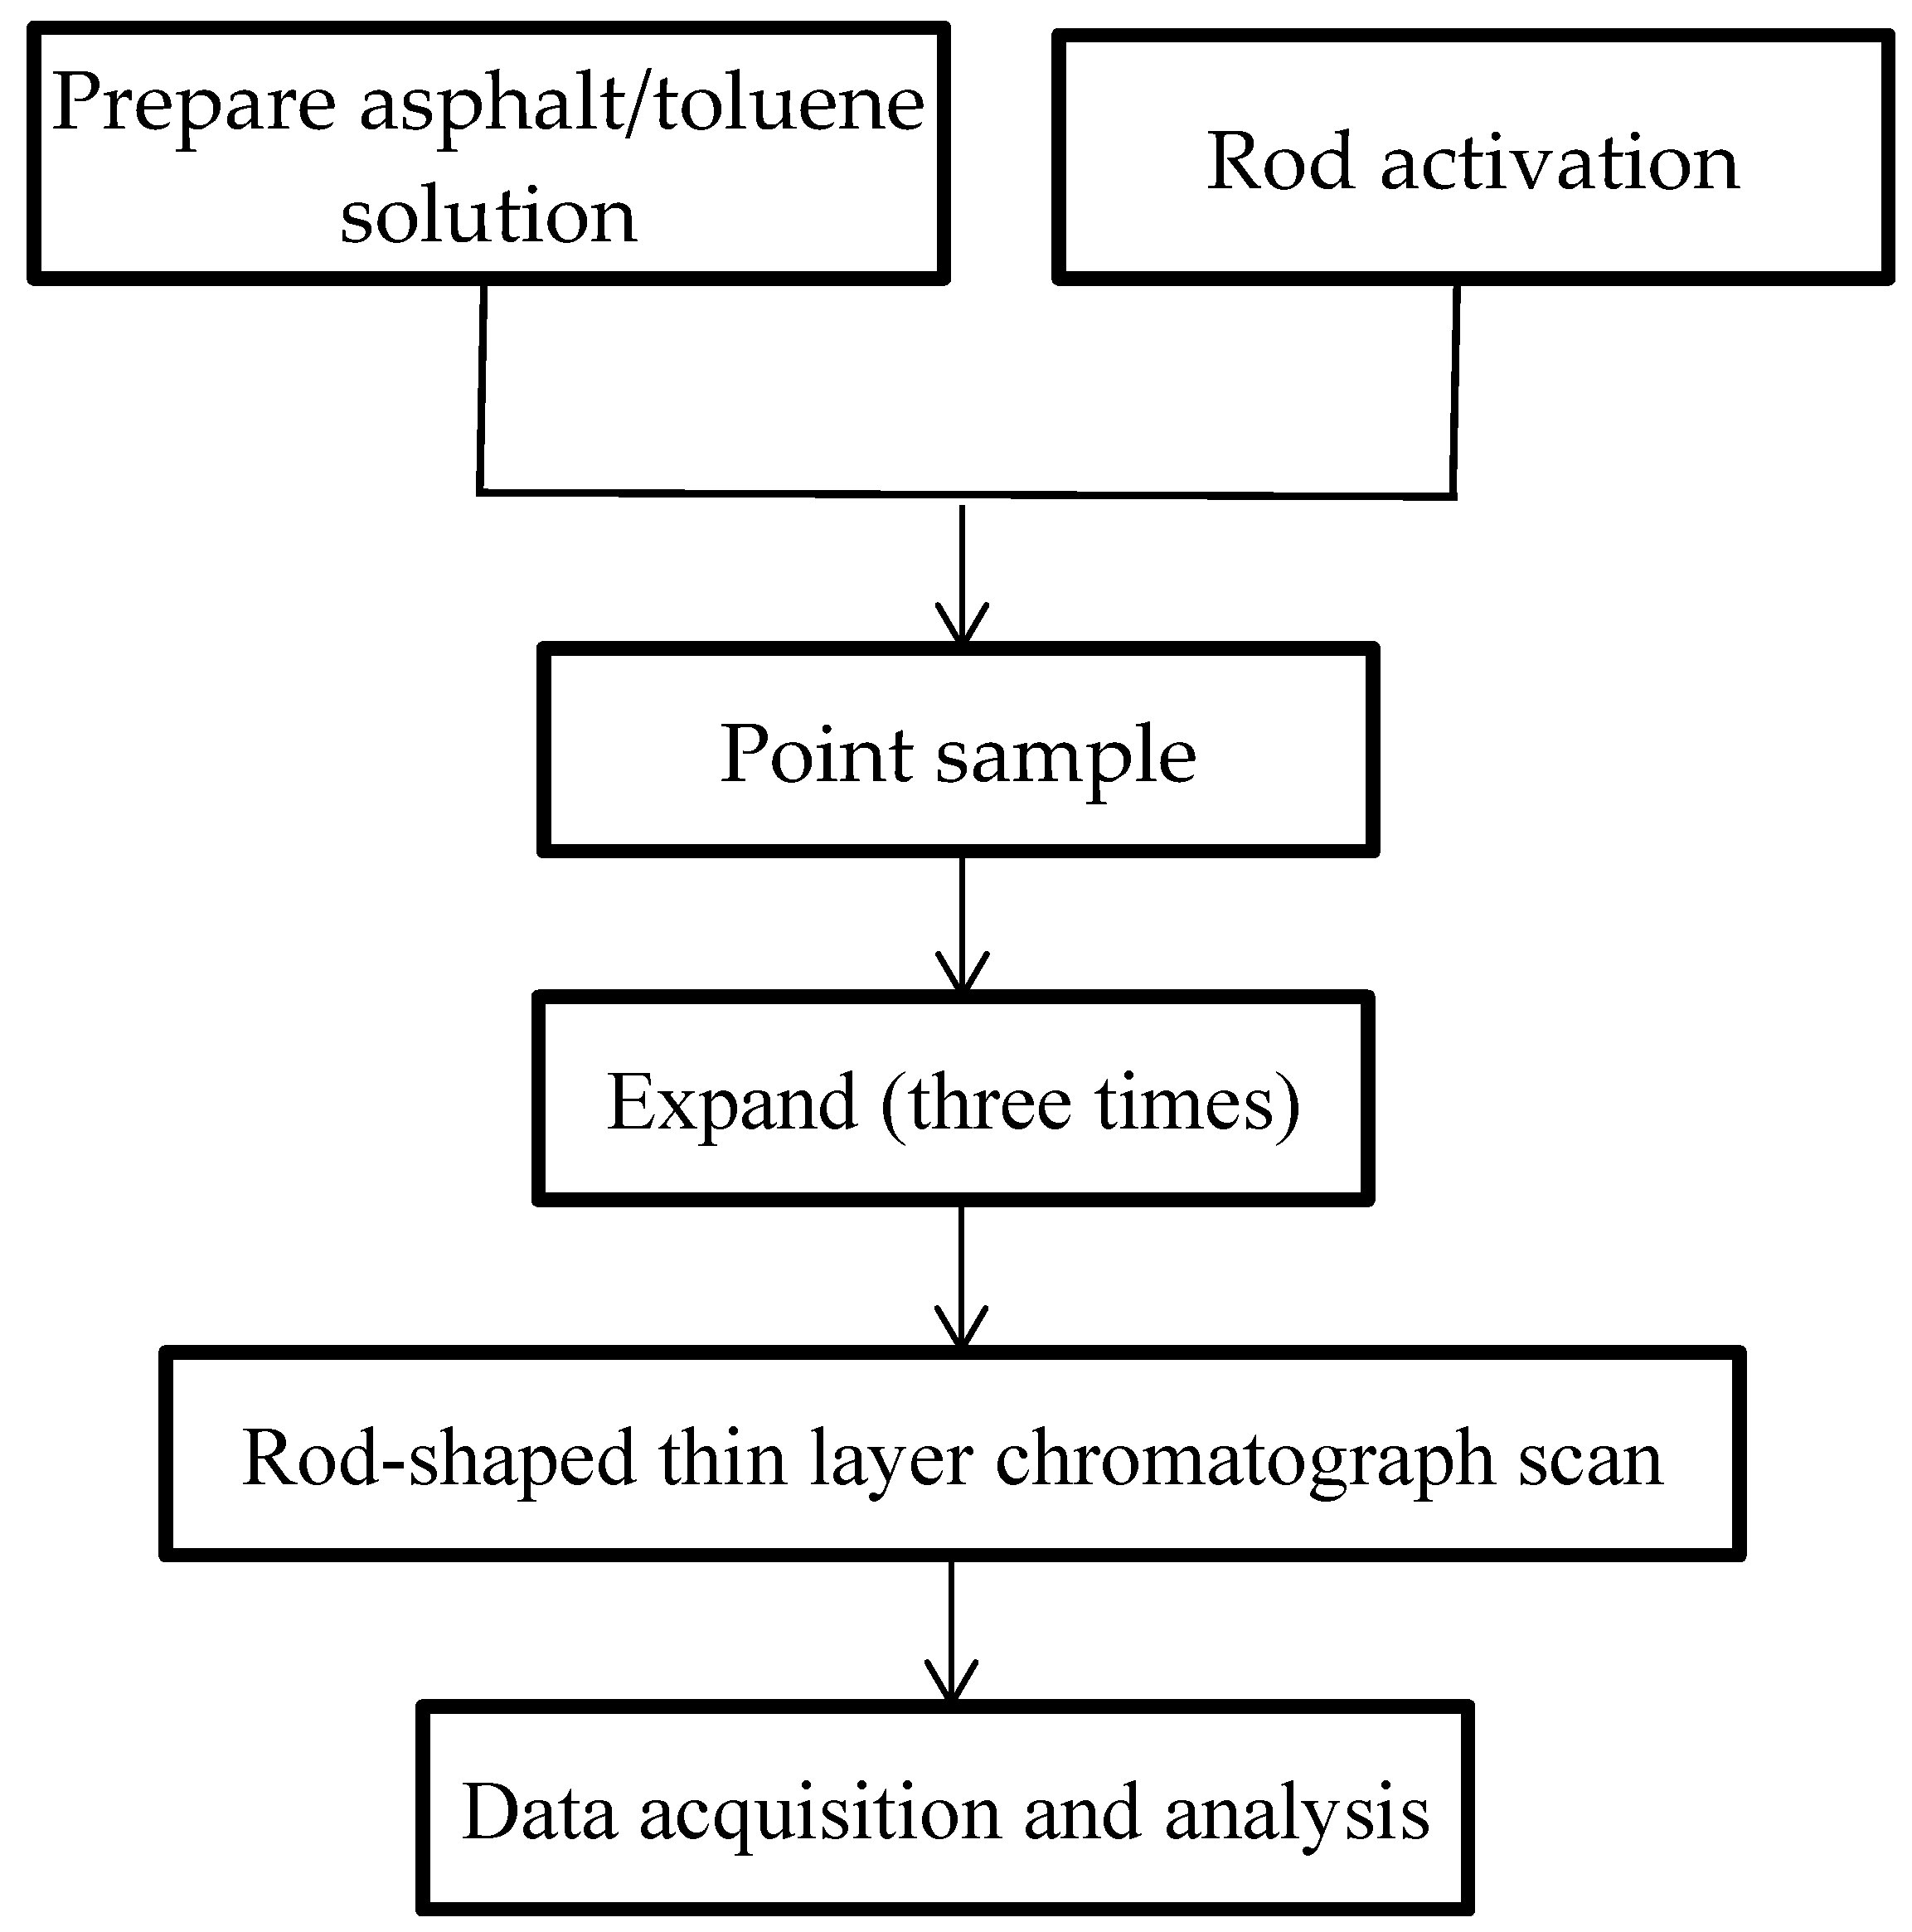
2.2.5. Rod-Shaped Thin-Layer Chromatography Test
3. Results and Discussion
3.1. Study on the Service Performance of a Field Test Road Based on ALT
3.1.1. Temperature Variation in Asphalt Pavement
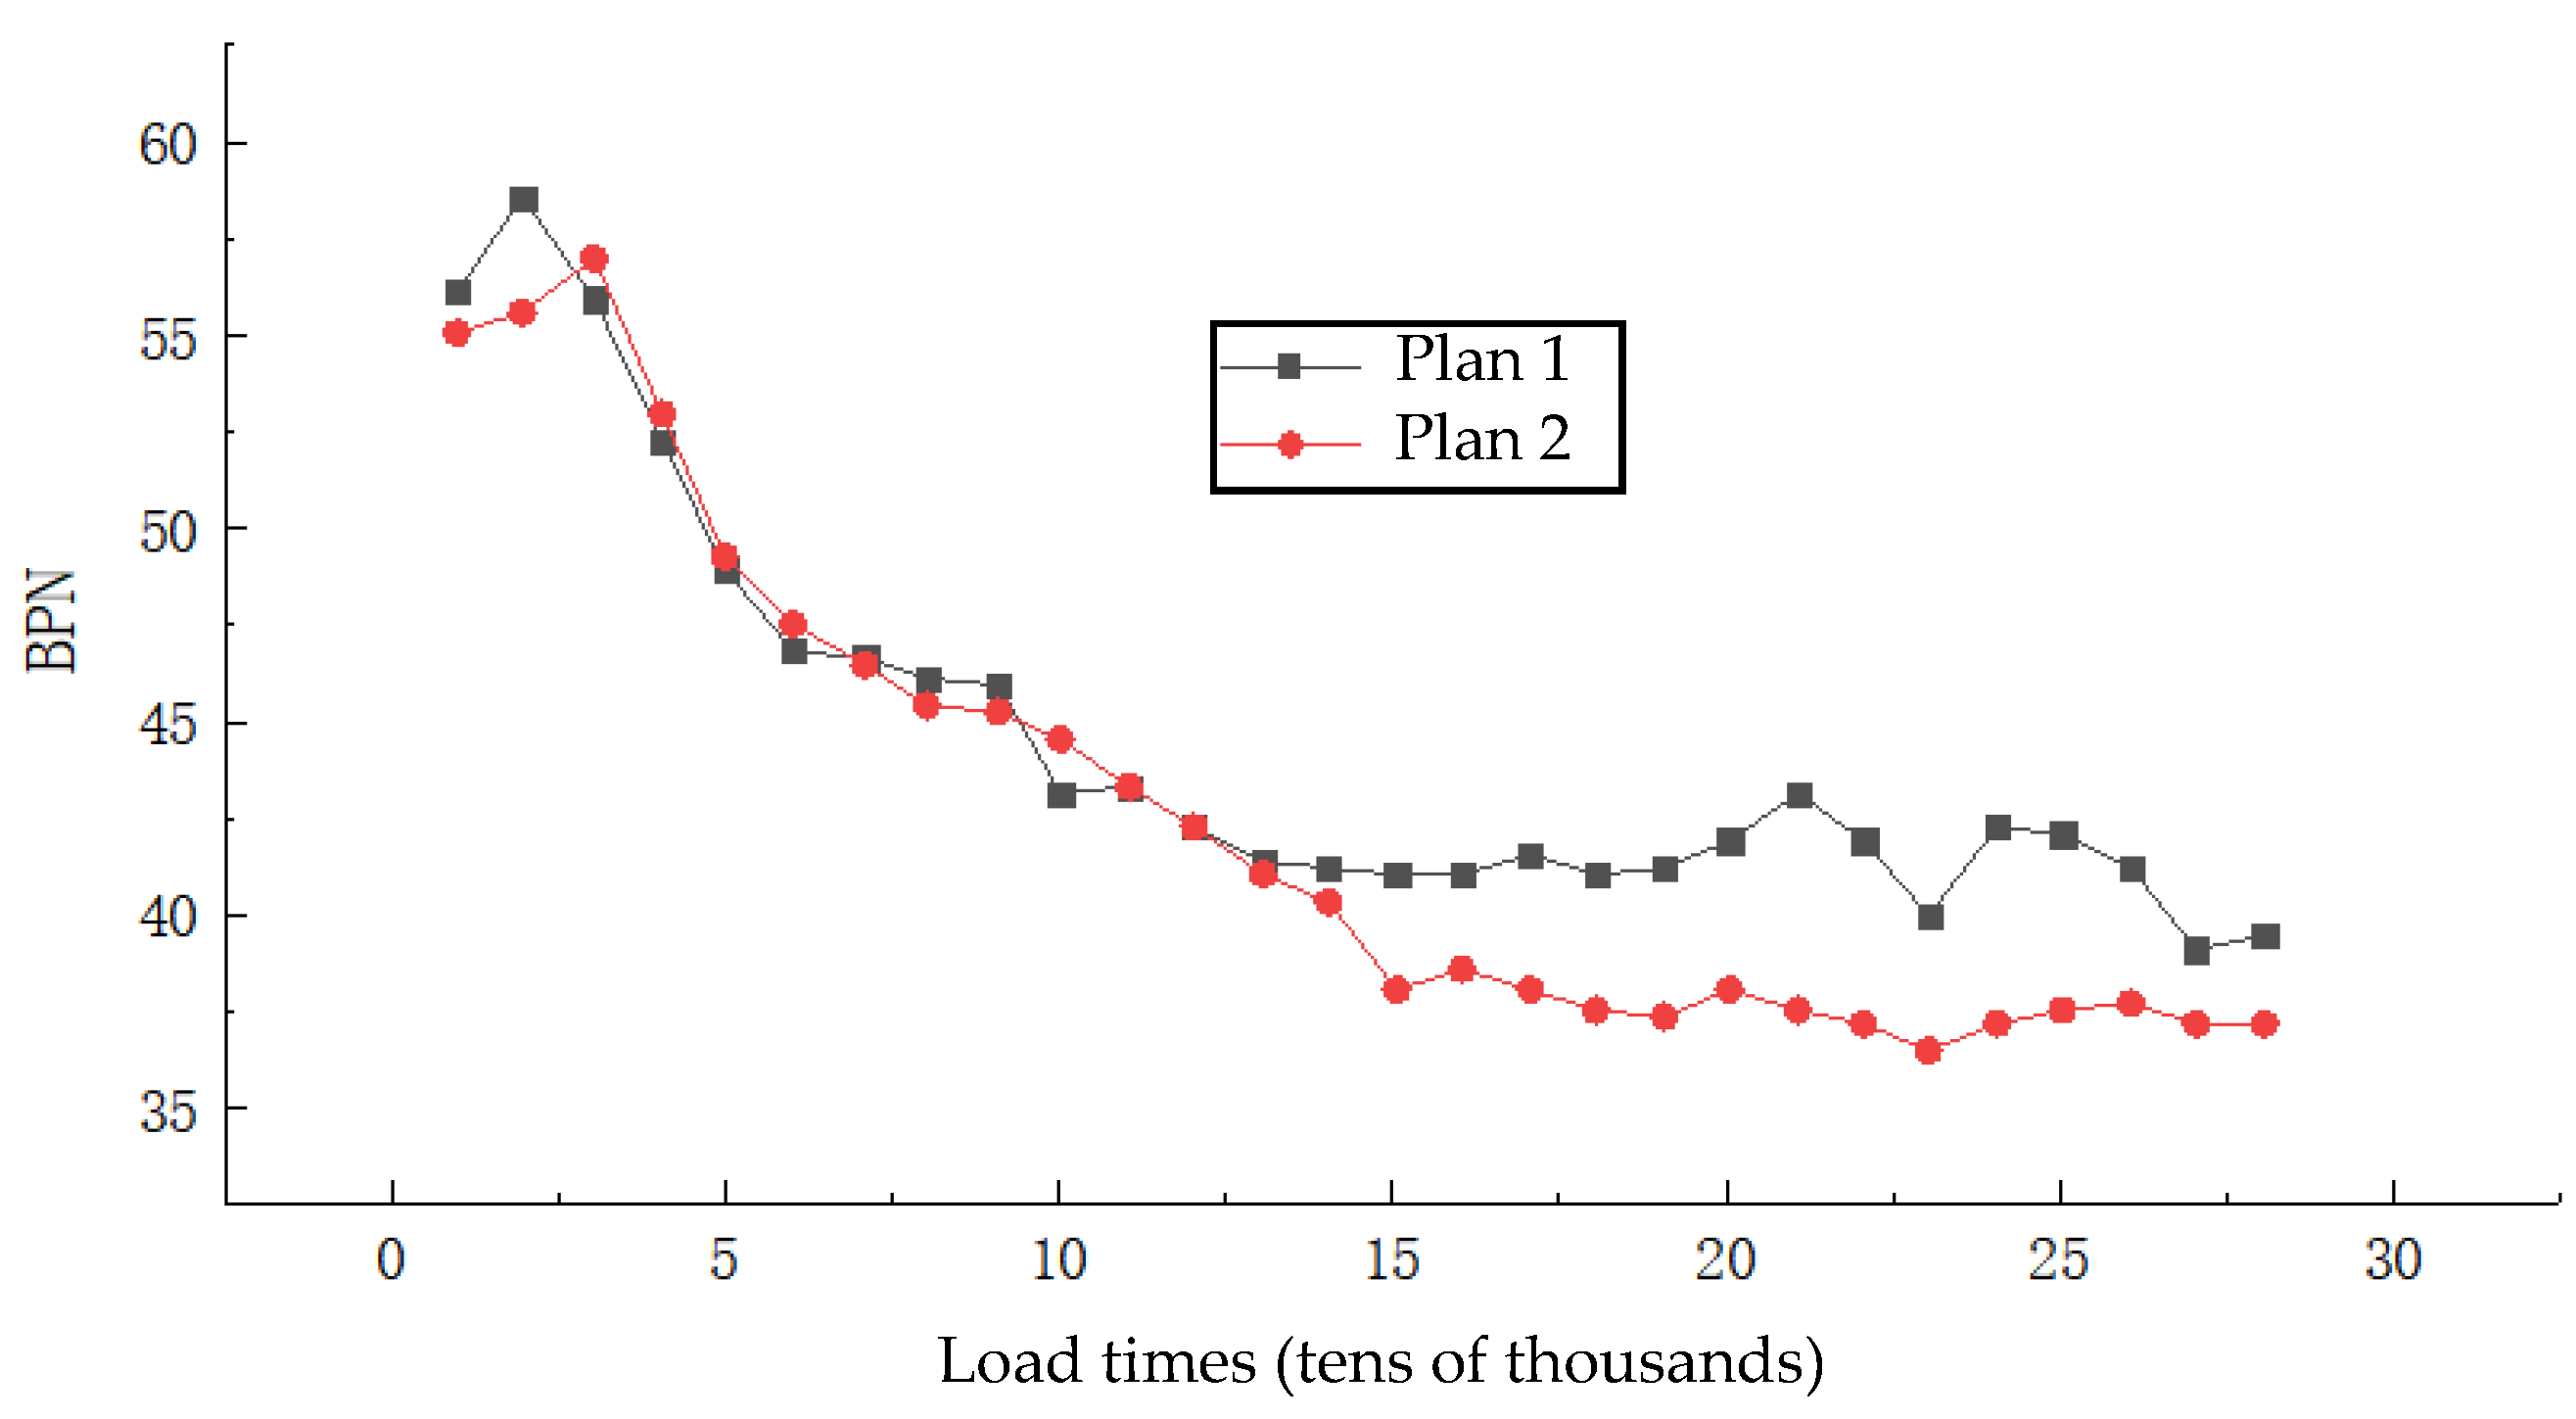
3.1.2. Skid Resistance Variation in Asphalt Pavement
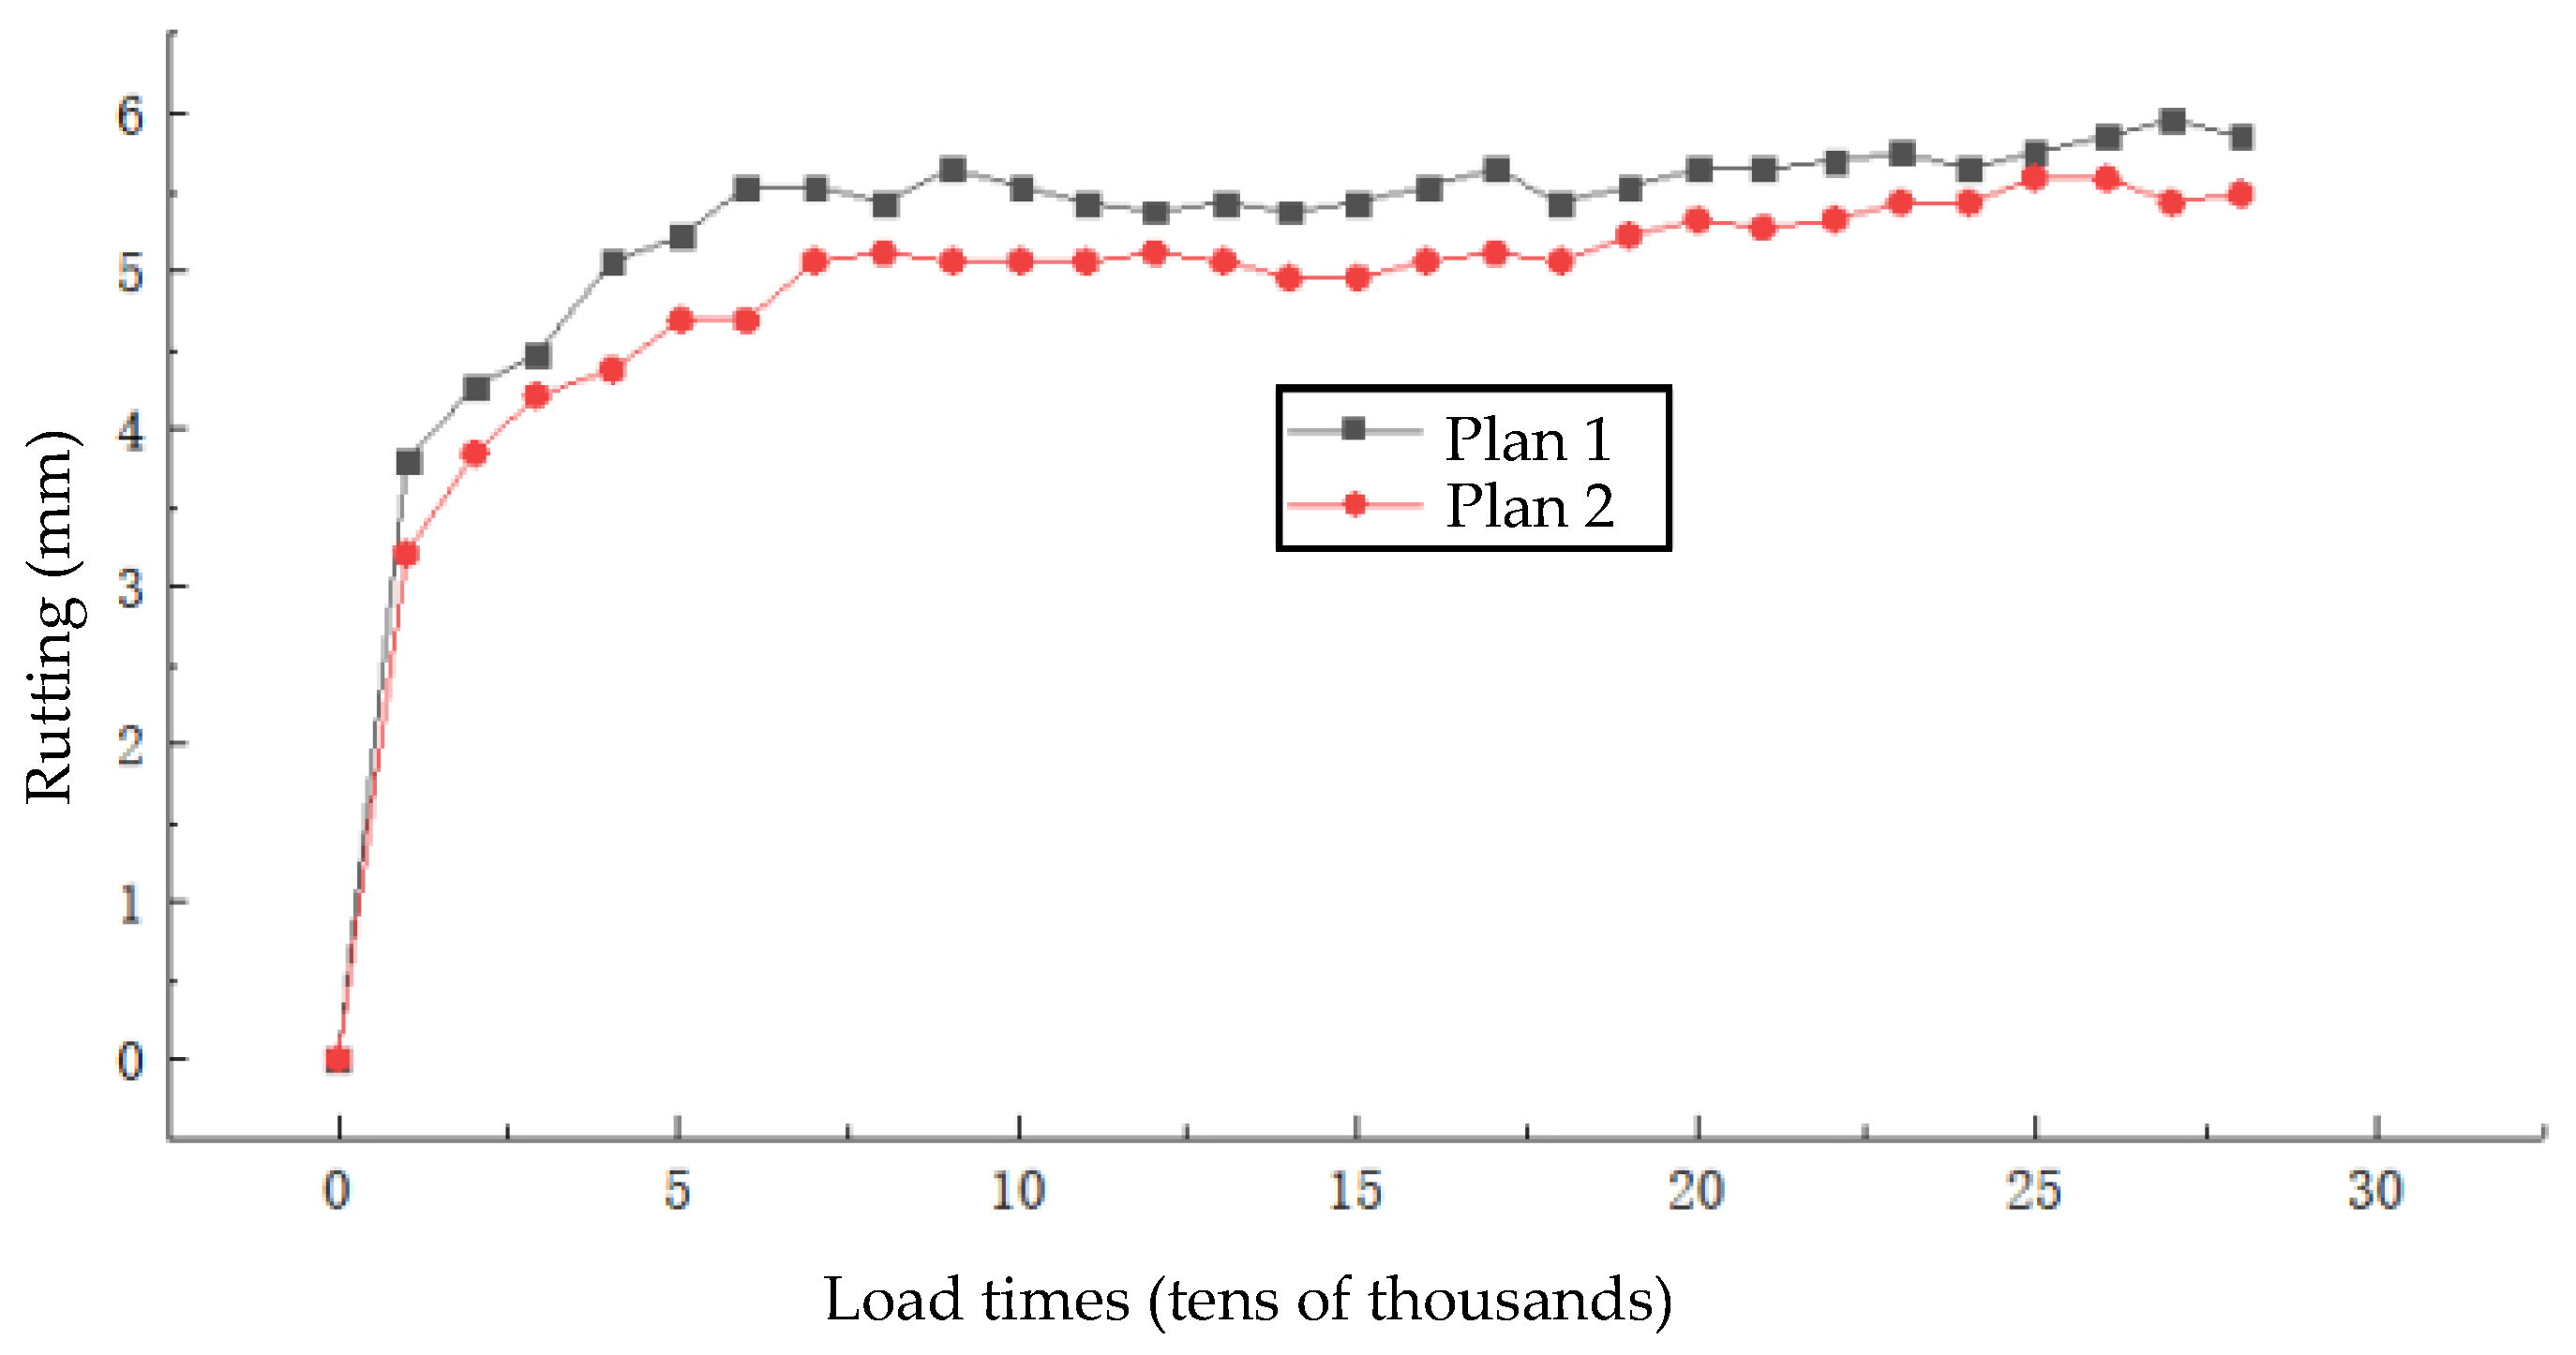
3.1.3. Rutting Variation in Asphalt Pavement
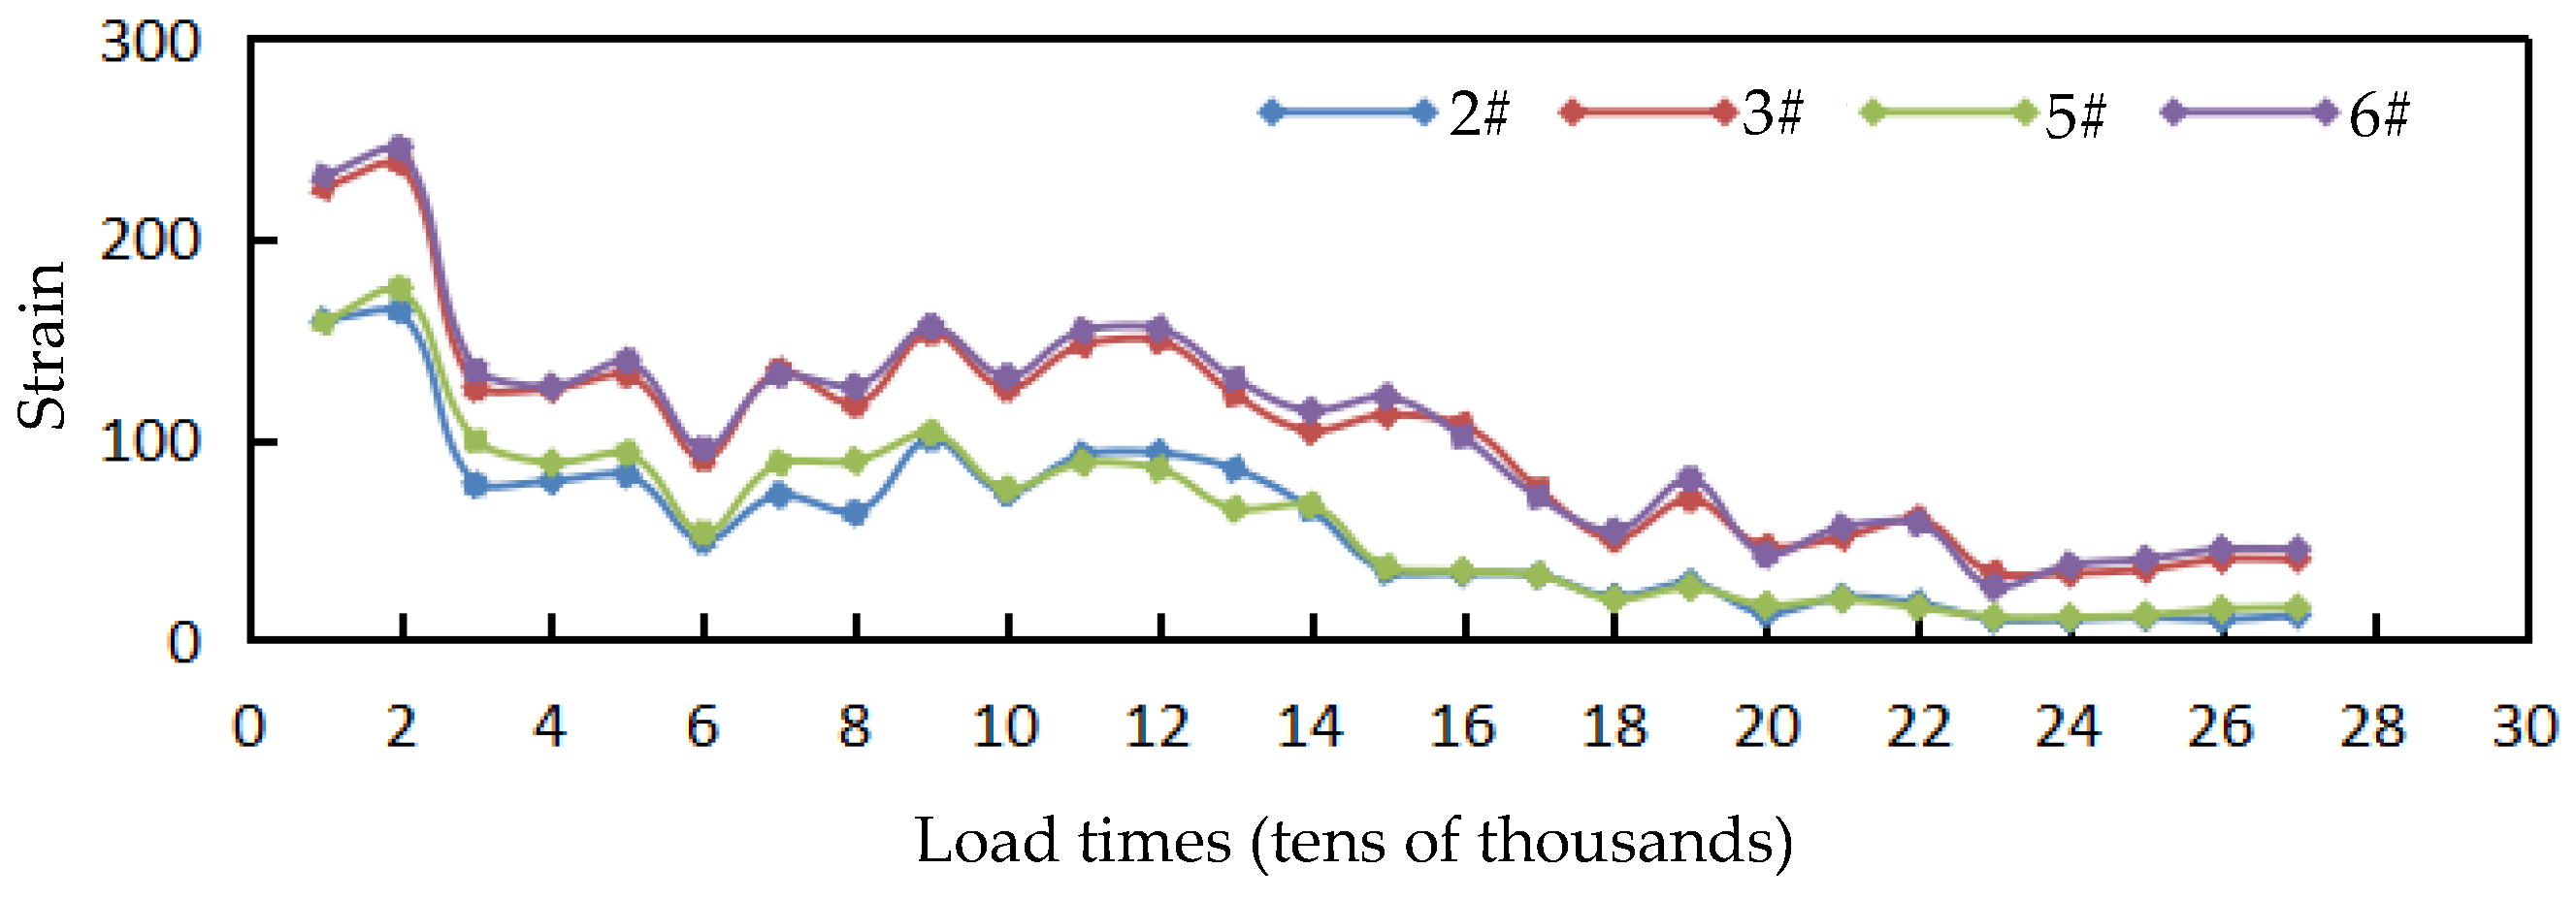
3.1.4. Strain Variation in Asphalt Pavement (Bottom Layer)
3.2. Analysis of the Load–Deflection Relationship
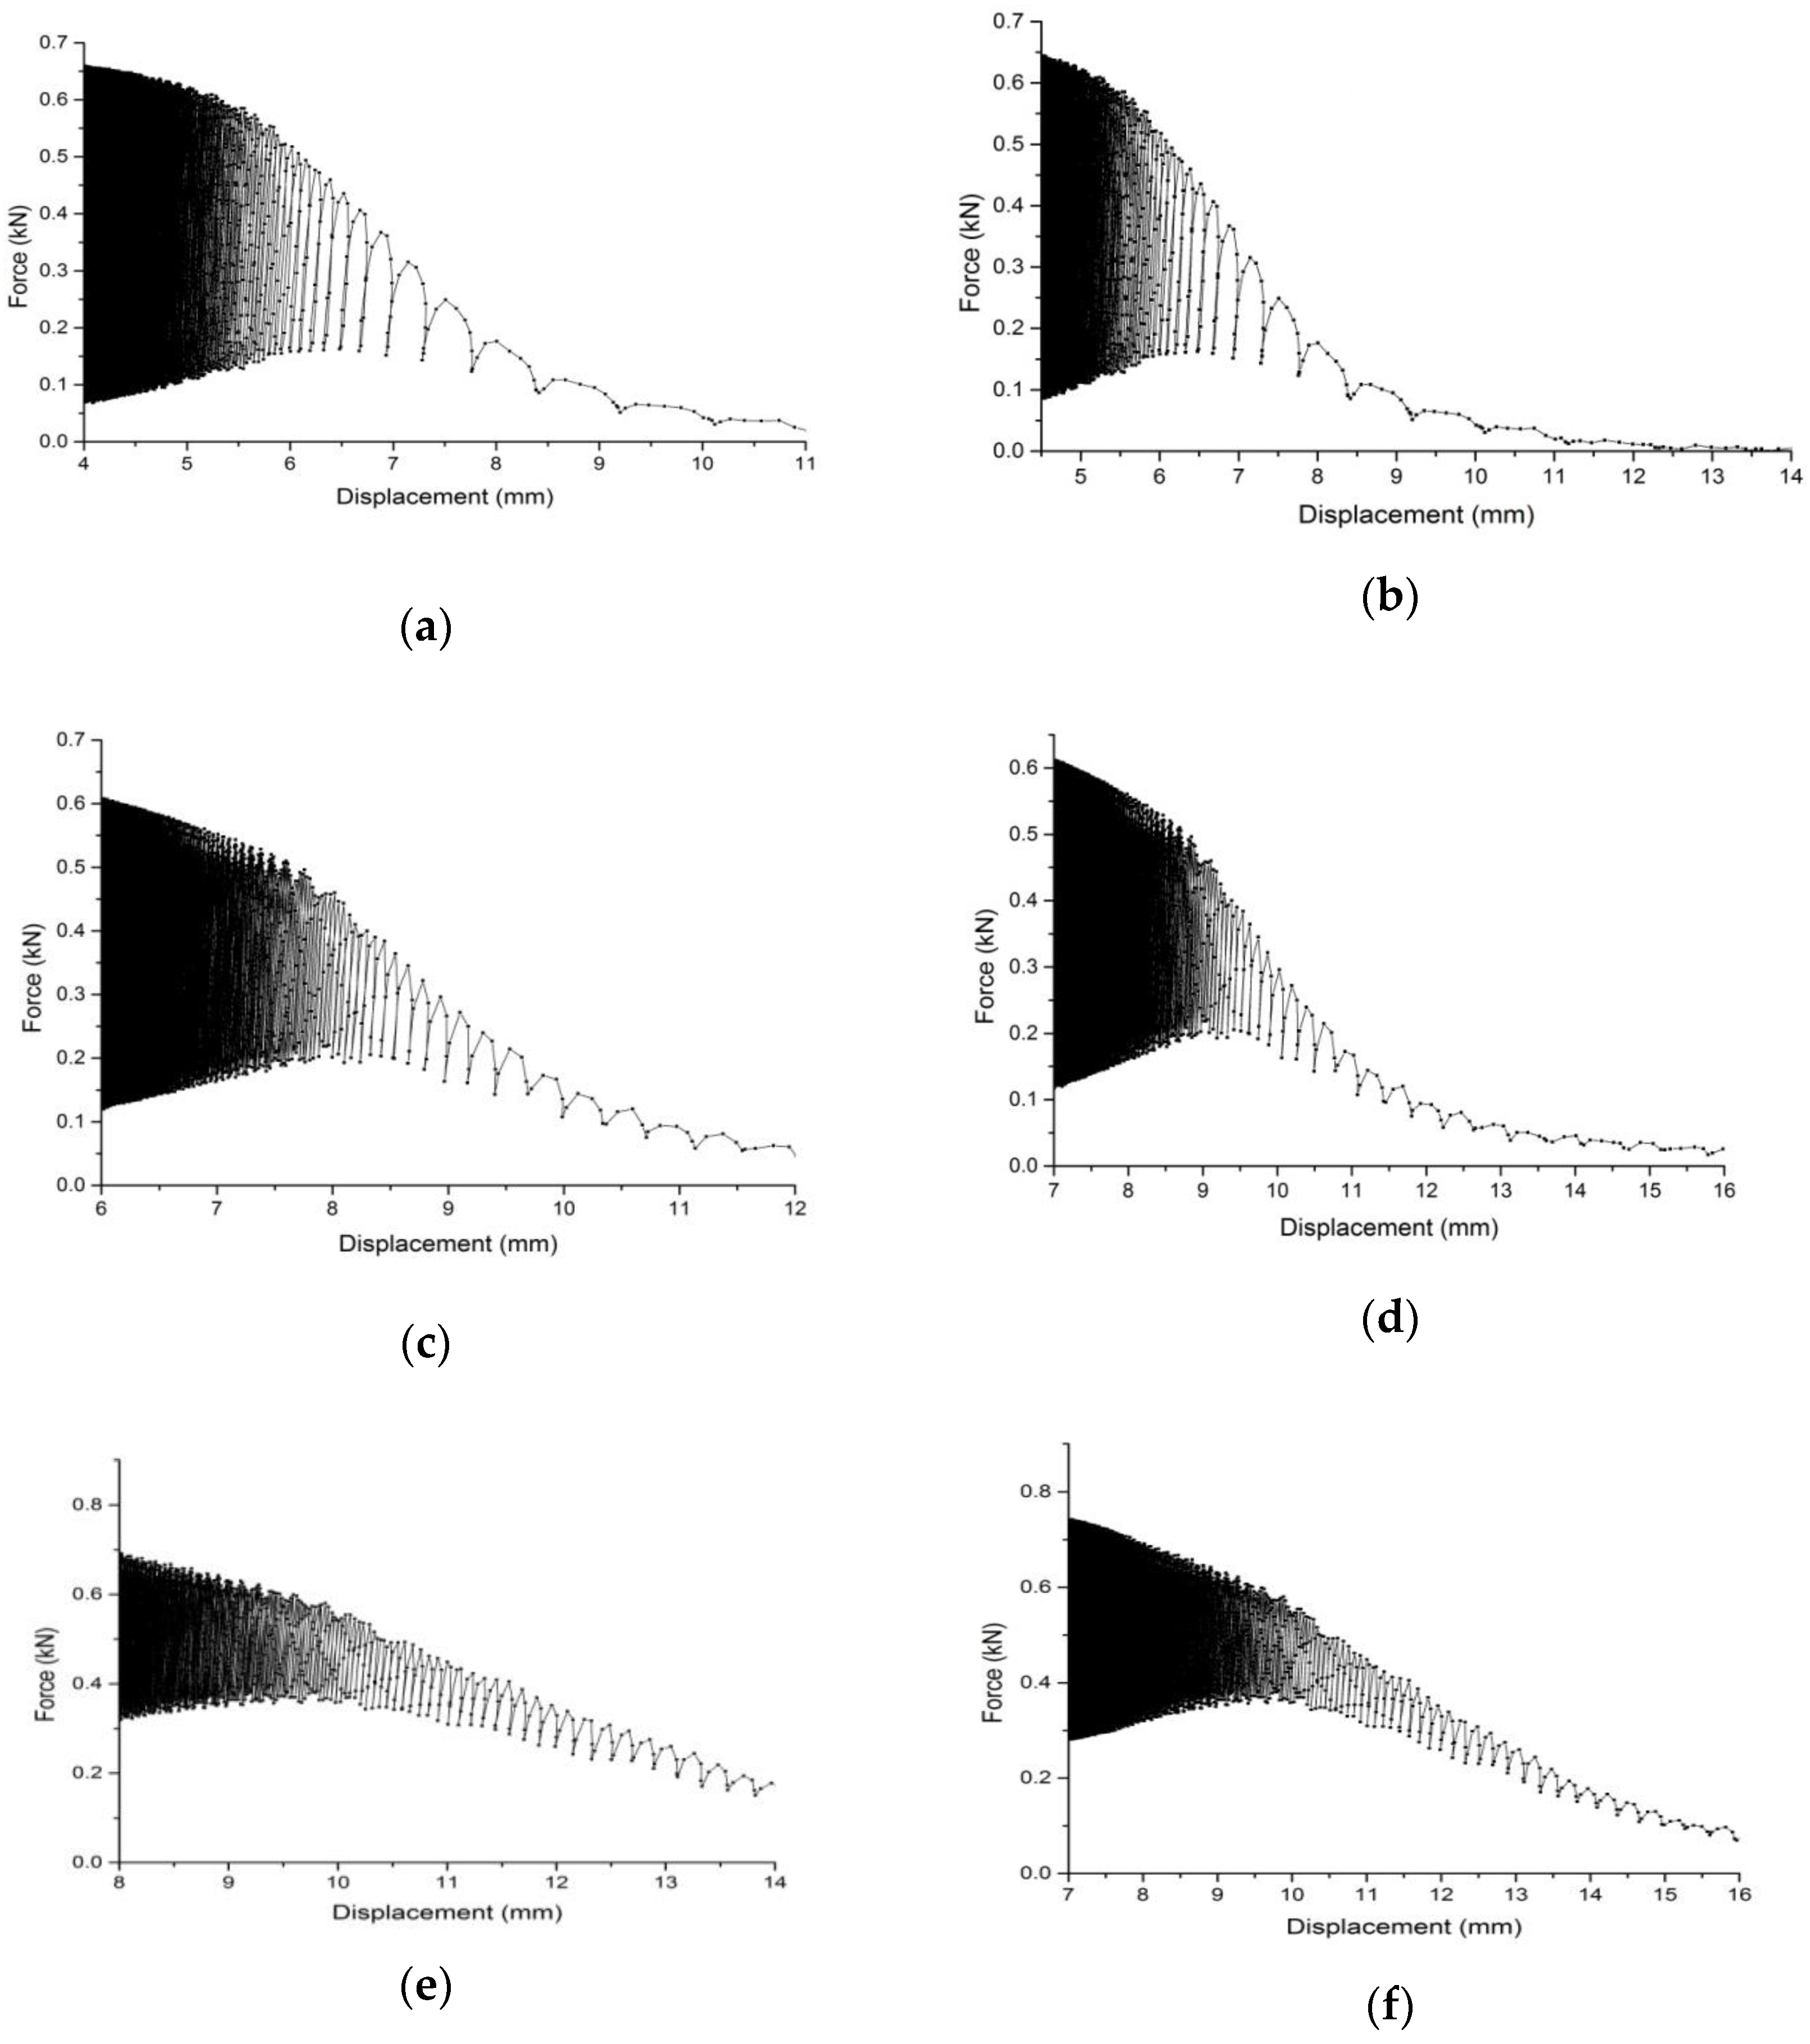
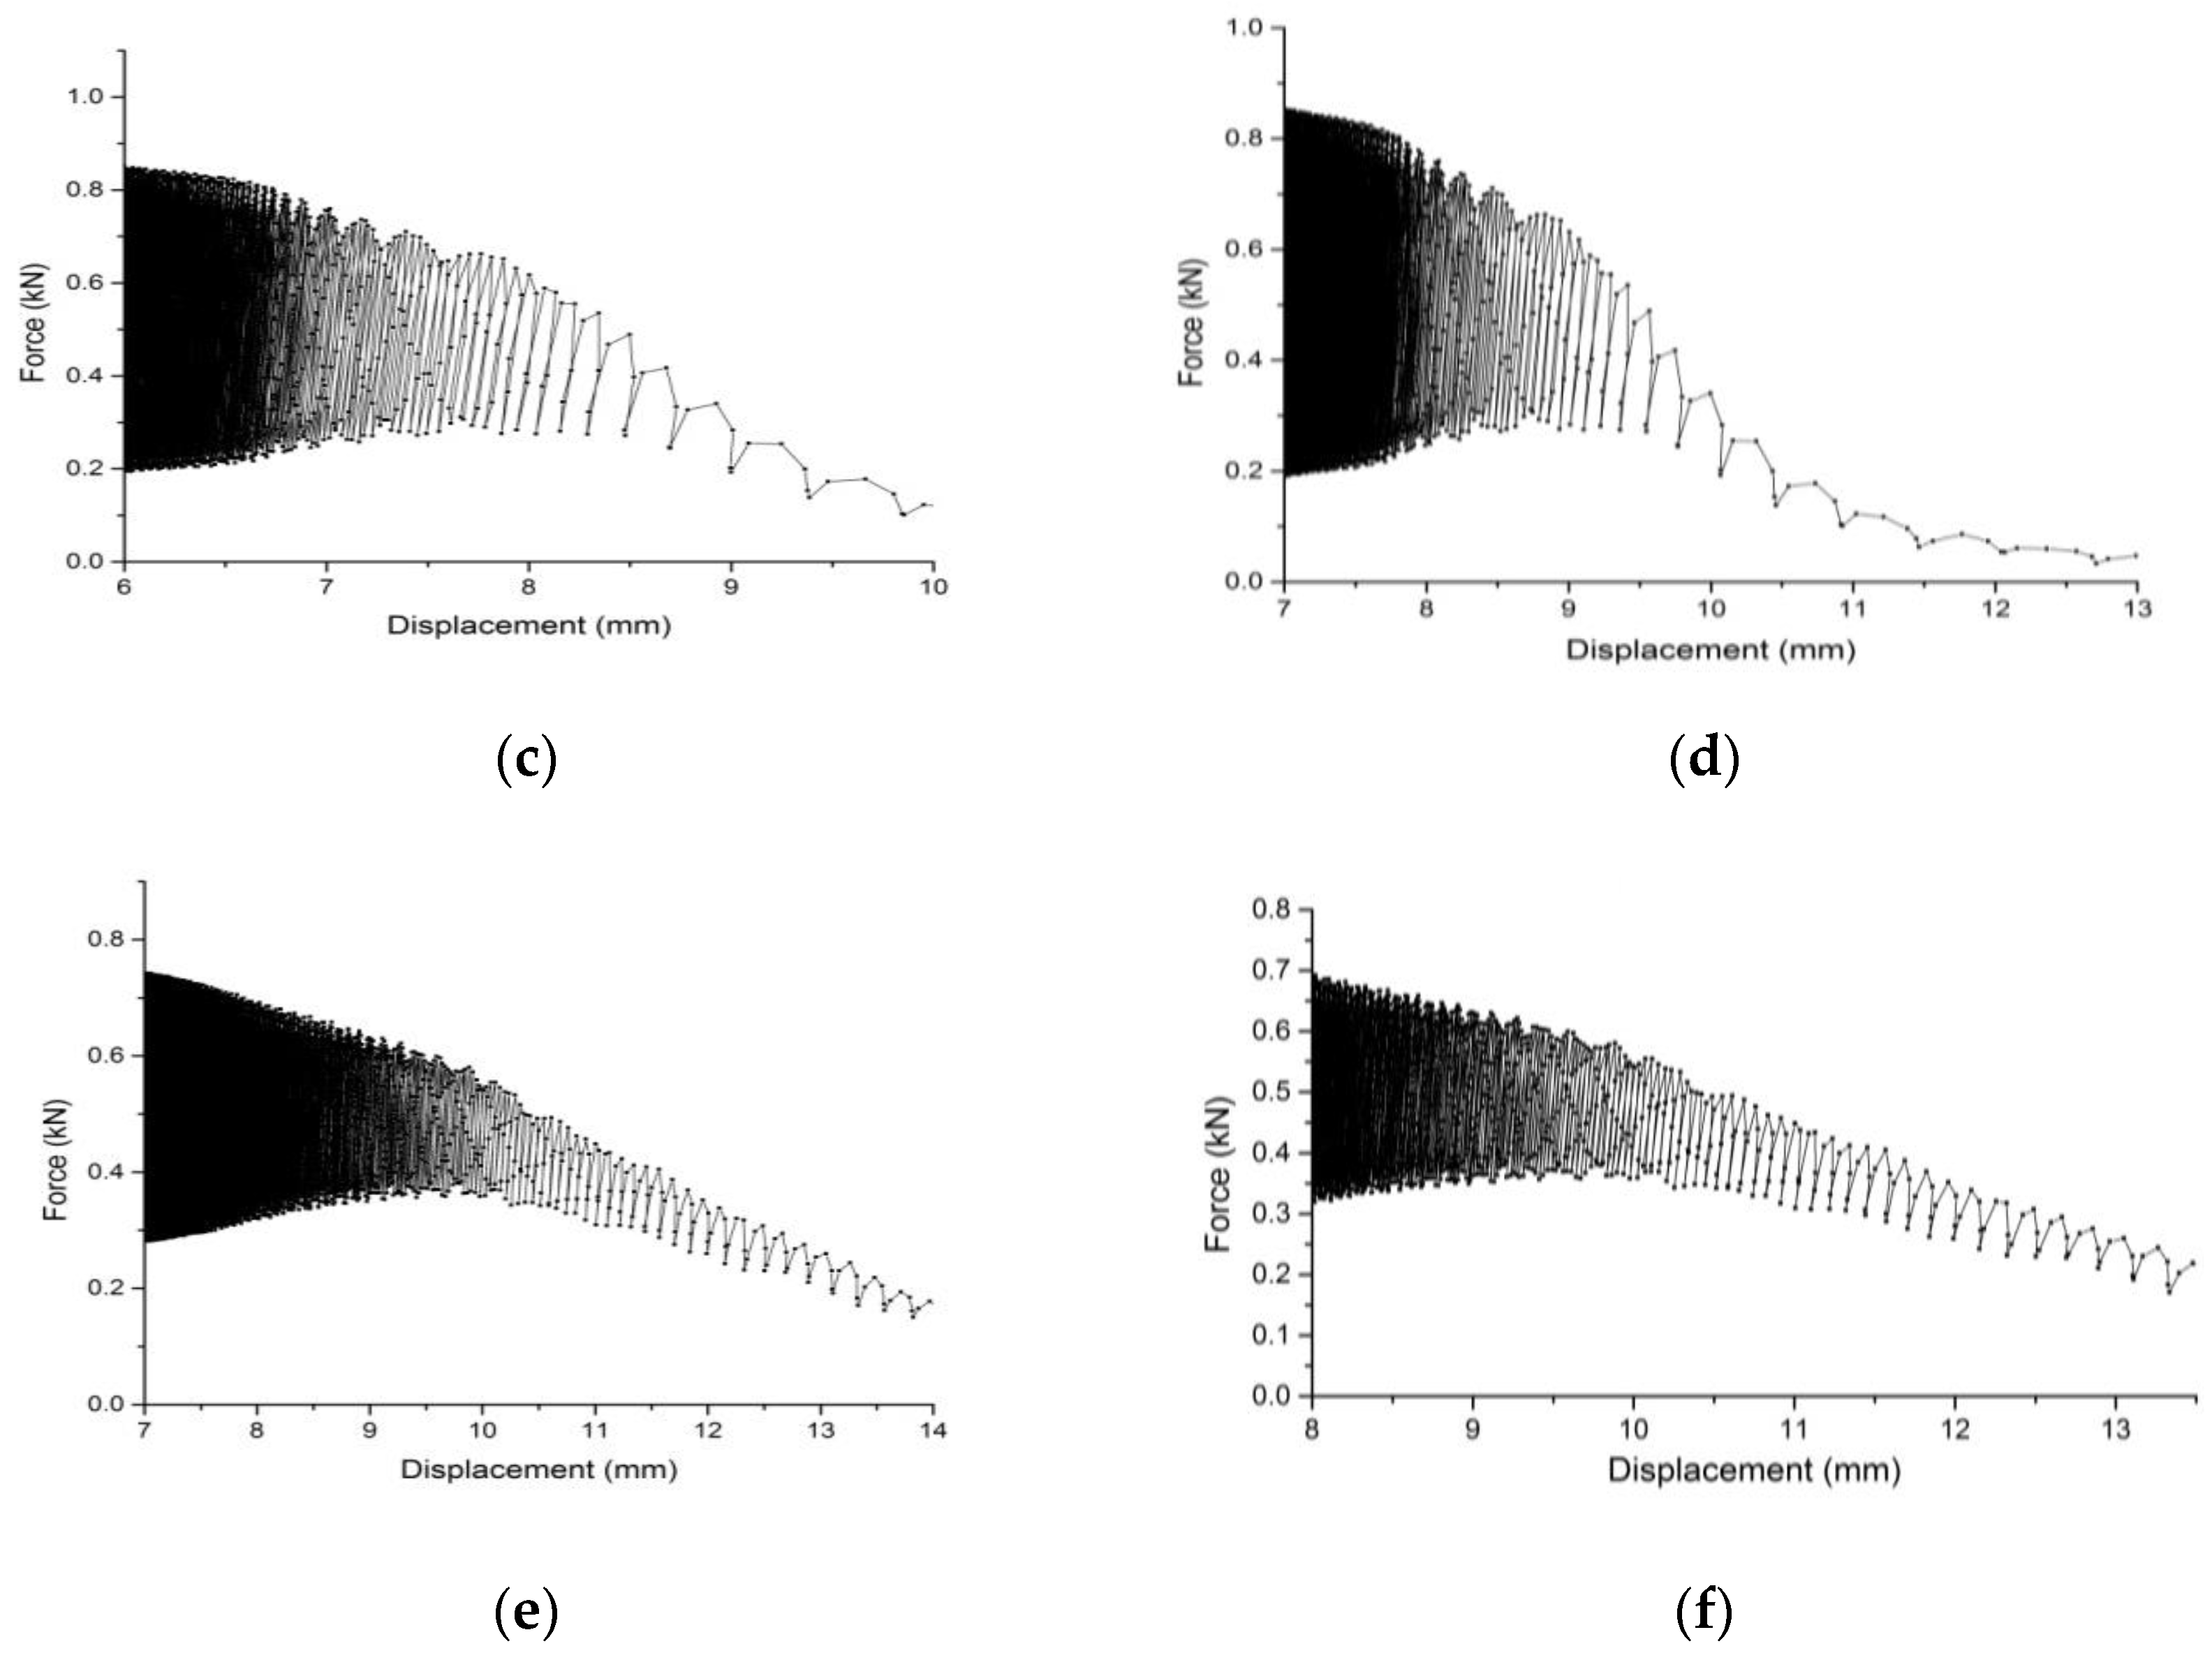
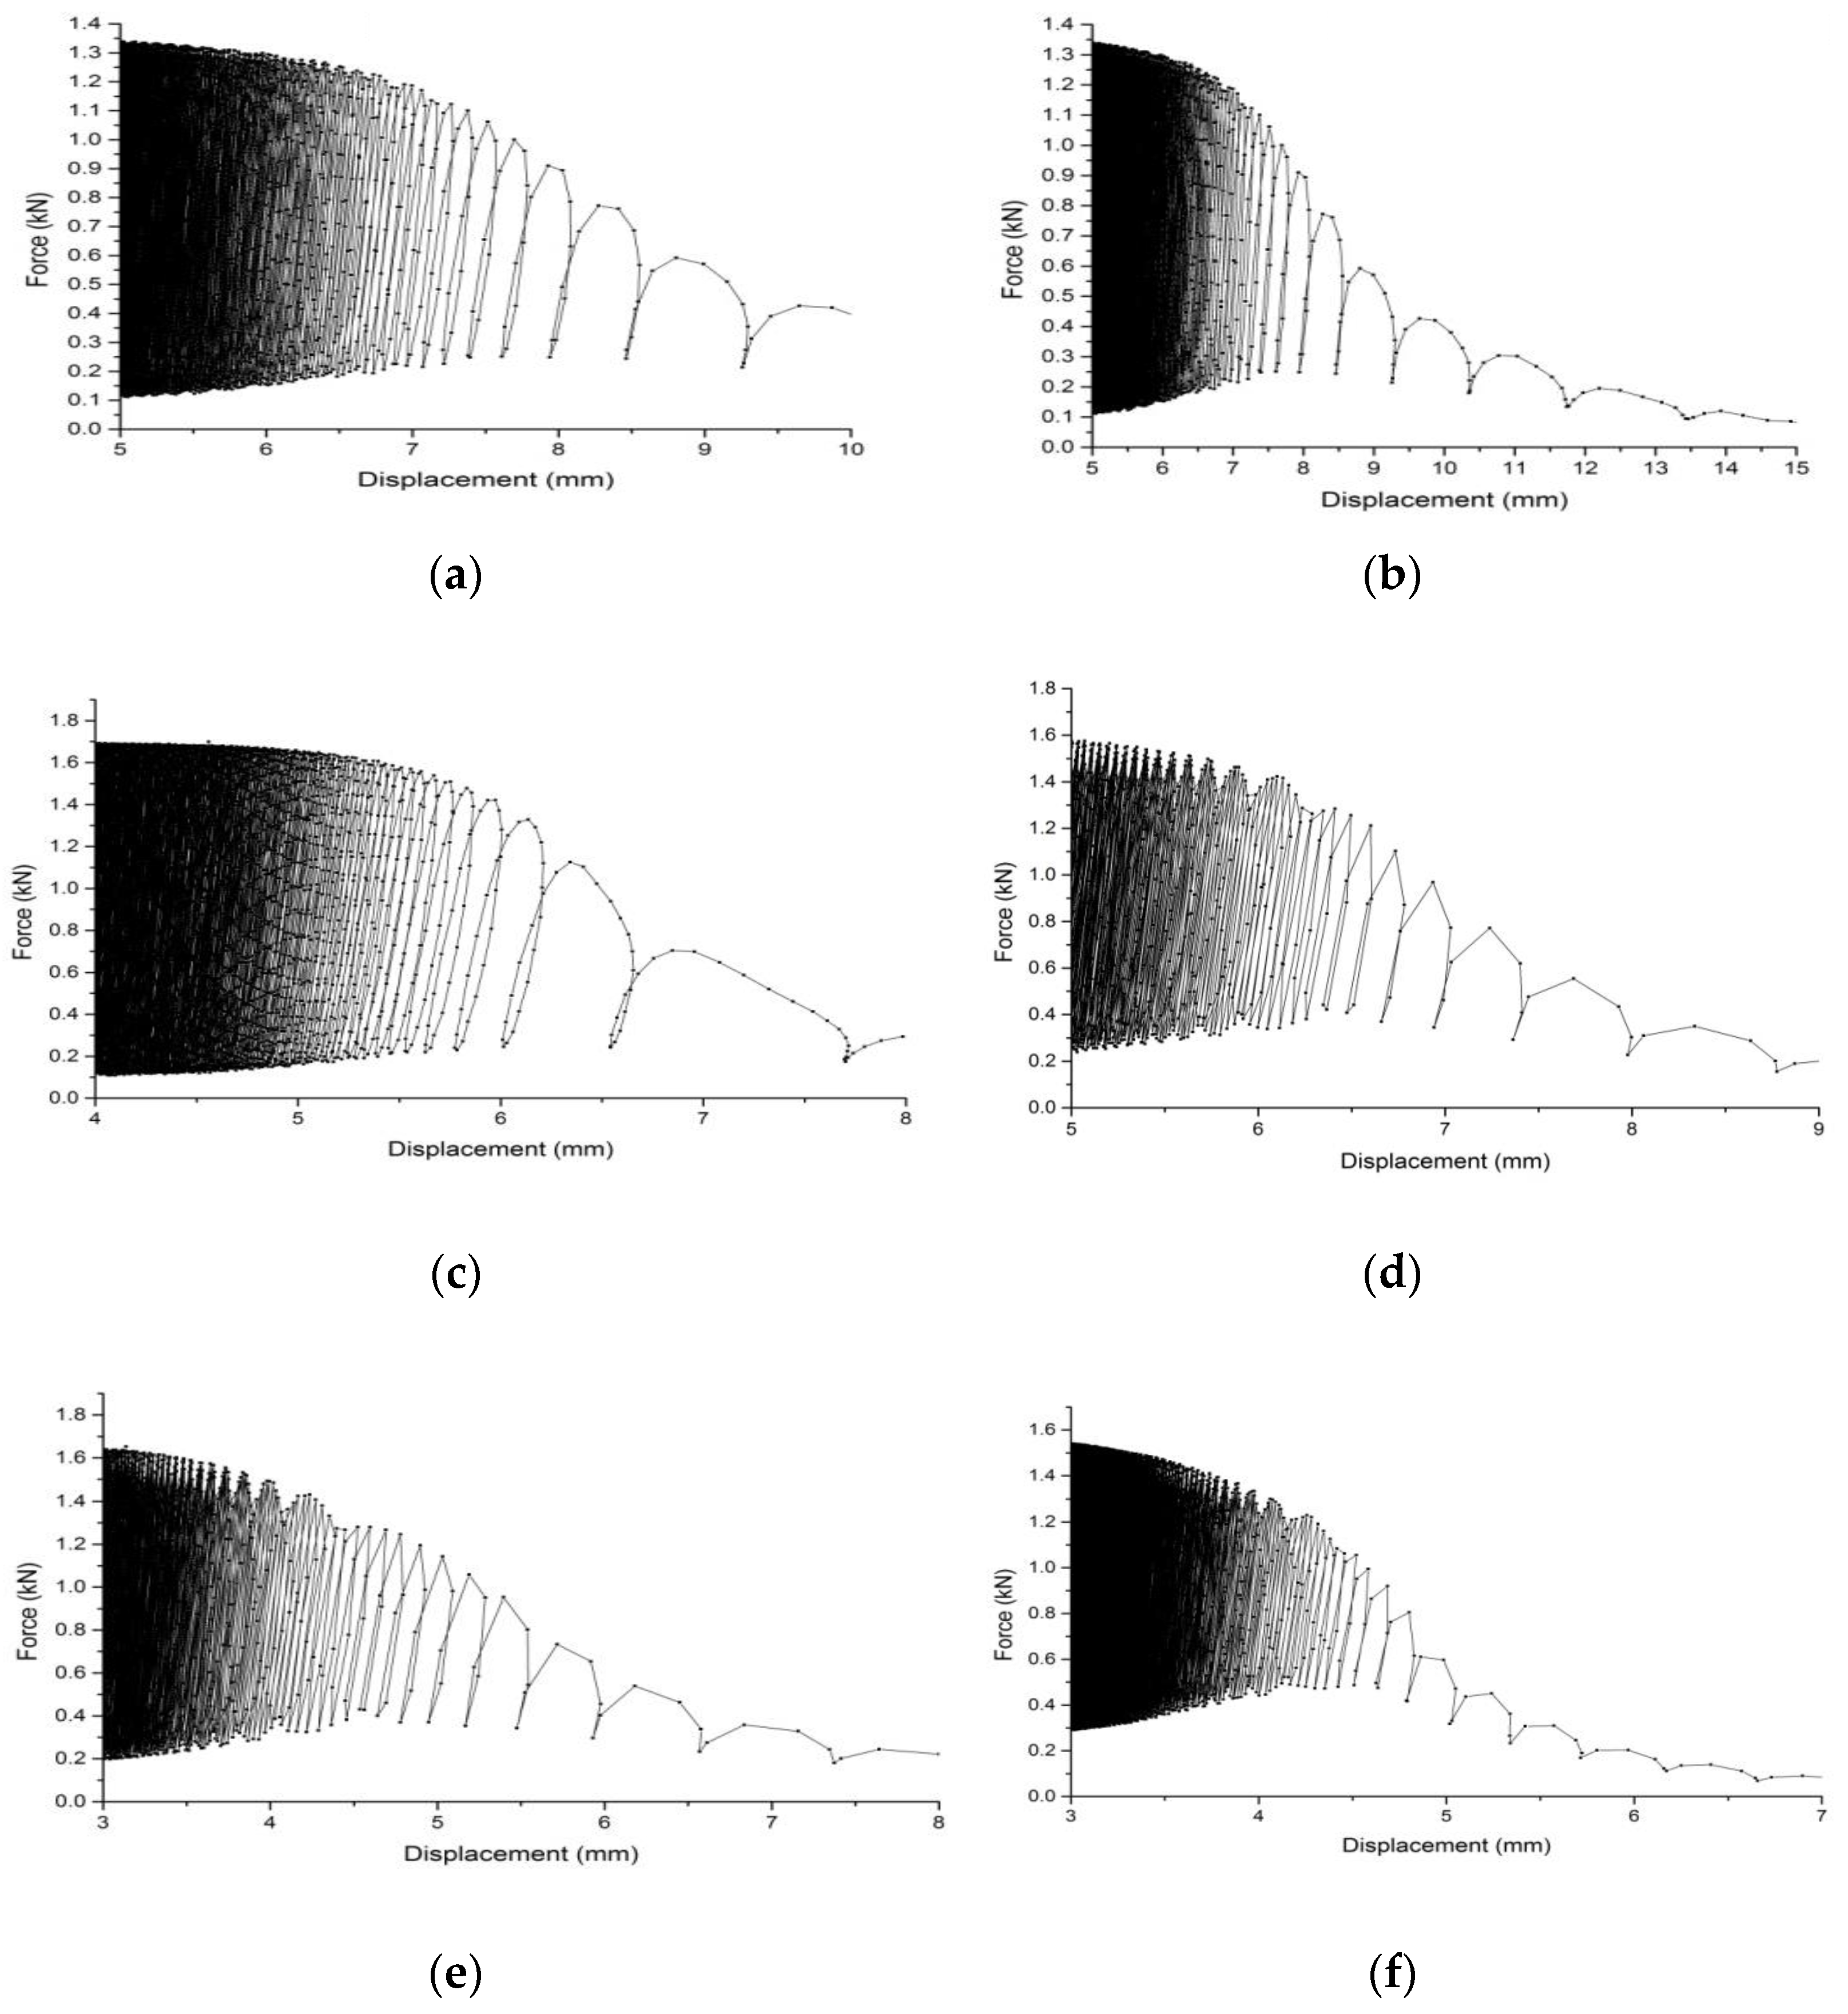
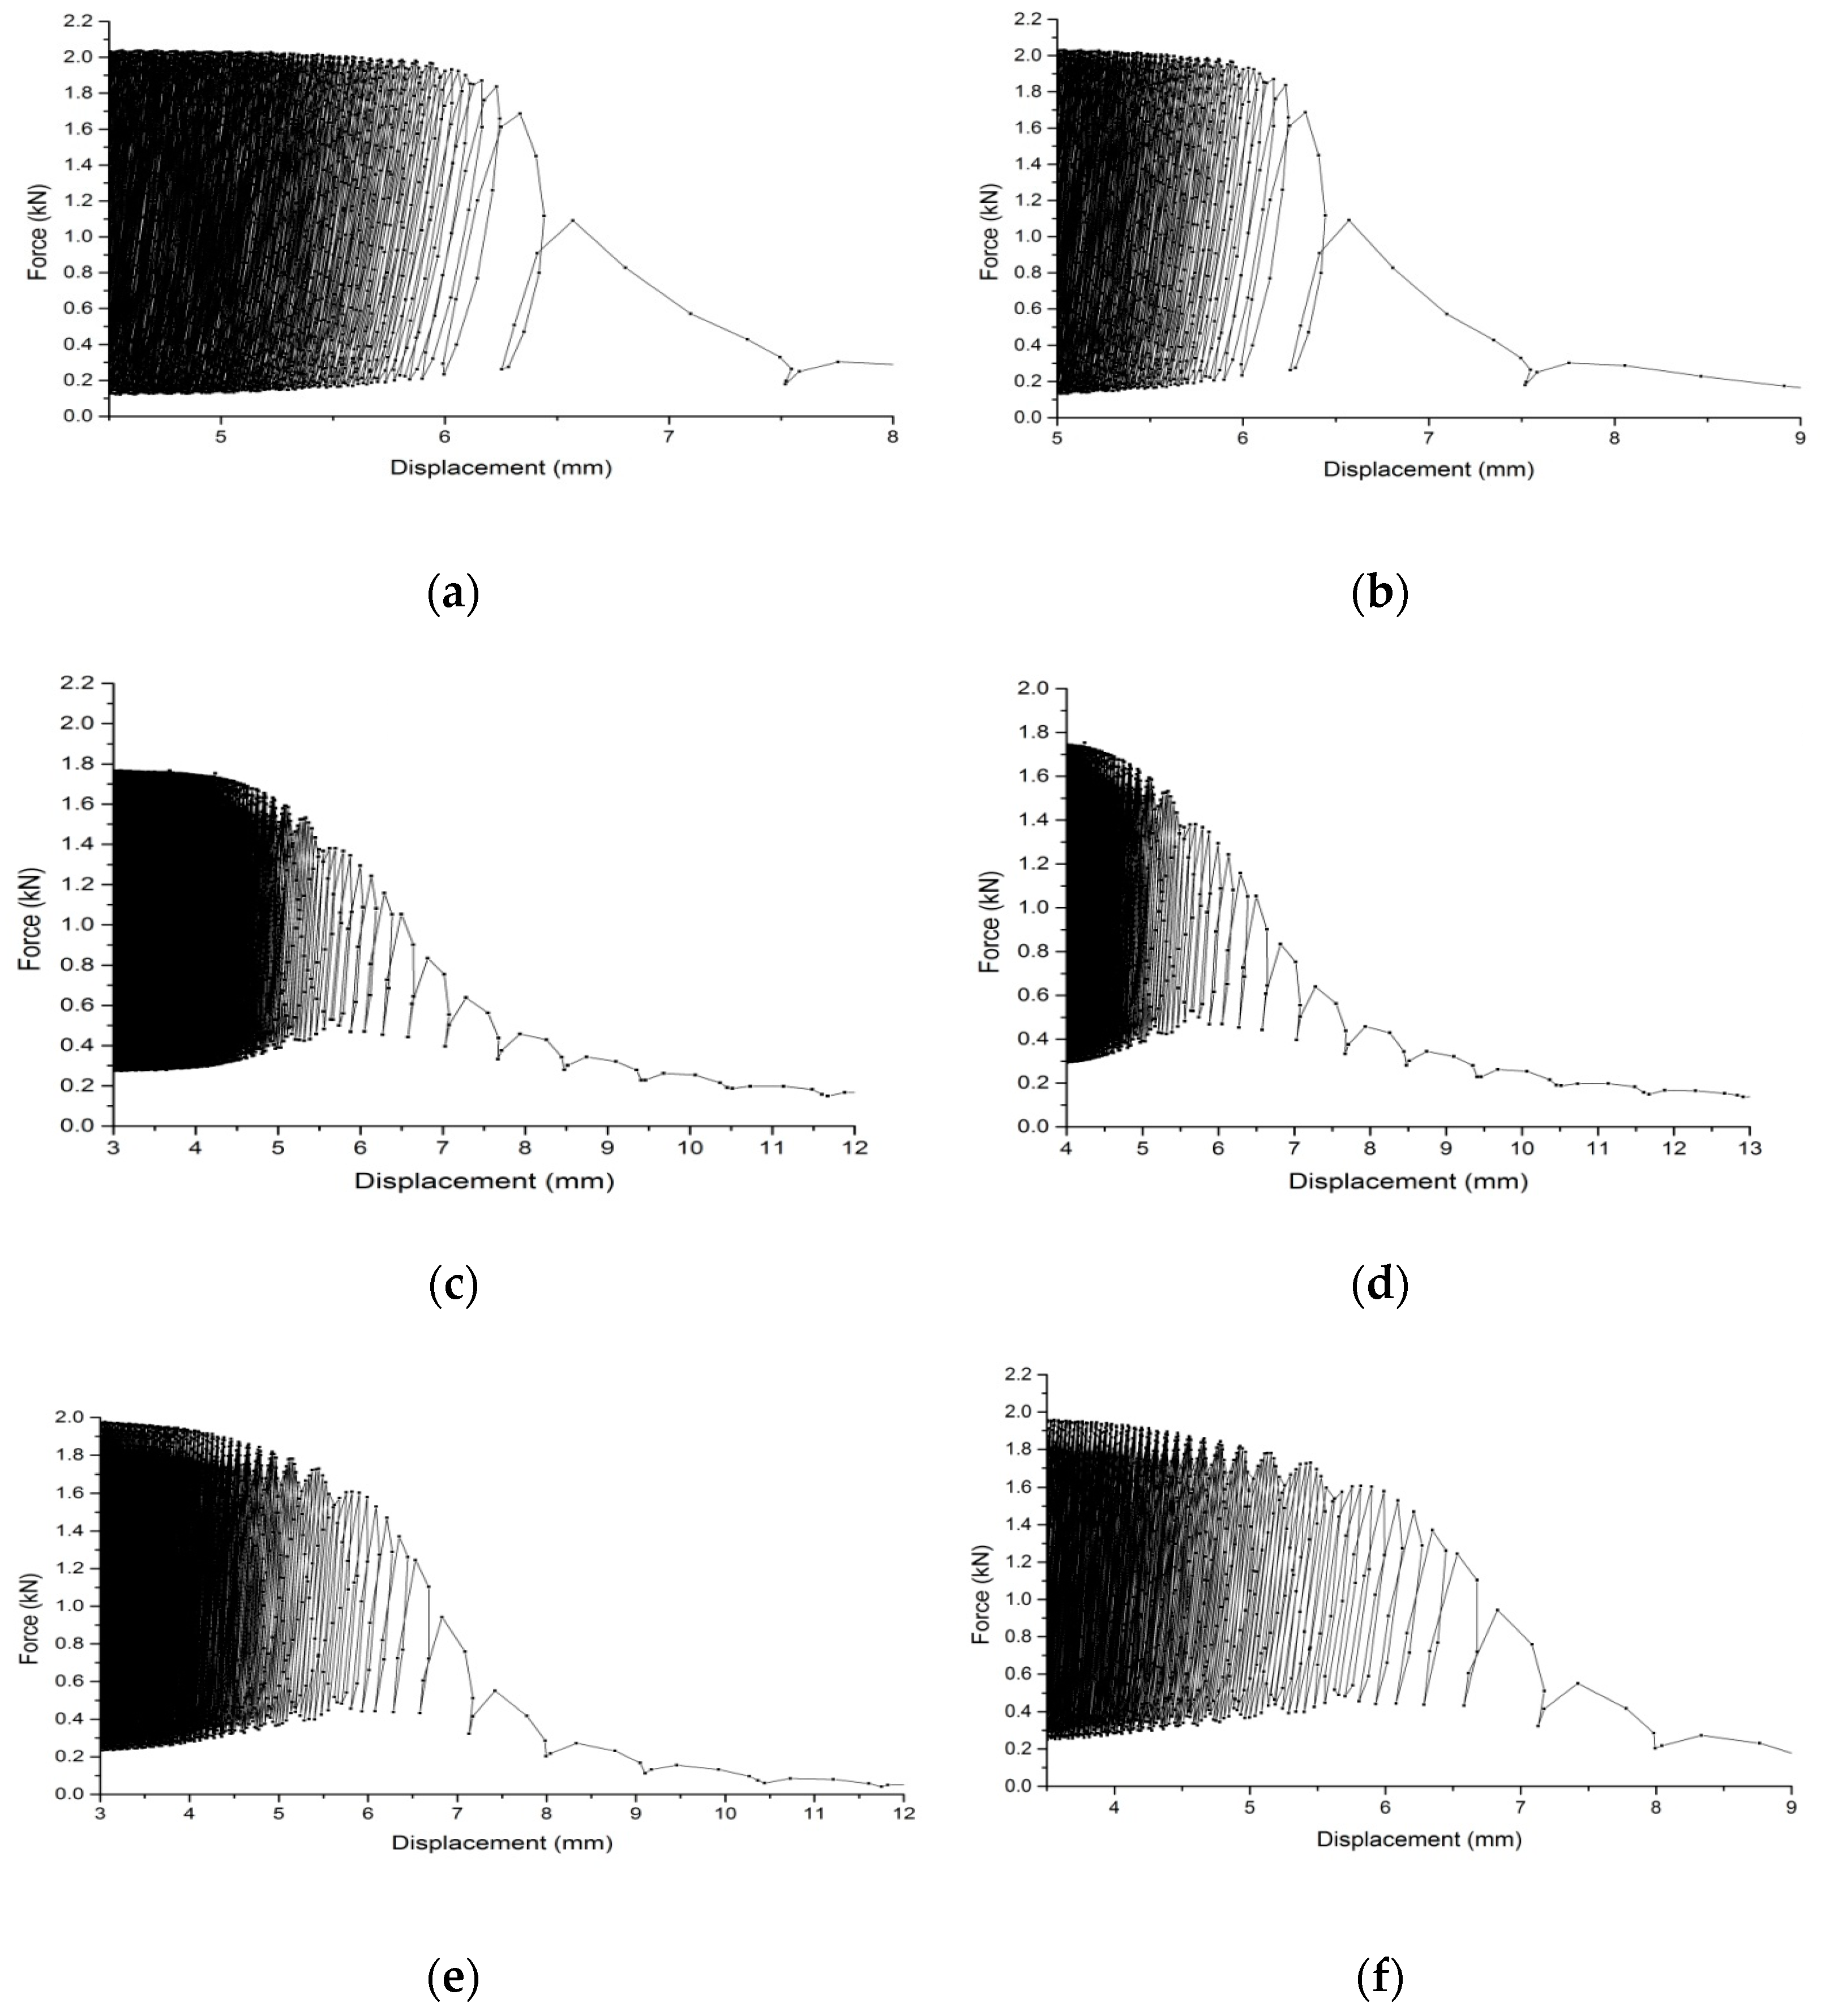
3.2.1. Analysis of the Load–Deflection Relationship
- (1)
- When the stress ratio was 0.2, 0.3, 0.4, 0.5, and 0.6, the failure forms of the ordinary asphalt mixture and the recycled asphalt mixture were basically the same under different loading frequencies. That is, in the process of repeated loading and unloading, the specimens’ flexural deformation gradually accumulated until fractures occurred.
- (2)
- Under the same stress level and loading frequency, the curve relationships between load and deflection for the ordinary asphalt mixture and the recycled asphalt mixture were similar (basically consistent). The results showed that the fatigue performance of the recycled asphalt mixture can meet the requirements of ordinary asphalt mixture and meet the technical standards of asphalt pavement design.
- (3)
- The relationships between load and fatigue deformation for the ordinary asphalt mixture and the recycled asphalt mixture were different under different stress ratios and different loading frequencies. When the stress level was small (stress ratios of 0.2 and 0.3), the cumulative fatigue failure deformation of the ordinary asphalt mixture and the recycled asphalt mixture increased with the increase in loading frequency.
- (4)
- When the stress level was large (stress ratios of 0.4, 0.5, and 0.6), the cumulative fatigue failure deformation of the ordinary asphalt mixture and the recycled asphalt mixture decreased with the increase in loading frequency. The reason for this was that when the stress ratio was small, the flexural deformation of the trabecular specimen caused by the applied load was very small, far less than the bending and tensile failure limit deformation. Under high loading frequencies, the cumulative deformation of deflection increased faster, and the cumulative deformation of fatigue failure was larger. When the stress ratio was large, the load exerted great influence on the bending deformation of the trabecular specimen. The greater the loading frequency, the faster the time of action on the asphalt mixture viscoelastic specimen. The specimen was mostly elastomer, and the stiffness modulus was large. When the fatigue failure was reached, the cumulative deformation caused via fatigue failure was relatively small. However, under a certain stress level, due to the larger stiffness modulus, the flexural deformation will be relatively small, and fatigue cracking will not easily occur. Therefore, the higher the loading frequency of an asphalt mixture specimen, the greater the fatigue life.
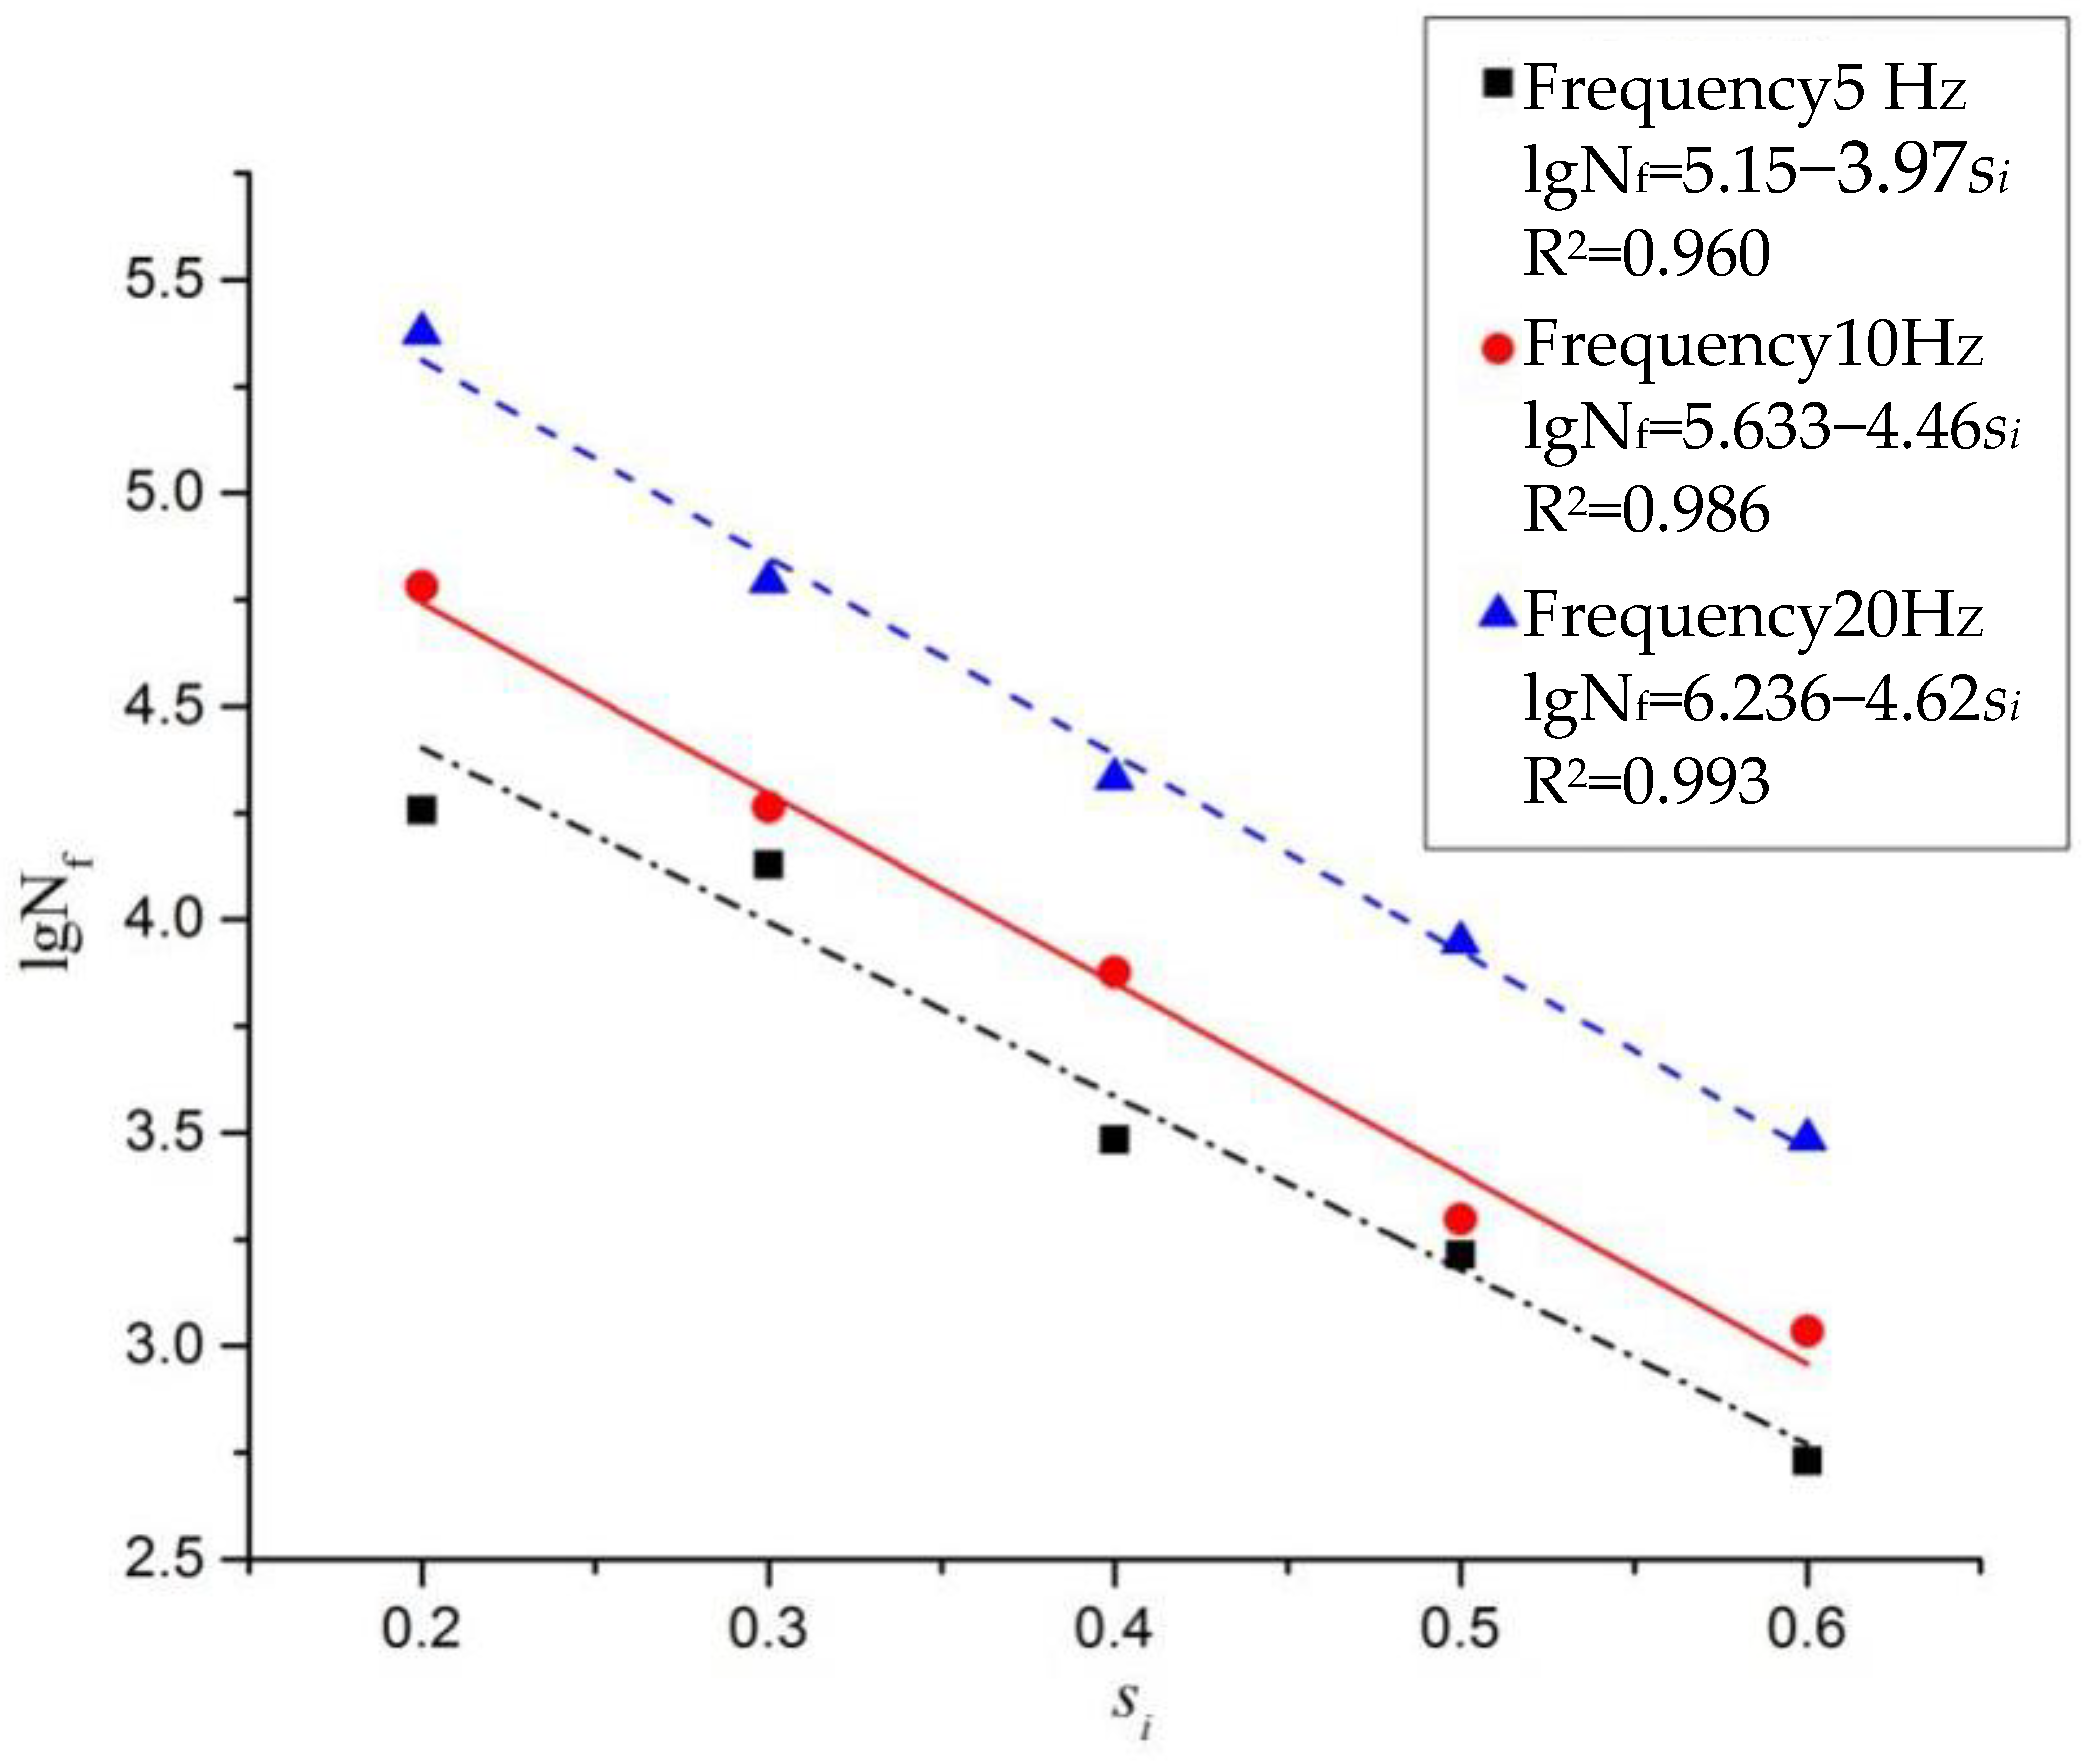
3.2.2. Three-Point Bending Fatigue Life Analysis
- (1)
- Under the same stress ratio, the fatigue life of II-1 and III-1 increased with the increase in loading frequency. When the stress ratio was 0.3, the fatigue life difference between the asphalt mixtures with loading frequencies of 5 Hz and 10 Hz was not obvious, but the fatigue life of the asphalt mixture with a loading frequency of 20 Hz was 3.8 times than that of the 5 Hz mixture and 3.1 times than that of the 10 Hz mixture. This indicates that the influence of higher loading frequency on the fatigue life of an asphalt mixture is more obvious when other test conditions are the same. Under the same test conditions, the order of fatigue life of the recycled asphalt mixtures under different loading frequencies was 20 Hz > 10 Hz > 5 Hz.
- (2)
- Under most of the same test conditions, the fatigue life of I-1 and II-1 was similar. This indicates that the recycled asphalt mixture met the requirements for long-term use of asphalt pavement. Although the aging of the RAP material in the recycled asphalt mixture has adverse effects on the fatigue life, the addition of a regenerant can better restore the pavement performance of the aged asphalt, thus improving the fatigue life of the recycled asphalt mixture.
- (3)
- Under the same loading frequency, the fatigue life significantly decayed with the increase in stress ratio, which indicates that the stress ratio has a major effect on the fatigue life of an asphalt mixture. When the loading frequency was 20 Hz, with the increase in stress ratio from 0.3 to 0.6, the fatigue life of I-1 decreased by 66.3%, 85.3%, and 94.8%, and the fatigue life of II-1 decreased by 65.5%, 85.8%, and 95.1%. As the stress ratio gradually increased, the applied load was closer to the ultimate stress of bending and tensile failure of the specimen. With the increase in load times, the residual deformation of the specimen gradually increased, the stiffness (or modulus) of the material gradually decreased, the micro-cracks continuously developed, and, finally, the complete fracture occurred.
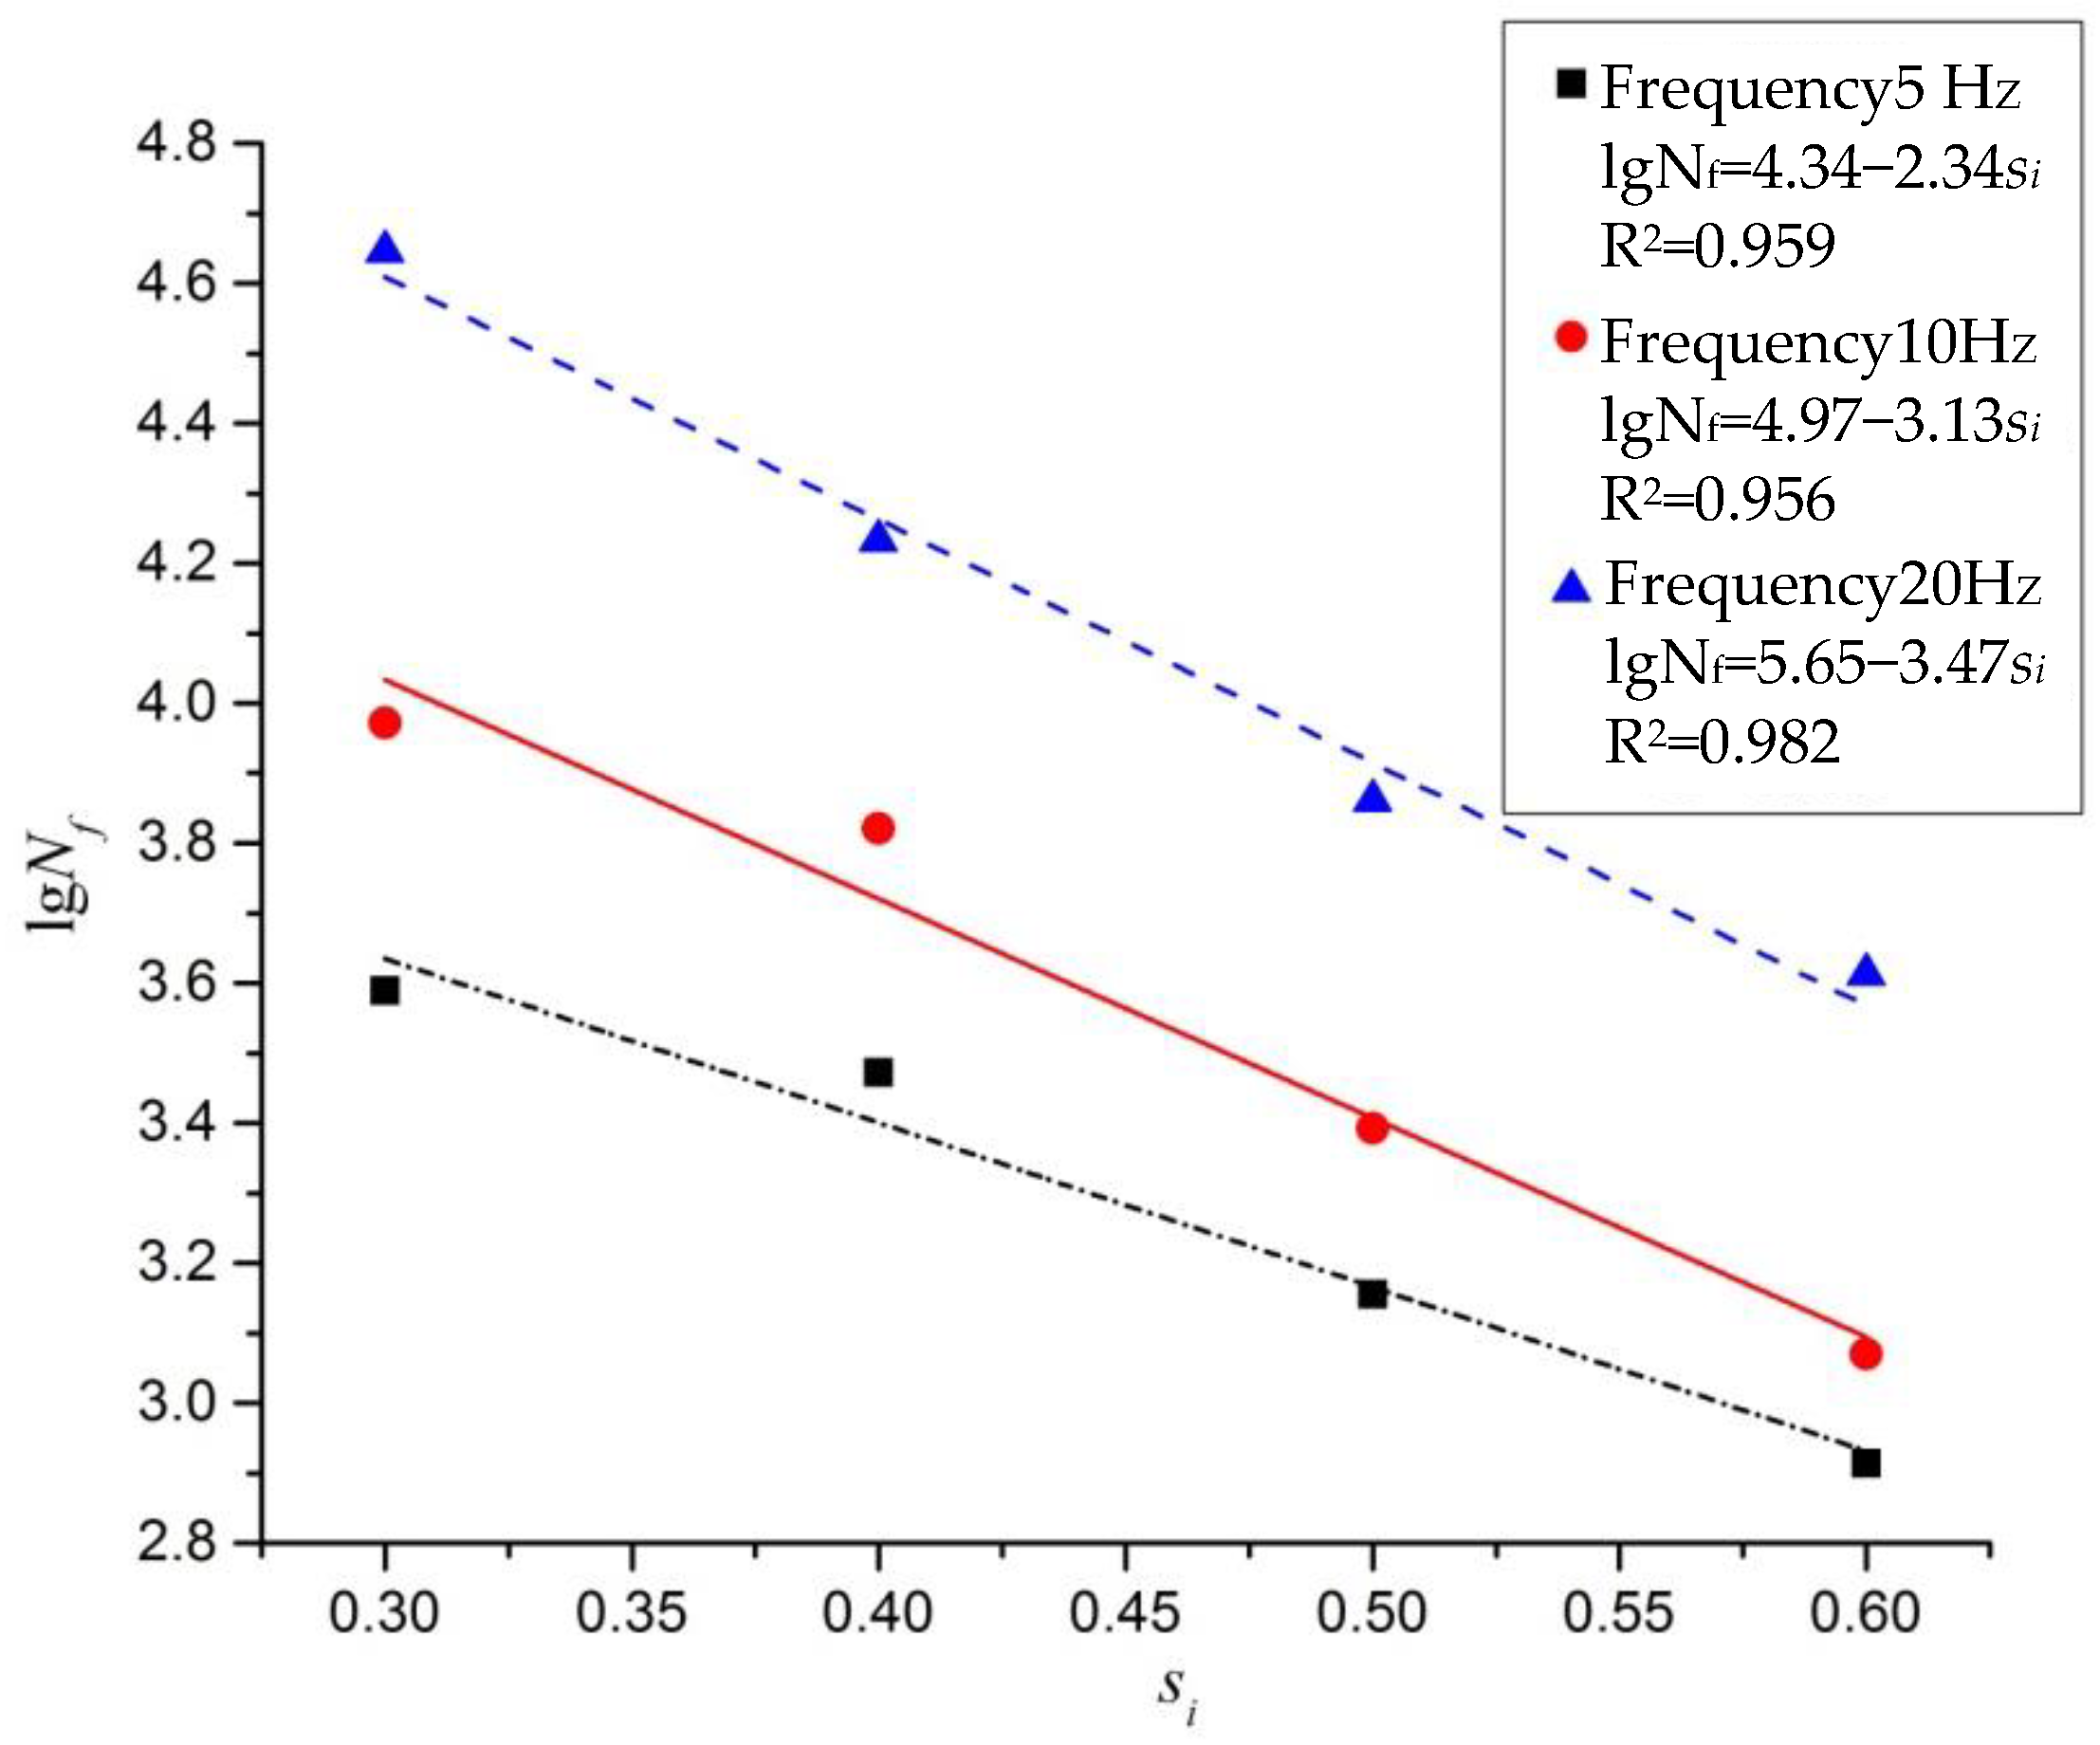
3.2.3. Fatigue Equation under Stress Control Mode
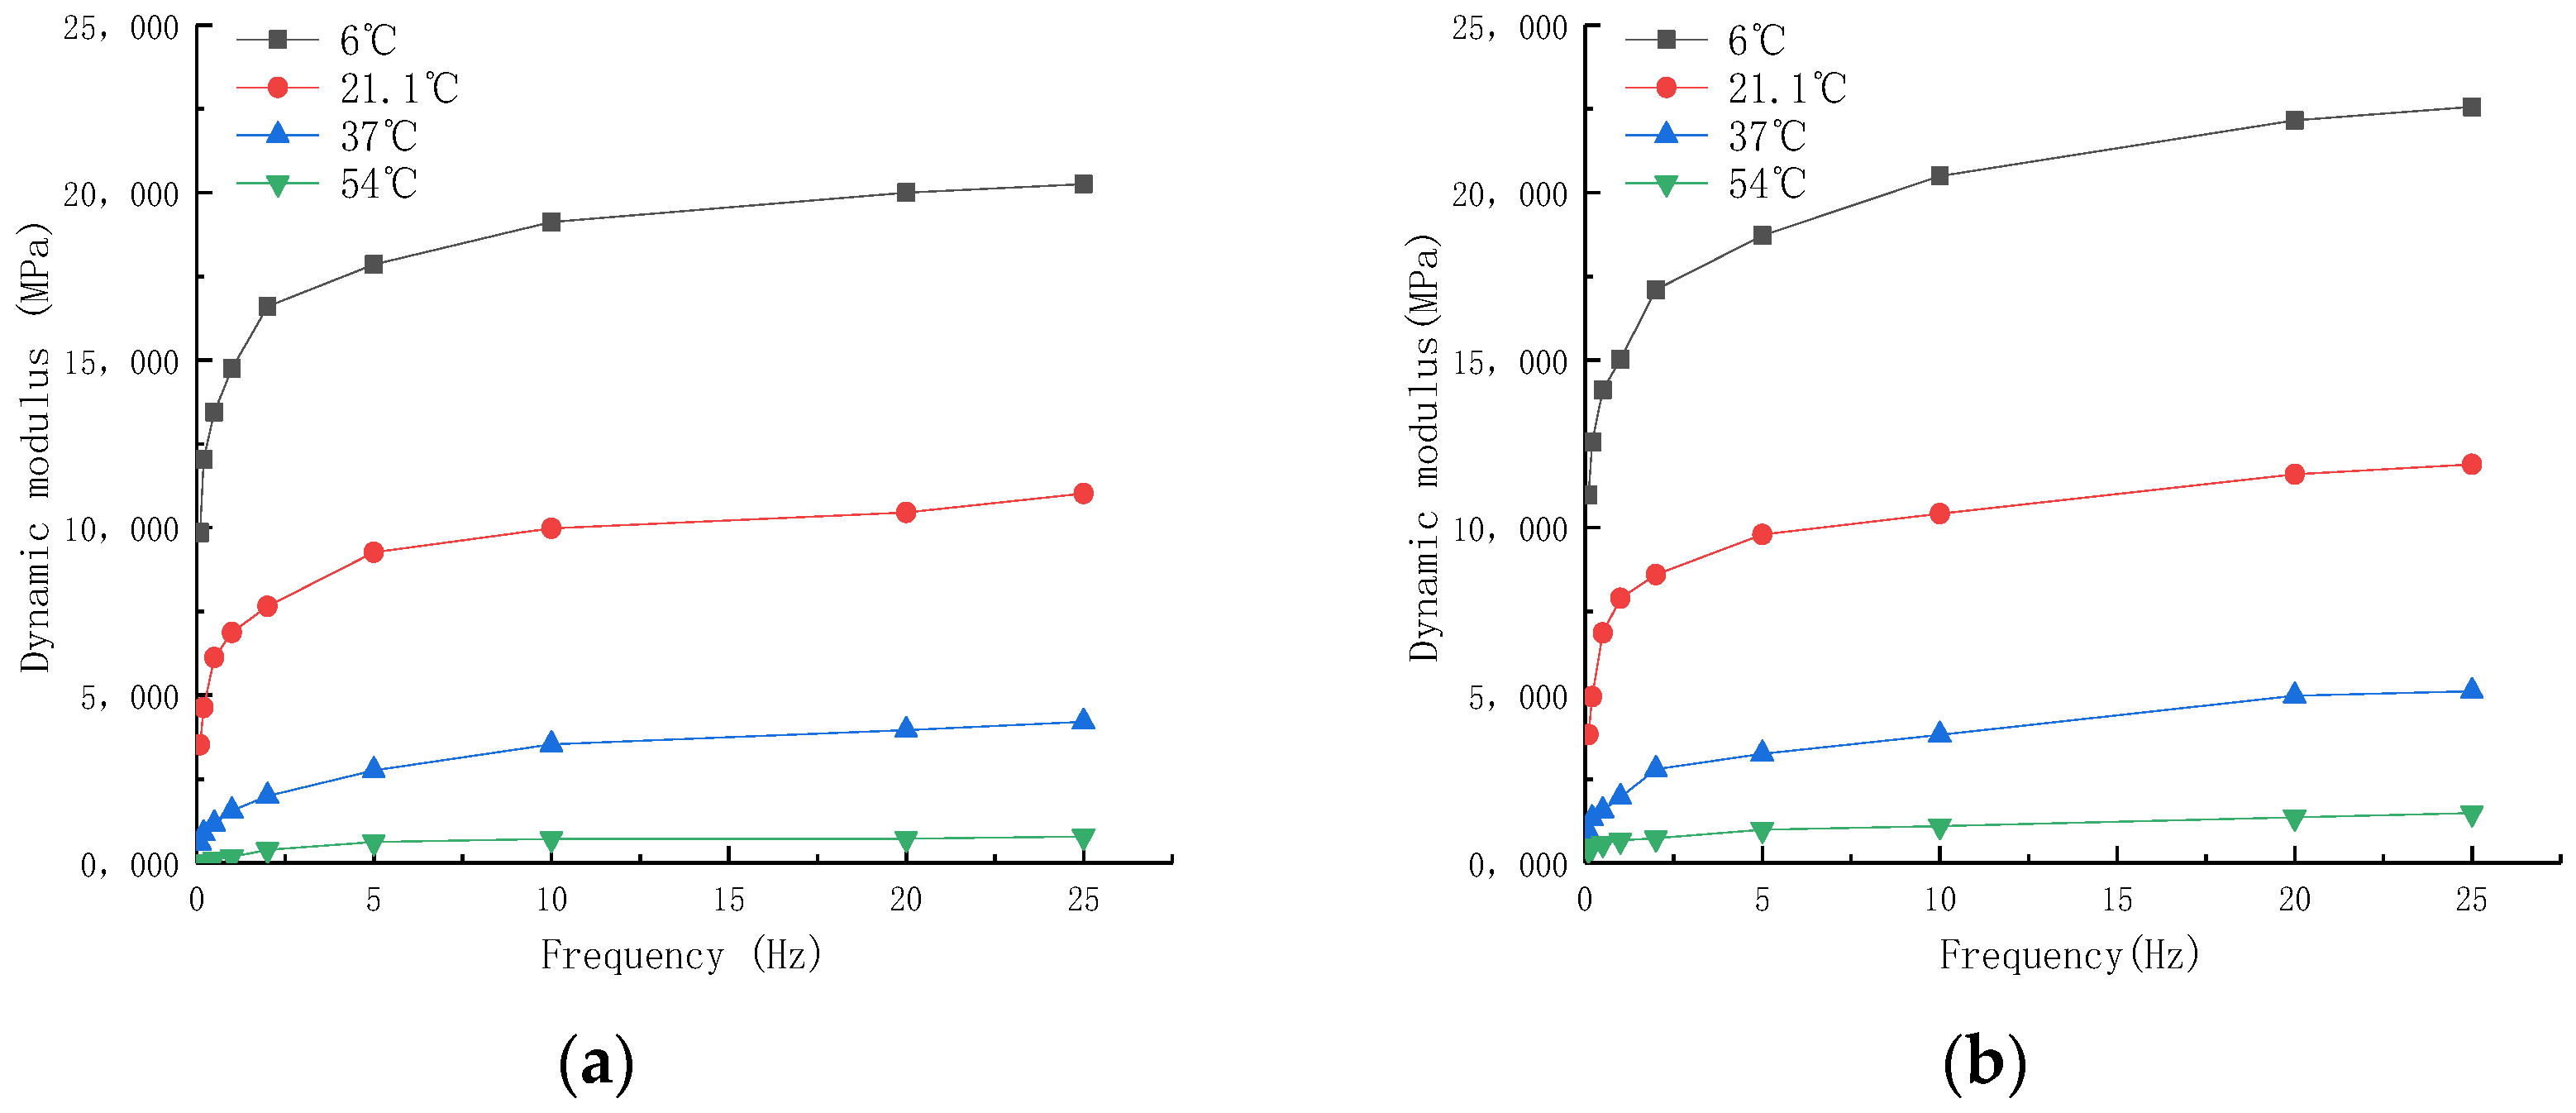
3.3. Dynamic Modulus Analysis of the Asphalt Mixture Based on the Test Road
- (1)
- The dynamic modulus of the asphalt mixture material increased with the increase in load frequency under the same temperature condition, but with the continuous increase in temperature, the dynamic modulus gradually decreased the growth rate until it approached a quantitative value. The dynamic modulus of the asphalt mixture rapidly increased before 3 Hz and then tended to gradually slow down. Therefore, the dynamic modulus of the asphalt mixture will not become infinitely higher due to the increasing frequency, as when the loading frequency continues to increase, the viscosity of the asphalt mixture will gradually decrease, and its elasticity will gradually increase.
- (2)
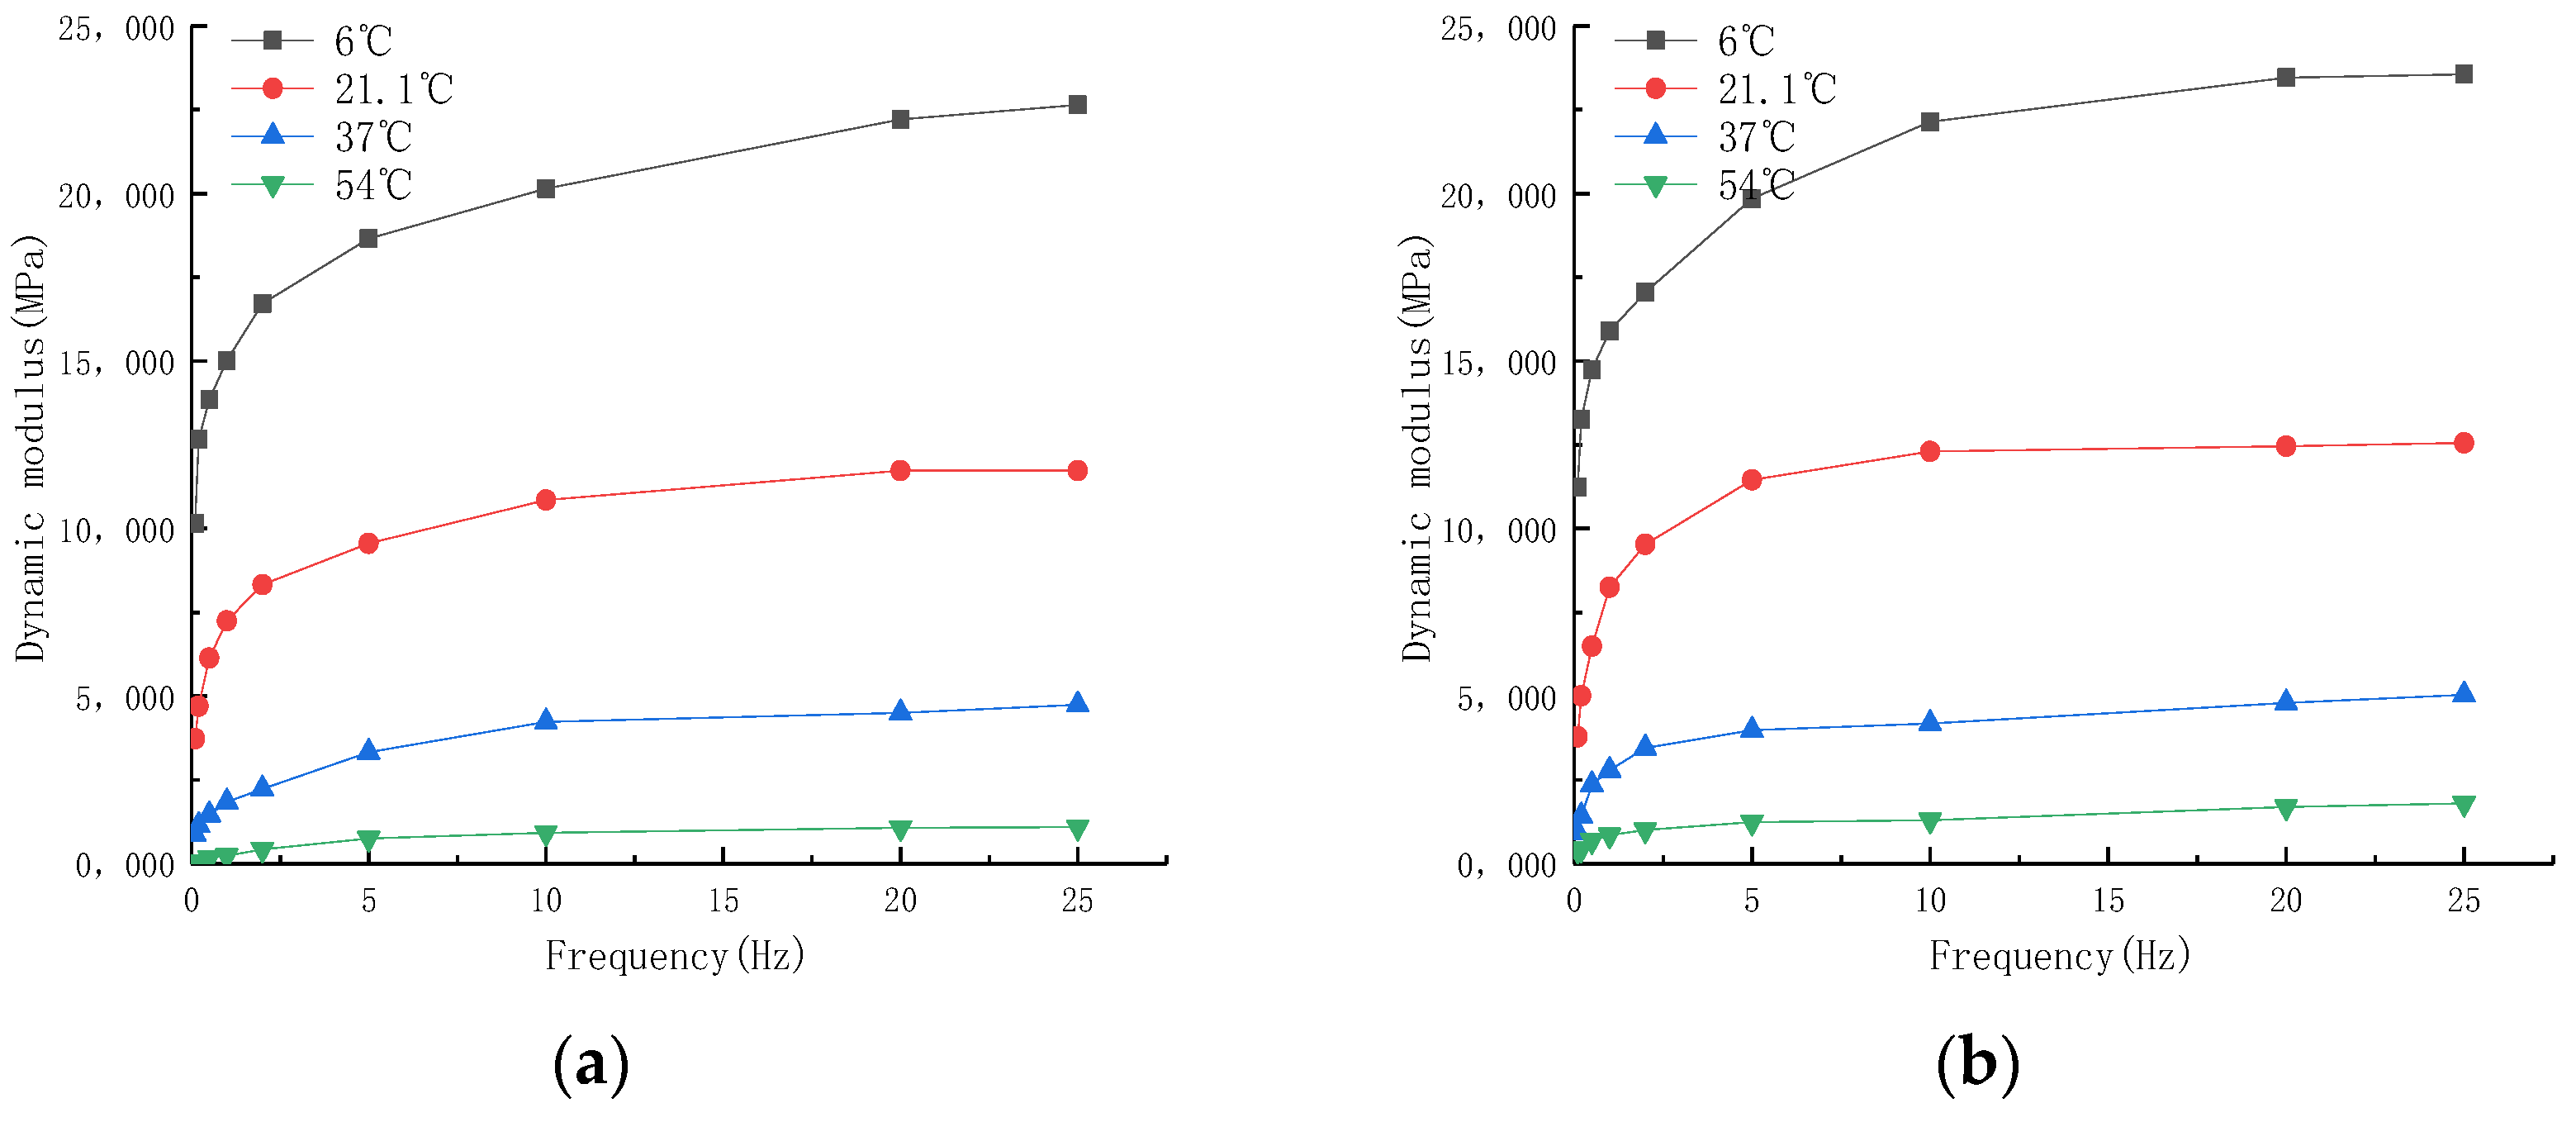
- Based on the ALT full-scale experiment, it was found that under the same temperature conditions, the dynamic elastic modulus of the asphalt mixture before the equipment wheel load was greater than that after the wheel load. The reason for this is that after long-term wheel loading, the fine aggregate will be compacted, the coarse aggregate will be crushed, and the asphalt will age, which will lead to the structural stiffness and dynamic modulus of the mixed material being reduced.
- (3)
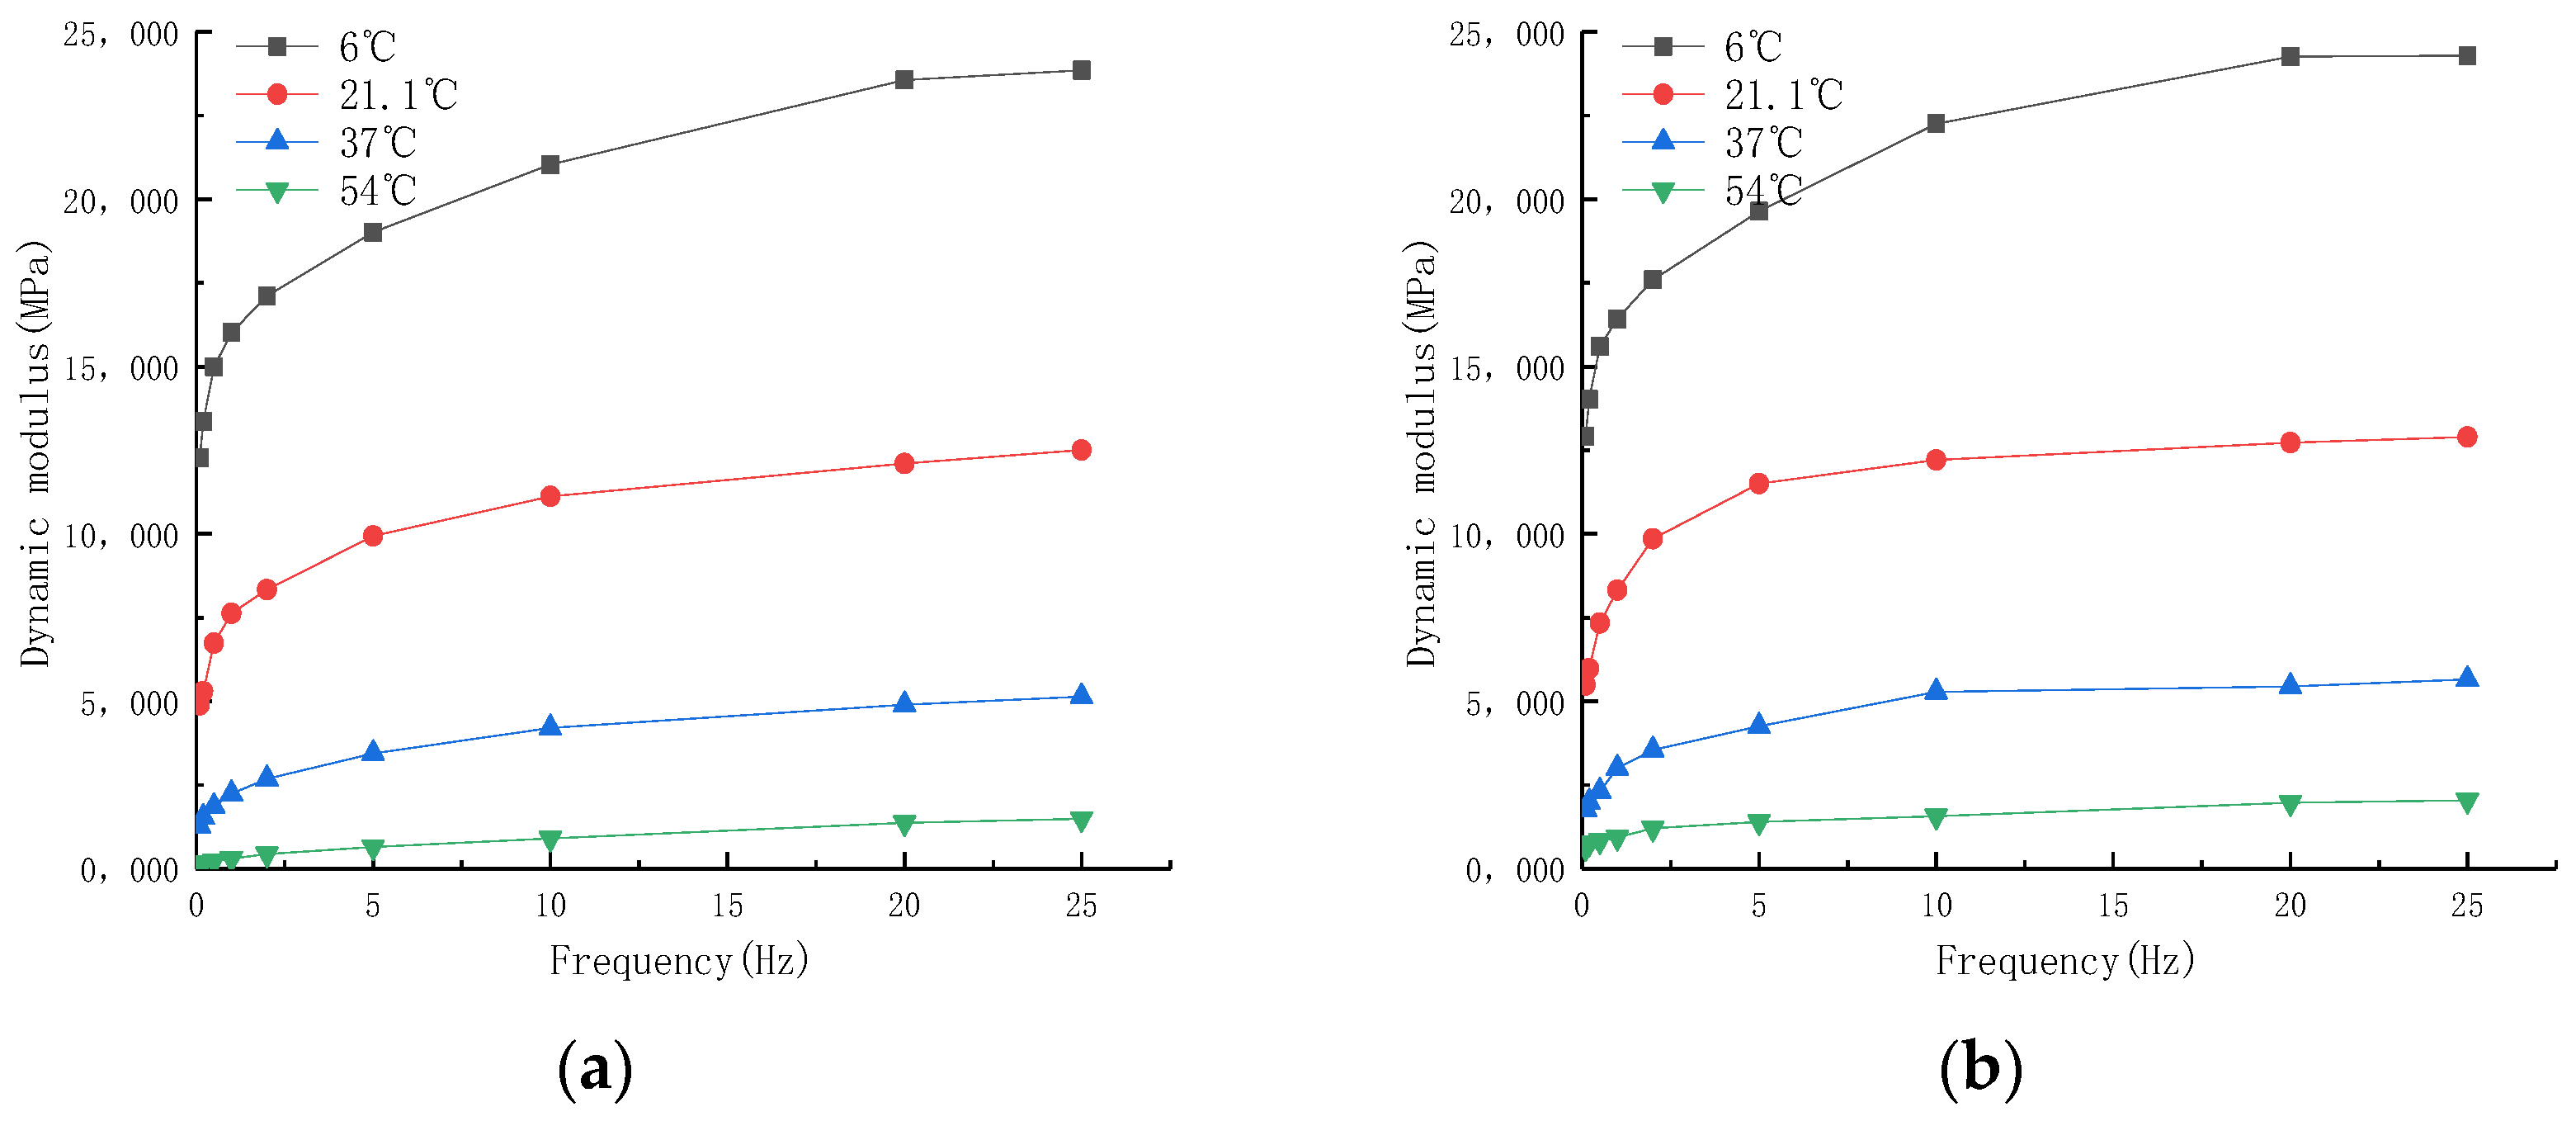
- The modulus of the SMA-13 recycled asphalt mixture was smaller than that of the AC-20 recycled asphalt mixture. Structurally speaking, SMA-13 is characterized by discontinuous gradation, with more coarse aggregates and less fine aggregates, and its mixture belongs to the skeleton compact structure. AC is characterized by continuous gradation, a continuous amount of each file material, and step-by-step gap filling, and its mixed material structure belongs to the suspension dense type. This is the cause of the smaller modulus of the former and the larger modulus of the latter.
- (4)
- The dynamic modulus of the asphalt mixture increased at temperature and rapidly decreased at different loading frequencies. When the test temperature was different, the dynamic modulus of the asphalt mixture increased with the increase in loading frequency. At the same frequency, the dynamic modulus decreased with the increase in temperature, which was due to the gradual decrease in the resilience modulus of asphalt as a binder. It can be seen that the basic mechanical properties of a viscoelastic asphalt mixture can be accurately reflected through dynamic modulus testing.
- (5)
- The modulus of the recycled asphalt mixture was slightly larger than that of the ordinary asphalt mixture, which was because the recycled asphalt mixture was mixed with 20% RAP material, and the elastic modulus became larger due to the existence of the RAP material. Under different temperatures and frequencies, the dynamic modulus of the SMA-13 ordinary asphalt mixture and SMA-13 recycled asphalt mixture after accelerated loading were close to each other, which is consistent with the residual fatigue life rule of the two given in Section 3.2, and the same was true for the AC-20 recycled asphalt mixture.
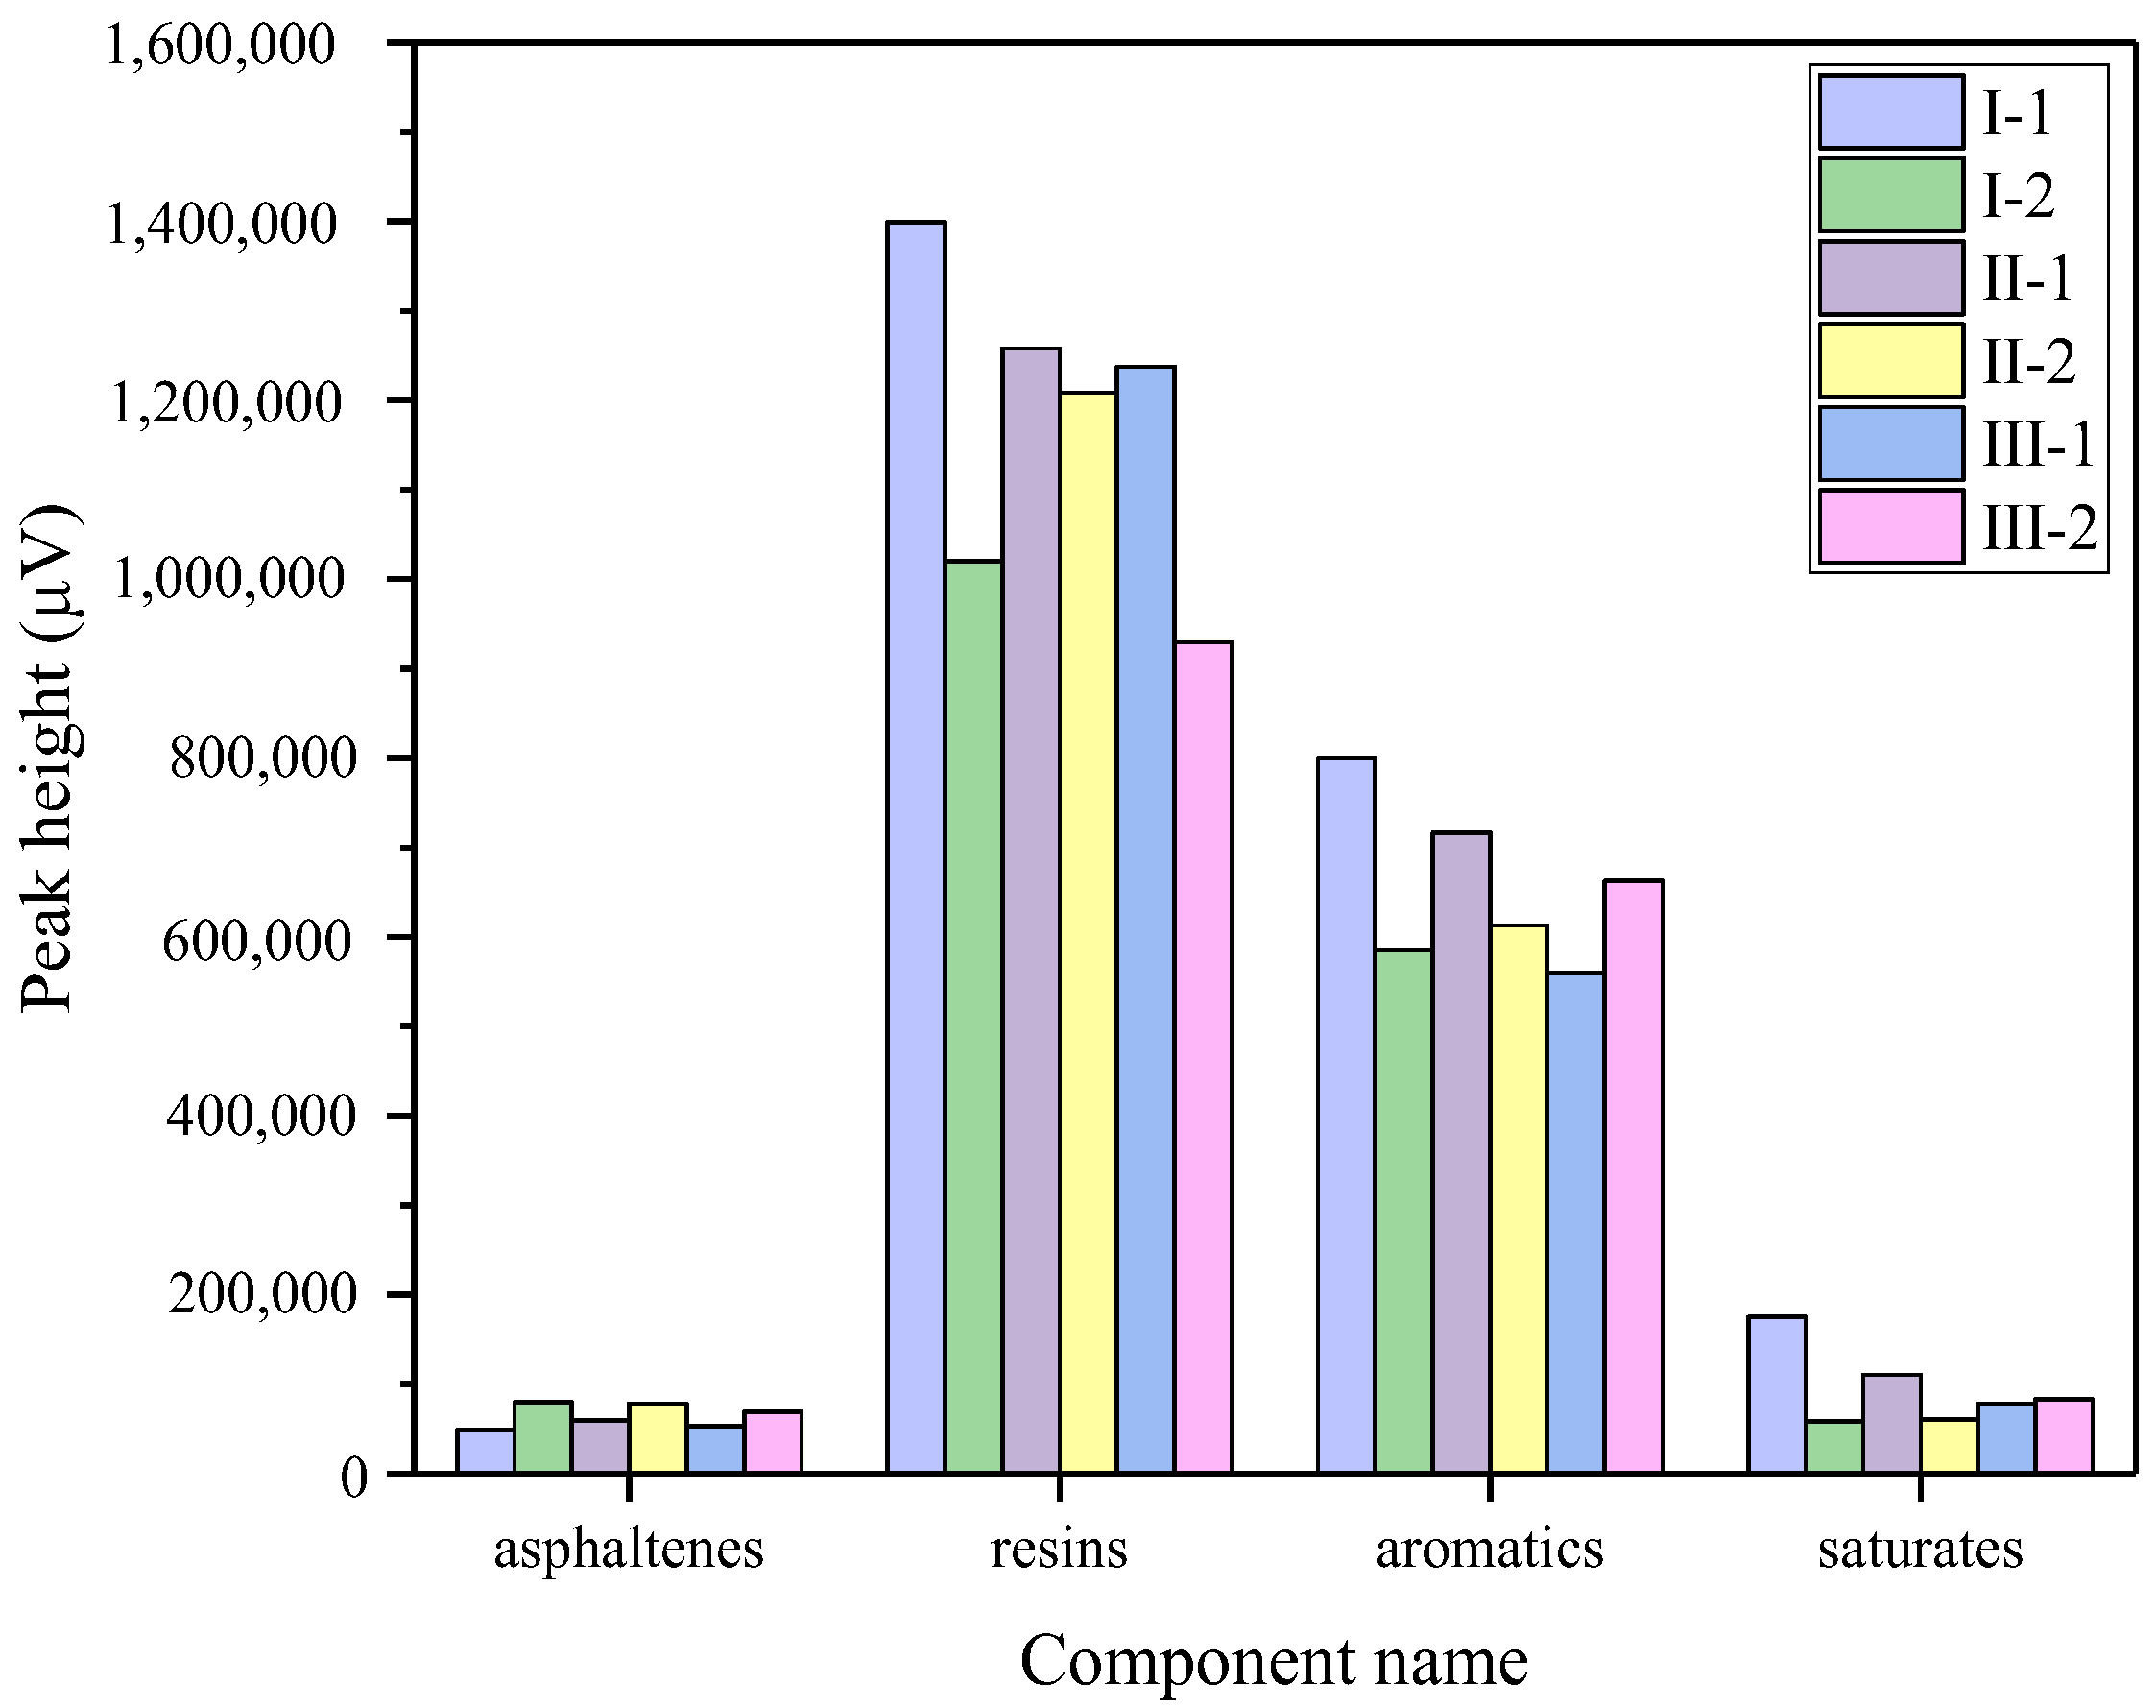
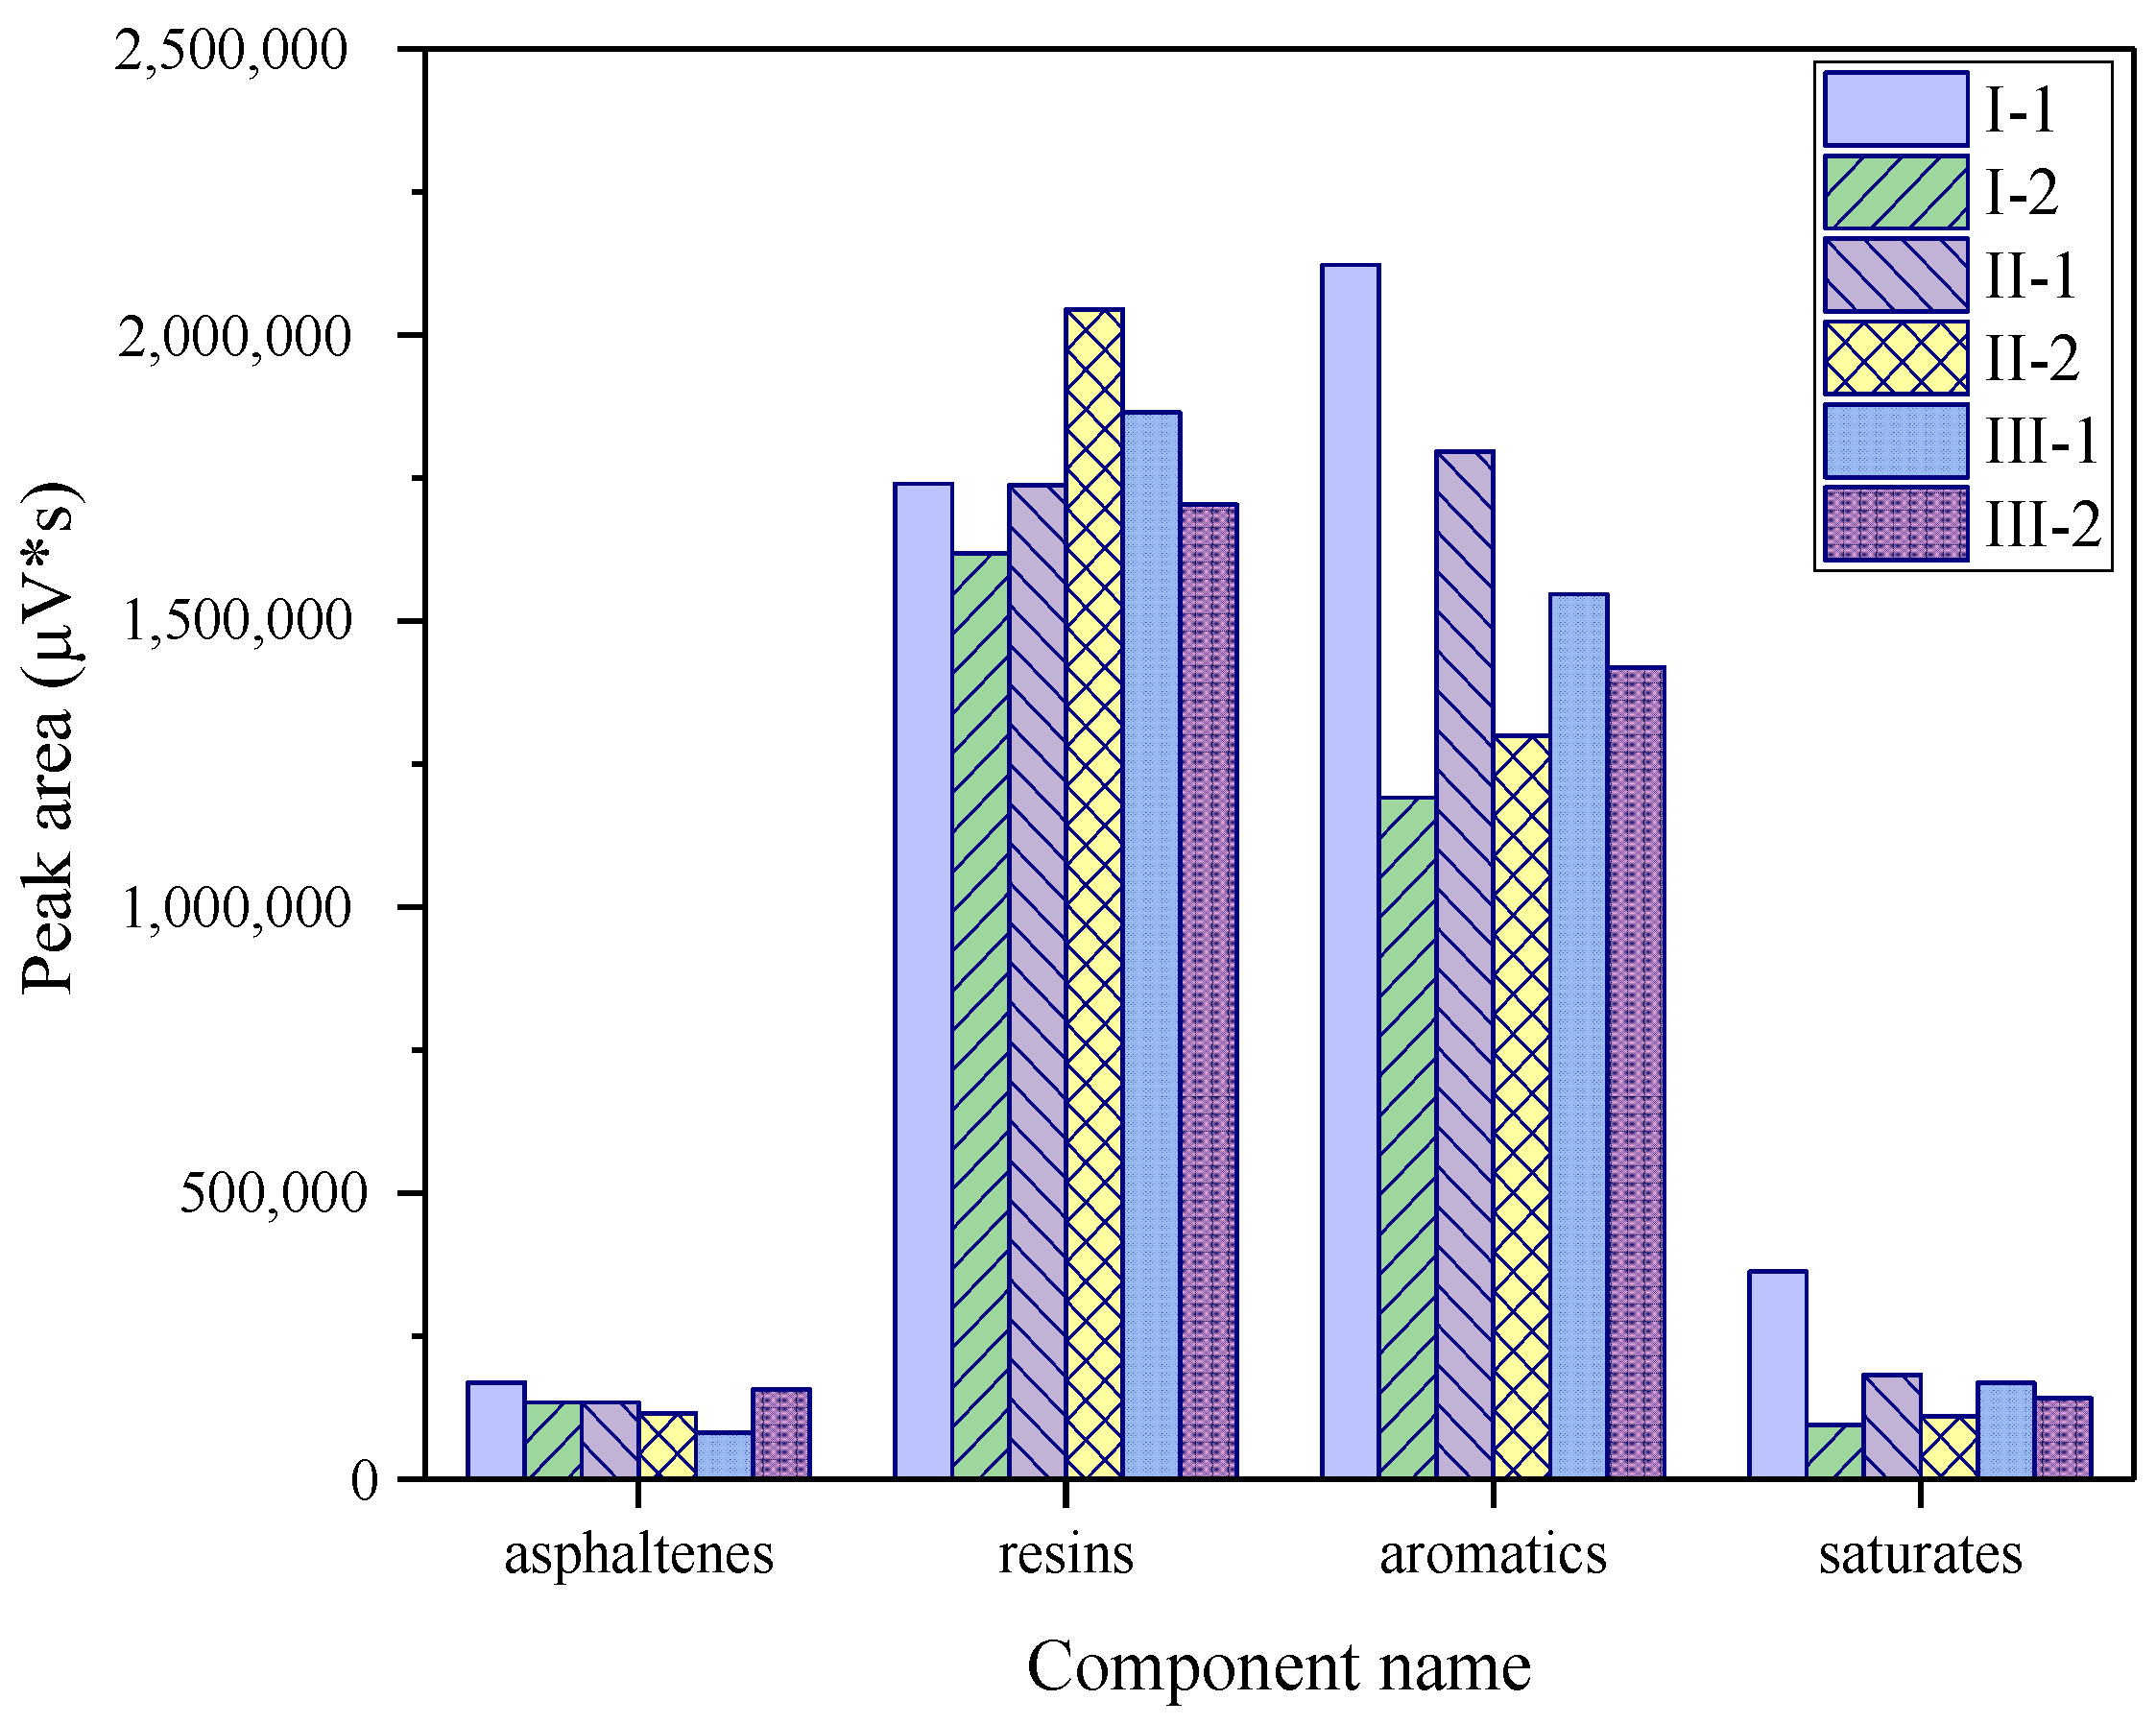
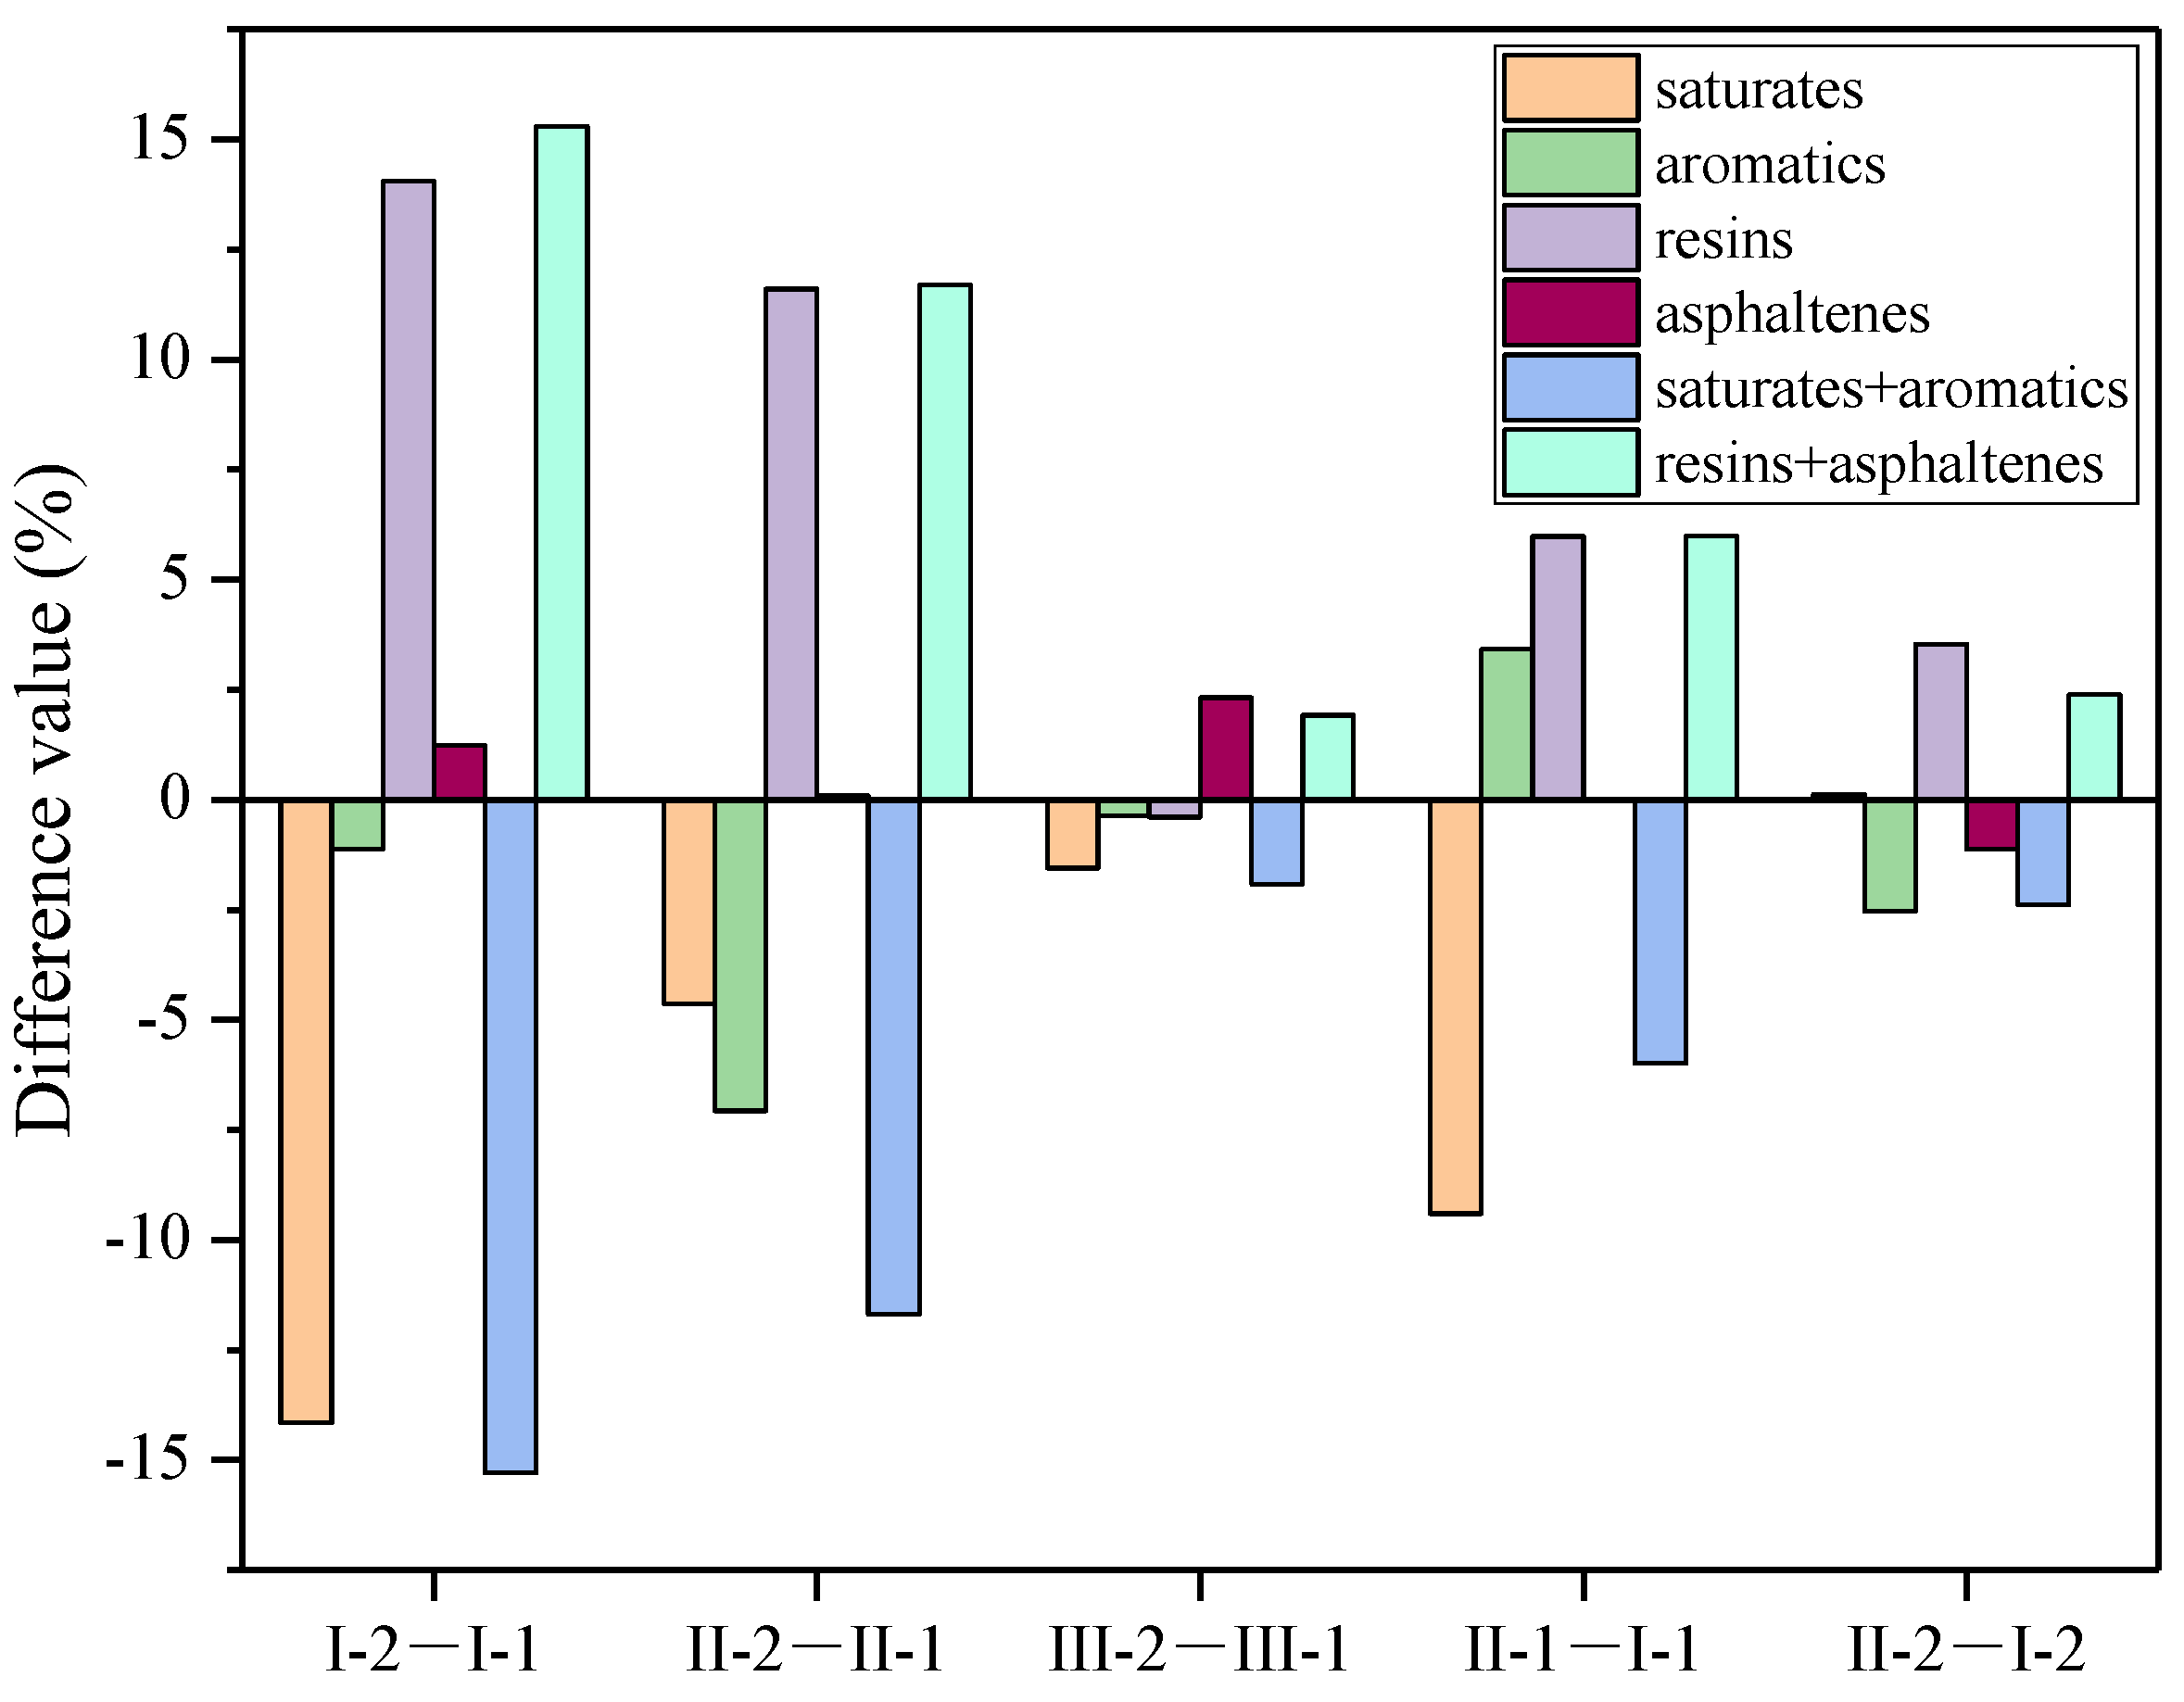
3.4. Analysis of Asphalt Secondary Aging Components
- (1)
- Under accelerated loading, different loads under the same thermal oxygen, light, and water conditions will have different influences on the pavement over a period of time. According to the experimental data, the saturates + aromatics content of I-2 was 58.74%, and the saturates + aromatics content of I-1 was 74.03%, with I-2 < I-1. The resins + asphaltenes content of I-2 was 41.26%, and the resins + asphaltenes content of I-1 was 25.97%. The saturates and aromatics of asphalt following the accelerated loading section were reduced, and the lighter components were converted more into resins and asphaltenes. Under the coupling action of load, hot oxygen, light, and water, the aging of asphalt was accelerated, and the aging degree was normal, without serious aging phenomena.
- (2)
- The saturates + aromatics content of II-2 was 56.35%, and the content of saturates + aromatics of II-1 was 11.69% more than II-2. The contents of resins + asphaltenes under unaccelerated loading and accelerated loading were 31.96% and 43.65%, respectively. Under the coupling action of running load, hot oxygen, light, and water, certain aging conditions were generated, but no serious aging phenomena occurred.
- (3)
- The content of saturates + aromatics in II-1 was 5.99% less than that in I-1, and the content of saturates + aromatics in II-2 was 2.39% less than that in I-2. Based on the content of the four components, there were no excessive aging phenomena in the recycled asphalt mixture. After the fatigue test, the contents of each component in the recycled asphalt mixture after aging were basically the same as that of the ordinary asphalt mixture. This may be because the recycled asphalt mixture contains RAP, which has undergone aging and has stable content of light components. The old and new asphalt were combined and the four components were recombined, and the content of light components of I-1 was 5.99% different from that of I-1. After accelerated loading, the light component content of II-2 was 2.39% different from that of I-2, and the light components of II-2 and II-1 were only 11.69% lower. Therefore, the recycled asphalt mixture exhibited better fatigue resistance under the same aging conditions. The road performance and durability of the recycled asphalt mixture met the application requirements.
- (4)
- Distinct from the accelerated loading of the SMA-13 ordinary asphalt mixture and SMA-13 recycled asphalt mixture on the upper layer, the different components of the AC-20 recycled asphalt mixture on the bottom layer displayed little difference under the two conditions of accelerated loading and unaccelerated loading. The saturates + aromatics content of III-2 was 62.59%, while the saturates + aromatics content of III-1 was 64.51% (basically the same). The resins + asphaltenes content of III-2 was not different from that of III-1. This indicated that the aging degree of the accelerated loading section and the unaccelerated loading section in the following layer were basically the same, with no obvious change, and that the road performance and durability met the use requirements. After accelerated loading, the light component of the SMA-13 thermal reclaimed asphalt mixture decreased by 11.39%, and that of the AC-20 thermal reclaimed asphalt mixture by 1.92%, mainly because the full-scale experiment directly acted on the upper layer, and the influence of the thermal oxygen, light, and water conditions also mainly acted on the upper layer. However, the AC-20 thermal reclaimed asphalt mixture was located at the bottom layer of the pavement structure, which was less affected and did not experience accelerated asphalt aging.
4. Conclusions
- (1)
- As the number of loading times increases, the BPN value of the two structures tended to be stable, and the BPN of Plan 2 was six lower than that of Plan 1. On the basis of the full-scale experiment, the recycled asphalt mixture and ordinary asphalt mixture exhibited good road performance. However, the ordinary asphalt mixture pavement had better skid resistance. As the bottom layer, each component of the AC-20 recycled asphalt mixture showed little difference after accelerated loading and unaccelerated loading and remained consistent. This indicated that accelerated loading aging mainly affects the upper layer of pavements. In summary, recycled asphalt mixtures should not be applied to the upper layer of pavements but can be rationalized in the middle layer and the bottom layer of pavements.
- (2)
- Under the same stress level and loading frequency, the curve relationships between load and deflection for the SMA-13 and AC-20 ordinary asphalt mixtures and the recycled asphalt mixture were similar (basically consistent). The results showed that the fatigue performance of a recycled asphalt mixture can meet the requirements of an ordinary asphalt mixture and meet the technical standards of asphalt pavement design. The macroscopic mechanical response and road service performance of the two pavement structures under load were basically the same, which reflects the good road performance of the blended recycled asphalt mixture.
- (3)
- When the stress ratio was 0.3, the fatigue life difference between the asphalt mixtures with loading frequencies of 5 Hz and 10 Hz was not obvious, but the fatigue life of the asphalt mixture with a loading frequency of 20 Hz was 3.8 times than that of the 5 Hz mixture and 3.1 times than that of the 10 Hz mixture. Under the same test conditions, the order of fatigue life of the recycled asphalt mixtures under different loading frequencies was 20 Hz > 10 Hz > 5 Hz.
- (4)
- The stress ratio and fatigue life showed a good linear relationship on the single logarithm curve, and the fatigue equations for the recycled asphalt mixtures under different load frequencies were obtained; that is, lgNf = k + n × Si. The n value of AC-20 ranged from 2.34 to 3.47, and the variation range was relatively large, indicating that the loading frequency was more sensitive to the fatigue life and stress level of the specimens.
- (5)
- The saturates and aromatics of asphalt in the accelerated loading section were decreased, while the light components were transformed more into resins and asphaltenes. Following the full-scale experiment, the light component of the SMA-13 recycled asphalt mixture decreased by 11.69%, while that of the SMA-13 ordinary asphalt mixture decreased by 15.29%, indicating that the coupling effect of load, thermal oxygen, light, and water accelerated the aging of the asphalt, but no serious aging phenomena occurred. The recycled asphalt mixture exhibited better fatigue resistance under the same aging conditions.
- (6)
- The pendulum tribometer used in this study could not fully simulate tire contact with the road, as real vehicle tires are much rougher and can provide better grip on the road surface. It is well known that BPN measurements are more influenced by non-slip micro-texture components than by macroscopic texture. This problem may lead to slight changes in the BPN value, especially when the sample surface void is blocked by dust or the road is wet in rainy days, and the BPN cannot be accurately detected. In addition, temperature, load, light, water, and other factors have a great impact on pavement aging. Therefore, it is necessary to monitor the road temperature, load, and other parameters and comprehensively analyze the decay mechanisms and laws of recycled asphalt pavement from a multi-directional perspective, so as to improve the utilization rate of recycled materials to make full use of resources and reduce waste.
Author Contributions
Funding
Institutional Review Board Statement
Informed Consent Statement
Data Availability Statement
Acknowledgments
Conflicts of Interest
References
- Ruiz, A.; Guevara, J. Sustainable Decision-Making in Road Development: Analysis of Road Preservation Policies. Sustainability 2020, 12, 872. [Google Scholar] [CrossRef]
- Roach, P.E.; Ugursal, I. Development and technoeconomic evaluation of pathways to new construction net-zero energy houses in Nova Scotia. Trans. Can. Soc. Mech. Eng. 2020, 45, 221–232. [Google Scholar] [CrossRef]
- Perumal, L.; New, M.; Jonas, M.; Liu, W. The impact of roads on sub-Saharan African ecosystems: A systematic review. Environ. Res. Lett. 2021, 16, 113001. [Google Scholar] [CrossRef]
- Sidle, R.C. Dark Clouds over the Silk Road: Challenges Facing Mountain Environments in Central Asia. Sustainability 2020, 12, 9467. [Google Scholar] [CrossRef]
- Suprayoga, G.B.; Witte, P.; Spit, T. Coping with strategic ambiguity in planning sustainable road development: Balancing economic and environmental interests in two highway projects in Indonesia. Impact Assess. Proj. Apprais. 2020, 38, 233–244. [Google Scholar] [CrossRef]
- Zhao, H.; Su, J.; Ma, S.; Su, C.; Wang, X.; Li, Z.; Wei, J.; Cui, S. Study on Cold Recycled Asphalt Mixtures with Emulsified/Foamed Asphalt in the Laboratory and On-Site. Coatings 2022, 12, 1009. [Google Scholar] [CrossRef]
- Li, J.; Zhu, L.; Yu, M.; Zuo, S.; Cui, X.; Liu, P. Long-Term Performance of Recycled Asphalt Pavement with Recycled Engine Oil Bottom Based on Accelerated Loading Test. Coatings 2022, 12, 522. [Google Scholar] [CrossRef]
- Li, M.; Tang, W.; Yu, X.; Zhan, H.; Wang, X.; Wang, Z. Laboratory investigation on blending process of reclaimed asphalt mixture. Constr. Build. Mater. 2022, 325, 126793. [Google Scholar] [CrossRef]
- Li, X.; Wang, Q.; Liu, S. Research on Application of Warm Mix Asphalt Technology in Hot In-Place Recycled Engineering. Appl. Mech. Mater. 2013, 361-363, 1655–1658. [Google Scholar] [CrossRef]
- Reza, I.; Luis, L.; Alan, C. Integrated performance evaluation of asphalt mixtures with very high reclaimed asphalt pavement (RAP) content. Constr. Build. Mater. 2022, 347, 129607. [Google Scholar] [CrossRef]
- Yin, P.; Pan, B. Effect of RAP content on fatigue performance of hot-mixed recycled asphalt mixture. Constr. Build. Mater. 2022, 328, 127077. [Google Scholar] [CrossRef]
- Marcandré, B.; Sébastien, L.; Kevin, B.; Alan, C. Laboratory Study of the Effects of the Mixer Type and Mixing Time on the Volumetric Properties and Performance of a HMA with 30 Percent Reclaimed Asphalt Pavement. Materials 2023, 16, 1300. [Google Scholar] [CrossRef]
- Li, F.; Zhu, H.; Yan, J.; Liu, Q.; Zhang, Z. Experimental Study of Hot Recycled Asphalt Mixtures with High Percentages of Reclaimed Asphalt Pavement and Different Recycling Agents. J. Test. Eval. 2014, 42, 1183–1190. [Google Scholar]
- Gao, J.; Yao, Y.; Huang, J.; Yang, J.; Song, L.; Xu, J.; Lu, X. Effect of Hot Mixing Duration on Blending, Performance, and Environmental Impact of Central Plant Recycled Asphalt Mixture. Buildings 2022, 12, 1057. [Google Scholar] [CrossRef]
- Prosperi, E.; Bocci, E.; Bocci, M. Effect of Bitumen Production Process and Mix Heating Temperature on the Rheological Properties of Hot Recycled Mix Asphalt. Sustainability 2022, 14, 9677. [Google Scholar] [CrossRef]
- Bocci, E.; Bocci, M.; Prosperi, E. Influence of the Hot-Mix Asphalt Production Temperature on the Effectiveness of the Reclaimed Asphalt Rejuvenation Process. Infrastructures 2022, 8, 8. [Google Scholar] [CrossRef]
- Cong, P.; Zhang, Y.; Liu, N. Investigation of the properties of asphalt mixtures incorporating reclaimed SBS modified asphalt pavement. Constr. Build. Mater. 2016, 113, 334–340. [Google Scholar] [CrossRef]
- Homsi, F.; Bodin, D.; Yotte, S.; Breysse, D.; Balay, J.M. Fatigue life modelling of asphalt pavements under multiple-axle loadings. Road Mater. Pavement Des. 2012, 13, 749–768. [Google Scholar] [CrossRef]
- Dong, C.; Liu, W.; Zhou, L.; Zhang, R.; Kan, Q.; Leng, W. Evaluation on Fatigue Life of Expressway Asphalt Pavement Based on Tire-Pavement-Subgrade Coupling Model. Am. J. Civ. Eng. 2017, 5, 400–407. [Google Scholar]
- Ziari, H.; Aliha, M.; Mojaradi, B.; Jebalbarezi, S. Investigating the effects of loading, mechanical properties and layers geometry on fatigue life of asphalt pavements. Fatigue Fract. Eng. Mater. Struct. 2019, 42, 1563–1577. [Google Scholar] [CrossRef]
- Yu, Y.; Tang, S.; Xu, G.; Fan, Y.; Wu, Y.; Wang, H.; Yang, J. Investigations on the long-term skid resistance of epoxy asphalt mixture based on accelerated loading test. Constr. Build. Mater. 2023, 365, 130150. [Google Scholar] [CrossRef]
- Hoha, D.; Boboc, V.; Boboc, A. The Behaviour of a Flexible Road Pavement under Accelerated Loading Test. Bull. Transilv. Univ. Brasov. Eng. Sciences. Ser. I 2018, 11, 257–266. [Google Scholar]
- Cao, W.; Mohammad, L.; Barghabany, P. Use of indirect tension test and viscoelastic continuum damage theory for fatigue characterization of asphalt mixtures. Constr. Build. Mater. 2018, 187, 38–49. [Google Scholar] [CrossRef]
- Luo, X.; Hu, S.; Zhou, F.; Crockford, W.; Karki, P. Simple Asphalt Mixture Shear Rutting Test and Mechanical Analysis. J. Mater. Civ. Eng. 2022, 34, 04022220. [Google Scholar] [CrossRef]
- Ibrahim, O.; Yared, D.; Björn, B. Hierarchical approach for fatigue cracking performance evaluation in asphalt pavements. Front. Struct. Civ. Eng. 2017, 11, 257–269. [Google Scholar]
- Mensching, D.; Daniel, J.; Underwood, B. Exploring indicators for fatigue cracking in hot mix asphalt pavements using simplified-viscoelastic continuum damage theory. Road Mater. Pavement Des. 2018, 19, 536–545. [Google Scholar] [CrossRef]
- Fu, Y. Research on the Fatigue Damage of the Asphalt Pavement. Appl. Mech. Mater. 2012, 256–259, 1776–1779. [Google Scholar]
- Wu, Y.; Zhou, X.; Wang, X.; Shan, L. Long-Term Service Performance of Hard-Grade Asphalt Concrete Base Pavement Based on Accelerated Loading Test of Full-Scale Structure. Sustainability 2022, 14, 9712. [Google Scholar] [CrossRef]
- Xu, X.; Yu, Y.; Yang, J.; Wu, C. Long-Term Skid Resistance Evaluation of GAC-16 Based on Accelerated Pavement Testing. Adv. Mater. Sci. Eng. 2020, 2020, 1–9. [Google Scholar] [CrossRef]
- Park, D. Evaluation of Predicted Pavement Fatigue Life Based on Surface Profiles and Asphalt Mixture Types. KSCE J. Civ. Eng. 2010, 14, 191–196. [Google Scholar] [CrossRef]
- Xiao, Z.; Chen, M.; Wu, S.; Xie, J.; Kong, D.; Qiao, Z.; Niu, C. Moisture Susceptibility Evaluation of Asphalt Mixtures Containing Steel Slag Powder as Filler. Materials 2019, 12, 3211. [Google Scholar] [CrossRef] [PubMed]
- Syyed, A.; Hunain, A.; Ahsan, W.; Muhammad, H.; Salman, H.; Junaid, M.; Abdullah, N.; Muhammad, A. Saving Energy in the Transportation Sector: An Analysis of Modified Bitumen Application Based on Marshall Test. Energies 2018, 11, 3025. [Google Scholar] [CrossRef]
- Lv, S. Study on Low Temperature Performance Evaluation Index of Asphalt Mixture Based on Bending Test at Low Temperature. Appl. Mech. Mater. 2012, 1931, 427–430. [Google Scholar] [CrossRef]
- Li, Z.; Yu, W.; Ying, M. The Research of Low Temperature Performance of Asphalt Mixture. Adv. Mater. Res. 2010, 168–170, 2507–2512. [Google Scholar]
- Kim, M.; Mohammad, L.; Jordan, T.; Cooper, S. Fatigue performance of asphalt mixture containing recycled materials and warm-mix technologies under accelerated loading and four point bending beam test. J. Clean. Prod. 2018, 192, 656–664. [Google Scholar] [CrossRef]
- AASHTO TP 62; Standard Method of Test for Determining Dynamic Modulus of Hot Mix Asphalt (HMA). American Association of State Highway and Transportation Officials: Washington, DC, USA, 2007.
- JTG E20-2011; Standard Test Methods of Bitumen and Bituminous Mixtures for Highway Engineering. Ministry of Transport of the People’s Republic of China: Beijing, China, 2011.
- Nie, Y.; Zhang, Y.; Yu, J.; Kuang, D.; Zhang, X. Research on Aging Mechanism and Recycling Mechanism Based on Asphalt Four Components Analysis. Appl. Mech. Mater. 2012, 1975, 1659–1664. [Google Scholar] [CrossRef]


| Serial Number | Material Classification | |
|---|---|---|
| I | I-1 | SMA-13 ordinary asphalt mixture |
| I-2 | SMA-13 ordinary asphalt mixture (after accelerated loading) | |
| II | II-1 | SMA-13 recycled asphalt mixture |
| II-2 | SMA-13 recycled asphalt mixture (after accelerated loading) | |
| III | III-1 | AC-20 recycled asphalt mixture |
| III-2 | AC-20 recycled asphalt mixture (after accelerated loading) | |
| Type of Asphalt Mixture | Oil–Stone Ratio | Dynamic Stability (times/mm) |
|---|---|---|
| SMA-13 recycled asphalt mixture | 6.10 | >6000 |
| AC-20 recycled asphalt mixture | 4.50 | 2896 |
| Index | The Flexural Tensile Strength of the Specimen under Failure, RB (MPa) | Maximum Flexural Tensile Strain at Failure of Specimen, εB × (10−6) | The Bending Stiffness Modulus of the Specimen under Failure, SB (MPa) | |
|---|---|---|---|---|
| Number | ||||
| 1 | 8.38 | 3371 | 2485 | |
| 2 | 8.86 | 3898 | 2274 | |
| 3 | 12.88 | 4387 | 2936 | |
| 4 | 8.67 | 4222 | 2054 | |
| 5 | 10.02 | 4064 | 2464 | |
| 6 | 10.98 | 5232 | 2099 | |
| 7 | 10.68 | 5218 | 2048 | |
| 8 | 9.84 | 4806 | 2048 | |
| Average value | 10.04 | 4399.7 | 2301 | |
| Technical requirement | - | ≥2500 | - | |
| Index | The Flexural Tensile Strength of the Specimen under Failure, RB (MPa) | Maximum Flexural Tensile Strain at Failure of Specimen, εB × (10−6) | The Bending Stiffness Modulus of the Specimen under Failure, SB (MPa) | |
|---|---|---|---|---|
| Number | ||||
| 1 | 11.28 | 3207 | 3517 | |
| 2 | 9.70 | 3683 | 2635 | |
| 3 | 9.32 | 3923 | 2376 | |
| 4 | 10.11 | 3502 | 2886 | |
| 5 | 11.16 | 4748 | 2350 | |
| 6 | 10.77 | 3417 | 3152 | |
| 7 | 9.24 | 3293 | 2804 | |
| 8 | 11.30 | 2923 | 3869 | |
| Average value | 10.36 | 3587 | 2949 | |
| Technical requirement | - | ≥2500 | - | |
| Plan | The Upper Layer (Thickness of 40 mm) | The Bottom Layer (Thickness of 60 mm) |
|---|---|---|
| Plan 1 | SMA-13 ordinary asphalt mixture | AC-20 recycled asphalt mixture; RAP content is 40% |
| Plan 2 | SMA-13 recycled asphalt mixture; RAP content is 20% | AC-20 recycled asphalt mixture; RAP content is 40% |
| Test Condition | Parameter |
|---|---|
| Air flow | 2.0 L/min |
| Hydrogen flow rate | 160 mL/min |
| Test rate | 30 s/scan |
| Activation rate | 50 s/scan |
| Rod load | 100–150 μg |
| Sampling quantity | 1 μL |
Disclaimer/Publisher’s Note: The statements, opinions and data contained in all publications are solely those of the individual author(s) and contributor(s) and not of MDPI and/or the editor(s). MDPI and/or the editor(s) disclaim responsibility for any injury to people or property resulting from any ideas, methods, instructions or products referred to in the content. |
© 2023 by the authors. Licensee MDPI, Basel, Switzerland. This article is an open access article distributed under the terms and conditions of the Creative Commons Attribution (CC BY) license (https://creativecommons.org/licenses/by/4.0/).
Share and Cite
Xia, Q.; Gao, J.; Zhang, Q.; Xu, B.; Sun, Q.; Sun, K.; Yuan, Z. Study of Decay Mechanisms and Rules of Recycled Asphalt Pavement via a Full-Scale Experiment. Coatings 2023, 13, 1955. https://doi.org/10.3390/coatings13111955
Xia Q, Gao J, Zhang Q, Xu B, Sun Q, Sun K, Yuan Z. Study of Decay Mechanisms and Rules of Recycled Asphalt Pavement via a Full-Scale Experiment. Coatings. 2023; 13(11):1955. https://doi.org/10.3390/coatings13111955
Chicago/Turabian StyleXia, Quanping, Jiangping Gao, Qigong Zhang, Bin Xu, Qiang Sun, Ke Sun, and Zhaodi Yuan. 2023. "Study of Decay Mechanisms and Rules of Recycled Asphalt Pavement via a Full-Scale Experiment" Coatings 13, no. 11: 1955. https://doi.org/10.3390/coatings13111955
APA StyleXia, Q., Gao, J., Zhang, Q., Xu, B., Sun, Q., Sun, K., & Yuan, Z. (2023). Study of Decay Mechanisms and Rules of Recycled Asphalt Pavement via a Full-Scale Experiment. Coatings, 13(11), 1955. https://doi.org/10.3390/coatings13111955