Article

Gradation Optimization Based on Micro-Analysis of Rutting Behavior of Asphalt Mixture

1
Shandong Railway Investment Holding Group Co., Ltd., Jinan 250102, China
2
School of Transportation Civil Engineering, Shandong Jiaotong University, Jinan 250357, China
3
Jiqing High Speed Railway Co., Ltd., Jinan 250101, China
4
Shandong Yimeng Communications Engineering Co., Ltd., Linyi 276004, China
*
Authors to whom correspondence should be addressed.
Coatings 2023, 13(11), 1965; https://doi.org/10.3390/coatings13111965
Submission received: 24 October 2023 / Revised: 12 November 2023 / Accepted: 14 November 2023 / Published: 18 November 2023
(This article belongs to the Special Issue Asphalt Pavement: Materials, Design and Characterization)

Abstract

:
This study investigates the microscopic mechanism of the force on particles of different particle sizes in the asphalt mixture during rutting formation. The gradation was optimized by analyzing the particle force results. The enhanced discrete element method (EDEM) was used to simulate the rutting test, study the correlation state between different particle sizes in the rutting process, and analyze the rutting of asphalt pavement from the aggregate level. From a microscopic perspective, the specific forces acting on particles at different times were determined to investigate the particle size range of stressed particles in two types of asphalt mixtures. Furthermore, the role of particles with different sizes in the rutting process was analyzed. The force limit values of particles with different particle sizes are fitted, and the force of particles in two types of asphalt mixtures is compared and analyzed. After that, the gradation of the asphalt mixture is optimized, and the feasibility of the gradation optimization method is verified by laboratory experiments. The results show that the change rule of the rutting simulation test is gradually transformed from compacted rutting to unstable rutting. The force of the asphalt concrete-13 (AC-13) asphalt mixture is borne by the particles with a radius greater than 1.8 mm. The force of the stone matrix asphalt-13 (SMA-13) asphalt mixture is borne by the particles with a radius greater than 3.6 mm, and the small particle size particles play a filling role. When the particle radius is less than 5.1 mm, the force value of AC-13 asphalt mixture particles is greater than that of SMA-13. When the particle radius exceeds 5.1 mm, the force value of SMA-13 asphalt mixture particles is greater than that of AC-13. The force of particles with a radius of 5.7 mm and 7.3 mm in the SMA-13 asphalt mixture is 30% higher than that in AC-13, and the force limit of particles is proportional to the particle size. The dynamic stability, flexural tensile strength, water immersion residual stability, and freeze-thaw splitting strength ratios of the optimized asphalt mixture are improved compared with those before optimization. The AC-13 asphalt mixture is increased by 8.5%, 9.2%, 1.6%, and 1.9%, respectively, and the SMA-13 asphalt mixture is increased by 10.6%, 7.3%, 0.7%, and 2.1%, respectively. It shows that the grading optimization method is feasible.

1. Introduction

Asphalt mixtures have become the first choice for high-quality pavement materials. It has the advantages of high safety, comfortable driving, short construction time, and low maintenance costs. It was widely used in the construction of high-grade highways and municipal roads in China. The asphalt mixture will be subjected to wheel long-term rutting deformation during service, which will affect the overall strength of the pavement and driving comfort. The serious rutting will threaten the safety of driving [1,2,3,4]. Therefore, it is of great significance to study the structural role of different particle sizes in asphalt mixtures during the rutting process and to deeply understand the mechanism of rutting formation for the design of the rutting resistance of asphalt mixtures.
In the past, research on rutting was mainly carried out by laboratory tests and theoretical deduction. Laboratory rutting is an engineering test method to simulate the real wheel load of asphalt pavement and produce rutting in the laboratory, which is widely used in scientific research and engineering practice. This test mainly includes a standard rutting test, a Hamburg wheel-track device (HWTD), and an asphalt pavement analyzer (APA). The results show that the rutting test results of slab specimens cannot truly evaluate and predict the actual rutting resistance of asphalt pavement, and the construction methods and the problems involved in the selection of raw materials will affect the rutting performance of the field pavement and slab specimens, resulting in a difference in rutting performance [5,6]. HWTD and APA are also applicable in China. Huang et al. [7] evaluated the high-temperature performance of a TB composite-modified asphalt mixture through an HWTD test. Wang et al. [8] studied the influence of the shape and porosity of the asphalt mixture specimen on the APA rutting test. Du et al. [9] carried out HWTD and APA tests on asphalt mixture specimens with different aggregate crushing values and obtained their application scope. However, the comparative study of related experiments is not comprehensive enough. The accuracy of several rutting test methods to evaluate the anti-rutting performance of asphalt mixtures remains to be verified.
The theoretical approach to the rutting problem started earlier in foreign countries. In 1972, Barksdale and Romain [10,11] proposed the elastic layered system method. The method is to stratify the pavement, calculate the deformation of each layer by linear or nonlinear elastic layered system theory, and then accumulate the deformation of each layer. In 1976, Hills and Van de Loo [12] put forward the Shell rutting calculation method, which is the most widely used method for asphalt pavement rutting at home and abroad. The model assumes that the deformation of the asphalt mixture is caused by sliding between adjacent mineral aggregates, and the relationship between asphalt mixture stiffness and asphalt stiffness is obtained through creep tests. In 1979, Huschek [13] proposed a modified Maxwell model to characterize the viscoelastic properties of the mixture. The viscosity of the generalized sticky pot is a function of time and increases with time. In 1994, Sousa [14] established the viscoelastic-plastic method on the generalized Maxwell model and obtained the relationship between the maximum permanent strain and the depth of rutting using the Von Mises plastic mechanical model and the associated flow criterion. The theoretical derivation is based on the rut deformation theory obtained by previous scholars. Combined with the actual road surface structure, pavement material properties, and on-site use environment. The causes and development of rutting are explored, and the theory of rutting deformation is further studied and deduced. However, these theoretical studies are carried out on the premise of simplifying the model and the ideal environment, basically analyzing the rutting in a macro way and rarely involving the micro aspect. In addition, due to the complexity of actual working conditions and the instability of material properties, the conclusions derived from theoretical derivation are difficult to apply directly to practical engineering.
With the development of science and technology, the use of computers to simulate the microstructure of different specimens has become widespread. In the field of research on asphalt mixtures, the discrete element method has a great advantage in reflecting the inhomogeneity and discontinuity of the material interior [15,16,17,18], without satisfying the conditions of deformation coordination and displacement continuity. Therefore, it is suitable for the analysis of nonlinear problems such as rutting and fracture [19,20,21]. Scholars have shown that the discrete element method (DEM) can accurately simulate laboratory rutting tests of asphalt mixtures [22,23,24]. Ma et al. [25] established a three-dimensional discrete element model of asphalt mixtures from randomly generated aggregates to simulate rutting deformation under virtual wheel load. Yu [26] analyzed the influence of material differences on rutting deformation by simulating an asphalt mixture single-layer rutting test and a double-layer rutting test. The results showed that a high-modulus asphalt mixture has better resistance to rutting deformation. Ma et al. [27,28] also conducted high-temperature creep tests and virtual rutting tests based on DEM to predict the permanent deformation of asphalt mixture specimens. In addition, the durability of the pavement is closely related to the asphalt mixture design methodology [29,30], which should not only have good structural stability but also meet both high and low temperature performance requirements [31,32]. It is found that the asphalt mixture gradation can be optimized by DEM simulation of aggregate structure from the perspective of mechanical properties. Chen et al. [33] used DEM simulation to reveal the properties of asphalt mixtures with different aggregate particle sizes and gradations. Jiang et al. [34] established the discrete element models of fine-graded and coarse-graded mixtures and studied the effect of gradation on structural stability. Miao et al. [35] used DEM to study and analyze the skeleton structure and aggregate function of an asphalt mixture. The skeleton structure and properties of the asphalt mixture were further analyzed from the perspective of micro-scale structure. H. Yu et al. [36] established a three-dimensional discrete element model to study the influence of angular distribution and aggregate particle size distribution on the dynamic modulus of asphalt mixtures.
Different particle sizes play different roles in the formation of rutting, which leads to different degrees of rutting damage. In previous studies, an asphalt mixture was used as a continuous medium. The role of particles in asphalt mixtures was rarely considered. Research on using rutting simulation results to optimize the gradation of asphalt mixtures was rarely involved. In this study, the rutting process of the asphalt mixture was simulated using EDEM. The force and role of particles with different particle sizes during the rutting process were studied. Based on the research results, the gradation of the asphalt mixture was further optimized, which provided a theoretical basis for the further study of the anti-rutting design of the asphalt mixture.

2. Discrete Element Simulation

2.1. Establishment of Material Model

Aggregate accounts for more than 90% of the quality of the asphalt mixture and plays an important role as structural support in the mixture to maintain good durability, stability, and pavement deformation ability [37,38,39]. All simulations are performed using EDEM version 6.2.0. The aggregate is composed of particles of different sizes. To simplify the modeling, the minimum sieve size is limited to 2.36 mm, and the mass ratio of aggregate particles in each sieve interval is calculated (Figure 1a). The median value of each sieve interval is used as the particle size passing through the sieve interval. In this paper, only the influence of particle size on the simulation results was investigated. Without considering the shape characteristics of the particles, the particles simulated in the software are all circular particles (Figure 1b). According to the morphological characteristics of the real particles and the particles built in the software, it can be seen that the difference between the particle size of the built particles and the real particles is small. In addition, the mechanical parameters of the discrete element particles need to be determined in the software to correspond to the relevant materials, in which the particle material is rock, the container material containing particles is steel, and the test wheel material is rubber. In the simulation process, the friction coefficients selected between different materials are different. (Figure 1c). According to the difference in geometric characteristics, the discrete element is divided into two categories: particle and block, in which the contact between particle and particle and between particle and boundary is simulated by a vibration equation [40]. The contact model is represented as a vibration model (Figure 1d).

2.2. Interparticle Contact Model

As far as the current computer performance is concerned, the asphalt mortar part cannot be simulated by using a large number of small particles. In this paper, the Hertz-Mindlin with bonding model in EDEM is used to replace the asphalt mortar part that plays a cementing role. Before the particles are bonded, the standard Hertz-Mindlin contact model is used to generate interaction between the particles. After the bonding occurs, the force and moment on the particles are set to 0, and the values of the force and moment are adjusted at each calculation time step by Equations (1)–(6).
δ F n = υ n S n A δ t
δ F t = υ t S t A δ t
δ M n = ω n S t J δ t
δ M t = ω t S t J 2 δ t
A = π R B 2
J = 1 2 π R B 4
where R B is the bonding radius; J is the moment of inertia; A is the area; δ t is the time step; υ n , υ t are the normal and tangential velocities of particles; ω n , ω t are the normal and tangential angular velocities of the particles; S n , S t are the normal and tangential stiffness of the particles. When the normal and tangential shear stresses exceed a predefined value, the bond breaks:
σ max < F n A + 2 M t J R B
τ max < F t A + M n J R B
According to the above theory, the asphalt mixture particle model is constructed in EDEM, which can reflect the relative motion forms such as tension, slip, compression, and rotation between particles and allow the transfer of force and moment between particles. Therefore, the above theoretical model can better simulate the relative motion between the mineral particles in the asphalt mixture and accurately reflect its constitutive relationship.

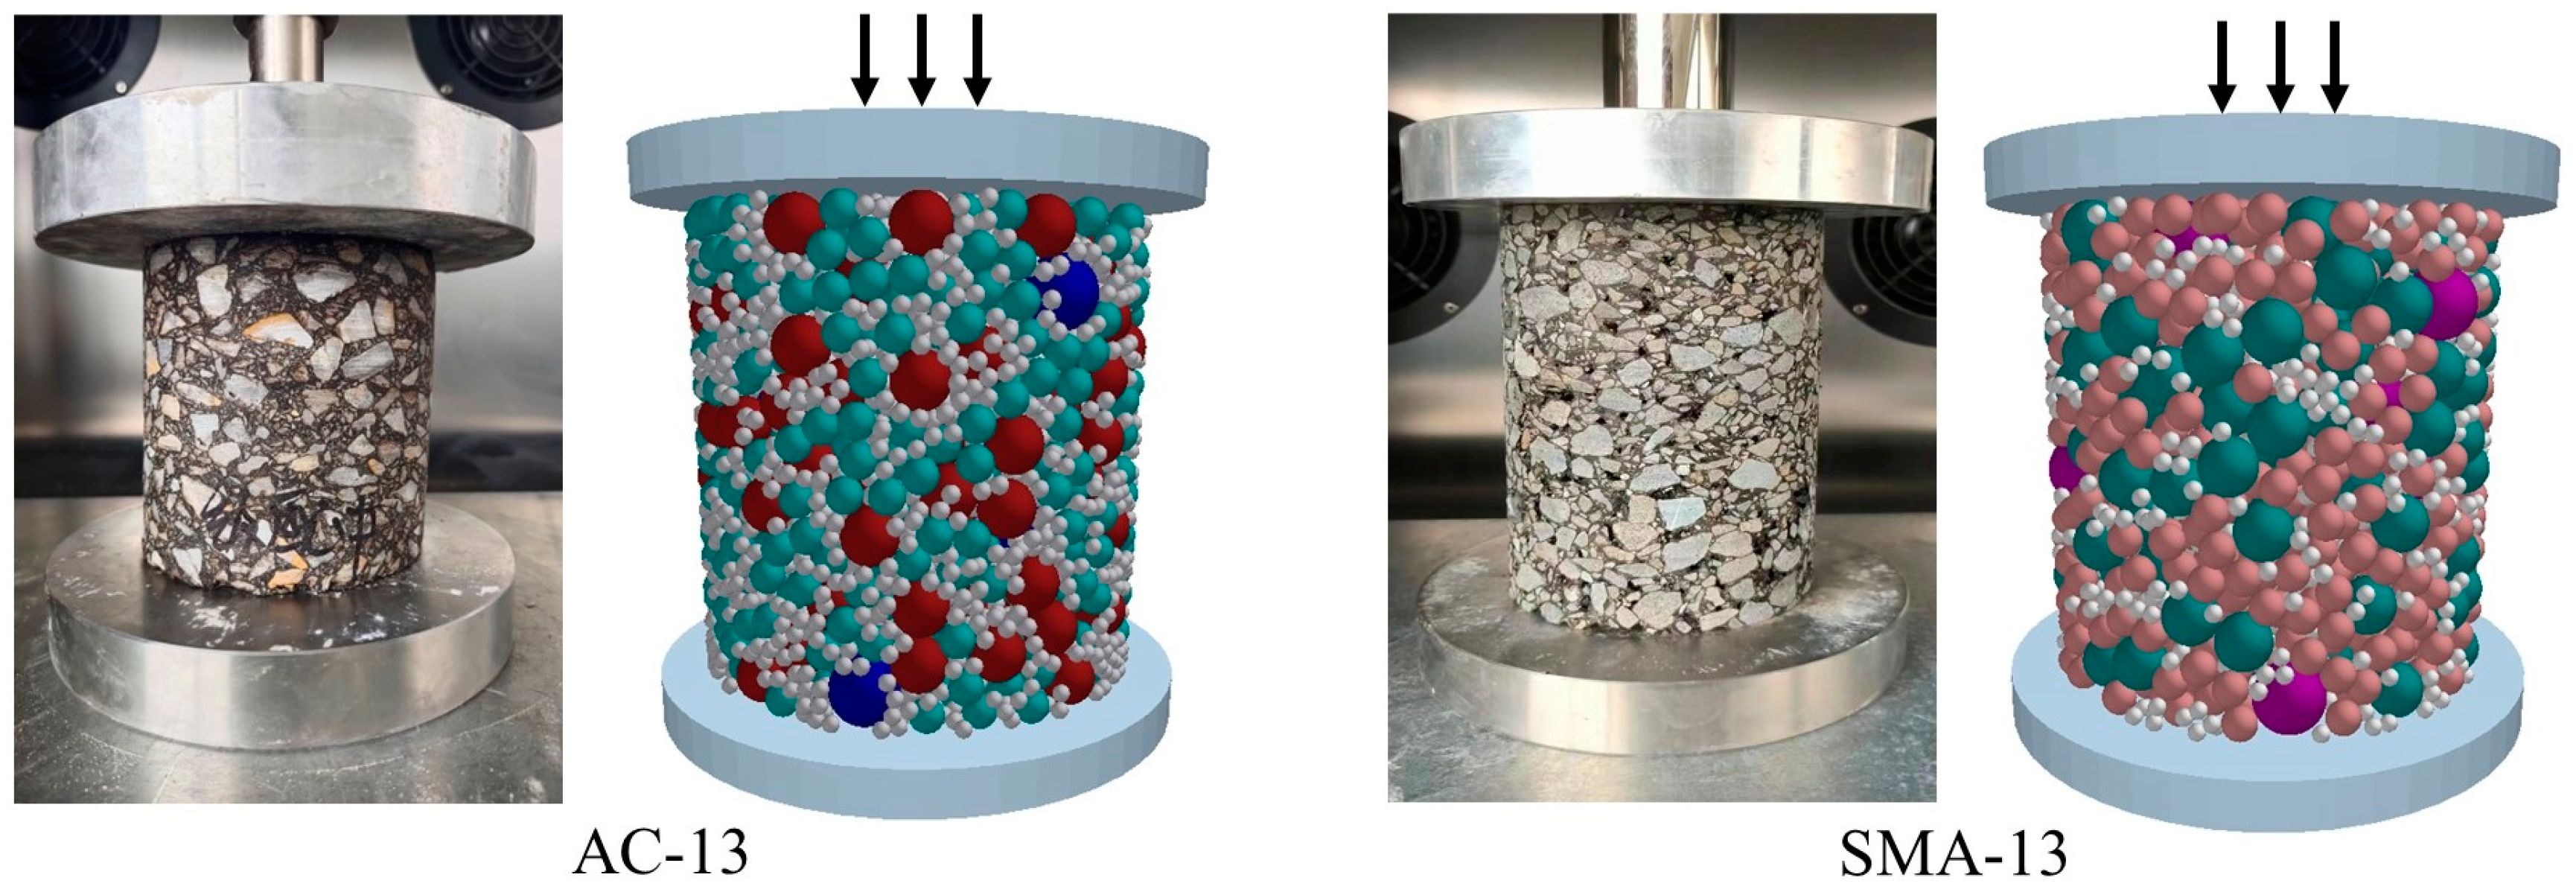
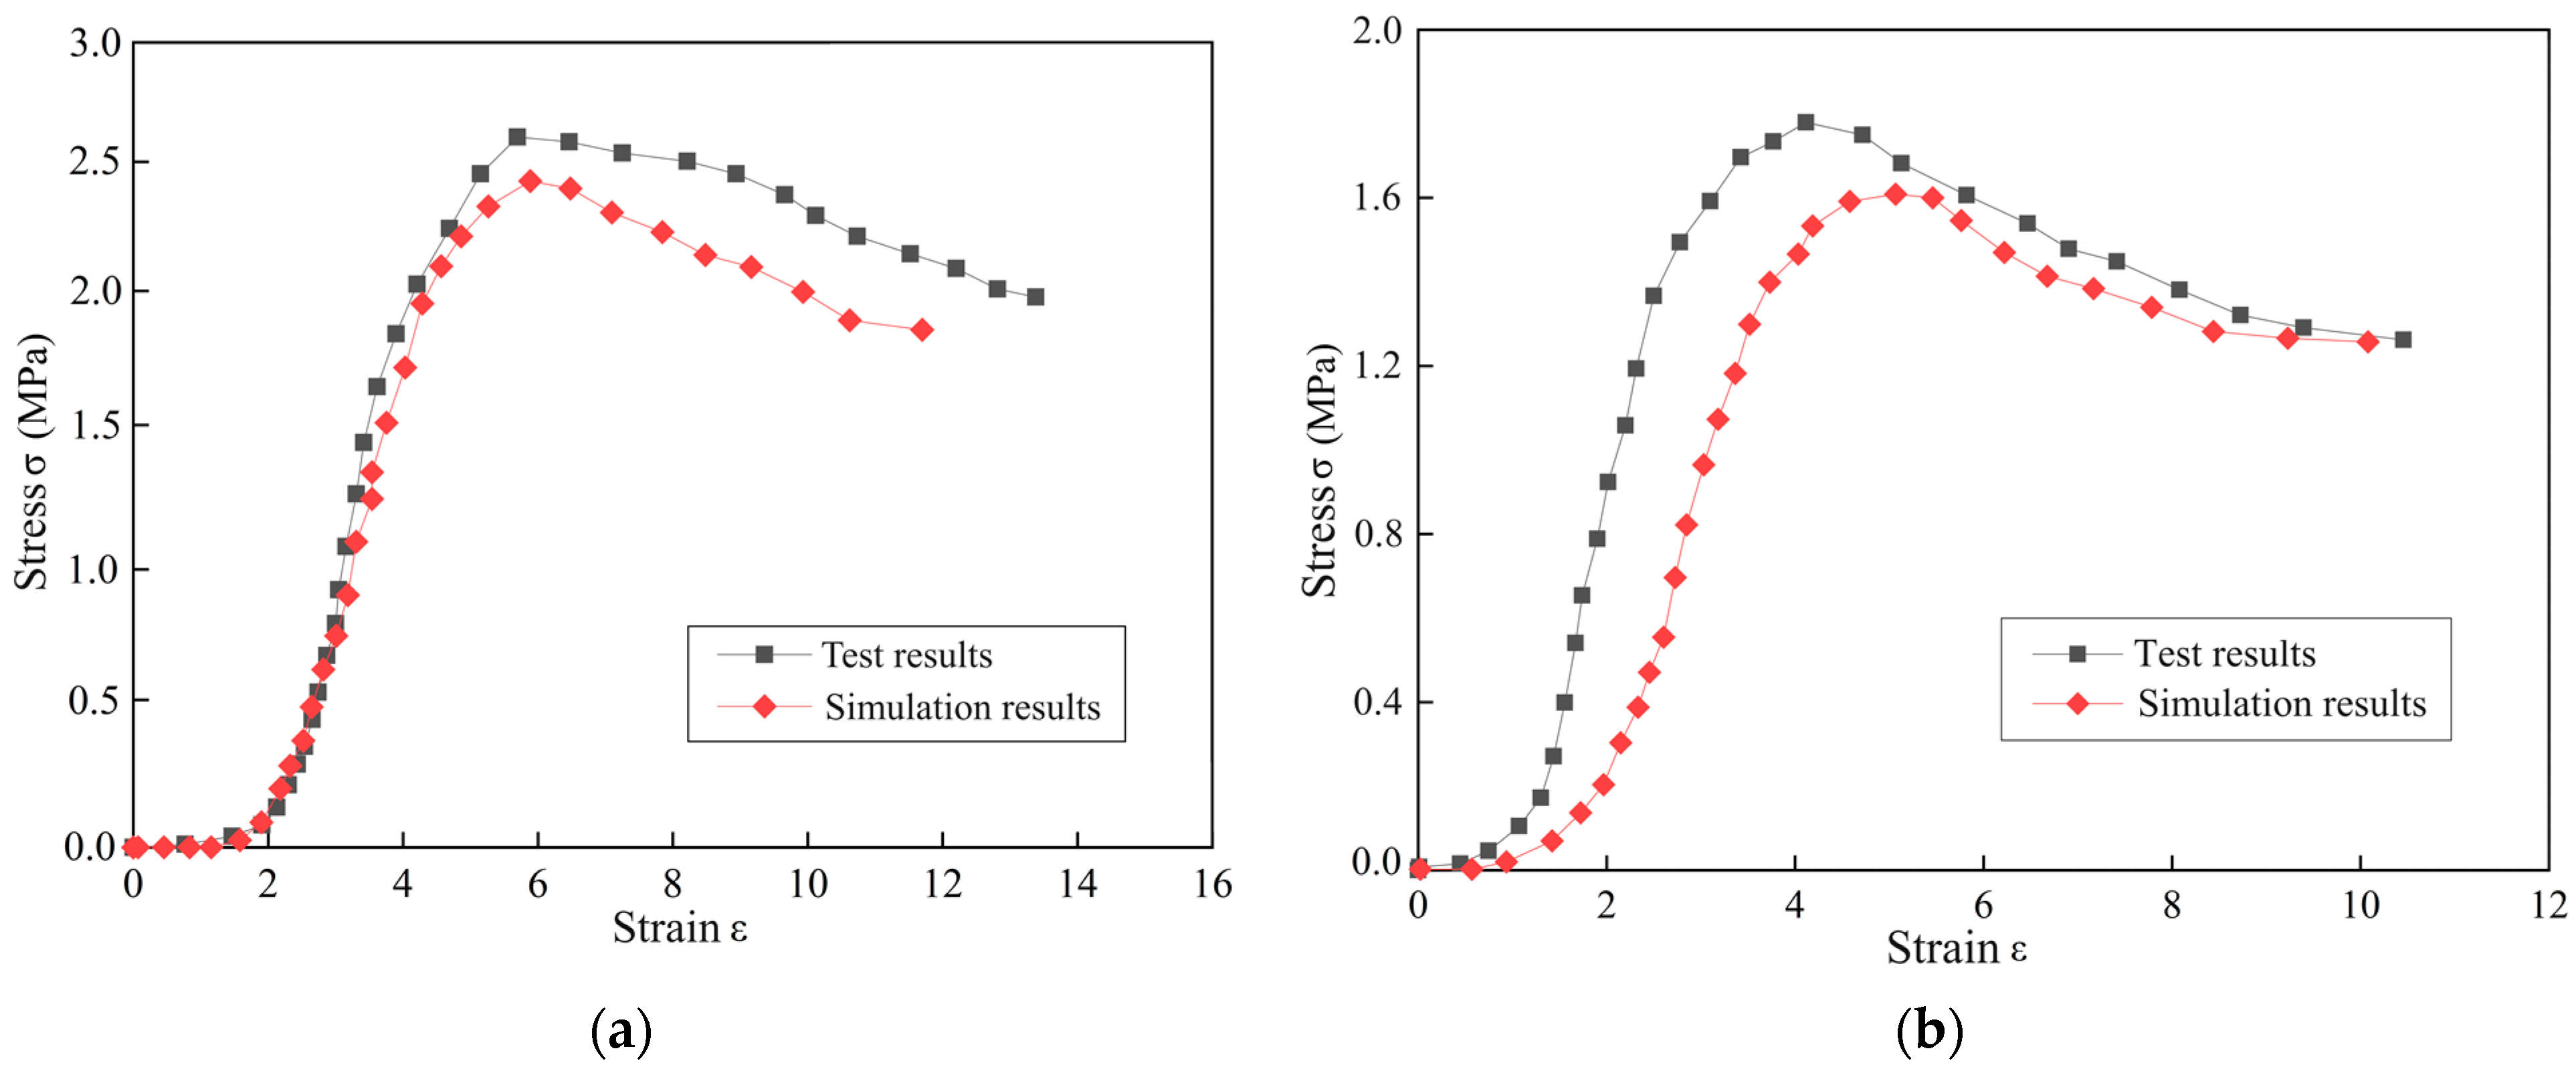
2.3. Material Parameter Calibration

In EDEM, the main parameters of the bonding model include: normal stiffness ( K n ), shear stiffness ( K s ), critical normal stress ( σ n ), critical shear stress ( σ s ), and bonded disk radius ( R B ). The setting of the above parameters directly affects the interaction mode and mechanical properties between particles and has an important impact on the simulation results.
The bonding model parameters are calibrated by simulation and experimental data, as shown in Figure 2. At present, the commonly used method to determine the parameters of the material model is the “trial and error method”. The stress-strain curve is obtained by a laboratory uniaxial compression test, and then the simulation uniaxial compression test is carried out. By continuously adjusting the mesoscopic parameters to fit the stress-strain curve of the laboratory experiment, the appropriate mesoscopic parameters are obtained. These parameters can better reflect the macroscopic properties of the material [18,41]. After many experiments and simulation results, the microscopic parameters are shown in Table 1. The comparison between the experimental results and the simulation results is shown in Figure 3, and the error is less than 10%. It shows that the mesoscopic parameters of the discrete element model are feasible for rutting simulation. The following research is based on the simulation results for further analysis.

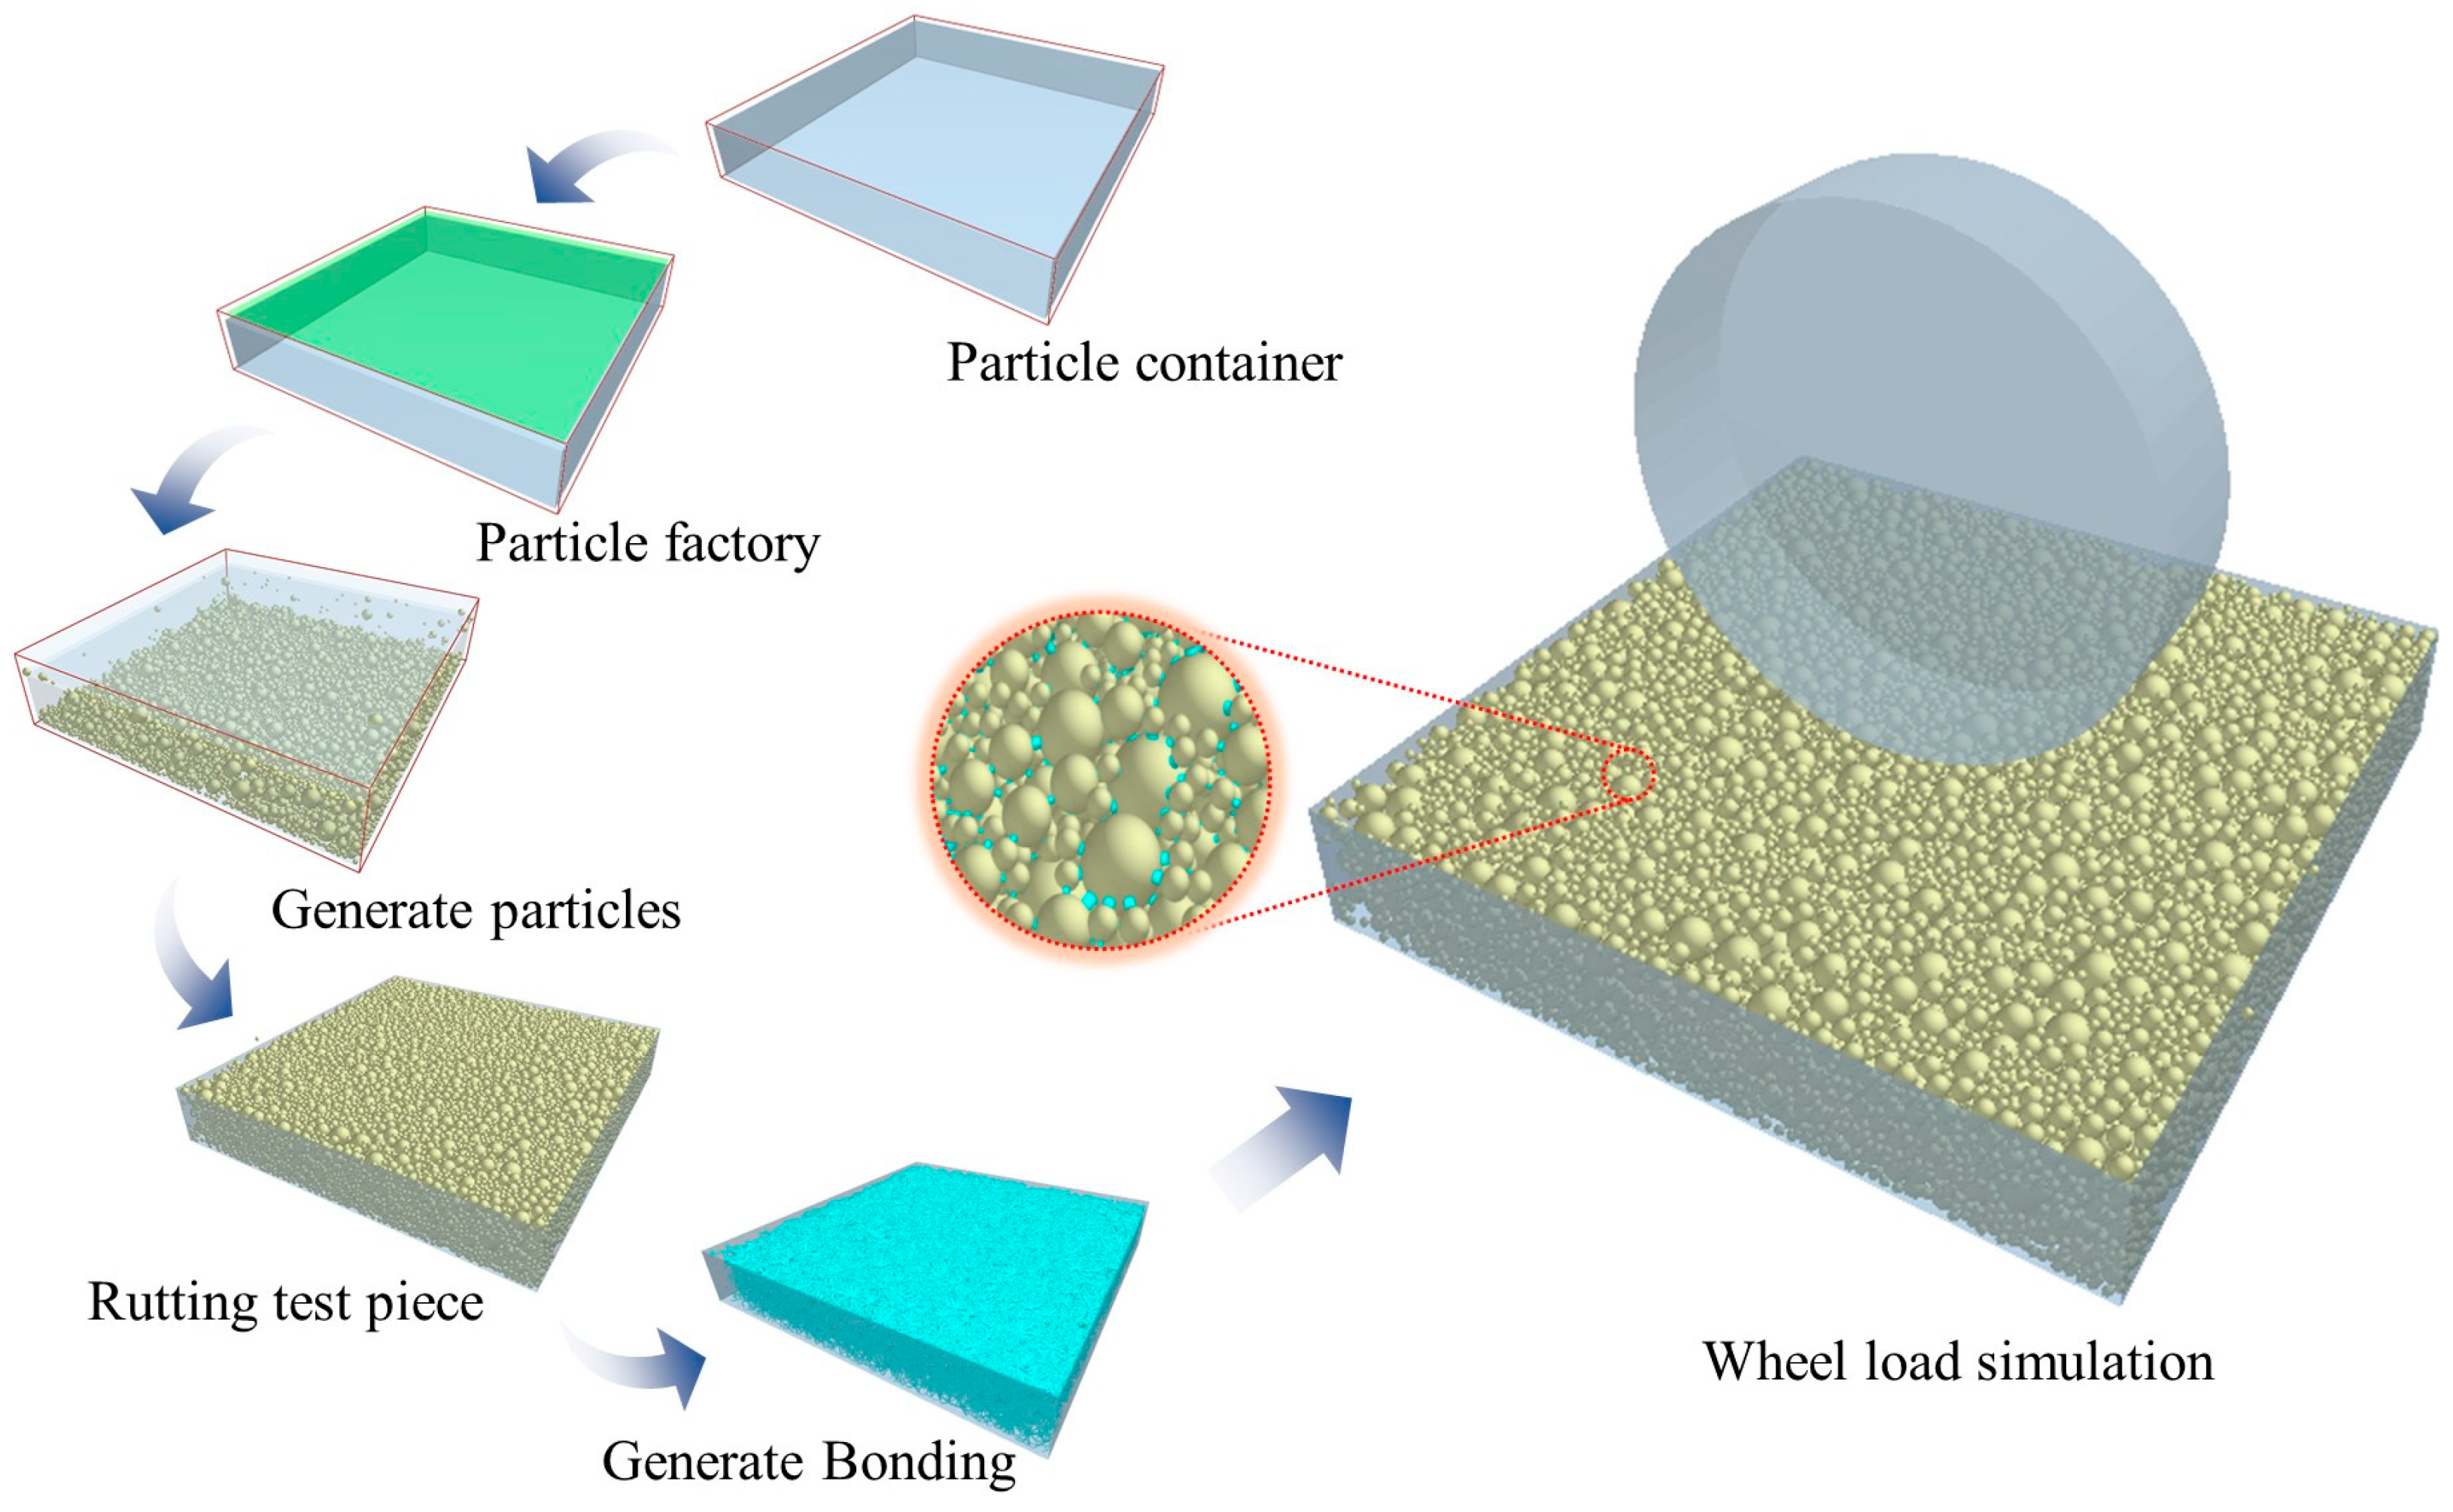
2.4. Establishment of Rutting Model

The discrete element model of rutting was established by EDEM. The particle container was created according to Standard JTG E20-2011 T0719-2011 in China [42]. The particle container is created with a size of 300 mm × 300 mm × 50 mm, and the particle factory for generating particles is established above it. After the particle generation is completed, a cylinder is set vertically above the specimen for the simulation of the tire. The establishment process of the rut model is shown in Figure 4. It is difficult to realize the dynamic loading mode of laboratory rut rolling in EDEM. In this paper, the loading mode of wheel pressure on the specimen is simulated by referring to the speed of 0.01 m/s downward set in reference [43]. The total time is 2.5 s, which meets the requirement of stopping the test when the maximum deformation of the specimen reaches 25 mm in the specification.

3. Simulation Results and Analysis

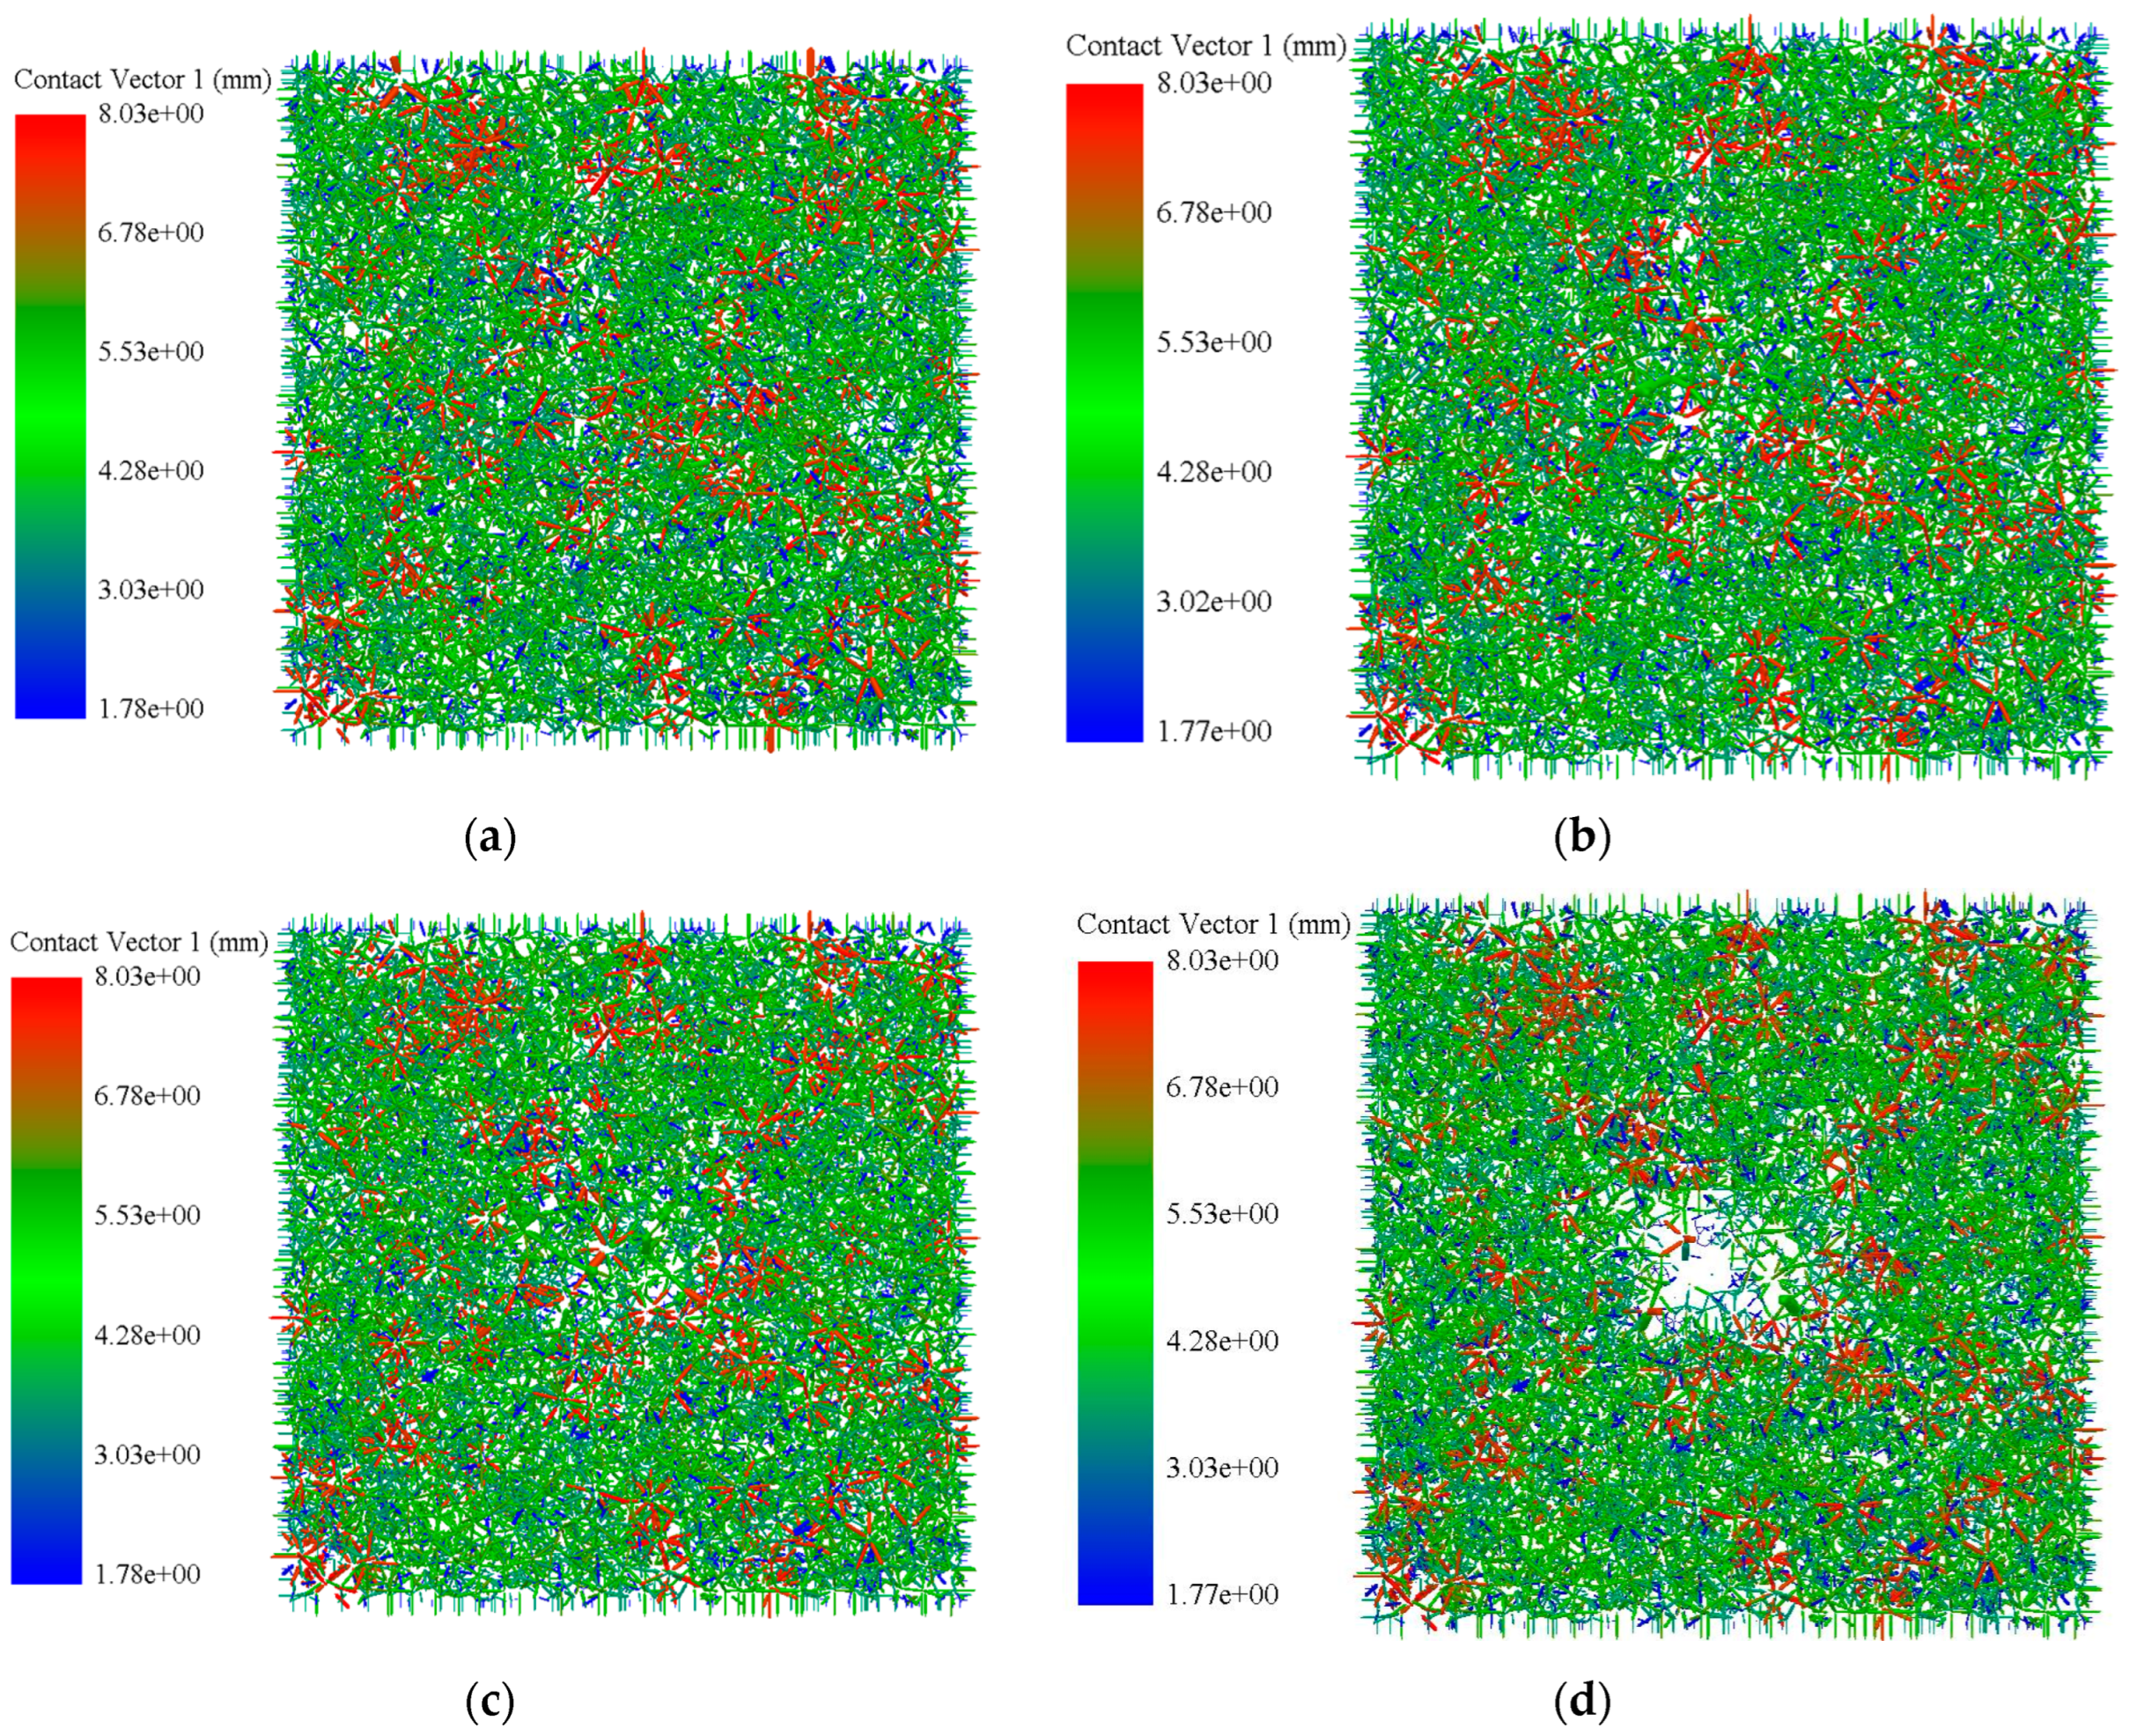
3.1. Interparticle Correlation State Analysis

The interaction of axial force between particles is expressed in the form of a purple columnar short line between particles. The appearance of the columnar short line changes in real time according to the compression state of the asphalt mixture, so as to obtain the change in interaction between aggregate particles in the process of rutting. The particle connections of the two types of asphalt mixture at different times during compression are shown in Figure 5.
The small particle-size particles of the AC-13 asphalt mixture are larger, and the total number of particles is larger, so the columnar short lines between particles are dense. At the beginning (Figure 5a), the columnar short lines between the particles maintain their normal appearance. When the simulation time reaches 0.5 s (Figure 5b), the wheel exerts a pressure effect on the asphalt mixture. The short columnar line between the particles at the compression point becomes thicker, indicating that the particles under the wheel remain under pressure. At this time, the asphalt mixture is in a state of compaction. When the simulation time reaches 1.5 s (Figure 5c), the connection of particles under the wheel gradually becomes thicker and denser. It shows that after the wheel presses some aggregate particles to both sides of the wheel, the remaining particles have been under the wheel to bear the pressure. When the simulation stops (Figure 5d), it can be found that the columnar short lines between the particles under the wheel are basically in a coarse state, and there are still normal columnar short lines at the bottom. It shows that a large number of small particle-size particles will continue to move downward during the rutting process of the asphalt mixture, so that the large particle-size particles are suspended in the small particle-size particles and cannot form an embedded skeleton.
The large particle-size particles of the SMA-13 asphalt mixture are more, and the total number of particles is less, so the columnar short lines between particles are sparse. At the beginning (Figure 5e), the contact distribution between particles is uniform, and the overall appearance of the columnar short line is uniform. When the simulation time reaches 0.5 s (Figure 5f), the short line of contact between the particles at the compression point becomes thicker and denser. It shows that the asphalt mixture becomes dense under the pressure of the wheel, and the connection of other parts does not change greatly. Therefore, it is determined that the rut generated at this stage is a compacted rut. When the simulation time reaches 1.5 s (Figure 5g), the contact between the particles at the pressure becomes sparse, and only a small number of short lines between the particles are coarse. It shows that the asphalt mixture at the compression point is loose, and the position moves. Compacted rutting gradually transformed into unstable rutting. At the end of the simulation (Figure 5h), it can be found that the particles at the compression point are no longer connected, and the short line between the particles on both sides of the compression point appears thick and dense. It shows that the rutting type at this stage is unstable rutting. Shear deformation occurs between the aggregate particles under the wheel, resulting in some aggregate particles being squeezed into both sides of the wheel.

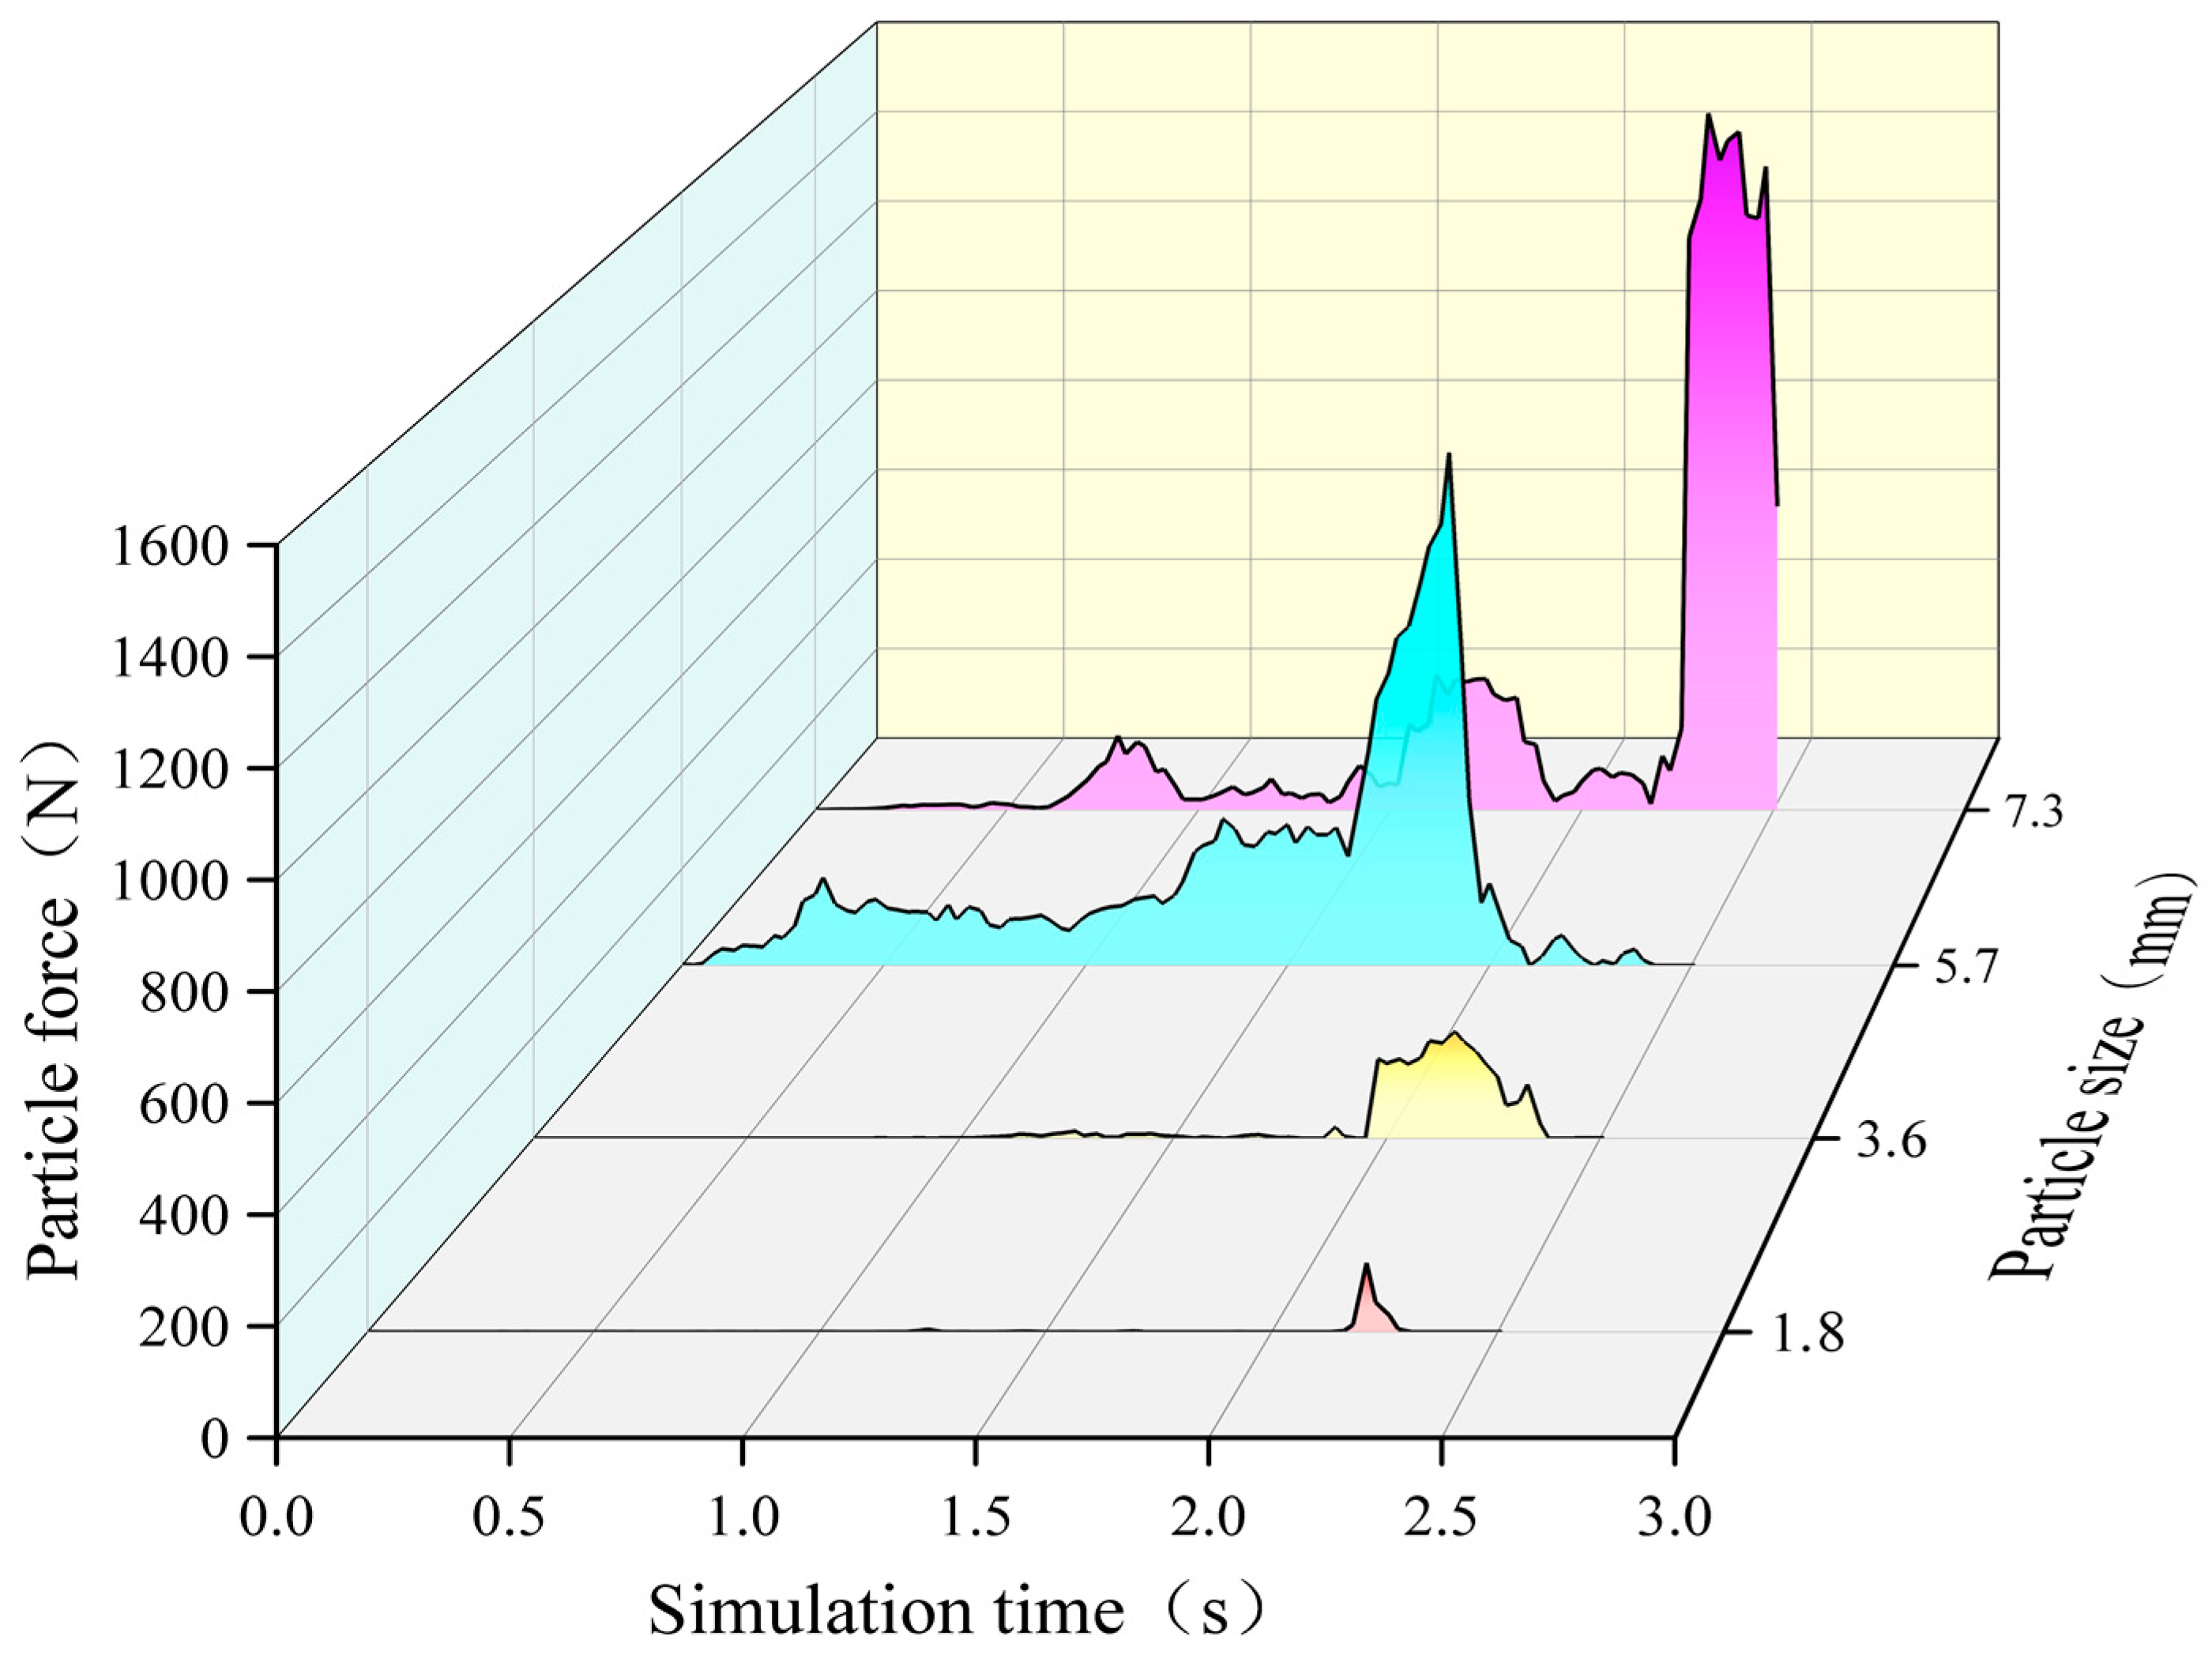
3.2. Force of Particles with Different Sizes in Rutting

According to different particle sizes, the connection between particles is enhanced by color. The largest particles are set to red, the smallest particles to blue, and other medium-sized particles to green. Then the effect of different particle sizes on the process of rutting is analyzed. The connection of particles with different particle sizes at different times in the AC-13 and SMA-13 asphalt mixtures is shown in Figure 6 and Figure 7.
It can be seen from Figure 6 that the colors of all particles are presented at the initial time, indicating that the connections between particles with different particle sizes are relatively uniform. When the simulation reaches 0.5 s, the wheel produces pressure on the asphalt mixture. It is obvious from the figure that the blue particles are less connected. The particles above the medium particle size move slightly after being subjected to wheel pressure, and the contact with other particles becomes close. At this stage, the asphalt mixture becomes dense after being compressed. When the simulation reaches 1.5 s, the contact of large-sized particles at the pressure becomes denser. It shows that the large particles move under shear and bear part of the pressure. At the end of the simulation, the blue particle contacts in the non-loaded area increase. It shows that the shear sliding occurs between the large particle size and the medium particle size particles at the compression point, and the particles are suspended in the small particle size particles after losing the bearing capacity, which has a certain squeezing effect on the small particle-size particles.
It can be seen from Figure 7 that the relationship between particles of different particle sizes is also relatively uniform at the initial time. When the simulation reaches 0.5 s, the number of large-sized particle connections at the pressure decreases, while the medium-sized particle connections become thicker. It shows that the large-sized particles as a whole move downward while sliding and cutting off the connection with other particles. At the same time, the pressure is transferred to the medium-sized particles to make the contact between the particles closer. The particles are redistributed after compression, which makes the asphalt mixture dense. When the simulation reaches 1.5 s, the contact of large-sized particles at the compression point is significantly reduced because most of them are squeezed to both sides of the wheel. The connection between other particle-size particles at the compression point also becomes sparse. It shows that the small and medium particles gradually produce shear sliding, and the bearing capacity decreases. At the end of the simulation, the connection between the particles at the pressure is sparse, and the asphalt mixture loses its bearing capacity. The medium-sized particles on both sides of the wheel are more densely connected. The reason is that most of the medium-sized particles are squeezed onto both sides of the wheel after being sheared and piled up together after redistribution.

3.3. The Force Curve of Particles in Asphalt Mixtures

The above contents are studied based on the force relationship between particles in a macroscopic way, and the change in interaction between aggregate particles during the rutting process is analyzed. However, it is difficult to obtain the specific force of different particle sizes with time only in the macroscopic way. The following will be studied from the perspective of the microscopic force of particles.

3.3.1. Force Curve Analysis of Particles with Different Sizes

The relationship between the force and time of different particle sizes of the AC-13 asphalt mixture is shown in Figure 8.
It can be seen from Figure 8 that the force of particles with a particle radius of 7.3 mm gradually increases before 0.5 s. Then, the force began to fluctuate, but overall, it was relatively stable. It shows that the asphalt mixture is in a compacted state. The particle force reaches its peak at 1.6 s. The particles are compacted to the limit, and the bearing capacity reaches 1092.81 N. Then the force began to decline for 2 s, and the particles moved under shear. The force fluctuates again after 2 s, and the particles still bear the load. It shows that the selected particles have been under the wheel without shear failure. The force curves of particles with particle radii of 5.7 mm and 3.6 mm are similar. The initial force is relatively stable, and the force is small. The two particles are suspended in the initial compaction process of the asphalt mixture. Then the force of the particles gradually increases, and the contact between the particles begins to bear the external pressure. When the particle force curve reaches its peak, it begins to decline sharply. It shows that the shear failure occurs after the particle reaches the limit under compression and is no longer used as a pressure-bearing structure. The force of particles with a particle radius of 1.8 mm is significantly smaller than that of other particle sizes. It can be seen from the time of the peak force that the particle only plays a role in transmitting pressure during the compaction stage of the asphalt mixture. The particle force is 0 after 0.7 s, and it is inferred that the particle is pushed to both sides of the wheel by other particles or in other particle gaps to fill the gap. In the process of asphalt mixture rutting, the particles in the asphalt mixture contact each other and form a stable structure. This skeleton can increase the strength and stability of the asphalt mixture. The force of different particle sizes is different, and the effect is different.
The relationship between the force and time of different particle sizes in the SMA-13 asphalt mixture is shown in Figure 9.
According to Figure 9, particles with a particle radius of 7.3 mm are less and stable before 0.6 s. It shows that the asphalt mixture is in the compaction stage. There are small peaks at 0.8 s and 1.7 s, respectively. It shows that the particles are subjected to the pressure of the upper wheel and shear with other particles at these two times. The large-sized particles as a whole slide downward while squeezing other particles elsewhere. At 2.4 s, the mutation occurs, and the large-size particles are in the compaction limit state, and the bearing capacity reaches 1518.53 N. After that, the force decreased sharply, indicating that the shear failure occurred after the particles were compressed and the bearing capacity was lost. The particles with a radius of 5.7 mm increase slowly before 1.6 s and are in a compacted state. It increased sharply after 1.6 s and reached the peak bearing capacity of 1061 N at 1.9 s. Then it decreases sharply, and the particles are also subjected to shear failure and cannot continue to bear the load. The particles with a radius of 3.6 mm are not stressed before 1 s. It peaked at 2.2 s and then decreased rapidly. The force value at the peak value is only 20% of the maximum force value of the upper particle size, which cannot be the main bearing object. It shows that the particles with a particle size of more than 3.6 mm in the SMA-13 asphalt mixture are the main part of the force. The force trend of particles with a radius of 1.8 mm is similar to that of other particle sizes. However, its force is too small, and it only plays a filling role in the asphalt mixture. In the process of asphalt mixture rutting, pressure will be applied to the asphalt mixture. These forces can further enhance the interaction between particles and form a more compact skeleton structure. The formation of this skeleton structure has an important influence on the performance and service life of asphalt mixtures. It can increase the anti-deformation ability of the asphalt mixture and reduce the occurrence of rutting.

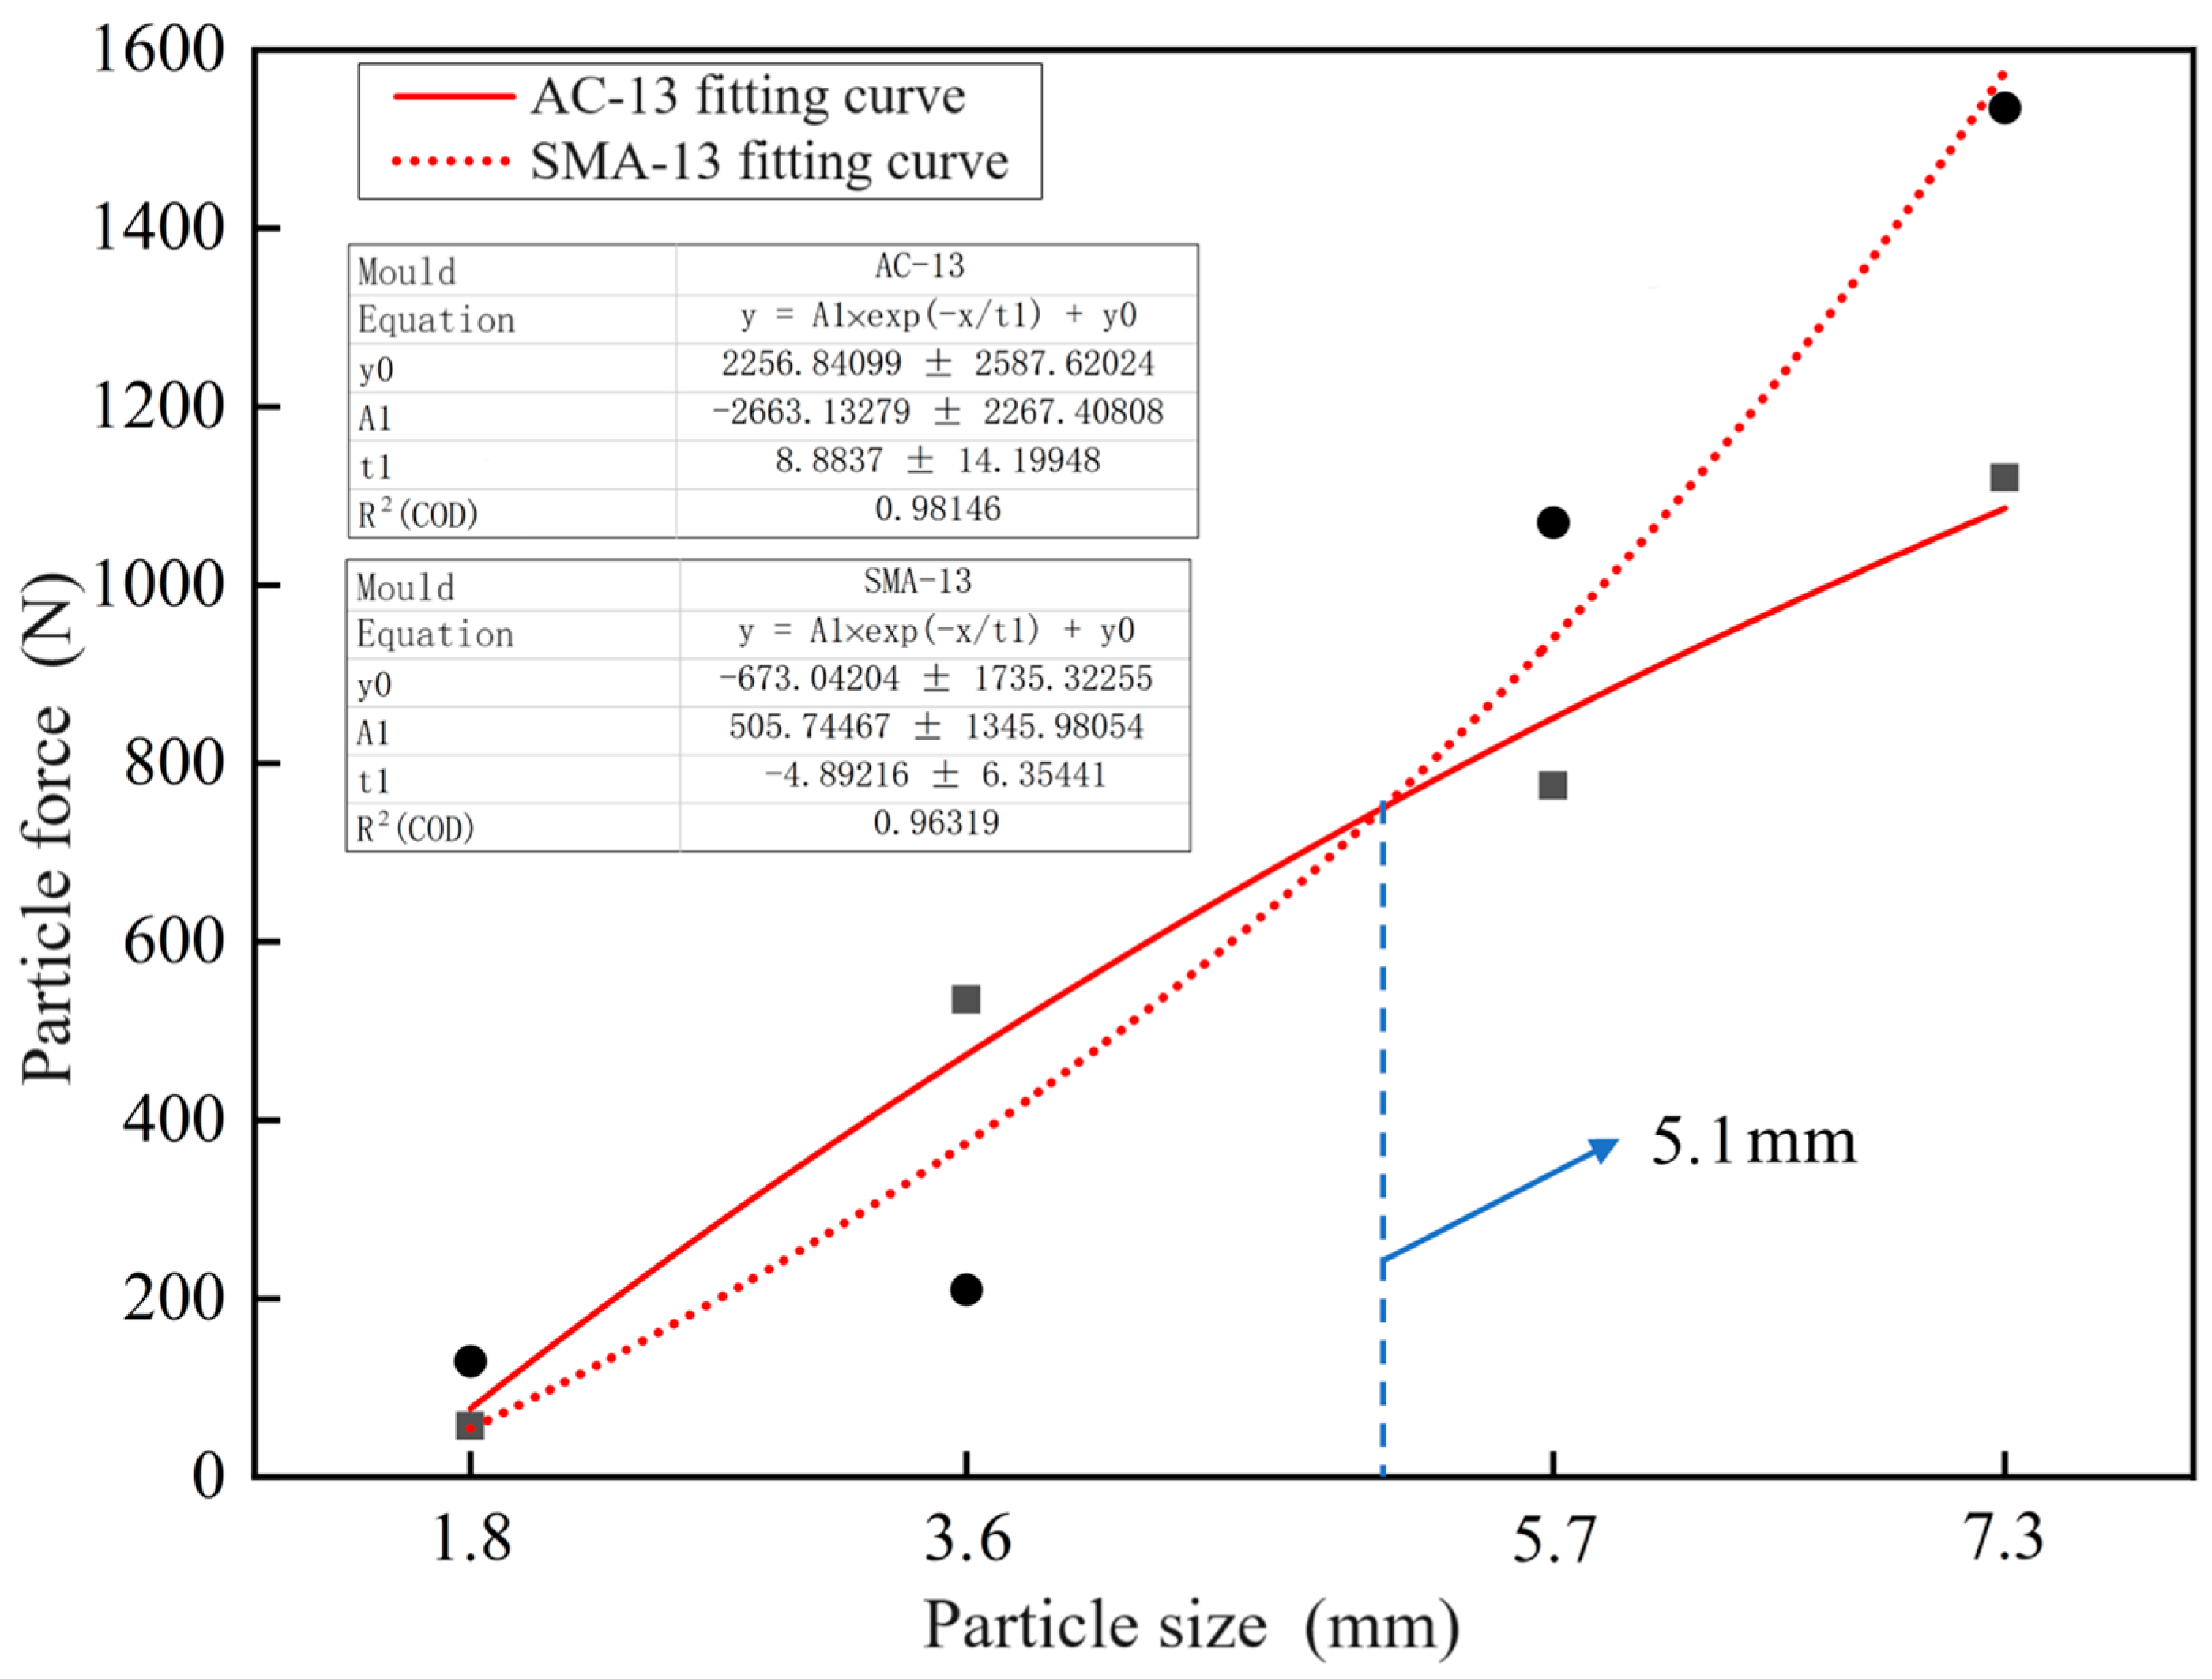
3.3.2. Comparative Analysis of Forces on Particles of the Same Size

The force curve of particles under the same particle size in the AC-13 and SMA-13 asphalt mixtures is shown in Figure 10.
It can be seen from Figure 10 that the AC-13 asphalt mixture under the four particle sizes reaches the stress limit time earlier than the SMA-13 type. Under the same applied conditions, the SMA-13 asphalt mixture is compacted deeper in the compacted rutting stage, indicating that its porosity is greater than that of AC-13. By observing the interval between the two types of asphalt mixtures reaching the force limit value under each particle size, it is found that the larger the particle size, the shorter the interval between the two mixtures reaching the force limit value. This time interval change is mainly caused by AC-13 particles. In the SMA-13, the time for particles of different particle sizes to reach the force limit value is maintained at about 2 s. In the AC-13, with the decrease in particle size, the earlier the time for particles to reach the force limit value, the above time interval changes. The small particles in the AC-13 asphalt mixture account for a large proportion. When the tire is pressed, the small particles first come into contact and bear the force. Because of its limited bearing capacity, it reaches the limit value of the force at the earliest. The large particles are suspended in the small particles, and it takes a short compaction time to bear the pressure. As the main pressure-bearing object, the force of large particles is much greater than that of small particles. According to the force limit values of the particles with different sizes in Figure 10. In the AC-13 asphalt mixture, the particle limit values with a particle radius of 1.8 mm are 10.6%, 7.5%, and 5.2% of those with a particle radius of 3.6 mm, 5.7 mm, and 7.3 mm, respectively. The results show that the particle size of 1.8 mm accounts for a small proportion of the total force, and the external load is mainly borne by the particle size of 1.8 mm or more. In the SMA-13 asphalt mixture, the particle limit values with a particle radius of 1.8 mm are 60.9%, 12.0%, and 8.4% of 3.6 mm, 5.7 mm, and 7.3 mm particles, respectively. It can be seen that the difference between the force values of particles with 1.8 mm and 3.6 mm particle sizes is small, and both are far smaller than the superior particle size. Therefore, the main force particles are particles with a particle size of more than 3.6 mm. In order to further compare the particle size range of the two kinds of asphalt mixture particles, the limit values of different particle size particles in the two types of asphalt mixture are nonlinearly fitted. The fitting results are shown in Figure 11.
According to Figure 11, the correlation coefficient of the fitting curve of the force limit value of the two types of asphalt mixture particles exceeds 0.96. It shows that the fitting curve can better describe the changing trend of the data. It can be seen from the two fitting curves. When the particle radius is less than 5.1 mm, the force value of AC-13 asphalt mixture particles is greater than that of SMA-13. When the particle radius exceeds 5.1 mm, the force value of SMA-13 asphalt mixture particles is greater than that of AC-13. For particles with a radius of 5.7 mm and 7.3 mm. The force limit value in the SMA-13 asphalt mixture is about 30% higher than that in the AC-13 asphalt mixture. In addition, the particle force limit values of the two types of asphalt mixture are proportional to the particle size.

4. Asphalt Mixture Gradation Optimization, Design, and Verification

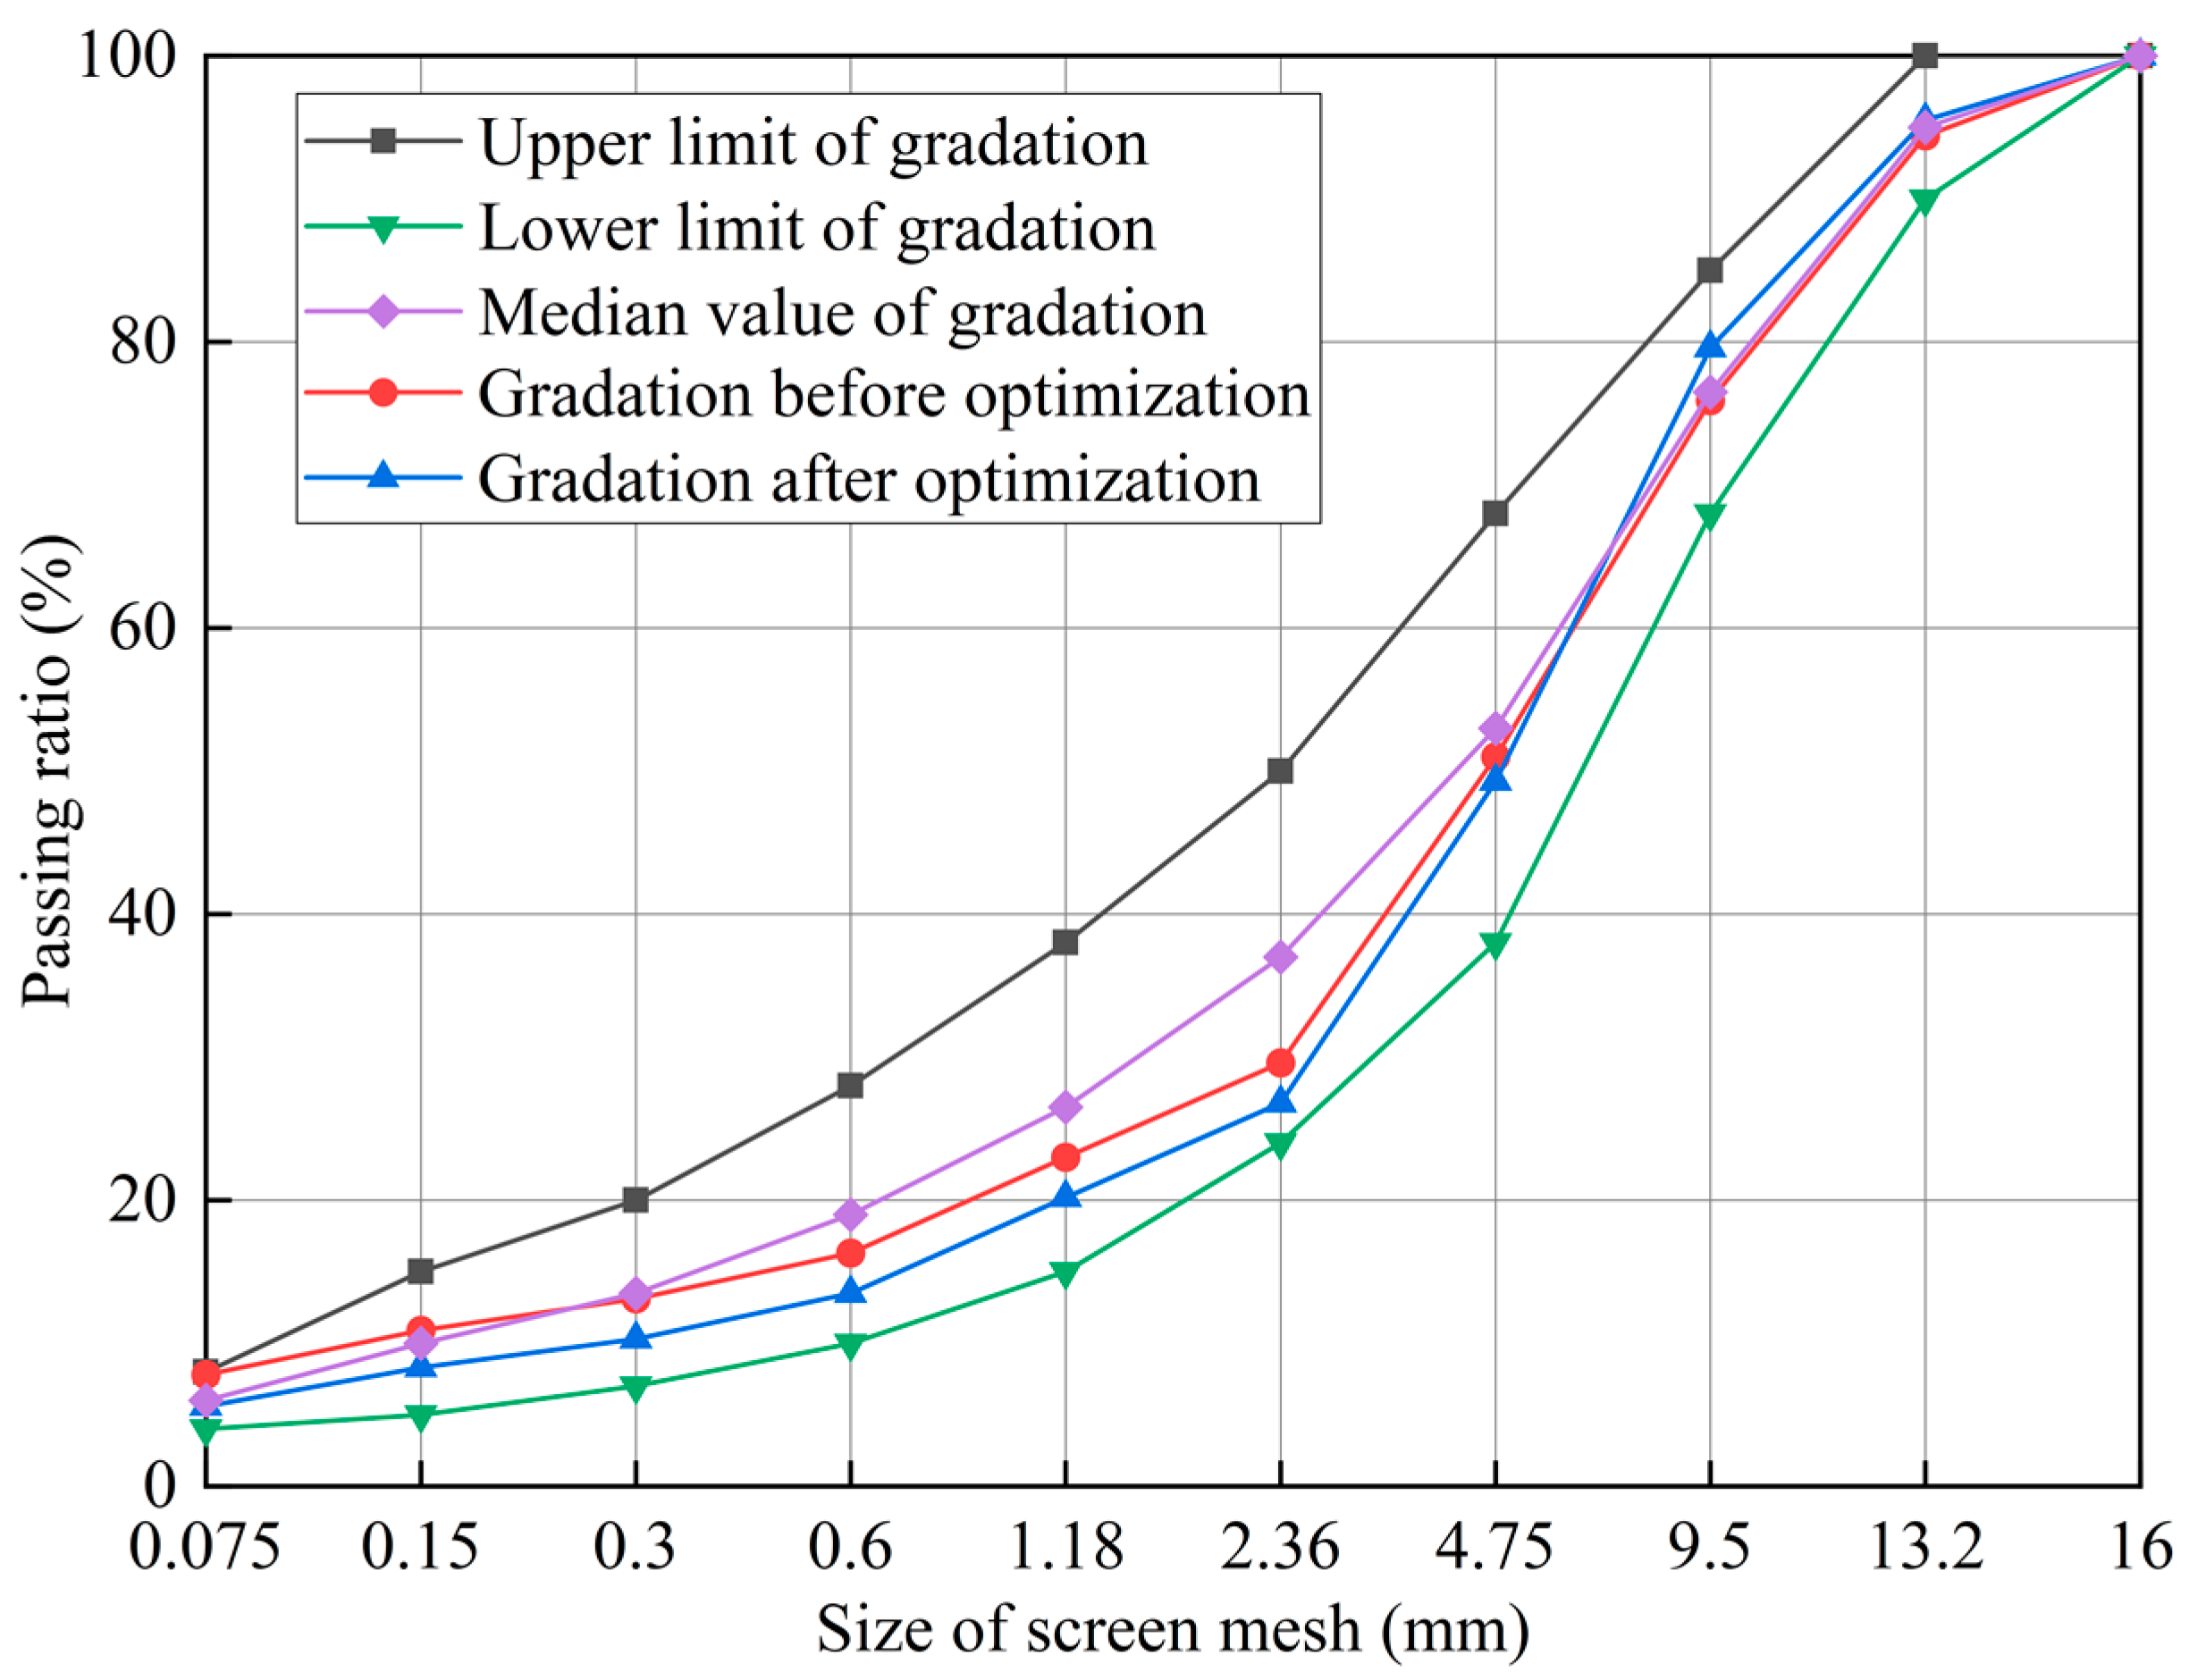
4.1. Gradation Optimization Design

According to the above simulation results, it can be concluded that particles with different particle sizes play different roles when subjected to external loads. By determining the appropriate particle size and distribution range, the distribution of particles is more uniform, which can improve the bearing capacity of the pavement. Improper gradation will reduce road performance and even lead to road damage. Therefore, a reasonable gradation design is the key factor in ensuring the good performance of the asphalt mixture.
The optimization of asphalt mixture gradation should correspond to the real material. The mineral materials are divided into three grades, namely 1 # (10–15 mm), 2 # (5–10 mm), and 3 # (0–5 mm). According to the simulation results of different particles in Section 3.3.2, the gradation of the asphalt mixture is adjusted. In the AC-13 asphalt mixture, the force value of particles with a radius of less than 5.1 mm is greater than that of SMA-13, and the bearing capacity of particles with a radius of 1.8 mm is very small. It shows that particles with a radius between 1.8 and 5.1 mm play a major role. Corresponding to the real mineral aggregate, the aggregate dosage of 2 # (5–10 mm) grade should be increased. In the SMA-13 asphalt mixture, the particles with a radius of more than 5.1 mm bear the load higher than the AC-13. It shows that particles with a radius of 5.1–7.3 mm are the main carriers of external loads. Therefore, the aggregate content of 1 # (10–15 mm) grade is increased. Based on the above principles, this paper designs a new gradation of the original gradation. The grades of the AC-13 and SMA-13 asphalt mixtures before and after optimization are shown in Figure 12 and Figure 13, respectively.
The improvement effect of road performance after optimization of asphalt mixture gradation is not clear through discrete element simulation results. The performance of the asphalt mixture before and after optimization is tested below, and the performance indexes are compared and analyzed. The feasibility of the grading optimization method is verified by a laboratory experiment.

4.2. Asphalt Mixture Performance Test

Styrene-butadiene-styrene (SBS)-modified asphalt is adopted in this experiment. The physical performances of the SBS-modified asphalt are tested in accordance with Chinese specification JTG E20-2011 and meet the requirements [44]. According to the Marshall test, the optimum asphalt-aggregate ratios of AC-13 and SMA-13 before optimization are 5.06% and 5.92%, respectively, and the optimum asphalt-aggregate ratios after optimization are 5.19% and 6.13%, respectively.

4.2.1. High-Temperature Rutting Test

The rutting test can be applied to evaluate the high-temperature rutting resistance of asphalt mixtures before and after optimization of gradation according to Standard JTG E20-2011 T0719-2011 in China [42]. The rutting specimens of two types of asphalt mixture are made, respectively, with three parallel specimens in each group. The test results are shown in Table 2.
According to Table 2, the average dynamic stability of the AC-13 asphalt mixture before gradation optimization is 4184 times/mm. The average value of dynamic stability after grading optimization is 4538 times/mm. The dynamic stability has increased by 8.5%. It shows that by optimizing the gradation of mineral aggregate, the coverage of asphalt film is more uniform and the formation of voids is reduced. Therefore, the mechanical properties and high temperature resistance of the material are improved. The average dynamic stability of the SMA-13 asphalt mixture before and after optimization is 5615 times/mm and 6208 times/mm, respectively. The dynamic stability has increased by 10.6%. By increasing the content of coarse-particle mineral aggregate, a better interlocking effect can be achieved, and the fluidity of asphalt can be reduced. Thereby reducing the deformation and fatigue damage of the mixture at high temperatures.

4.2.2. Low-Temperature Bending Test

The bending test is applied to evaluate the low-temperature properties of the asphalt mixture according to Chinese Standard JTG E20-2011 T0728-2000 [45]. The slab specimen (300 × 300 × 50 mm) is mixed at the optimum asphalt-aggregate ratio and then cut into a beam specimen (250 × 30 × 35 mm). The three-point bending beam test with a span of 200 mm is carried out under the condition of −10 °C. The test results are shown in Table 3.
As can be seen from Table 3, the flexural tensile strength of the AC-13 and SMA-13 asphalt mixtures after optimization increased by 9.2% and 7.3%, respectively. The improvement effect of the AC-13 asphalt mixture on low-temperature crack resistance is better than that of SMA-13. The reason is that the content of fine-particle mineral aggregate in the AC-13 asphalt mixture is higher. After optimizing the mineral aggregate gradation, a tighter mineral aggregate skeleton is formed. Therefore, the crack resistance of the material has improved. The filling action of fine-grained aggregates helps to reduce the fluidity of asphalt, thus reducing the deformation and cracking of the mixture at low temperatures. However, the increase in coarse aggregate content in the SMA-13 asphalt mixture is not beneficial to improving the cementation performance between asphalt and fine aggregate and is easy to cause cracking at low temperatures.

4.2.3. Water Stability Performance Test

The Marshall immersion test and the freeze-thaw splitting test are applied to evaluate the water stability performance of the asphalt mixture according to Chinese Standard JTG E20-2011 T0709-2011 and T0729-2000 [46,47]. The water immersion residual stability and the freeze-thaw splitting strength ratio test are used as indexes to evaluate the water stability. The test results are shown in Table 4.
It can be seen from the test results in Table 4 that the water immersion residual stability and freeze-thaw splitting strength ratio of the AC-13 asphalt mixture after optimization are 1.6% and 1.9% higher than those before optimization, respectively. A small number of voids can reduce the possibility of water entering the asphalt mixture. The infiltration degree of water in the asphalt mixture is reduced, and the overflow and stripping of asphalt are reduced. Therefore, the water stability of the asphalt mixture is improved. The water immersion residual stability and freeze-thaw splitting strength ratio of the SMA-13 asphalt mixture after optimization are 0.7% and 2.1% higher than those before optimization, respectively. The content of coarse mineral aggregate is increased to achieve the interlocking skeleton structure, and the deformation resistance and tensile shear resistance of the asphalt mixture are enhanced. The stable aggregate skeleton is helpful to resist the erosion of water flow and the separation of asphalt, improving the water stability.

5. Conclusions

In this paper, EDEM is used to simulate the formation process of AC-13 and SMA-13 asphalt mixture ruts. The software post-processing system is used to obtain the force characteristics and effects of different particle-size particles in the process of rut formation. Based on this, the gradation is further optimized and verified, and the following conclusions are obtained:
(1)
In the AC-13 asphalt mixture, particles with a radius of more than 1.8 mm are the main bearing particles. In the SMA-13 asphalt mixture, the particles with a radius of more than 3.6 mm are the main bearing particles. Small particle-size particles play a filling role. The particle force limit value of the two types of asphalt mixture is proportional to the particle size.
(2)
When the particle radius is less than 5.1 mm, the particle force value of the AC-13 asphalt mixture is greater than that of SMA-13. When the particle radius is greater than 5.1 mm, the particle force value of the SMA-13 asphalt mixture is greater than that of AC-13. For particles with a radius of 5.7 mm and 7.3 mm, the force limit value of the SMA-13 asphalt mixture is increased by about 30% compared to that of the AC-13 asphalt mixture.
(3)
Through laboratory experimental research, the dynamic stability, flexural tensile strength, water immersion residual stability, and freeze-thaw splitting strength ratios of the AC-13 asphalt mixture after optimization are 8.5%, 9.2%, 1.6%, and 1.9% higher than those before optimization. The dynamic stability, flexural tensile strength, water immersion residual stability, and freeze-thaw splitting strength ratios of the SMA-13 asphalt mixture after optimization are 10.6%, 7.3%, 0.7%, and 2.1% higher than those before optimization. The road performance of the asphalt mixture after gradation optimization has improved, which shows that the gradation optimization method is feasible.

Author Contributions

Conceptualization, H.X. and K.W.; methodology, H.X. and P.H.; software, H.X.; validation, H.X., Q.G. and J.W.; formal analysis, H.X.; investigation, J.H. and H.X.; resources, H.L.; data curation, K.W.; writing—original draft preparation, P.H.; writing—review and editing, Q.G.; visualization, J.W.; supervision, H.X.; project administration, K.W.; funding acquisition, K.W. All authors have read and agreed to the published version of the manuscript.

Funding

Science and Technology Plan of Shandong Provincial Department of Transportation (2022B109) and Shandong Railway Investment Holding Group Open Project (TTKF2022-01).

Institutional Review Board Statement

Not applicable.

Informed Consent Statement

Not applicable.

Data Availability Statement

All data that support the findings of this study are included within the article.

Conflicts of Interest

Qingliang Guo was employed by the company Shandong Railway Investment Holding Group Co., Ltd., Junjie Wang and Jiezhou Hang were employed by the company Jiqing High Speed Railway Co., Ltd., Hongzhen Li was employed by the company Shandong Yimeng Communications Engineering Co., Ltd., The authors declare no conflict of interest. The remaining authors declare that the research was conducted in the absence of any commercial or financial relationships that could be construed as a potential conflict of interest.

References

  1. Han, D.D.; Wei, L.Y.; Zhang, J.X. Experimental study on performance of asphalt mixture designed by different method. Procedia Eng. 2016, 137, 407–414. [Google Scholar] [CrossRef]
  2. Wong, W.G.; Han, H.F.; He, G.P.; Wang, K.C.P.; Lu, W.M. Rutting response of hot-mix asphalt to generalized dynamic shear moduli of asphalt binder. Constr. Build. Mater. 2004, 18, 399–408. [Google Scholar] [CrossRef]
  3. Topal, A.; Sengoz, B. Determination of fine aggregate angularity in relation with the resistance to rutting of hot-mix asphalt. Constr. Build. Mater. 2005, 19, 155–163. [Google Scholar] [CrossRef]
  4. Morea, F.; Agnusdei, J.O.; Zerbino, R. The use of asphalt low shear viscosity to predict permanent deformation performance of asphalt concrete. Mater. Struct. 2011, 44, 1241–1248. [Google Scholar] [CrossRef]
  5. Guan, H.X.; Zhang, Q.S.; Liu, J. Rutting test improving methods of asphalt mixture. J. Traffic Transp. Eng. 2011, 11, 16–21. [Google Scholar]
  6. Li, Q.; Ni, F.J. Comparison of anti-rutting performance tests for asphalt mixture. J. Southeast Univ. Nat. Sci. Ed. 2014, 44, 1266–1270. [Google Scholar]
  7. Huang, W.D.; Mo, D.C.; Lyu, Q.; Zheng, M.; Zhou, L. High temperature performance evaluation of TB composite modified asphalt mixture based on Hamburg wheel tracking test. J. Chang. Univ. Nat. Sci. Ed. 2020, 40, 12–21. [Google Scholar]
  8. Wang, H.; Tan, H.Q.; Zhang, J.P. Effects of molding shape and air void of asphalt mixture specimen on APA rutting tests. J. Southeast Univ. Nat. Sci. Ed. 2016, 46, 589–593. [Google Scholar]
  9. Du, R.Y.; Lin, Y.G. Study on Application Range of Hamburg Rut and APA Rut Test. J. China Foreign Highw. 2019, 39, 237–242. [Google Scholar]
  10. Barksdale, R.D. Laboratory Evaluation of Rutting in Base Course Materials. In Proceedings of the Third International Conference on the Structural Design of Asphalt Pavements, London, UK, 7–11 January 1972. [Google Scholar]
  11. Romain, J.E. Rut Depth Manual-Asphalt Pavements and Overlays for Road Traffic; Shell International Petroleum Company: London, UK, 1978. [Google Scholar]
  12. Hills, J.F.; Brian, D.; Loo, P.P. The Correlation of Rutting and Creep Tests of Asphalt Mixes. In Flexible Pavements; Transport and Road Research Laboratory (TRRL): Wokingham, UK, 1974. [Google Scholar]
  13. Zhang, H.Q. The Application Study of the United Prediction Model of the Volumetric Parameters and Rutting Resistance Performance of Asphalt Mixture. Master’s Thesis, Shandong University, Jinan, China, 2009. [Google Scholar]
  14. Xie, L.B. Research of Asphalt Pavement Rutting Prediction Model Based on Temperature Filed and Dynamic Modulus. Master’s Thesis, Xi’an University of Architecture and Technology, Xi’an, China, 2013. [Google Scholar]
  15. Rougier, E.; Knight, E.E.; Broome, S.T.; Sussman, A.J.; Munjiza, A. Validation of a three-dimensional finite-discrete element method using experimental results of the split Hopkinson pressure bar test. Int. J. Rock Mech. Min. Sci. 2014, 70, 101–108. [Google Scholar] [CrossRef]
  16. Feng, H.; Pettinari, M.; Hofko, B.; Stang, H. Study of the internal mechanical response of an asphalt mixture by 3-D discrete element modeling. Constr. Build. Mater. 2015, 77, 187–196. [Google Scholar] [CrossRef]
  17. Liu, Y.; You, Z.; Zhao, Y. Three-dimensional discrete element modeling of asphalt concrete: Size effects of elements. Constr. Build. Mater. 2012, 37, 775–782. [Google Scholar] [CrossRef]
  18. Li, J.; Zhang, J.; Qian, G.; Zheng, J.; Zhang, Y. Three-dimensional simulation of aggregate and asphalt mixture using parameterized shape and size gradation. J. Mater. Civ. Eng. 2019, 31, 4019004. [Google Scholar] [CrossRef]
  19. Mahmoud, E.; Masad, E.; Nazarian, S. Discrete element analysis of the influences of aggregate properties and internal structure on fracture in asphalt mixtures. J. Mater. Civ. Eng. 2010, 22, 10–20. [Google Scholar] [CrossRef]
  20. Chen, J.; Pan, T.; Huang, X. Discrete element modeling of asphalt concrete cracking using a user-defined three-dimensional micromechanical approach. J. Wuhan Univ. Technol. Mater. Sci. Ed. 2011, 26, 1215–1221. [Google Scholar] [CrossRef]
  21. Meza-Lopez, J.; Noreña, N.; Meza, C.; Romanel, C. Modeling of asphalt concrete fracture tests with the discrete-element method. J. Mater. Civ. Eng. 2020, 32, 4020228. [Google Scholar] [CrossRef]
  22. Xue, B.; Xu, J.; Pei, J.Z.; Zhang, J.P.; Li, R. Investigation on the micromechanical response of asphalt mixture during permanent deformation based on 3D virtual wheel tracking test. Constr. Build. Mater. 2021, 267, 121031. [Google Scholar] [CrossRef]
  23. Zhang, X.; Chen, E.L.; Li, N.P.; Wang, L.F.; Si, C.D.; Wang, C.Y. Micromechanical analysis of the rutting evolution of asphalt pavement under temperature–stress coupling based on the discrete element method. Constr. Build. Mater. 2022, 325, 126800. [Google Scholar] [CrossRef]
  24. Wang, H.N.; Bu, Y.; Wang, Y.Z.; Yang, X.; You, Z.P. The effect of morphological characteristic of coarse aggregates measured with fractal dimension on asphalt mixture’s high-temperature performance. Adv. Mater. Sci. Eng. 2016, 2016, 6264317. [Google Scholar] [CrossRef]
  25. Ma, T.; Zhang, D.Y.; Zhang, Y.; Hong, J.X. Micromechanical response of aggregate skeleton within asphalt mixture based on virtual simulation of wheel tracking test. Constr. Build. Mater. 2016, 111, 153–163. [Google Scholar] [CrossRef]
  26. Yu, C.C. Meso-Structural Character Analysis on the Rutting of Asphalt Pavement Based on Discrete Element Simulation. Master’s Thesis, Shijiazhuang Tiedao University, Shijiazhuang, China, 2020. [Google Scholar]
  27. Ma, T.; Zhang, D.Y.; Zhang, Y.; Wang, S.Q.; Huang, X.M. Simulation of wheel tracking test for asphalt mixture using discrete element modelling. Road Mater. Pavement Des. 2018, 19, 367–384. [Google Scholar] [CrossRef]
  28. Ma, T.; Zhang, D.Y.; Zhang, Y.; Zhao, Y.L.; Huang, X.M. Effect of air voids on the high-temperature creep behavior of asphalt mixture based on three-dimensional discrete element modeling. Mater. Des. 2016, 89, 304–313. [Google Scholar] [CrossRef]
  29. Yu, H.; Ma, T.; Wang, D.; Wang, Z.; Lye, S.; Zhu, X.Y. Review on China’s pavement engineering research 2020. China J. Highw. Transp. 2020, 33, 1–66. [Google Scholar]
  30. Zhang, D.M.; Zheng, Y.M.; Yuan, G.C.; Guo, H.; Zhou, Q.; Qian, G.P.; Liang, B. Comparative analysis of rheological and microscopic performance of SBS modified asphalt based on field aging and laboratory aging. Fuel 2023, 352, 128933. [Google Scholar] [CrossRef]
  31. Castillo-Camarena, E.A.; Williams, S. Application of percent within limits concepts on a balanced mix design of asphalt mixture. Int. J. Pavement Eng. 2022, 1–23. [Google Scholar] [CrossRef]
  32. Xu, S.F.; Peng, G.; Zhang, Y.X.; Guo, Y.T.; Suo, Z.; Xu, Y. Design Method of asphalt pavement mixture based on performance balance approach. J. Transp. Eng. Part B Pavements 2021, 147, 4021009. [Google Scholar] [CrossRef]
  33. Chen, J.; Li, H.; Wang, L.; Wu, J.; Huang, X. Micromechanical characteristics of aggregate particles in asphalt mixture. Constr. Build. Mater. 2015, 91, 80–85. [Google Scholar] [CrossRef]
  34. Jiang, W.; Sha, A.M.; Xiao, J.J. Comparison and selection of gradation for porous asphalt concrete based on discrete element method. J. Jilin Univ. 2011, 41, 68–72. [Google Scholar]
  35. Miao, Y.H.; Yu, W.X.; Hou, Y.; Guo, L.Y.; Wang, L.B. Investigating the functions of particles in packed aggregate blend using a discrete element method. Materials 2019, 12, 556. [Google Scholar] [CrossRef]
  36. Yu, H.; Shen, S. Impact of Aggregate Packing on Dynamic Modulus of Hot Mix Asphalt mixture Using Three-Dimensional Discrete Element Method. Constr. Build. Mater. 2012, 26, 302–309. [Google Scholar] [CrossRef]
  37. Leon, L.P.; Gay, D. Gene expression programming for evaluation of aggregate angularity effects on permanent deformation of asphalt mixture. Constr. Build. Mater. 2019, 211, 470–478. [Google Scholar] [CrossRef]
  38. Guo, Y.; Zhao, C.; Markine, V.; Jing, G.; Zhai, W. Calibration for discrete element modelling of railway ballast: A review. Transp. Geotech. 2020, 23, 100341. [Google Scholar] [CrossRef]
  39. Jaradat, K.A.; Abdelaziz, S.L. On the use of discrete element method for multi-scale assessment of clay behavior. Comput. Geotech. 2019, 112, 329–341. [Google Scholar] [CrossRef]
  40. Hu, G.M. Analysis and Simulation of Particle System by Discrete Element Method; Wuhan University of Technology Press: Wuhan, China, 2010. [Google Scholar]
  41. Pue, J.D.; Emidio, G.D.; Flores, R.D.V.; Bezuijen, A.; Cornelis, W.M. Calibration of dem material parameters to simulate stress-strain behaviour of unsaturated soils during uniaxial compression. Soil Tillage Res. 2019, 194, 104303. [Google Scholar] [CrossRef]
  42. JTG E20-2011 T0719-2011; Standard Test Methods of Bitumen and Bituminous Mixtures for Highway Engineering. Research Institute of Highway Ministry of Transport: Beijing, China, 2011.
  43. Cong, L.Y. Simulation Test of Asphalt Mixture Rutting Based on Discrete Element Method. Master’s Thesis, Harbin Engineering University, Harbin, China, 2019. [Google Scholar]
  44. JTG E20-2011; Standard Test Methods of Bitumen and Bituminous Mixtures for Highway Engineering. Research Institute of Highway Ministry of Transport: Beijing, China, 2011.
  45. JTG E20-2011 T0728-2000; Standard Test Methods of Bitumen and Bituminous Mixtures for Highway Engineering. Research Institute of Highway Ministry of Transport: Beijing, China, 2011.
  46. JTG E20-2011 T0709-2011; Standard Test Methods of Bitumen and Bituminous Mixtures for Highway Engineering. Research Institute of Highway Ministry of Transport: Beijing, China, 2011.
  47. JTG E20-2011 T0729-2000; Standard Test Methods of Bitumen and Bituminous Mixtures for Highway Engineering. Research Institute of Highway Ministry of Transport: Beijing, China, 2011.
Figure 1. DEM materials modeling. (a) Percentage of mass of particles of different sizes; (b) Shape of real and simulated particles; (c) Parameters in simulation; (d) Vibration models.
Coatings 13 01965 g001
Figure 2. Laboratory and simulation calibration tests.
Coatings 13 01965 g002
Figure 3. Comparison between the uniaxial compression test results and the uniaxial compression simulation results (a) AC-13 asphalt mixture; (b) SMA-13 asphalt mixture.
Coatings 13 01965 g003
Figure 4. Rutting discrete element modeling process.
Coatings 13 01965 g004
Figure 5. Particle association states occur at different moments. (ad) The interaction of axial force between particles of AC-13 asphalt mixture at 0 s, 0.5 s, 1.5 s and 2.5 s; (eh) The interaction of axial force between particles of SMA-13 asphalt mixture at 0 s, 0.5 s, 1.5 s and 2.5 s.
Coatings 13 01965 g005
Figure 6. Connection of AC-13 particles with different particle sizes. (a) The simulation time is 0 s; (b) The simulation time is 0.5 s; (c) The simulation time is 1.5 s; (d) The simulation time is 2.5 s.
Coatings 13 01965 g006
Figure 7. Connection of SMA-13 particles with different particle sizes. (a) The simulation time is 0 s; (b) The simulation time is 0.5 s; (c) The simulation time is 1.5 s; (d) The simulation time is 2.5 s.
Coatings 13 01965 g007
Figure 8. Relationship between force and time for four different particle sizes of AC-13 particles.
Coatings 13 01965 g008
Figure 9. Relationship between force and time for four different particle sizes of SMA-13 particles.
Coatings 13 01965 g009
Figure 10. Comparison of particle force between AC-13 and SMA-13 asphalt mixtures with the same particle size. (a) The force curve of particles with a particle size of 7.3 mm; (b) The force curve of particles with a particle size of 5.7 mm; (c) The force curve of particles with a particle size of 3.6 mm; (d) The force curve of particles with a particle size of 1.8 mm.
Coatings 13 01965 g010
Figure 11. Fitting curves of force limit values for particles of different sizes.
Coatings 13 01965 g011
Figure 12. Mineral aggregate gradation of AC-13 asphalt mixture.
Coatings 13 01965 g012
Figure 13. Mineral aggregate gradation of SMA-13 asphalt mixture.
Coatings 13 01965 g013
Table 1. Bonding model microscopic parameters.
Type of Mixture K n (N/m3) K s (N/m3) σ n (Pa) σ s (Pa) R B (mm)
AC-132.11 × 10101.01 × 10102.31 × 1052.77 × 1050.53
SMA-132.32 × 1091.11 × 1091.58 × 1072.83 × 1070.86
Table 2. High-temperature rutting test results of asphalt mixture.
Type of MixtureGradation TypeDynamic Stability (Times/mm)
123Average
AC-13Gradation before optimization4227413441924184
Gradation after optimization4583450245294538
SMA-13Gradation before optimization5574562356495615
Gradation after optimization5968627663816208
Table 3. Low-temperature bending test results of asphalt mixture.
Type of MixtureGradation TypeFlexural Tensile Strength (MPa)Maximum Bending Strain (10−6)Bending Stiffness Modulus (MPa)
AC-13Gradation before optimization10.322587.23989.85
Gradation after optimization11.272896.33891.61
SMA-13Gradation before optimization12.082752.84388.87
Gradation after optimization12.963021.64289.77
Table 4. Marshall immersion and freeze-thaw split test results.
Type of MixtureGradation TypeWater Immersion Residual Stability (%)Freeze-Thaw Splitting Strength Ratio (%)
AC-13Gradation before optimization87.979.6
Gradation after optimization89.381.1
SMA-13Gradation before optimization91.786.4
Gradation after optimization92.388.2
Disclaimer/Publisher’s Note: The statements, opinions and data contained in all publications are solely those of the individual author(s) and contributor(s) and not of MDPI and/or the editor(s). MDPI and/or the editor(s) disclaim responsibility for any injury to people or property resulting from any ideas, methods, instructions or products referred to in the content.

