Article

Influence of Process Parameters on the Electrodeposition of Vanadium in NaCl-KCl-NaF-V2O3 Molten Salt

Key Laboratory of Ministry of Education for Modern Metallurgy Technology, College of Metallurgy and Energy, North China University of Science and Technology, Tangshan 063210, China
*
Author to whom correspondence should be addressed.
Coatings 2023, 13(2), 234; https://doi.org/10.3390/coatings13020234
Submission received: 13 December 2022 / Revised: 14 January 2023 / Accepted: 17 January 2023 / Published: 19 January 2023

Abstract

:
In NaCl-KCl-NaF-V2O3 molten salt, used graphite as an anode and carbon steel plate as a cathode, vanadium was successfully prepared by molten salt electrodeposition. The reduction mechanism of molten salt electrodeposition vanadium is discussed, and the influence of NaF content, current density, electrodeposition temperature, and electrodeposition time on the electrodeposition vanadium are studied. The optimum electrodeposition conditions are obtained: the composition of molten salt is XNaCl = 0.4, XKCl = 0.4, XNaF = 0.2, V2O3 is 15%; adopt bidirectional pulse current (pulse period T = 1000 ms, positive and negative current ratio ip/in = 6:1, positive and negative time ratio tp/tn = 3:1); the current density is 200 mA·cm−2. The electrodeposition temperature is 973 K, and the electrodeposition time is 30 min.

1. Introduction

Vanadium has the characteristics of a high melting point, good processing performance, strong corrosion resistance, high hardness, high resistivity, weak paramagnetism, a small linear expansion coefficient, and a small, fast neutron absorption cross-section. It is widely used in metallurgy, the chemical industry, mechanical manufacturing, aerospace, atomic energy, superconducting alloy materials, additives for special alloys, and the electronics industry [1,2].
Vanadium is mainly obtained by reducing vanadium oxides or chlorides with reducing agents such as carbon, hydrogen and metals [3,4,5,6]. The commonly used methods include the metal thermal reduction method [7,8,9], the vacuum carbon thermal reduction method [10,11], the hydrogen reduction method [12], the thermal decomposition method of vanadium nitride [13], and so on. High-purity vanadium generally needs to be obtained by preparing crude vanadium and then refining it in two steps.
In the current vanadium preparation process, it is difficult to remove the residual carbon after the vacuum carbothermal reduction reaction [14]. The hydrogen reduction method needs to reduce vanadium halide under the condition of long-time high-temperature heating [15,16,17]. The mechanical processing of vanadium prepared by calcium thermal reduction is difficult, and the required high-purity metal calcium is very expensive [18,19]. There is a long process and poor economy by magnesium thermal reduction method [19].
In order to obtain vanadium with high purity and reduce the experimental process, Cai, Z.F. et al. [20] use V2O5 as raw material to obtain metal vanadium in CaCl2-NaCl molten salt by low-temperature electrodeoxidation; Wang, S.L. et al. [21] electrolyze V2O3 in CaCl2-NaCl-CaO molten salt system to obtain metal vanadium. Compared with chloride, fluoride has the advantages of a wide potential window, low volatility, and no need for deep dehydration before use [22]. In this study, NaF is introduced into NaCl-KCl molten salt system to form a NaCl-KCl-NaF system, and V2O3 is used as raw material to electrodeposit metal vanadium in this system. Before the formal electrodeposition experiment, the impurities in the molten salt were removed by pre-electrolysis. Compared with other traditional methods, it has the characteristics of simple equipment, low cost and less environmental pollution.

2. Experimental

The analytically pure reagents NaCl, KCl, NaF, and V2O3 were dried at 473 K for 48 h, then accurately weighed in proportion, and the mass fraction of V2O3 was 15%. The reagents were fully mixed and put into a graphite crucible, and the graphite crucible was placed in a resistance furnace continuously flowing with Ar. After standing for 10 min, the resistance furnace was raised to the specified temperature according to the program and kept at a constant temperature for 30 min to ensure that the molten salt was completely melted. The prefabricated carbon steel cathode plate was put into a molten salt, and the cathode current density was set to 200 mA·cm−2 for pre-electrolysis for 10 min.
After the pre-electrolysis, the electrodeposition experiments under different conditions were carried out according to the experimental scheme in Table 1. After the electrodeposition was finished, the cathode plate was quickly taken out and put into boiling distilled water to remove the molten salt attached to the cathode substrate. Then, the molten salt was repeatedly washed with distilled water and dried for detection.

3. Results and Discussion

3.1. The Reduction Mechanism of V2O3

Using the molten salt system of sample 1 in Table 1, the electrochemical reduction mechanism of vanadium was studied by cyclic voltammetry. The experimentally measured cyclic voltammetry curve shows in Figure 1.
It can be seen from the figure that the values of Epc and Epa are related to the scanning speed v, and move to the negative and positive potential directions respectively with the increase of v. The current function ipc/v1/2 is also related to the scanning speed v and increases with the increase of v. It shows that the reduction process corresponding to the cathodic reduction peak is a simple electrode process. There is also an approximately linear relationship between ipc and v1/2 in the corresponding raw data. It can be seen that the electrode process corresponding to the cathodic reduction peak conforms to the criterion of quasi reversible electrode process; that is, the cathodic reduction reaction of vanadium in this system is controlled by the mixed rate of electron gain, loss and diffusion.
The molten salt system is analyzed by X-ray diffraction, and the result shows in Figure 2. The main existing form of V ions in the NaCl-KCl-NaF-V2O3 system is V3+. Therefore, it can be judged that the electrode reaction corresponding to the cathodic reduction peak is:
V3+ + 3e→V

3.2. Influence of NaF Content

3.2.1. Influence of NaF Content on the Thickness of the Deposition Layer

Figure 3 shows the deposition thickness on the surface of the sample when XNaF = 0.2 measured by glow discharge spectrometer. In this paper, the depth when the proportion of vanadium is reduced to 2.0% is selected as the deposition depth. It can be seen from the figure that there is a certain thickness of vanadium deposited on the surface of the sample, and the vanadium content is distributed in a gradient with the increase of the scanning depth. Figure 4 shows the variation of the vanadium deposition layer corresponding to different NaF contents in the molten salt, and it can be seen that with the increase of NaF content, the thickness of the deposition layer on the surface of the sample increases very little, and the amount of NaF in the molten salt has a limited influence on the surface vanadium content and the thickness of the deposition layer.

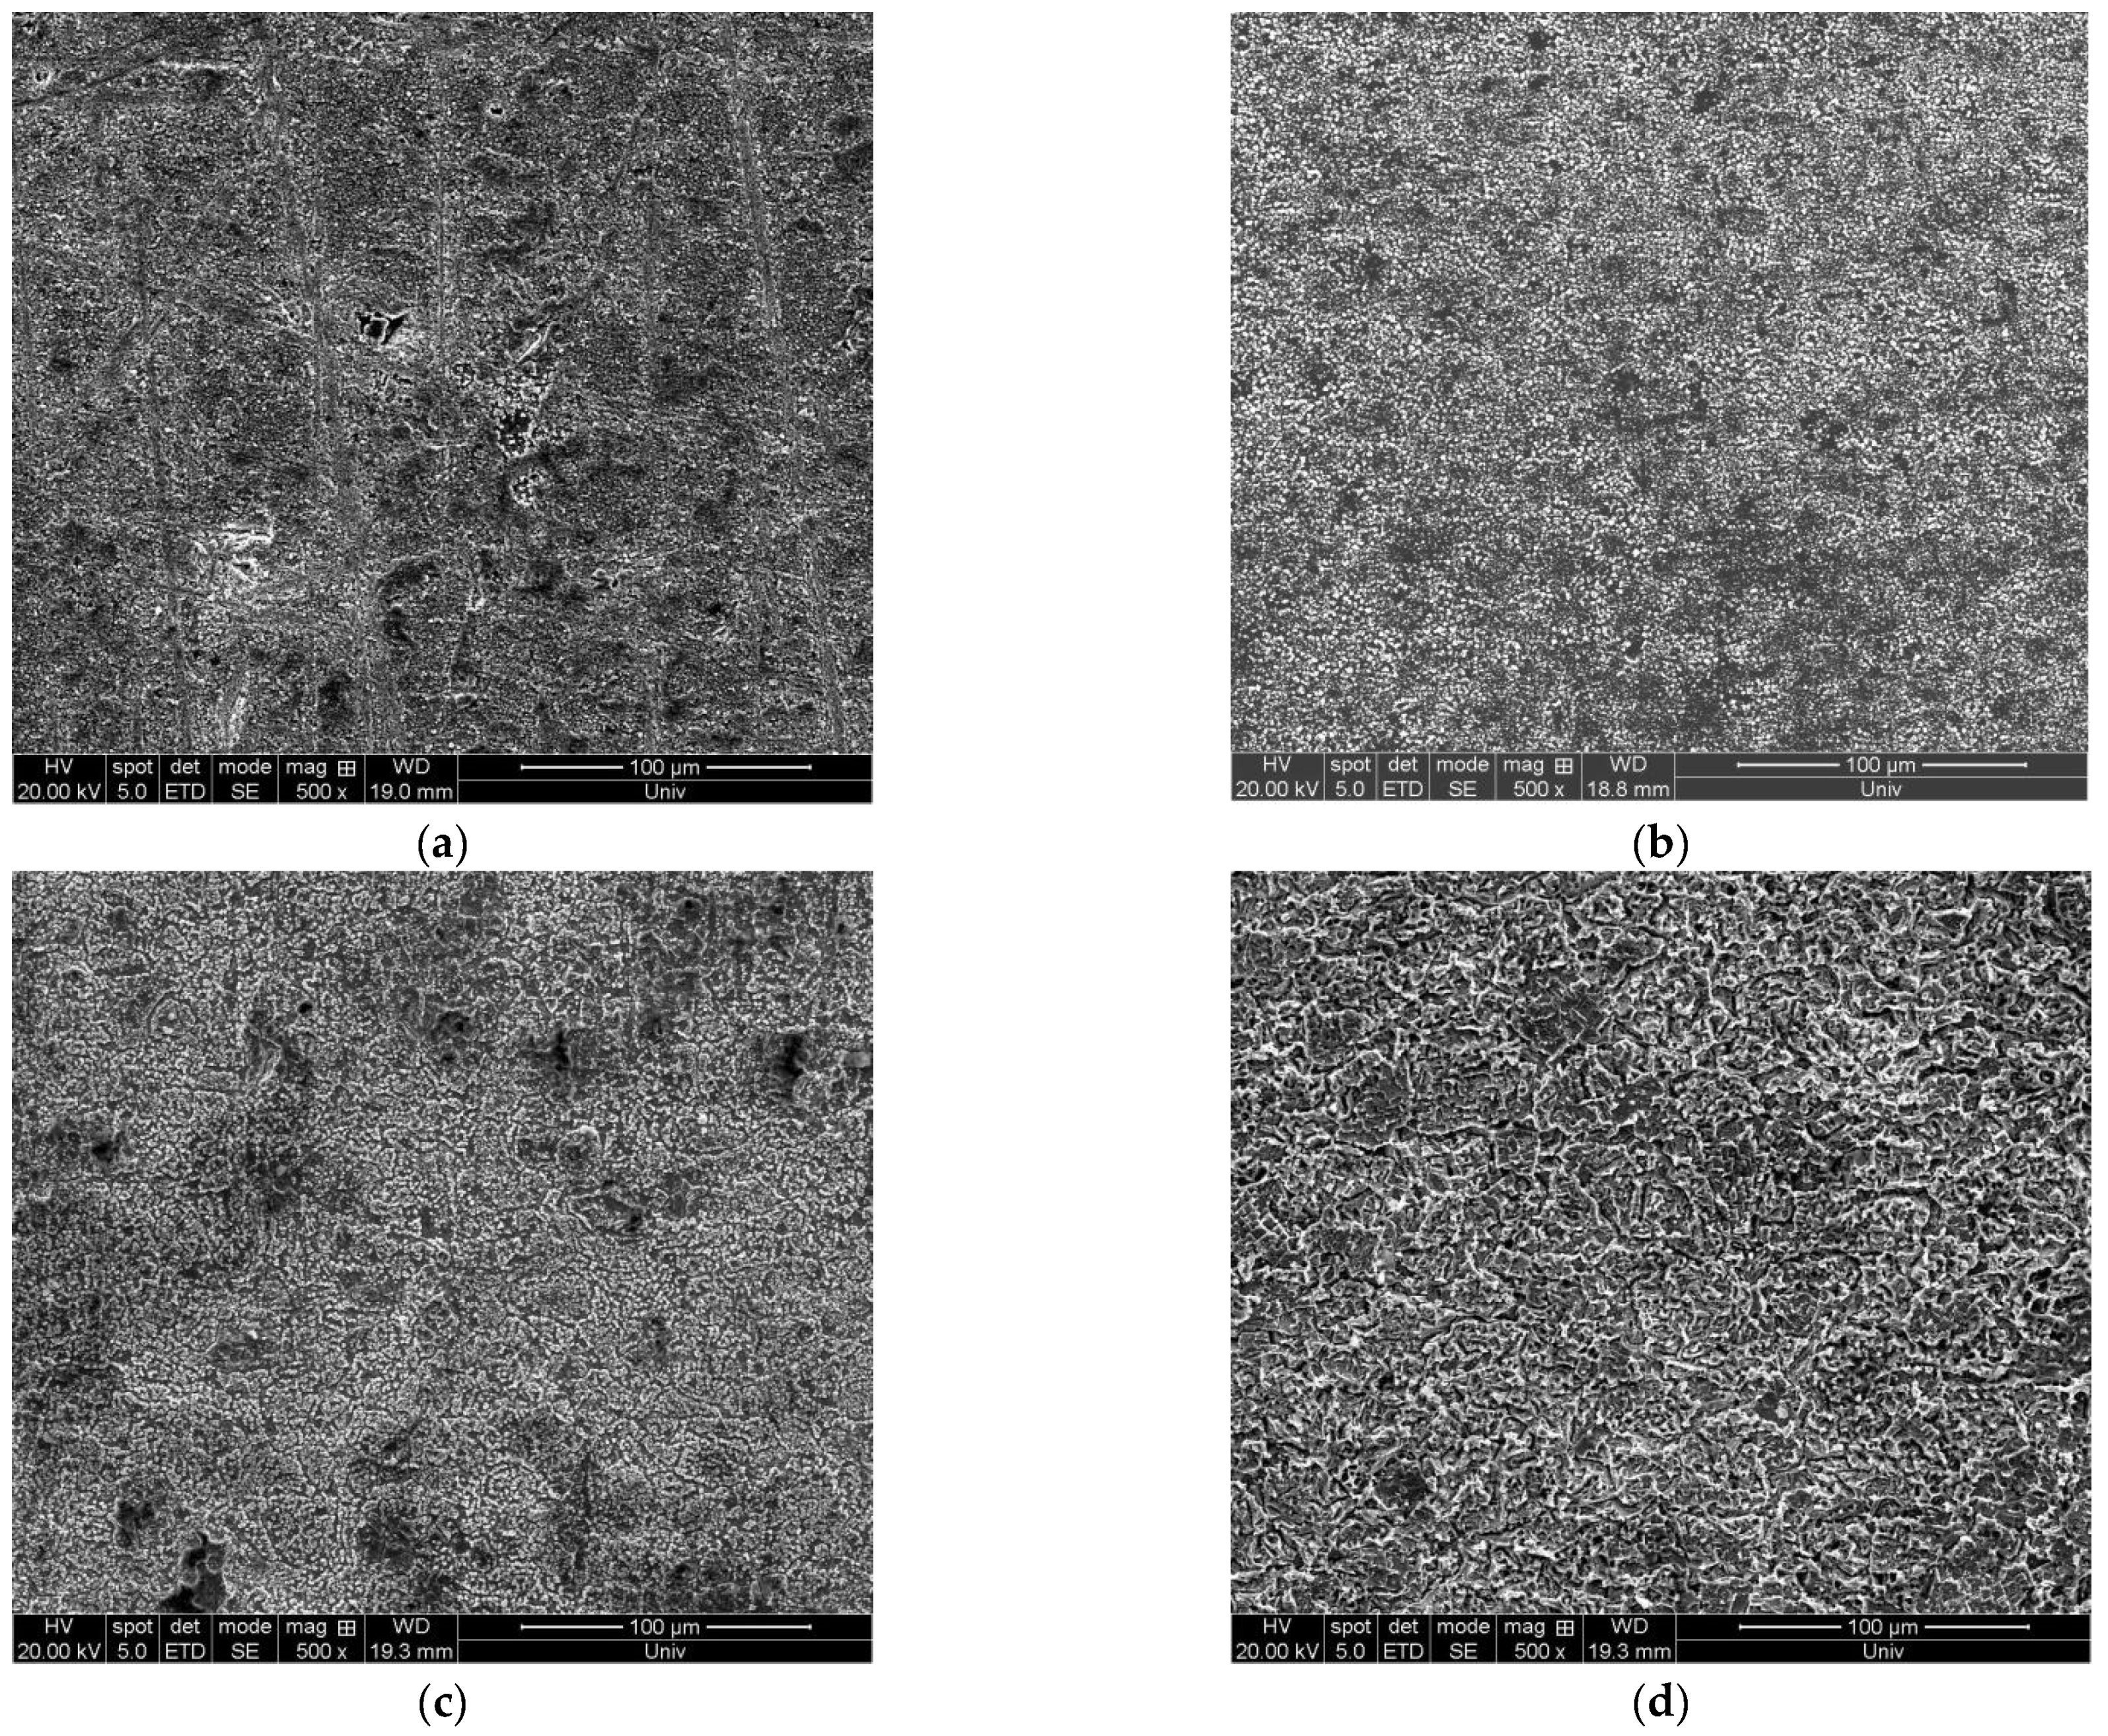
3.2.2. Influence of NaF Content on the Surface Morphology of the Deposition Layer

Figure 5 shows the influence of NaF content on the surface morphology of the deposition layer. It can be seen that when the NaF content increases, the dissolved V2O3 in the molten salt system will also increase, and the concentration of electrically active ions in the molten salt system will increase, resulting in a large amount of vanadoxy ion accumulation on the cathode surface, causing the vanadium deposition layer on the cathode surface to become loose, or even fall off. When the sample is cleaned, it will fall off more seriously.
It shows that the NaF content has a great influence on the surface morphology of the deposition layer. In order to obtain a uniform and stable deposition layer, the content of NaF should be controlled at a small value. In this experiment, XNaF = 0.2 can get better results.

3.3. Influence of Current Waveform

The traditional electrodeposition process is generally carried out by DC. However, DC electrodeposition will cause metal ions to be continuously reduced and precipitated in the liquid layer near the cathode surface, causing concentration polarization or other side reactions, thus affecting the quality of the deposition layer. Pulse electrodeposition is also known as on-off DC electrodeposition. It uses the relaxation of current or voltage pulses to increase the activation polarization of the cathode and reduce the concentration polarization of the cathode so as to obtain an electrodeposition layer with better physicochemical properties.
The bidirectional pulse parameters selected in the experiment are as follows: pulse period T = 1000 ms; positive and negative current ratio i p/i n = 6:1, positive and negative time ratio t p/t n = 3:1. It can be seen from Figure 6 and Table 2 that the surface quality of the deposition layer by bidirectional pulse electrodeposition is better than that of DC electrodeposition. This is due to the existence of anode pulses in bidirectional pulse electrodeposition, which can dissolve and remove burrs on the surface of the deposition layer in time so that the surface of the deposition layer becomes flat, smooth, and has a certain brightness. Due to the continuous precipitation of metal ions on the cathode substrate, DC deposition will lead to uneven distribution and shedding of the deposition layer thickness.

3.4. Influence of Current Density

The current density is an important factor in the electrodeposition process. It determines the deposition rate of the metal and the grain size of the deposited crystal, thus greatly affecting the quality of the electrodeposition layer. Generally speaking, if the current density is too low, the cathodic polarization will be small, and the deposits obtained at this time are often coarsely crystallized; if the current density is too large, the cathodic polarization will be large, and nodules or dendrites will easily occur [23].

3.4.1. Influence of Current Density on the Thickness of the Deposition Layer

Figure 7 shows the vanadium deposition thickness of the sample at different current densities. It can be seen from the figure that with the increase of current density, the deposition rate and diffusion rate of vanadium on the cathode plate become faster, and the thickness of the deposition layer increases continuously. When the current density is 90 mA·cm−2 and 120 mA·cm−2, due to the low degree of cathodic polarization, the deposition rate of vanadium is slower, and the thickness of the deposition layer is thinner, both less than 1 μm. 0.59 μm and 0.75 μm, respectively; when the current density increases between 120 mA·cm−2 and 150 mA·cm−2, the deposition rate of vanadium increases rapidly; When the current density is greater than 150 mA·cm−2, the growth rate of vanadium deposit thickness slows down; When the current density continues to expand to 250 mA·cm−2, the deposition layer is not smooth because the current density is too large and dendrites are formed during vanadium deposition. And when the cathode plate is removed and treated, part of the deposition layer falls off. It can also be seen from the glow discharge spectrum in Figure 8 that the change of vanadium content fluctuates relatively large with the increase of scanning depth.

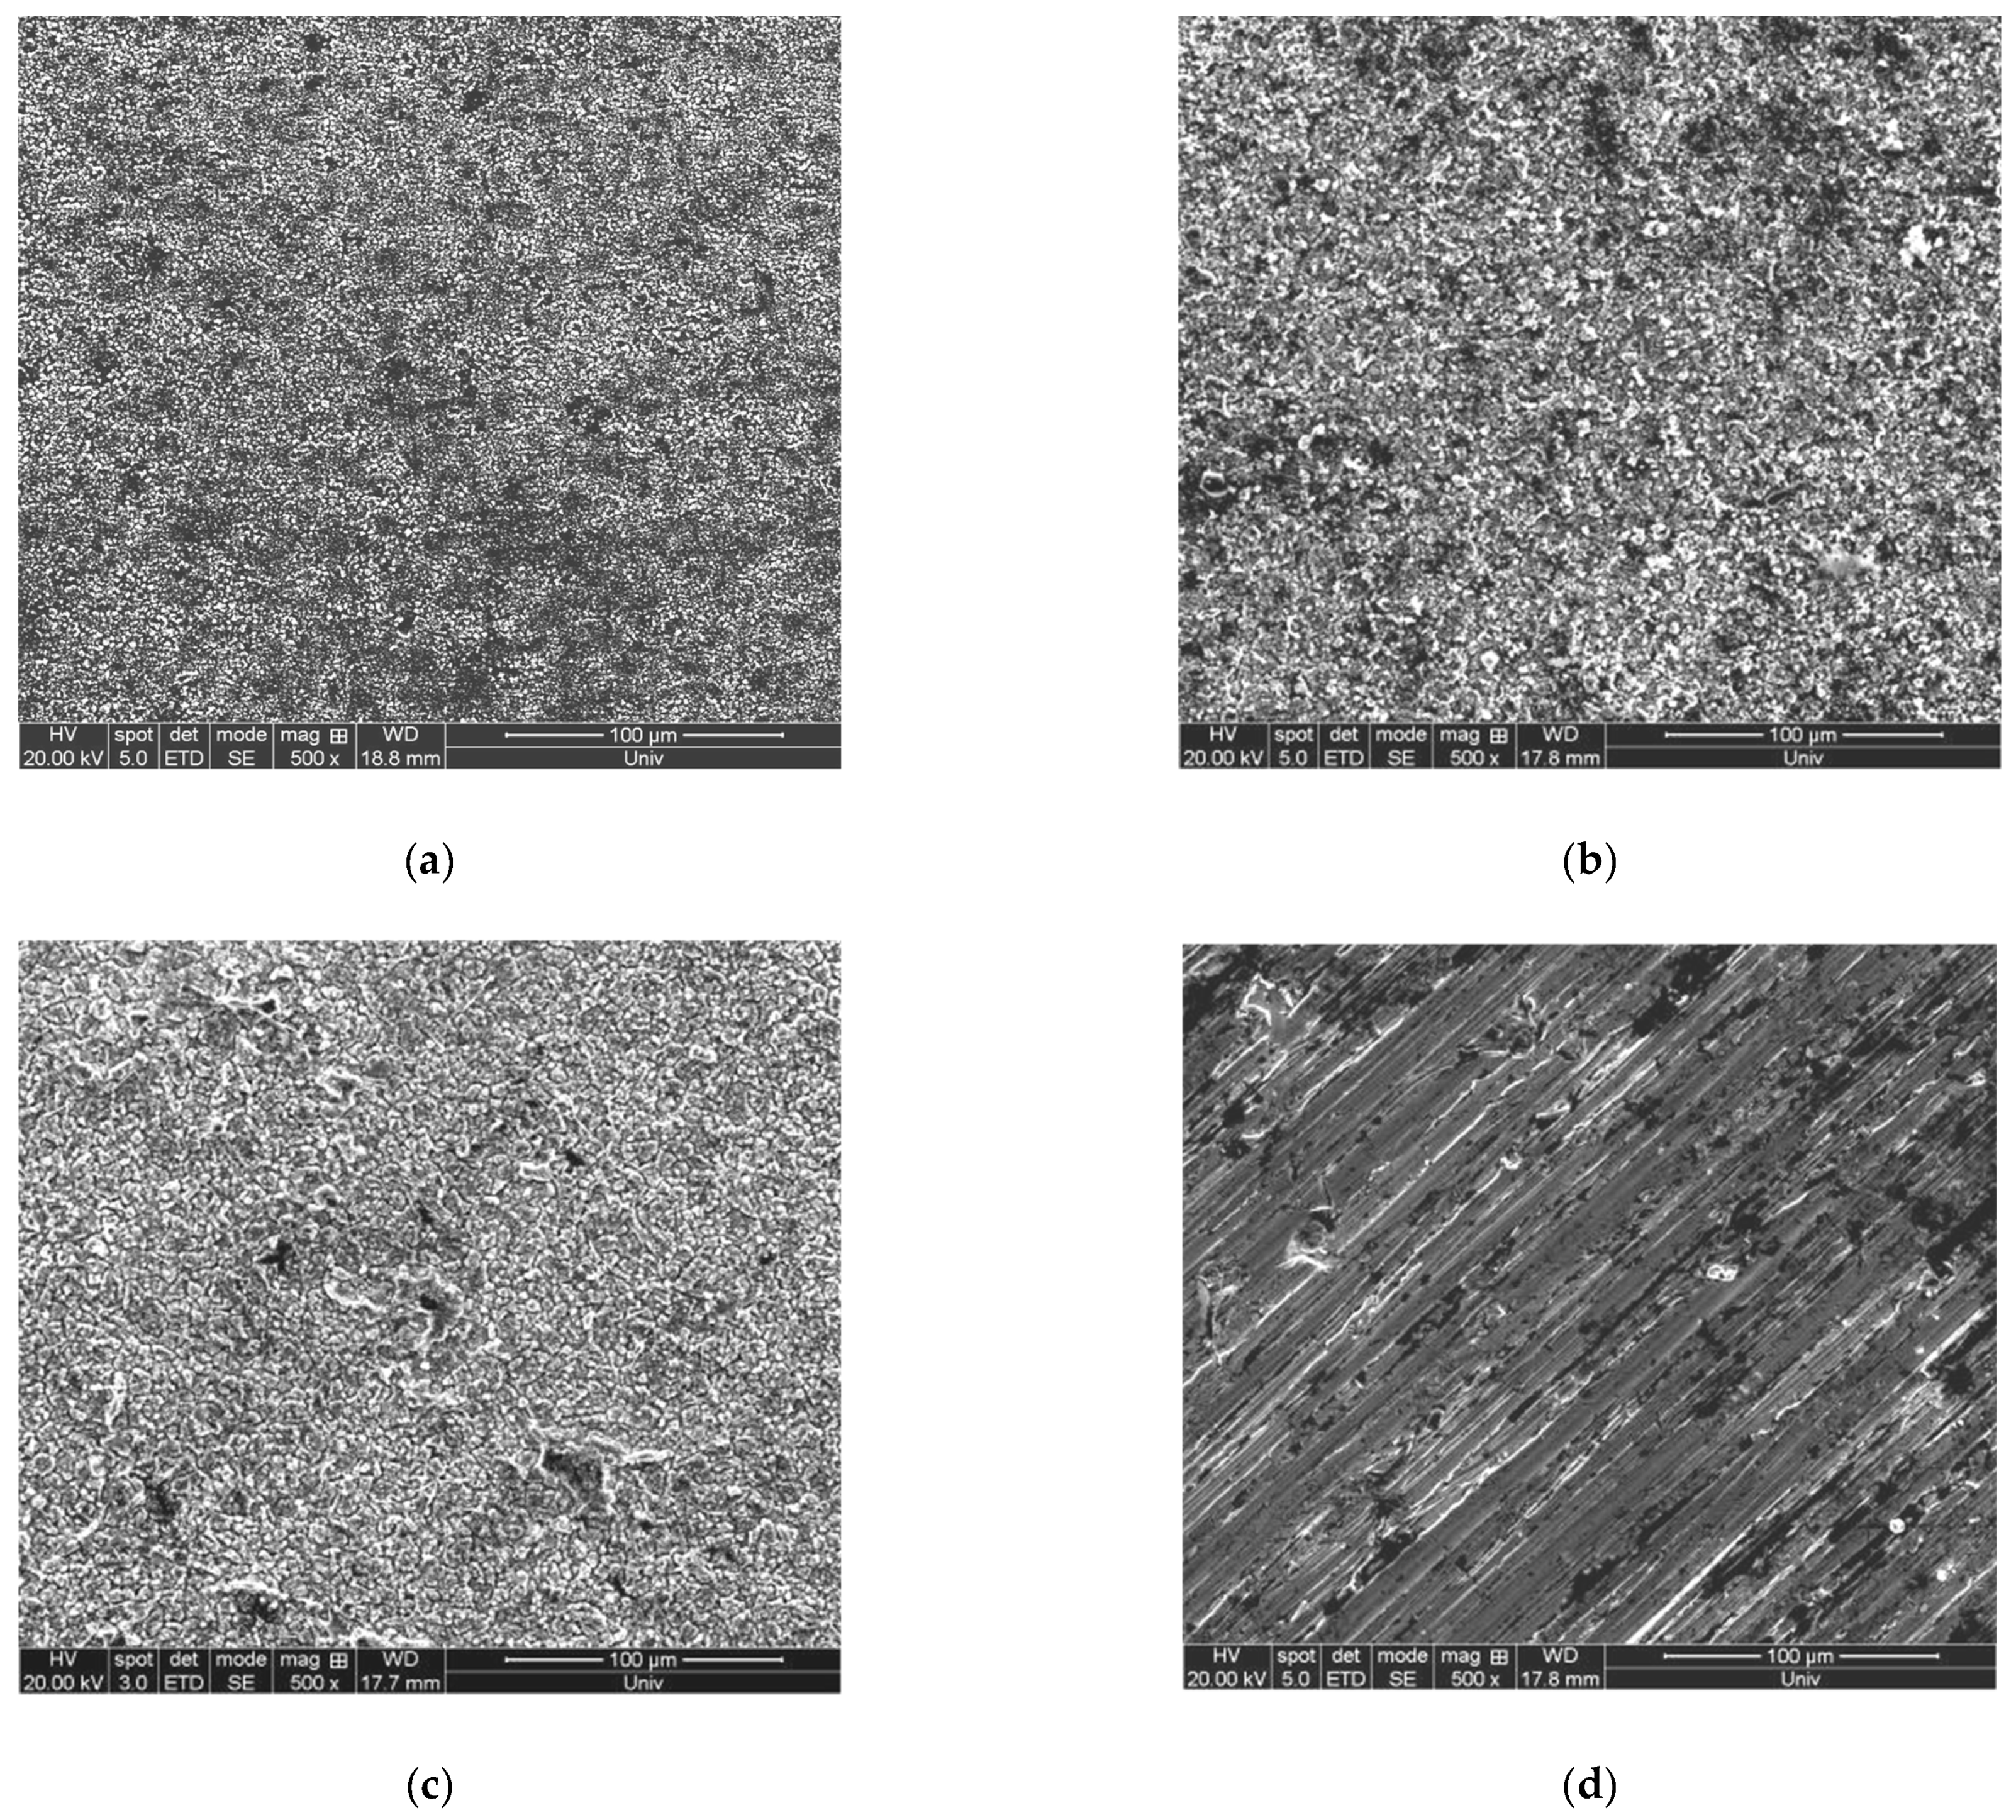
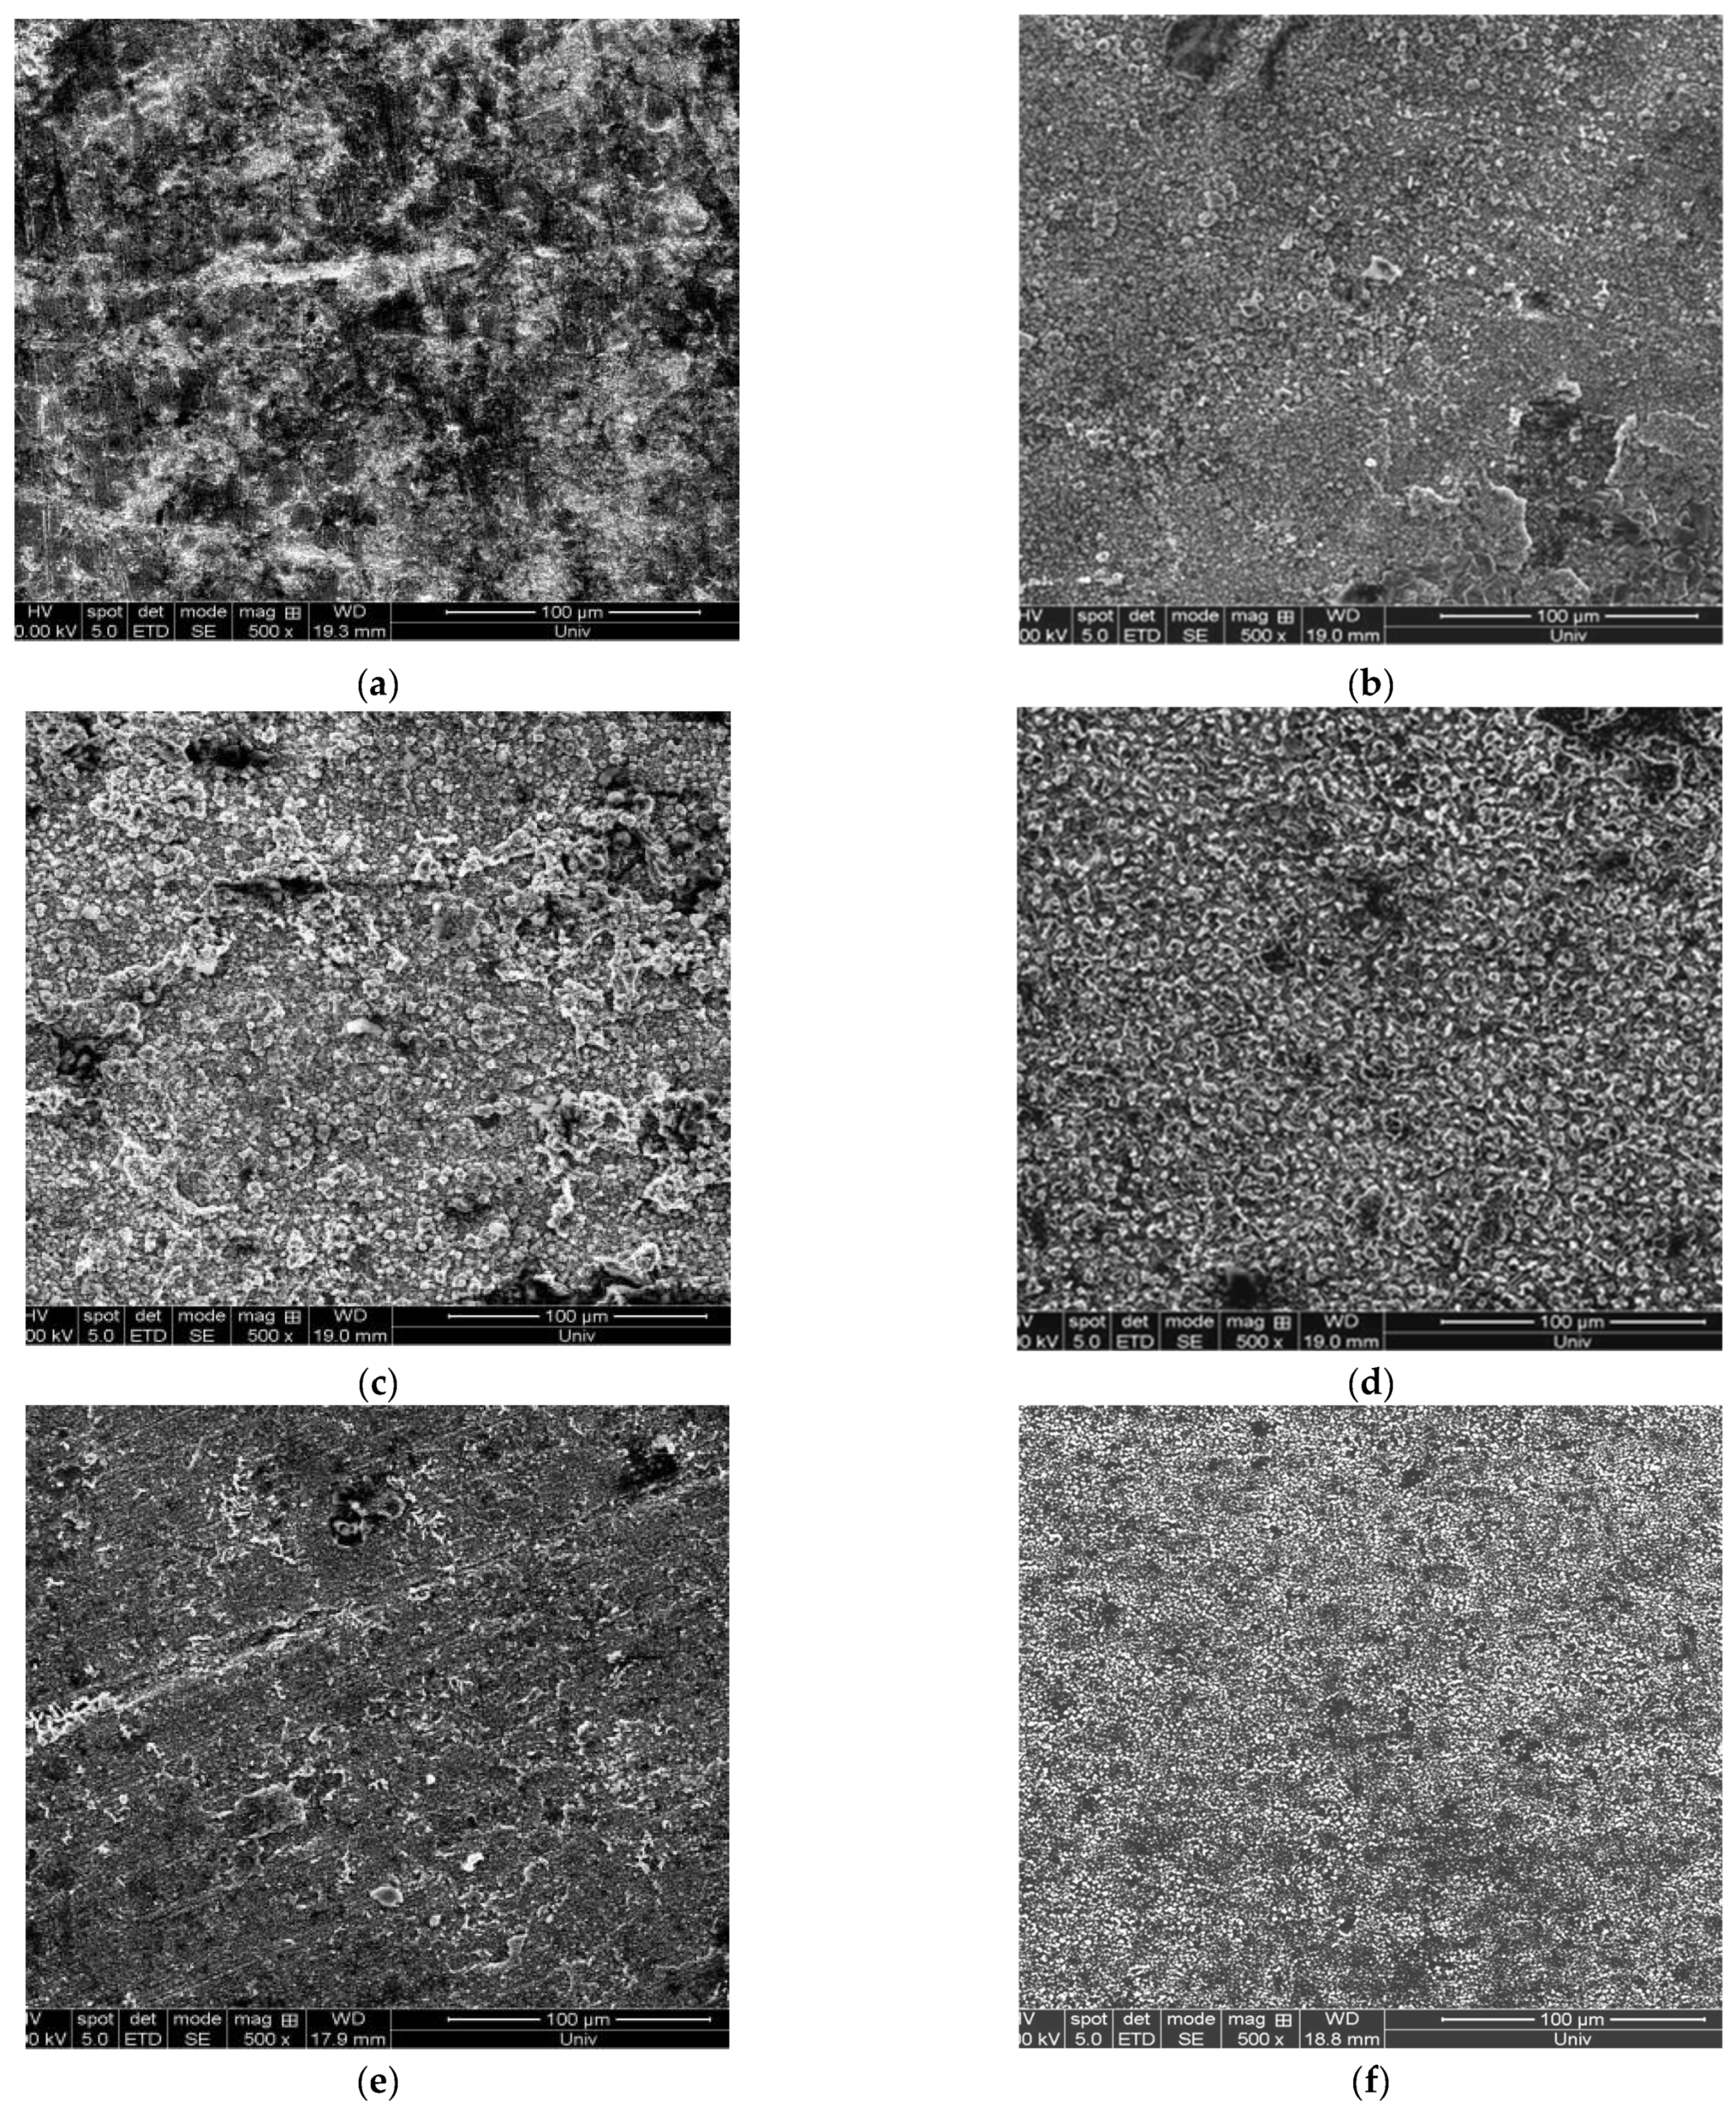
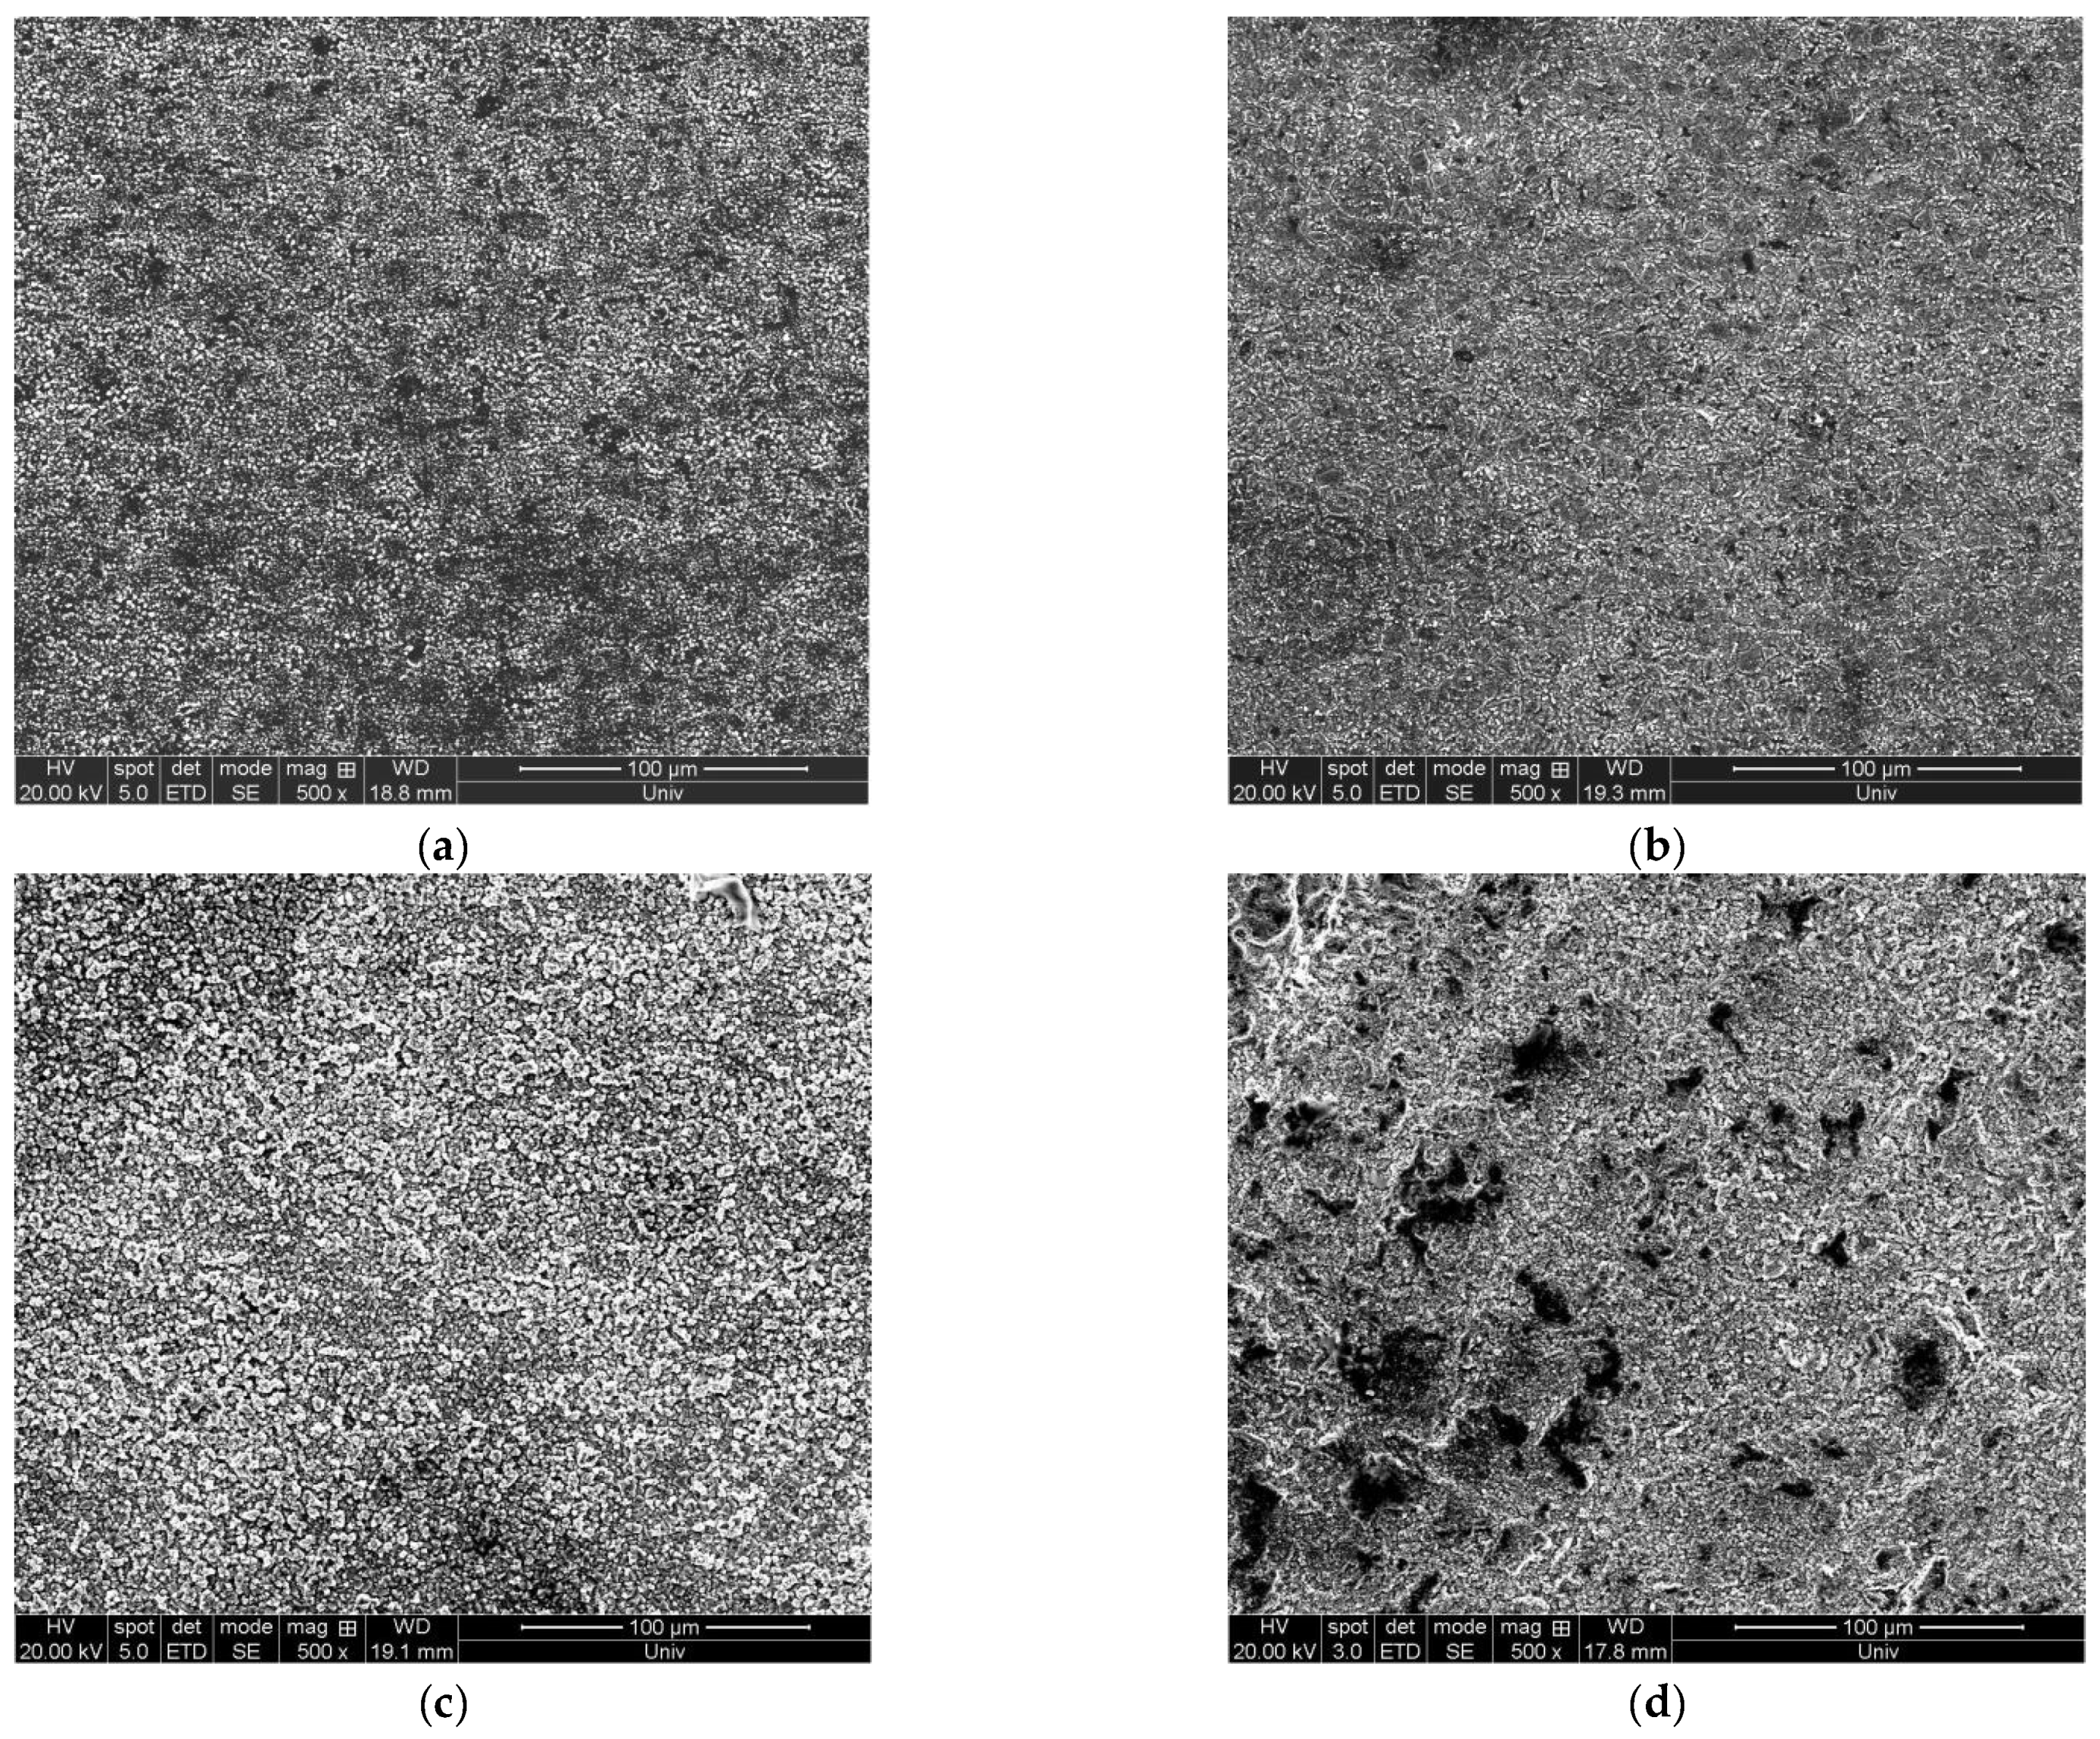
3.4.2. Influence of Current Density on the Surface Morphology of the Deposition Layer

The surface morphologies of the electrodeposition layers at different current densities are shown in Figure 9. It can be seen that when the current density is greater than 200 mA·cm−2, the electrodeposition metal grows too fast in the direction of the electric force due to the excessive current density, forming a dendritic structure and extending to the molten salt. In the removal and cleaning of the cathode plate, the surface of the vanadium deposition layer is partially exfoliated. When the current density is 200 mA·cm−2, the surface morphology of the vanadium deposition layer is good and smooth. When the current density is less than 150 mA·cm−2 because the current density is small, the polarization of the cathode is weakened, and the grain of the deposition layer will be coarse, resulting in the thin vanadium deposition layer of the cathode plate at the same time.

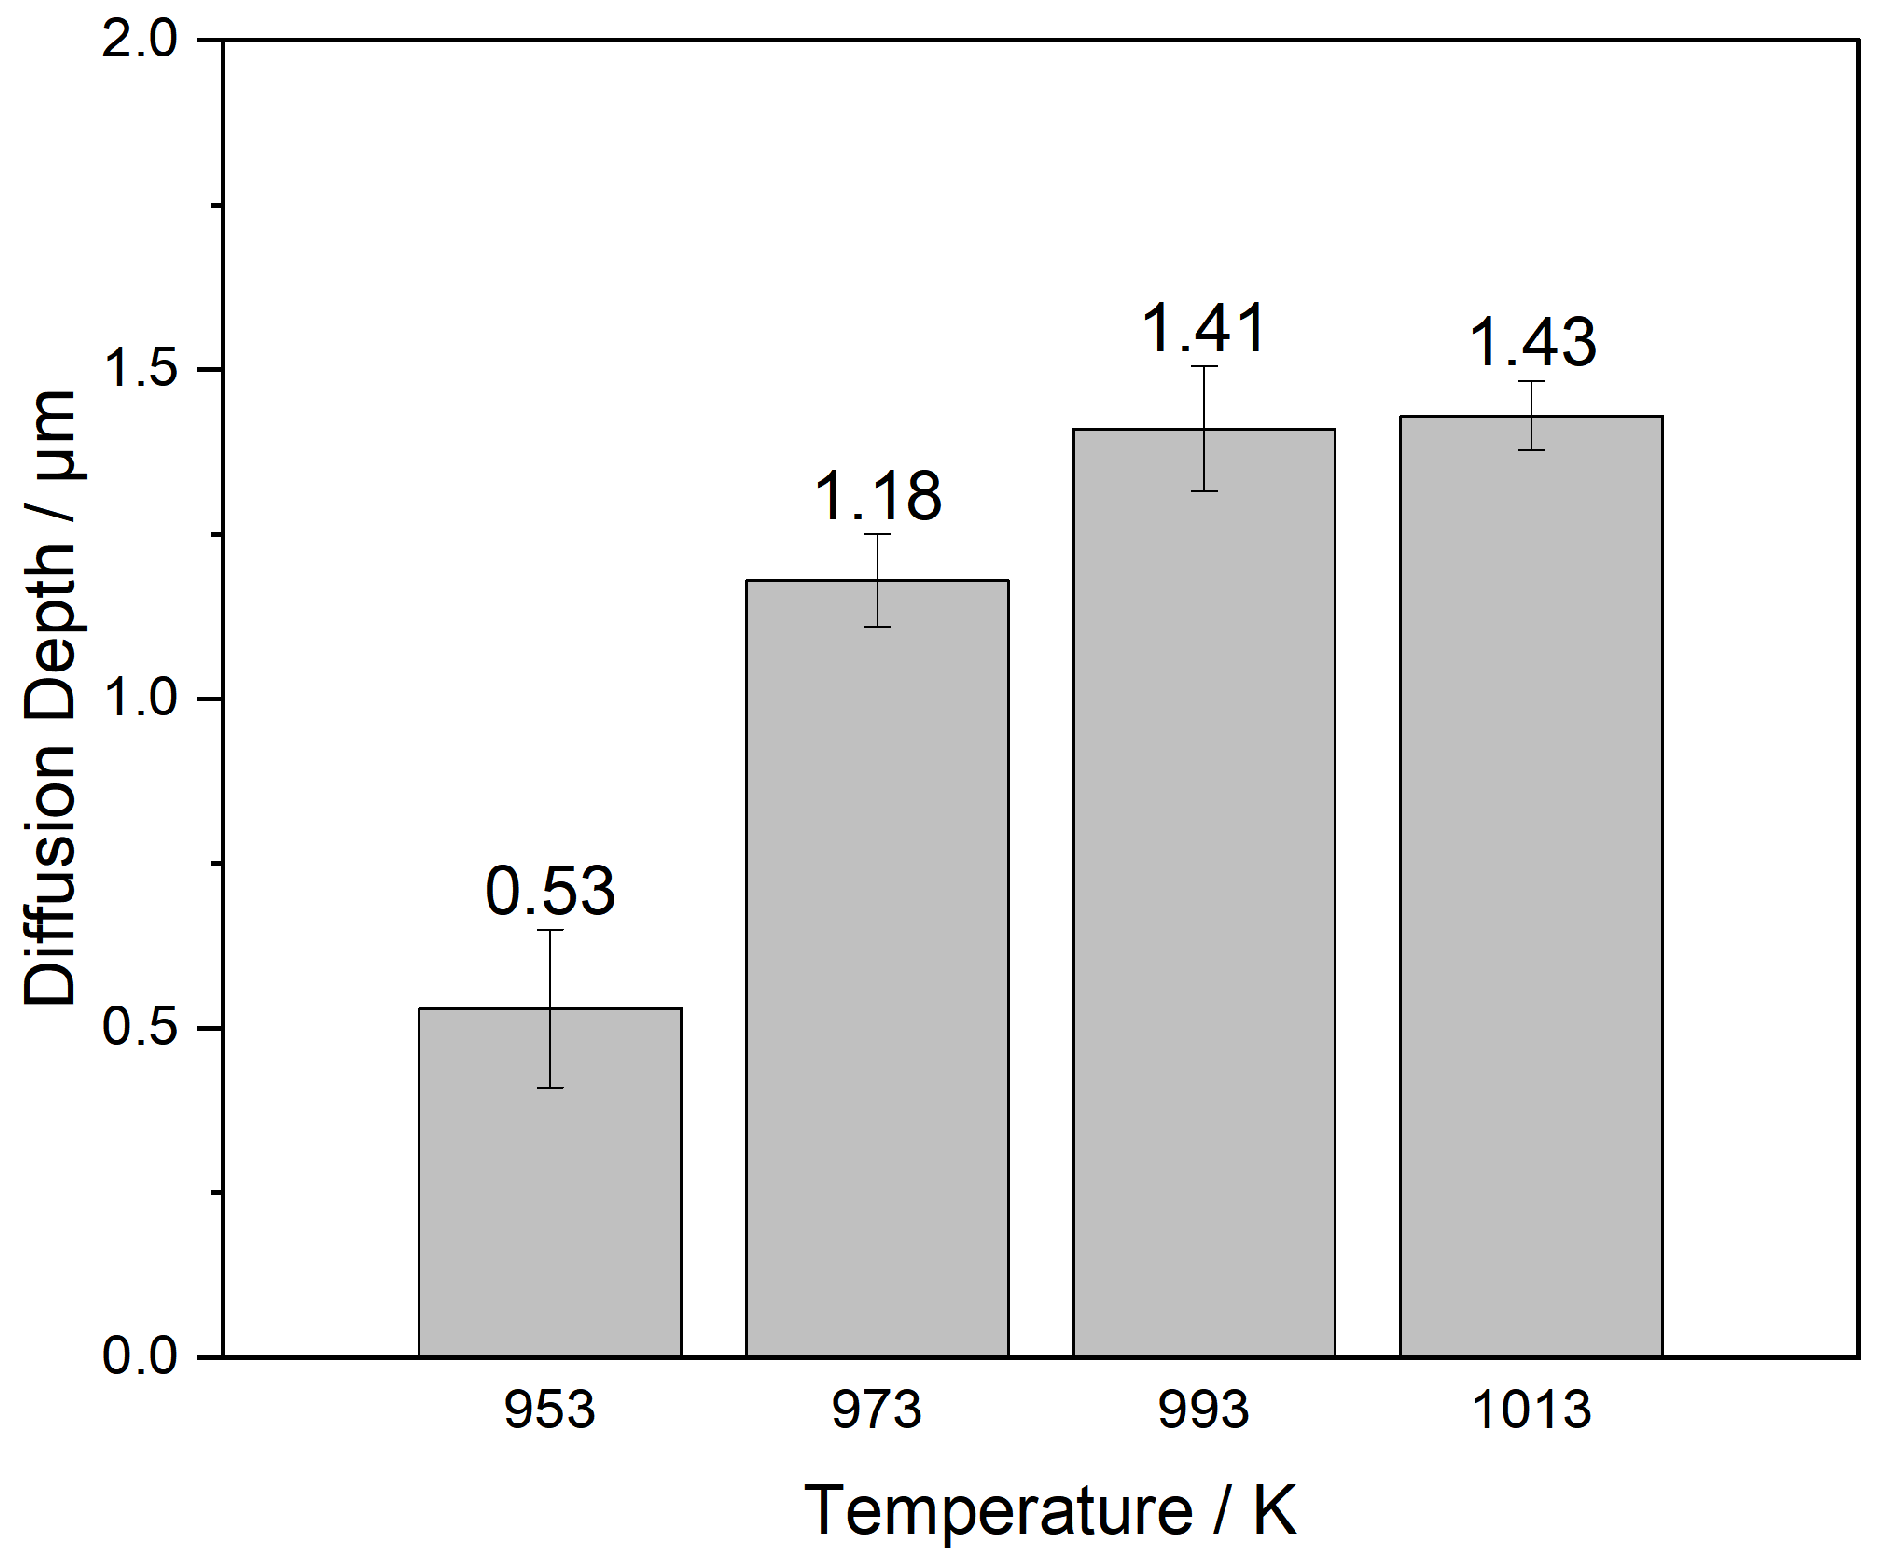
3.5. Influence of Electrodeposition Temperature

The electrodeposition temperature is also an important factor affecting the quality of the deposition layer [24]. When the electrodeposition temperature exceeds the critical temperature, the stability of the complex anion in the molten salt decreases, and the decomposed high-concentration free cations are reduced on the cathode to obtain the powder, which leads to poor adhesion between the deposit and the substrate. If the temperature of the molten salt is too high, it will cause the metal to reverse melting in the molten salt or aggravate side reactions in the molten salt system. When the temperature is too low, the viscosity of the molten salt is relatively large, and the molten salt is easy to stick to the cathode surface, which affects the quality of the deposition layer. Therefore, it is necessary to determine the most suitable molten salt temperature in order to obtain a good deposition layer.

3.5.1. Influence of Electrodeposition Temperature on the Thickness of Vanadium Deposition layer

Figure 10 shows the thickness of the vanadium deposition layer on the surface of the sample at different electrodeposition temperatures. It can be seen that the thickness of the deposition layer increases with the increase in temperature. When the electrodeposition temperature is 953 K, the viscosity of molten salt is large, and the activated ions are limited by mass transfer, resulting in a decrease in deposition rate and a thin vanadium deposition layer, which is only 0.53 μm. When the electrodeposition temperature is greater than 953 K, the vanadium deposition thickness increases significantly with increasing temperature; When the electrodeposition temperature is greater than 993 K, due to the high temperature, the composite anion in the molten salt decomposes, and the powder reduced by the high concentration free cation on the cathode plate affects the bonding between the vanadium deposit and the matrix, so that the ratio of the increase of the vanadium deposition layer is little.

3.5.2. Influence of Electrodeposition Temperature on the Surface Morphology of Vanadium Deposition Layer

Figure 11 is the surface morphology of the vanadium deposition layer at different electrodeposition temperatures. It can be seen from the figure that the electrodeposition temperature has a large influence on the deposition layer. When the electrodeposition temperature is 953 K, due to the large viscosity of molten salt, more molten salt is brought out on the cathode plate. In the process of cleaning the cathode plate, the vanadium deposition layer falls off more, the surface becomes rough, there are strip grooves, and even the vanadium deposition layer falls off completely in many positions. Finally, the vanadium deposition layer is thin and not dense. When the electrodeposition temperature is 973 K, the vanadium deposition layer is uniform and dense, the obtained vanadium deposition layer is uniform and dense, and the cleaning process was almost no shedding, so the obtained vanadium deposition layer is relatively bright. When the electrodeposition temperature is 993 K, the surface of the vanadium deposition layer has a slight shedding phenomenon during the cleaning process, and the unshedded part is dense. When the electrodeposition temperature is 1013 K, the vanadium deposition layer is not dense, and the main reason is that the temperature is high, and the powder is produced on the cathode surface, which affects the deposition effect of vanadium and makes the deposition quality worse.

3.6. Influence of Electrodeposition Time

3.6.1. Influence of Electrodeposition Time on the Thickness of the Deposition Layer

The thickness of the vanadium deposition layer on the cathode plate at different electrodeposition times is shown in Figure 12. It can be seen that the deposition time has a significant influence on the thickness of the deposition layer. With the extension of time, the thickness of the deposition layer increases continuously. When the time is 10 min, the thickness is only 1.41 μm; when the time reaches 50 min, the thickness reaches 4.26 μm.

3.6.2. The Influence of Electrodeposition Time on the Surface Morphology of the Deposition Layer

Figure 13 shows the surface morphology of the electrodeposition layer under different electrodeposition times. It can be seen that the change in electrodeposition time has a greater influence on the surface morphology of the deposition layer. When the electrodeposition time is 10 min, the particle size of the deposition layer on the cathode substrate is small and uniform. When the electrodeposition time is 20 min, the particle size increases slightly, the surface is smooth and smooth, and the particle is uniform. When the electrodeposition time is 30 min, the particle size is uniform, and the surface is bright and smooth. When the electrodeposition time is 50 min, the surface of the electrodeposition layer becomes uneven and uneven, and the particle size becomes coarser. In contrast, the surface quality of 30 min electrodeposition is better.

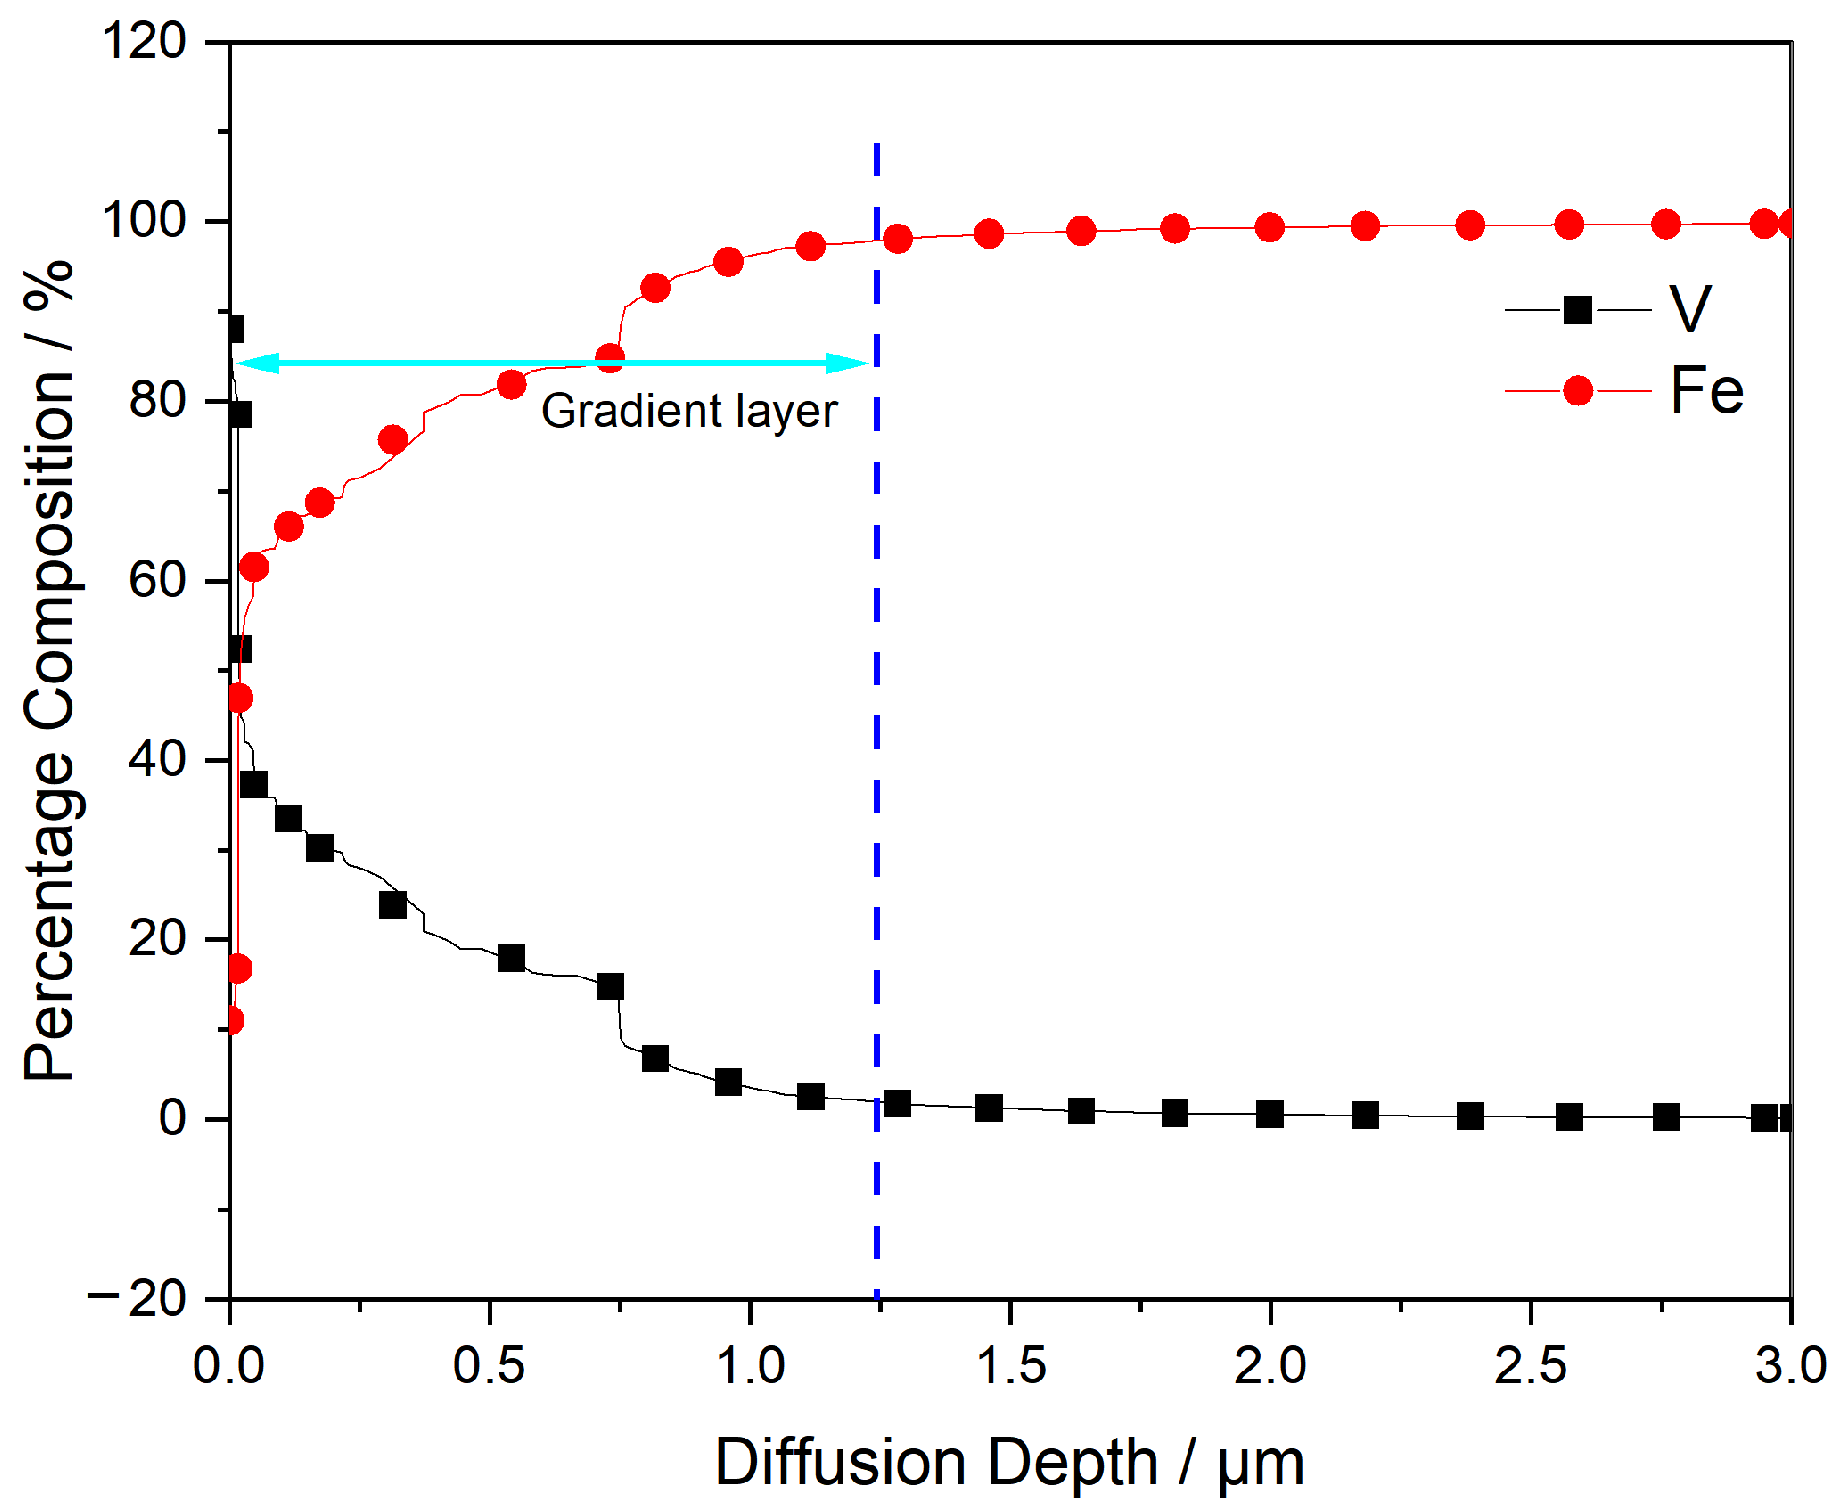
3.7. Cross-Section Analysis of Vanadium Deposits under Optimum Preparation Conditions

According to the previous analysis, the best deposition conditions are: the composition of molten salt is XNaCl = 0.4, XKCl = 0.4, XNaF = 0.2; The deposition current is a double pulse current; The deposition temperature is 973 K; The current density is 200 mA/cm2; The deposition time is 30 min. The surface morphology of the vanadium deposit obtained under this condition is shown in Figure 13c, and the corresponding energy spectrum results are shown in Figure 14.
It can be seen that the elements deposited on the surface of the deposition layer are mainly vanadium and contain a small amount of iron. Figure 15 shows the detection and analysis results of the coating surface using an optical microscope and field emission scanning electron microscope. It can be seen that the vanadium atoms in the deposition layer are diffused with the iron atoms in the cathode carbon steel. The thickness of the deposition layer dominated by vanadium element is about 3 μm, which is not much different from the detection results of the glow discharge spectrometer.

4. Conclusions

The vanadium is prepared by electrodeposition in the NaCl-KCl-NaF-V2O3 molten salt system. The influence of different factors on the quality of the vanadium deposition layer is analyzed, the optimal value of each parameter is obtained, and the best process conditions for the preparation of vanadium by electrodeposition are obtained:
(1)
When the system ratio is XNaCl = 0.4, XKCl = 0.4, and XNaF = 0.2, the quality of the obtained vanadium deposition layer is the best;
(2)
The electrodeposition method adopts the bidirectional pulse method, and the surface quality of the obtained vanadium deposition layer is better than that of DC electrodeposition. The process parameters are: pulse period T = 1000 ms; positive and negative current ratio i p/i n = 6:1; positive and negative time ratio t p/t n = 3:1;
(3)
The current density of electrodeposition has a great influence on the thickness of the vanadium deposition layer; when the current density is 200 mA·cm−2, a better vanadium deposition layer is obtained;
(4)
The electrodeposition temperature is an important factor affecting the thickness of the vanadium deposition layer; when the electrodeposition temperature is 973 K, it can not only ensure good fluidity of molten salt but also maintain the stability of the complex anion in the molten salt and reduce the volatilization of molten salt;
(5)
With the prolongation of electrodeposition time, the thickness of the vanadium deposition layer increases continuously, but too long a deposition time will also make the surface of the deposition layer rough and uneven. The quality of the vanadium deposition layer obtained by electrodeposition for 30 min is better.
The best deposition conditions are: the composition of molten salt is XNaCl = 0.4, XKCl = 0.4, XNaF = 0.2; The deposition current is a double pulse current (pulse period T = 1000 ms; positive and negative current ratio i p/i n = 6:1; positive and negative time ratio t p/t n = 3:1); The deposition temperature is 973 K; The current density is 200 mA/cm2; The deposition time is 30 min;
Molten salt electrodeposition is an important method to prepare high-purity metal vanadium at present. It is a problem worth studying to select the appropriate molten salt system and further optimize the technological parameters, which will greatly promote the progress of the vanadium process and the development of the vanadium industry.

Author Contributions

Conceptualization, Y.L.; methodology, Y.L.; software, Y.T. and C.L.; validation, Y.T. and C.L.; formal analysis, Y.T.; investigation, Y.T. and C.L.; resources, Y.L.; data curation, Y.T. and C.L.; writing—original draft preparation, Y.T.; writing—review and editing, Y.T.; visualization, Y.T. and C.L.; supervision, Y.L.; project administration, Y.L.; funding acquisition, Y.L. All authors have read and agreed to the published version of the manuscript.

Funding

This research received no external funding.

Institutional Review Board Statement

Not applicable.

Informed Consent Statement

Not applicable.

Data Availability Statement

Not applicable.

Conflicts of Interest

The authors declare no conflict of interest.

References

  1. Liu, S.Q. Production status and development trend of vanadium product in world in recent years. Iron Steel Vanadium Titan 2014, 35, 55–62. [Google Scholar]
  2. Xin, X.Y.; Li, S.J. Progress in the research of vanadium metal preparation. Sichuan Nonferrous Met. 2009, 1, 11–14. [Google Scholar]
  3. Zuo, H.; Chen, C.; Wang, H. Research on the indusrtial production processes of high purity metal vanadium. Henan Sci. Technol. 2018, 2, 151–152. [Google Scholar]
  4. Joly, M.P. In Proceedings of the Second United Nations International Conference on Peaceful Uses of Atomic Energy. Geneva, Switzerland, 1–13 September 1956; p. 309. [Google Scholar]
  5. Zhang, Y.Y.; Yu, L.; Yu, H.; Fu, T.; Wang, J.; Shen, F.Q.; Cui, K.K. Microstructure evolution and growth mechanism of Si-MoSi2 composite coatings on TZM (Mo-0.5Ti-0.1Zr-0.02 C). Alloys Compd. 2022, 894, 62403. [Google Scholar] [CrossRef]
  6. Xian, X.B.; Ye, L.S.; Leng, B.Y. Study on Preparation and Properties of Pure Vanadium. Rare Met. Mater. Eng. 2010, 39, 928–931. [Google Scholar]
  7. Block, F.E. Metallothermic Reduction of Vanadium Chlorides. Report of Investigations 5722; Bureau of Mines, US Department of Interior: Washington, DC, USA, 1961; p. 17.
  8. Carlson, O.N.; Burkholder, H.R.; Martsching, G.A.; Schmidt, F.A. Preparation of High Purity Vanadium, AIME Extraction Metallurgy of Refractory Metals Meeting; Ames Lab.: Chicago, CA, USA, 1981; p. 1. [Google Scholar]
  9. Rostoker, W.; Kolodney, M. The Metallurgy of Vanadium. J. Electrochem. Soc. 1958, 105, 197–206. [Google Scholar] [CrossRef]
  10. Wang, Z.F. Preparation of Vanadium Alloy by Electrochamical Reduction of Solid in Molten Salt; Northeastern University: Shenyang, China, 2013. [Google Scholar]
  11. Wang, J.; Zhang, Y.Y.; Cui, K.K.; Fu, T.; Gao, J.J.; Hussain, S.; AlGarni, T.S. Pyrometallurgical recovery of zinc and valuable metals from electric arc furnace dust-A review. J. Clean. Prod. 2021, 298, 126788. [Google Scholar] [CrossRef]
  12. Yang, S.Z. Vanadium Metallurgy, 1st ed.; Metallurgical Industry Press: Beijing, China, 2010; pp. 96–97. [Google Scholar]
  13. Tripathy, P.K.; Suri, A.K. A New Process for the Preparation of Vanadium Metal. High Temp. Mater. Process. 2002, 21, 127–137. [Google Scholar] [CrossRef] [Green Version]
  14. Lu, Z.Y.; Luo, D.M.; Chen, H.S.; Sui, Z.T. Preparation of High Density VC by Vacuum Carbon Reduction Method. Rare Met. 2003, 1, 132–134. [Google Scholar]
  15. Li, M.J.; Zhang, S.L.; Ding, X.M.; Luo, W.; Xiong, M. Preparation of Tungsten-doped VO2 Thin Film with Low Phase Transition Temperature by Hydrogen Reduction Method. Iron Steel Vanadium Titan. 2010, 2, 6–9. [Google Scholar]
  16. Wu, Z.W.; Yang, H.T.; Wu, L.R.; Hu, C.Q.; Gao, W.G.; Huang, L.Y.; Li, L. Research progress in preparation of metal powders by pressurized hydrogen reduction. Int. J. Hydrogen Energy 2021, 46, 35102–35120. [Google Scholar] [CrossRef]
  17. Abolpour, B.; Afsahi, M.M.; Azizkarimi, M. Hydrogen reduction of magnetite concentrate particles. Miner. Process. Extr. Metall. Rev. 2018, 130, 1–14. [Google Scholar] [CrossRef]
  18. Wu, C.L.; Wang, B.H.; Chen, X.; Wang, H.L.; Wang, N. Preparation of Vanadium Powder by Calcium Thermic Reduction of Calcium Vanadate in Molten Salts. Nonferrous Met. (Extr. Metall.) 2019, 6, 52–54+75. [Google Scholar]
  19. Cheng, W.; Huang, M.S.; Wang, Z.J.; Yang, L.H. Preparation of High-purity Lanthanum by Calciothermic Reduction. Min. Metall. Eng. 2013, 3, 104–106+109. [Google Scholar]
  20. Cai, Z.F.; Zhang, Z.M.; Guo, Z.C. Direct electrochemical reduction of solid vanadium oxide to metal vanadium at low temperature in molten CaCl2-NaCl. Int. J. Miner. Metall. Mater. 2012, 19, 499–505. [Google Scholar] [CrossRef]
  21. Wang, S.L.; Li, S.C.; Wan, L.F. Electro-deoxidation of V2O3 in molten CaCl2-NaCl-CaO. Int. J. Miner. Metall. Mater. 2012, 19, 212–216. [Google Scholar] [CrossRef]
  22. Liu, Y.X.; Yan, H.W.; Liu, Z.W.; Qin, B.; Yang, P.C. Direct electrolytic preparation of titanium in NaF-K2TiF6-TiO2 system. J. Kunming Univ. Sci. Technol. (Nat. Sci.) 2021, 46, 9–15+64. [Google Scholar]
  23. Zhang, M.J. Principles and Applications of Molten Salt Electrochemistry, 1st ed.; Chemical Industry Press: Beijing, China, 2006. [Google Scholar]
  24. Aguilera, L.; Leyet, Y.; Romaguera-Barcelay, Y.; Thaines, E.; Terezo, A.; Souza, G.L.; Freitas, R.G.; Passos, R.R.; Pocrifka, L.A. Influence of electrodeposition temperature in the electrochemical properties of Ni(OH)2: An experimental and theoretical study. Thin Solid Films.Influence of electrodeposition temperature in the electrochemical properties of Ni(OH)2: An experimental and theoretical study. Thin Solid Film. 2019, 670, 24–33. [Google Scholar]
Figure 1. Typical CV curves for different scan rates.
Coatings 13 00234 g001
Figure 2. XRD spectrum of the NaCl-KCl-NaF-V2O3 molten salt system.
Coatings 13 00234 g002
Figure 3. Distribution of Fe and V content of specimen sections at XNaF = 0.2. Light blue line is gradual range of vanadium deposition and dark blue line is the proportion of vanadium is reduced to 2.0%.
Coatings 13 00234 g003
Figure 4. The thickness of the vanadium deposition layer of specimens corresponding to different NaF contents.
Coatings 13 00234 g004
Figure 5. Surface morphology of the specimen obtained from the variation of the sample matrix and molten salt NaF content: (a) XNaF = 0.2 (b) XNaF = 0.3 (c) XNaF = 0.4 (d) matrix.
Coatings 13 00234 g005
Figure 6. Surface morphology of the deposition layer under different current waveforms and current densities. (a) is DC electrodeposition, 120 mA·cm−2, (b) is Bidirectional pulse electrodeposition, 120 mA·cm−2, (c) is DC electrodeposition,150 mA·cm−2, (d) is Bidirectional pulse electrodeposition, 150 mA·cm−2, (e) is DC electrodeposition, 200 mA·cm−2 and (f) is Bidirectional pulse electrodeposition, 200 mA·cm−2.
Coatings 13 00234 g006
Figure 7. Thickness of the vanadium deposition layer at different current densities.
Coatings 13 00234 g007
Figure 8. Distribution of Fe and V content of specimen sections at 250 mA·cm−2. Light blue line is gradual range of vanadium deposition and dark blue line is the proportion of vanadium is reduced to 2.0%.
Coatings 13 00234 g008
Figure 9. Surface morphology of vanadium deposition layer at different current densities and substrates: (a) matrix, (b) 90 mA·cm−2, (c) 120 mA·cm−2, (d) 150 mA·cm−2, (e) 200 mA·cm−2, and (f) 250 mA·cm−2.
Coatings 13 00234 g009
Figure 10. Thickness of vanadium deposition layer on the surface of cathode plate at different temperatures.
Coatings 13 00234 g010
Figure 11. Surface morphology of the deposition layer at different temperatures: (a) 953 K, (b) 973 K, (c) 993 K, and (d) 1013 K.
Coatings 13 00234 g011
Figure 12. The thickness of the vanadium deposition layer on the cathode plate at different electrodeposition times.
Coatings 13 00234 g012
Figure 13. Surface morphology of vanadium deposition layer on a cathode plate at different times: (a) 10 min, (b) 20 min, (c) 30 min, and (d) 50 min.
Coatings 13 00234 g013
Figure 14. EDS spectrum of deposited layer surface under optimum conditions.
Coatings 13 00234 g014
Figure 15. Appearance and EDS of section: (a)appearance (b) EDS.
Coatings 13 00234 g015
Table 1. Test scheme.
SampleMolten Salt Mole RatioCurrent WaveformElectrodeposition Temperature (K)Current Density (mA·cm−2)Electrodeposition Time (min)
1XNaCl:XKC:XNaF = 0.4:0.4:0.2Bidirectional pulse97320010
2XNaCl:XKC:XNaF = 0.35:0.35:0.3Bidirectional pulse97320010
3XNaCl:XKC:XNaF = 0.3:0.3:0.4Bidirectional pulse97320010
4XNaCl:XKC:XNaF = 0.4:0.4:0.2Bidirectional pulse9739010
5XNaCl:XKC:XNaF = 0.4:0.4:0.2DC97312010
6XNaCl:XKC:XNaF = 0.4:0.4:0.2Bidirectional pulse97312010
7XNaCl:XKC:XNaF = 0.4:0.4:0.2DC97315010
8XNaCl:XKC:XNaF = 0.4:0.4:0.2Bidirectional pulse97315010
9XNaCl:XKC:XNaF = 0.4:0.4:0.2DC97320010
10XNaCl:XKC:XNaF = 0.4:0.4:0.2Bidirectional pulse97325010
11XNaCl:XKC:XNaF = 0.4:0.4:0.2Bidirectional pulse95320010
12XNaCl:XKC:XNaF = 0.4:0.4:0.2Bidirectional pulse99320010
13XNaCl:XKC:XNaF = 0.4:0.4:0.2Bidirectional pulse101320010
14XNaCl:XKC:XNaF = 0.4:0.4:0.2Bidirectional pulse97320020
15XNaCl:XKC:XNaF = 0.4:0.4:0.2Bidirectional pulse97320030
16XNaCl:XKC:XNaF = 0.4:0.4:0.2Bidirectional pulse97320050
Table 2. Surface quality of deposition layers at different current waveforms and current densities.
Order NumberCurrent WaveformCurrent Density/mA·cm−2Surface Quality
(a)DC electrodeposition120The surface has deposits attached and a peeling phenomenon
(b)Bidirectional pulse electrodeposition120The surface is relatively flat, but there is a local peeling phenomenon
(c)DC electrodeposition150The surface is rough, and the deposits are unevenly distributed.
(d)Bidirectional pulse electrodeposition150The surface is relatively flat, and the deposited particles are larger.
(e)DC electrodeposition200The surface is relatively flat, and the deposition layer is thin and not dense.
(f)Bidirectional pulse electrodeposition200The surface is flat, and the deposit’s thickness is uniform and tight.
Disclaimer/Publisher’s Note: The statements, opinions and data contained in all publications are solely those of the individual author(s) and contributor(s) and not of MDPI and/or the editor(s). MDPI and/or the editor(s) disclaim responsibility for any injury to people or property resulting from any ideas, methods, instructions or products referred to in the content.

