Article

High Performance and Reusable SAW Sensor Coated with Thiourea-Decorated POSS with Different Functional Groups for DMMP Detection

1
Department of Mechanical Engineering, Inha University, Incheon 22212, Republic of Korea
2
3D Convergence Center, Inha University, Incheon 22212, Republic of Korea
*
Authors to whom correspondence should be addressed.
Coatings 2023, 13(2), 348; https://doi.org/10.3390/coatings13020348
Submission received: 20 November 2022 / Revised: 26 January 2023 / Accepted: 27 January 2023 / Published: 2 February 2023
(This article belongs to the Special Issue Coatings and Interfaces II)

Abstract

:
A colorless, odorless G nerve agent, a type of chemical transfer agent (CWA) that causes significant loss of life, is being studied for quick and accurate detection. In this study, detection materials with different functional groups were synthesized based on thiourea (TU)-decorated polyhedral oligomeric silsesquioxane (POSS) to study the most suitable material for the detection of dimethyl methylphosphonate (DMMP), a simulant of neural agents. The sensing material was coated on a SAW sensor with a resonance frequency of 250 MHz based on ST-quartz, the DMMP exposure experiment was conducted, and the performance of the sensing material was compared through frequency shift before and after exposure. Coating materials with excellent reactivity with DMMP and appropriate coating concentration for each material were identified at a concentration of 10 ppm. Among them, POSS-TU with 3,5-bis(trifluoromethyl)phenyl as a functional group showed the largest frequency shift characteristics, and it was used in low concentration (1, 5, and 10 ppm) DMMP detection experiments to confirm linear frequency shift characteristics according to low concentration. Finally, through a selectivity experiment with other gases, it was confirmed that the amount of frequency shift in other gases except DMMP was small, making it an excellent DMMP sensing material.

1. Introduction

Recently, biochemical terrorism and hazardous material leakage accidents have occurred frequently in the international community. In particular, early detection of CWAs, which cause human casualties even in very small amounts, is urgently needed because they spread rapidly in vaporized form. Table 1 shows the classification and examples of CWAs [1,2,3,4,5,6].
In general, CWAs are detected through techniques such as photoionization [1], ion mobility spectroscopy [7,8], gas chromatography [9,10], and flame photometry [11,12] in combination with mass spectrometry (GC-MS). However, it is difficult for many people to use these technologies easily, due to needing large equipment, their low portability, high cost, and advanced technology. In contrast, the surface acoustic wave (SAW) sensor, a type of chemical detector, has strengths in sensitivity, portability, and low power consumption, which is useful for future use as a portable detector [13]. The SAW sensor has a characteristic that the detected material varies depending on the type of sensing material coated on the delay line, so research on sensing materials is also important. Fluorine functional polymers such as fluoropolyol, fluoroalcohol polysiloxane, and fluoroalcoholic linear polysiloxane can interact with target analytes through hydrogen bonds [14,15,16,17], and most neuroactive agents in CWAs belong to organic phosphonic acid groups and have a part (-P(O)-O) that can act as a hydrogen bond receptor, making them sensitive to sensing substances [18]. Therefore, in the case of nerve agent detection, it is important to prepare a material that can stably hydrogen bond with the nerve agent. POSS [18,19] and TU [20,21] have superior stability and reproducibility compared to monomolecular materials and are mainly used in fields that require chemical detection and material immobilization due to their easy immobilization characteristics. If the two materials make different functional groups, sensing materials that selectively react to them can be manufactured, so experiments are being continued to compare their performance by attaching various functional groups. Although the previously used POSS and TU were able to stably detect DMMP, due to their limitations in the selectivity and their low-concentration detection sensitivity, they have a higher sensitivity and need to be improved to detect low-concentration DMMP. Therefore, a TU-decorated POSS with different functional groups was used as a sensing material and an experiment was conducted to detect a more stable and low concentration of DMMP. In the experiment, the SAW sensor was coated by diluting the synthesized material to various concentrations to investigate the optimized coating concentration. In this paper, TU-decorated POSS is referred to as PSS-TU, and different functional groups are listed in an arbitrary order and numbered as PSS-TUn (n = 1, 2, 3), respectively. The performance of the sensing material was evaluated through a DMMP exposure experiment, and a low-concentration DMMP exposure experiment was carried out using the most reactive sensing material.

2. Experiment

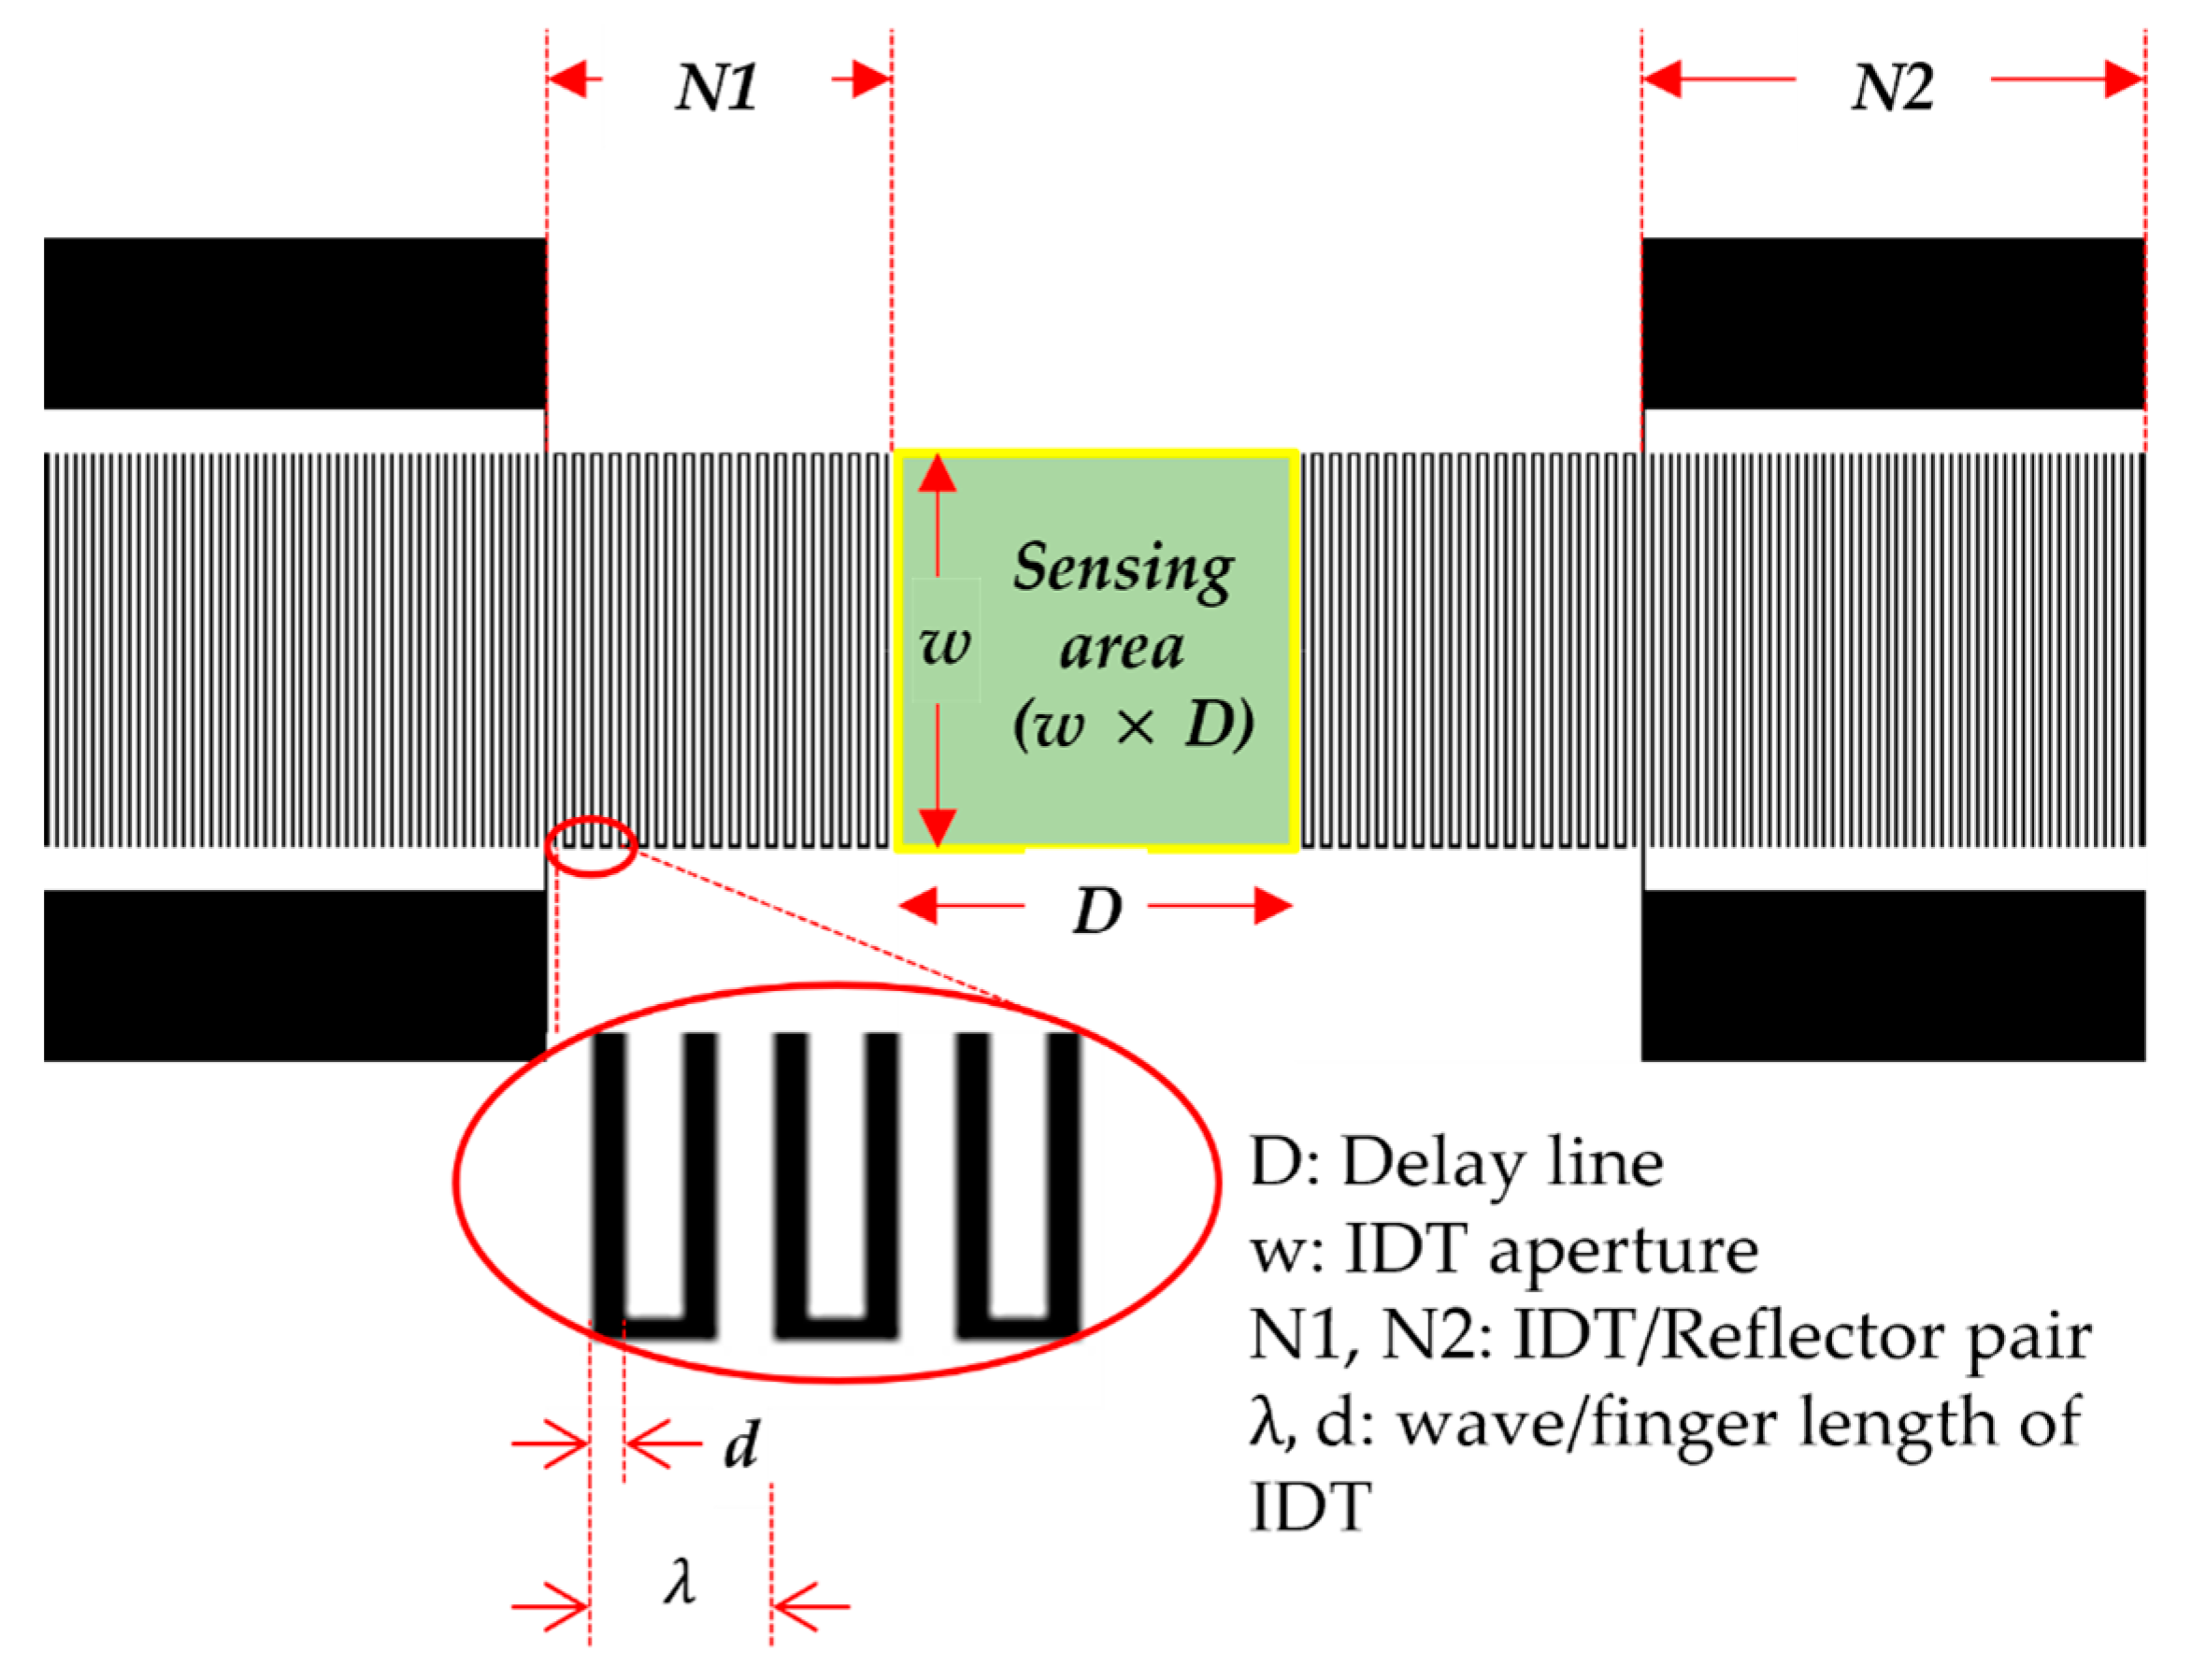
2.1. Design of SAW Sensor

The SAW sensor fabricated on piezoelectric material is shown in Figure 1. The SAW sensor is characterized in that the piezoelectric element repeats contraction and relaxation by the applied voltage and propagates sideways to propagate an electrical signal. Due to these properties, the SAW sensor has a SAW propagation speed, which changes as the mass of the sensing material increases when the vapor molecule is adsorbed to the sensing material [22,23,24,25,26,27]. This change shifts the center frequency of the SAW sensor to obtain quantitative information about the analyte, and adsorption occurs temporarily, allowing the sensor to be reused [28]. In addition, due to the characteristics of surface propagation, it is exposed to physical and chemical changes around it and reacts very sensitively, so it is mainly used as a sensor to measure small physical and chemical changes [28,29,30,31,32,33,34,35]. The equation for the frequency shift is as follows.
Δ f = k 1 + k 2 f 0 2 Δ m A
where Δ f , k i , f 0 , v , λ , m , A are frequency shift, piezoelectric constant, resonant frequency, SAW propagation speed, wavelength, mass, and area of the receptor, respectively.
The characteristics of SAW sensors are based on several factors, such as piezoelectric material, finger length, and the number of reflectors in the case of piezoelectric materials as Figure 2; quartz, lithium niobate (LiNbO3), etc. [23] are generally used, and the type of wave depends on the type of piezoelectric material, crystal shear, and temperature dependence. In this SAW device, among piezoelectric materials, ST-cut quartz, which has a low coefficient of thermal expansion and high thermal stability [27], was used as a piezoelectric substrate. The sensitivity of the sensor according to the selection of piezoelectric materials is shown in Equation (2)
f 0 = v / λ
where, λ , v, and f 0 are the wavelength, SAW propagation velocity, and center frequency, respectively.
In this study, ST-quartz with a SAW propagation speed of 3158 m/s [22,26] was used as a piezoelectric device for the SAW sensor, and aluminum (Al) was used as the IDT. Titanium also has excellent metal adhesion and has been used to adhere Al-IDT to ST-quartz. The IDT pattern used a normal pattern, and a SAW sensor with a resonance frequency of 250 MHz was manufactured with a delay line of 1 mm, a wavelength of IDT of 12.638 um, and an IDT/Reflector pair of 120/198.

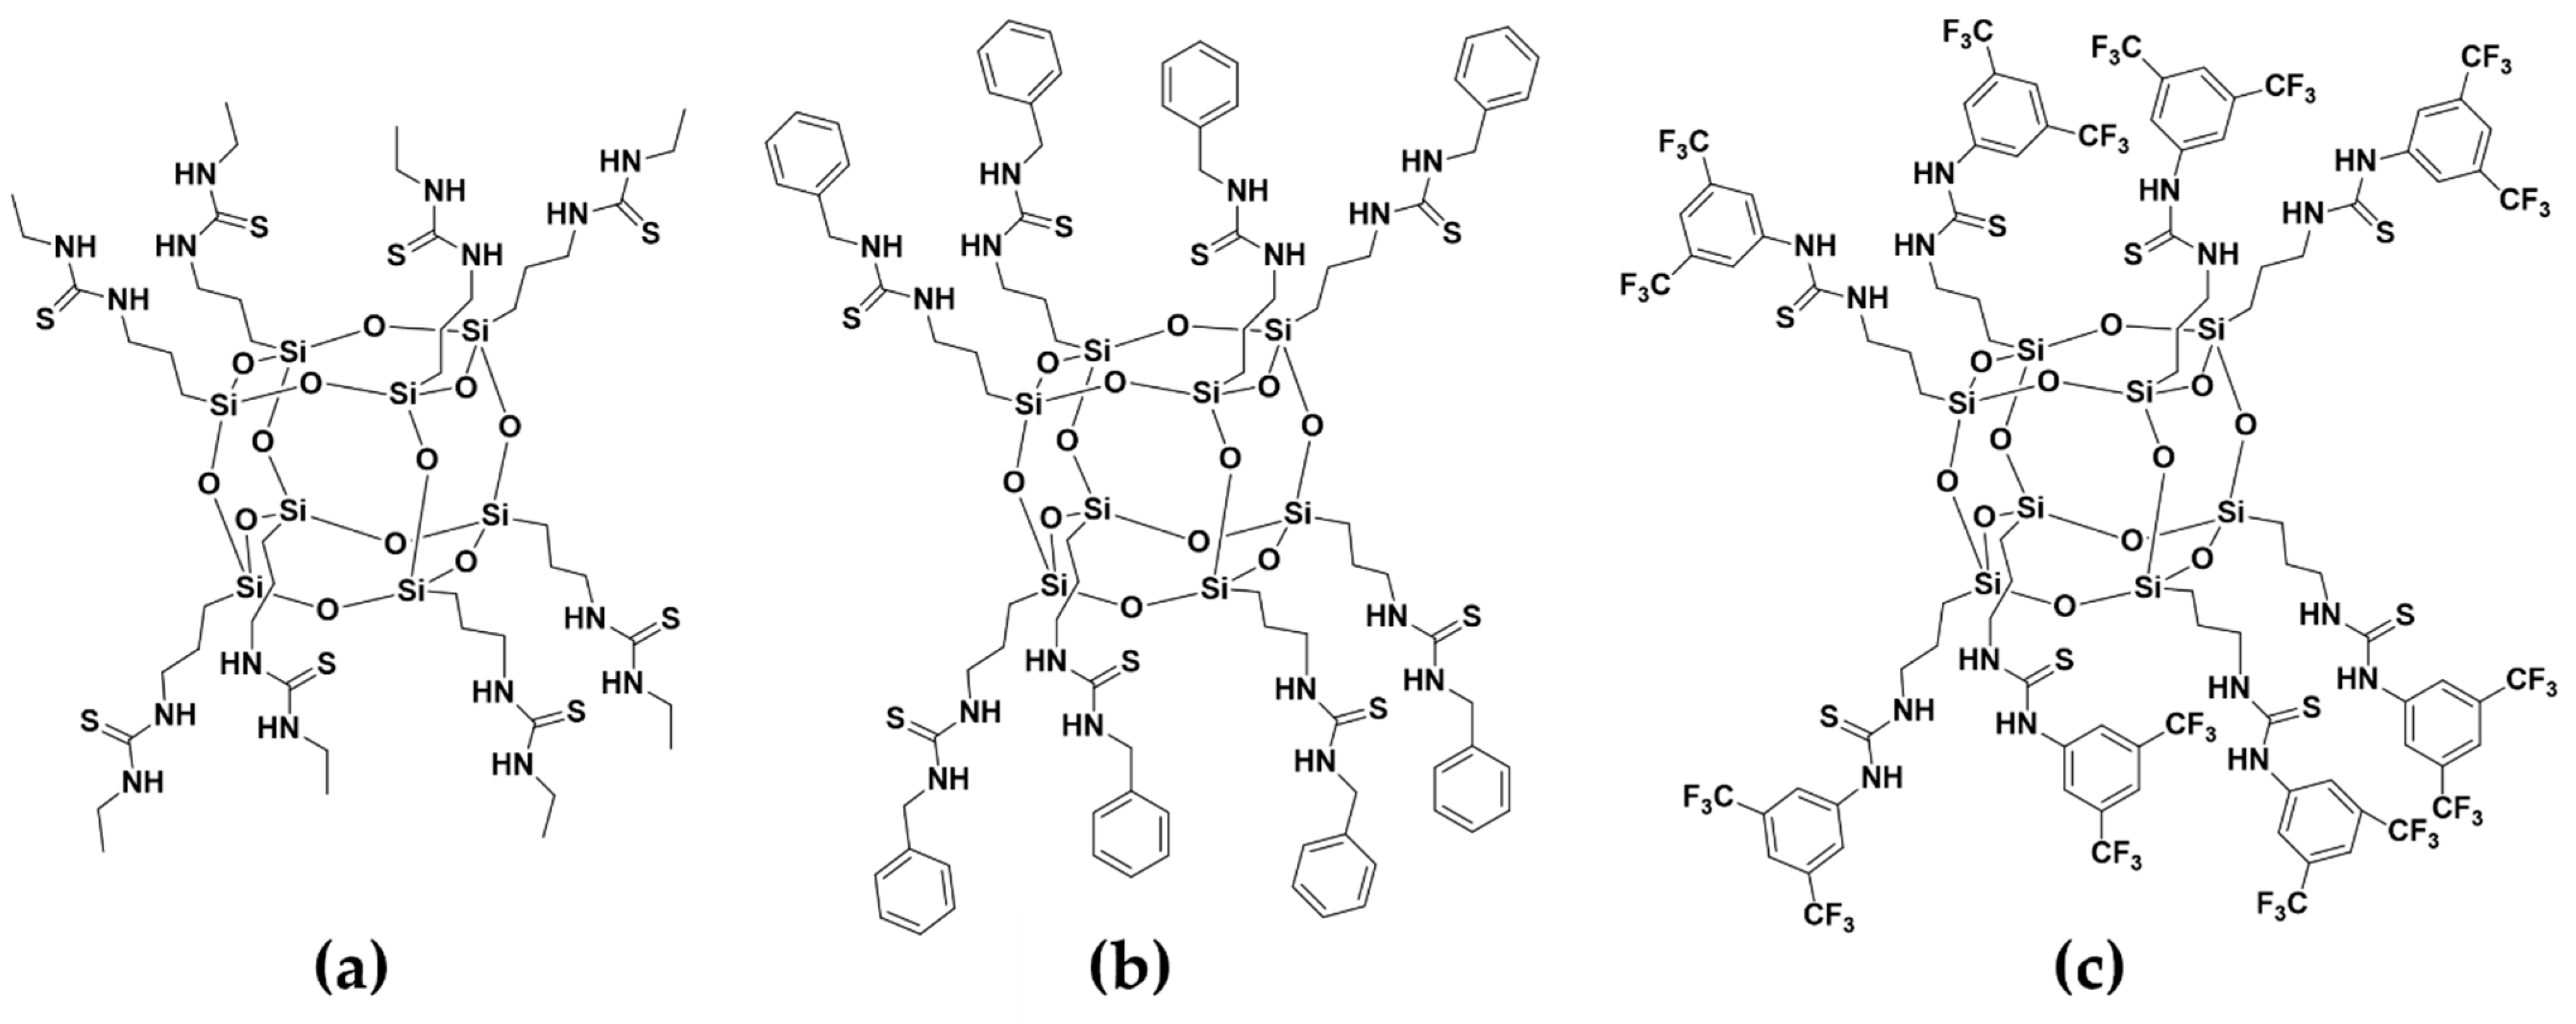
2.2. Sensing Material Synthesis and Coating

Figure 3 shows the synthesis process of sensing materials. For the synthesis process of Figure 3a, refer to the following [11]. First, prepare a 50–100 mg scale for the synthesized PSS-(NH2)8 in Figure 3a, and soak it in a dimethyl sulfoxide (DMSO) solution of 0.1 M to produce a solid PSS-(NH3Cl)8 that does not dissolve in DMSO as shown in Figure 3b. Then, amine and isothiocyanate (R-NCS) 8 Equiv. are added to the solution and heated for 12 h in an oven at 100 °C to synthesize the PSS-TU receptor with different functional groups, as shown in Figure 3c. In the PSS-TU, thiourea is the Electronic Withdrawing Group (EDG) [36] of the S = and R functional groups at the same time as the link between the functional group and the POSS. Therefore, there is a possibility that the target agent and hydrogen bonding would be better so that the existing POSS produces a material to have TU as decoration. The synthesized sensing materials with functional group are shown in Figure 4. The functional group of PSS-TU1 is propyl, the functional group of PSS-TU2 is benzyl, and the functional group of PSS-TU3 is 3,5-bis(trifluoromethyl)phenyl. The three materials have H at the end of the functional group or CF3 to allow hydrogen bonding with DMMP.
Dimethylformamide (DMF) was used as a solvent. The dilution concentration was 1 mg/mL, 0.5 mg/mL, 0.25 mg/mL, and 0.167 mg/mL. Figure 5 shows the solution of the synthesized PSS-TUn and the process of coating it. We cleaned the bottle first and added a receptor to it. After that, DMF, a solvent solution, was added to the dilution concentration, and then transferred to a sonicator for 3 h. These solutions were coated on the delay line area of the SAW sensor surface by drop casting. The coating amount was 0.5 μL. The solution-coated SAW sensor was dried in a convection oven at 60 °C for 1 h. These sensors were measured simultaneously with one uncoated SAW sensor and one coated SAW sensor under the same environmental conditions, and the performance of the sensing material was compared through the frequency shift difference between the two sensors to reduce the effects of moisture, temperature, and air.

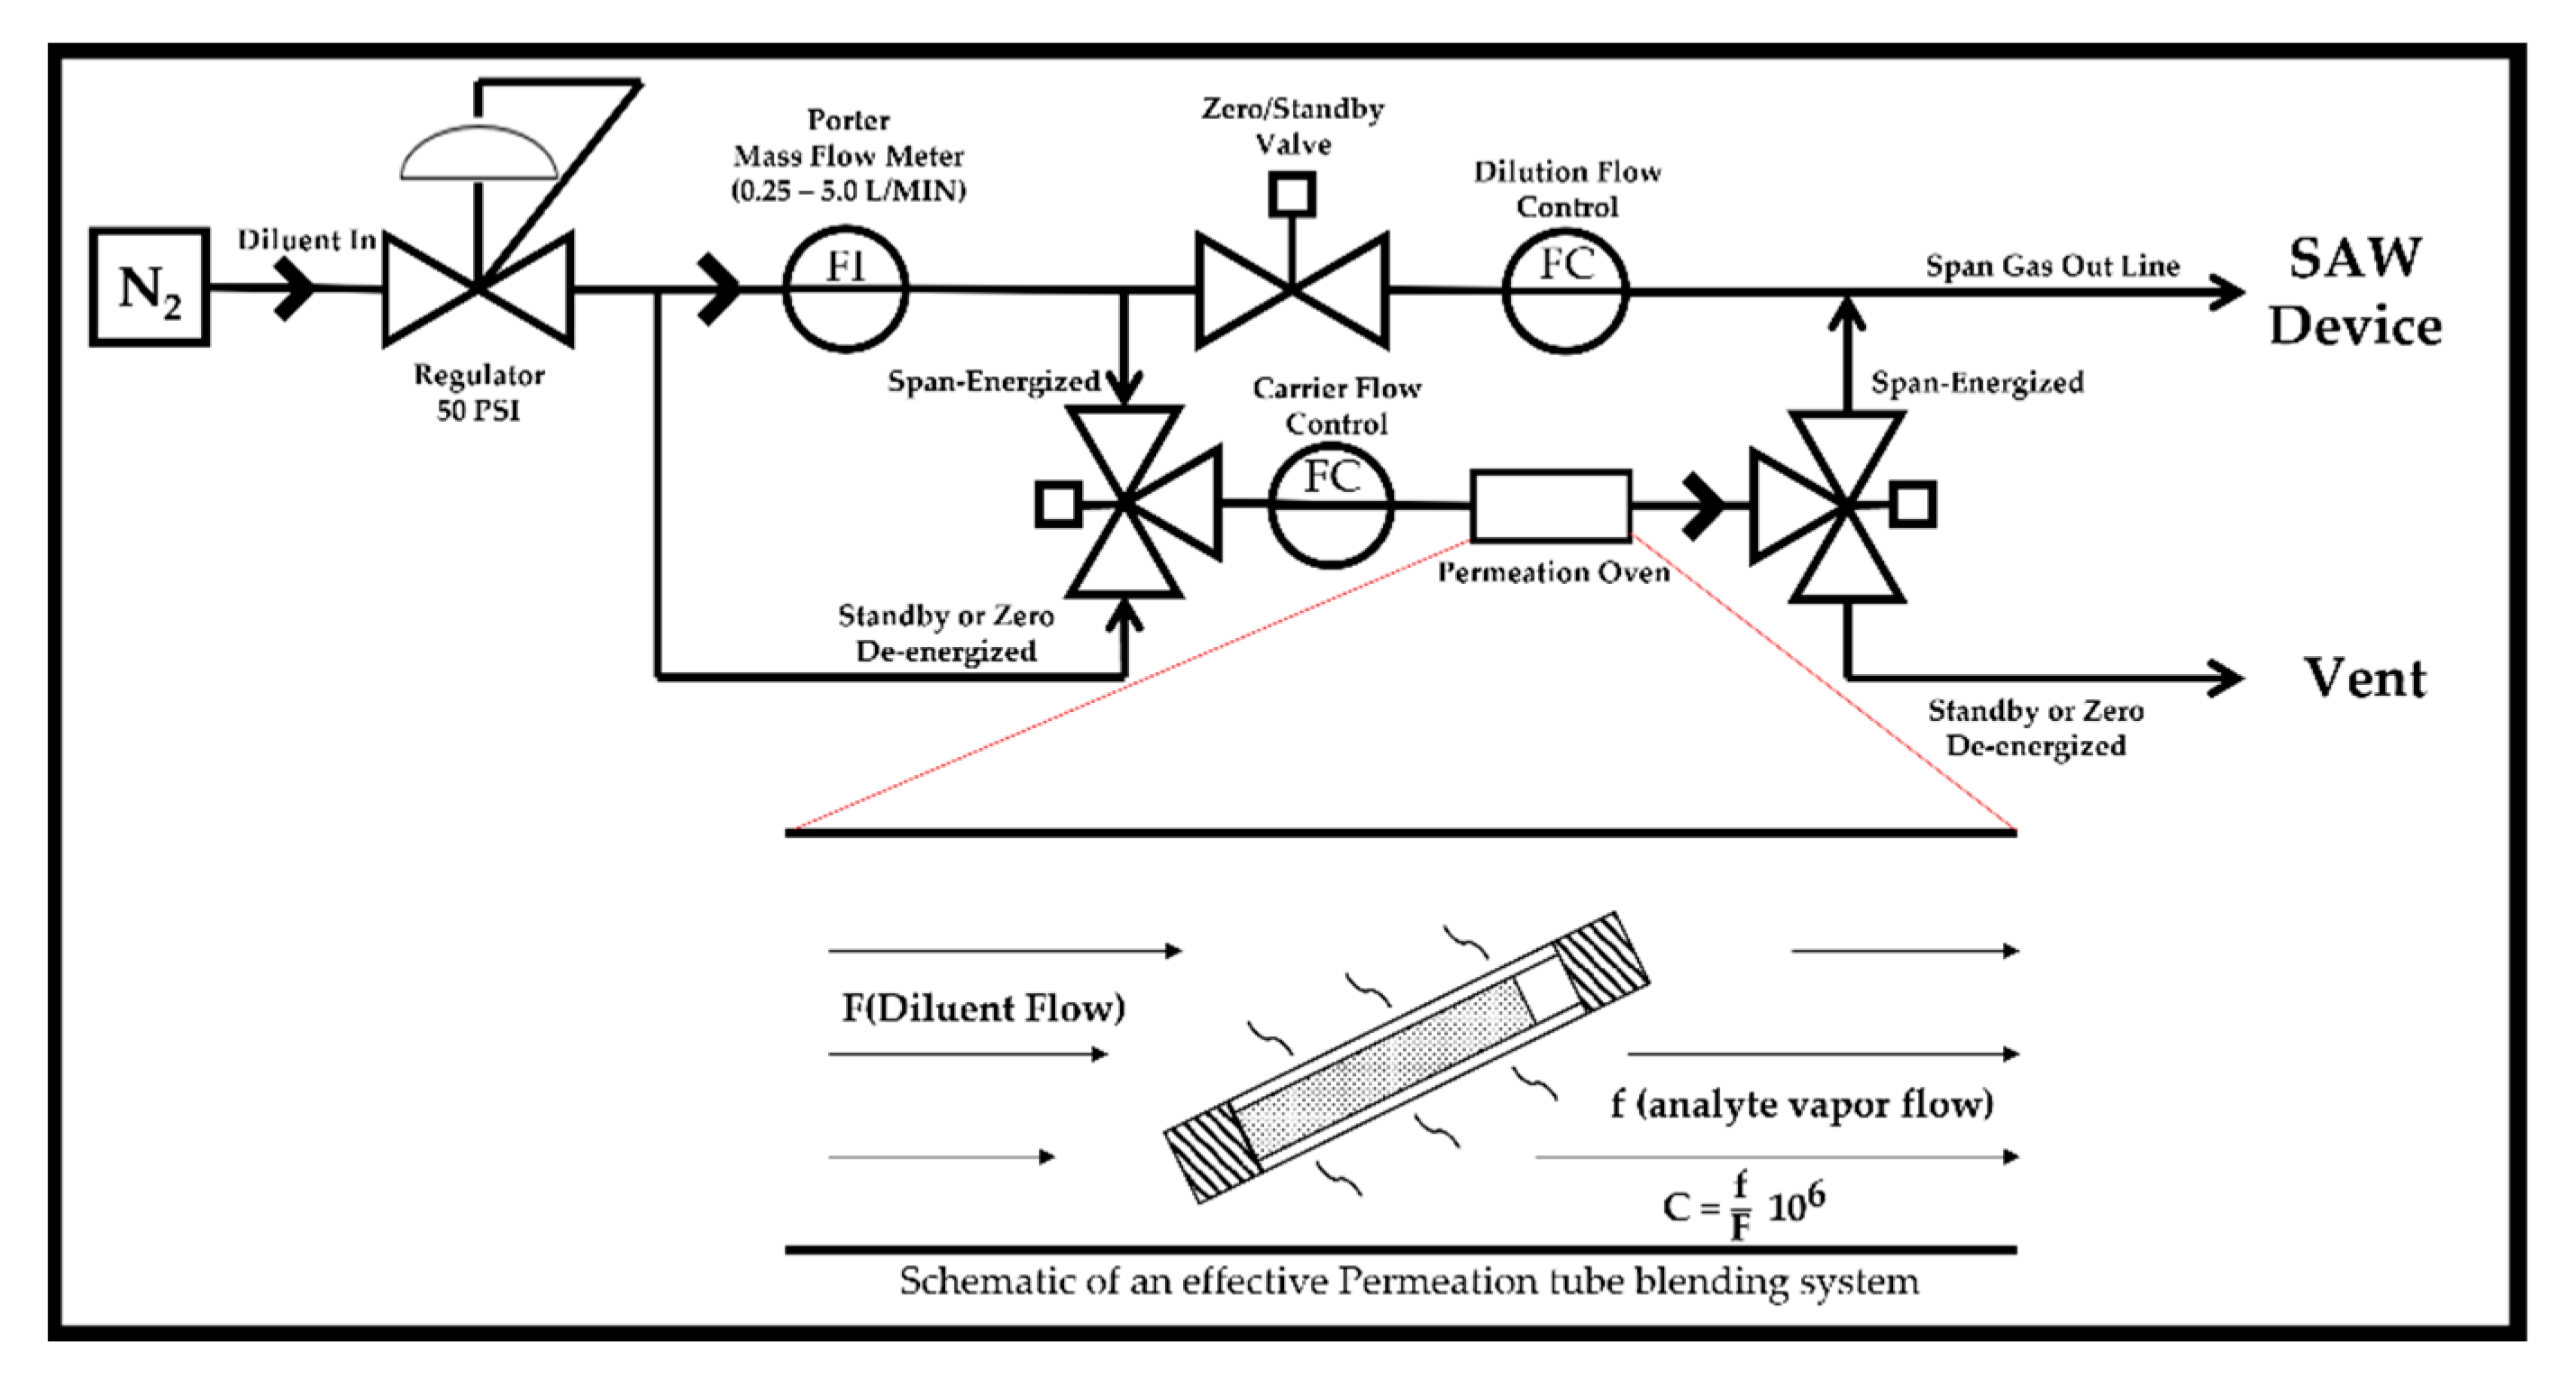
2.3. Experimental Setup

As a gas generator, a Base Module manufactured by FLEXSTREAM (KIN-TEK Analytical, Inc, La Marque, TX, USA) was used. The entire experimental setting and the actual image of the permeation tube used are attached to Figure S1. This equipment was a permeation tube system that can use both permeation and diffusion tubes, and this research was conducted an experiment using a permeation tube. The diffusion tube method makes uses of the phenomenon that a source of vapor at constant temperature and pressure contained at one end of a tube will flow by diffusion down the tube. The flow rate from a permeation tube is given by Equation (3):
E = 2.216   × 10 6 DMPA TL log P P - p
where E , D , M , P , A , T , L , and p are the emission rates of ng/min, diffusion coefficients at temperature T and pressure P, molecular weight, the total pressure of Thor, cross-sectional area of the diffusion path in centimeter square, the temperature in Kelvin, and length of the diffusion path, and the partial pressure of the analyte vapor at T in torr, respectively.
In Equation (3), the diffusion coefficient D is also a function of temperature and pressure as shown in Equation (4):
D = D 0 T T 0 m P 0 P
where D 0 , T 0 , P 0 are the diffusion coefficient at standard temperature and pressure, 273.1 K, 760 torr, respectively, and m is a constant, usually 2 but can be 1.75.
Equations (3) and (4) can be used to estimate the expected output from the diffusion tube, but a new equation is required to consider the error for the actual measurement. The radiation rate is determined by maintaining the diffusion tube under constant operating conditions and periodically measuring the weight of the analyte.
Equation (5) yields the concentration of a mixture prepared from a permeation tube
C i = E i K F
where C i , E i , F , and K are the concentration of analyte i in part-per-million, the emission rate of analyte i in ng/min, the dilution flow in mL/min, and the conversion factor to convert ng/min to nL/min at standard temperature and pressure, respectively [37]. The flow from the diffusion tube varies with temperature and pressure, requiring precise control of variables such as temperature, weight change of the diffusion tube, dilution gas flow rate, and pressure. The invasive tube requires analyte flow similar to the diffusion tube method [37]. In addition, Figure 6 is a schematic diagram of a gas generation system using a permutation tube.

3. Results

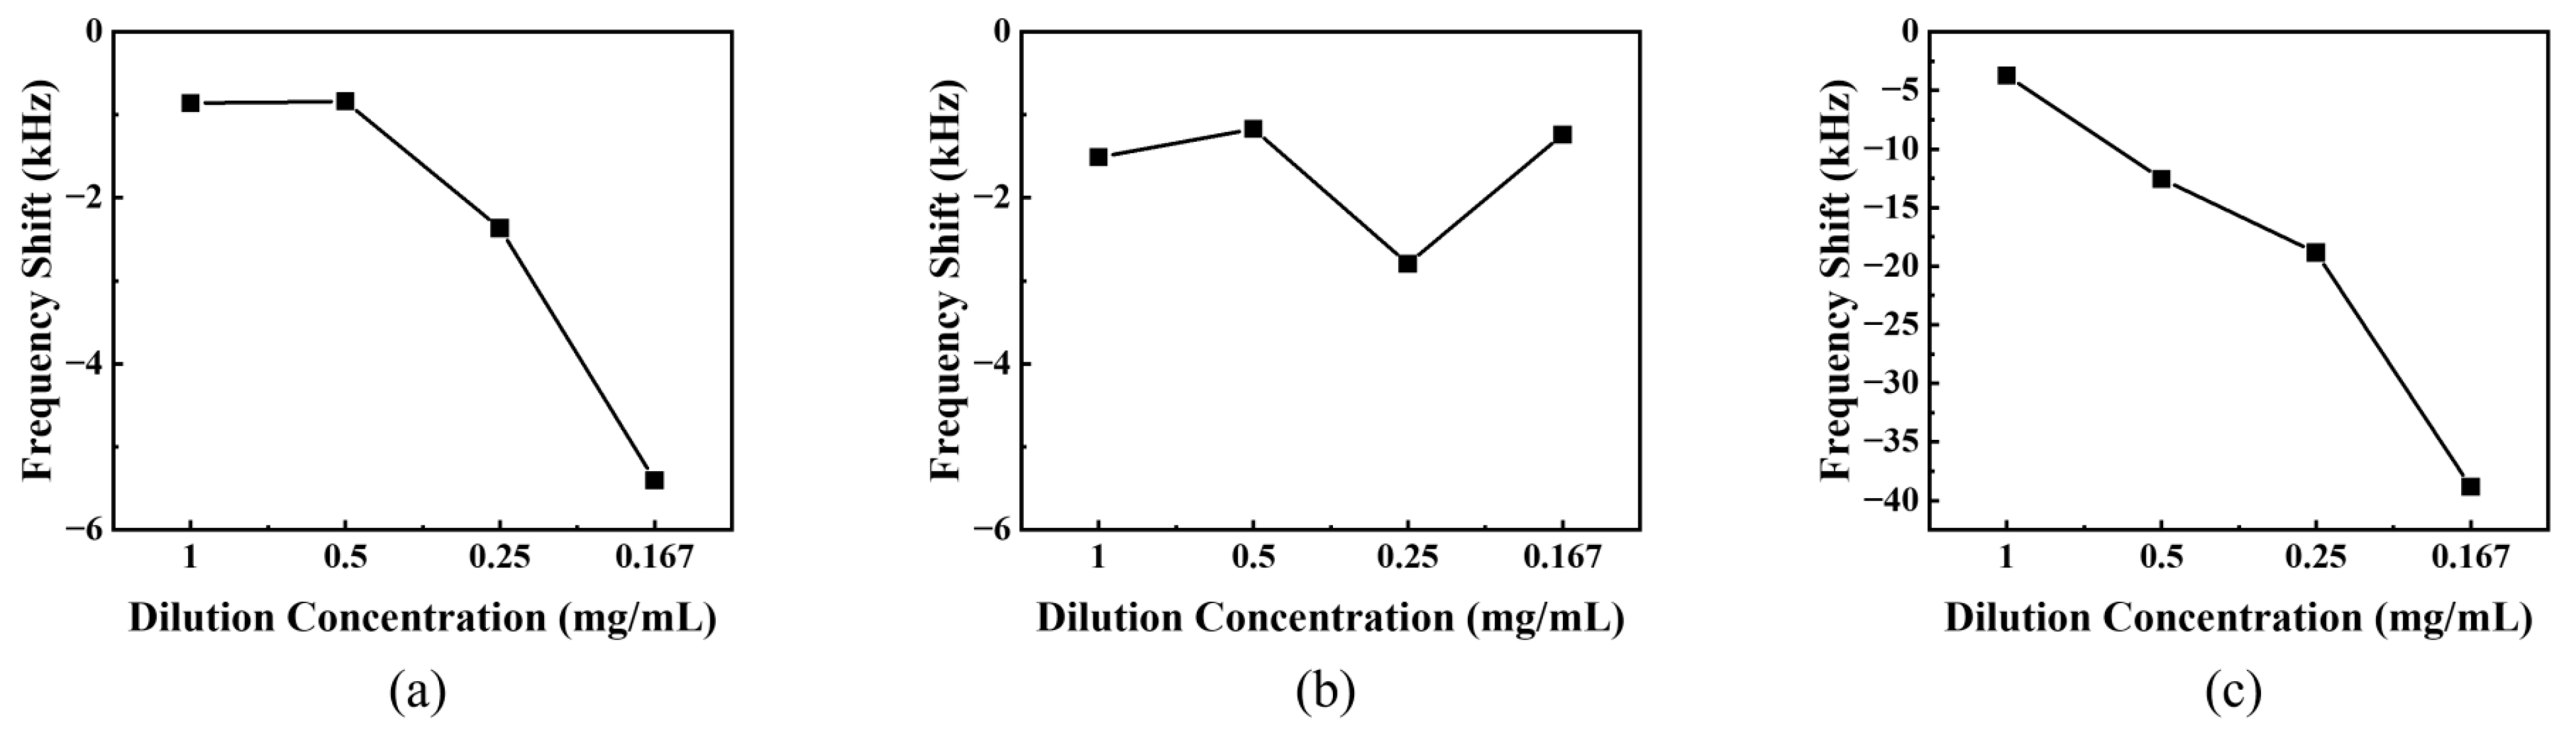
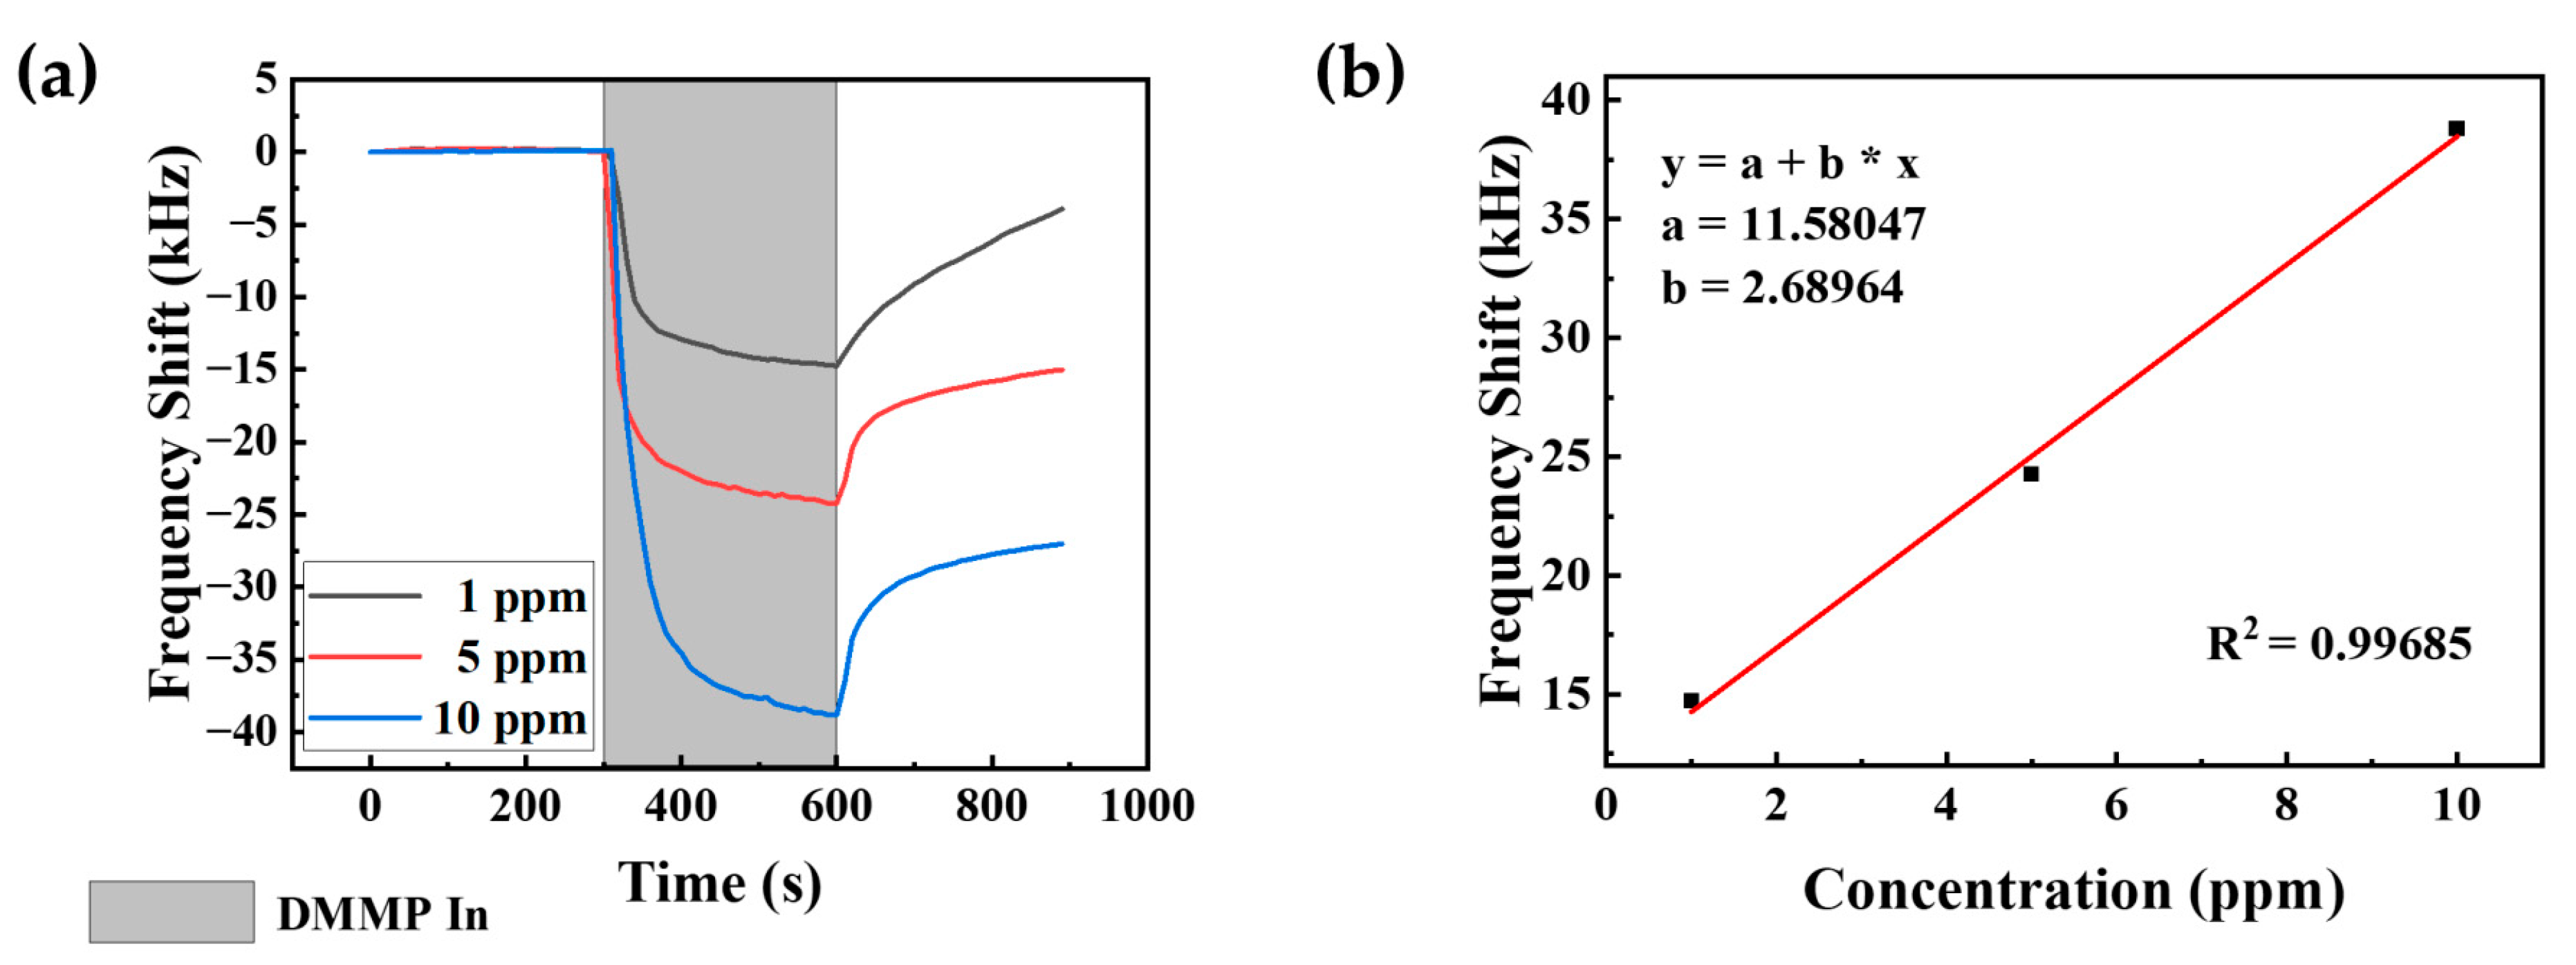
3.1. Sensitivity to DMMP Vapor Due to Coating Concentration

DMMP detection was determined by the difference in frequency shift between the non-coating sensor and the synthesized material-coated sensor before and after DMMP exposure [39,40]. The three different sensing materials were diluted to various concentrations and coated on the SAW sensor. Measurement was carried out after stabilization for 30 min through a nitrogen purge of 254 sccm before the experiment. After the measurement was started, nitrogen purge was performed for 5 min, and 10 ppm of DMMP exposure and nitrogen washing were repeated three times for 5 min, respectively. The reactivity graph over time is attached to Figure S2. Figure 7 shows the maximum frequency shift in the first cycle when exposed to DMMP by the sensing material and dilution concentration.
Figure 7a shows the DMMP detection experimental frequency shift of SAW sensors coated with PSS-TU1 of different concentrations. PSS-TU1 showed frequency response characteristics when exposed to DMMP gas. During dilution, the maximum frequency shift increases as the amount of DMF increases. Therefore, the maximum frequency shift was most reactive at about −6 kHz for 0.167 mg/mL, where the frequency shift was about 6-times higher than that of 1 mg/mL.
Figure 7b shows the DMMP detection experimental frequency shift of SAW sensors coated with PSS-TU2 of different dilution concentrations. PSS-TU2 showed frequency response characteristics when exposed to DMMP gas. In the case of PSS-TU2, the lower the dilution concentration, the higher the frequency shift, but the maximum frequency shift was shown at 0.25 mg/mL, and the maximum frequency shift was reduced at 0.167 mg/mL. Therefore, the optimal dilution concentration was 0.25 mg/mL, and the maximum frequency shift at this time was measured at approximately −3 kHz.
The PSS-TU3 in Figure 7c showed the largest frequency shift characteristics compared to the other two materials. In addition, the higher the amount of DMF in the solution, the greater the frequency shift of the SAW sensor. The maximum frequency shift depending on the dilution concentration is −3.78 kHz, −12.56, −18.84 and −38.83 kHz, respectively. Compared to other sensing materials, the maximum frequency shift of PSS-TU3 was the largest, and 0.167 mg/mL among the dilution concentrations of PSS-TU3 was measured as 2- to 15-times larger than the maximum frequency shift of other dilution concentrations. Therefore, for a dilution concentration of 0.167 mg/mL of PSS-TU3, the reactivity experiment with DMMP at 10 ppm showed the greatest frequency response.

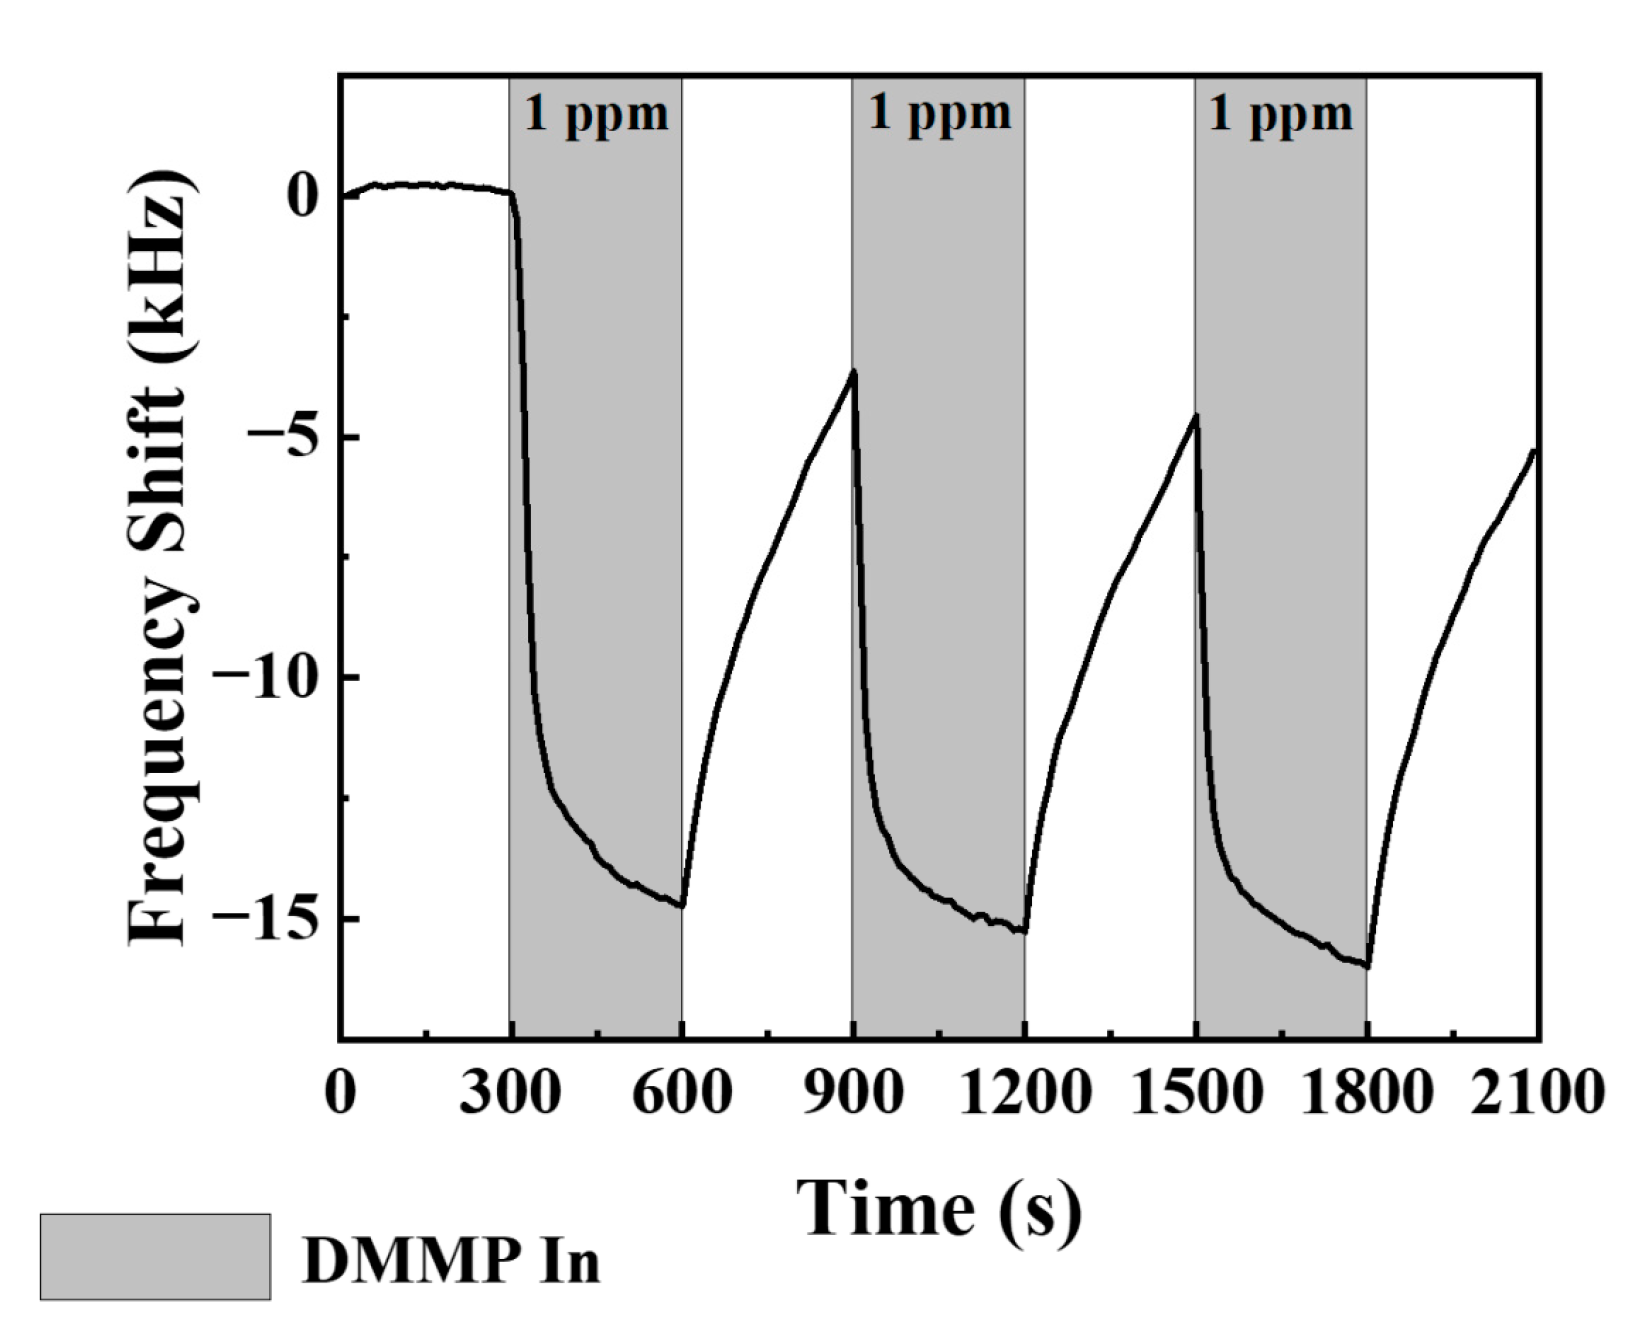
3.2. Sensitivity to Low Concentrations of DMMP Vapor

Through the above results, it was confirmed that the dilution concentration of PSS-TU3 of 0.167 mg/mL has high DMMP sensitivity and can be stably reused through recovery after the reaction. Therefore, a low-concentration DMMP detection experiment was performed using this material. In the same way as the experiment above, the reactivity of the synthesized material was evaluated by the difference in frequency shift between the non-coating sensor and the synthesized material-coated sensor before and after DMMP exposure, and the DMMP concentration was 1, 5 and 10 ppm. Figure 8a shows the low-concentration DMMP reaction test of a SAW sensor coated with a sensing material, and the response was excellent. Frequency shifts by reaction with DMMP were −14.725, −24.197, and −38.798 kHz at 1, 5, 10 ppm, respectively. In addition, the linearity graph according to the reaction of each concentration is shown in Figure 8b, and the linearity is 0.99685, indicating that the frequency shift is linearly proportional to the DMMP concentration. In addition, Figure 9 shows the frequency shift according to the repeatability experiments of DMMP concentration 1 ppm and a sensing material. At DMMP exposure, the maximum frequency shifts are about −14.725, −15.264, and −16.007 kHz, respectively, and after the reaction, about 75 to 80% of the recovery through nitrogen purging is recovered. Through this, it was confirmed that the SAW sensor coated with a sensing material can be reused in the reaction with DMMP.

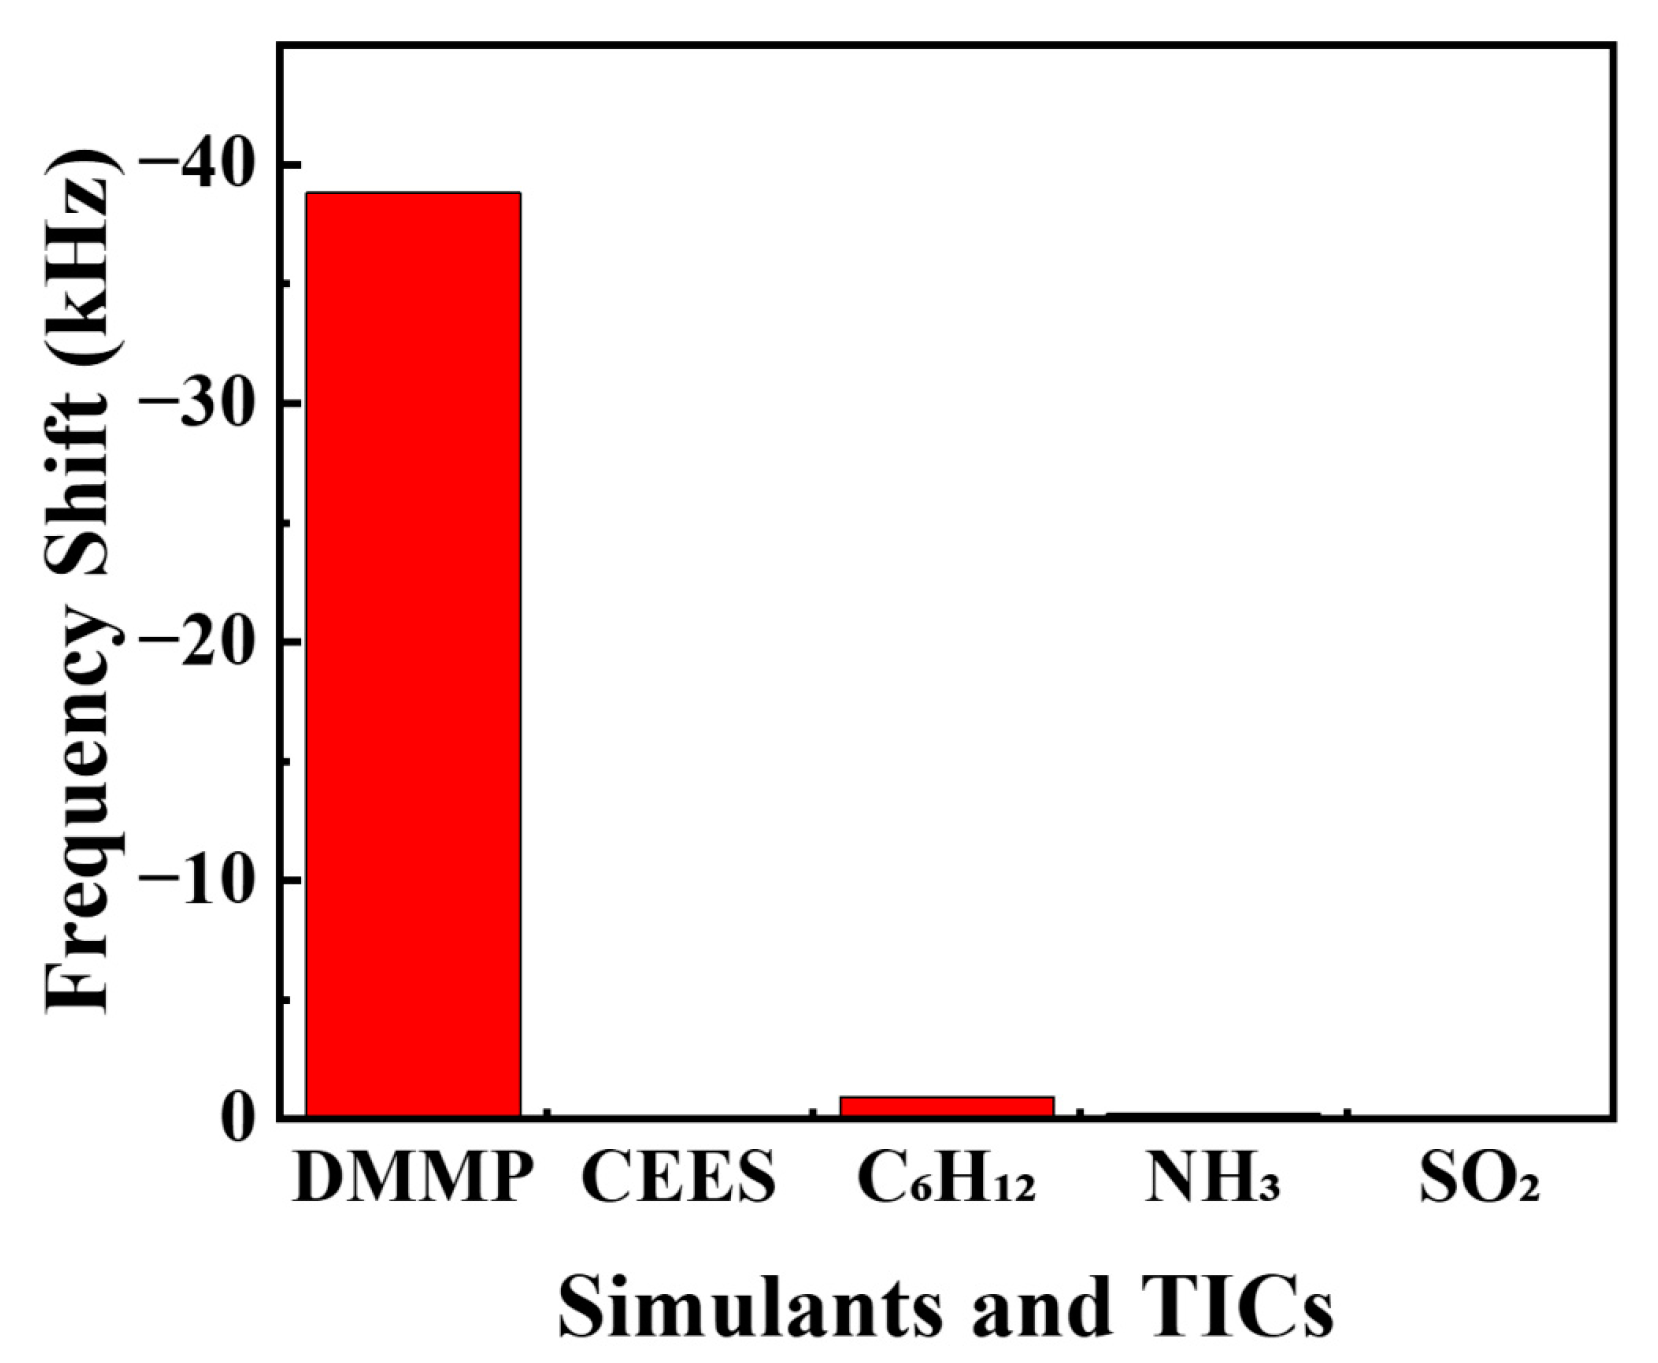
3.3. Response to Other CWAs Simulants and TICs

Figure 10 shows the results of reaction experiments of TIC and other CWA simulators in PSS-TU3. Experiments excluding DMMP were conducted at a fixed flow rate (2000 sccm), and all experiments were conducted through KIN-TEK equipment and permeation tubes, and the exposure concentration for each material was 100 ppm. The materials used in the experiment were C6H12 (cyclohexane), NH3 (ammonia), SO2 (sulfur dioxide), and NO2 (nitrogen dioxide), which are toxic chemicals (TICs) in the industry, and CEES, a blood agent simulant. The frequency shift graph over time is attached to Figure S3. As a result of the experiment, the frequency shift of the SAW sensor did not change because PSS-TU3 did not react with all substances except C6H12 and DMMP, and in the case of C6H12, the frequency shift of −0.933 kHz was shown when exposed. As a result, it was confirmed that DMMP and PSS-TU3 reacted at a lower concentration of 10 ppm and showed a larger frequency shift, so they reacted selectively with DMMP.

4. Conclusions

PSS-TUn (n = 1, 2, 3) with different functional groups was synthesized to detect DMMP, a simulant of the nerve agent sarin among CWAs. To compare the performance of the sensing material, the SAW sensor with a resonance frequency of 250 MHz was manufactured for various parameters such as an ST-Quartz substrate and an IDT configured with Al. The sensing material was coated on the SAW sensor and compared with the uncoated SAW sensor to evaluate the performance of the sensing material. To find highly sensitive substances among the sensing substances coated on the SAW sensor, a DMMP exposure experiment of 10 ppm was conducted at various dilution concentrations. As a result, when PSS-TU3 was 0.167 mg/mL, the reactivity was high. In the low-concentration DMMP detection experiment, experiments of 1, 5, and 10 ppm were conducted, and frequency shift linearly increased as the concentration of DMMP increased. Previously, DMMP detection experiments were conducted on POSS and TU-based sensing materials, and the maximum frequency shift at 12.5 ppm concentration was about −5 to −2 kHz; on the other hand, PSS-TU3 confirmed the maximum frequency shift characteristics of about −15 kHz at 1 ppm DMMP concentration [11]. Therefore, in the case of PSS-TU3, it was confirmed that higher DMMP reactivity and lower concentration DMMP detection were possible compared to existing POSS and TU. Future research aims to detect various toxic gases in real time by conducting selective reaction experiments through various CWA simulators and complete array boards.

Supplementary Materials

The following supporting information can be downloaded at: https://www.mdpi.com/article/10.3390/coatings13020348/s1, Figure S1: (a) Gas sensing system for SAW sensor and (b) permeation tubes used in the presented study; Figure S2: DMMP response from SAW sensors according to coating concentration of a sensing material: (a) PSS-TU1, (b) PSS-TU2, (c) PSS-TU3; Figure S3: PSS-TU3 response to different target materials from SAW sensors.

Author Contributions

Formal analysis, B.-G.B.; investigation, B.-G.B.; data curation, H.-S.C. and H.-C.J.; writing—original draft preparation, B.-G.B.; visualization, Y.-J.L. writing—review and editing, Y.-J.L.; project administration, J.-H.K.; funding acquisition, J.-H.K. All authors have read and agreed to the published version of the manuscript.

Funding

This research was supported by Korea Institute for Advancement of Technology (KIAT) grant funded by the Korea Government (MOTIE) (P0008458, HRD Program for Industrial Innovation), supported by the Basic Science Research Program through the National Research Foundation of Korea (NRF) funded by the Ministry of Education (No.2022R1A6A1A0305170511), and also supported by the Institute of Civil Military Technology Cooperation Center funded by the Defense Acquisition Program Administration and Ministry of Trade, Industry and Energy, the Korean government under grant No. 20-CM-BR-05.

Institutional Review Board Statement

Not applicable.

Informed Consent Statement

Not applicable.

Data Availability Statement

Not applicable.

Conflicts of Interest

The authors declare no conflict of interest.

References

  1. Salem, H.; Sidell, F.R. Nerve agents. In Encyclopedia of Toxicology, 2nd ed.; Wexler, P., Ed.; Elsevier: London, UK, 2005; pp. 201–206. [Google Scholar] [CrossRef]
  2. Sferopoulos, R. A Review of Chemical Warfare Agent (CWA) Detector Technologies and Commercial-off-the-Shelf Items; Defence Science and Technology Organisation: Canberra, Australia, 2009; pp. 155–219. Available online: https://apps.dtic.mil/sti/citations/ADA502856 (accessed on 3 May 2022).
  3. Chauhan, S.; D’cruz, R.; Faruqi, S.; Singh, K.K.; Varma, S.; Singh, M.; Karthik, V. Chemical warfare agents. Environ. Toxicol. Pharmacol. 2008, 26, 113–122. [Google Scholar] [CrossRef] [PubMed]
  4. Sidell, F.R.; Newmark, J.; McDonough, J.H. Chapter 5 Nerve agents. In Medical Aspects of Chemical Warfare; Office of The Surgeon General Department of the Army and US Army Medical Department Center and School: Falls Church, VA, USA, 1997; Volume 130, pp. 155–219. Available online: https://medcoe.army.mil/borden-tb-med-aspects-chem-warfare (accessed on 3 May 2022).
  5. Pacsial-Ong, E.J.; Aguilar, Z.P. Chemical warfare agent detection: A review of current trends and future perspective. Front. Biosci. -Sch. 2013, 5, 516–543. [Google Scholar] [CrossRef]
  6. McCafferty, R.R.; Lennarson, P.J. Common chemical agent threats. Neurosurg. Focus. 2002, 12, 1–4. [Google Scholar] [CrossRef]
  7. Satoh, T.; Kishi, S.; Nagashima, H.; Tachikawa, M.; Kanamori-Kataoka, M.; Nakagawa, T.; Kitagawa, N.; Tokita, K.; Yamamoto, S.; Seto, Y. Ion mobility spectrometric analysis of vaporous chemical warfare agents by the instrument with corona discharge ionization ammonia dopant ambient temperature operation. Anal. Chim. Acta 2015, 865, 39–52. [Google Scholar] [CrossRef] [PubMed]
  8. Puton, J.; Namieśnik, J. Ion mobility spectrometry: Current status and application for chemical warfare agents detection. TrAC-Trends Anal. Chem. 2016, 85, 10–20. [Google Scholar] [CrossRef]
  9. Smith, P.; Lepage, C.J.; Koch, D.; Wyatt, H.; Hook, G.; Betsinger, G.; Erickson, R.; Eckenrode, B. Detection of gas-phase chemical warfare agents using field-portable gas chromatography-mass spectrometry systems: Instrument and sampling strategy considerations Trends. Analyt. Chem. 2004, 23, 296–306. [Google Scholar] [CrossRef]
  10. Contreras, J.; Murray, J.; Tolley, S.; Oliphant, J.; Tolley, H.; Lammert, S.; Lee, E.; Later, D.; Lee, M. Hand-portable gas chromatograph-toroidal ion trap mass spectrometer (GC-TMS) for detection of hazardous compounds. J. Am. Soc. Mass Spectrom. 2008, 19, 1425–1434. [Google Scholar] [CrossRef]
  11. Logan, T.; Allen, E.; Way, M.; Swift, A.; Soni, S.D.; Koplovitz, I. A method for the analysis of tabun in multisol using gas chromatographic flame photometric detection. Toxicol. Mech. Methods 2006, 16, 359–363. [Google Scholar] [CrossRef]
  12. Seto, Y.; Kanamori-Kataoka, M.; Tsuge, K.; Ohsawa, I.; Maruko, H.; Sekiguchi, H.; Sano, Y.; Yamashiro, S.; Matsushita, K.; Sekiguchi, H. Development of an on-site detection method for chemical and biological warfare agents. Toxin Rev. 2007, 26, 299–312. [Google Scholar] [CrossRef]
  13. Kirschner, J. Surface Acoustic Wave Sensors (SAWS). Micromech. Syst. 2010, 6, 1–11. [Google Scholar]
  14. Bielecki, M.; Witkiewicz, Z.; Rogala, P. Sensors to Detect Sarin Simulant. Crit. Rev. Anal. Chem. 2021, 51, 299–311. [Google Scholar] [CrossRef]
  15. Yang, Z.; Peng, H.; Wang, W.; Liu, T. Crystallization behavior of poly(ε-caprolactone)/layered double hydroxide nanocomposites. J. Appl. Polym. Sci. 2010, 116, 2658–2667. [Google Scholar] [CrossRef]
  16. Higgins, B.; Simonson, D.; Houser, E.; Kohl, J.; Andrew Mcgill, R. Synthesis and characterization of a hyperbranched hydrogen bond acidic carbosilane sorbent polymer. J. Polym. Sci. Part A Polym. Chem. 2010, 48, 3000–3009. [Google Scholar] [CrossRef]
  17. Wang, Y.; Du, X.; Long, Y.; Tang, X.; Tai, H.; Jiang, Y. The response comparison of a hydrogen-bond acidic polymer to sarin, soman and dimethyl methyl phosphonate based on a surface acoustic wave sensor. Anal. Methods 2014, 6, 1951–1955. [Google Scholar] [CrossRef]
  18. Lee, Y.; Kim, J.; Kim, J.; Yun, J.; Jang, W. Detection of Dimethyl Methylphosphonate (DMMP) Using Polyhedral Oilgomeric Silsesquioxane (POSS). J. Nanosci. Nanotechnol. 2018, 18, 6565–6569. [Google Scholar] [CrossRef] [PubMed]
  19. Kim, J.; Park, H.; Kim, J.; Seo, B.; Kim, J. SAW Chemical Array Device Coated with Polymeric Sensing Materials for the Detection of Nerve Agents. Sensors 2020, 20, 7028. [Google Scholar] [CrossRef]
  20. Chung, Y.; Ha, S.; Woo, T.; Kim, Y.; Song, C.; Kim, S. Binding thiourea derivatives with dimethyl methylphosphonate for sensing nerve agents. RSC Adv. 2019, 9, 10693–10701. [Google Scholar] [CrossRef]
  21. Song, S.; Ha, S.; Cho, H.; Lee, M.; Jung, D.; Han, J.; Song, C. Single-walled carbon-nanotube-based chemocapacitive sensors with molecular receptors for selective detection of chemical warfare agents. ACS Appl. Nano Mater. 2018, 2, 109–117. [Google Scholar] [CrossRef]
  22. Drafts, B. Acoustic wave technology sensors. IEEE Trans. Microw. Theory Tech. 2001, 49, 795–802. [Google Scholar] [CrossRef]
  23. Devkota, J.; Ohodnicki, P.; Greve, D. SAW sensors for chemical vapors and gases. Sensors 2017, 17, 801. [Google Scholar] [CrossRef] [Green Version]
  24. Mujahid, A.; Dickert, F. Surface acoustic wave (SAW) for chemical sensing applications of recognition layers. Sensors 2017, 17, 2716. [Google Scholar] [CrossRef] [PubMed]
  25. Xiaofeng, X.; Xiaotao, Z.; Dongyi, A.; Jingxia, Y.; Jingxia, Y.; Xia, X.; Wanfeng, X.; Yongliang, T.; Sean, L.; Yongqing, F. NH3-Sensing Mechanism Using Surface Acoustic Wave Sensor with AlO(OH) Film. Nanomaterials 2019, 9, 1732. [Google Scholar] [CrossRef]
  26. Sheng, X.; Rui, Z.; Junpeng, C.; Tao, L.; Xiuli, S.; Meng, H.; Fu, Z.; Xiaoguang, H. Surface Acoustic Wave DMMP Gas Sensor with a Porous Graphene/PVDF Molecularly Imprinted Sensing Membrane. Micromachines 2021, 12, 552. [Google Scholar] [CrossRef]
  27. Bo, L.; Xiao, C.; Hualin, C.; Mohammad, M.A.; Xiangguang, T.; Luqi, T.; Yi, Y.; Tianling, R. Surface acoustic wave devices for sensor applications. J. Semicond. 2016, 37, 021001. [Google Scholar] [CrossRef]
  28. Go, D.; Atashbar, M.; Ramshani, Z.; Chang, H. Surface acoustic wave devices for chemical sensing and microfluidics: A review and perspective. Anal. Methods 2017, 9, 4112–4134. [Google Scholar] [CrossRef] [PubMed]
  29. Sayago, I.; Fernandez, M.; Fontecha, J.; Horrillo, M.; Terrado, E.; Seral-Ascaso, A.; Munoz, E. Carbon nanotube-based SAW sensors. In Proceedings of the 2013 Spanish Conference on Electron Devices, Valladolid, Spain, 12–14 February 2013; IEEE: New York, NY, USA, 2013; pp. 127–130. [Google Scholar] [CrossRef]
  30. Penza, M.; Antolini, F.; Vittori, M. Carbon nanotubes as SAW chemical sensors materials. Sens. Actuators B Chem. 2004, 100, 47–59. [Google Scholar] [CrossRef]
  31. Kumar, M.K.; Ramaprabhu, S. Nanostructured Pt functionlized multiwalled carbon nanotube-based hydrogen sensor. J. Phys. Chem. B 2006, 110, 11291–11298. [Google Scholar] [CrossRef] [PubMed]
  32. Joo, B.S.; Huh, J.S.; Lee, D.D. Fabrication of polymer SAW sensor array to classify chemical warfare agents. Sens. Actuators B Chem. 2007, 121, 47–53. [Google Scholar] [CrossRef]
  33. Hartmann-Thompson, C.; Hu, J.; Kaganove, S.; Keinath, S.; Keeley, D.; Dvornic, P. Hydrogen-bond acidic hyperbranched polymers for surface acoustic wave (SAW) sensors. Chem. Mater. 2004, 16, 5357–5364. [Google Scholar] [CrossRef]
  34. Le, X.; Liu, Y.; Peng, L.; Peng, J.; Xu, Z.; Gao, C.; Xie, J. Surface acoustic wave humidity sensors based on uniform and thickness controllable graphene oxide thin films formed by surface tension. Microsyst. Nanoeng. 2019, 5, 36. [Google Scholar] [CrossRef]
  35. Lama, S.; Kim, J.; Ramesh, S.; Lee, Y.; Kim, J.; Kim, J. Highly Sensitive Hybrid Nanostructures for Dimethyl Methyl Phosphonate Detection. Micromachines 2021, 12, 648. [Google Scholar] [CrossRef] [PubMed]
  36. Connelly, N.G.; William, E.G. Chemical redox agents for organometallic chemistry. Chem. Rev. 1996, 96, 877–910. [Google Scholar] [CrossRef] [PubMed]
  37. McKinley, J.; Majors, R. The preparation of calibration standards for volatile organic compounds—A question of traceability. Lc Gc N. Am. 2000, 18, 1024–1033. [Google Scholar]
  38. McKinley, J. Permeation Tubes: A Simple Path to very Complex Gas Mixtures. Available online: https://kin-tek.com/wp-content/uploads/2015/12/Gases-Instruments-Jan-2008.pdf (accessed on 3 May 2022).
  39. Matatagui, D.; Martí, J.; Fernández, M.; Fontecha, J.; Gutiérrez, J.; Gràcia, I.; Cané, C.; Horrillo, M. Chemical warfare agents simulants detection with an optimized SAW sensor array. Sens. Actuators B Chem. 2011, 154, 199–205. [Google Scholar] [CrossRef]
  40. Kim, J.; Kim, E.; Kim, J.; Kim, J.-H.; Ha, S.; Song, C.; Jang, W.J.; Yun, J. Four-Channel Monitoring System with Surface Acoustic Wave Sensors for Detection of Chemical Warfare Agents. J. Nanosci. Nanotechnol. 2020, 20, 7151–7157. [Google Scholar] [CrossRef]
Figure 1. Surface acoustic wave chemical sensor.
Coatings 13 00348 g001
Figure 2. SAW sensor design and parameters.
Coatings 13 00348 g002
Figure 3. Schematic illustration of the synthesis process and each structure: (a) PSS-(NH2)8, (b) PSS-(NH3Cl)8, (c) PSS-TUn (n = 1, 2, 3).
Coatings 13 00348 g003
Figure 4. Synthesized material: (a) PSS-TU1, (b) PSS-TU2, (c) PSS-TU3.
Coatings 13 00348 g004
Figure 5. The solution manufacturing process and drop casting process.
Coatings 13 00348 g005
Figure 6. Gas feeding system: Base Module Flow Diagram for the permeation tube and schematic of and effective permeation tube blending system from KIN-TEK [37,38].
Coatings 13 00348 g006
Figure 7. Maximum frequency shift according to DMMP response from SAW sensor according to coating concentration of sensing material: (a) PSS-TU1, (b) PSS-TU2, (c) PSS-TU3.
Coatings 13 00348 g007
Figure 8. DMMP response from SAW sensors with PSS-TU3. (a) DMMP experiments at various concentrations. (b) Linearity according to DMMP reaction of various concentrations.
Coatings 13 00348 g008
Figure 9. The repeatability of the SAW sensor at a DMMP concentration of 1 ppm.
Coatings 13 00348 g009
Figure 10. Selectivity for CWAs simulants and TICs of PSS-TU3.
Coatings 13 00348 g010
Table 1. CWAs classification.
CWAsExamples
Nerve agentsSarin (GB), Soman (GD), Tabun (GA)
Blister agentsMustard gas, Nitrogen mustard
Blood agentsArsine, Cyanogen chloride, Hydrogen cyanide
Choking agentsChlorine, Hydrogen chloride, Phosgene
Disclaimer/Publisher’s Note: The statements, opinions and data contained in all publications are solely those of the individual author(s) and contributor(s) and not of MDPI and/or the editor(s). MDPI and/or the editor(s) disclaim responsibility for any injury to people or property resulting from any ideas, methods, instructions or products referred to in the content.

