Abstract
The degradation process and the electrochemical behavior of two anti-corrosion and anti-fouling coating systems (FW-1 and FW-2) in a simulated diurnal cycling immersion environment (3.5% NaCl, 35 °C 12 h + 25 °C 12 h) were investigated by electrochemical impedance spectroscopy (EIS) technology. Combined with the coating gloss, color difference, adhesion strength and scanning electron microscopy (SEM) tests, the micro morphologies and the variations of the performance parameters were comparatively analyzed. The results showed that in the 160 days of immersion, with the hydrolysis of the FW-1 topcoat resin and some pigments dissolved and released, the surface micro-morphology of the coating changes from rough to smooth, thereby increasing the gloss. While, for the FW-2 topcoat, the occurrence of micro pores and tiny cracks results in an increase in the roughness and a decrease in the gloss. The release of the copper ion particles in the antifouling topcoat has an influence on the color, manifesting as obvious rise in the color difference of the coating. The low-frequency impedance (|Z|0.01 Hz) values of both coating samples decreases slowly, presenting a very good shielding to the carbon steel substrate. The self-polishing of the topcoat has no big effect on the electrochemical performance of the whole anti-corrosion and anti-fouling coating system; the protective performance of the coating system mainly depends on the integrity of the primer and the intermediate paint.
1. Introduction
Marine biofouling is a major issue, which can deteriorate the service performance of marine ships and infrastructures. Adherence and accumulation of marine organisms on the surfaces of the ships may cause severe detrimental effects, such as significantly increasing fuel consumption, accelerating corrosion, maintenance frequency and cost [1,2,3]. Therefore, it is very important to apply long-term antifouling coatings to protect marine ships against biofouling. Currently, for the antifouling coatings, there are three main types according to the mechanism of action, which are self-polishing antifouling coatings, low surface energy antifouling coatings and biomimetic antifouling coatings. Among them, self-polishing antifouling coatings have been most widely used in combating biofouling on ships [2,4].
Self-polishing antifouling coatings are generally composed of film-forming binders, pigments, fillers and active molecules called biocides, in which some binder components undergo hydrolysis in sea water, and the water-soluble pigments are dissolved and released along with the binder components into sea water. The continuous hydrolysis and removal of the polymeric matrix and the subsequent exposure of a fresh surface is termed the self-polishing effect, which can prevent the attachment of marine organisms to the coating surface and contribute to sustainable antifouling agents released to maintain long-term antifouling [5,6]. The tributyltin (TBT)-based self-polishing antifouling coatings, which were widely used since early 1980s, have been banned due to the high toxicity [1,2,3,4,5]. At present, the most commonly used self-polishing coatings are acrylic resin-based products. The acrylic resins include zinc acrylate, copper acrylate and silyl acrylate [5]. The addition of antifouling agents to self-polishing anti-fouling coating formulations can achieve better antifouling effects. Currently, cuprous oxide (Cu2O) is one of the main antifouling agents applied in tin-free self-polishing antifouling coatings [6,7]. Once the coating is immersed into seawater, the soluble Cu2O molecules are quickly oxidized to produce more stable divalent copper ions (Cu2+), which will be accumulated in organisms and possess bactericidal effects [5,6].
Electrochemical impedance spectroscopy (EIS) is a widely accepted non-destructive technique for studying the deterioration process of organic coatings and their protective effect on metallic substrates [8,9,10]. In the previous applications of the EIS technique, most have been focused on the study of anti-corrosion coatings; very few were involved in the failure of anti-fouling coatings. Cao et al. [11] applied the EIS method to comparatively study the protective effect of three antifouling coating systems on 5083 Al alloy in 3.5% NaCl solution. Thomas et al. [12] studied the electrochemical behavior of PANi/polyurethane antifouling coating in salt water using the EIS method and analyzed the effect of conductive polyaniline on the impedance. Peres et al. [13,14] studied the antifouling performance of two anti-fouling coatings formulated with papain and ferric tannate pigments, respectively, and studied the water uptake behavior of the coatings by the EIS method. Zhu et al. [15] investigated the antifouling property of a series of fluorinated/silanized polyacrylate polymers which they prepared and evaluated the anti-corrosion performance of the coatings by using low frequency impedance in the EIS measurement. Kharchenko et al. [16] investigated the anti-fouling and anti-corrosion properties of rosin-based coatings containing butanol extracts, and the EIS results showed that the incorporation of butanol extract in rosin-based coatings improved the barrier property of the coating by reducing its water uptake.
In practical application, the antifouling coating is often used as a topcoat brushed on an anti-corrosion primer. The service life of the anti-fouling and anti-corrosion coating system depends on two aspects: one is whether the topcoat has an antifouling effect; the other one is whether the entire coating system provides protective property to the substrate. Currently, much research was focused on the development of antifouling coatings and the evaluation of their antifouling effect [3,6], or the modification of antifouling coatings and the integration study of antifouling and anticorrosion property [12,17,18,19,20]. The action mechanism of the self-polishing anti-fouling coating is the slow dissolution of the outermost layer of the coating due to the hydrolysis reaction; however, as a topcoat, the antifouling coating should also possess a good barrier effect in addition to its antifouling performance [15]. Unfortunately, there are few studies which have reported on the variation in the protective effect of anti-corrosion and anti-fouling coating systems on metal substrates during service and the relationship between the variation and the antifouling effect.
In this study, two anti-corrosion and anti-fouling coating systems were prepared and a simulated diurnal cycling immersion test (3.5% NaCl solution, 35 °C 12 h + 25 °C 12 h) was used to imitate the situation of high temperature in daytime and low temperature at night in southern China. The degradation process and the electrochemical parameters were comparatively studied by means of the EIS technique. Combined with gloss test, color difference test and scanning electron microscope observation, the microscopic morphological characteristics and the variation of the detecting parameters of the two coating systems during the dissolution and failure process of the topcoats were investigated. The relationship between the protective property of the whole coating systems and the failure of topcoats was also discussed.
2. Experimental Procedure
2.1. Materials and Samples Preparation
The substrate was Q235 carbon steel with the dimension of 150 mm × 75 mm × 2.5 mm. The applied coatings included two kinds of anti-corrosion and anti-fouling coating systems, which were FW-1 and FW-2, respectively. The FW-1 coating system was produced by Jordan Paint (Zhangjiagang) Co., Ltd. (Zhangjiagang, China), and the FW-2 coating system was produced by Xiamen Institute of Materials (Xiamen, China); both were composed of primer, intermediate paint and self-polishing anti-fouling topcoat. Table 1 shows the information of the two coating systems. The Cu2O antifouling agent content in the FW-1 topcoat is close to 50% and it is about 38% in the FW-2 topcoat.

Table 1.
Coating systems prepared and the film thickness.
The surface of the steel substrate was first sanded with 320# dry sandpaper then cleaned with filter paper and acetone and finally dried in the air before the coating system was applied. The primer, intermediate paint and topcoat were brushed on the substrate manually with an interval of 24 h. The dry film thickness of each coating layer was measured with a MINTEST6006 thickness meter (Time Instruments Co., Shanghai, China). The total thickness of the coating system was 600 ± 20 μm.
2.2. Corrosion Tests
The coated steel samples were subjected to 3.5 wt% NaCl solution under an alternating hot and cold temperature conditions (35 °C 12 h + 25 °C 12 h), which was used to simulate diurnal cycling immersion environment in southern China. The solution temperature was controlled using a water bath, first at 35 °C for 12 h and then decreasing to 25 °C for 12 h. The solution was replaced every 48 h.
2.3. Measurements and Characterization
2.3.1. Electrochemical Impedance Spectroscopy Test
The electrochemical impedance spectroscopy (EIS) tests were carried out on the coated samples periodically using a PARSTAT 2273 electrochemical impedance workstation (Princeton, NJ, USA). A conventional three-electrode setup was used, consisting of a saturated calomel reference electrode (SCE), a platinum electrode as the counter electrode and a coated sample as the working electrode. EIS measurements were performed at a frequency range of 105 to 10−2 Hz with 10 mV sinusoidal voltage perturbation applied with respect to open circuit potential. The test medium was 3.5 wt% NaCl solution at room temperature. The EIS data was fitted using the ZSimpwin software (V 3.50).
2.3.2. Gloss and Color Change Tests
The gloss and color change of the coatings were tested by a NHG268 three-angle gloss meter and a NR200 high quality portable computerized colorimeter, respectively, which are both produced by Shenzhen 3nh Technology Co., Ltd., Shenzhen, China. The gloss test and the color change test were performed according to GB/T 9754−2007 [21] and GB/T 11186.2−1989 [22], respectively. Three points were randomly selected on the coating surface and then an average value was taken and recorded. The color difference () was calculated by Equation (1) according to the GB/T 11186.3−1989 [23] standard, where ΔL* is the difference in lightness or darkness, Δa* is the difference between red and green and Δb* is the difference between yellow and blue.
2.3.3. Copper Ions Release Test in Antifouling Coating
According to GB/T6824-2008 [24] (Determination of copper ion exudation rate of ship bottom antifouling paint), an inductively coupled plasma mass spectrometer (ICP-MS, Agilent Technologies 7700 series, Palo Alto, CA, USA) was used to quantitatively detect the copper ions contents in the 3.5% NaCl solution (35 °C 12 h + 25 °C 12 h) in which the coated samples were immersed for a period of time. The release rate of copper ions (R, μg/(cm2·d)) from the antifouling coating was calculated according to Equation (2), where ρ is the cumulative concentration of copper ions in the solution (ug/L); V is solution volume (L), t is the test time (h) and A the test area of the coating.
2.3.4. Adhesion Test
The adhesion strength of the coatings was measured by a PosiTest AT-M pull-off adhesion tester (DeFelsko Corporation, Ogdensburg, NY, USA) according to the GB/T5210-2006 [25] standard. The remaining water on the surface of coating was removed softly before the application of an adhesive (Ergo1690 two-component structural adhesive, Wetzikon, Switzerland) which bonded the coating and the test dolly. The diameter of the dolly was 20 mm. The pull rate was at 0.2 Mpa/S and the value of each sample was calculated by averaging six data points.
2.3.5. Scanning Electron Microscope Observation and Energy Spectra Analysis
The microscopic surface morphology of the coating and cross-sectional morphology of the coated sample were observed by a Quanta 650 scanning electron microscope (FEI, Hillsboro, OR, USA). The composition of the coating was analyzed by an energy spectrometer (AZtec X-max 80, Oxford Instrument, Oxford, UK).
3. Results and Discussion
3.1. EIS Results and Macroscopic Surface Morphology of Two Coating Systems
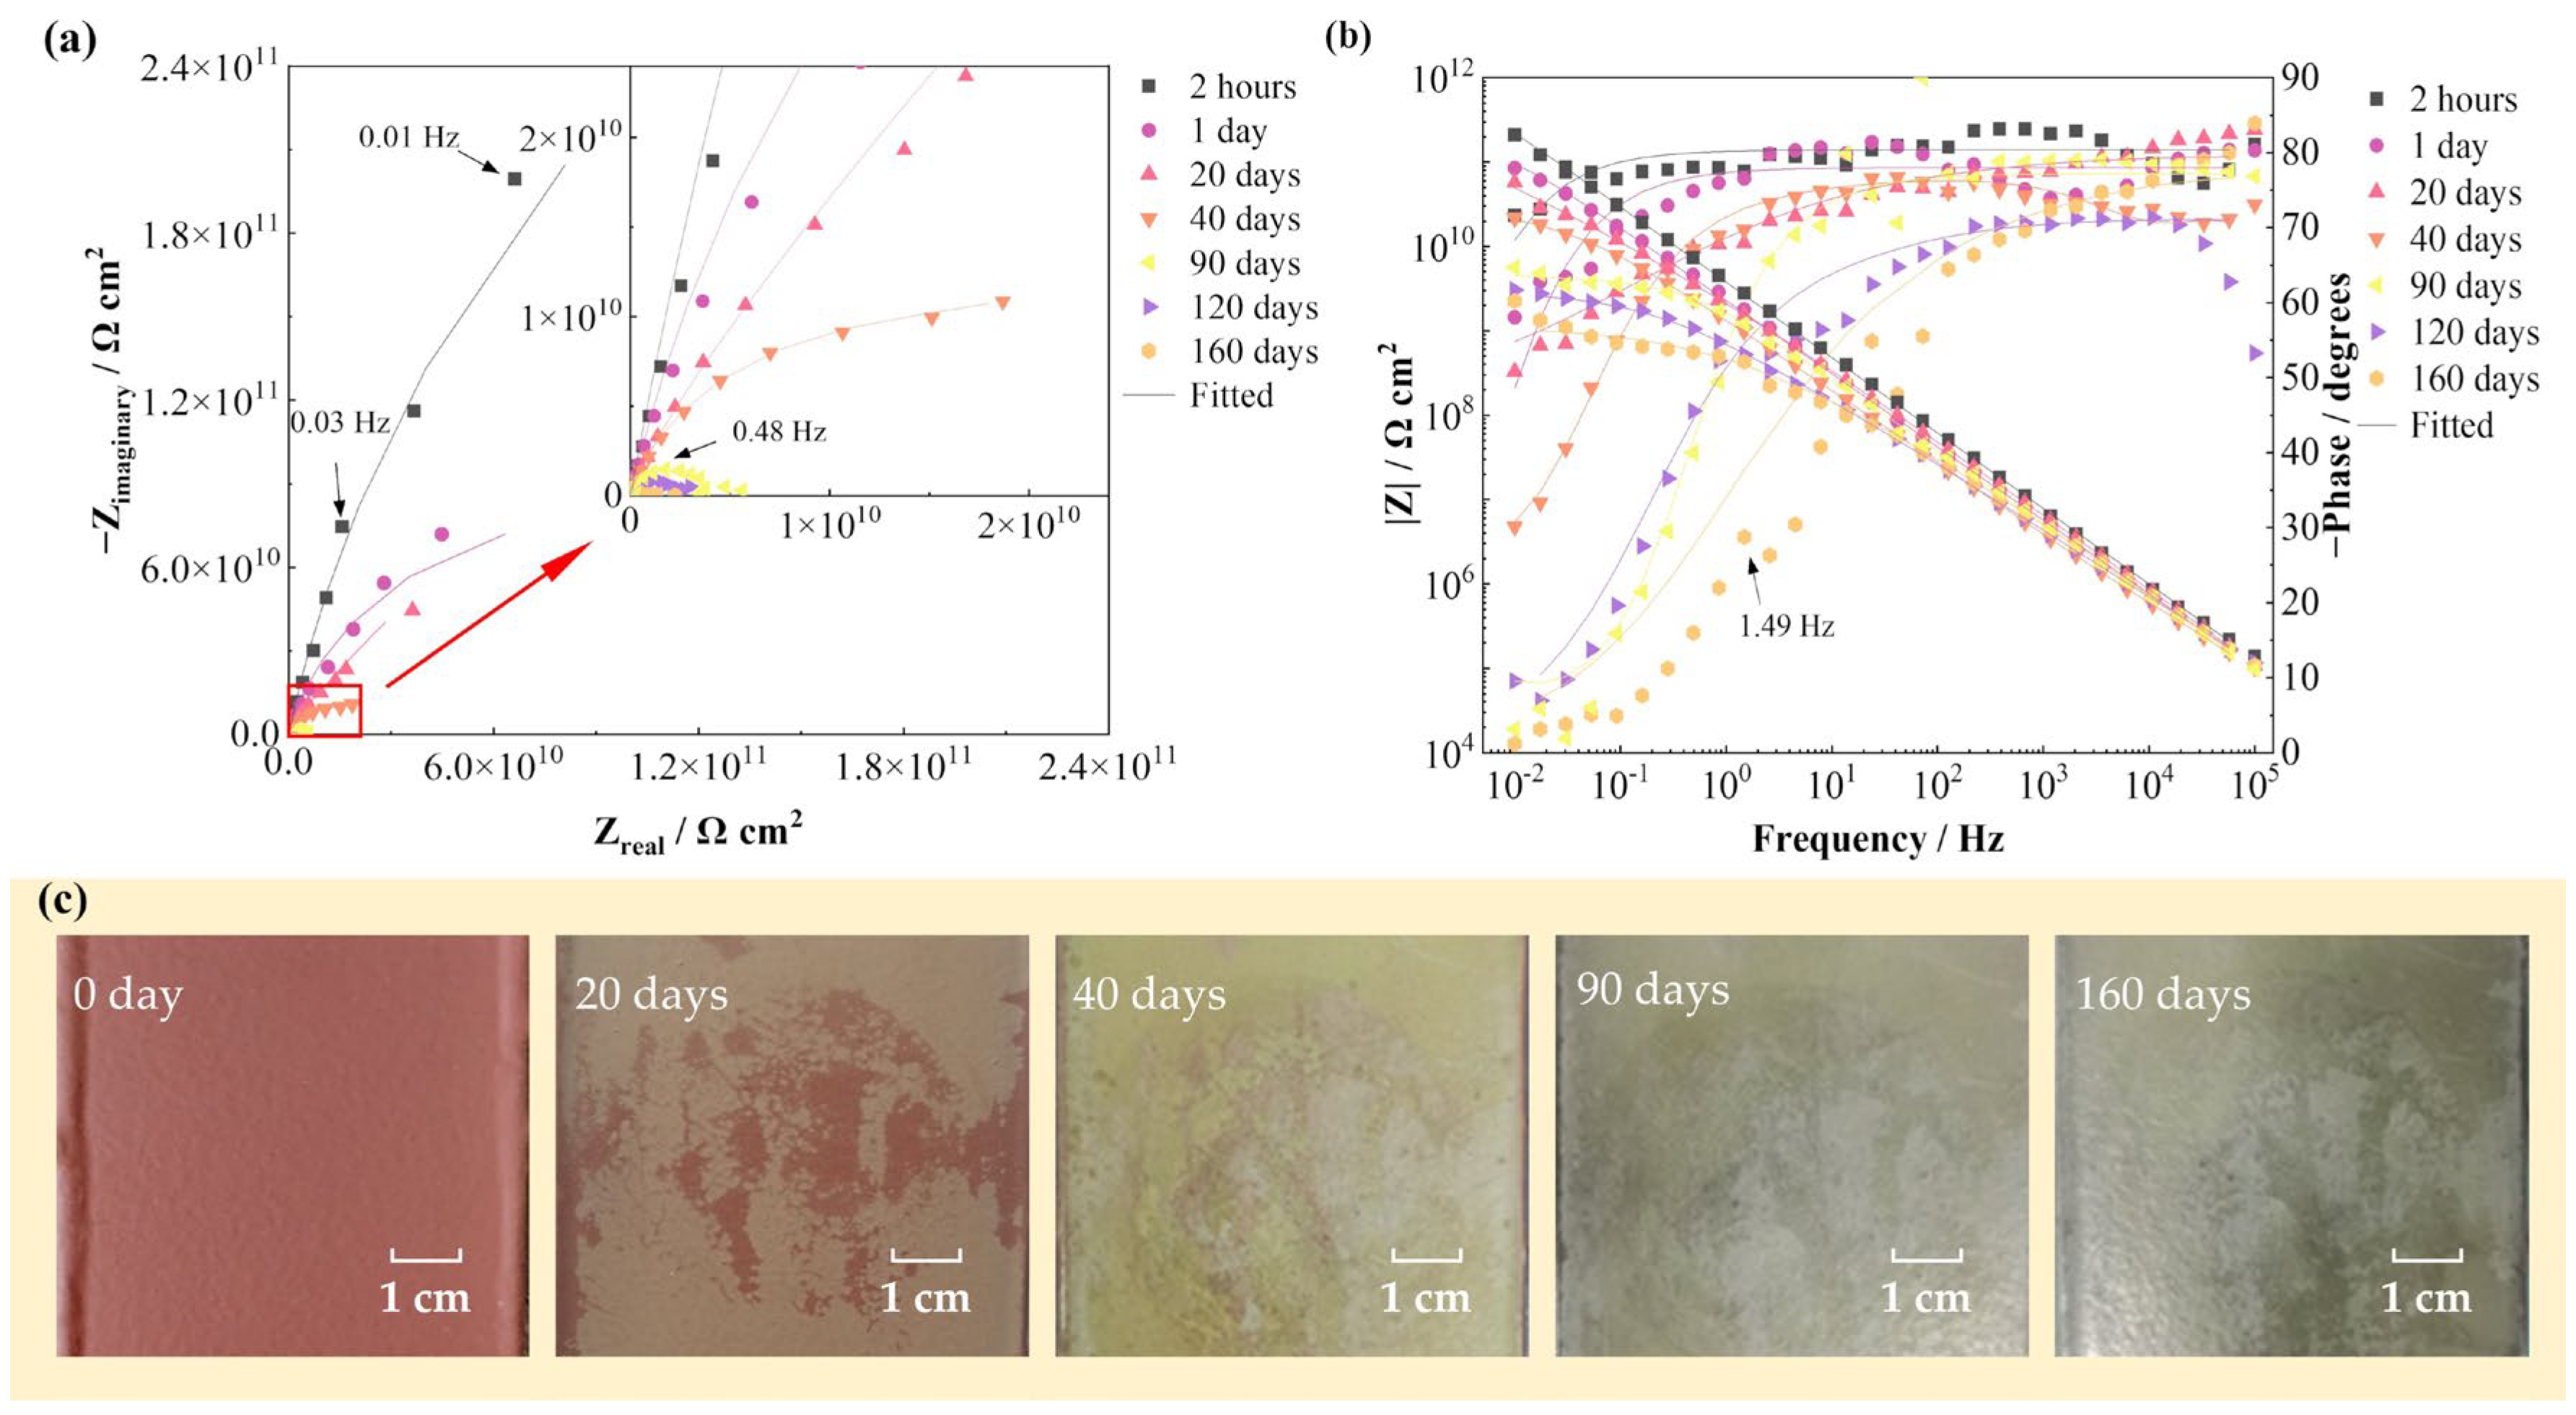
Figure 1 shows the EIS spectra and surface photographs of the FW-1 coating sample in 160 days immersion under alternating hot and cold temperature condition. Figure 1a,b present that at the beginning of the test (2 h), the Nyquist plot presents a capacitive arc with a large radius, and the variation of the impedance modulus (|Z|) with frequency in the Bode plot shows a straight line with a slope of −1. These indicate that the coating system has very good barrier performance and provides excellent protection to the steel substrate. As the solution continuously diffuses into the coating, the capacitive arc radius decreases gradually and also the low frequency impedance modulus (|Z|0.01 Hz). At 160 days, the |Z|0.01 Hz decreases from the initial value of 2 × 10¹¹ Ω cm2 to 2 × 10⁹ Ω cm2, still demonstrating a good barrier performance [6,26]. In Figure 1c, it can be seen that before immersion, the coating shows a bright red color. As the test progressed, the color becomes lighter and gradually turns to yellow and green; until 160 days of immersion, the surface of the coating is still intact with no blisters or rusting spots visible to the naked eye.
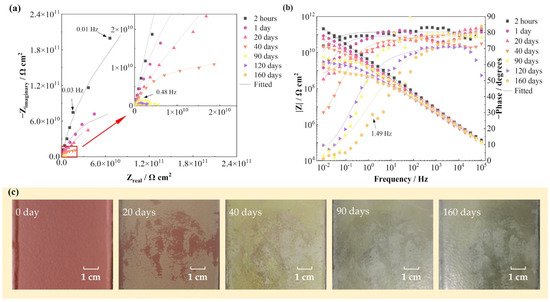
Figure 1.
EIS spectra and surface photographs of the FW-1 coating sample in 160 days immersion test: (a) Nyquist plot; (b) Bode plot; (c) digital photos.
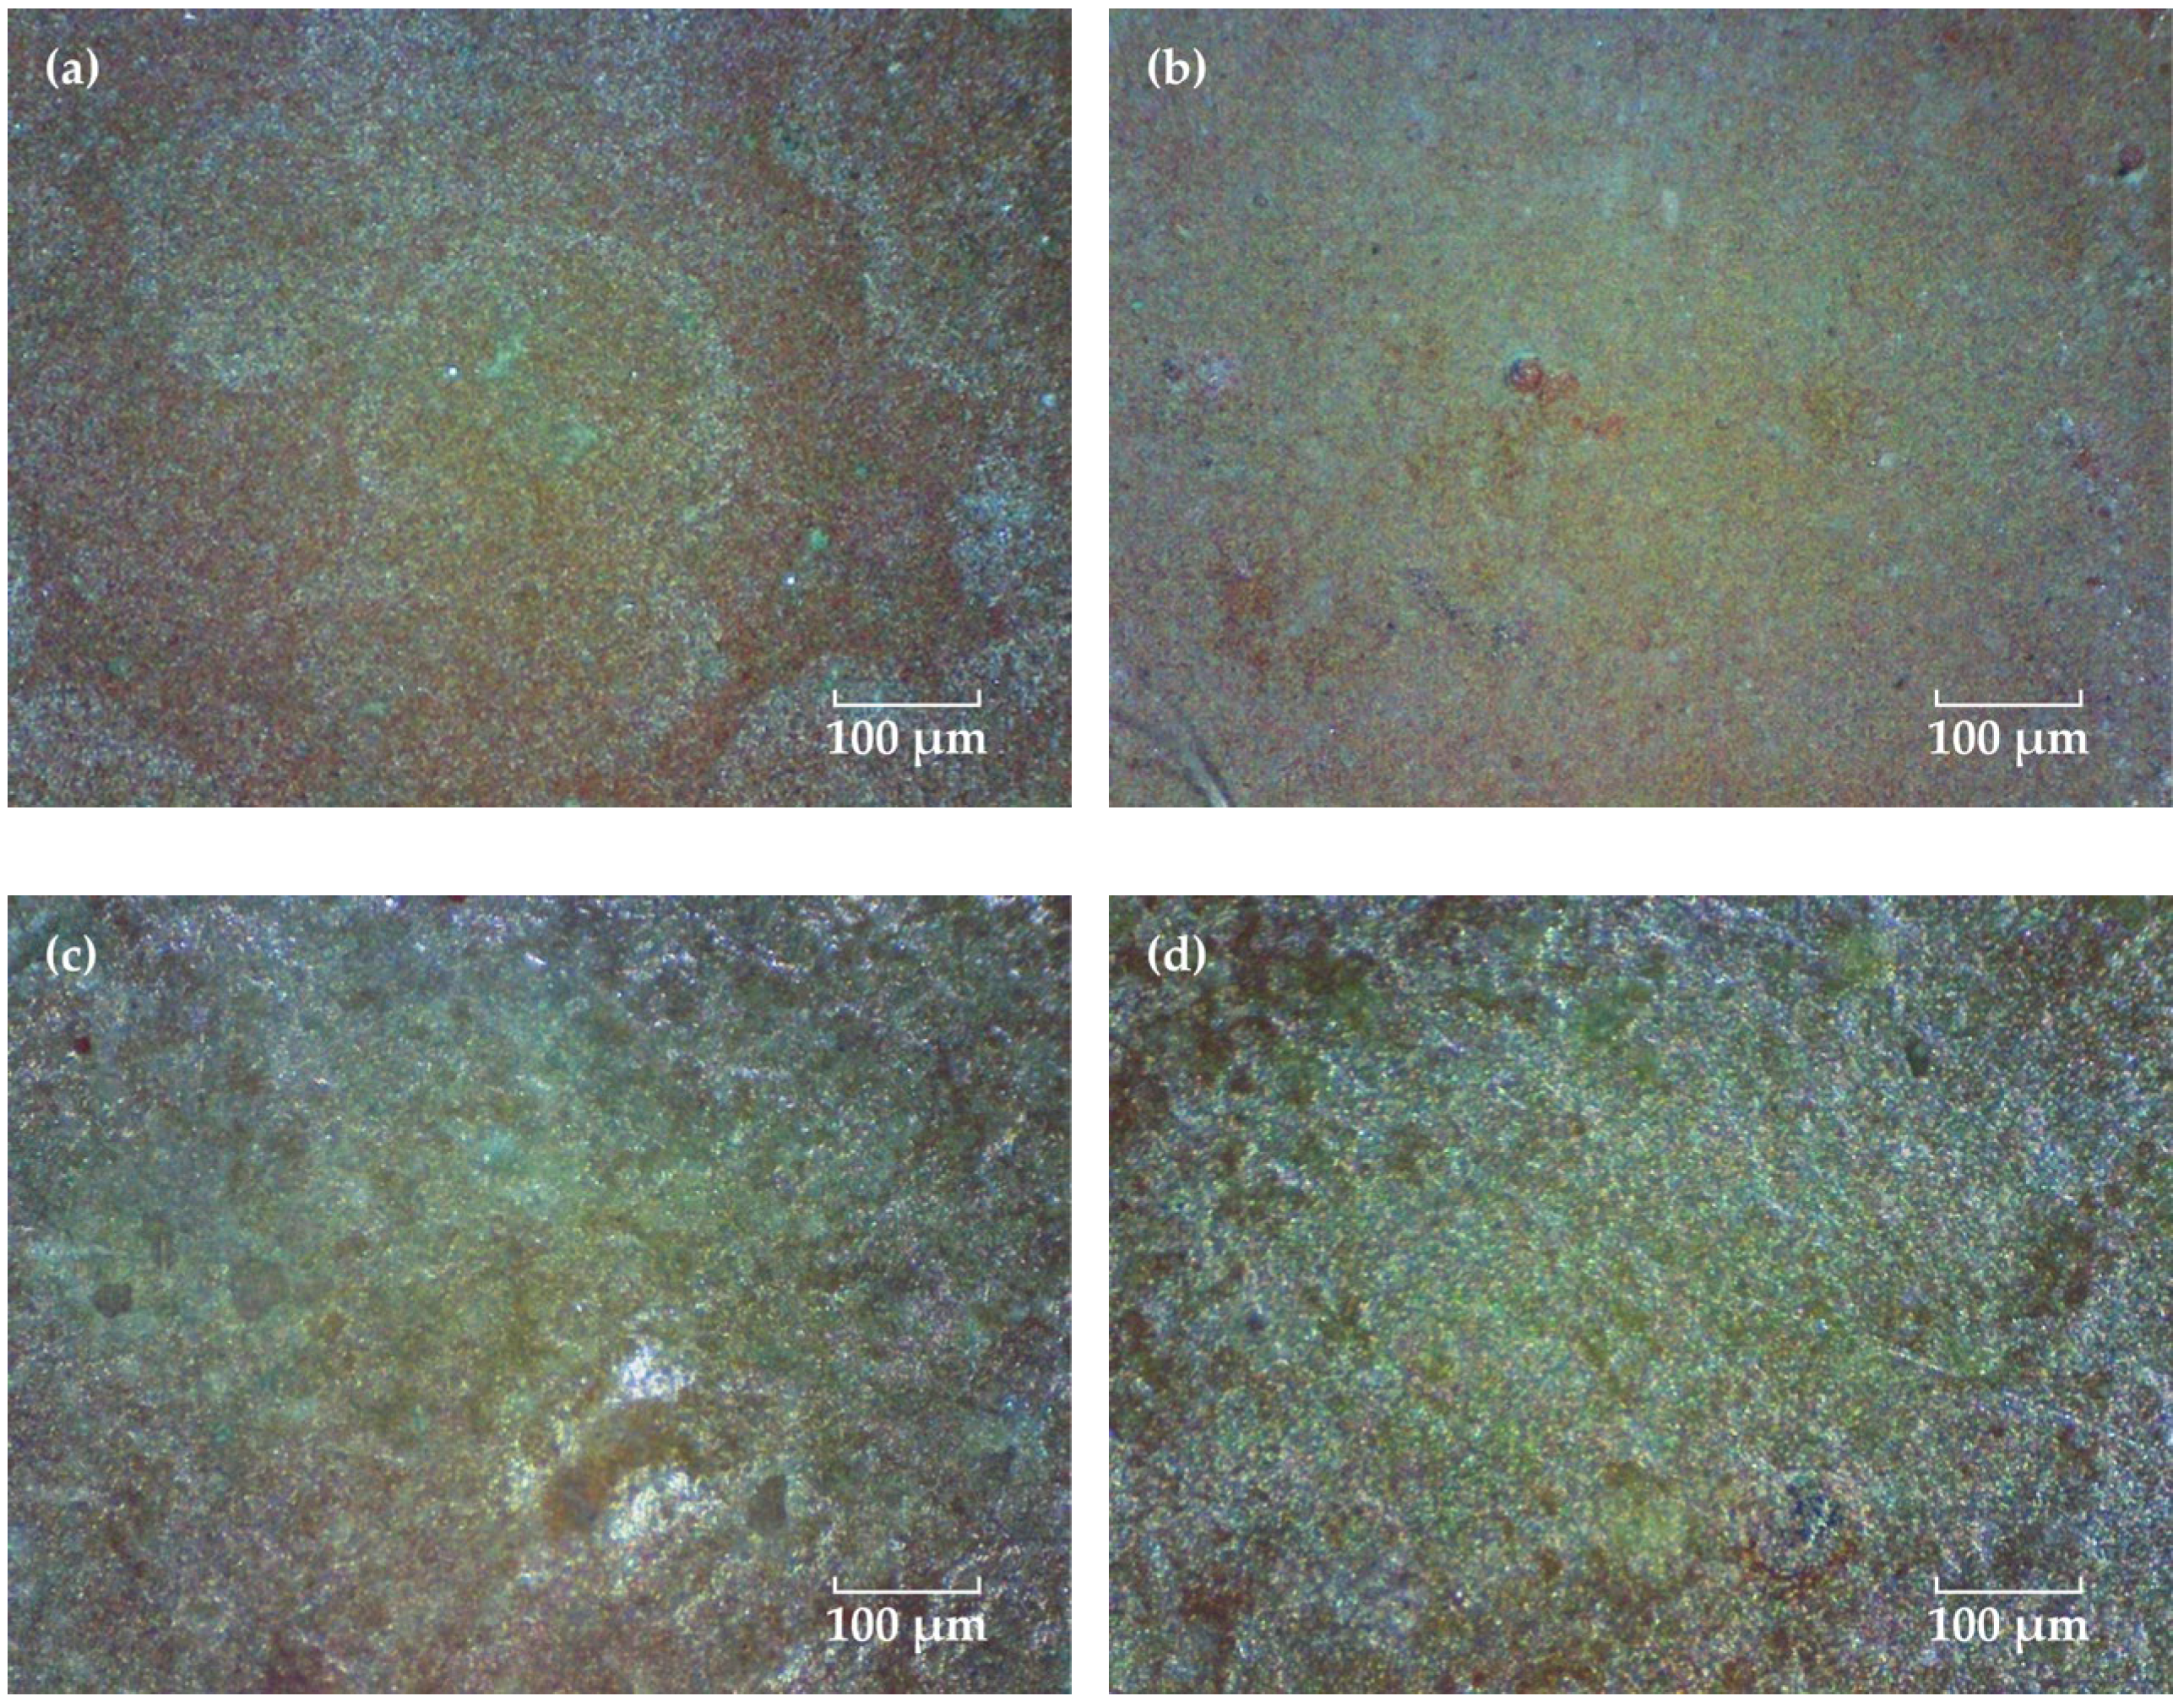
A portable video digital microscope (Anyty 3R-MSV500, 3R Eddytek Corp, Beijing, China) was used to observe the surface morphology of the coating. Figure 2 shows the micrographs with 200 times magnification. Before immersion, the coating surface shows a flat pattern and many fine green particles could be observed, which might be the Cu2O agents in the surface layer of the topcoat. As the solution diffuses into the coating, the Cu2O particles in the surface layer are dissolved and copper ions are produced and released into the solution. In this process, some of the copper ions can be adsorbed and accumulated on the surface of the coating, forming an insoluble cupric salts green deposition [27,28,29]. As the time extended, the green color of the coating is more pronounced, which may be related to the self-polishing effect of the coating that lets the copper oxide particles in the inner layer exposed and released continuously [5,30].
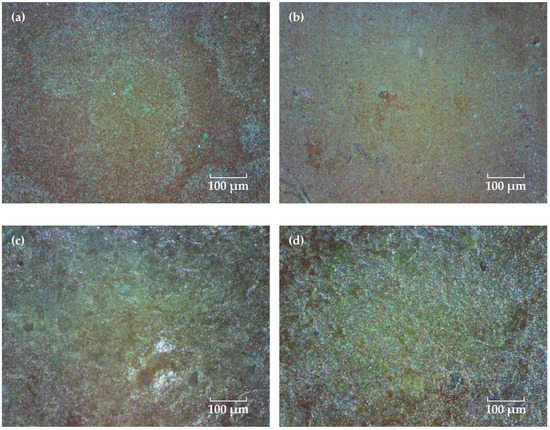
Figure 2.
Surface micrographs of the FW-1 coating after immersion for different time. (a) 0 day, (b) 20 days, (c) 90 days and (d) 160 days.
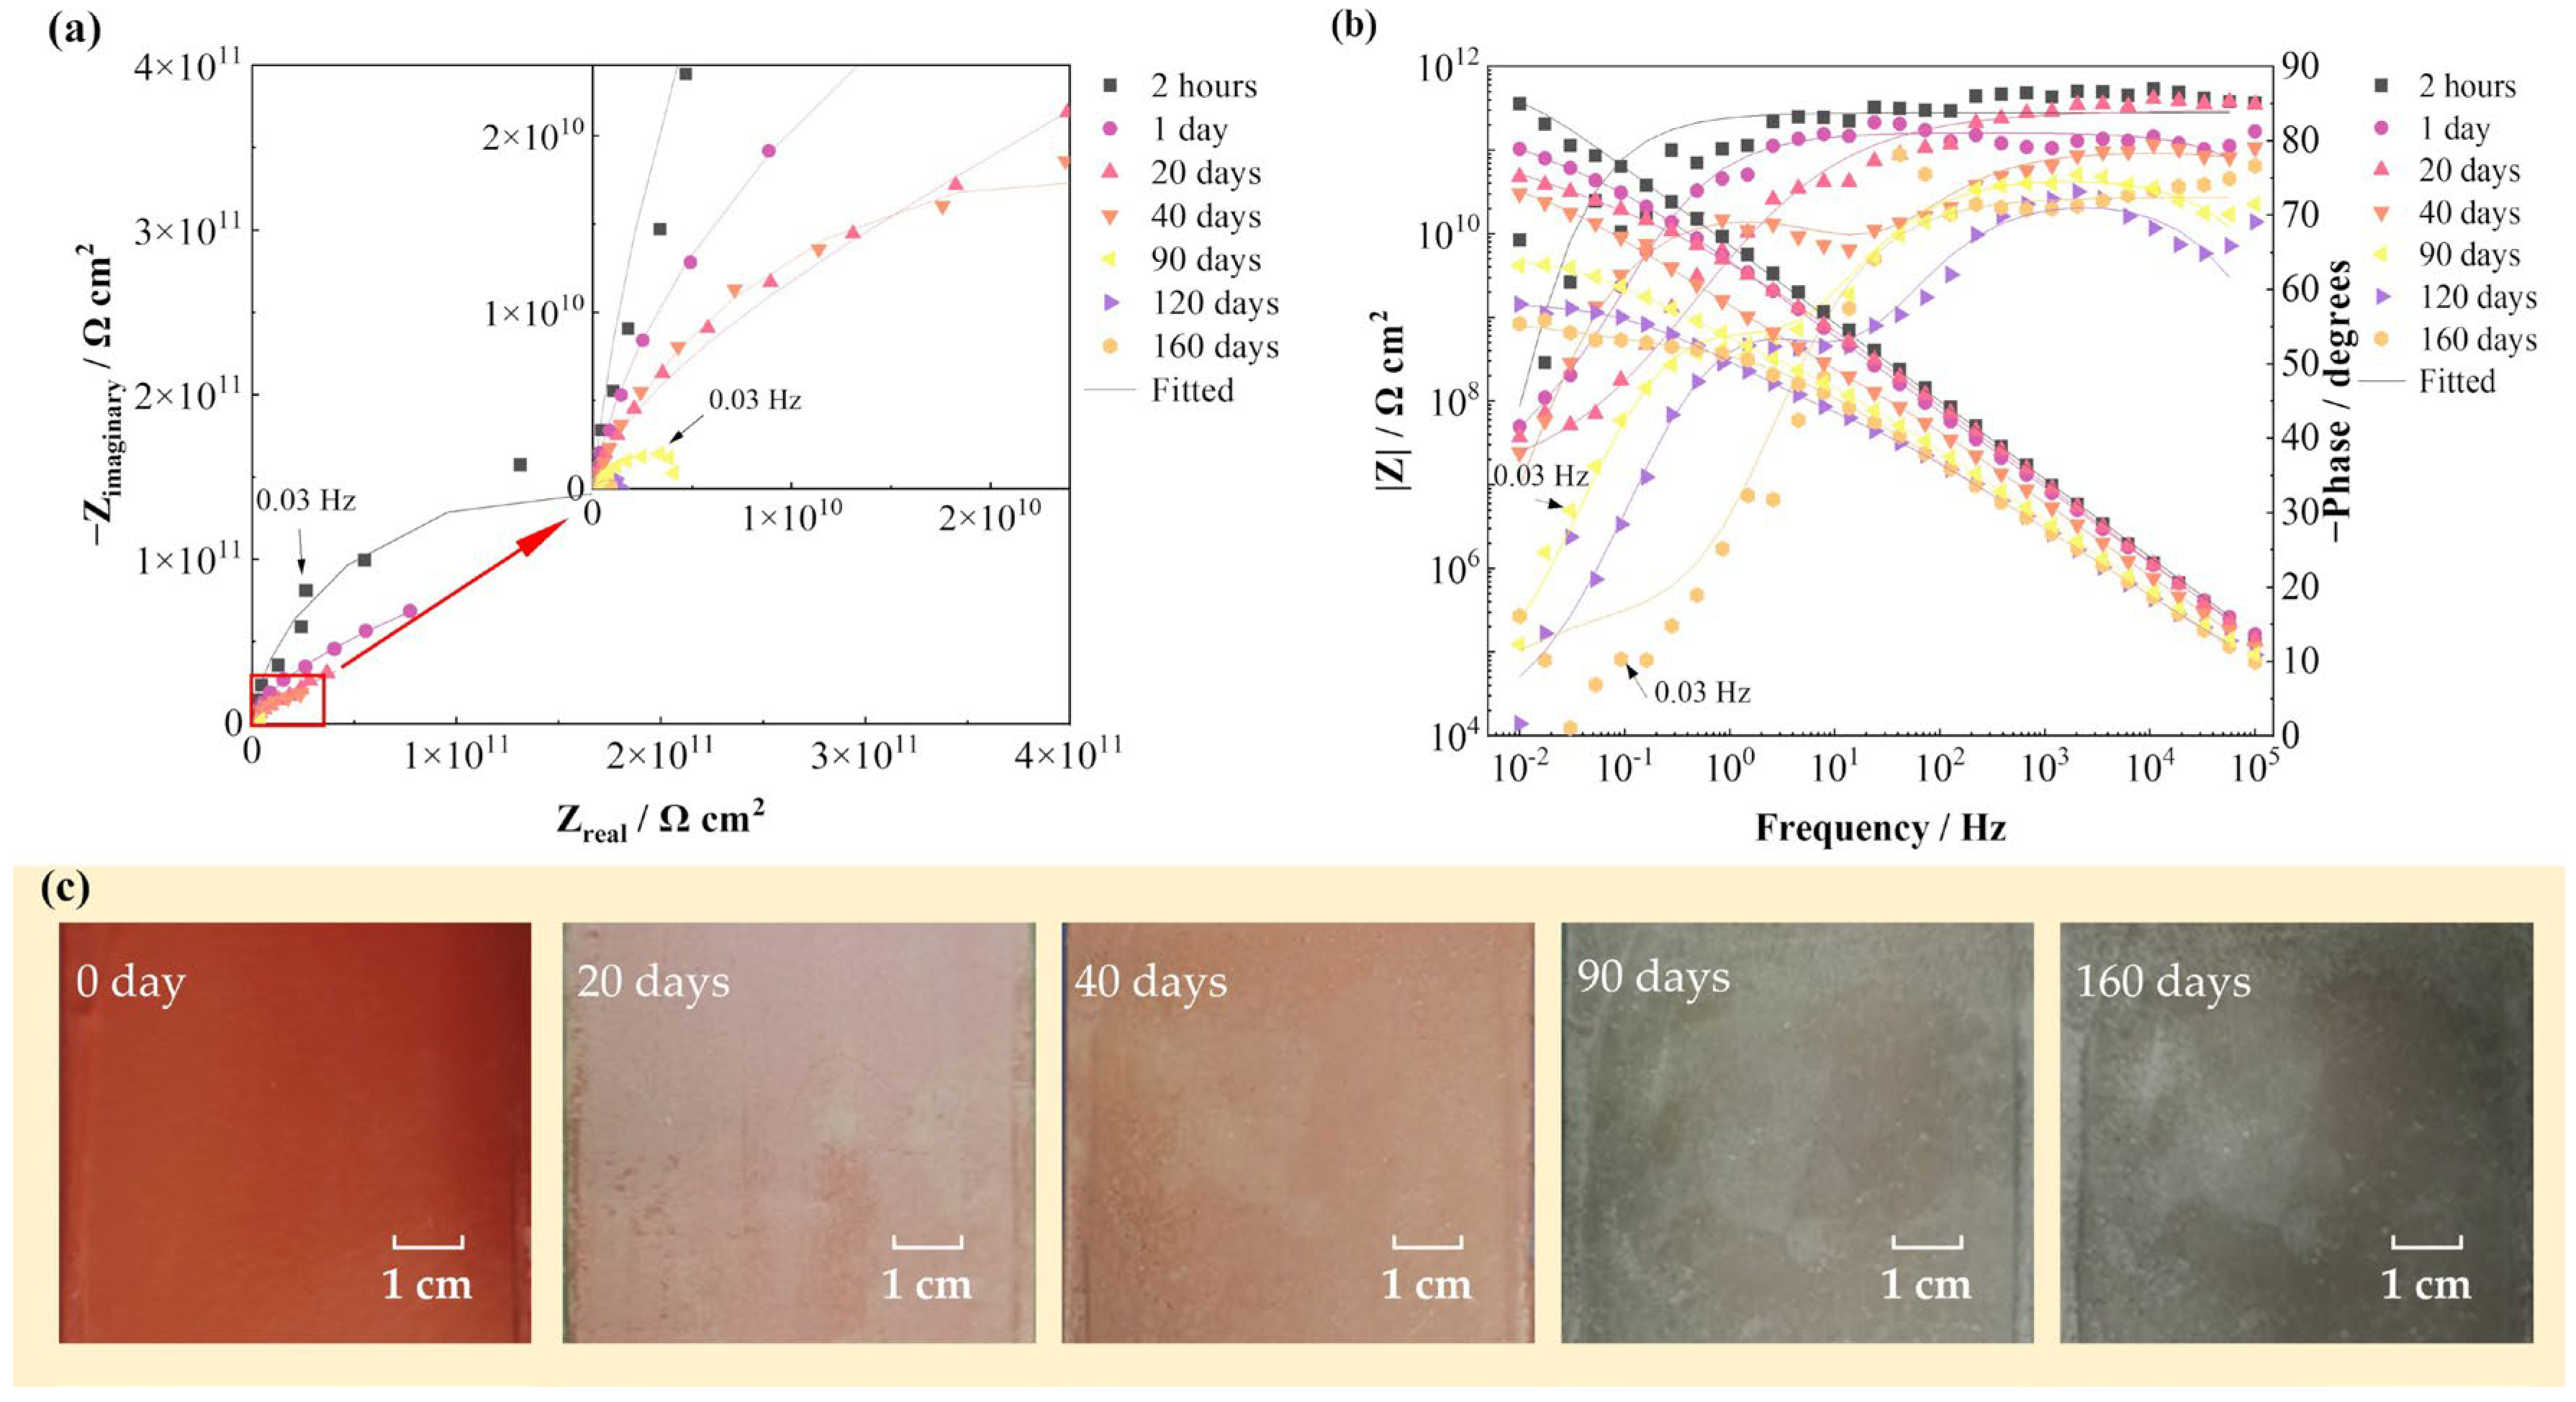
Figure 3 shows the EIS spectra and surface photographs of the FW-2 coating sample in 160 days immersion under alternating hot and cold temperature conditions. Figure 3a,b present that at the beginning (2 h), the |Z|0.01 Hz value of the sample is 2 × 10¹¹ Ω cm2, which indicates that the coating has very good shielding performance against the substrate [15,16]. With time, the radius of the capacitive arc and the value of |Z|0.01 Hz gradually decrease. At 160 days, the |Z|0.01 Hz decreases to 8 × 10⁸ Ω cm2. The high value of the impedance demonstrates that the coating system still has a good protective performance. In Figure 3c, it can be seen that before immersion, the coating shows a red color. Then, with time, the color of the coating gradually changes to dark green and the coating surface remains intact at 160 days.
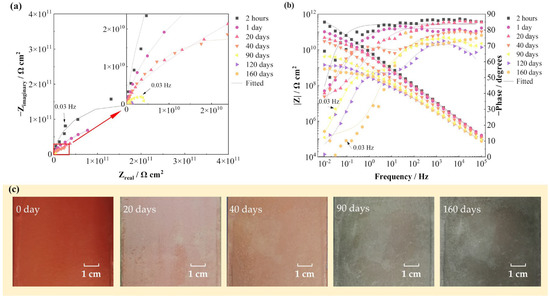
Figure 3.
EIS spectra and surface photographs of the FW-2 coating sample in 160 days immersion test: (a) Nyquist plot; (b) Bode plot; (c) digital photos.
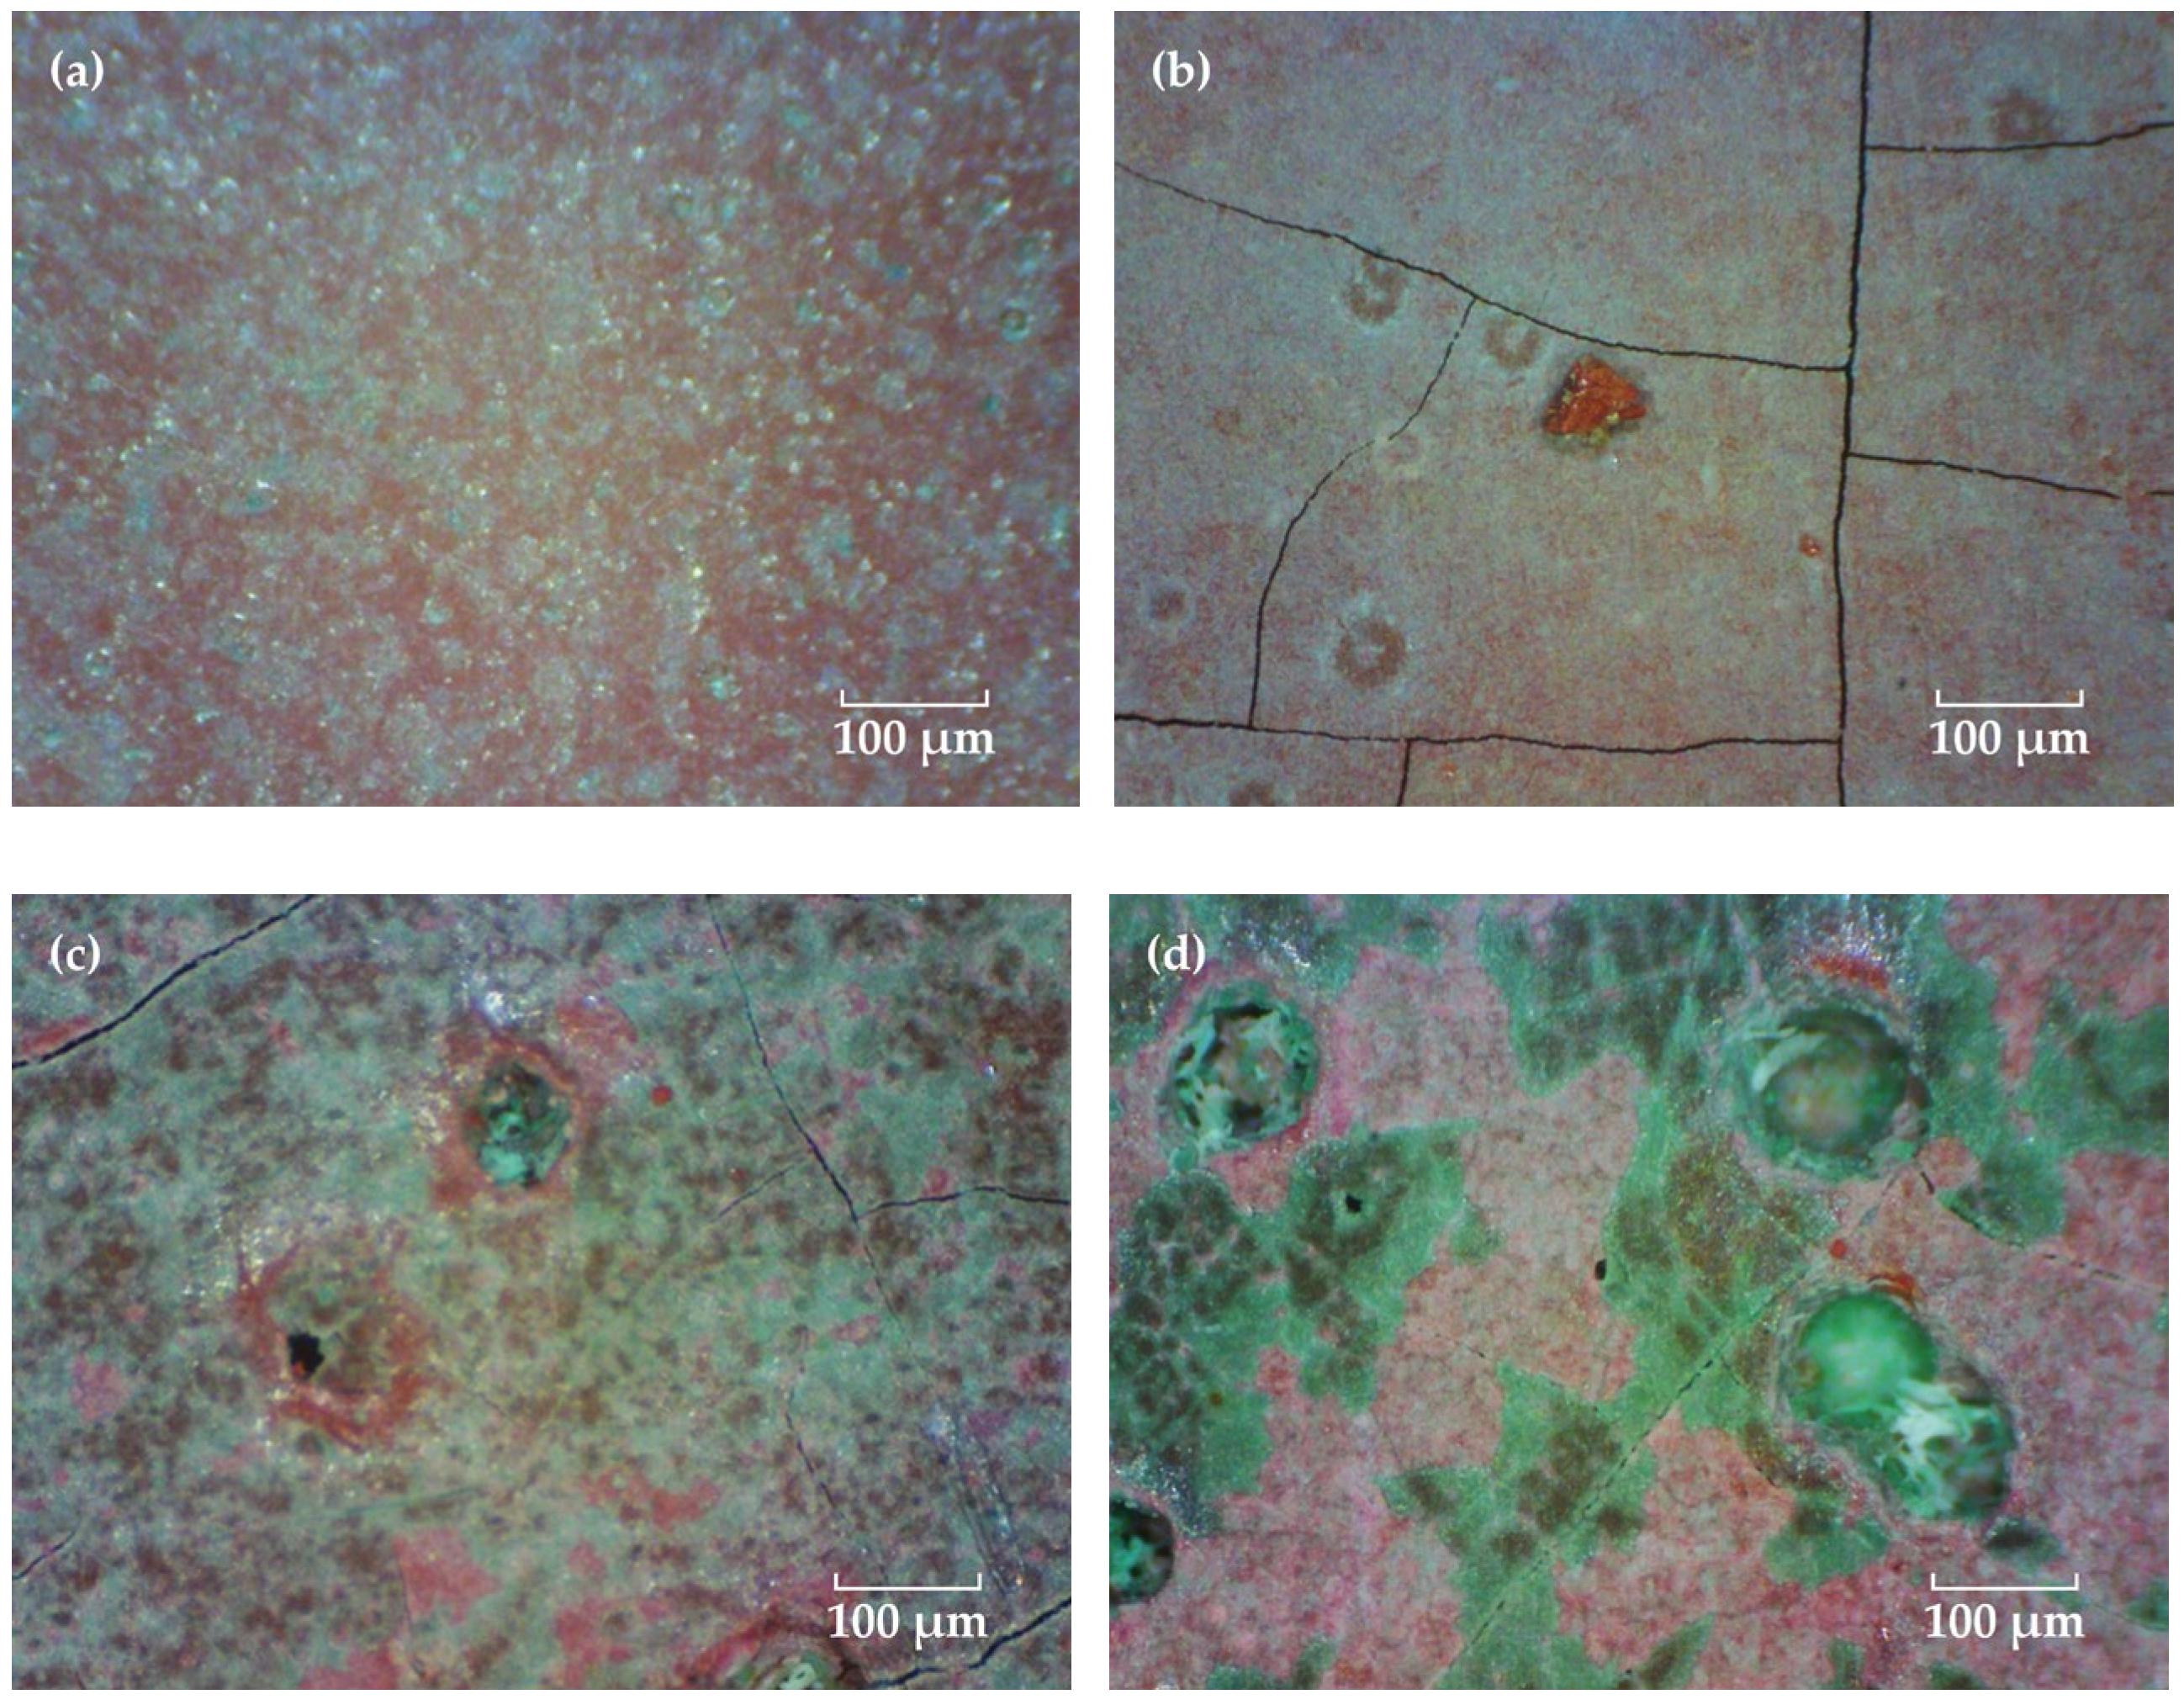
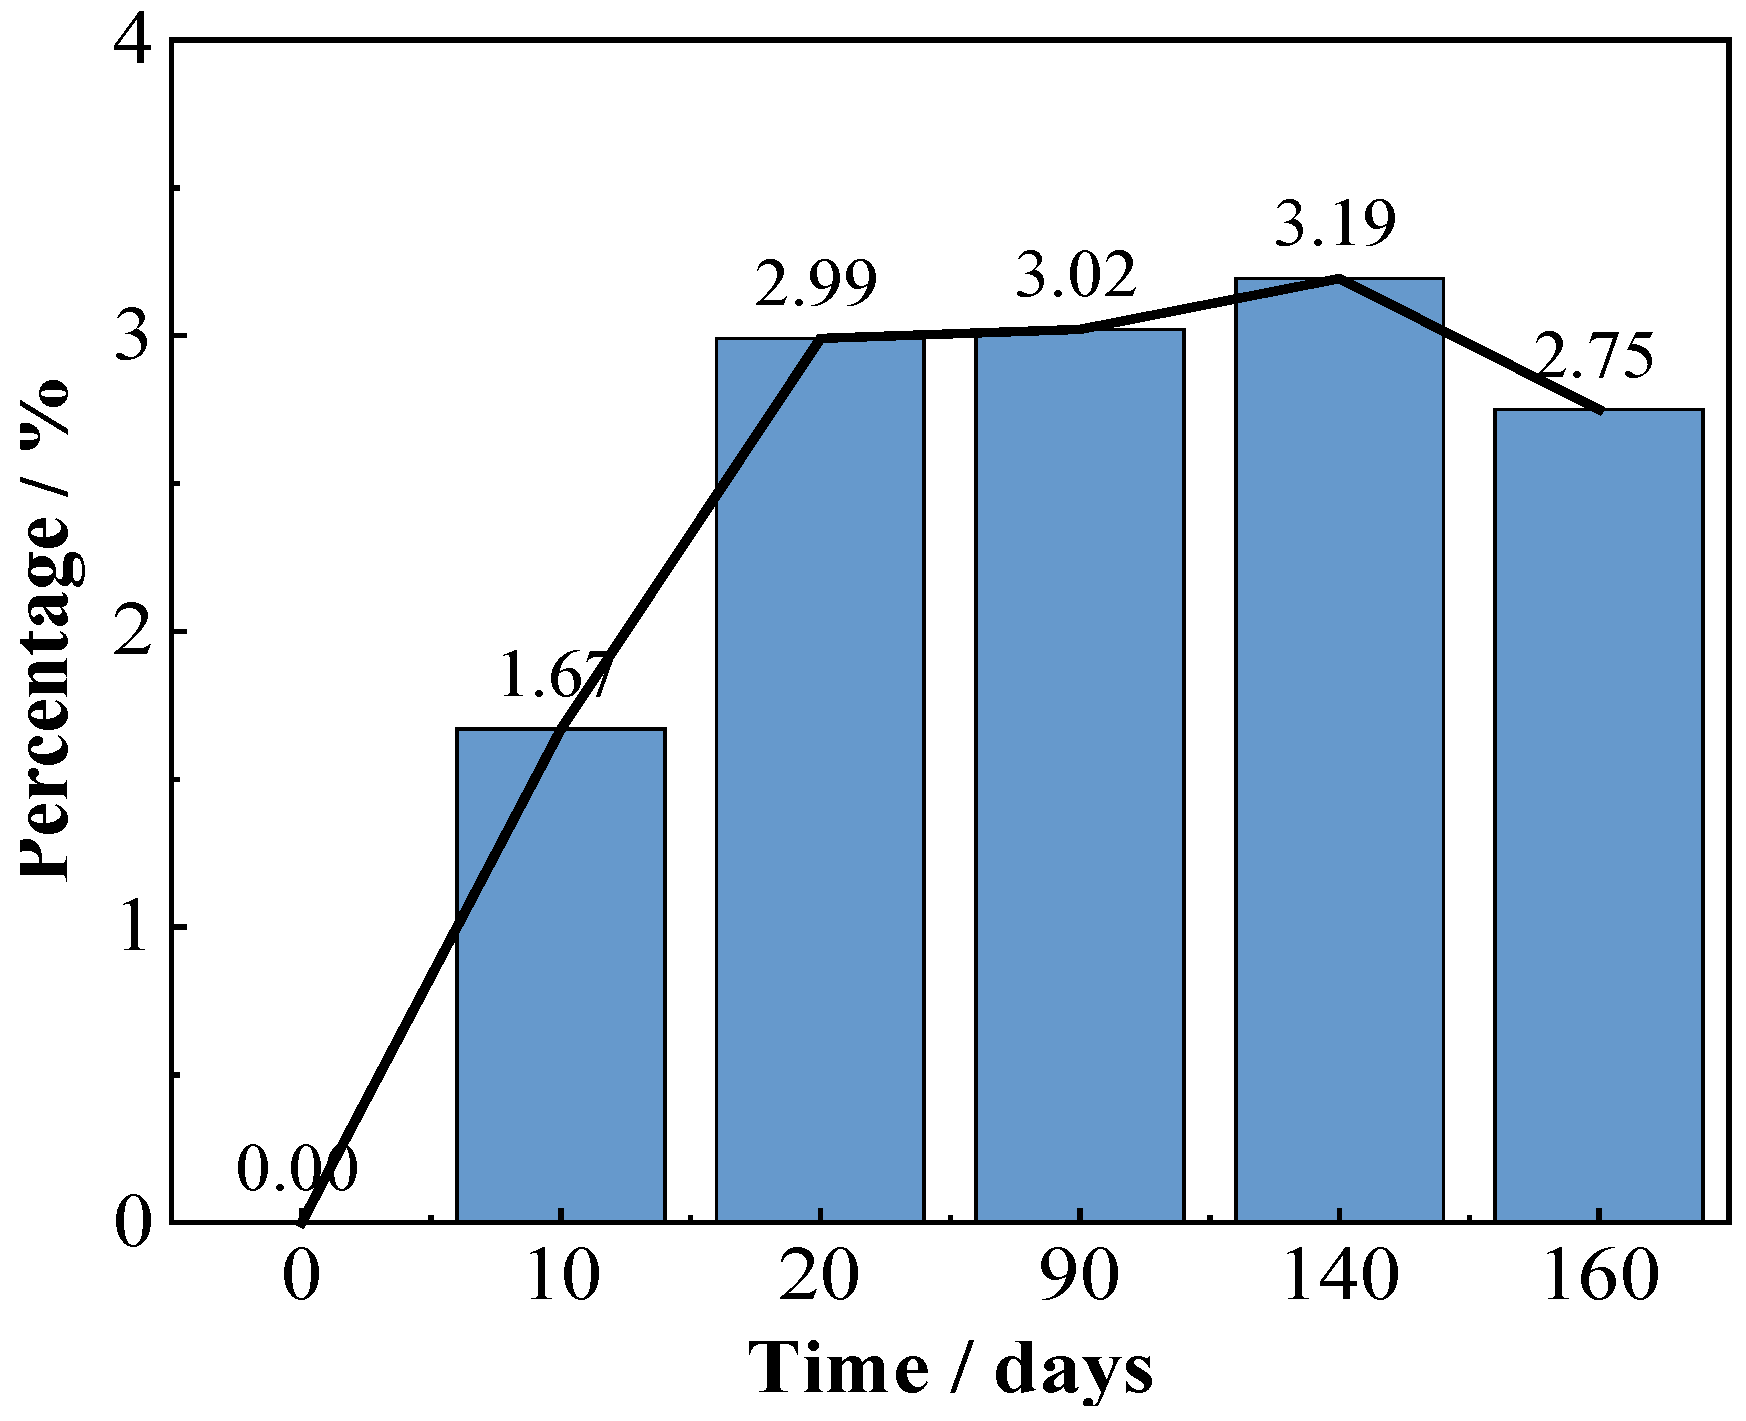
Figure 4 shows the coating morphologies via the video digital microscope (magnification 200×). Before immersion, many uniformly distributed green Cu2O particles can be observed on the red topcoat surface, which are slightly larger in size than those in the FW-1 coating (Figure 2a). With the time extended, the green particles are dissolved, and the surface of the coating become flatter. However, some tiny cracks and holes are observed, and the sizes of the holes increased as the test continued. The micro holes may be related to some soluble pigments added to the coating, such as Cu2O and ZnO, which are dissolved when contact with the solution and leach from the anti-fouling coating [31,32,33]. The micro-crack usually has a relationship with the flexibility of the film-forming material in the coating. For a coating with lower flexibility, it is easier to produce micro-cracks, especially in the high and low temperature immersion environments, which can promote the internal stress in the film, and the cracks will propagate from film defects when the internal stress in the film exceeds the fracture energy [34]. After a certain number of micro-cracks and holes are formed on the surface, copper ions formed by Cu2O dissolution reaction are more likely to leach out from these microscopic defects and accumulate around them. As a result, many green substances are deposited around the micro-holes and cracks when the tests were conducted at 90 days and 160 days (Figure 4c,d). Photoshop software was used to analyze the quantity and area of the micro-cracks and holes in the surface micrographs of the FW-2 coating in Figure 4. The results are shown in Figure 5. It is seen that before 20 days, the percentage total areas of micro-cracks and holes show a trend of increasing; subsequently, with the immersion, the percentage tends to be steady.
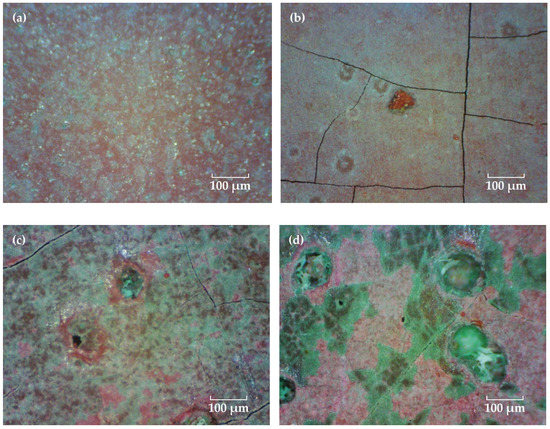
Figure 4.
Surface micrographs of the FW-2 coating after immersion for different time. (a) 0 day, (b) 20 days, (c) 90 days and (d) 160 days.
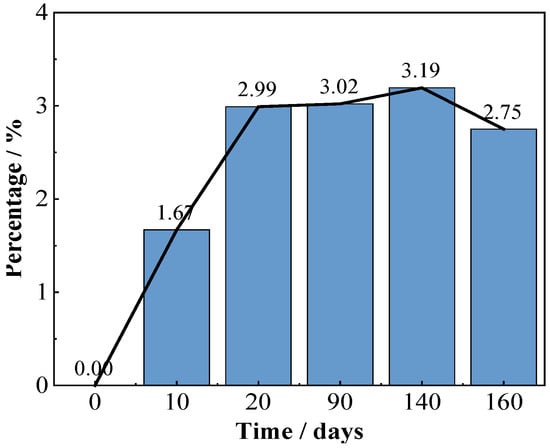
Figure 5.
Analysis result of areas of micro-cracks and holes in surface micrographs of the FW-2 coating.
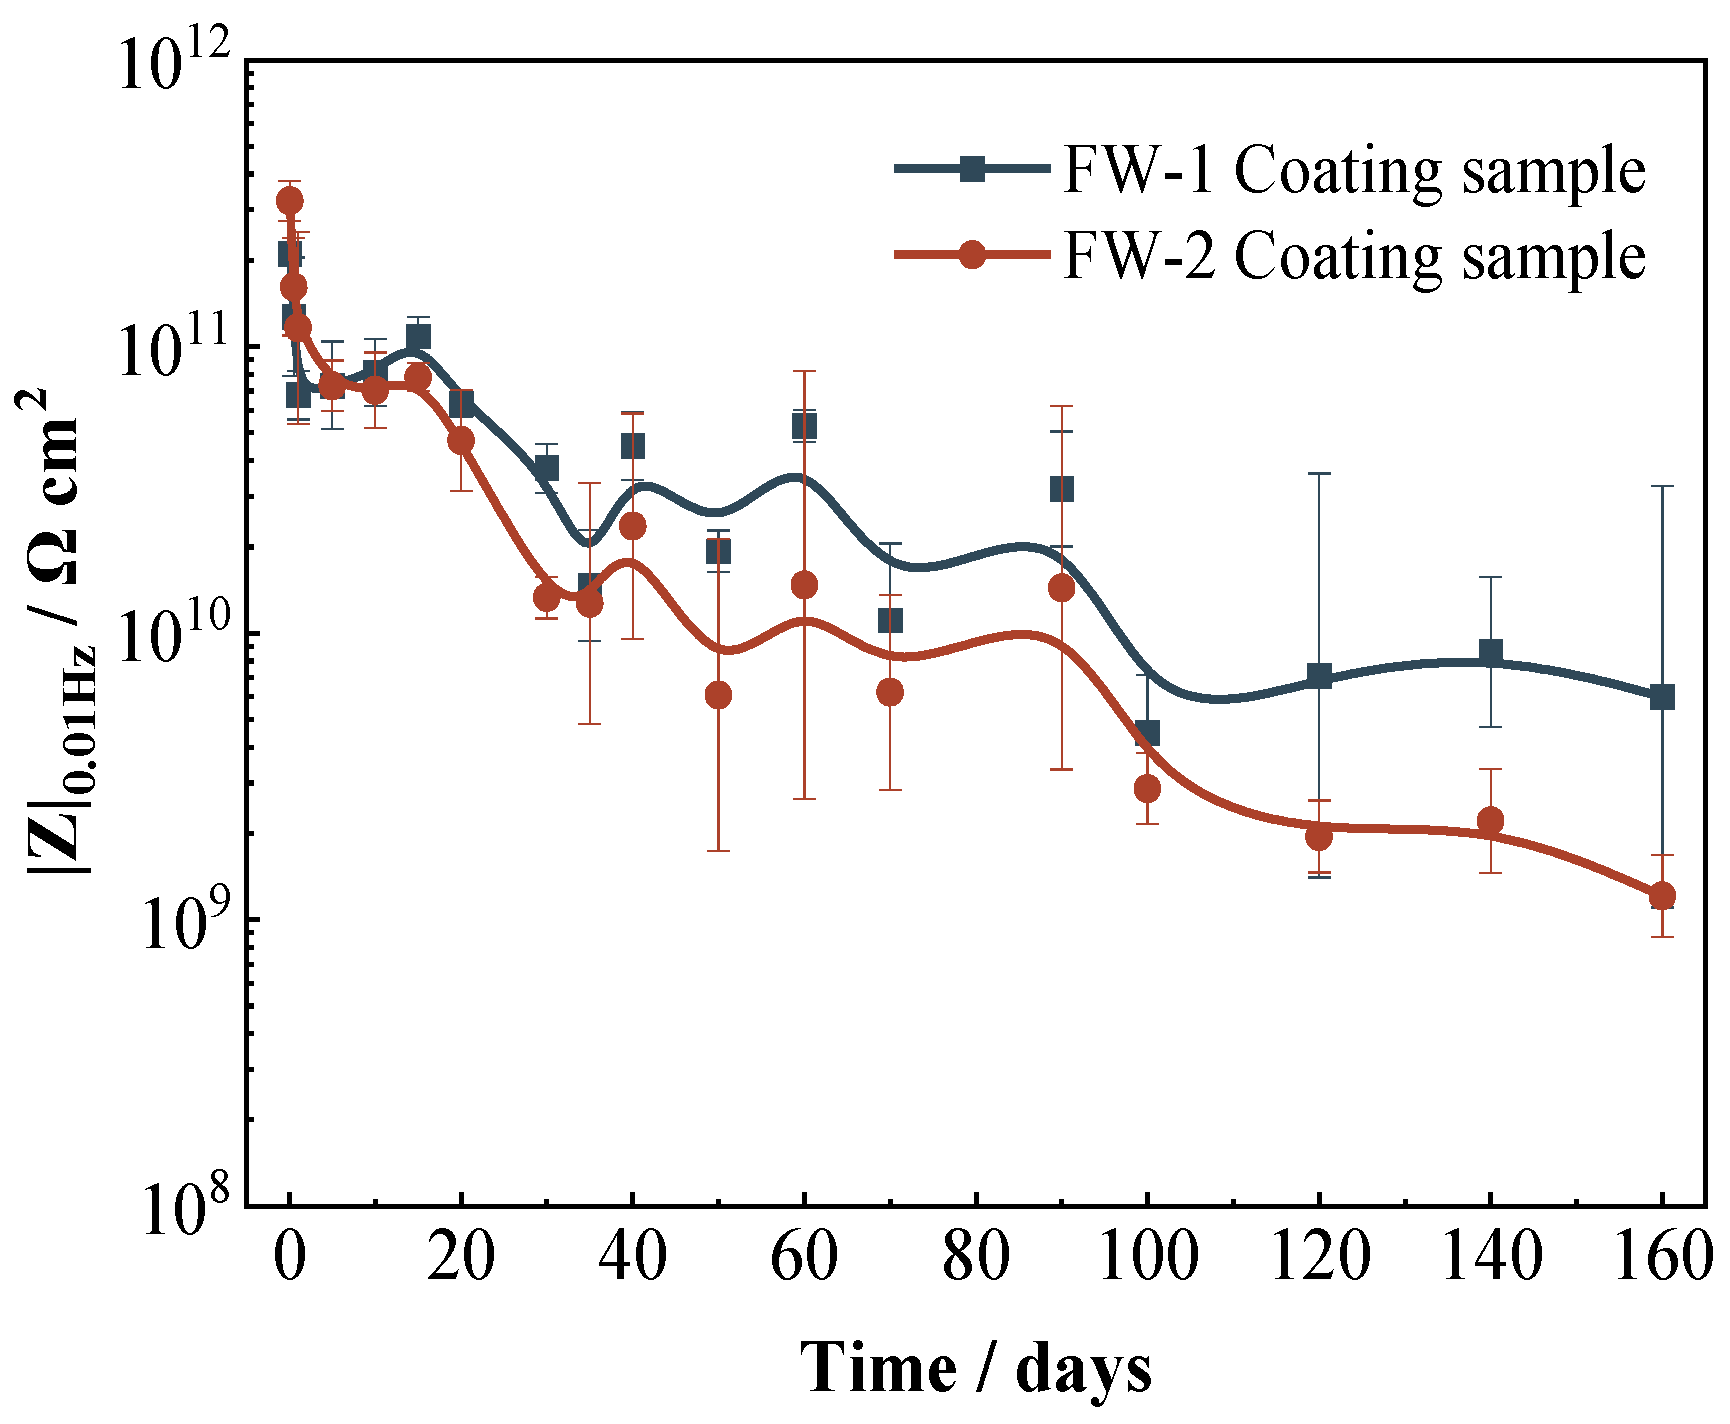
The low-frequency impedance (|Z|0.01 Hz) can be used to evaluate the protection performance of coatings to the substrate. Figure 6 shows the variation of the |Z|0.01 Hz for two coating samples with time. The whole trend of the |Z|0.01 Hz for two coating samples is similar; both present a rapid decrease (0−1 days) and then a gradual decline. It is seen that the value of |Z|0.01 Hz for the FW-1 sample is slightly higher than that of the FW-2 sample, which indicates that the FW-1 coating has a slightly better protection performance to the substrate. As the test proceeds, the difference between the two samples gradually becomes obvious.
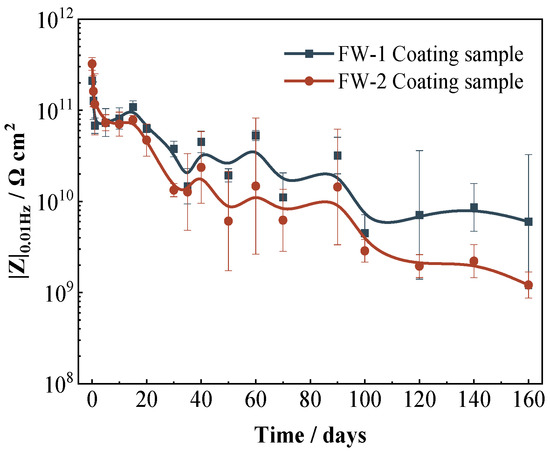
Figure 6.
Variation of |Z|0.01 Hz for two coating samples with time.
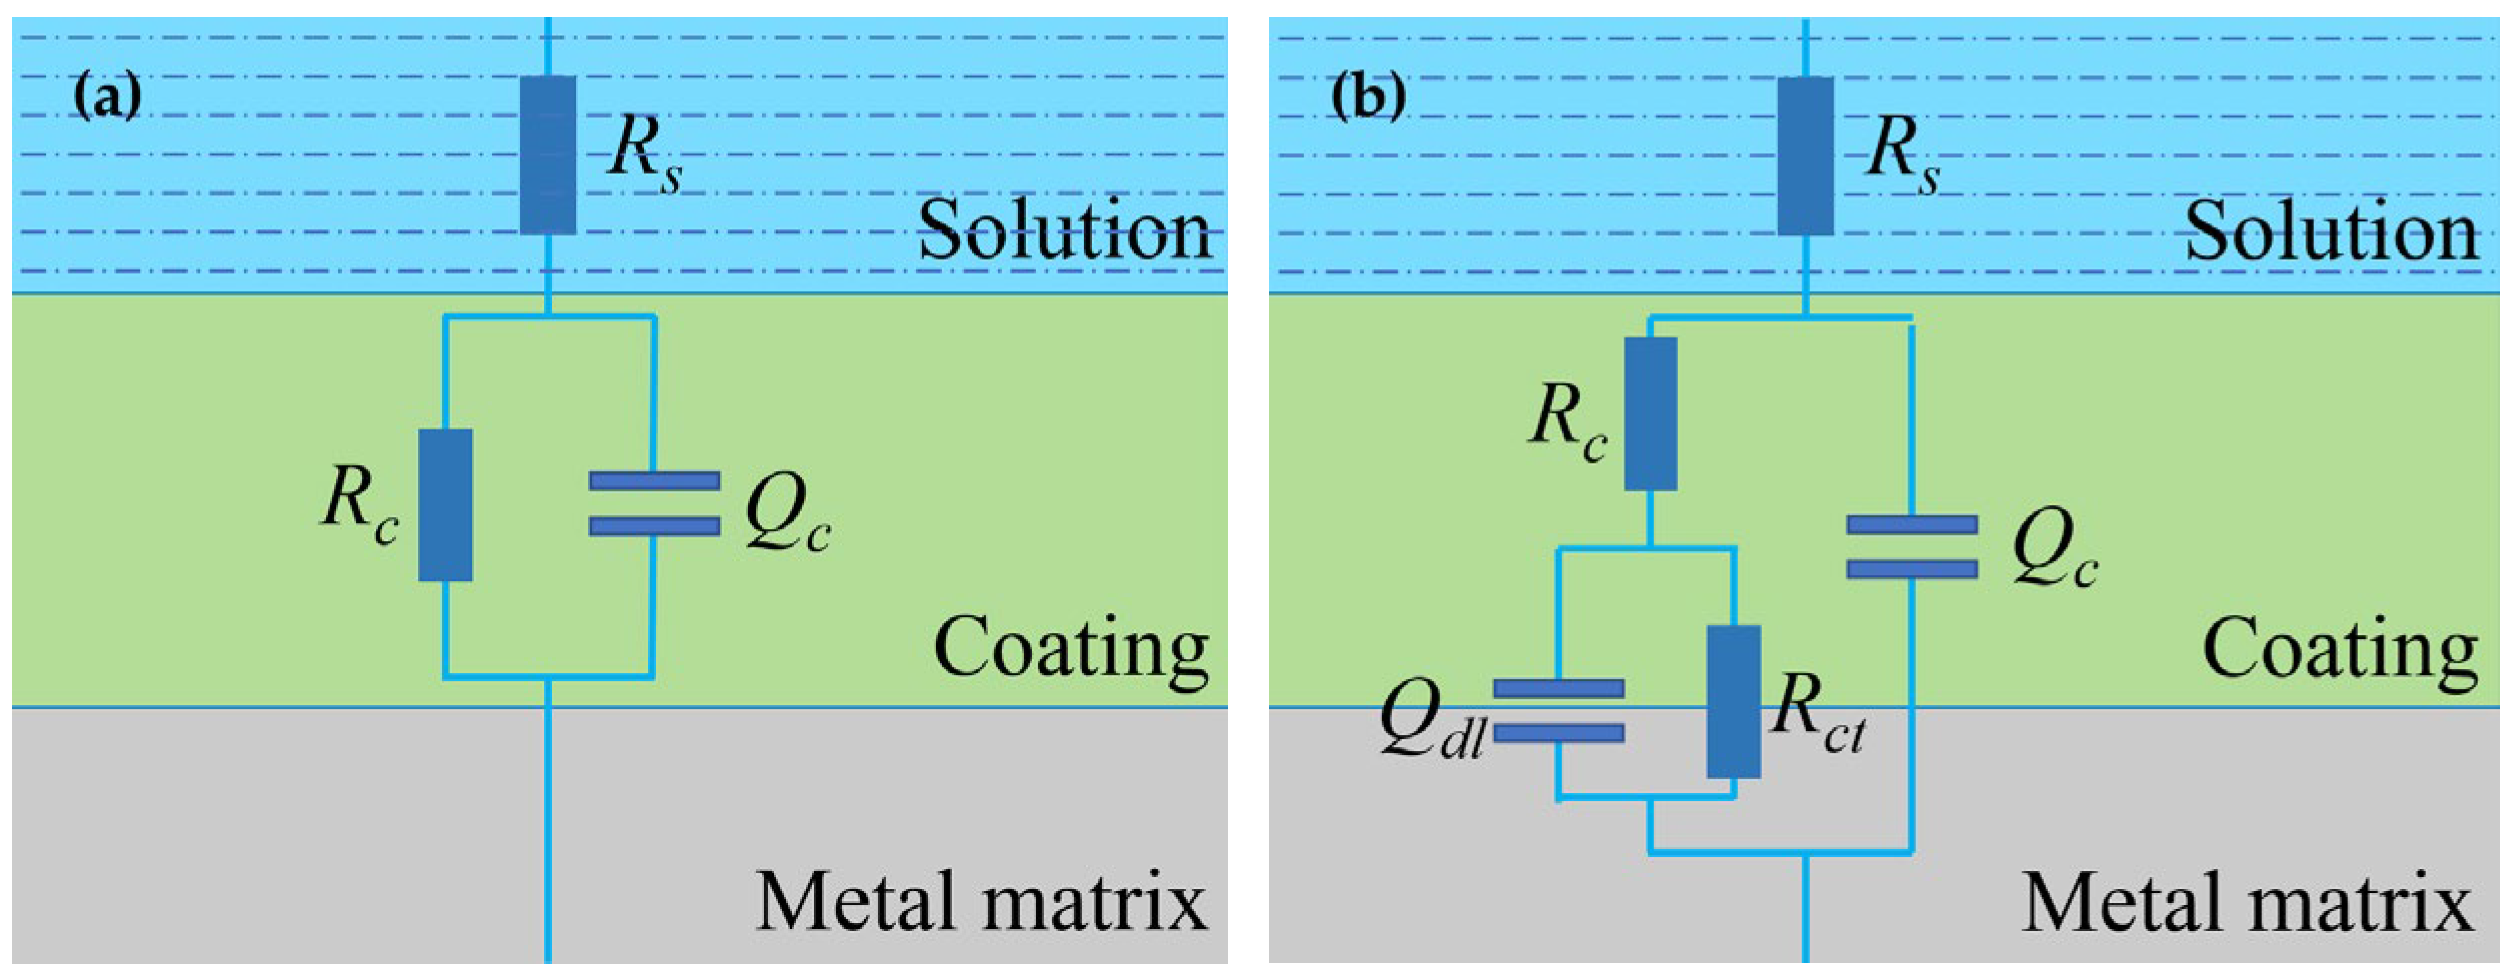
The equivalent circuit models in Figure 7 were used to fit and analyze the impedance data of the two coating samples. At the beginning of the test (0−5 days), the coating is equivalent to a barrier layer with a high-value coating resistance in parallel with a low-value coating capacitance, so Model A was used for fitting [35]. In this model, Rs is the solution resistance, Qc is the constant phase element (CPE) simulating the non-ideal capacitance behavior of the coating electrode and Rc is the coating resistance. When the electrolyte reaches the substrate surface and the electrochemical reactions (anodic reaction: Fe → Fe2+ + 2e−, cathodic reaction: 2H2O + O2 + 4e− → 4OH−) at the coating–metal interface may take place, Model B was introduced to fit the data in the period of 6 days–160 days, in which Rct is the charge transfer resistance and Qdl the double layer capacitance. Table 2 and Table 3 list the EIS fitting parameters for the two coating samples. It is noted that, with the time extended, the nQc (the n related to the constant phase element) gradually changes to a smaller value [36]. This indicates that the homogenization of the coating has become worse to some extent, which may be caused by the penetration of the solution into the coating or some changes occurring in the coating.
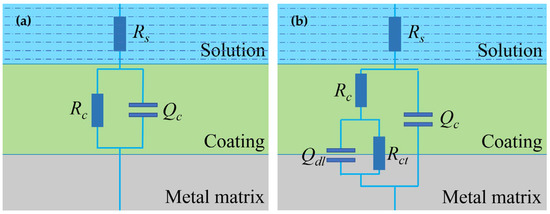
Figure 7.
Equivalent circuit models for impedance data fitting. (a) Model A, (b) Model B.

Table 2.
The impedance fitting parameters of the FW-1 coating sample.

Table 3.
The impedance fitting parameters of the FW-2 coating sample.
The coating resistance Rc and the constant phase element Qc are two important parameters used to evaluate the protective performance of the coatings. Diffusion of the electrolyte into the organic coatings will cause the film resistivity to decrease and the film dielectric constant to increase, thus Rc decreases and Qc increases. According to Equation (3), the coating capacitance Cc can be calculated by Qc and the coating porosity (P) and the water absorption volume fraction (φ) can be obtained with Equations (4) and (5) by Rc and Cc [36,37], respectively, where Rpt is theoretical resistance when the coating porosity is assumed to be infinite, d is the coating thickness (μm), A is the area of the working electrode, k is the conductivity of 3.5% NaCl solution (0.01 S/m−1), and C0 and Ct are the initial coating capacitance and the coating capacitance after immersion time t, respectively.
Cc = Qc1/n (Rs−1 + Rc−1) (n−1)/n
P = Rpt/Rc, Rpt = 100 × d/Ak
φ = log (Ct/C0)/log80
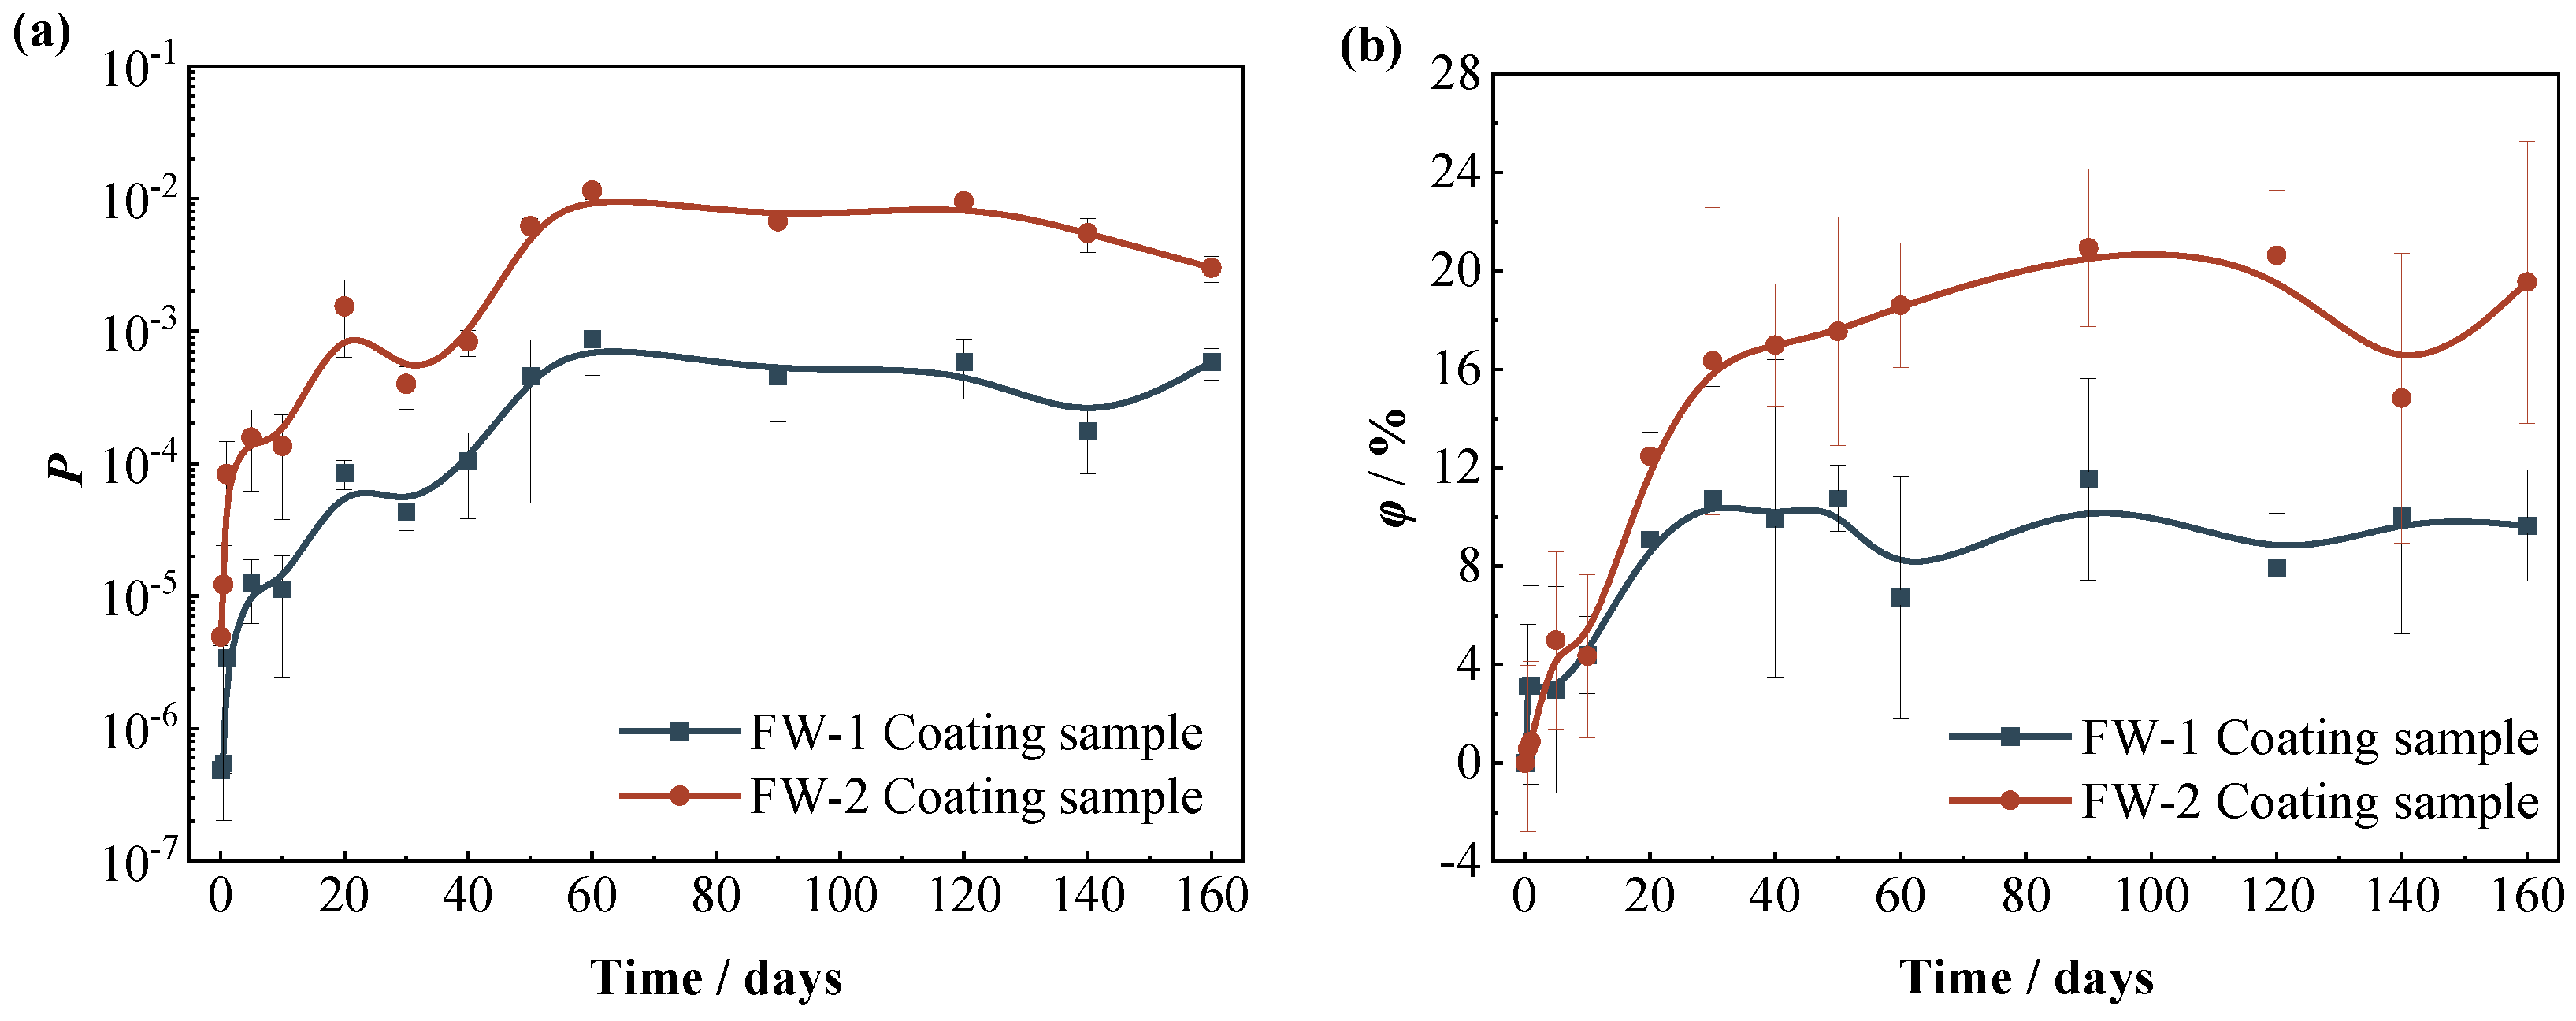
Figure 8 shows the variation curves of the coating porosity (P) and the water absorption volume percentage (φ) of the two coating systems with time. At first (0−5 days), the porosity of the two coating systems increases rapidly, during which the porosity of the FW-1 coating increases rapidly from the initial value of 5 × 10⁻⁷ to 2 × 10⁻⁵, and the porosity of the FW-2 coating increases from 4 × 10⁻⁶ to 2 × 10⁻⁴. From 5 days to 60 days, the porosity of the two coatings increases at a slower rate, and remains basically unchanged after 60 days. The φ of both coatings also rises rapidly at first and then slows down after 30–50 days, which is probably because the water uptake reaches a saturation state [35]. Comparatively, the values of P and φ for the FW-2 coating are higher than those of the FW-1 coating. This is consistent with the previous results of the coating morphologies by the video digital microscope, in which the micro-cracks and holes occur in the FW-2 topcoat during the immersion process. These micro defects provide more channels for solution penetration in the coating and cause the increase in the coating’s water uptake. In addition to the variation of dielectric property, the water penetration is also responsible for the changes in the mechanical properties of the coating, such as coating swelling and decreasing adhesion to the substrate [8].
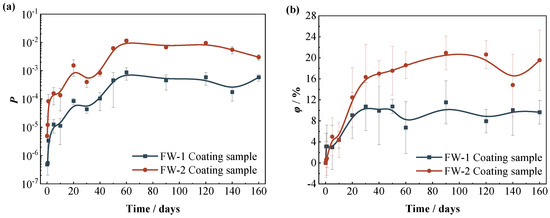
Figure 8.
Variations of (a) porosity and (b) water absorption of two coating systems with time.
3.2. The Microscopic Morphology and Composition Analysis of Two Coating Systems
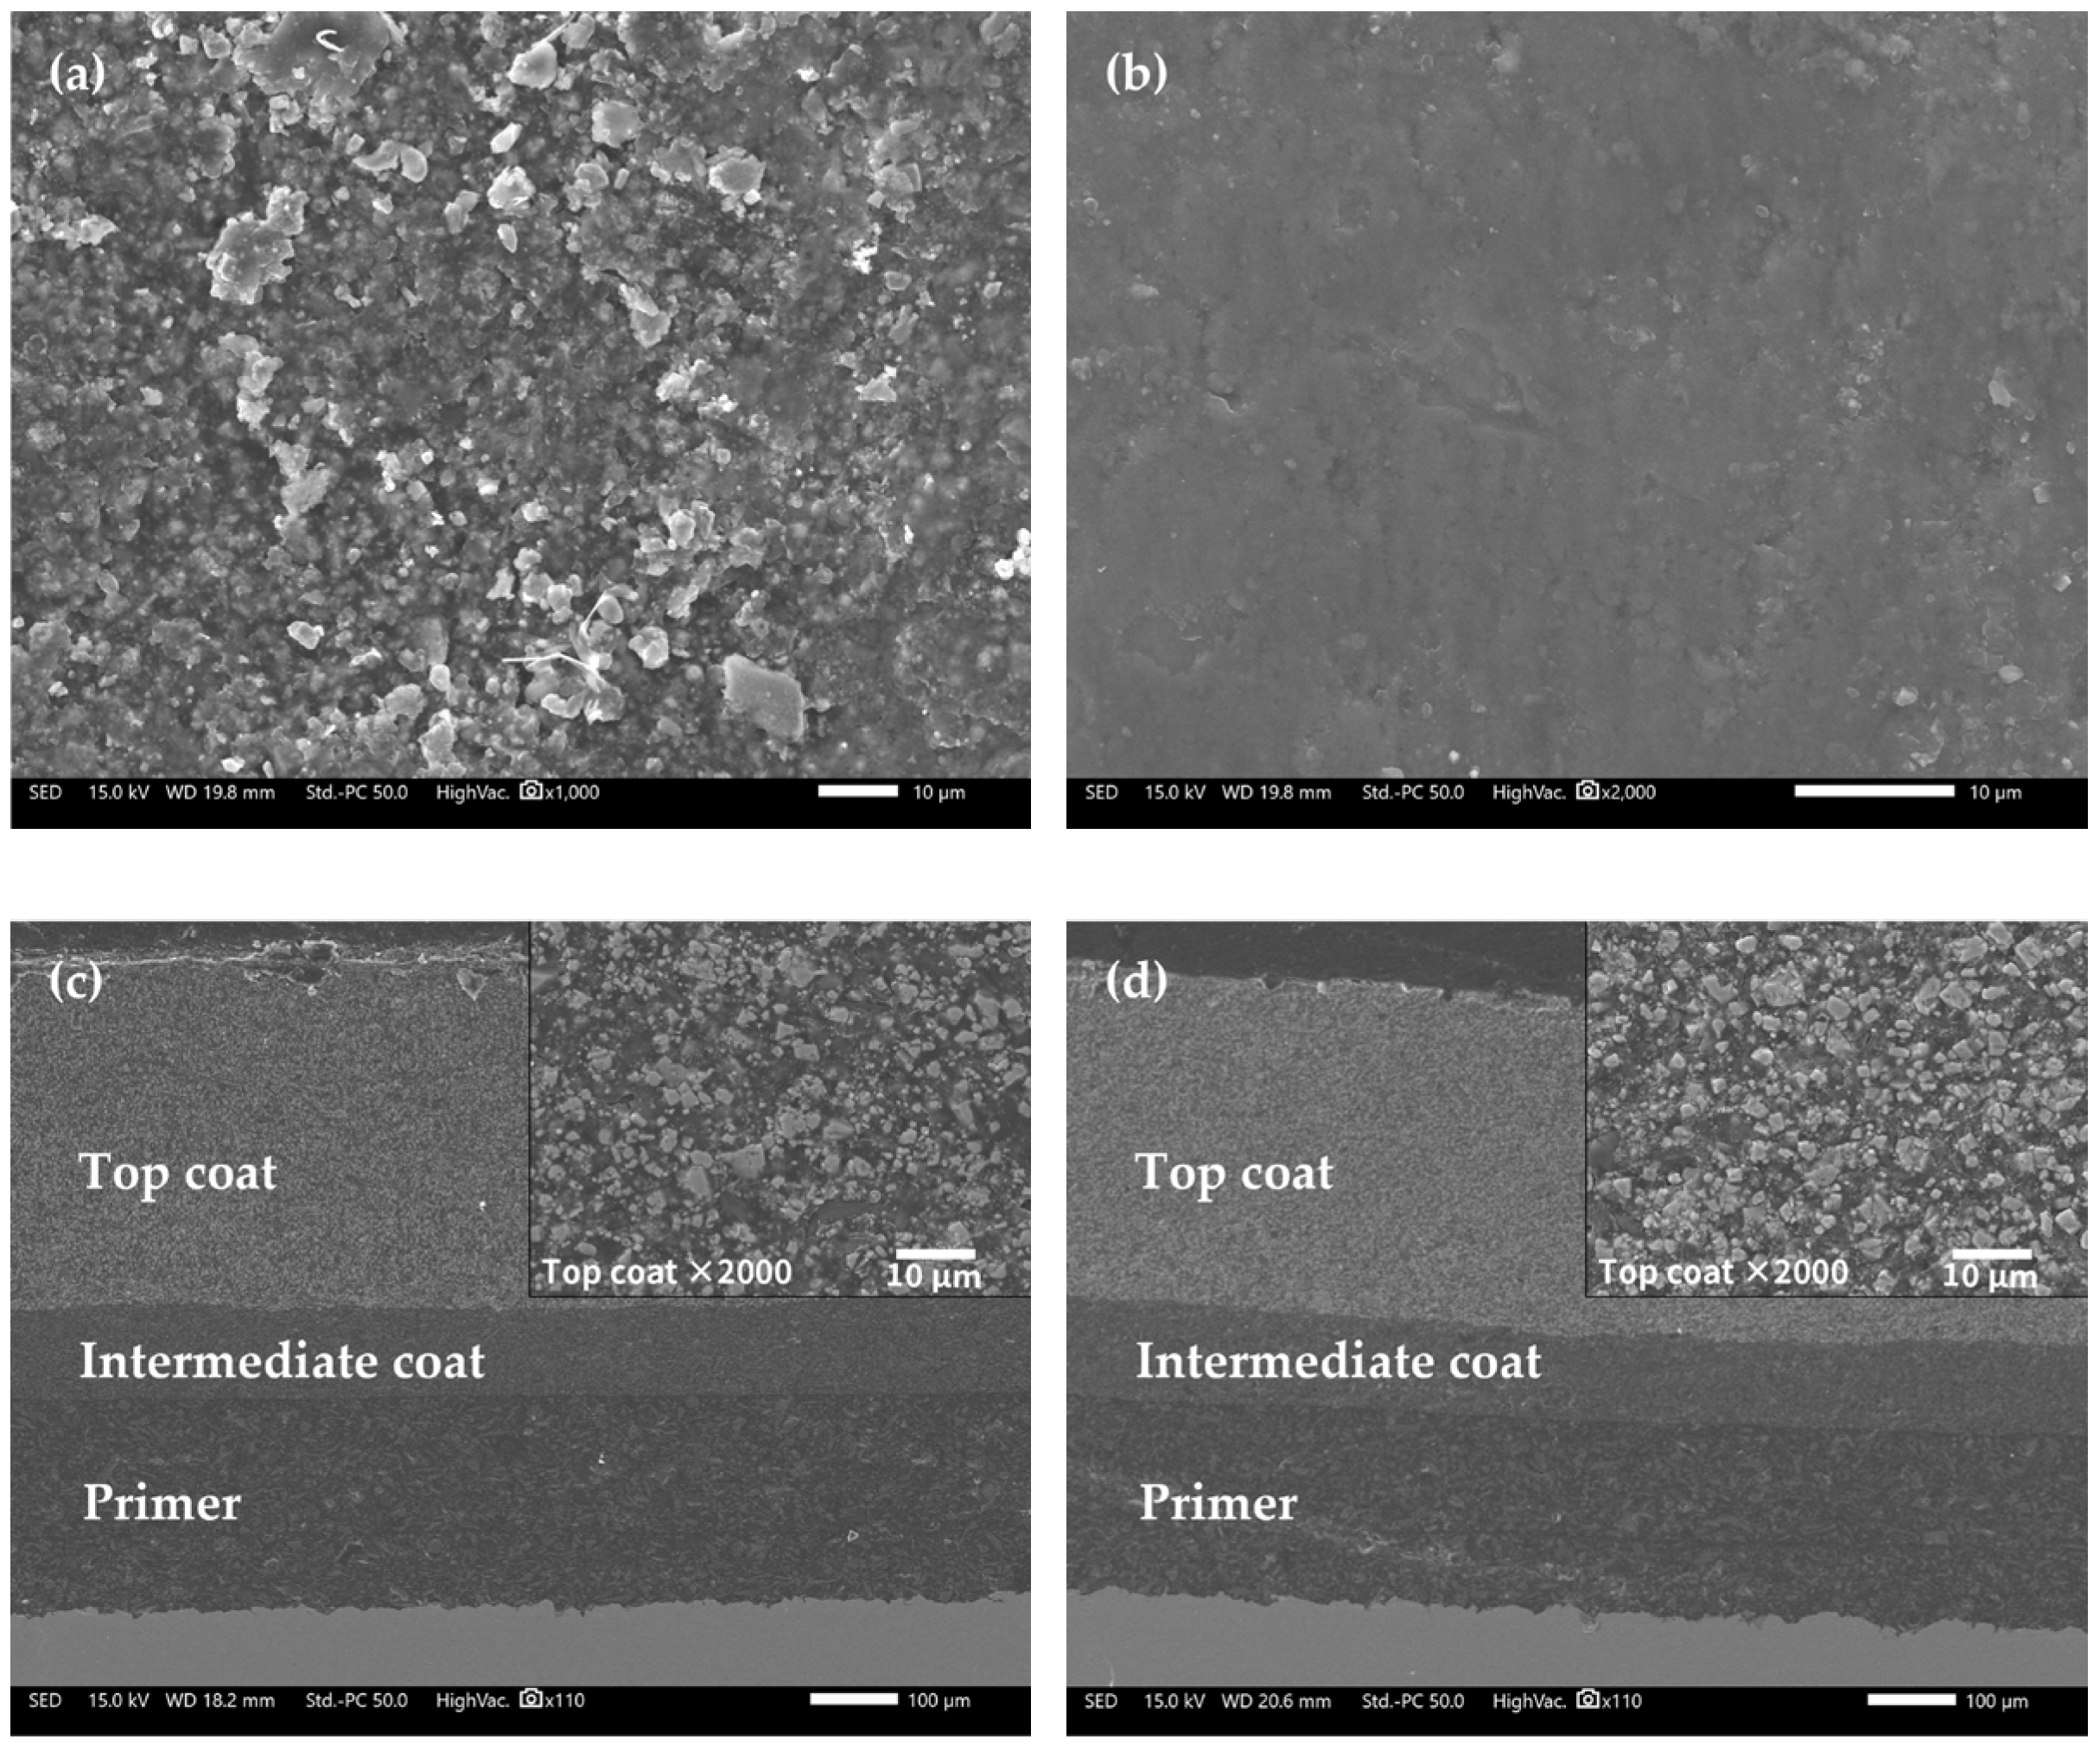
Figure 9 shows the microscopic morphologies of the FW-1 coating sample by SEM. Figure 9a presents the surface morphology of the FW-1 topcoat before immersion (0 day). The surface looks relatively rough, and many white particles of pigments can be observed. After immersion, the surface becomes smoother (Figure 9b), which may be related to the self-polishing effect of the antifouling topcoat. During the service process of self-polishing coatings, the hydrolyzed and removed groups are preferentially those from rough spots, this will provide a low surface roughness of the coating, often called the self-smoothing effect [1,5]. Figure 9c,d present the cross-sectional morphologies. The topcoat, intermediate coat and primer are all intact after 160 days of immersion. It also can be seen from the magnified view of the topcoat in the right corner that no obvious microscopic holes and cracks in it. This indicates that the FW-1 anti-corrosion and anti-fouling coating system has very good resistance to deterioration, which is consistent with the above EIS results, where the|Z|0.01 Hz still has a high value of 2 × 10⁹ Ω cm2 at 160 days, granting a very good shielding performance to the substrate.
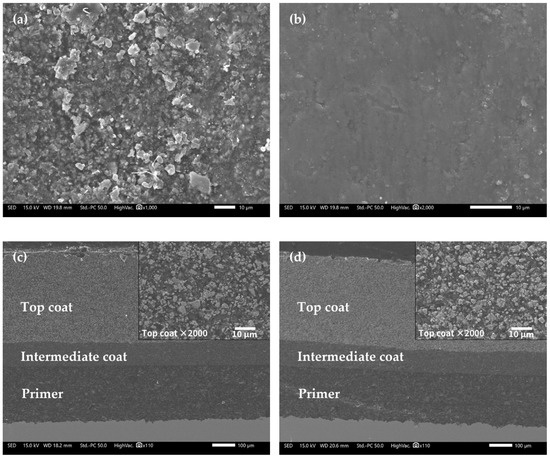
Figure 9.
SEM images of FW-1 sample: (a) 0 day, surface; (b) 160 days, surface; (c) 0 day, cross-section; (d) 160 days, cross-section.
EDS was performed on the surface and cross-section of the FW-1 topcoat to analyze the chemical elements. Table 4 shows the results of the surface analysis. Before immersion, the elemental content of Cu on the surface is 49.52 wt%; after 160 days of immersion, the content of Cu slightly decreases to 46.92 wt%, indicating that a small quantity of copper agents in the surface layer dissolve and leach out. In addition, the contents of Zn, Fe, Si, Mg, S and Ti elements decrease apparently, which may be due to the self-polishing effect of the coating, in which, along with the hydrolysis of the polymer binders, pigments such as Cu2O, ZnO, ZnS and MgSiO3 can be dissolved out of the coating [38,39].

Table 4.
EDS analysis results of the FW-1 topcoat surface for 0 day and 160 days testing.
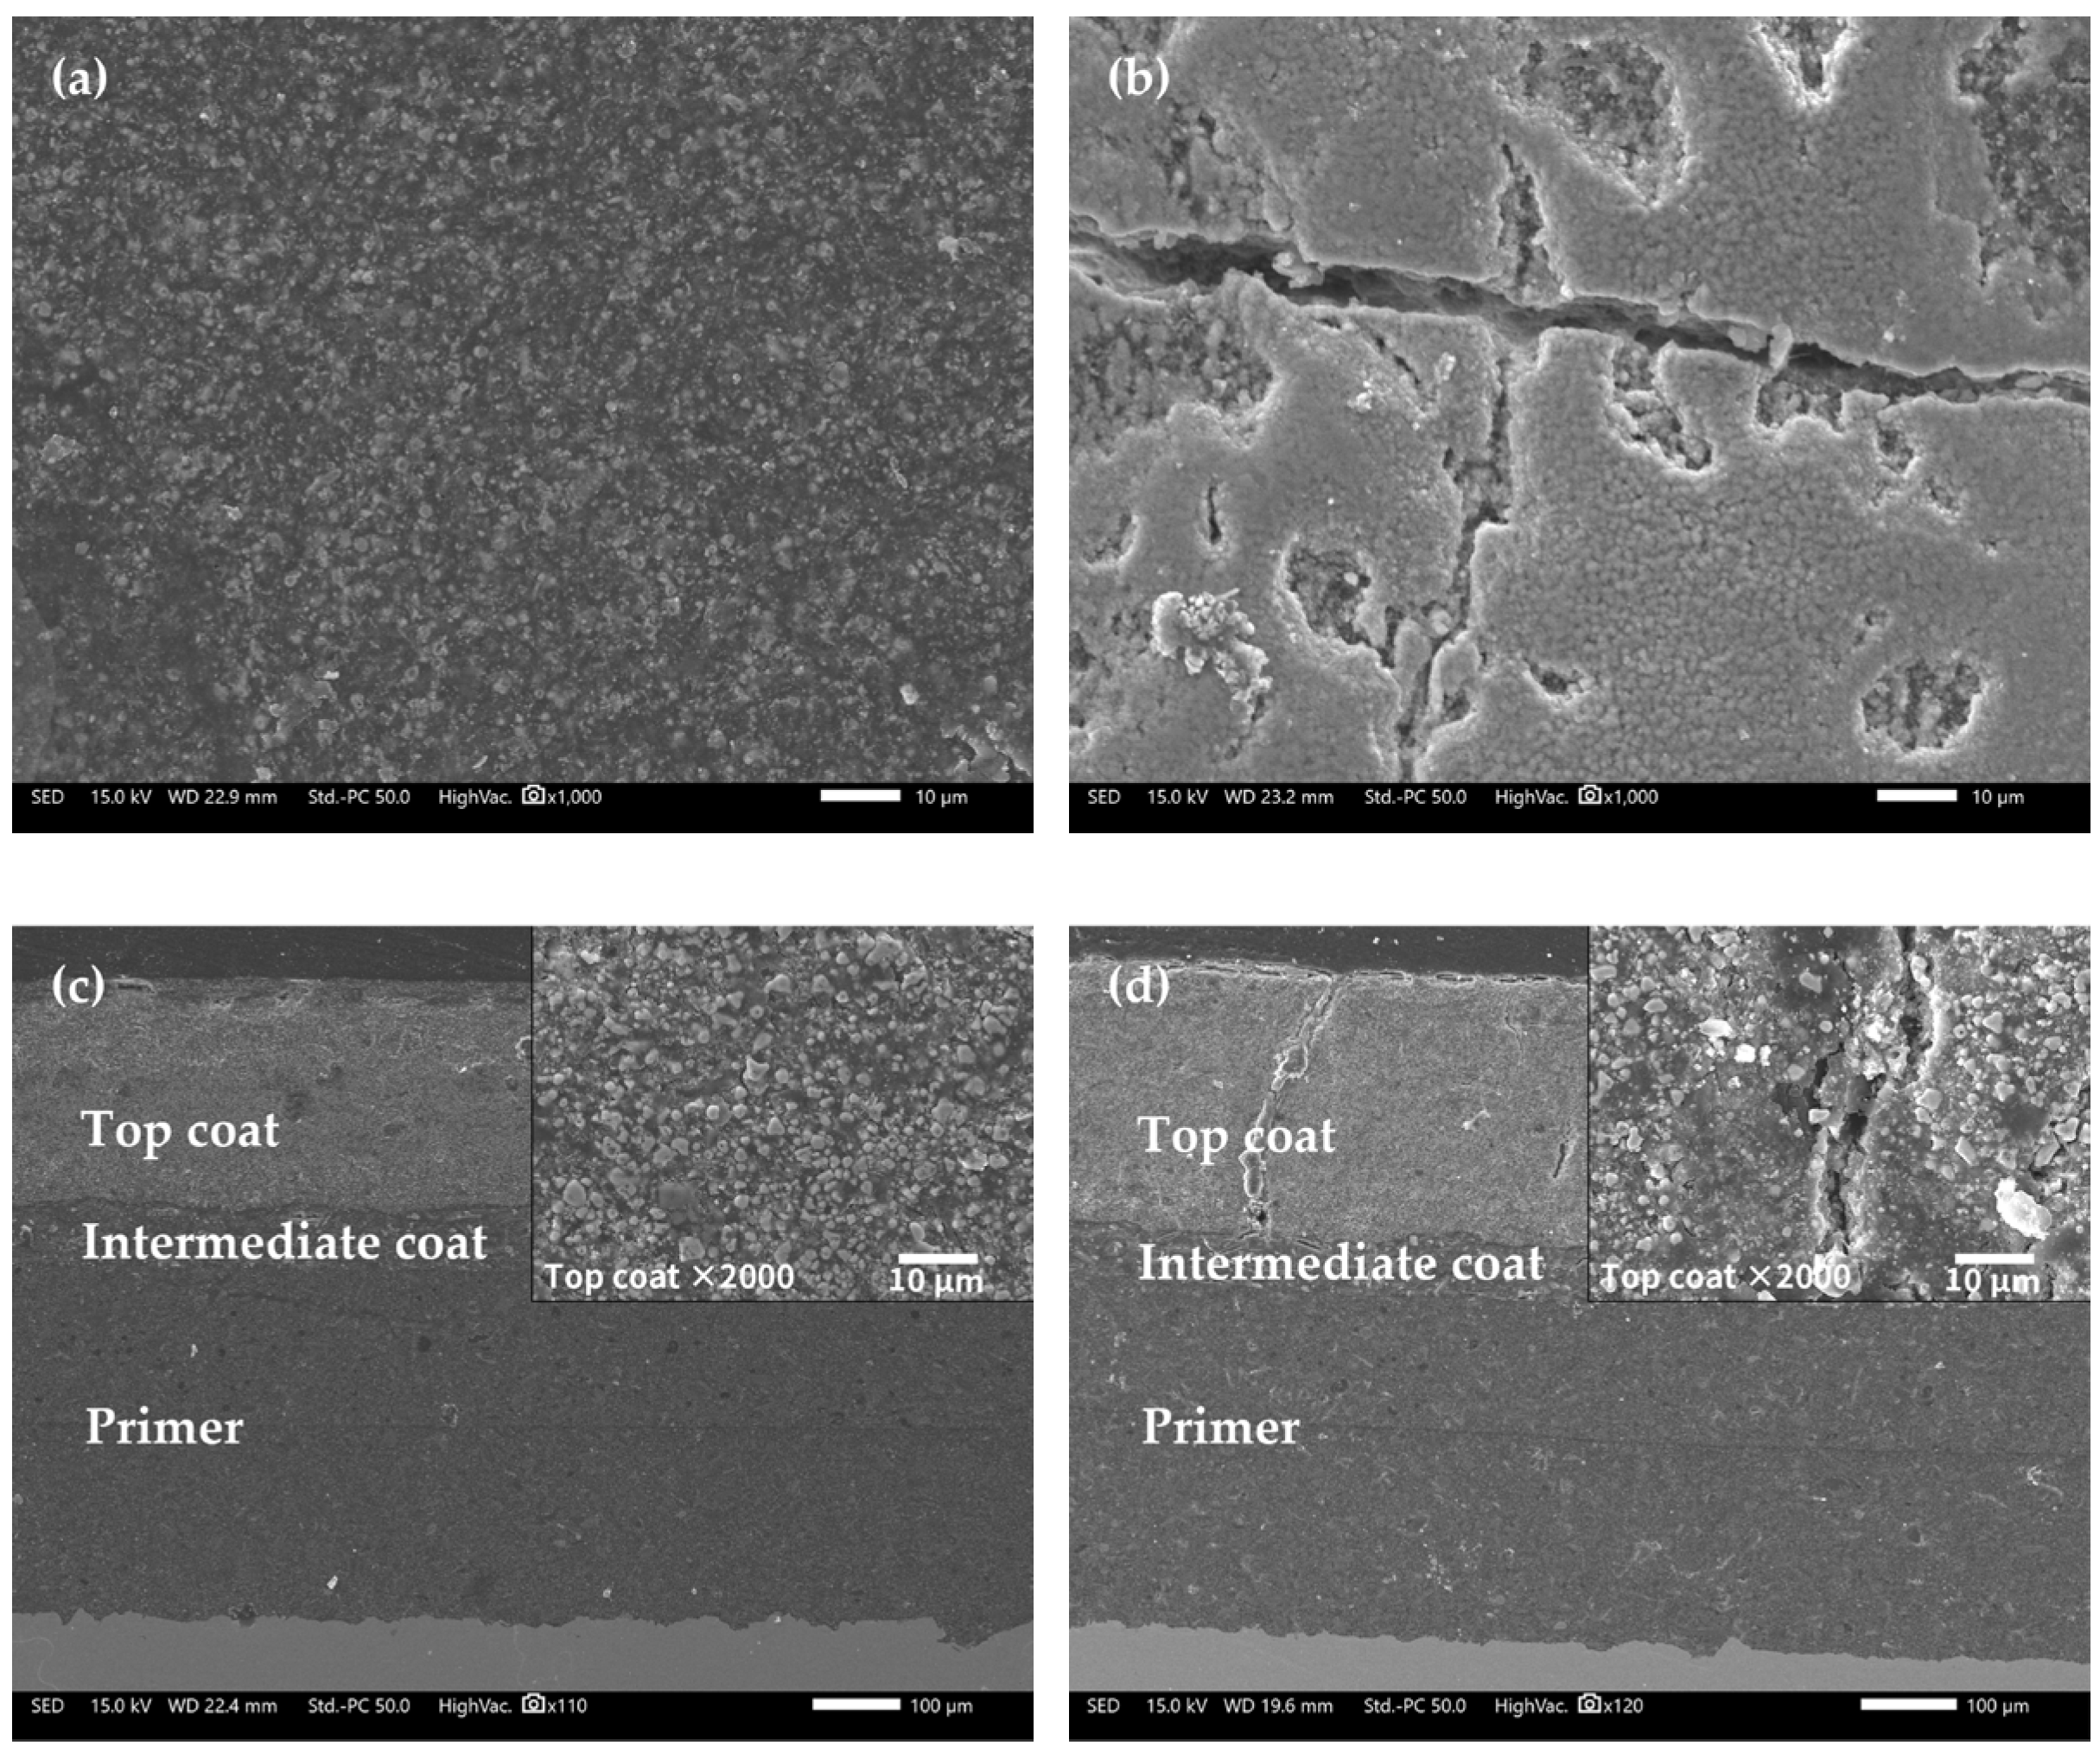
Figure 10 shows the microscopic morphologies of the FW-2 coating sample by SEM. Before immersion (0 d), the surface of the topcoat looks flat (Figure 10a). After immersion, some microscopic cracks and holes appear, in which the width of the cracks is about 2–5 µm and the diameter of holes is up to 10 µm. Usually, some pigments in anti-fouling coatings, such as Cu2O and ZnO, have diameters in the range of 1–3 µm [32,39,40]. These pigments have a certain solubility, which can undergo a dissolution reaction on contact with the aqueous solution in the coating and be released [32,33,41], producing microscopic pores in the coating. The occurrence of micro-cracks may be related to the high and low temperature cyclic immersion. Higher temperature accelerates the penetration of the solution in the coating and lower temperature slows down the penetration rate [42], which could promote the internal stress in the coating. If the flexibility of the coating is not good enough, the repeated heating and cooling effect will increase the internal stress of the coating; thus, micro-cracks are developed [34,43]. Figure 9c,d shows the cross-section morphologies of the coating. It is seen that the intermediate and primer coatings are still intact after 160 days of immersion, but a small number of micro-cracks in the topcoat have penetrated through the topcoat to the intermediate coat. This indicates that the shielding performance of the topcoat has been reduced while the intermediate coat and the primer may still provide barrier performance. The above impedance result shows that the |Z|0.01 Hz of the FW-2 coated sample is 8 × 10⁸ Ω cm2 after 160 days test, which manifests that the coating system has a good protection performance with respect to the substrate. Combine the SEM and EIS results, it seems that the whole protection performance of the coating system mainly depends on the primer and intermediate coats. However, the presence of micro-cracks throughout the topcoat can cause a decrease in the shielding performance of the anti-corrosion and antifouling coating systems. This can be manifested from the decrease in the low-frequency impedances of the FW-1 and FW-2 coating samples.
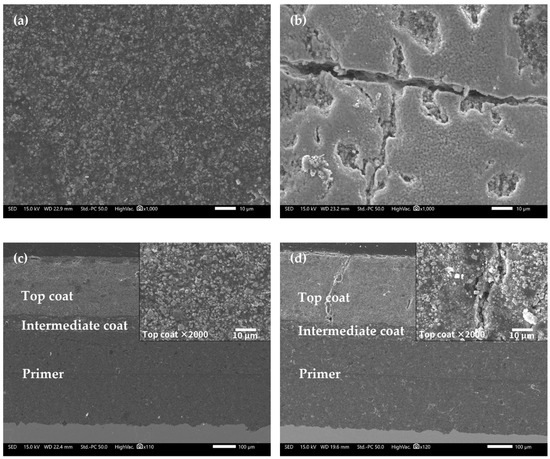
Figure 10.
SEM images of FW-2 sample: (a) 0 day, surface; (b) 160 days, surface; (c) 0 day, cross-section; (d) 160 days, cross-section.
Table 5 shows the EDS analysis results of the surface of the FW-2 coating. Before immersion, the Cu element content in the surface of the FW-1 topcoat is 37.55 wt%, which is lower than that in the FW-1 topcoat. Similar to the FW-1 coating sample, after immersion, the contents of elements Zn, Si, Fe, S and Al decrease, which may be due to the self-polishing effect of zinc acrylic copolymer. With the hydrolysis of the polymer, the pigments with a certain solubility are dissolved out of the coating, leaving more Cu2O particles exposed. It is noted that there is a slight increase in the Cu element content; this may be associated with the occurrence of micro-cracks and holes on the surface, as shown in Figure 9b. The Cu ions released from the outer layer of the topcoat might be prone to deposit in these micro defects, which can be seen in Figure 4c,d. This is probably the reason for the increase in the Cu content after immersion for some time.

Table 5.
EDS analysis results of the FW-2 topcoat surface for 0 day and 160 days testing.
3.3. Copper Ion Release from Two Anti-Fouling and Anti-Corrosion Coating Samples
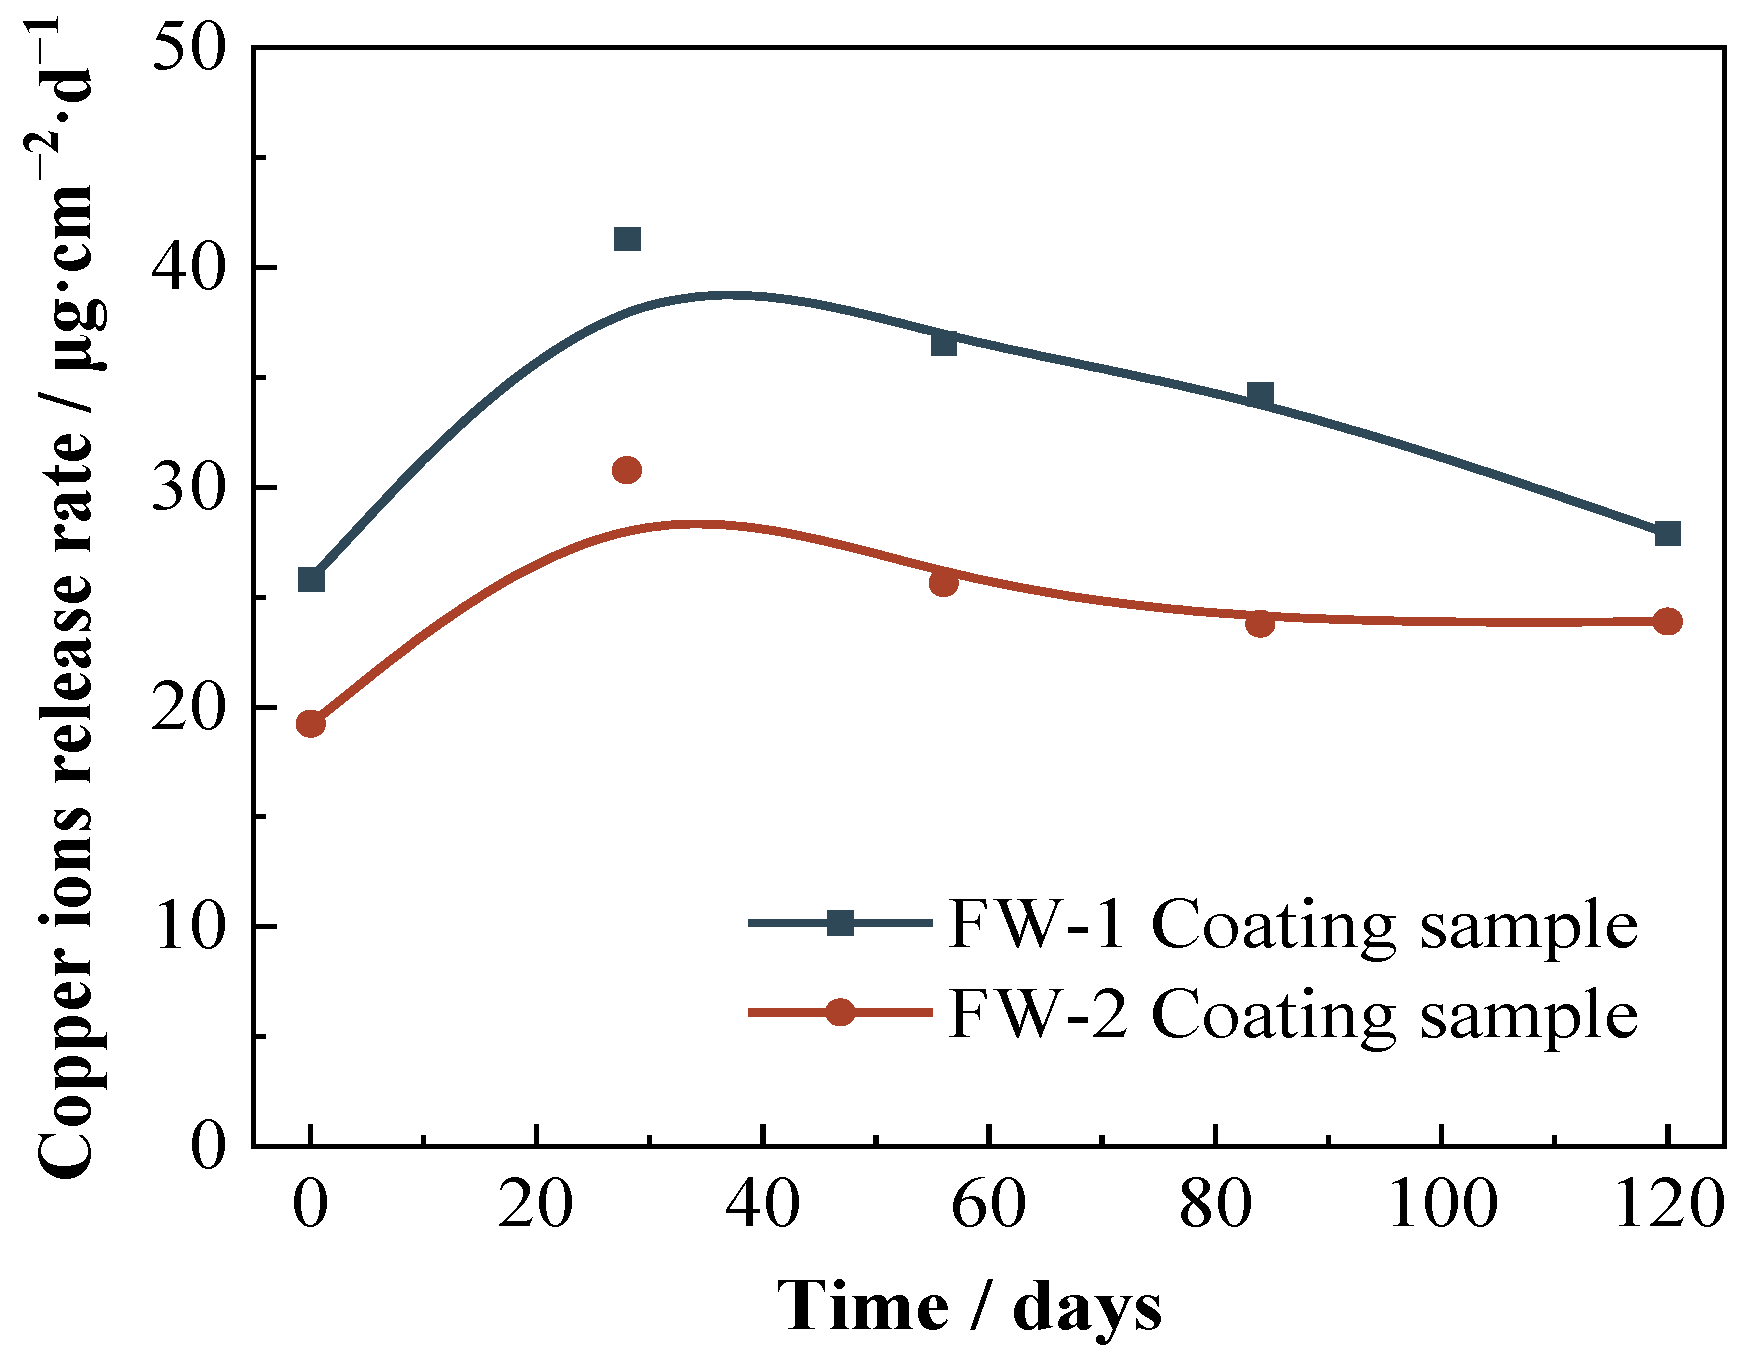
The results of the copper release rate from the two anti-fouling topcoats by IC-MS methods are shown in Figure 11. The initial copper release rate of FW-1 sample is 25.82 μg·cm−2·d−1, and 19.23 μg·cm−2·d−1 for the FW-2 sample. The higher copper release rate of the FW-1 topcoat means a better antifouling effect, which is consistent with the higher copper content of the FW-1 topcoat in the above EDS test. As the immersion continues, more electrolyte diffuses into the interior of the coating, loosening the internal structure and exacerbating the release of Cu2O [44], thereby increasing the copper release rate to a maximum. Then, with the consumption of Cu2O, the release rate gradually decreases and eventually tends to be steady. At 120 days, the copper release rate for the FW-1 and FW-2 samples is 27.90 μg·cm−2·d−1 and 23.88 μg·cm−2·d−1, respectively, which is higher than the critical leaching rate (10–15 μg·cm−2·d−1) reported in the previous literature [45]. This indicates that the antifouling topcoats still provide a good antifouling effect.
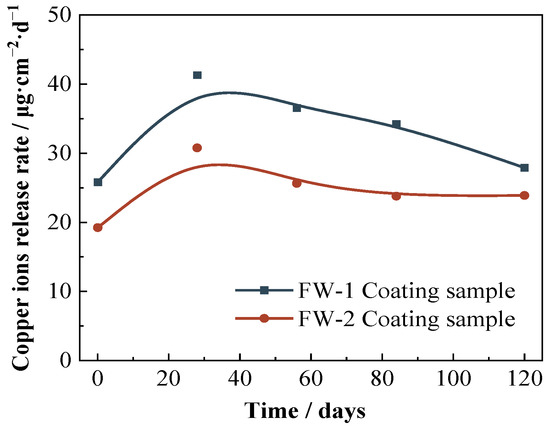
Figure 11.
Copper ions release rate curves of two coating samples.
3.4. Glossiness and Color Difference Analysis of Two Coating Samples
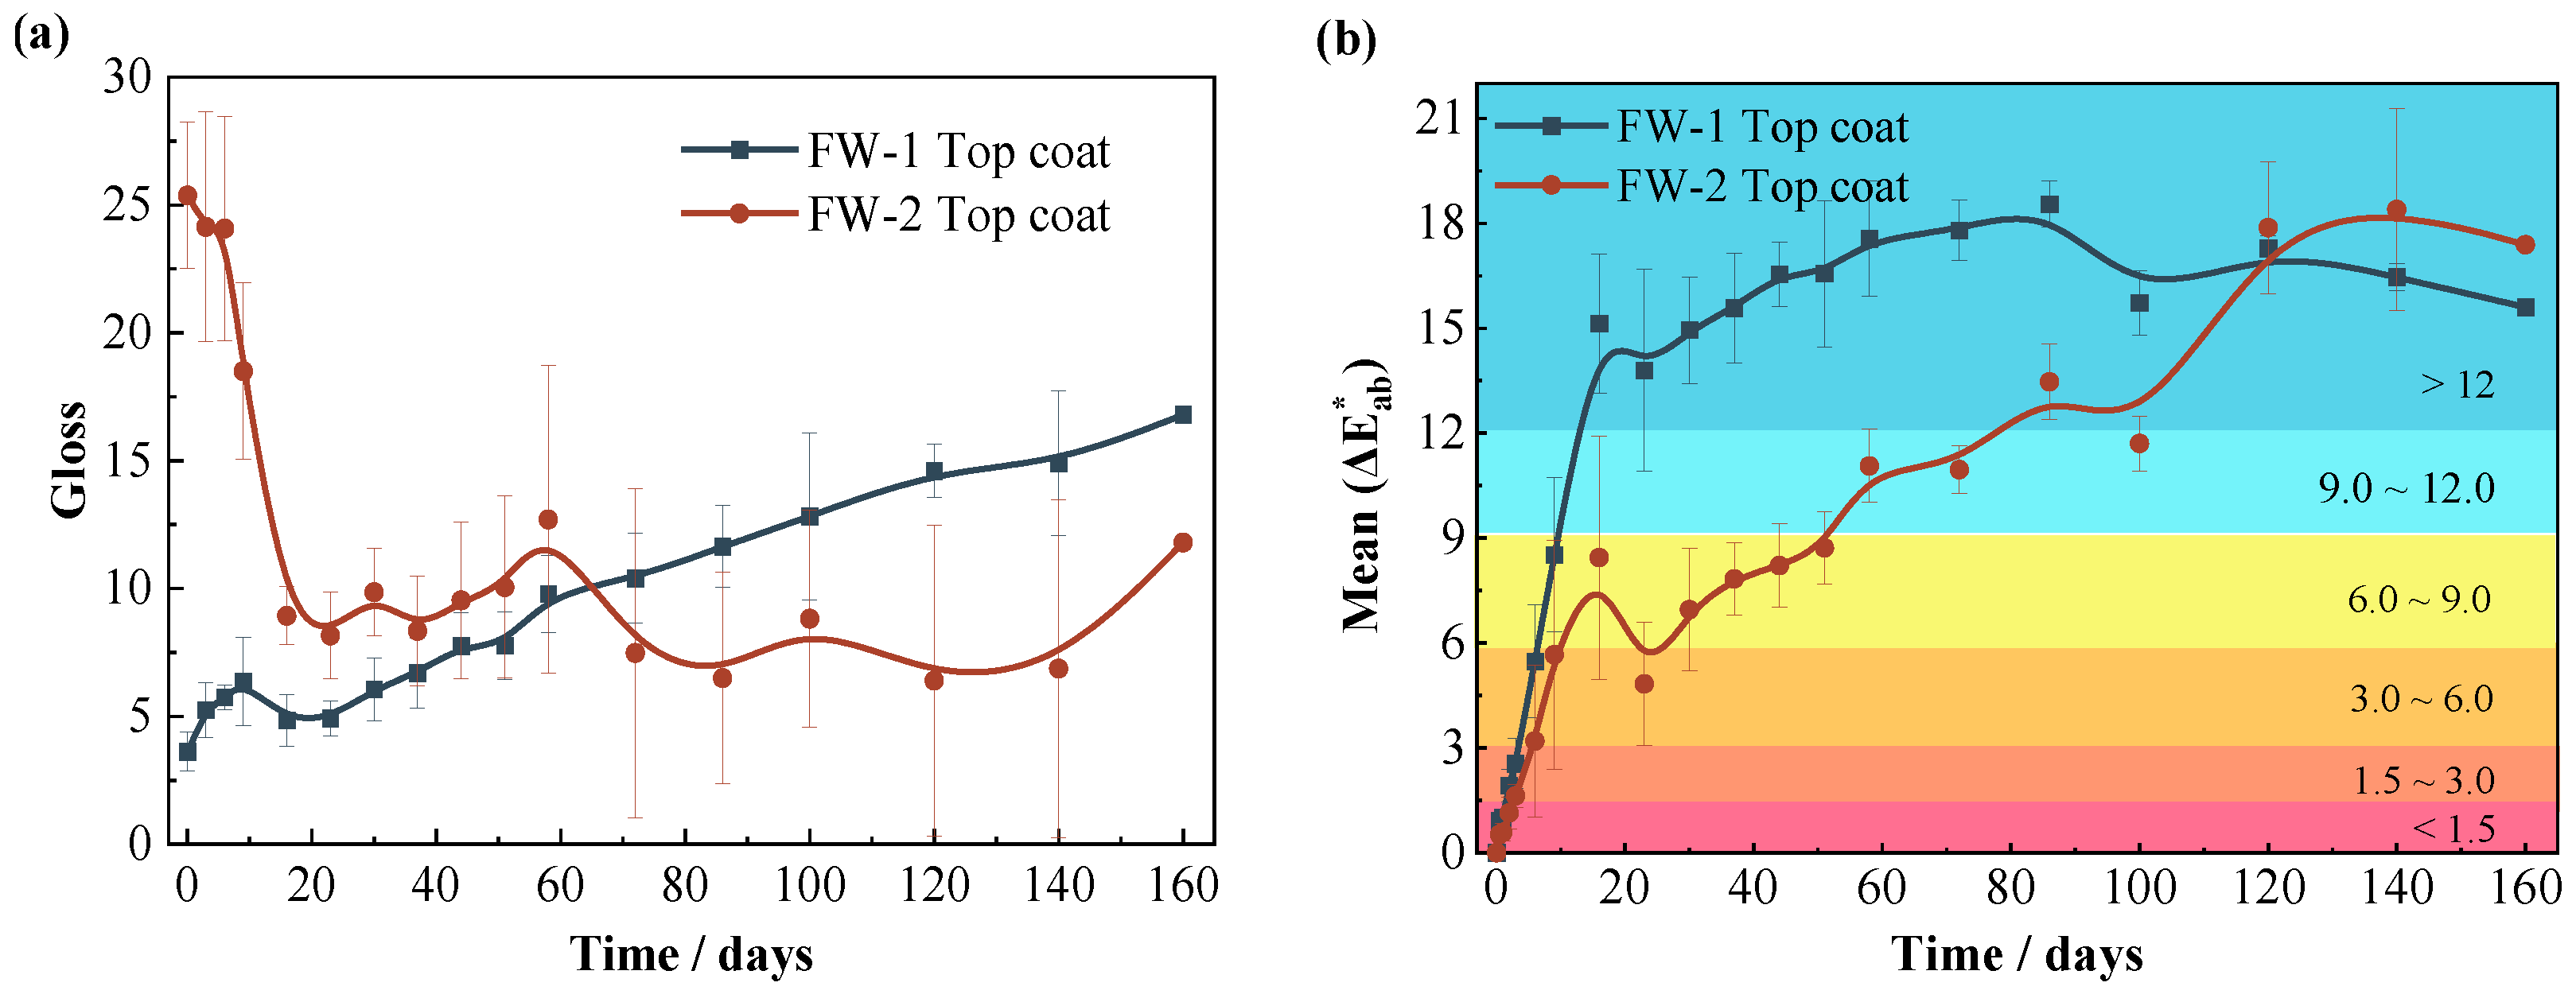
Figure 12a demonstrates the gloss results for two coating samples. The initial value of gloss for the FW-1 coating is 3.6 and then shows a gradually increasing trend with time. Usually, the gloss is closely related to the surface roughness of the coating. The coating with a lower surface roughness cannot absorb and scatter visible light efficiently; hence, it has a larger gloss value [46]. The above SEM results (Figure 9a,b) show that the FW-1 coating surface has a relatively rough micro morphology at first, and after immersion for a while the coating surface becomes more smoother on account of the self-polishing effect; therefore, the gloss value is increased. The initial gloss value of the FW-2 coating is 25.3; and with immersion time extended, the gloss drops quickly to 9 at 15 days, and then fluctuates in the range of 7 to 10. The SEM morphology shows that the surface of the FW-2 coating is smooth at the beginning, but as the solution diffuses, and especially under the cyclic high and low temperature action, some micro-cracks and tiny holes soon appear on the surface of the coating. This can be seen in Figure 4b, which shows via digital video microscope that microcracks had appeared on the coating surface after 20 days of test. These micro-cracks and holes cause an increase in the surface roughness and lead to a rapid drop in gloss [46,47,48,49]. The gloss of the FW-2 coating does not change much after 20 days of immersion, which is consistent with the surface micromorphology change in Figure 4. As shown in Figure 5, the area percentage of the micro-cracks and holes on the surface of the FW-2 coating, attained by a statistic analysis, does not change too much after 20 days of immersion. Probably, the roughness of the coating changes very little in that stage.
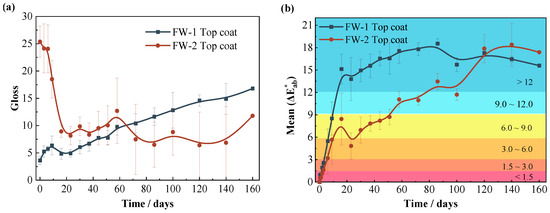
Figure 12.
Variations of (a) gloss and (b) color difference of two coating samples.
Figure 12b demonstrates the color difference results of the two coating samples. For both coatings, the value of color difference shows a rapid increase in the initial stage (0–16 days), which is probably due to the rapid diffusion of the solution into the topcoat at the beginning, leading to the dissolution and release of Cu2O in the outmost layer, and resulting in the change of color from red to green. The color difference of the FW-1 coating changes relatively more quickly, and the value of the color difference reaches up to the “serious discoloration” level () at 14 days, while the value of the color difference for the FW-2 coating is on the level of “obvious discoloration” () at 14 days. This is consistent with the results in Figure 11 in which the copper release rate of the FW-1 coating is higher than that of the FW-2 coating because the copper release causes a change in the coating color. In the later stage, the color difference of the FW-1 coating gradually tends to be steady, while the value of the FW-2 coating presents an increasing trend, higher than that of the FW-1 coating. Combined with the above photo results (Figure 1, Figure 2, Figure 3 and Figure 4), under the cyclic high and low temperature immersion condition, and after the micro-cracks and holes have appeared on the surface of the coating, the dissolved cuprous oxide pigments tend to deposit and accumulate around these micro defects, causing a continuous change in the color of the coating. Therefore, for anti-fouling coatings, the test of the color difference is not only related to the change of color due to the coating deterioration; it can also, to a certain extent, reflect the release of antifouling agents.
3.5. Adhesion Test Results of Two Coating Samples
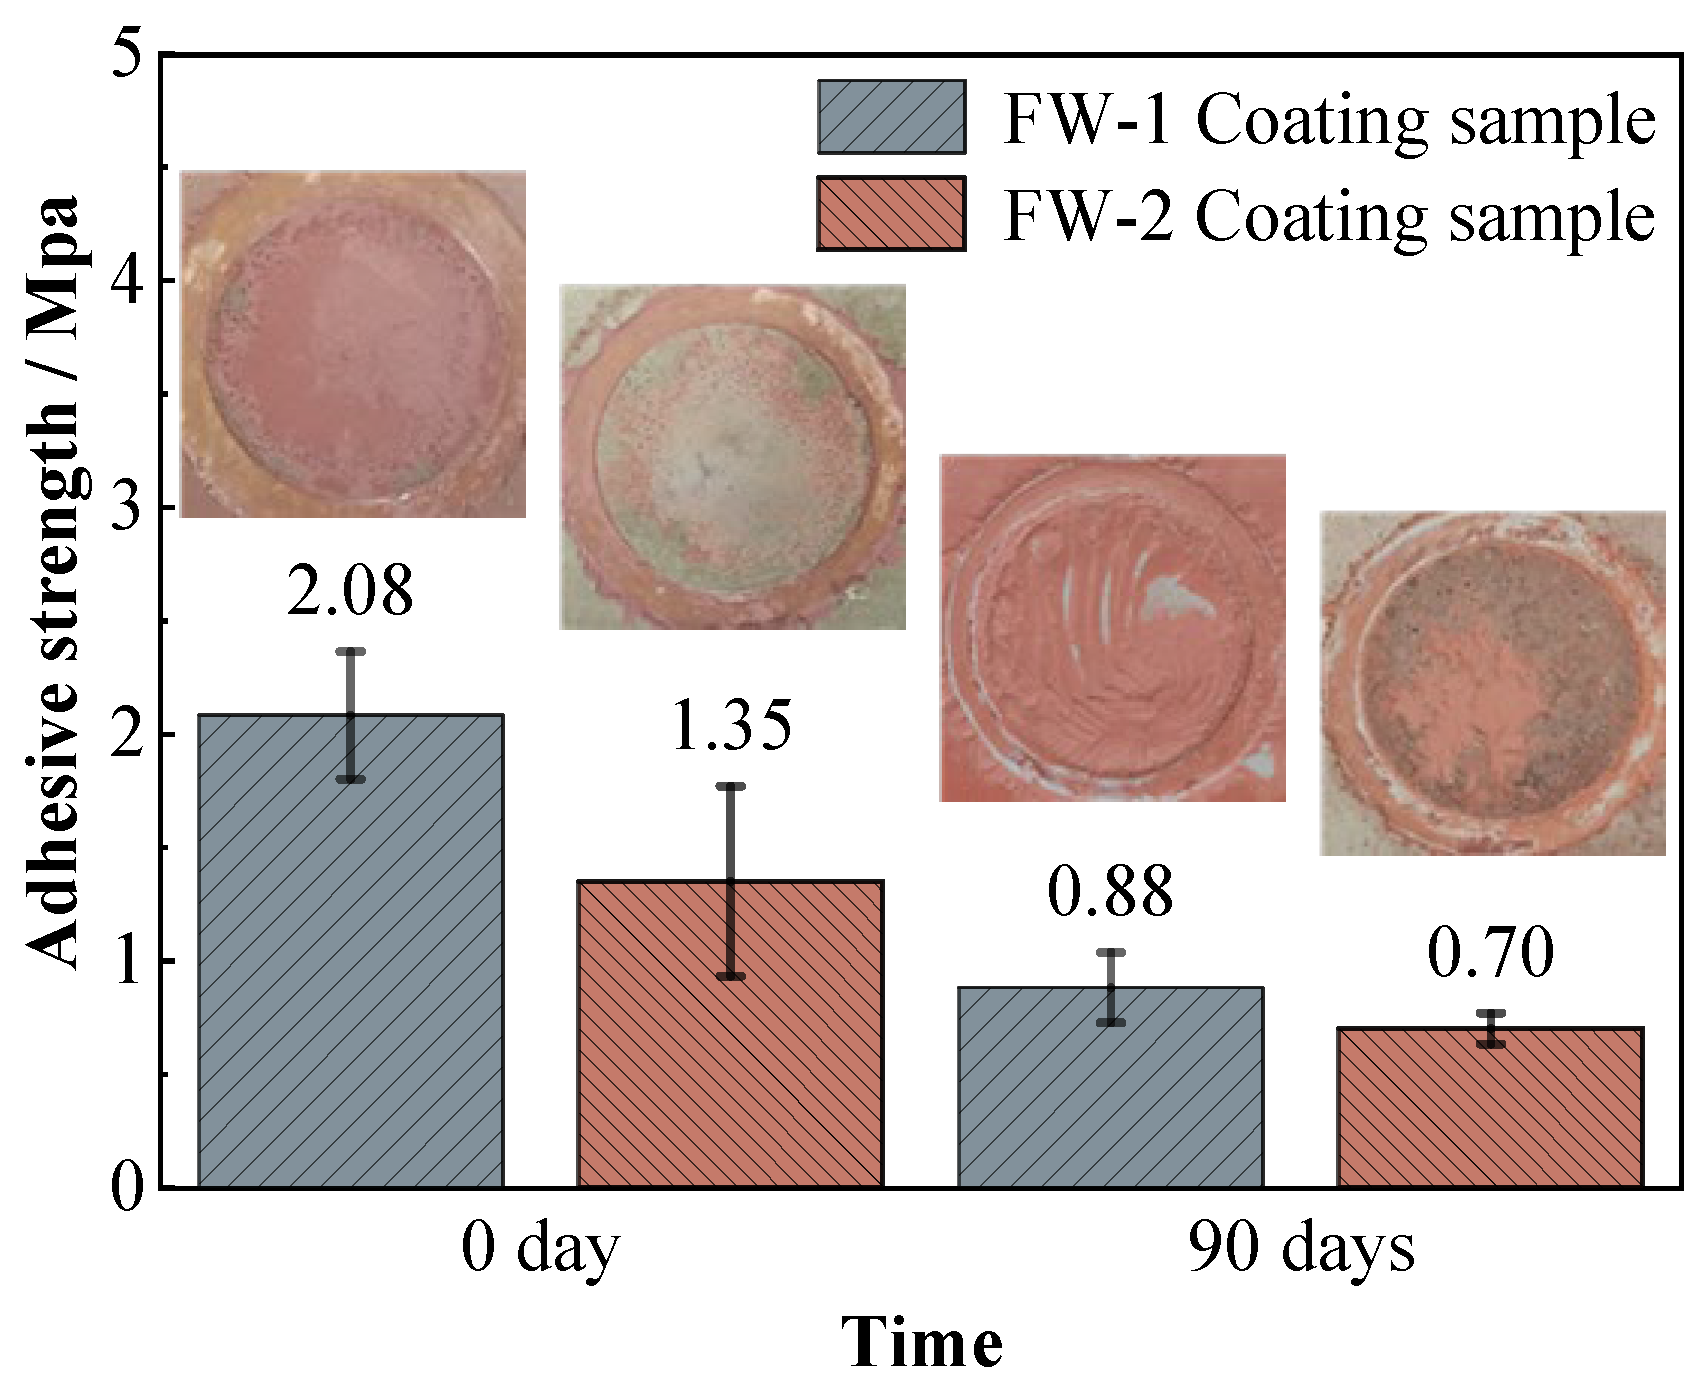
Figure 13 shows the adhesion strength of the two coating systems on the steel substrate before and after immersion. For the FW-1 coating, the initial value of the adhesion strength is 2.08 MPa, and after 90 days of immersion it decreases to 0.88 MPa. For the FW-2 coating, the initial value is 1.35 MPa, and after 90 days of immersion it decreases to 0.70 MPa. The photos of the sample surfaces after the pull-off tests are also shown in Figure 13, which demonstrate that the damage pattens of the two coating samples are mainly due to the cohesive failure in the topcoat. These are probably due to the self-polishing effect of the antifouling topcoat, in which the micro structure of the outermost layers become relatively loose after hydrolysis reaction and is therefore easily peeled off from the inner-layer of the topcoat. The adhesion strength of the FW-1 coating is higher than that of the FW-2 coating, which is in agreement with the above results concerning morphologies and the gloss test. In some studies, it is mentioned that the coatings, owning better flexibility, show higher adhesion [18,44], and that a close link might exist between the internal stresses development and the loss of adhesion from a pre-existing defect [43]. The above results show that after a period of test, some micro-cracks and tiny holes appear on the surface of the FW-2 topcoat, which causes the roughness to rise and the gloss to drop. These might have a relationship with the relatively lower flexibility of the coating and the internal stress caused by the high and low temperature immersion environment. During the adhesion test, there was no delamination occurring to the intermediate coat and primer of both coating systems, indicating that the intermediate paint and primers are still in good condition, which is also consistent with the above EIS and SEM results. The coatings with higher adhesive strength would provide better protection to the metallic substrates [50].
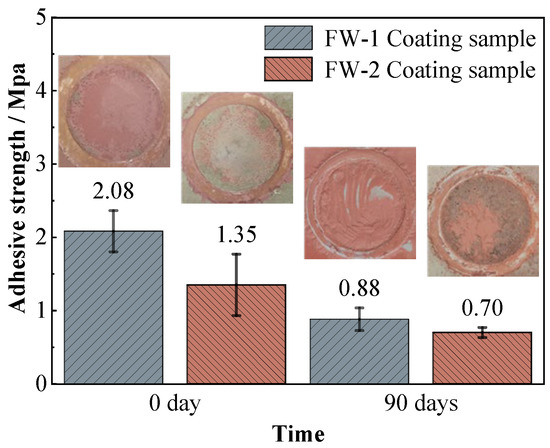
Figure 13.
Adhesion results of two coating samples before and after the immersion test.
4. Conclusions
For the two anti-corrosion and anti-fouling coating samples in the diurnal temperature difference immersion process (3.5% NaCl, 35 °C 12 h + 25 °C 12 h), the Cu ions release rate of both topcoats is higher than the critical value, producing a good antifouling effect. After the hydrolysis reaction, the surface micro-morphology of the FW-1 self-polishing topcoat changes from rough to smooth, thereby gradually increasing the gloss. During the alternating high and low temperature immersion, some micro-cracks and holes appear on the FW-2 self-polishing topcoat, leading to a decrease in the coating gloss. After 160 days of test, the low-frequency impedance modulus (|Z|0.01 Hz) of both coating samples remains higher than 8 × 10⁸ Ω cm2, presenting a very good shielding performance to the steel substrate. The hydrolysis and dissolution of the topcoat have no big influence on the protection performance of the whole coating system, which depends more on the integrality of the primer and intermediate coat. The color difference is not only related to the change of color due to the coating deterioration; it can also, to a certain extent, reflect the release of antifouling agents. As the copper ions are released, the color difference of the topcoat increases.
Author Contributions
Methodology, X.Z. and Y.Z.; Formal analysis, Y.C.; Investigation, H.Z. and F.K.; Writing—original draft, H.Z. and F.K.; Writing—review & editing, X.Z., Y.T. and Y.Z.; Supervision, Y.T. All authors have read and agreed to the published version of the manuscript.
Funding
This research received no external funding.
Institutional Review Board Statement
Not applicable.
Informed Consent Statement
Not applicable.
Data Availability Statement
Not applicable.
Conflicts of Interest
The authors declare no conflict of interest.
References
- Yebra, D.M.; Kiil, S.; Dam-Johansen, K. Antifouling technology—Past, present and future steps towards efficient and environmentally friendly antifouling coatings. Prog. Org. Coat. 2004, 50, 75–104. [Google Scholar] [CrossRef]
- An, X.L.; Dong, W.J.; Yang, X.C.; Li, X.; Yv, L.M.; Ni, C.H. Research progress of new tin-free self-polishing marine antifouling coatings. Mater. Res. Appl. 2021, 15, 423–431. (In Chinese) [Google Scholar]
- Coneski, P.N.; Weise, N.K.; Fulmer, P.A.; Wynne, J.H. Development and evaluation of self-polishing urethane coatings with tethered quaternary ammonium biocides. Prog. Org. Coat. 2013, 76, 1376–1386. [Google Scholar] [CrossRef]
- Ma, S.N.; Zhang, Z.P. Development status and trend of antifouling coating technology for ships. China Surf. Eng. 2009, 22, 19–23+35. (In Chinese) [Google Scholar] [CrossRef]
- Xie, L.Y.; Hong, F.; Liu, J.H.; Zhang, G.Z.; Wu, Q. Comprehensive design and research of marine antifouling polymer materials. Acta Polym. Sin. 2012, 1, 1–13. [Google Scholar] [CrossRef]
- Tian, J.; Xu, K.; Hu, J.; Zhang, S.; Cao, G.; Shao, G. Durable self-polishing antifouling Cu-Ti coating by a micron-scale Cu/Ti laminated microstructure design. J. Mater. Sci. Technol. 2021, 79, 62–74. [Google Scholar] [CrossRef]
- Wang, X.J.; Yv, X.Y.; Cong, W.W.; Zhang, K.; Zhang, Q.H.; Lu, Z.; Wang, Z.H.; Gui, T.J. Research status of tin-free self-polishing antifouling coatings. China Coat. 2021, 36, 1–4. (In Chinese) [Google Scholar] [CrossRef]
- Margarit-Mattos, I.C.P. EIS and organic coatings performance: Revisiting some key points. Electrochim. Acta 2020, 354, 136725. [Google Scholar] [CrossRef]
- Jamali, S.S.; Mokhtarian, P.; Mills, D.J. A probabilistic model for estimation of ionically permeable inhomogeneities in polymer coatings. Prog. Org. Coat. 2015, 87, 20–27. [Google Scholar] [CrossRef]
- Zhang, J.T.; Hu, J.M.; Zhang, J.Q.; Cao, C.N. Studies of impedance models and water transport behaviors of polypropylene coated metals in NaCl solution. Prog. Org. Coat. 2004, 49, 293–301. [Google Scholar] [CrossRef]
- Cao, J.Y.; Zhang, H.L.; Zhang, F.; Quan, L.; Tang, Y.M. Study on seawater corrosion behavior of 5083 aluminum alloy with different antifouling coatings. Equip. Environ. Eng. 2016, 13, 28–34. (In Chinese) [Google Scholar] [CrossRef]
- Thomas, K.A.; Nair, S.; Rajeswari, R.; Ramesh kumar, A.V.; Natarajan, V.; Mukundan, T.; John, R. Electrochemical behaviour of PANi/polyurethane antifouling coating in salt water studied by electrochemical impedance spectroscopy. Prog. Org. Coat. 2015, 89, 267–270. [Google Scholar] [CrossRef]
- Peres, R.S.; Armelin, E.; Moreno-Martínez, J.A.; Alemán, C.; Ferreira, C.A. Transport and antifouling properties of papain-based antifouling coatings. Appl. Surf. Sci. 2015, 341, 75–85. [Google Scholar] [CrossRef]
- Peres, R.S.; Zmozinski, A.V.; Moreno-Martínez, J.A.; Armelin, E.; Alemán, C.; Ferreira, C.A. Influence of pH in the synthesis of ferric tannate pigment for application in antifouling coatings. J. Coat. Technol. Res. 2017, 14, 945–953. [Google Scholar] [CrossRef]
- Zhu, B.; Liu, Z.; Liu, J.; Yang, Y.; Meng, Y.; Yu, F.; Jiang, L.; Wei, G.; Zhang, Z. Preparation of fluorinated/silanized polyacrylates amphiphilic polymers and their anticorrosion and antifouling performance. Prog. Org. Coat. 2020, 140, 105510. [Google Scholar] [CrossRef]
- Kharchenko, U.; Beleneva, I.; Karpov, V. Antifouling and anticorrosion potential of Pseudoalteromonas piscicida extract. J. Coat. Technol. Res. 2020, 17, 887–896. [Google Scholar] [CrossRef]
- El Saeed, A.M.; Abd El-Fattah, M.; Azzam, A.M.; Dardir, M.M.; Bader, M.M. Synthesis of cuprous oxide epoxy nanocomposite as an environmentally antimicrobial coating. Int. J. Biol. Macromol 2016, 89, 190–197. [Google Scholar] [CrossRef]
- Chen, Y.; Zhang, G.; Zhang, G.; Ma, C. Rapid curing and self-stratifying lacquer coating with antifouling and anticorrosive properties. Chem. Eng. J. 2021, 421, 129755. [Google Scholar] [CrossRef]
- Fazli-Shokouhi, S.; Nasirpouri, F.; Khatamian, M. Polyaniline-modified graphene oxide nanocomposites in epoxy coatings for enhancing the anticorrosion and antifouling properties. J. Coat. Technol. Res. 2019, 16, 983–997. [Google Scholar] [CrossRef]
- Cerchier, P.; Pezzato, L.; Gennari, C.; Moschin, E.; Moro, I.; Dabalà, M. PEO coating containing copper: A promising anticorrosive and antifouling coating for seawater application of AA 7075. Surf. Coat. Technol. 2020, 393, 125774. [Google Scholar] [CrossRef]
- GB/T 9754–2007; Paints and Varnishes—Determination of Specular Gloss of Non–Metallic Paint Films at 20°, 60° and 85°. Standardization Administration of the People’s Republic of China: Beijing, China, 2007.
- GB/T 11186.2–1989; Methods for Measuring the Colour of Paint Films—Part 2: Colour Measurement. The State Bureau of Quality and Technical Supervision: Beijing, China, 1989.
- GB/T 11186.3–1989; Methods for Measuring the Colour of Paint Films—Part 3: Calculation of Colour Differences. The State Bureau of Quality and Technical Supervision: Beijing, China, 1989.
- GB/T 6824–2008; Determination for Release Rate of Cupper–Ion for Antifouling Paint on Ship Bottom. Standardization Administration of the People’s Republic of China: Beijing, China, 2008.
- GB/T5210–2006; Paints and Varnishes—Pull-Off Test for Adhesion. Standardization Administration of the People’s Republic of China: Beijing, China, 2006.
- Fu, T.; Tang, X.B.; Cai, Y.; Zuo, Y.; Tang, Y.M.; Zhao, X.H. Correlation research of phase angle variation and coating performance by means of Pearson’s correlation coefficient. Prog. Org. Coat. 2020, 139, 105459. [Google Scholar] [CrossRef]
- Cao, J.Y.; Yang, J.H.; Fu, T.; Zhang, H.L.; Zhao, X.H.; Tang, Y.M.; Zuo, Y. Failure process comparison of two antifouling coatings containing cuprous oxide and organic antifouling agent. China Surf. Eng. 2019, 32, 105–112. (In Chinese) [Google Scholar] [CrossRef]
- Faÿ, F.; Horel, G.; Linossier, I.; Vallée-Réhel, K. Effect of biocidal coatings on microfouling: In vitro and in situ results. Prog. Org. Coat. 2018, 114, 162–172. [Google Scholar] [CrossRef]
- Champ, M.A. A review of organotin regulatory strategies, pending actions, related costs and benefits. Sci. Total Environ. 2000, 258, 21–71. [Google Scholar] [CrossRef]
- Tribou, M.; Swain, G. The effects of grooming on a copper ablative coating: A six year study. Biofouling 2017, 33, 494–504. [Google Scholar] [CrossRef]
- Tian, W.; Meng, F.; Liu, L.; Li, Y.; Wang, F. The failure behaviour of a commercial highly pigmented epoxy coating under marine alternating hydrostatic pressure. Prog. Org. Coat. 2015, 82, 101–112. [Google Scholar] [CrossRef]
- Kiil, S.; Dam-Johansen, K. Characterization of pigment-leached antifouling coatings using BET surface area measurements and mercury porosimetry. Prog. Org. Coat. 2007, 60, 238–247. [Google Scholar] [CrossRef]
- Yebra, D.M.; Kiil, S.; Weinell, C.E.; Dam-Johansen, K. Dissolution rate measurements of sea water soluble pigments for antifouling paints: ZnO. Prog. Org. Coat. 2006, 56, 327–337. [Google Scholar] [CrossRef]
- Wood, K.A. Optimizing the exterior durability of new fluoropolymer coatings. Prog. Org. Coat. 2001, 43, 207–213. [Google Scholar] [CrossRef]
- Zhang, J.T.; Hu, J.M.; Zhang, J.Q.; Cao, C.N. Studies of water transport behavior and impedance models of epoxy-coated metals in NaCl solution by EIS. Prog. Org. Coat. 2004, 51, 145–151. [Google Scholar] [CrossRef]
- Zhou, Q.; Wang, Y. Comparisons of clear coating degradation in NaCl solution and pure water. Prog. Org. Coat. 2013, 76, 1674–1682. [Google Scholar] [CrossRef]
- Wei, H.; Tang, J.; Chen, X.; Tang, Y.; Zhao, X.; Zuo, Y. Influence of organic and inorganic cerium salts on the protective performance of epoxy coating. Prog. Org. Coat. 2022, 166, 106763. [Google Scholar] [CrossRef]
- Perera, D.Y. Effect of pigmentation on organic coating characteristics. Prog. Org. Coat. 2004, 50, 247–262. [Google Scholar] [CrossRef]
- Bressy, C.; Hellio, C.; Nguyen, M.N.; Tanguy, B.; Maréchal, J.-P.; Margaillan, A. Optimized silyl ester diblock methacrylic copolymers: A new class of binders for chemically active antifouling coatings. Prog. Org. Coat. 2014, 77, 665–673. [Google Scholar] [CrossRef]
- Vetere, V.F.; Pérez, M.C.; Romagnoli, R.; Stupak, M.E.; del Amo, B. Solubility and toxic effect of the cuprous thiocyanate antifouling pigment on barnacle larvae. J. Coat. Technol. 1997, 69, 39–45. [Google Scholar] [CrossRef]
- Yonehara, Y.; Yamashita, H.; Kawamura, C.; Itoh, K. A new antifouling paint based on a zinc acrylate copolymer. Prog. Org. Coat. 2001, 42, 150–158. [Google Scholar] [CrossRef]
- Bressy, C.; Hugues, C.; Margaillan, A. Characterization of chemically active antifouling paints using electrochemical impedance spectrometry and erosion tests. Prog. Org. Coat. 2009, 64, 89–97. [Google Scholar] [CrossRef]
- Perrin, F.X.; Merlatti, C.; Aragon, E.; Margaillan, A. Degradation study of polymer coating: Improvement in coating weatherability testing and coating failure prediction. Prog. Org. Coat. 2009, 64, 466–473. [Google Scholar] [CrossRef]
- Mao, T.; Lu, G.; Xu, C.; Yu, H.; Yu, J. Preparation and properties of polyvinylpyrrolidone-cuprous oxide microcapsule antifouling coating. Prog. Org. Coat. 2020, 141, 105317. [Google Scholar] [CrossRef]
- Yang, W.; Zhao, W.; Liu, Y.; Hu, H.; Pei, X.; Wu, Y.; Zhou, F. The effect of wetting property on anti-fouling/foul-release performance under quasi-static/hydrodynamic conditions. Prog. Org. Coat. 2016, 95, 64–71. [Google Scholar] [CrossRef]
- Jin, H.L.; Ding, L.H.; Chen, J.H. Effect of graphene content on structure and glossiness of Pu/Cu coating sprayed on photovoltaic panel. Mater. Prot. 2021, 54, 71–74. (In Chinese) [Google Scholar] [CrossRef]
- Merlatti, C.; Perrin, F.X.; Aragon, E.; Margaillan, A. Natural and artificial weathering characteristics of stabilized acrylic–urethane paints. Polym. Degrad. Stab. 2008, 93, 896–903. [Google Scholar] [CrossRef]
- Croll, S.G.; Hinderliter, B.R.; Liu, S. Statistical approaches for predicting weathering degradation and service life. Prog. Org. Coat. 2006, 55, 75–87. [Google Scholar] [CrossRef]
- Zhang, Z.; Wu, J.; Zhao, X.; Zhang, Y.; Wu, Y.; Su, T.; Deng, H. Life evaluation of organic coatings on hydraulic metal structures. Prog. Org. Coat. 2020, 148, 105848. [Google Scholar] [CrossRef]
- Ariffin, M.M.; Aung, M.M.; Abdullah, L.C.; Salleh, M.Z. Assessment of corrosion protection and performance of bio-based polyurethane acrylate incorporated with nano zinc oxide coating. Polym. Test. 2020, 87, 106526. [Google Scholar] [CrossRef]
Disclaimer/Publisher’s Note: The statements, opinions and data contained in all publications are solely those of the individual author(s) and contributor(s) and not of MDPI and/or the editor(s). MDPI and/or the editor(s) disclaim responsibility for any injury to people or property resulting from any ideas, methods, instructions or products referred to in the content. |
© 2023 by the authors. Licensee MDPI, Basel, Switzerland. This article is an open access article distributed under the terms and conditions of the Creative Commons Attribution (CC BY) license (https://creativecommons.org/licenses/by/4.0/).

