3.2. Microstructure and Phase Composition of the FeCoCrAlCu HEA Coating
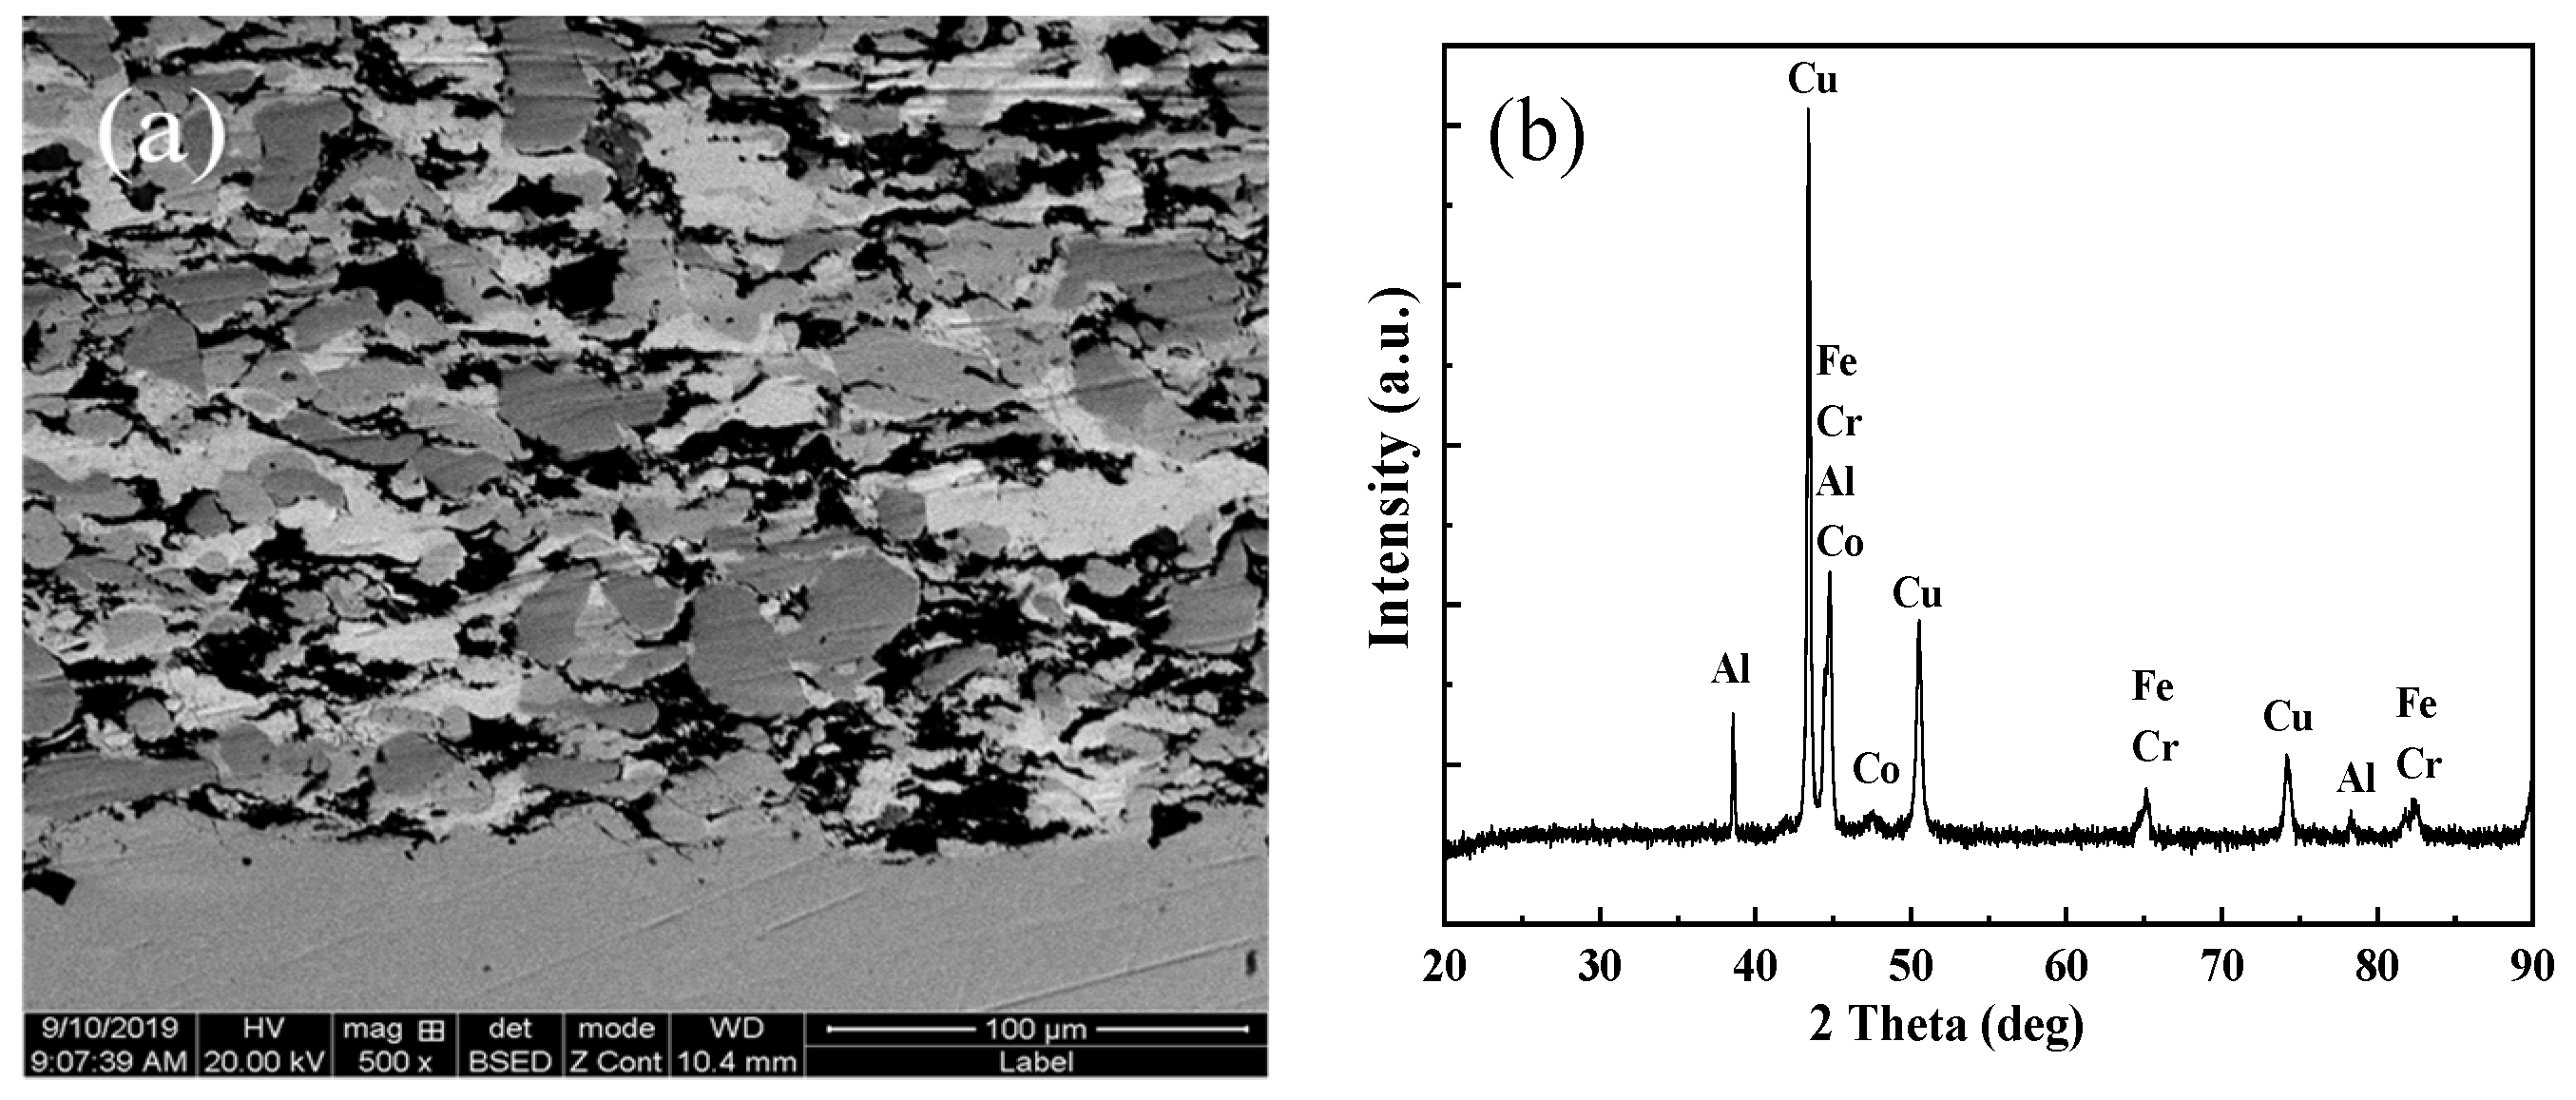
Figure 4 shows the images and XRD pattern of the FeCoCrAlCu HEA coating synthesized by induction remelting.
Figure 4a is a cross-section image of the coating. No cracks or pores were observed in the coating, and its overall structure was dense, with a small black phase. According to the energy spectrum in
Figure 4a, the black phase contains a large number of Al and O elements, so the black phase is an aluminum oxide phase. The coating microstructure mainly comprises dendritic (referred to as “DR”) and interdendritic (referred to as “ID”) structures. A dark-gray metallurgical bonding zone with a width of approximately 100 ± 10 μm was formed at the interface between the substrate and the FeCoCrAlCu HEA coating.
Figure 4b is a low-magnification SEM image of the FeCoCrAlCu HEA coating surface, showing the uniform distribution of elements.
Figure 4c is a high-magnification SEM image of the FeCoCrAlCu HEA coating surface. The internal structure of the dendritic phase was relatively uniform and formed a dense strip-staggered structure, which is a typical BCC-phase-amplitude-modulated structure.
Figure 4d presents the XRD pattern of the FeCoCrAlCu coating. Both BCC and FCC phases were formed in the coating. The BCC phase consisted of a B1-disordered phase (FeCr) and a B2-ordered phase (AlCo) [
12]. The lattice constants of the BCC and FCC phases, calculated using Bragg’s equation (2 dsin
θ = nλ), were 2.883 Å and 3.669 Å, respectively. The diffraction peaks of the BCC phase of the FeCoCrAlCu HEA coating were similar to those of Fe and Cr, which indicates that other elements in the BCC phase dissolved in the Fe and Cr. The diffraction peaks of the FCC phase were very near that of Cu, which indicates that other elements of the FCC phase dissolved in Cu and that Cu was precipitated in the FCC phase (F
Cu). The lattice constant of the BCC phase of the FeCoCrAlCu HEA coating (2.883 Å) was very close to those of Fe and Cr (2.866 Å and 2.884 Å, respectively) due to a small amount of lattice distortion after adding Al and Co. The diffraction peak position of the FCC phase in the FeCoCrAlCu HEA coating was similar to that of Cu, and the addition of Al, Co, Cr, Fe, and other elements increased the lattice constant of the FCC phase (3.669 Å > 3.61 Å for Cu). Lattice distortion of the FCC phase occurred due to the fusion of other elements and the different enthalpies of mixing and atomic radii and the electronegativity between Cu and other elements.
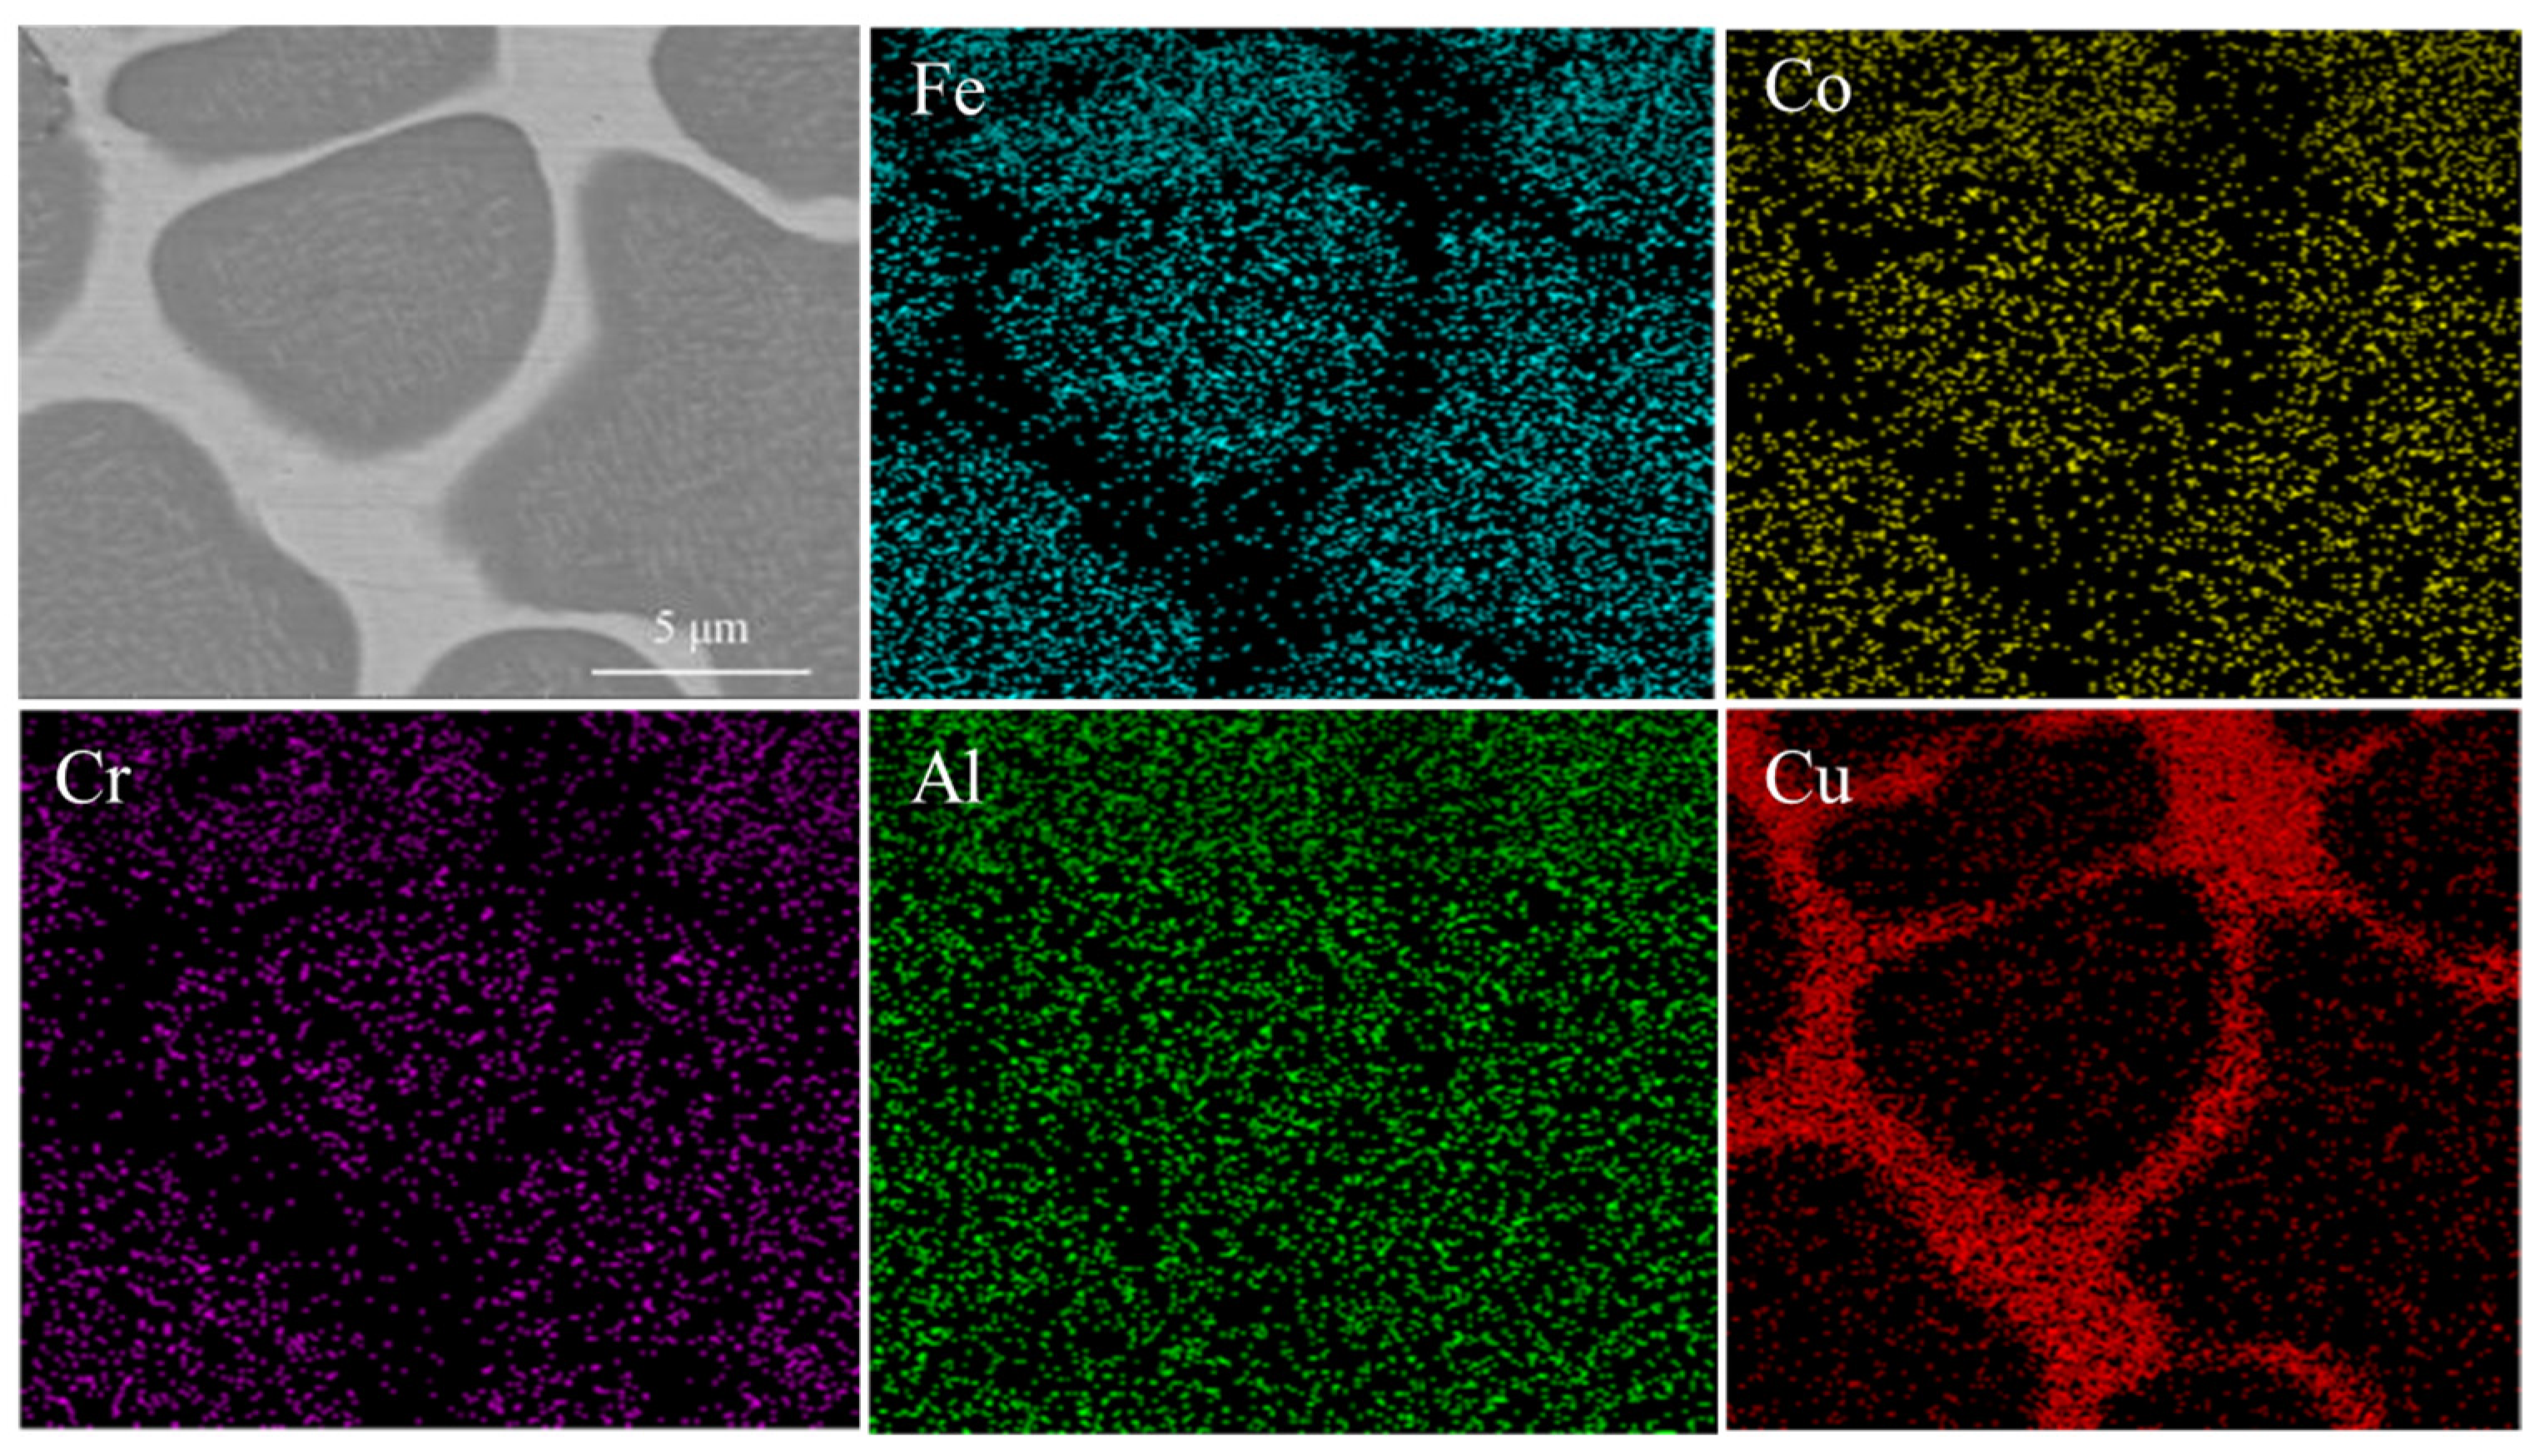
Figure 5 shows that the dendritic region of the FeCoCrAlCu HEA coating was enriched with Fe, Cr, and Co, whereas the intercrystalline region was enriched with Cu, and Al was evenly distributed in both the dendritic and intercrystalline regions. In addition, the overall structure of the coating was dense. The EDS analysis showed that the dendritic region of the FeCoCrAlCu HEA coating was enriched with Fe, Cr, Co, Al, and a small amount of Cu (
Table 3), whereas the interdendritic region was enriched with Cu, Al, and small amounts of Co, Fe, and Cr. The black phase (alumina) was mainly composed of Al (54.3 at.%), O (39.2 at.%), and trace amounts of Co, Cr, Cu, and Fe (as alumina-based metal oxides). In addition, alumina formed due to internal oxidation. Pores and cracks in the pre-formed coating and oxygen in the cold-spraying powder oxidized elements in the coating during remelting. This verifies that the black phase in
Figure 4a was mainly the alumina phase.
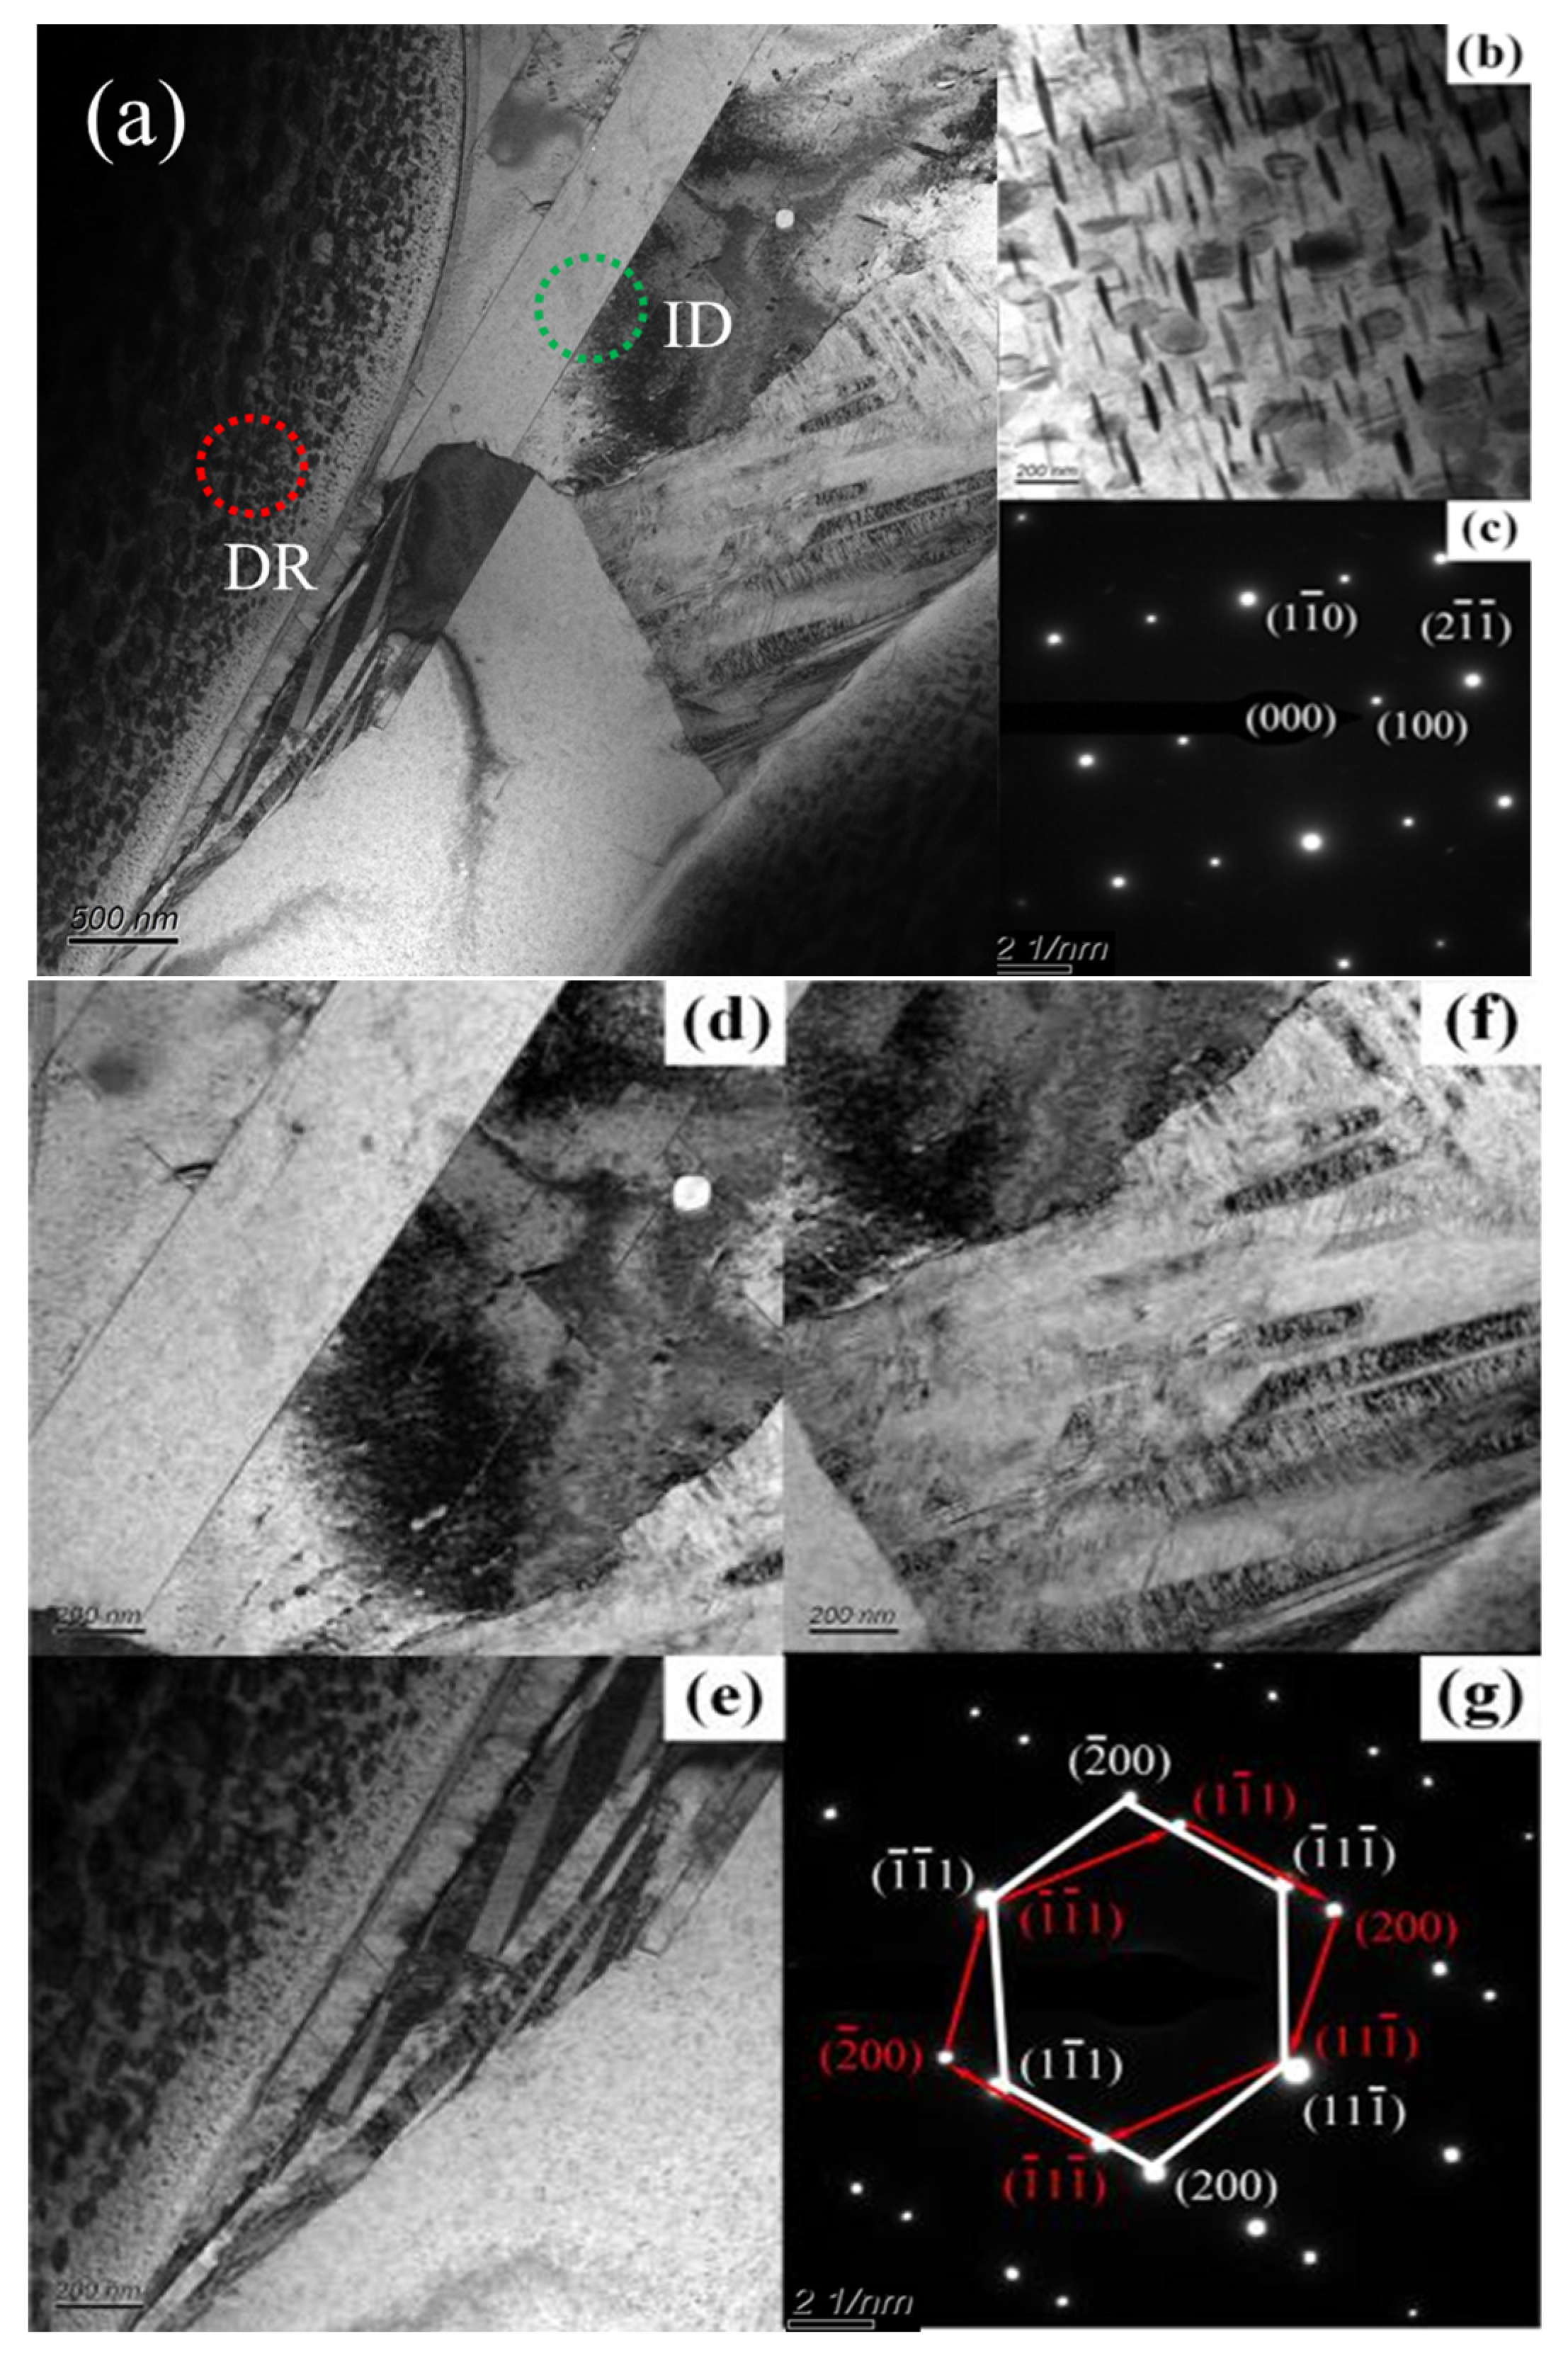
TEM images of the FeCoCrAlCu HEA coating are shown in
Figure 6.
Figure 6a is a bright-field TEM image of the FeCoCrAlCu HEA coating (red circle).
Figure 6c,g show that the coating was composed of dendritic BCC and intercrystalline FCC phases.
Figure 6b displays the bright-field morphology of the BCC phase near the grain boundary of the FeCoCrAlCu HEA coating. The FeCoCrAlCu dendrites mainly possessed a BCC phase structure consisting of the amplitude-modulated structure of the B1-disordered phase (FeCr) and the B2-ordered phase (AlCo). There were also nanoscale BCC phases of 100–200 nm sizes precipitated near the grain boundaries.
Figure 6c displays the SAED pattern of the BCC (011) zone axis, which shows clearly that the dendrites possessed a typical BCC structure.
Figure 6d–g are TEM images and the corresponding SAED patterns of the FCC structure of the FeCoCrAlCu HEA coating (green circle). The intercrystalline structure of the FeCoCrAlCu coating was composed of the FCC phase and manifested typical twin characteristics (
Figure 6d). The lamellar thicknesses of the FCC twins in
Figure 6d,e were less than 300 nm and 100 nm, respectively.
Figure 6g displays the SAED pattern of the FCC (111) zone axis. The intergranular structure was composed of a typical FCC phase twin structure.
Figure 6f show that a large number of dislocations accumulated at the twin boundaries and could not continue to slip forward. According to the twin dislocation strengthening and toughening theory, when twin lamellae exist at the nanometer scale, dislocations interact with many twins. This phenomenon continuously increases the strength of an alloy and simultaneously produces many incomplete dislocations at the twin boundaries. The slip and blockage of these dislocations can yield better mechanical properties [
13].
Yang and Zhang [
14] reported the formation of a simple solid solution when five or more elements were alloyed with equal atomic ratios. Three parameters—mixed entropy “Δ
Smix”, the thermodynamic parameter “Ω”, and the variance of atomic size “
δ”—can be used to determine the formation of a simple solid solution by HEA, and the parameters can be expressed as follows:
where
ci is the atomic percentage of each component and
R is the gas constant (8.314 J/mol·K);
where
Tm is the alloy phase-transition temperature and Δ
Hmix is the enthalpy of mixing;
where
ri is the atomic radius of the component
i and
is the average atomic radius; and
when Ω ≥ 1.1 and
δ ≤ 6.6, the HEA tends to form a high-entropy-stabilized solid-solution phase.
Table 4 reveals that a stable solid-solution structure was formed in the FeCoCrAlCu HEA coating.
Figure 4 and
Figure 5 and
Table 3 show that the FeCoCrAlCu HEA coating was mainly composed of Al, Co, Cr, and Fe, which formed the gray BCC phase, with Cu and Al forming the white FCC phase and a small amount of the black alumina phase. According to the Gibbs free energy equation (Δ
Gmix = Δ
Hmix −
TΔ
Smix), when an alloy system has a small mixing enthalpy, it generates a low Gibbs free energy, which suppresses the precipitation of intermetallic compounds and makes the attractions between the atoms of different components stronger, thus forming a steady solid-solution structure.
Table 5 presents the enthalpies of mixing (kJ/mol) between different elements [
15]. The differences in the atomic radii of the four elements of the BCC phase were small (
Table 5), and the enthalpy of mixing between them was very small (≤−10 kJ/mol); thus, a solid-solution phase was easily formed.
Figure 4d reveals that the BCC phase possessed an amplitude-modulated structure of the B1-disordered phase (FeCr) and the B2-ordered phase (AlCo). The B2 structure was formed due to the more negative mixing enthalpy (−19 kJ/mol) between A1 and Co, and due to their strong binding capacities they easily formed a stable solid solution. Therefore, a solid solution of the AlCo superlattice structure was formed during the remelting process. The FCC phase of the FeCoCrAlCu HEA coating was enriched with Cu and Al. The enthalpy of mixing between Cu and Al (−1 kJ/mol) was small, whereas the enthalpy of mixing between Cu and other elements was large (≥6 kJ/mol); thus, it was difficult for Cu to form a stable solid solution. As Cu–Al generally forms a solid-solution phase, the FCC phase was composed of a Cu–Al-based solid solution. Al was uniformly distributed in the FeCoCrAlCu HEA coating due to the low mixing enthalpy between Al and other elements (≤−1 kJ/mol).
3.3. Microhardness and Frictional Properties
The average Vickers hardness value for the FeCoCrAlCu HEA coating surface was 528.2 HV. The hardness of the FeCoCrAlCu HEA coating was much higher than that of the FeCoCrAlCu HEA (441.5 HV) prepared by melting–casting [
16]. It is generally believed that the higher the hardness and strength of a material, the stronger its deformation resistance, the smaller the friction coefficient, and the better its wear resistance [
17]. The FeCoCrAlCu HEA coating displayed better wear resistance due to its higher hardness.
Table 3 and
Table 5 show that Al was evenly distributed in the coating. Since it had a larger atomic radius than the other elements, when it occupied lattice sites it increased lattice distortion. The increase in the lattice-distortion energy enhanced the effect of the solid-solution strengthening [
18]. Nanometer twins and incomplete dislocations existed at the twin interface of the FCC phase structure (
Figure 6). The complex interactions between twins and dislocations affected the mechanical properties of the alloy [
19]. According to the Hall–Petch effect, a nanoscale twin boundary is equivalent to a traditional grain boundary, which greatly hinders dislocation movements. It causes a large amount of dislocation accumulation at the twin boundaries via the twin-dislocation strengthening mechanism [
20,
21]. As the twin boundaries can also store dislocations, the alloy had high plasticity and toughness [
22]. The B2-ordered phase (AlCo) in the coating and the nanosized BCC phase precipitated at the dendrite boundaries enhanced the strength of the FeCoCrAlCu alloy [
23].
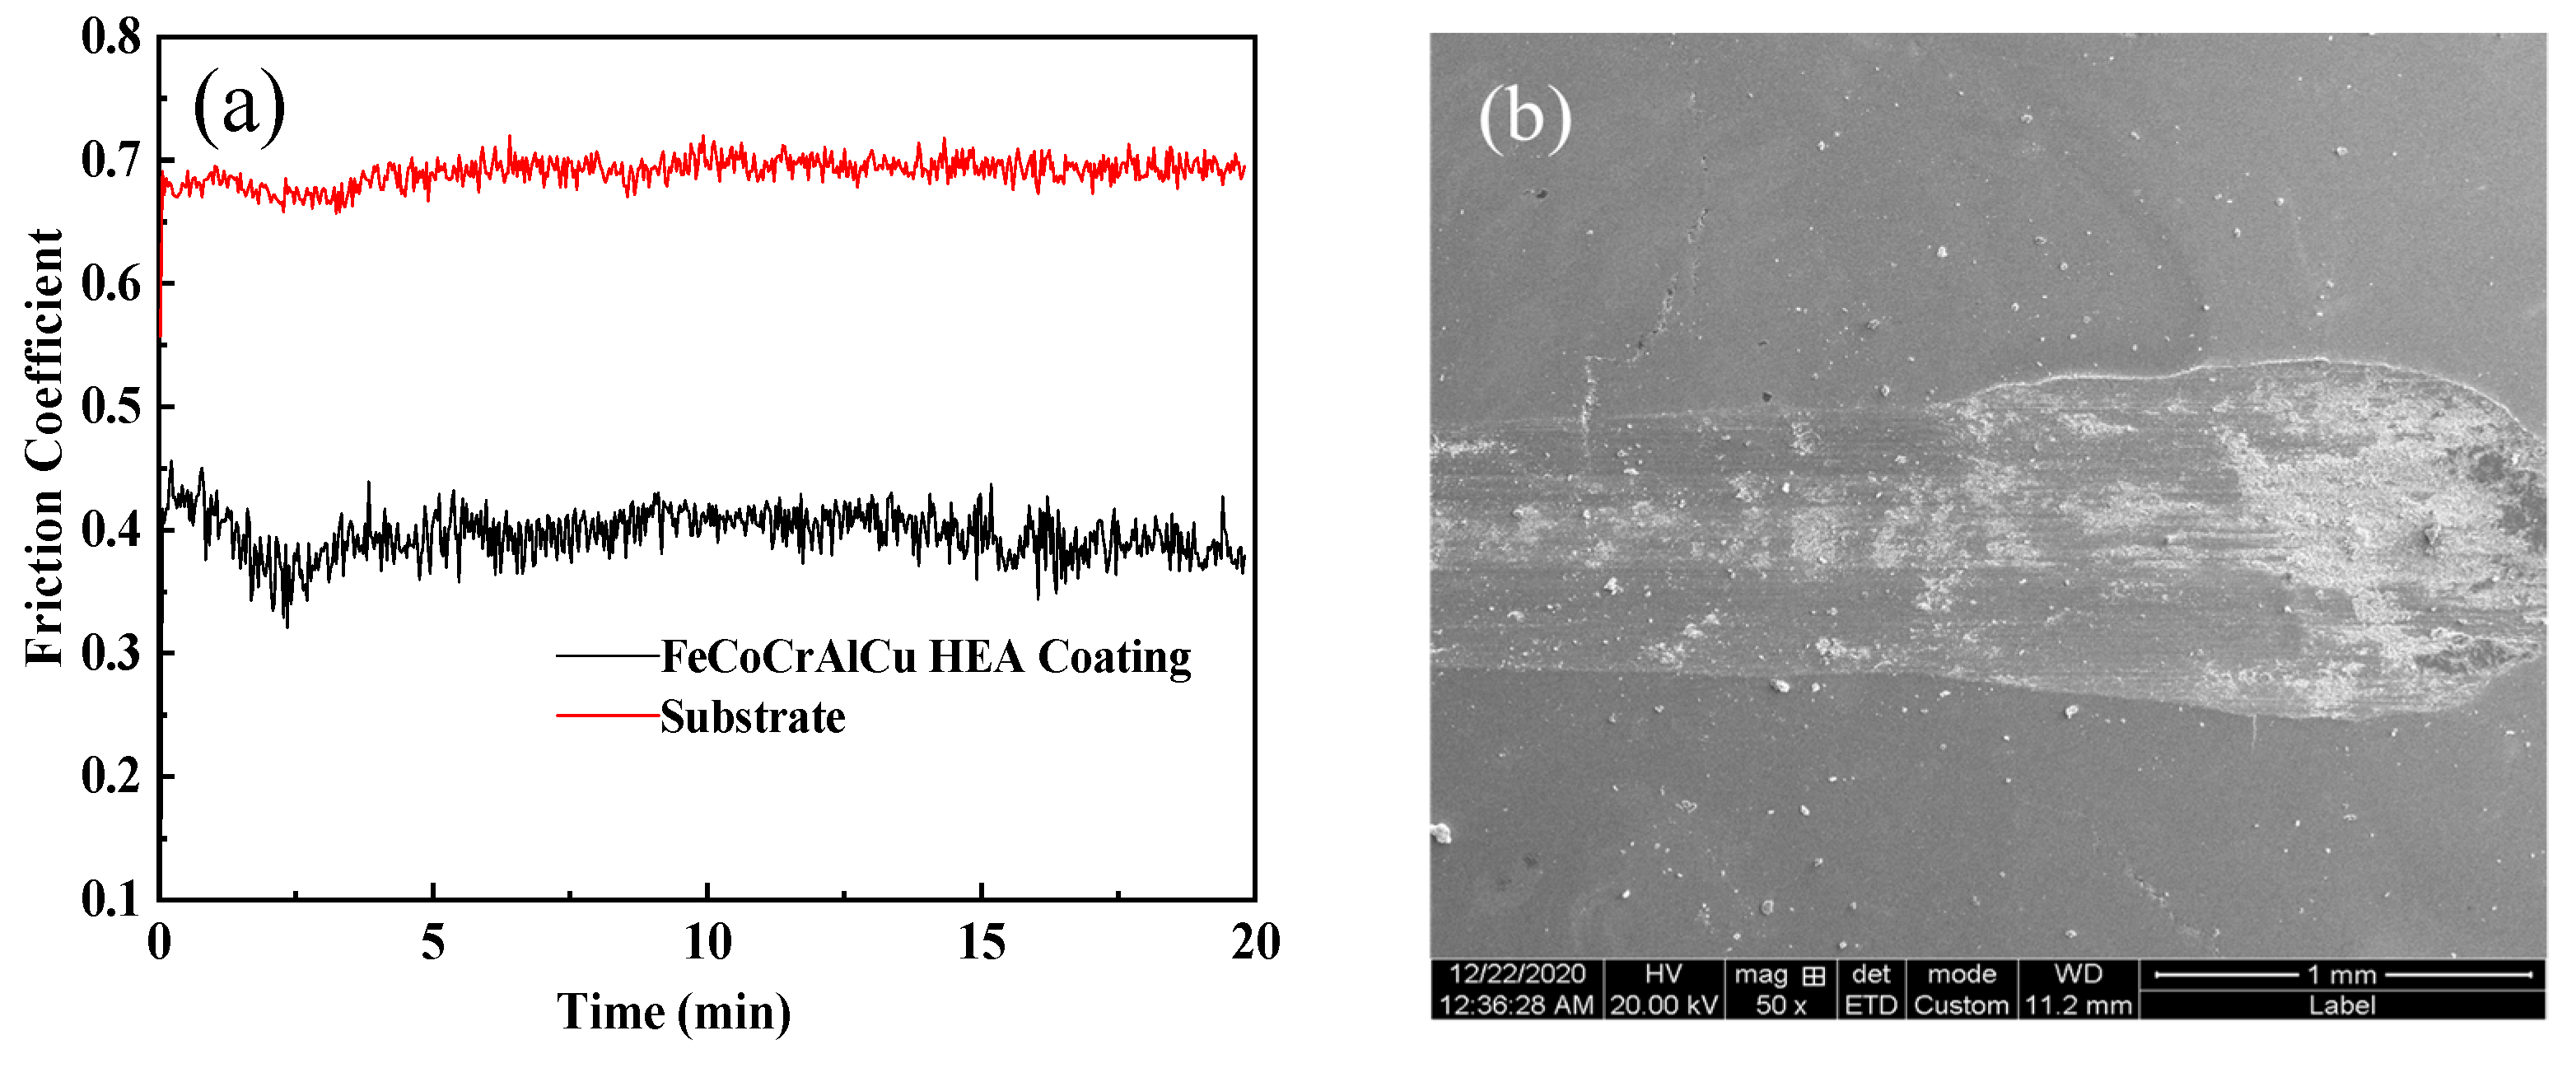
Figure 7 displays the friction coefficient curve and friction image of the FeCoCrAlCu HEA coating under dry friction conditions.
Figure 7a shows that the friction coefficient decreased first, then stabilized, and finally began to decrease as the test time lengthened. The average friction coefficient of the FeCoCrAlCu coating/Al
2O
3 friction pair was 0.379. The friction curve of the 45# steel matrix/Al
2O
3 friction pair was relatively stable, and its friction coefficient (0.695) was much higher than that of the FeCoCrAlCu HEA coating.
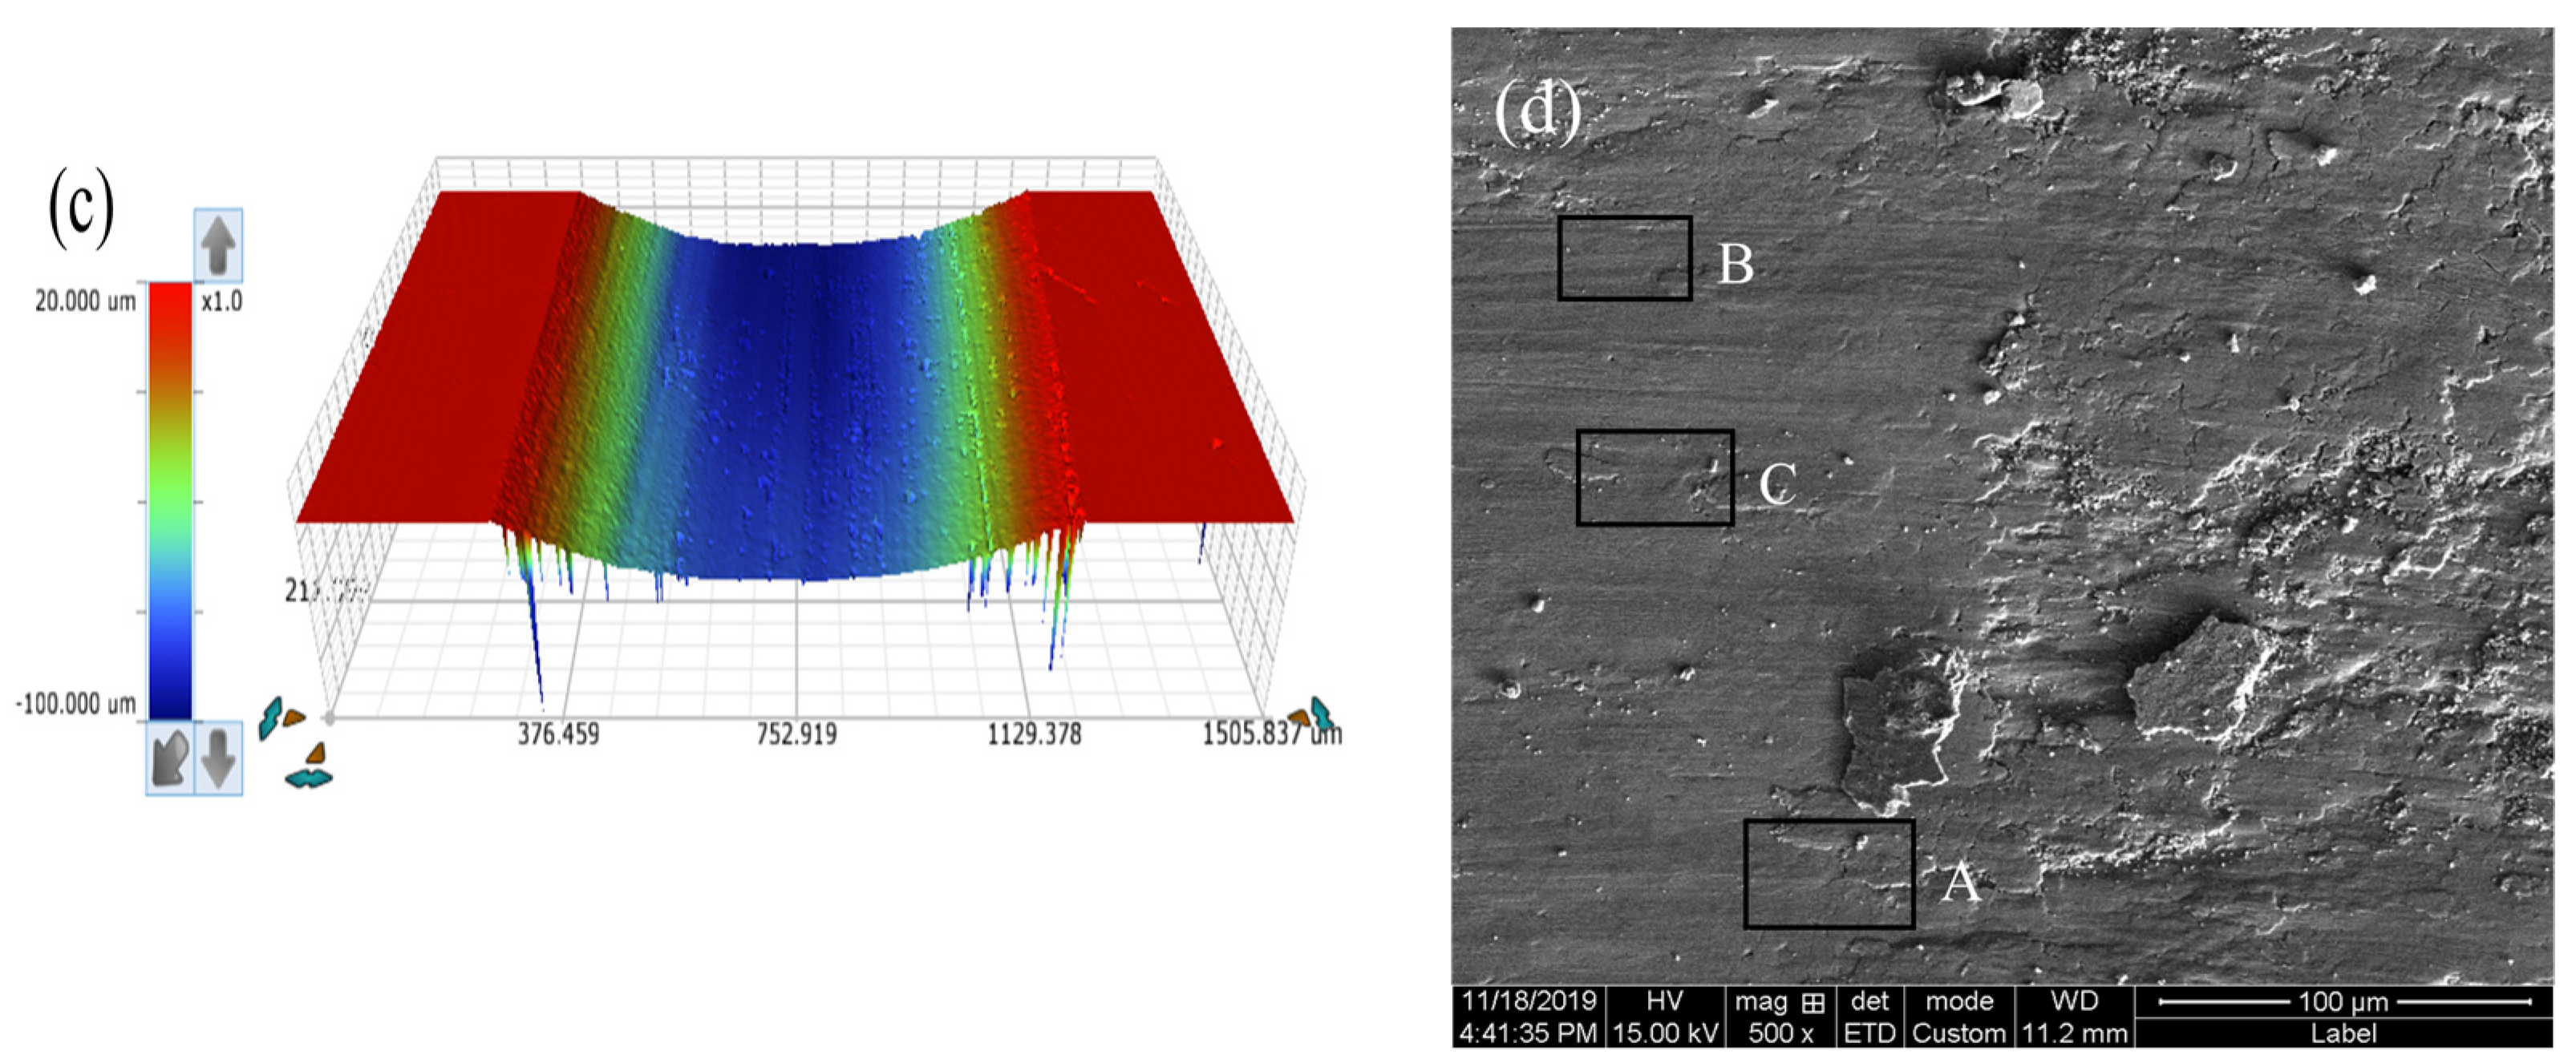
Figure 7b,c show the friction and wear of the FeCoCrAlCu HEA coating formed by induction remelting and the corresponding 3D morphology. The wear rate of the FeCoCrAlCu HEA coating was calculated as 3.96 × 10
–5 mm
3/(N × m)).
Figure 7d shows that many delaminations (area A), grooves (area B), furrows, and abrasive particles (area C) appeared in the friction morphology of the coating. These were attributed to the protective effect of the oxide film during friction. Due to the heat generation on the coating surface during high-speed friction, it was oxidized. Upon increasing the test time, the thickness of the oxide layer increased gradually, which reduced the friction coefficient and improved the wear resistance of the alloy. In addition, due to oxidation and work hardening during repeated friction, hard abrasive particles were formed. Moreover, the degeneration of alumina formed abrasive particles in the coating. These hard abrasive particles plowed the friction surface and stayed at the ends of the generated furrows. Therefore, the main wear mechanisms of the FeCoCrAlCu HEA coating were delamination wear, oxidative wear, and abrasive wear.
3.4. Corrosion Performance
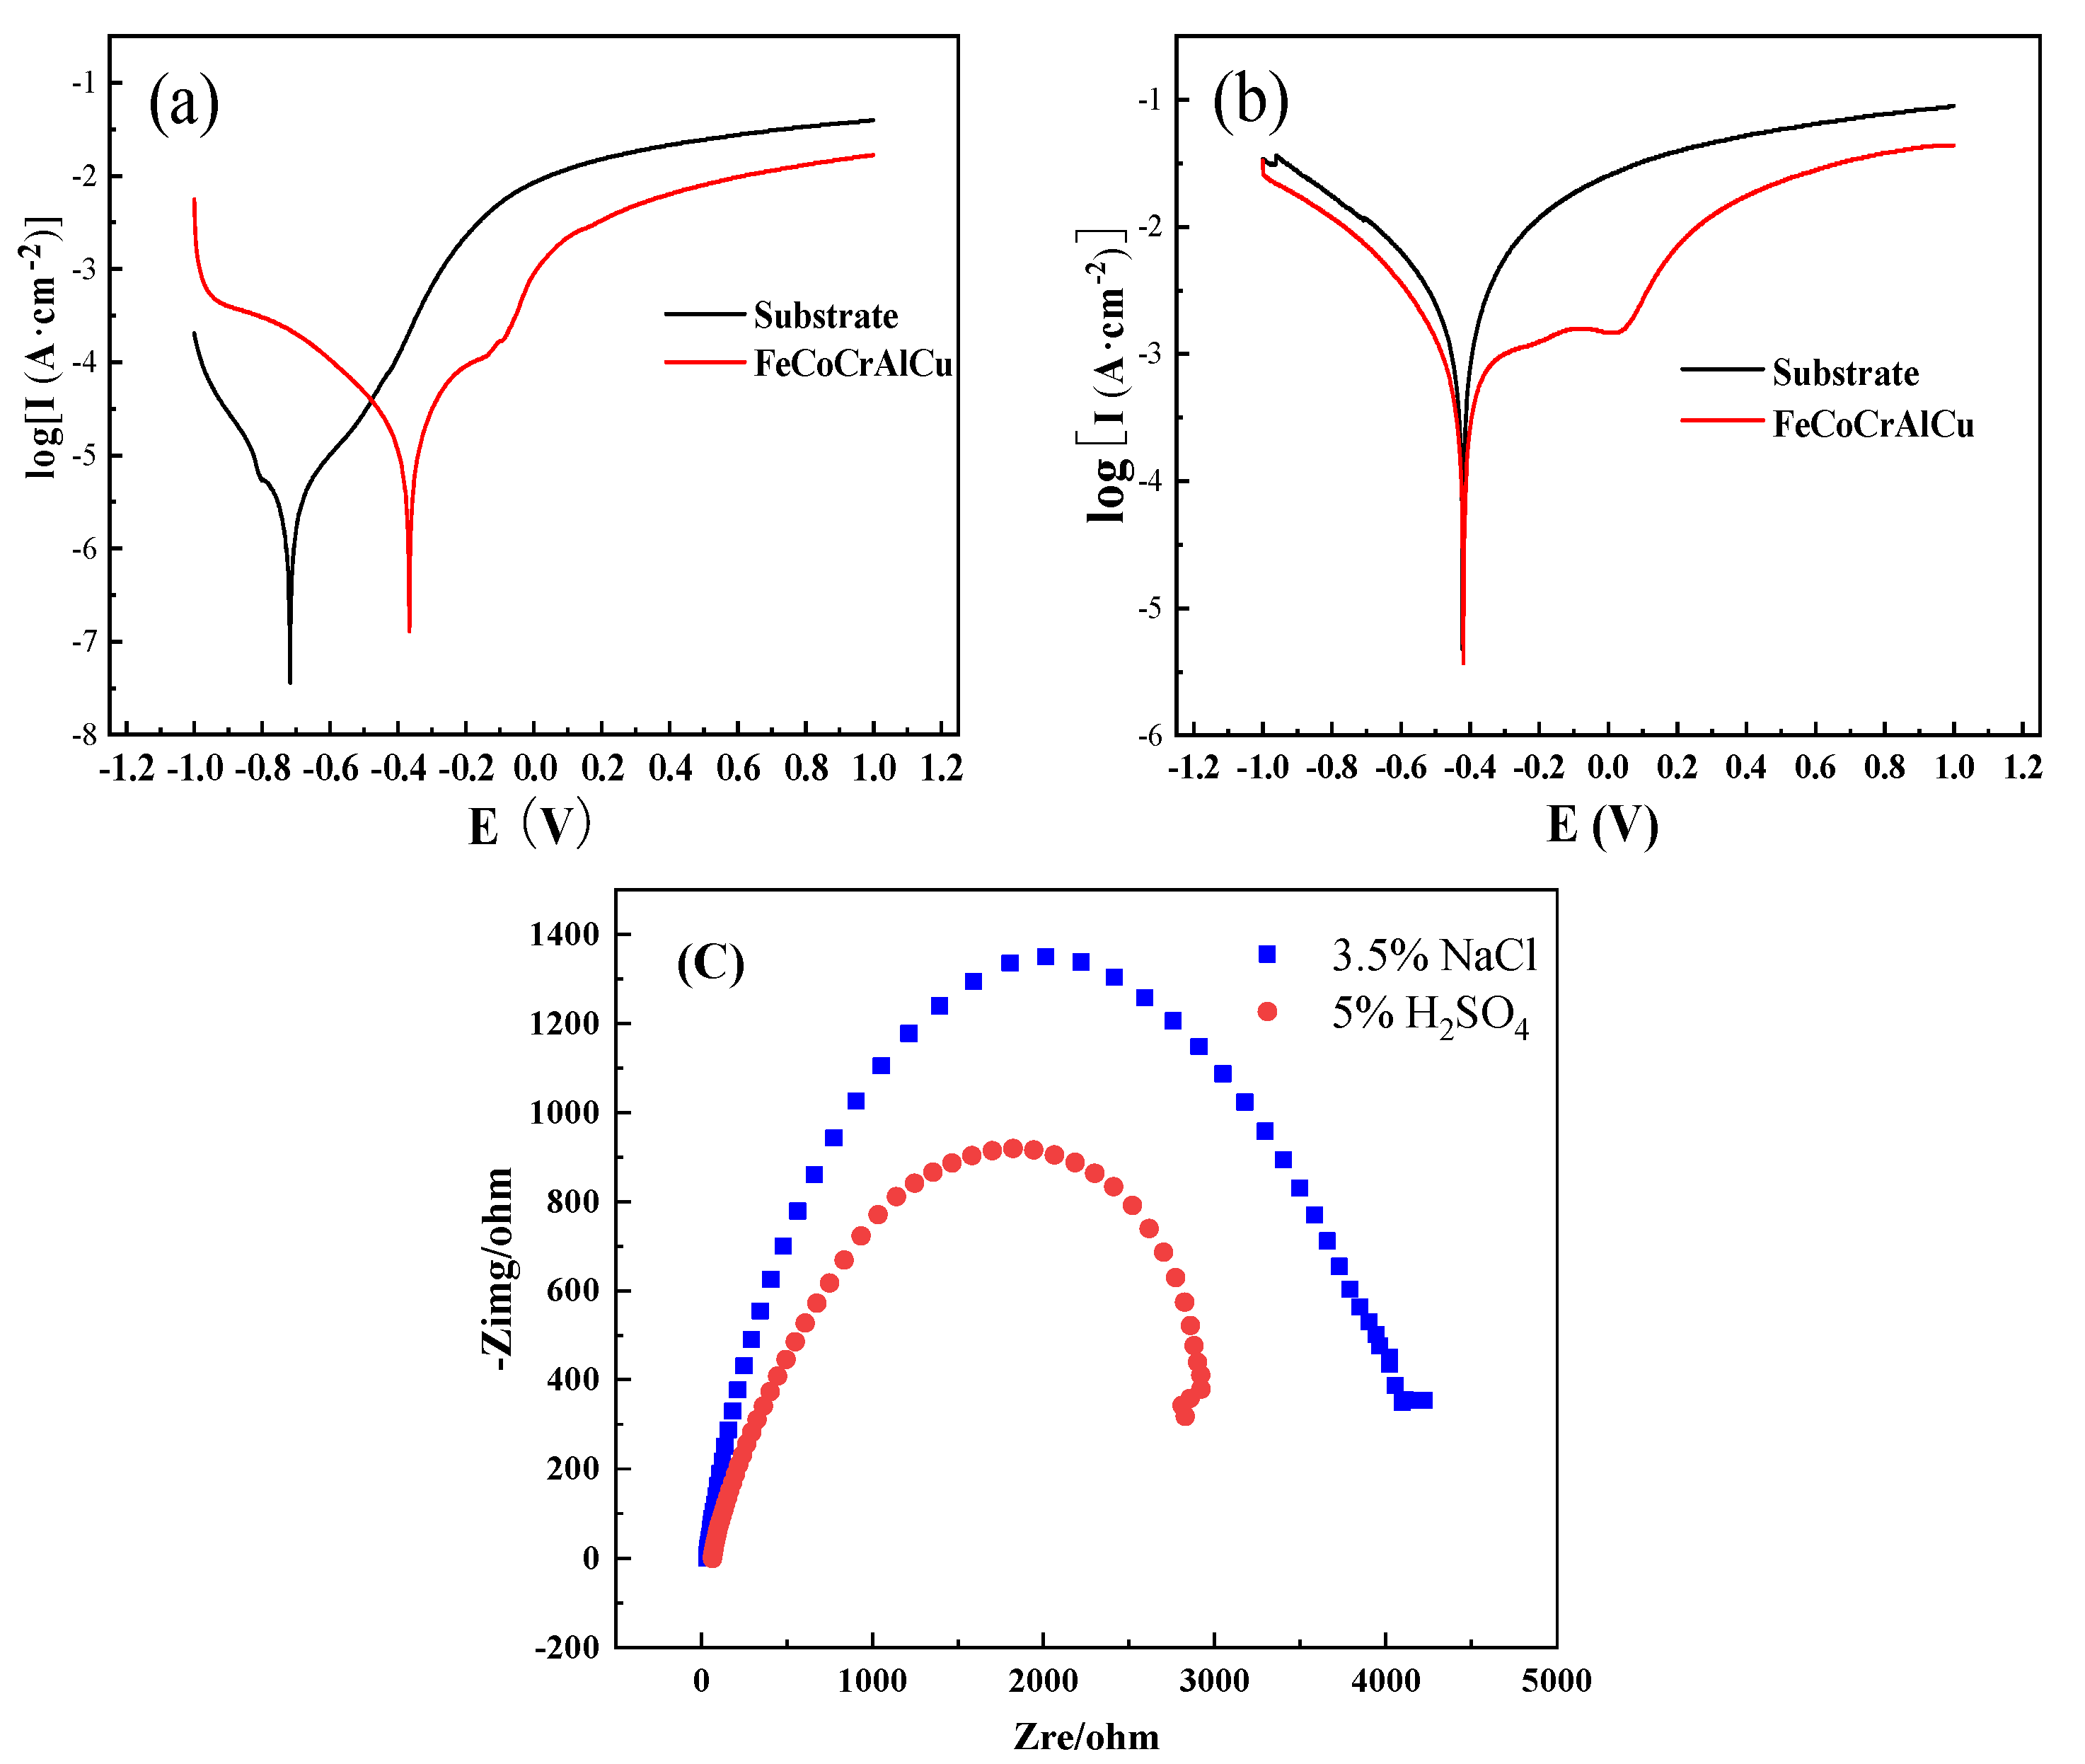
Figure 8a,b display the polarization curves of the FeCoCrAlCu HEA coating and the 45# steel substrate in two different corrosive media (3.5 wt.% NaCl and 5 wt.% H
2SO
4). The corresponding electrochemical parameters are presented in
Table 6. A metal becomes passivated when its free corrosion potential is positive and its free corrosion current density is small, which results in better linear polarization resistance and corrosion resistance [
24].
Figure 8c is a Nyquist plot of impedance spectra showing that the FeCoCrAlCu HEA coatings all presented the characteristics of capacitable reactance arcs. In 3.5 wt.% NaCl solution, the FeCoCrAlCu HEA coating had the largest radius of the impedance semicircle. Generally, the larger the impedance value, the better the corrosion resistance of the material.
In 3.5 wt.% NaCl immersion corrosion solution, the equations for the electrochemical anode and cathode reaction are as follows:
In 5 wt.% H
2SO
4 immersion corrosion solution, the equations for the electrochemical anode and cathode reactions are as follows:
Table 6 shows that the FeCoCrAlCu HEA coating had a higher positive self-corrosion potential (
Ecorr) and a lower corrosion current density (
Icorr) than the substrate. It is evident from
Figure 8 that the polarization curve of the FeCoCrAlCu HEA coating has a prominent activation–passivation zone. With the increase in the corrosion potential, the polarization curve first became relatively steep and then flat. Consequently, a passivation zone appeared. A dense passivation film was formed on the alloy surface, which improved the corrosion resistance.


