Article

Optimization of Electrical Properties of Nanocrystallized Na3M2(PO4)2F3 NASICON-like Glasses (M = V, Ti, Fe)

by
Maciej Nowagiel
1,
Anton Hul
1,
Edvardas Kazakevicius
2,
Algimantas Kežionis
2,
Jerzy E. Garbarczyk
1,* and
Tomasz K. Pietrzak
1,*
1
Faculty of Physics, Warsaw University of Technology, Koszykowa 75, 00-662 Warsaw, Poland
2
Faculty of Physics, Vilnius University, Saulėtekio 9, 10222 Vilnius, Lithuania
*
Authors to whom correspondence should be addressed.
Coatings 2023, 13(3), 482; https://doi.org/10.3390/coatings13030482
Submission received: 23 January 2023 / Revised: 15 February 2023 / Accepted: 16 February 2023 / Published: 21 February 2023

Abstract

:
Recently, an interest in NASICON-type materials revived, as they are considered potential cathode materials in sodium–ion batteries used in large-scale energy storage. We applied a facile technique of thermal nanocrystallization of glassy analogs of these compounds to enhance their electrical parameters. Six nanomaterials of the Na3M2(PO4)2F3 (M = V, Ti, Fe) system were studied. Samples with nominal compositions of Na3V2(PO4)2F3, Na3Ti2(PO4)2F3, Na3Fe2(PO4)2F3, Na3TiV(PO4)2F3, Na3FeV(PO4)2F3 and Na3FeTi(PO4)2F3 have been synthesized as glasses using the melt-quenching method. X-ray diffraction measurements were conducted for as-synthesized samples and after heating at elevated temperatures to investigate the structure. Extensive impedance measurements allowed us to optimize the nanocrystallization process to enhance the electrical conductivity of cathode nanomaterials. Such a procedure resulted in samples with the conductivity at room temperature ranging from 1 × 10 9 up to 8 × 10 5 S/cm. We carried out in situ impedance spectroscopy measurements (in an ultra-high-frequency range up to 10 GHz) and compared them with thermal events observed in differential thermal analysis studies.

1. Introduction

The contemporary world with its wealth and technical advances is based on affordable and widely available energy. If not for electricity, even such obvious systems as water mains, healthcare, education and nearly all means of communication, including the Internet, would stop working. Along with meeting demand for energy itself, global research is now focused on using sustainable energy sources, such as biofuels, water, geothermics, wind and solar power. The last two are expected to play a major role in the future energy mix in order to mitigate climate change [1]. They are, however, weather-dependent and operate in an intermittent manner. That is why energy storage systems, including batteries, are being intensively studied and developed [2,3,4,5,6,7].
NASICON-type materials are among the most promising materials for Na–ion battery cathodes. However, pristine crystalline materials suffer from modest electronic conductivity. The values of the conductivity are rarely reported but seem to be within a range from 10 8 to 10 6 S/cm [8,9,10]. Originally, almost fifty years ago, the name NASICON (NA-Super-Ionic-CONductor) was given to good Na + ionic conductors of the composition Na 1 + x Zr 2 Si x P 3 - x O 12 [11], which do not conduct electronically. These compounds, proposed by a 2019 Nobel Prize laureate, John B. Goodenough, were a class of structurally isomorphous 3D framework compounds exhibiting high ionic conductivity [12], often comparable to that of liquid electrolytes at higher temperatures. The substitution of Zr by a transition metal (e.g., Na3M2(PO4)3, where M = V, Fe, Ti) introduces electronic conductivity due to electron hopping between redox couples (e.g., Fe 3 + /Fe 2 + ). A substitution of a phosphate group with fluorine ions results in a higher potential vs. sodium and a reduction of the molar mass which leads to an increase of the gravimetric capacity. Na3V2(PO4)2F3 with a tetragonal structure (P4 2 /mnm space group) exhibits rich chemistry, attractive lithium/sodium insertion properties and therefore offers promising electrochemical properties. It was first reported by Meins et al. in 1999 [13] to belong to the tetragonal system with the space group of P4 2 /mnm for materials synthesized by solid state sintering. Substitution of vanadium with another transition metal such as Ti or Fe was proven to be feasible [14,15]. However, it changes the electrochemical performance of the material—redox reactions occur at different voltages and the maximum-reached capacity can be influenced as well [8]. Theoretical capacity involving three-electron transfer reactions can be as high as 195 mAh/g, depending on composition [14,16]. It means that the theoretical energy density (507 Wh/kg) is comparable to commercial LiFePO 4 . However, the electrochemical performance is limited by low intrinsic electrical conductivity and large particle size. This can be improved by carbon coating, particle downsizing or alkali/metalion doping. Carbon-coated material delivered a discharge capacity of 130 mAh/g with good cycling stability up to 3000 cycles [17].
Another approach that has been studied by J.E. Garbarczyk, T.K. Pietrzak and co-workers is thermal nanocrystallization of glassy analogs of cathode materials, which usually leads to improvement of electrical conductivity [18]. The effect was proved to be due to the occurrence of favorable conditions for polaron hopping in the region of defected grain boundaries. Recently, it was shown that such an approach can be used to prepare NASICON-type compounds as well [19]. The conductivities of synthesized materials were not satisfactory at that time. However, only one arbitrarily chosen temperature of nanocrystallization was applied, and the synthesis route of the materials was not optimized. In the case of another group of potential cathode materials, i.e. alluaudites, we later showed that great improvement of electrical parameters can be realized by optimizing thermal nanocrystallization conditions [20]. Thus, in this work in a similar way, we came back to previously studied Na 3 M 2 (PO 4 ) 2 F 3 (M = V, Ti, Fe) NASICON-like glass-ceramics [19]. In the aforementioned paper, the selection of titanium, vanadium and iron as transition metals was made due to the frequent occurrence of their oxides in numerous glassy systems and they are considered as glass modificators. In this work, we apply extensive optimization of synthesis conditions and thermal nanocrystallization parameters in order to obtain nanomaterials with significantly improved conductivity.

2. Materials and Methods

There were six materials studied: Na3V2(PO4)2F3, Na3Ti2(PO4)2F3, Na3Fe2(PO4)2F3, Na3TiV(PO4)2F3, Na3FeV(PO4)2F3 and Na3FeTi(PO4)2F3. For the purposes of this work, abbreviations identifying each sample are summarized and shown in Table 1.
Synthesis of the glasses studied in this work consisted of a few stages, including batch preparation, presynthesis, melting and melt-quenching. For each material, the procedure was similar, sometimes varying in details, which will be described in what follows.
Synthesis of Na3M2(PO4)2F3 (M = V, Ti) NASICON was started by mixing and homogenizing V2O5 or TiO2 and NH4H2PO4 in a mortar. The chemicals used are summarized in Table 2. Then, the batches in porcelain crucibles were put into an oven and presynthesized at 240 C for 4 h. For the compositions with M = Fe, pre-dried iron phosphate dihydrate was used. Because of the reactivity of NaF, which served as a sodium source, it was not added until the presynthesis step was finished. Thus, it required a second mixing and homogenizing process just before melting. NaF was added with 10% mol excess due to its evaporation at high temperatures. In the calculations, it was assumed that VOPO4, TiO0.5PO4 compounds are created after the presynthesis [19]. Only in the case of TV sample, V2O5, TiO2 and NH4H2PO4 were presynthesized in one batch resulting in TiVO1.5PO4.
When the mixing with NaF was finished, the batches were put into an Argenta AFI-02 inductive furnace, preheated to 700 C, heated up to 1300 C and melted for 15 min in a reducing atmosphere. The material was quenched between metal plates. Stainless steel ones were used for TT, FV and FT samples. VV, FF and TV samples, however, required faster cooling rates to become vitrified, so copper plates were used for quenching.
Each studied material was measured by a Malvern Panalytical Empyrean diffractometer with a copper lamp. The measurements were conducted at room temperature within angles of 2 θ from 5° to 115° for as-synthesized glasses and after heat treatment at 600–650 C to check the phase purity. Heat-treatment for the ex situ measurements was performed in argon flow in a Czylok tube furnace.
Electrical conductivity of as-synthesized glasses and the same samples after heat-treatment were studied by impedance spectroscopy (IS) at room temperature (ex situ measurements). The platinum electrodes had been sputtered onto glassy samples (with a typical thickness not exceeding ca. 1 mm, and surface area ca. 10 mm 2 ), which were afterwards heat-treated in a Czylok tube furnace in argon flow. The nanocrystallization process lasted 1 h at a set maximum temperature, and the heating/cooling rate was 2 C/min. We chose various maximum temperatures to establish the best conditions for the process.
Furthermore, in situ measurements during heating to specified maximum temperatures were conducted as well. The measurement was carried out in an argon atmosphere to prevent oxidation of transition metal ions. The temperature of the samples was precisely stabilized upon acquiring impedance spectra. Data was collected for a frequency from 10 mHz up to 20 MHz with a voltage signal amplitude of 100 mV using the Novocontrol Alpha-A analyzer [21]. The setup for high-frequency IS measurements was based on a broadband impedance analyzer that performed measurements in the frequency range from 10 Hz to 7 GHz [22,23].

3. Results and Discussion

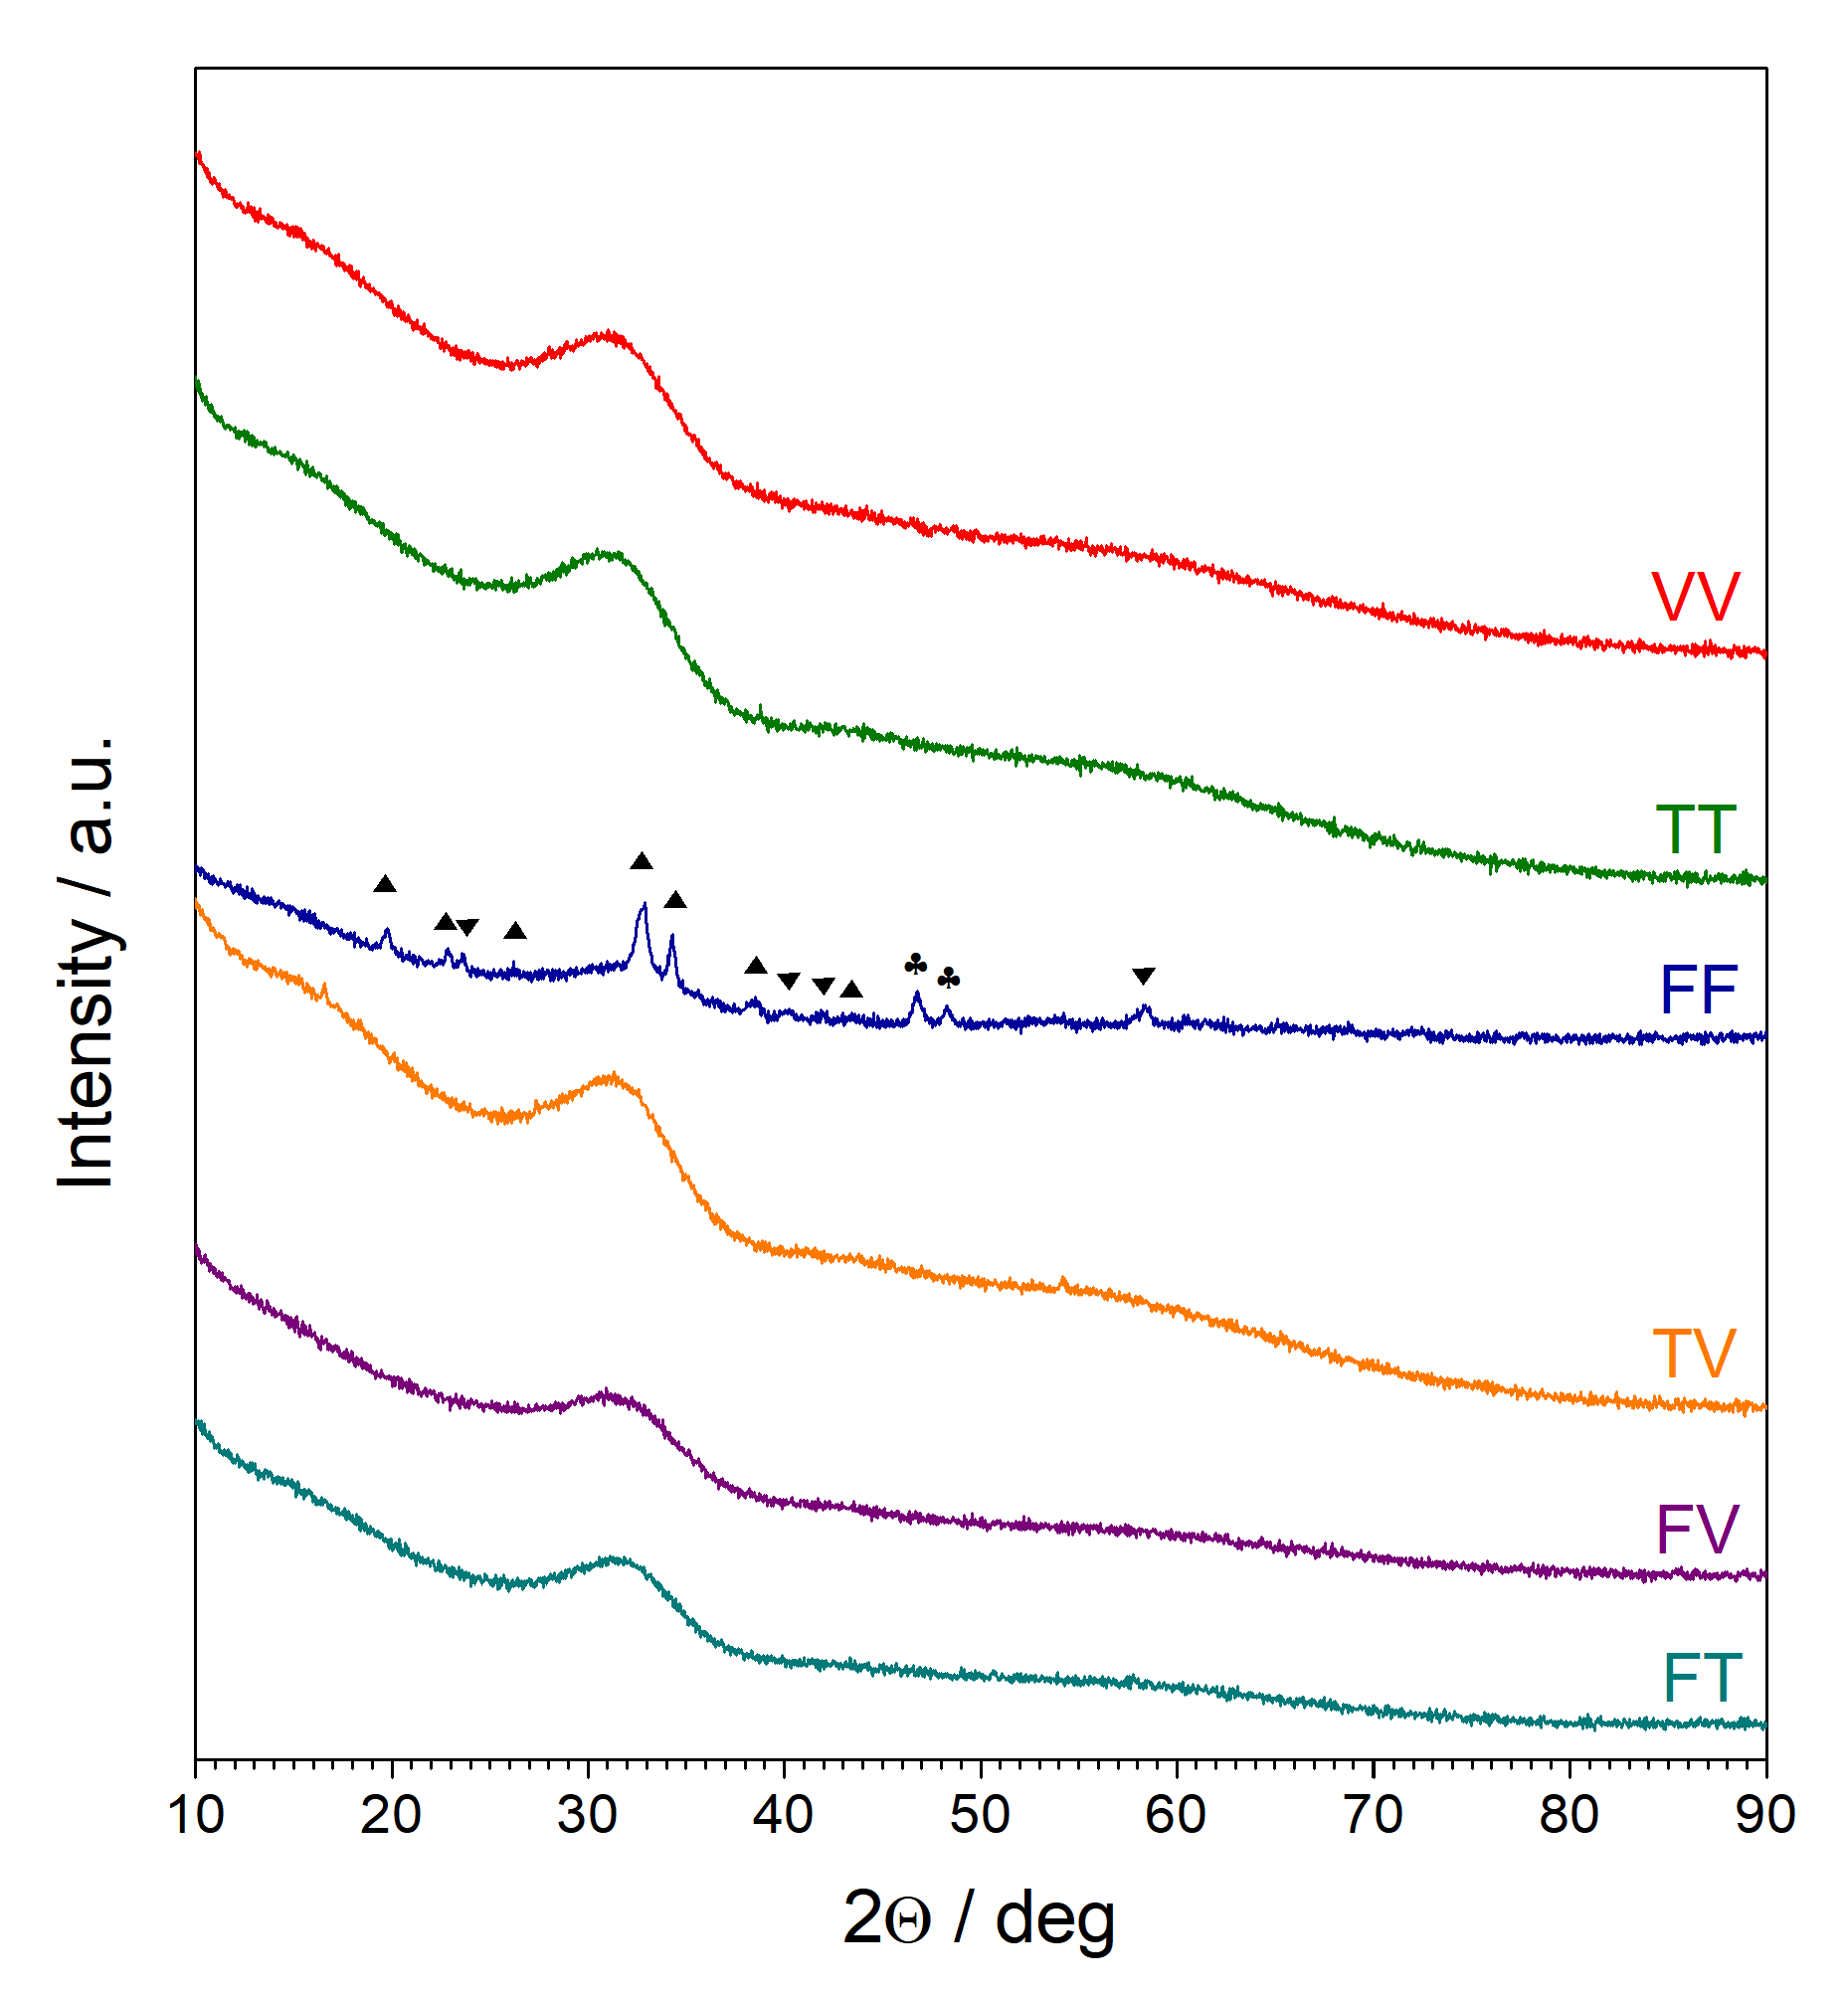
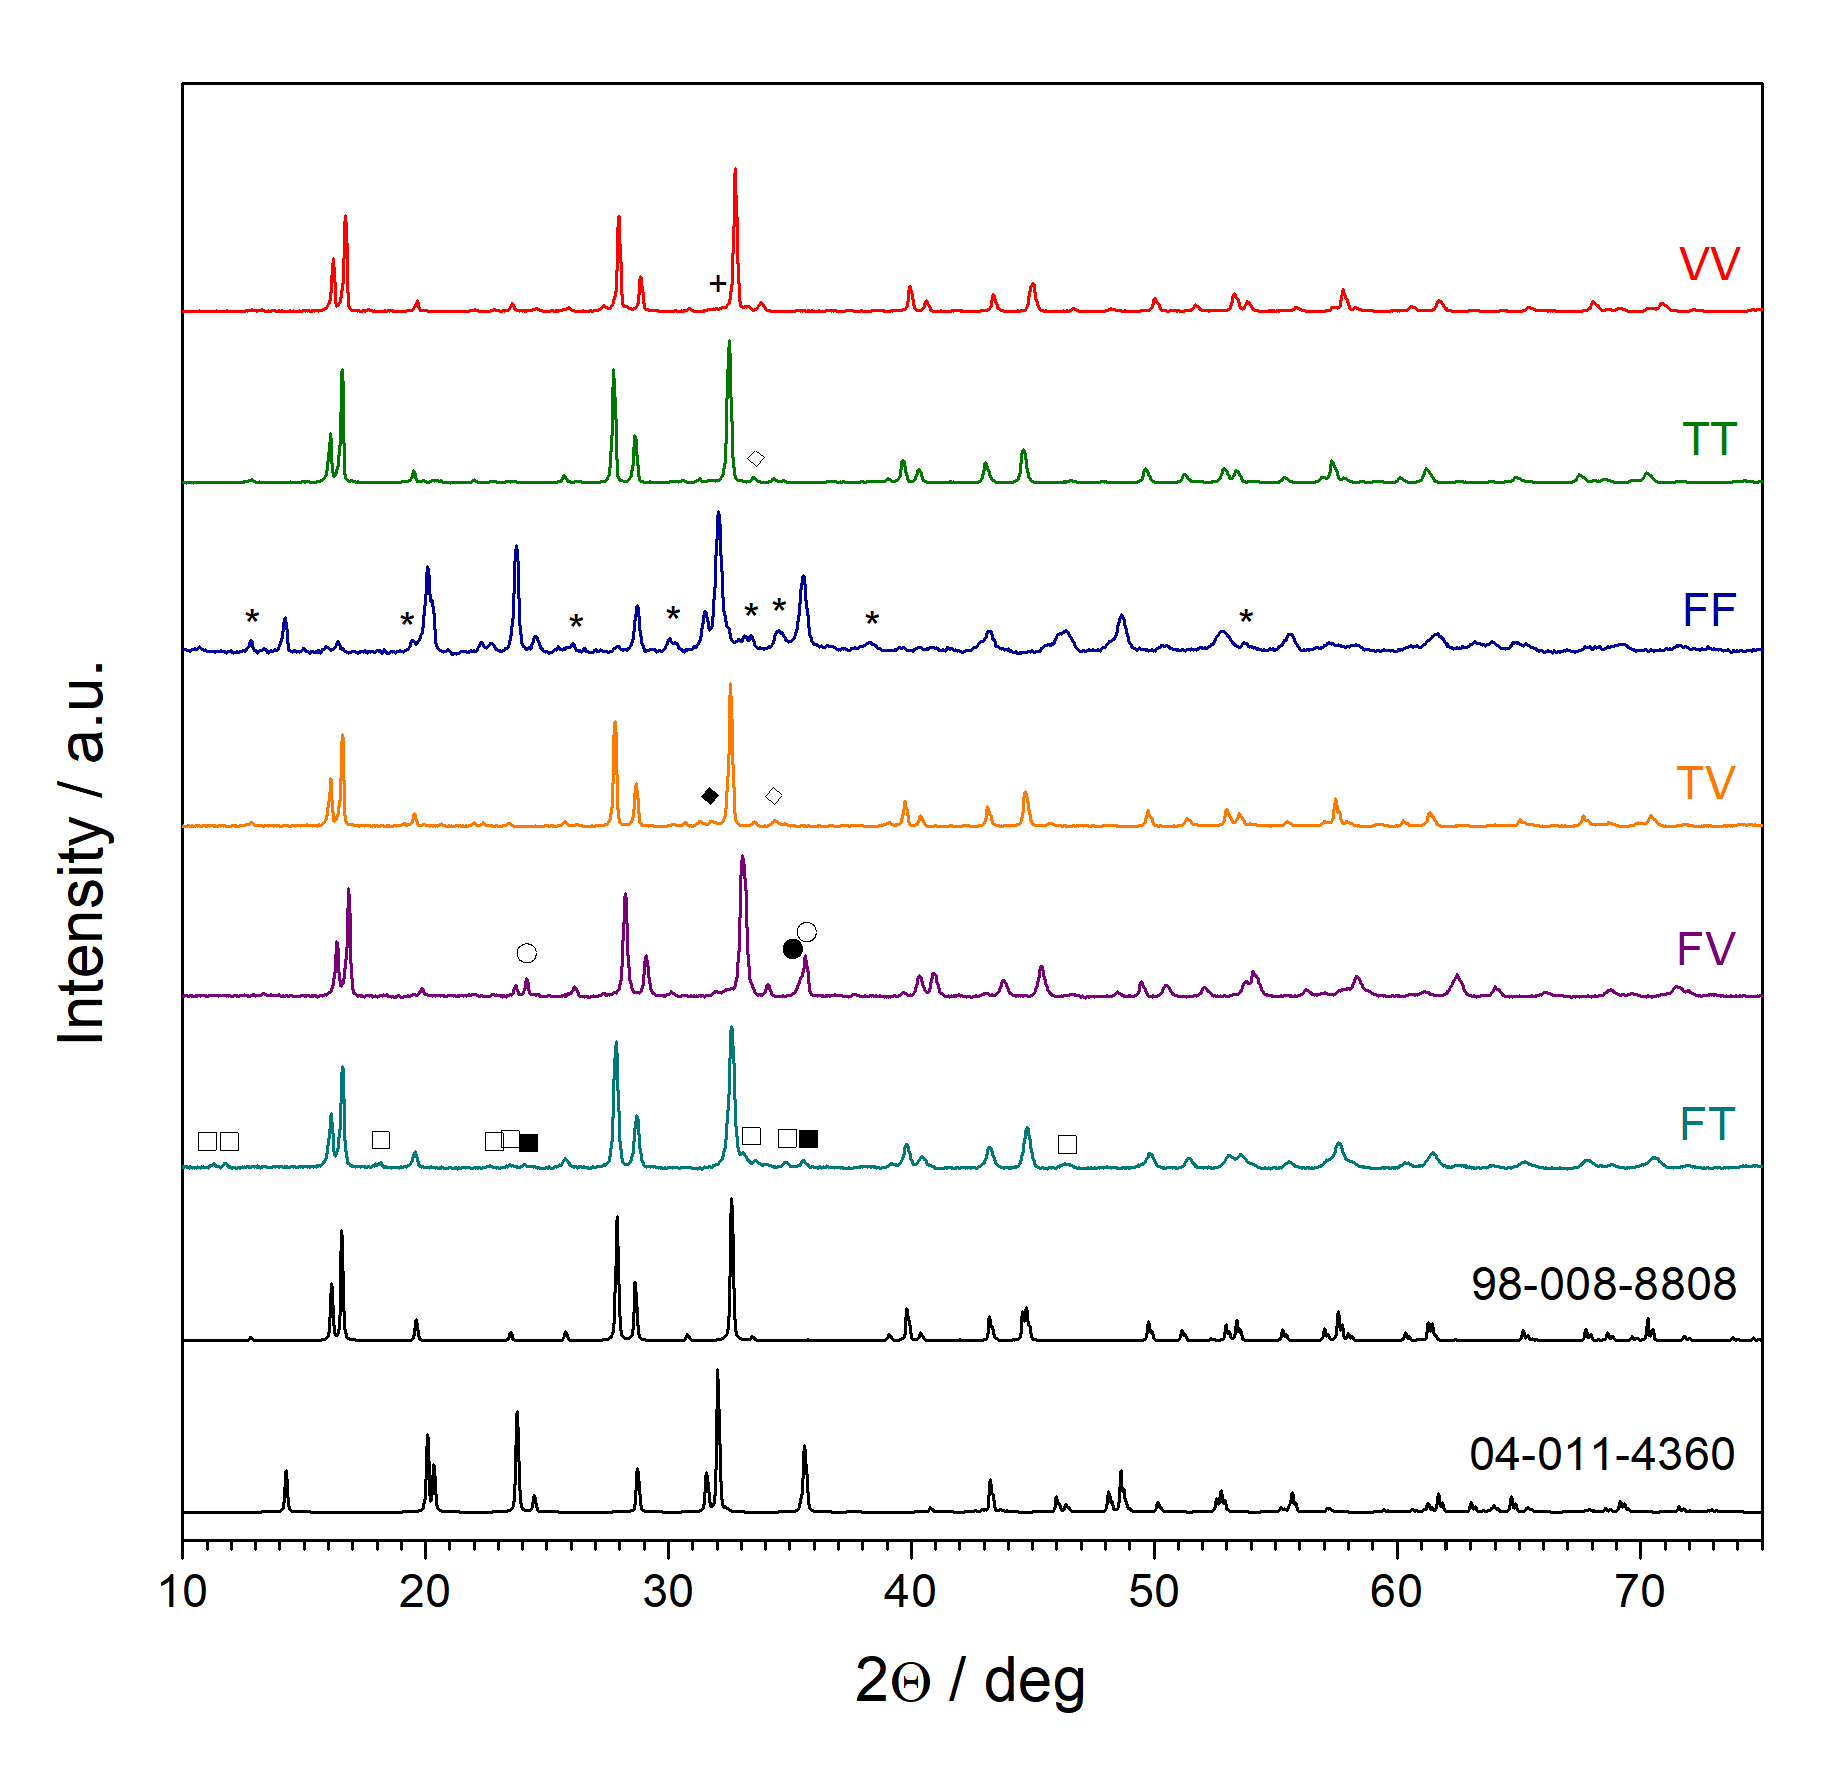
3.1. X-ray Diffractometry (XRD)

XRD patterns of as-synthesized samples are typical for amorphous materials (Figure 1). In this work, we observed improvement in vitrification in comparison to [19]. Only for the FF sample can one observe some peaks that can be attributed to rhombohedral Fe2O3 (ICDD 01-086-8845) and orthorhombic Na4(P2O7) (ICDD 04-018-4331). These are, however, not observed in the sample after heat-treatment, which indicates that the impurities are incorporated into the main crystal phases as shown in Figure 2.
XRD results after heat-treatment at 600–650 C in argon flow show that for all samples, except for FF, the main crystalline phase is isostructural with tetragonal Na3V2(PO4)2F3 (ICSD 98-008-8808)—Figure 2. The FF main phase is isostructural with rhombohedral γ —Na3Fe2(PO4)3 NASICON analogue (ICDD 04-011-4360).
Besides the main phase, small reflexes originating from secondary phases were observed. These were: monoclinic NaVO3 (ICSD 98-006-3479) in VV, orthorombic Na5Ti(PO4)2OF (ICDD 01-079-0411) in TT, orthorombic Na2FePO4F (ICSD 98-019-4076) in FF, orthorombic Na5Ti(PO4)2OF (ICDD 01-079-0411) and cubic NaF (ICDD 04-019-2673) in TV, hexagonal V2O3 (ICSD 98-000-1874) and cubic V3O4 (ICDD 04-002-6772) in FV, orthorombic Na4TiP2O9 (ICSD 98-003-9702) and hexagonal Fe2O3 (ICSD 98-041-5251) in FT. These phases originate from chemical reagents used during synthesis rather than porcelain crucibles used during melting, since ascribed phases are not silicon or aluminum compounds. The occurrence of secondary phases containing Na, Ti, Fe, V, F was observed in the previous paper as well [19]. It was then concluded that adjusting the maximum temperature used during melting can possibly improve phase purity. Thus, in this work, we tried to get rid of secondary phases in the VV sample by using temperatures in the range 1300–1350 C along with changing the synthesis time (5–15 min) to tune the reduction performed by the atmosphere in the outer crucible. However, this procedure did not eliminate crystallization of unwanted compounds. Because of that, the foregoing synthesis method was preserved, i.e., preheating at 700 C and melting for 15 min at 1300 C.

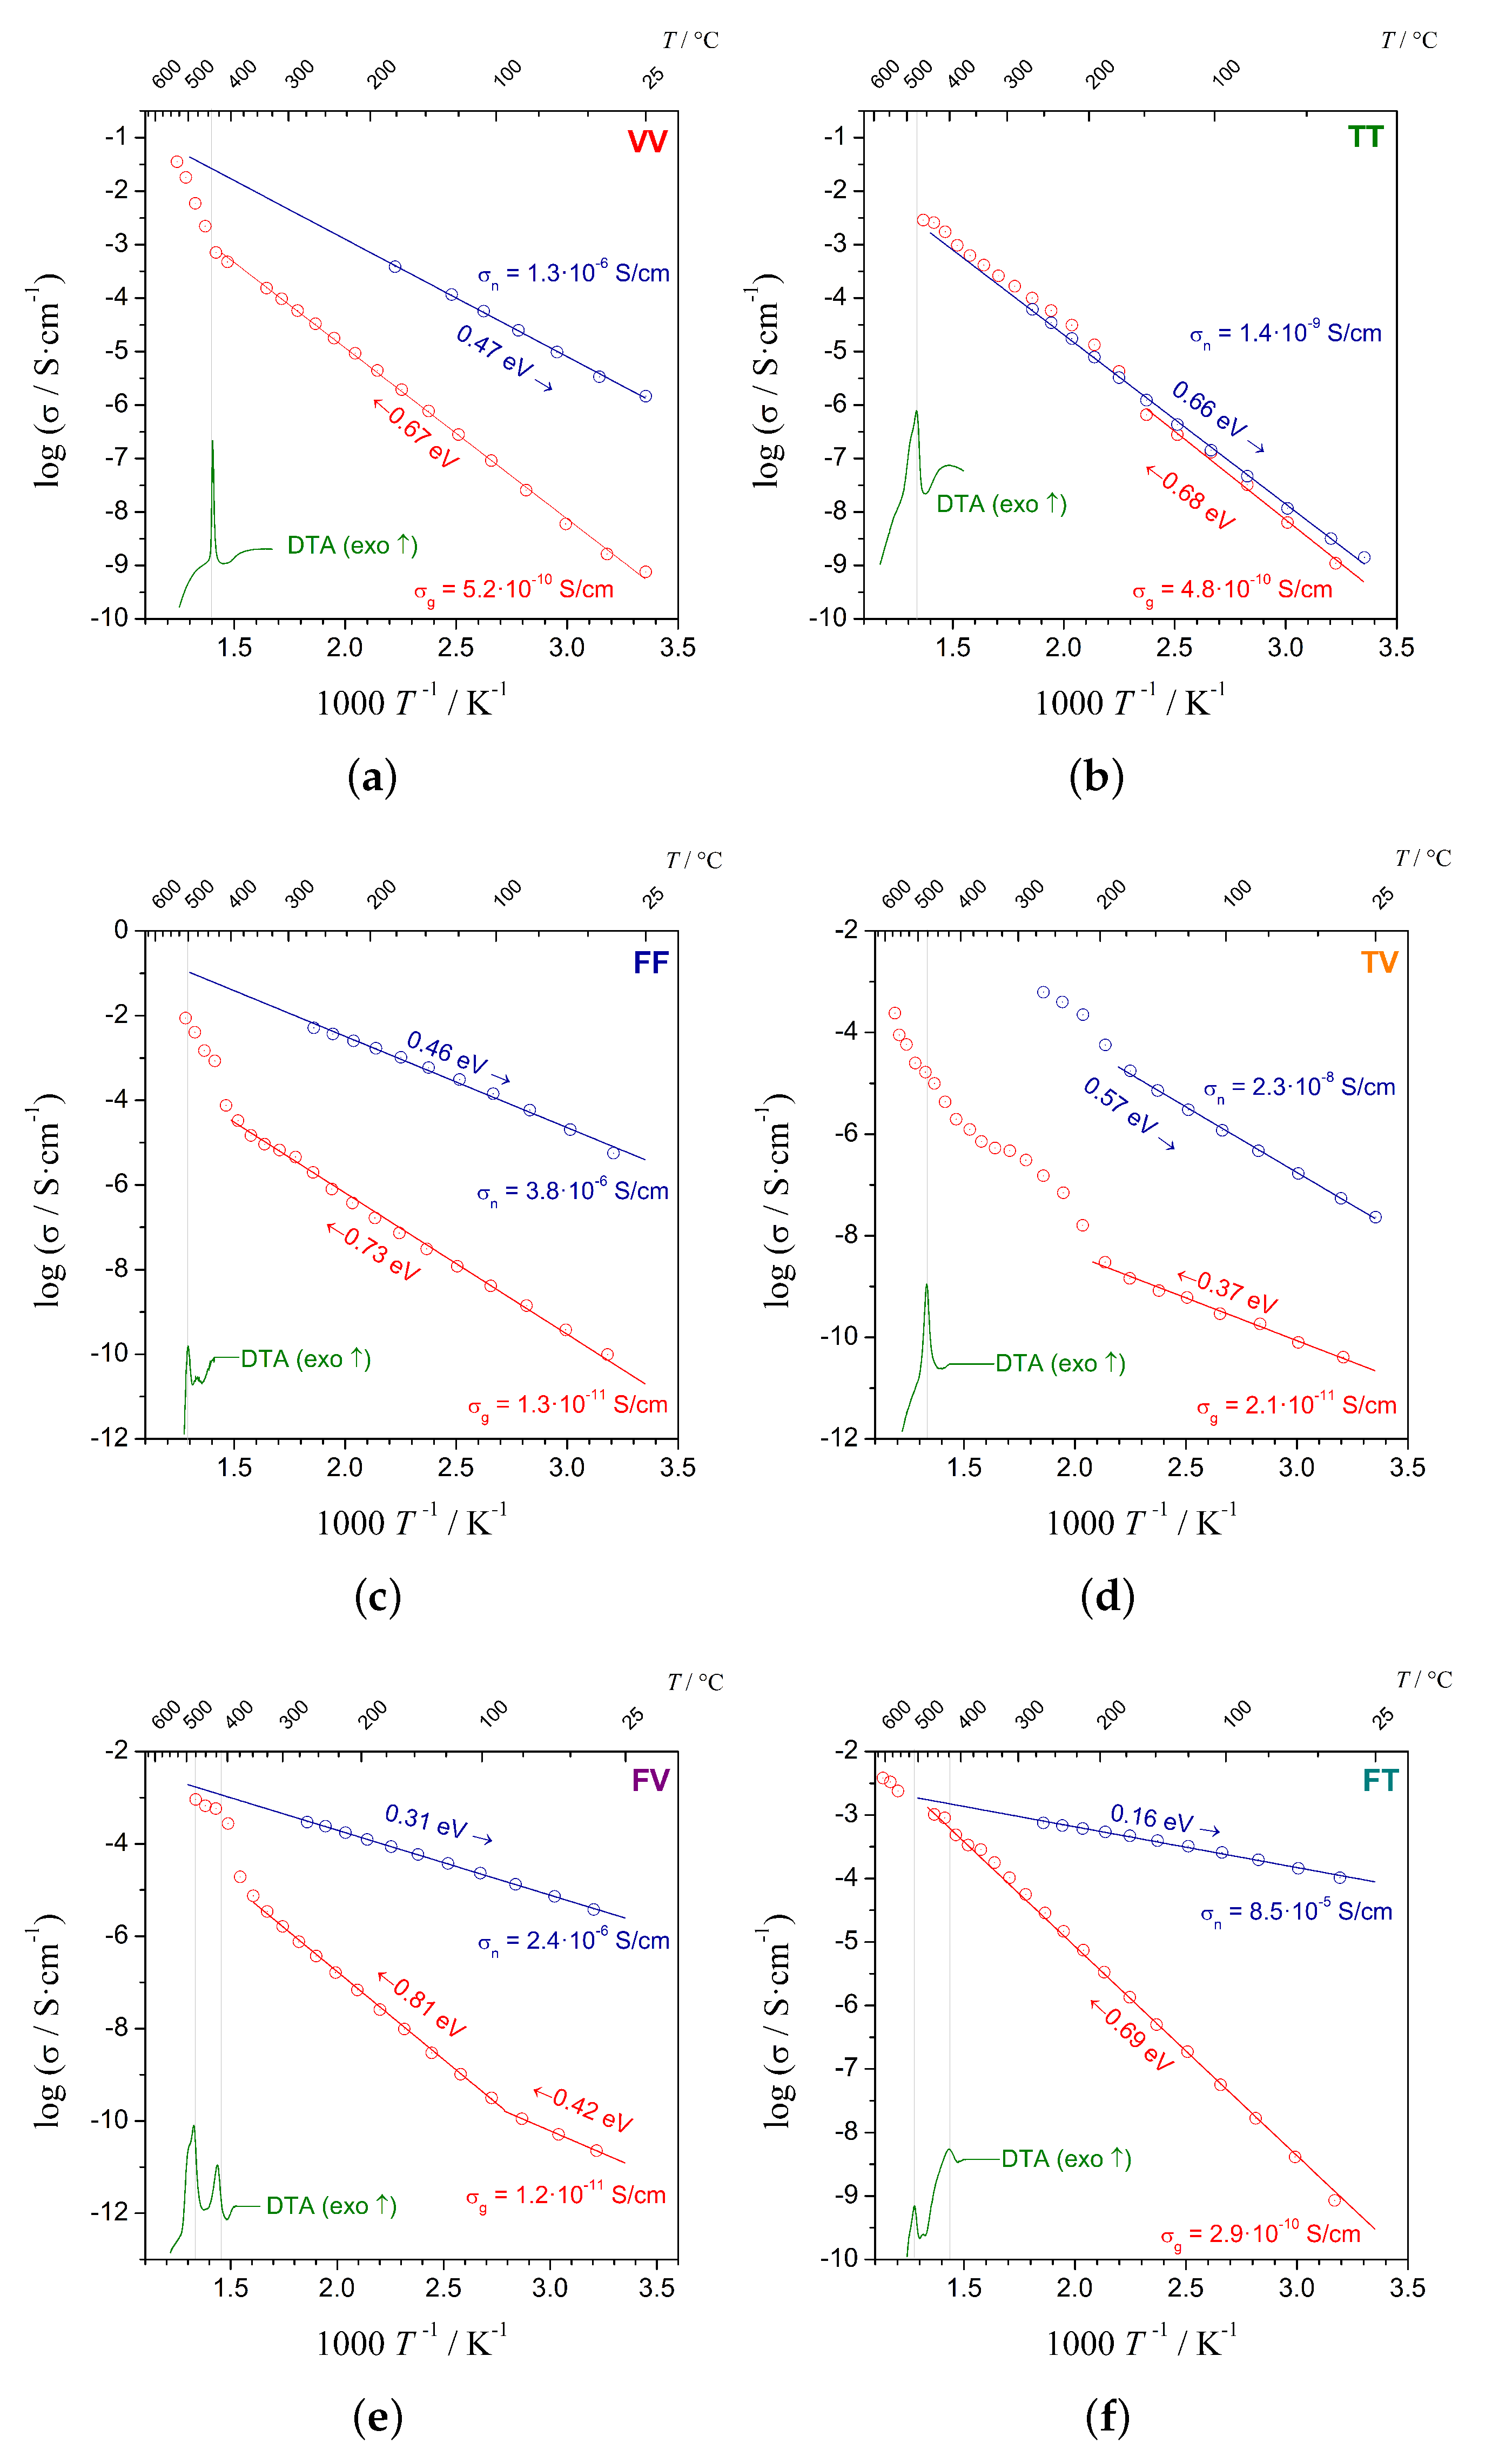
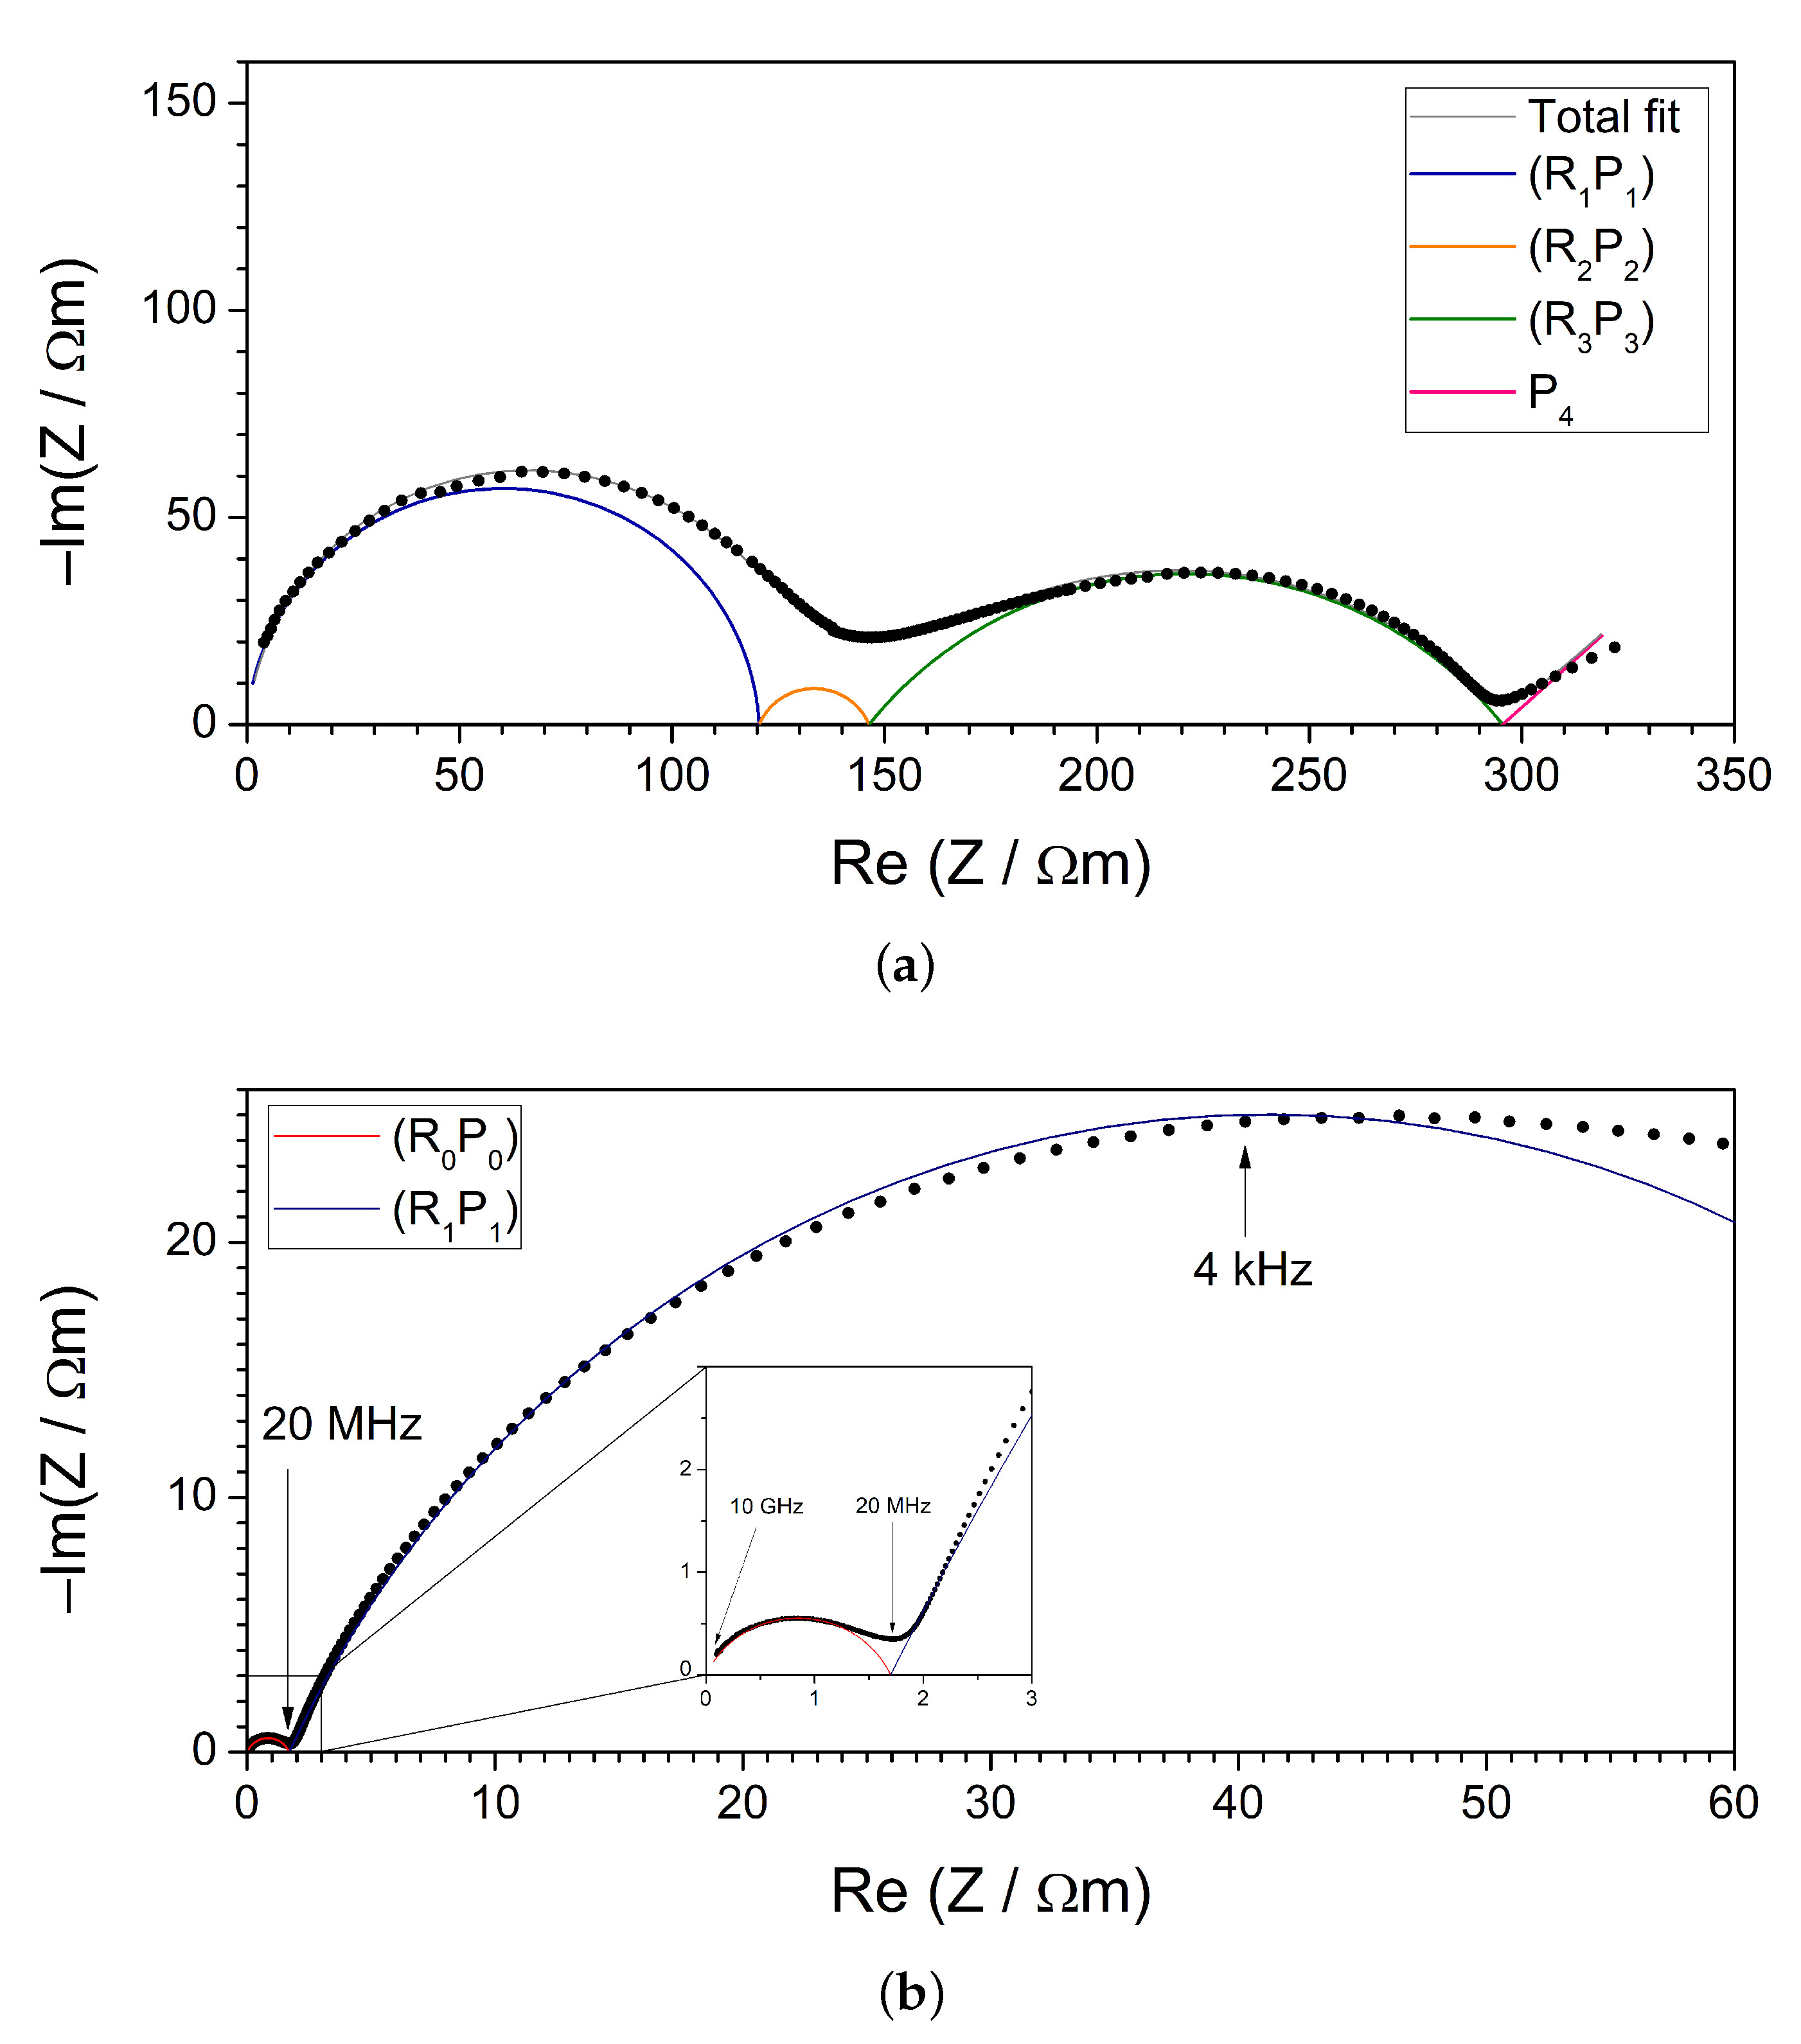
3.2. Impedance Spectroscopy (IS)

We carried out an in-depth investigation of the influence of the nanocrystallization temperature on the overall electrical conductivity of the samples. Figure 3 shows the room temperature conductivity of the samples after heat-treatment at given temperatures. The conductivity of the glassy samples, as well as DTA curves measured in argon flow at a constant heating rate of 1 C/min, are shown for comparison. DTA curves were typical for glassy materials (as compared to, e.g., [24]). They exhibited a step-like glass transition followed by one or two (sample FV) exothermic crystallization peaks. For VV, TT, TV and FV samples, it was observed that too high temperature is detrimental to electrical parameters. FF and FT samples, on the contrary, exhibited saturation-like dependency in a high nanocrystallization temperature range. Optimum temperature correlates with crystallization peaks on DTA curves. Namely, the optimum temperature is usually ca. 100 C higher than the maximum of the crystallization peak. However, the behavior differs between each composition (Table 3). The conductivity change is irreversible, which indicates that it is caused by the evolution of fine microstructure. For exemplary SEM images, one can be referred to the previous work [19].
In order to establish activation energy of the studied materials, we conducted in situ impedance measurements of glassy samples as well as samples heat-treated at optimum temperatures beforehand (Figure 4). Data points were plotted in Arrhenius coordinates, and linear ranges were selected on cooling and heating ramps. Subsequently, linear functions were fitted. The value of the activation energy E a is proportional to the slope of the fitted line according to the Arrhenius equation:
σ ( T ) = σ 0 T · exp E a k B T
Activation energies of glassy samples were in the range 0.67–0.81 eV (except for the TV sample—0.37 eV). At low temperatures, the FV glassy sample exhibited two activation energies—0.42 eV below ca. 100 C and 0.81 eV above that temperature. The activation energies dropped significantly after heat-treatment to values below 0.5 eV. The only exception was the TV sample—activation energy increased, but the final conductivity was still ca. 400 times higher than for the glassy sample. The values of the conductivity of the samples after nanocrystallization are in the range from ca. 10 9 (TT sample) to 10 4 S/cm (FT sample). Heat-treatment increased the values of conductivity by a factor of ca. 3 up to 3 × 10 5 compared to glassy samples. The values of optimal temperature, room temperature conductivity of the glassy and heat-treated samples and activation energies are summarized in Table 3.
The impedance of the nanocrystalline samples was investigated in-depth to correlate the electrical response with the microstructure of the nanomaterials. In Figure 5, Nyquist plots of the nanocrystalline sample VV measured at 270 C are shown. Figure 5a presents the impedance response measured at standard frequency range, namely 0.01 Hz—5 MHz. To obtain satisfactory fitting, an equivalent circuit consisting of three ( R P ) elements followed by a constant phase element (CPE) was proposed. However, in a high-frequency range, one can see an additional semicircle (Figure 5b) that was not observable in the standard frequency range. Therefore, a complete equivalent circuit model should be as follows: ( R 0 P 0 ) ( R 1 P 1 ) ( R 2 P 2 ) ( R 3 P 3 ) P 4 . A tentative physical meaning of the elements could be as follows: electronic conductivity of nanocrystalline shells, electronic conductivity of nanocrystalline cores, electronic conductivity of the residual glassy matrix and ionic conductivity of the residual glassy matrix. The serial CPE element stands for electrode-related processes, e.g., blocking of Na + ions at the interface. The important conclusion from these studies is that the high-frequency range may be very important to observe complete charge transfer processes in mixed electronic–ionic conductors. In the standard range, some processes (e.g., high conductivity of disordered nanocrystalline shells) may not be observable. The use of a serial ( R 2 P 2 ) ( R 3 P 3 ) circuit (Voight-type) to model mixed electronic–ionic conductivity of the glassy matrix was chosen because of its simplicity to be fitted to impedance data. However, a Maxwell equivalent circuit would have more physical meaning because ionic and electronic conductivity can be treated as parallel processes. Additionally, the ionic conductivity of crystalline cores and shells could be modeled by additional ( R P ) elements. Nevertheless, the satisfactory quality of the fitting may suggest that those processes are not distinct in the shape of the impedance figure. Hence, the conclusion is that the electronic conductivity in the nanocrystallites is predominant.

4. Conclusions

Electrical properties of six materials from the NASICON family were studied in this work: Na3 V2(PO4)2F3—VV, Na3Ti2(PO4)2F3—TT, Na3Fe2(PO4)2F3 (FF), Na3TiV(PO4)2F3—TV, Na3FeV(PO4)2F3—FV and Na3FeTi(PO4)2F3—FT. Conditions of the thermal nanocrystallization process were optimized in order to synthesize samples with maximal electrical conductivity. The highest value was obtained for the FT sample and was equal to 8.5 × 10 5 S/cm. Most of the samples exhibited RT conductivity better than 10 6 S/cm, and for all of the samples it was higher than 10 9 S/cm. Therefore, the nanocrystalline samples synthesized within this work have competing electronic conductivity, in comparison with their polycrystalline counterparts. Overall, the nanocrystallization in argon flow at the optimized temperatures resulted in much better conductivities than was demonstrated in previous work as shown in Table 4.
Similar to our previous optimization of alluaudite-like nanomaterials [20], each material required a different heat-treatment temperature, which correlates with temperatures of thermal events observed by DTA. It was also shown that nanomaterials with still modest conductivity (i.e. TT and TV) exhibited high activation energies (above 0.5 eV), whereas nanomaterials with significantly enhanced conductivity exhibited lower activation energies (below 0.50 eV, down to 0.16 eV). Such behavior is in agreement with our previous observation of nanocrystallized vanadium-doped olivine-like glasses [25].
Impedance spectroscopy measurements conducted in an ultra-wide frequency range (from 10 mHz to 10 GHz, i.e., 12 decades) were essential to observe the plethora of charge transfer processes occurring in these nanostructured mixed electronic–ionic conductors.
Synthesis of the NASICON-family materials with satisfying phase purity via nanocrystallization of glassy analogs is much more challenging than for the alluaudite family [20]. The least presence of secondary phases was observed in VV, TT and TV samples. The FF sample does not crystallize in a tetragonal Na3V2(PO4)2F3 (ICSD 98-008-8808) system but has a strong tendency to form an NASICON rhombohedral analog γ—Na3Fe2(PO4)3 (ICDD 04-011-4360).
When considering whether to use such nanocrystalline materials prepared in optimized conditions as electrodes in prototype sodium cells, one has to take into account that most probably the addition of carbon at the step of layer preparation would still be needed in order to provide reasonable C-rates.
Taking into consideration these studies along with our work on materials from the alluaudite family [20], we conclude that it is crucial to look for individual conditions of the nanocrystallization process of glasses, even though the materials’ crystal structures are alike.

Author Contributions

Conceptualization, funding acquisition, J.E.G. and T.K.P.; supervision and methodology, A.K. and T.K.P.; investigation, M.N., A.H. and E.K.; visualisation, M.N., A.H. and T.K.P.; writing—original draft preparation, M.N. and T.K.P. All authors have read and agreed to the published version of the manuscript.

Funding

This research was funded by POB Energy of Warsaw University of Technology within the Excellence Initiative: Research University (IDUB) programme.

Institutional Review Board Statement

Not applicable.

Informed Consent Statement

Not applicable.

Data Availability Statement

Data sharing not applicable.

Conflicts of Interest

The authors declare no conflict of interest.

Abbreviations

The following abbreviations are used in this manuscript:
NASICONNA-Super-Ionic-CONductor
XRDX-ray Diffractometry
DTADifferential Thermal analysis
ISImpedance Spectroscopy
RTRoom Temperature

References

  1. International Renewable Energy Agency. World Energy Transitions Outlook 2022: 1.5 °C Pathway; International Renewable Energy Agency: Abu Dhabi, United Arab Emirates, 2022. [Google Scholar]
  2. Goodenough, J.B.; Kim, Y. Challenges for Rechargeable Li Batteries. Chem. Mater. 2010, 22, 587–603. [Google Scholar] [CrossRef]
  3. Nitta, N.; Wu, F.; Lee, J.T.; Yushin, G. Li-ion battery materials: Present and future. Mater. Today 2015, 18, 252–264. [Google Scholar] [CrossRef]
  4. Canepa, P.; Gautam, G.S.; Hannah, D.C.; Malik, R.; Liu, M.; Gallagher, K.G.; Persson, K.A.; Ceder, G. Odyssey of Multivalent Cathode Materials: Open Questions and Future Challenges. Chem. Rev. 2017, 117, 4287–4341. [Google Scholar] [CrossRef]
  5. Hwang, J.-Y.; Myung, S.-T.; Sun, Y.-K. Sodium-ion batteries: Present and future. Chem. Soc. Rev. 2017, 46, 3529–3614. [Google Scholar] [CrossRef] [Green Version]
  6. Chen, S.; Wu, C.; Shen, L.; Zhu, C.; Huang, Y.; Xi, K.; Maier, J.; Yu, Y. Challenges and Perspectives for NASICON-Type Electrode Materials for Advanced Sodium-Ion Batteries. Adv. Mater. 2017, 29, 1700431. [Google Scholar] [CrossRef] [PubMed]
  7. Gandhi, S.; Vaddadi, V.S.C.S.; Panda, S.S.S.; Goona, N.K.; Parne, S.R.; Lakavat, M.; Bhaumik, A. Recent progress in the development of glass and glass-ceramic cathode/solid electrolyte materials for next-generation high capacity all-solid-state sodium-ion batteries: A review. J. Power Sources 2022, 521, 230930. [Google Scholar] [CrossRef]
  8. Ahsan, M.T.; Ali, Z.; Usman, M.; Hou, Y. Unfolding the structural features of NASICON materials for sodium-ion full cells. Carbon Energy 2022, 4, 776–819. [Google Scholar] [CrossRef]
  9. Muruganantham, R.; Chiu, Y.T.; Yang, C.C.; Wang, C.W.; Liu, W.R. An efficient evaluation of F-doped polyanion cathode materials with long cycle life for Na-ion batteries applications. Sci. Rep. 2017, 7, 14808. [Google Scholar] [CrossRef] [Green Version]
  10. Novikova, S.A.; Larkovich, R.V.; Chekannikov, A.A.; Kulova, T.L.; Skundin, A.M.; Yaroslavtsev, A.B. Electrical conductivity and electrochemical characteristics of Na3V2(PO4)3-based NASICON-type materials. Inorg Mater. 2018, 54, 794–804. [Google Scholar] [CrossRef]
  11. Goodenough, J.B.; Hong, H.Y.-P.; Kafalas, J.A. Fast Na+—ion transport in skeleton structures. Mater. Res. Bull. 1976, 11, 203–220. [Google Scholar] [CrossRef]
  12. Anantharamulu, N.; Rao, K.K.; Rambabu, G.; Kumar, B.V.; Radha, V.; Vithal, M. A wide-ranging review on Nasicon type materials. J. Mater. Sci. 2011, 46, 2821–2837. [Google Scholar] [CrossRef]
  13. Meins, J.M.L.; Crosnier-Lopez, M.P.; Hemon-Ribaud, A.; Courbion, G. Phase Transitions in the Na3M2(PO4)2F3 Family (M = Al3+, V3+, Cr3+, Fe3+, Ga3+): Synthesis, Thermal, Structural, and Magnetic Studies. J. Solid State Chem. 1999, 148, 260–277. [Google Scholar] [CrossRef]
  14. Matts, I.L. Multi-Redox Active Polyanionic Cathodes for Alkali-ion Batteries. Ph.D. Thesis, Massachusetts Institute of Technology, Cambridge, MA, USA, 2016. [Google Scholar]
  15. Chihara, K.; Kitajou, A.; Gocheva, I.D.; Okada, S.; Yamaki, J. Cathode properties of Na3M2(PO4)2F3 [M = Ti, Fe, V] for sodium-ion batteries. J. Power Sources 2013, 227, 80–85. [Google Scholar] [CrossRef]
  16. Matts, I.; Dacek, S.; Pietrzak, T.K.; Ceder, G. Explaining Performance-limiting Mechanisms in Fluorophosphate Na-ion Battery Cathodes Through Inactive Transition Metal Mixing and Firstprinciples Mobility Calculations. Chem. Mater. 2015, 27, 6008–6015. [Google Scholar] [CrossRef]
  17. Sharma, L.; Adiga, S.P.; Alshareef, H.N.; Barpanda, P. Fluorophosphates: Next Generation Cathode Materials for Rechargeable Batteries. Av. Energy Mater. 2020, 10, 2001449. [Google Scholar] [CrossRef]
  18. Pietrzak, T.K.; Wasiucionek, M.; Garbarczyk, J.E. Towards Higher Electric Conductivity and Wider Phase Stability Range via Nanostructured Glass-Ceramics Processing. Nanomaterials 2021, 11, 1321. [Google Scholar] [CrossRef]
  19. Pietrzak, T.K.; Kruk-Fura, P.E.; Mikołajczuk, P.J.; Garbarczyk, J.E. Syntheses and nanocrystallization of NaF-M2O3-P2O5 NASICON-like phosphate glasses (M = V, Ti, Fe). Int. J. Appl. Glass Sci. 2020, 11, 87–96. [Google Scholar] [CrossRef] [Green Version]
  20. Nowagiel, M.; Samsel, M.J.; Pietrzak, T.K. Towards high phase purity of nanostructured alluaudite-type glass-ceramics cathode materials for sodium ion batteries. Materials 2021, 14, 4997. [Google Scholar] [CrossRef]
  21. Pietrzak, T.K. Multi-device software for impedance spectroscopy measurements with stabilization in low and high temperature ranges working under Linux environment. Ionics 2019, 25, 2445–2452. [Google Scholar] [CrossRef] [Green Version]
  22. Kežionis, A.; Kazlauskas, S. High temperature ultrabroadband impedance spectrometer. In Proceedings of the International Workshop on Impedance Spectroscopy 2013, Chemnitz, Germany, 25–27 September 2013; pp. 32–33. [Google Scholar]
  23. Kežionis, A.; Kazlauskas, S.; Petrulionis, D.; Orliukas, A.F. Broadband Method for the Determination of Small Sample’s Electrical and Dielectric Properties at High Temperatures. IEEE Trans. Microw. Theory Tech. 2014, 62, 2456–2461. [Google Scholar] [CrossRef]
  24. Michalski, P.P.; Pietrzak, T.K.; Nowiński, J.L.; Wasiucionek, M.; Garbarczyk, J.E. Dependence of a glass transition temperature on a heating rate in DTA experiments for glasses containing transition metal oxides. J. Non Cryst. Solids 2016, 443, 155–161. [Google Scholar] [CrossRef]
  25. Garbarczyk, J.E.; Pietrzak, T.K.; Wasiucionek, M.; Kaleta, A.; Dorau, A.; Nowiński, J.L. High electronic conductivity in nanostructured materials based on lithium-iron-vanadate-phosphate glasses. Solid State Ionics 2015, 272, 53–59. [Google Scholar] [CrossRef]
Figure 1. XRD patterns of as-synthesized NASICON-like glasses. Reflexes in FF sample were ascribed to the following phases: up-triangles—orthorhombic Na4(P2O7) (ICDD 04-018-4331); down-triangles—rhombohedral Fe2O3 (ICDD 01-086-8845), club—unidentified.
Coatings 13 00482 g001
Figure 2. XRD patterns of nanocrystallized NASICON-like glasses. Na3V2(PO4)2F3 NASICON (ICSD card no. 98-008-8808) and γ—Na3Fe2(PO4)3 NASICON analogue patterns (ICDD 04-011-4360) are given as reference. Reflexes that could not be ascribed to either of the aforementioned phases were identified as coming from the following ones: crosses—monoclinic NaVO3 (ICSD 98-006-3479), open diamonds—orthorombic Na5Ti(PO4)2OF (ICDD 01-079-0411), full diamonds—cubic NaF (ICDD 04-019-2673), stars—orthorombic Na2FePO4F (ICSD 98-019-4076), open circles—hexagonal V2O3 (ICSD 98-000-1874), full circles—cubic V3O4 (ICDD 04-002-6772), open squares—orthorombic Na4TiP2O9 (ICSD 98-003-9702), full squares—hexagonal Fe2O3 (ICSD 98-041-5251).
Coatings 13 00482 g002
Figure 3. Electrical conductivity of samples at room temperature after their nanocrystallization at different maximum temperatures. The conductivity of the starting glass ( σ g ) is marked with a horizontal line. DTA traces taken at 1 C/min are given for comparison: (a) VV; (b) TT; (c) FF; (d) TV; (e) FV; (f) FT.
Coatings 13 00482 g003
Figure 4. Temperature dependencies of electrical conductivity upon heating of glassy samples (red circles) and samples nanocrystallized at optimum temperature (blue circles). The activation energies are given along with the value of the room temperature conductivities. DTA traces measured at 1 C/min are provided for comparison: (a) VV; (b) TT; (c) FF; (d) TV; (e) FV; (f) FT.
Coatings 13 00482 g004
Figure 5. Exemplary impedance figures (Nyquist plots) of a nanocrystalline VV NASICON sample in (a) 10 mHz–5 MHz and (b) up to 7 GHz range. Total fits (gray lines) and partial fits of (RP) elements (colorful solid line) are included in the plots. The absolute values were normalized using the geometrical factor of the samples to show the material’s resistivity; (c) the equivalent circuit used for total fit.
Coatings 13 00482 g005aCoatings 13 00482 g005b
Table 1. Sample IDs and reagents used in their syntheses.
IDCompoundReagents
VVNa3V2(PO4)2F3NaF, V2O5, NH4H2PO4
TTNa3Ti2(PO4)2F3NaF, TiO2, NH4H2PO4
FFNa3Fe2(PO4)2F3NaF, FePO4 · 2H2O
TVNa3TiV(PO4)2F3NaF, TiO2, V2O5, NH4H2PO4
FVNa3FeV(PO4)2F3NaF, FePO4 · 2H2O, V2O5, NH4H2PO4
FTNa3FeTi(PO4)2F3NaF, FePO4 · 2H2O, TiO2, NH4H2PO4
Table 2. Chemicals used to synthesize the glasses; purity given by manufacturer.
ChemicalPurityManufacturer
NaF⩾99%Sigma-Aldrich (Darmstad, Germany)
FePO4 · 2H2OpureCarl Roth (Karlsruhe, Germany)
V2O5⩾99.6%Sigma-Aldrich (Darmstadt, Germany)
TiO2⩾99.8%Sigma-Aldrich (Darmstadt, Germany)
NH4H2PO4⩾99%Polish Chemicals (Gliwice, Poland)
Table 3. Summary of total room temperature electrical conductivities of as-synthesized (glassy) and heat-treated (nano) samples. Conductivity values refer to Figure 3. Activation energies were determined from fitting parameters of Arrhenius Formula (1) to data in Figure 4. For each sample, optimal nanocrystallization temperature is given as well.
Sample T opt / C σ glass (25 C)/Scm 1 E a (Glass)/eV σ Nano (25 C)/Scm 1 E a (Nano)/eV
VV5325.2 × 10 10 0.671.3 × 10 6 0.47
TT4574.8 × 10 10 0.681.5 × 10 8 0.66
FF5561.3 × 10 11 0.733.2 × 10 6 0.46
TV6072.1 × 10 11 0.372.4 × 10 7 0.57
FV5061.2 × 10 11 0.42/0.814.0 × 10 6 0.31
FT6072.9 × 10 10 0.698.4 × 10 5 0.16
Table 4. Summary of total conductivities and activation energies of the samples obtained via the optimized nanocrystallization procedure. For comparison, the best data from previous work are given.
This WorkBest Values from [19]
Sample σ nano (25 C)/Scm 1 E a (nano)/eV σ nano (25 C)/Scm 1 E a (nano)/eV
VV1.3  × 10 6 0.478.9  × 10 8 0.53
TT1.5  × 10 8 0.661.3  × 10 10 0.65
FF3.2  × 10 6 0.465.5  × 10 11 0.68
TV2.4  × 10 7 0.574.8  × 10 10 0.69
FV4.0  × 10 6 0.311.4  × 10 11 0.68
FT8.4  × 10 5 0.161.8  × 10 11 0.70
Disclaimer/Publisher’s Note: The statements, opinions and data contained in all publications are solely those of the individual author(s) and contributor(s) and not of MDPI and/or the editor(s). MDPI and/or the editor(s) disclaim responsibility for any injury to people or property resulting from any ideas, methods, instructions or products referred to in the content.

