.jpg)
Corrosion Mechanisms of a Biodegradable Zn-0.4Li Alloy in Simulated Gastrointestinal Environment

 ,
,
Abstract
:1. Introduction
2. Materials and Methods
2.1. Alloy Preparation
2.2. Immersion Tests
2.3. Microstructure Observation and Corrosion Product Analysis
2.4. Electrochemical Measurements
3. Results
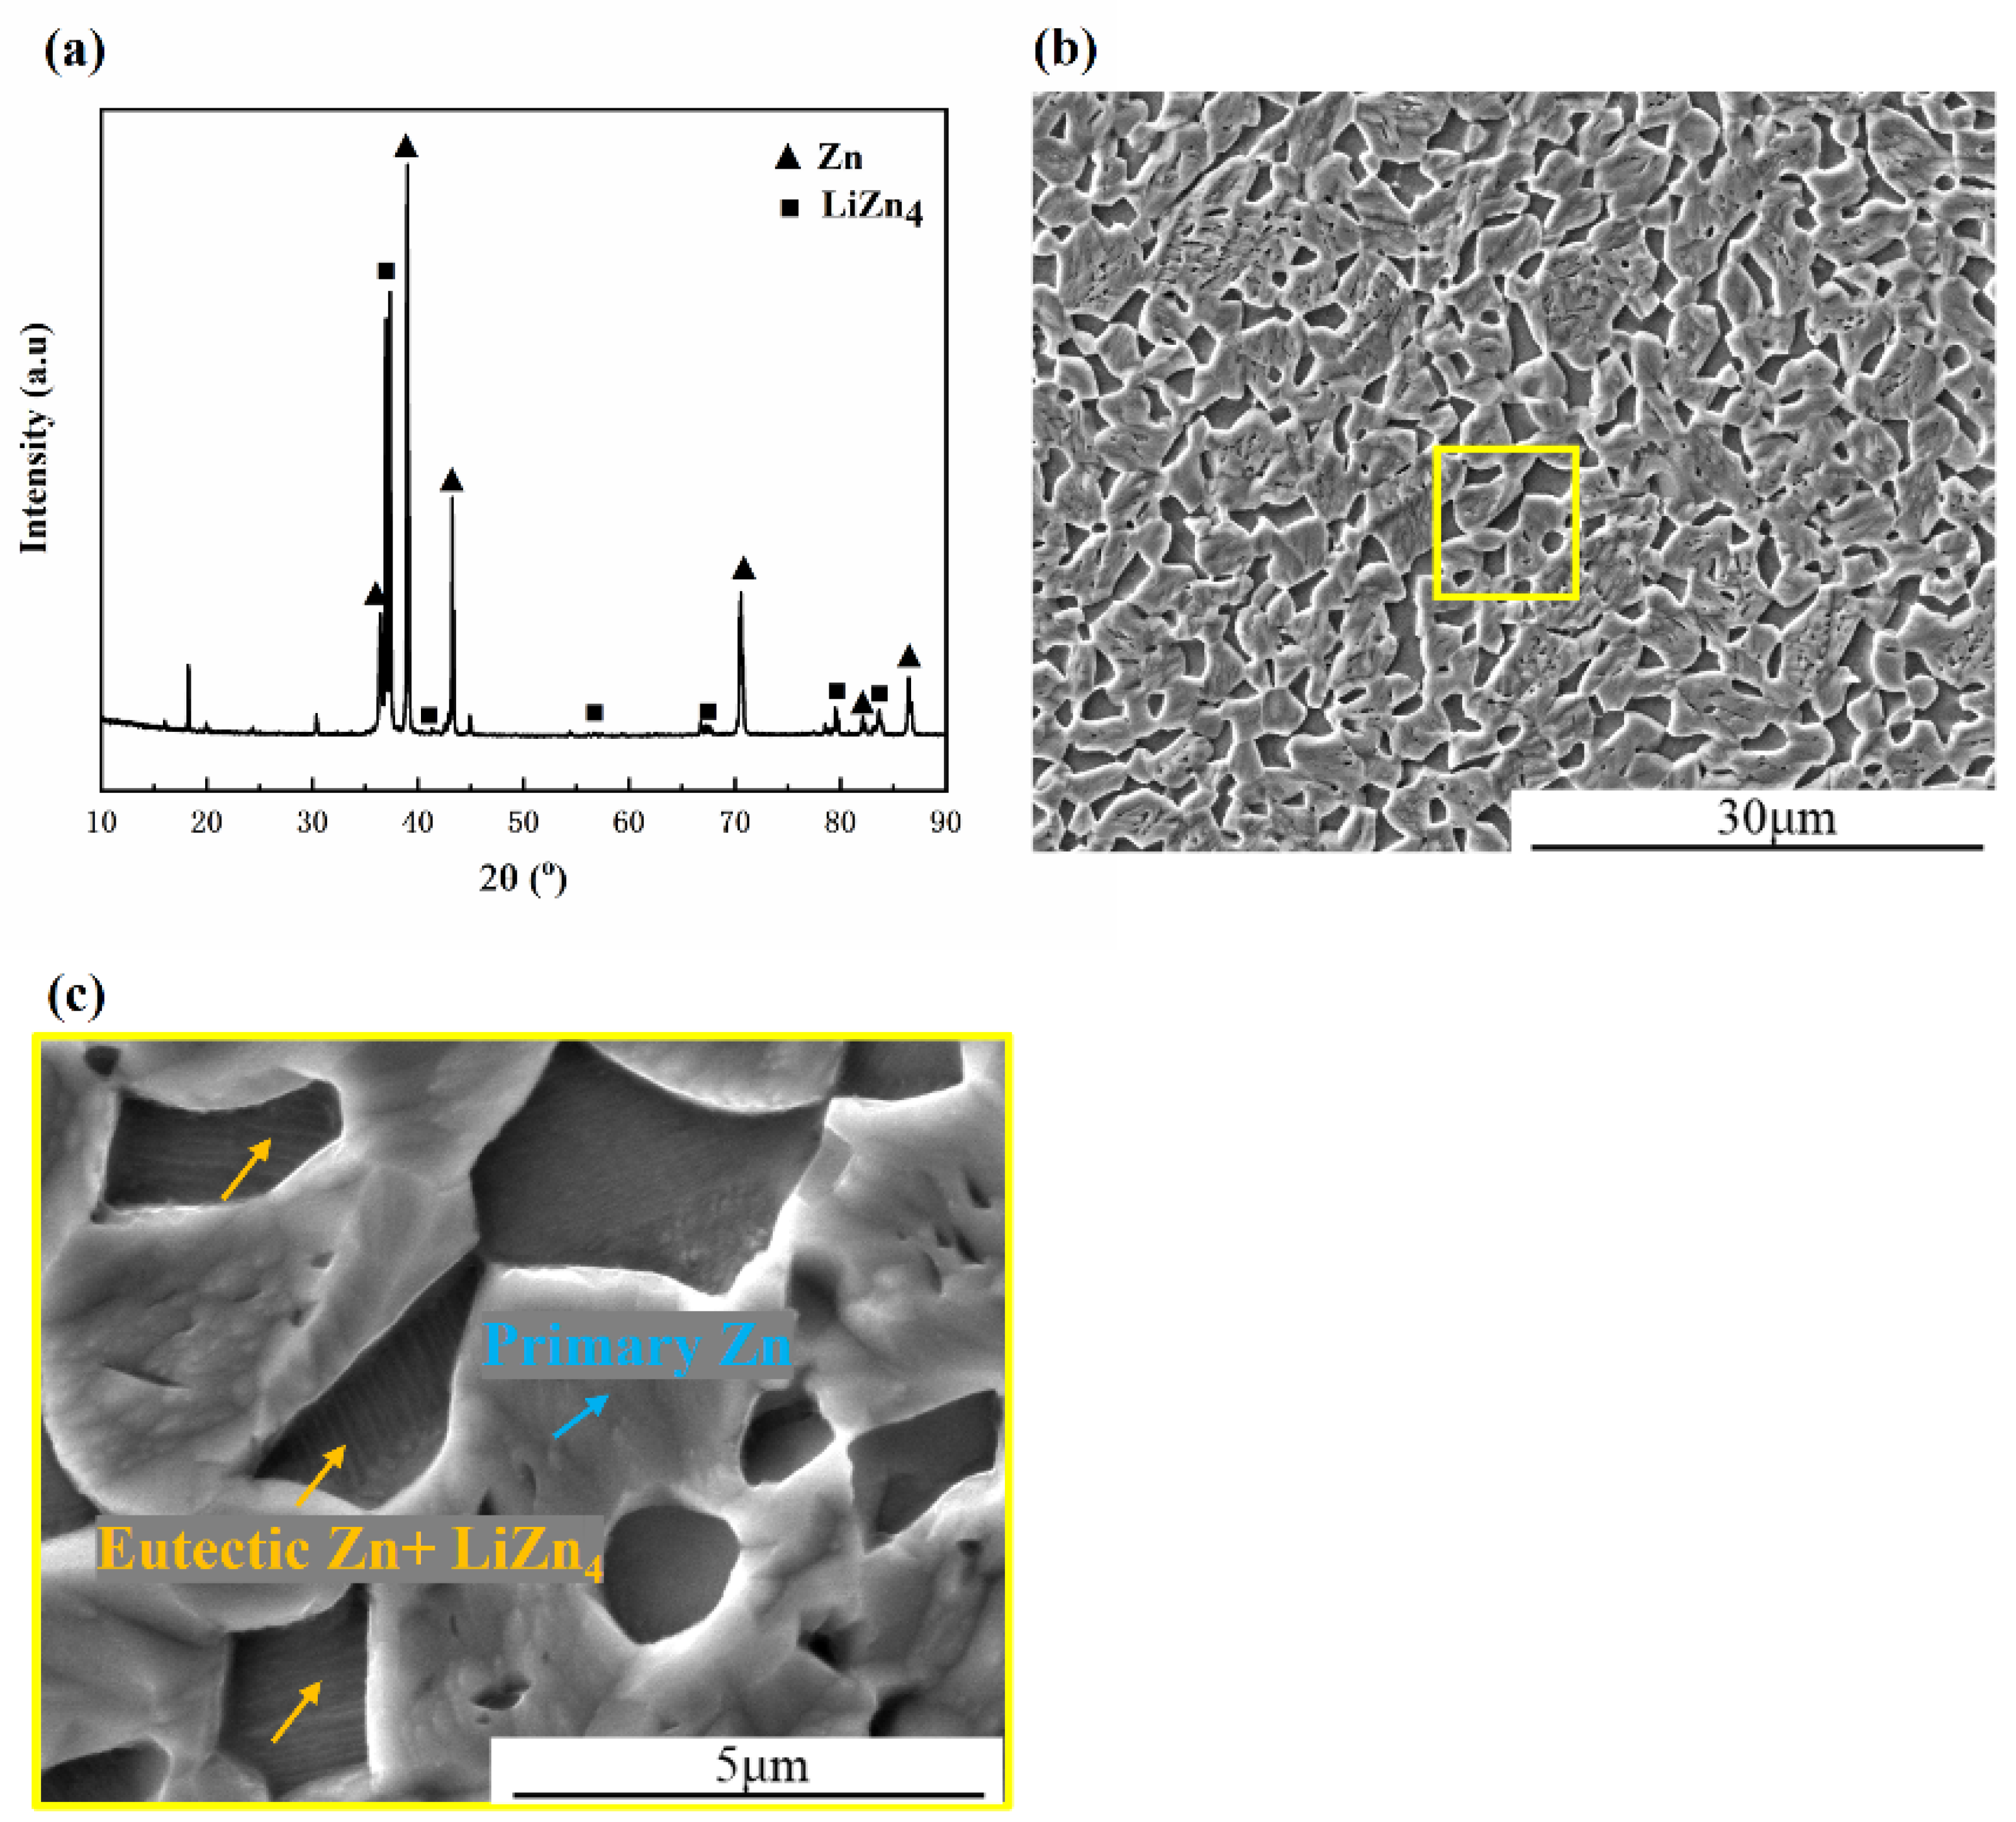
3.1. Microstructure Characterization
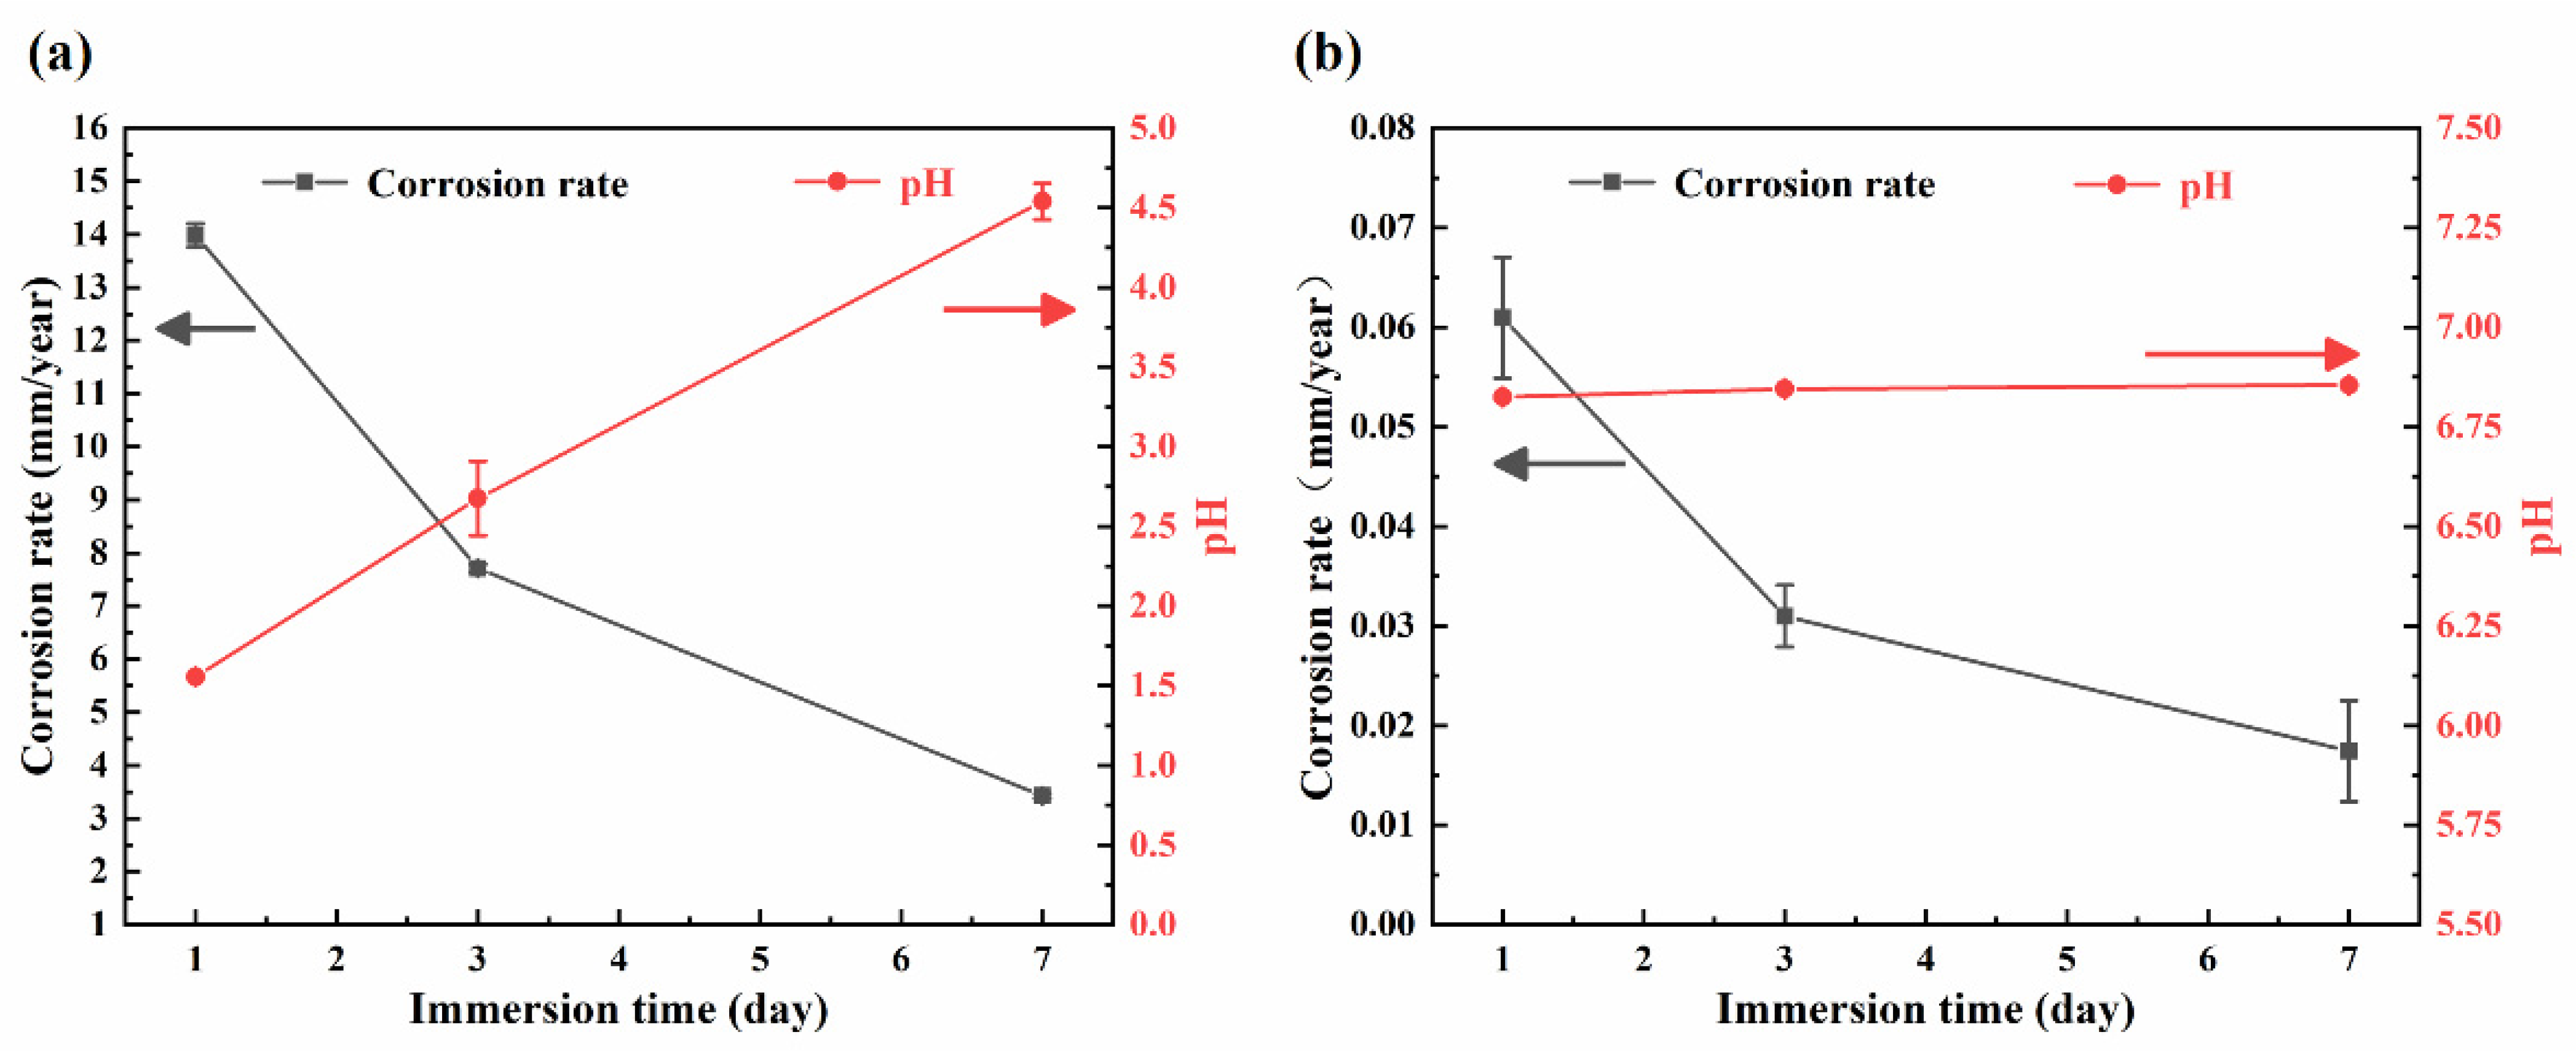
3.2. Immersion Test
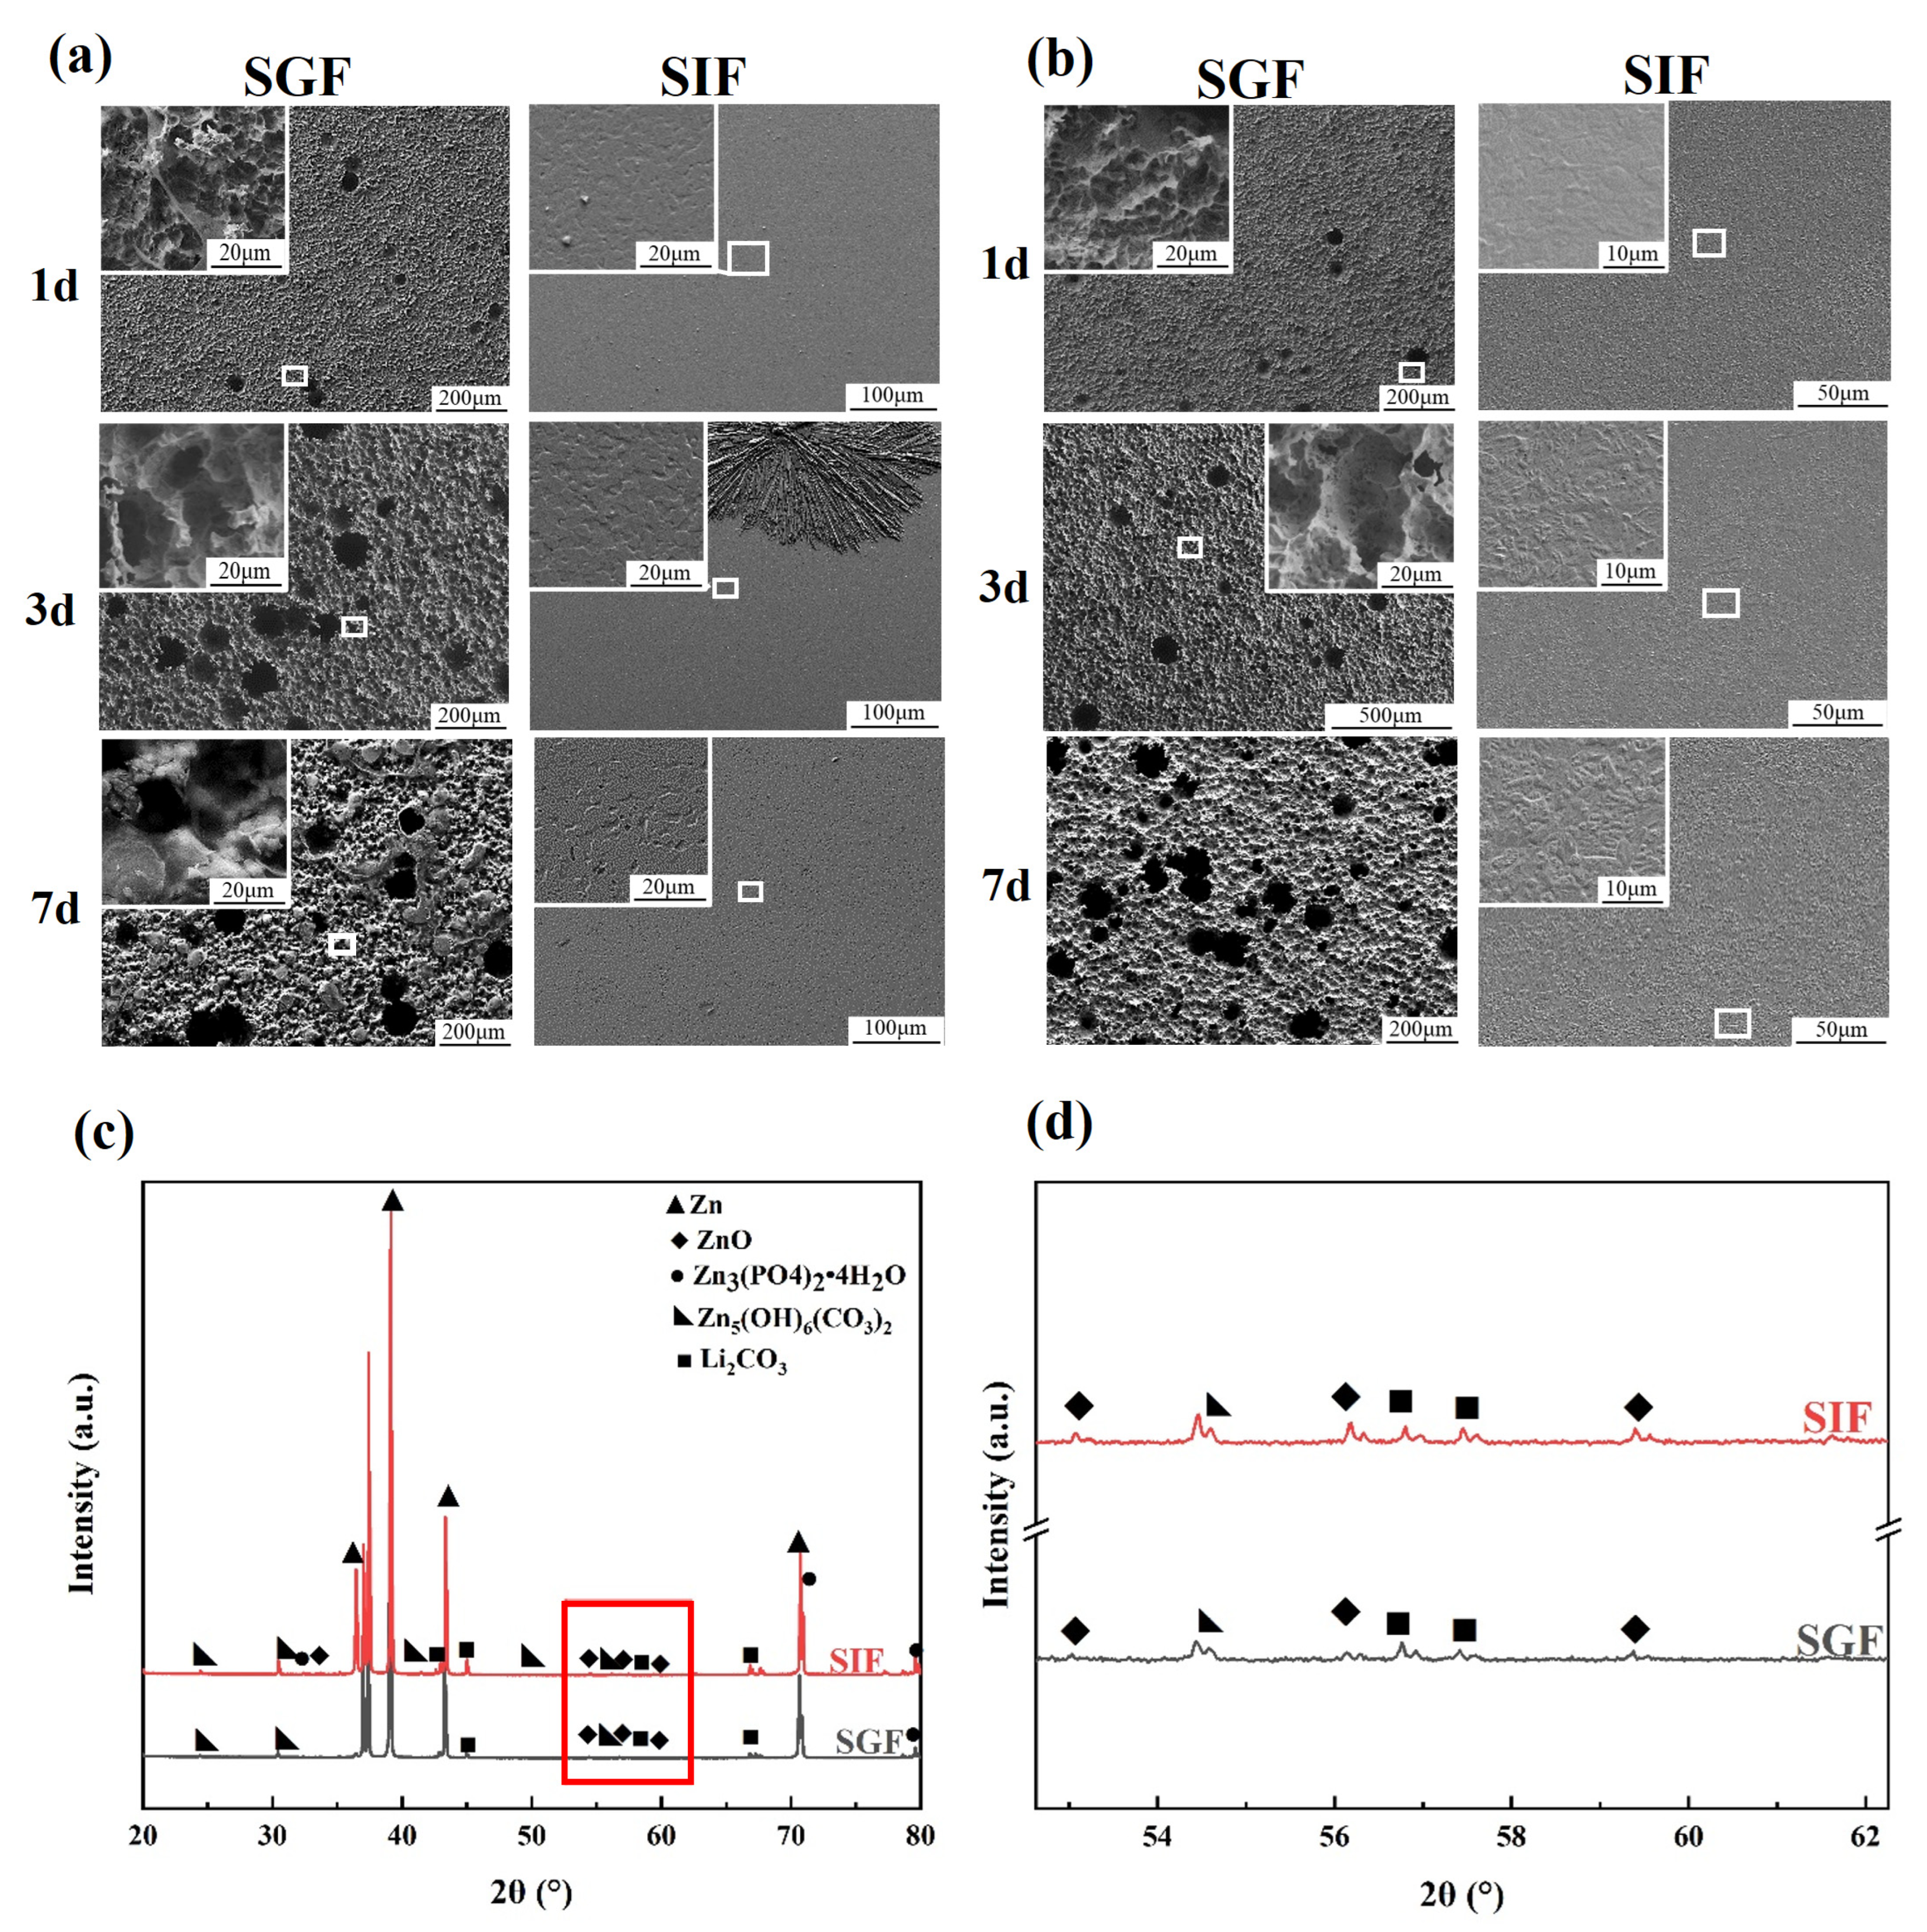
3.3. Surface Morphology and Chemical Composition
3.4. Competitive Mechanisms of Zn and Li in the Degradation Process
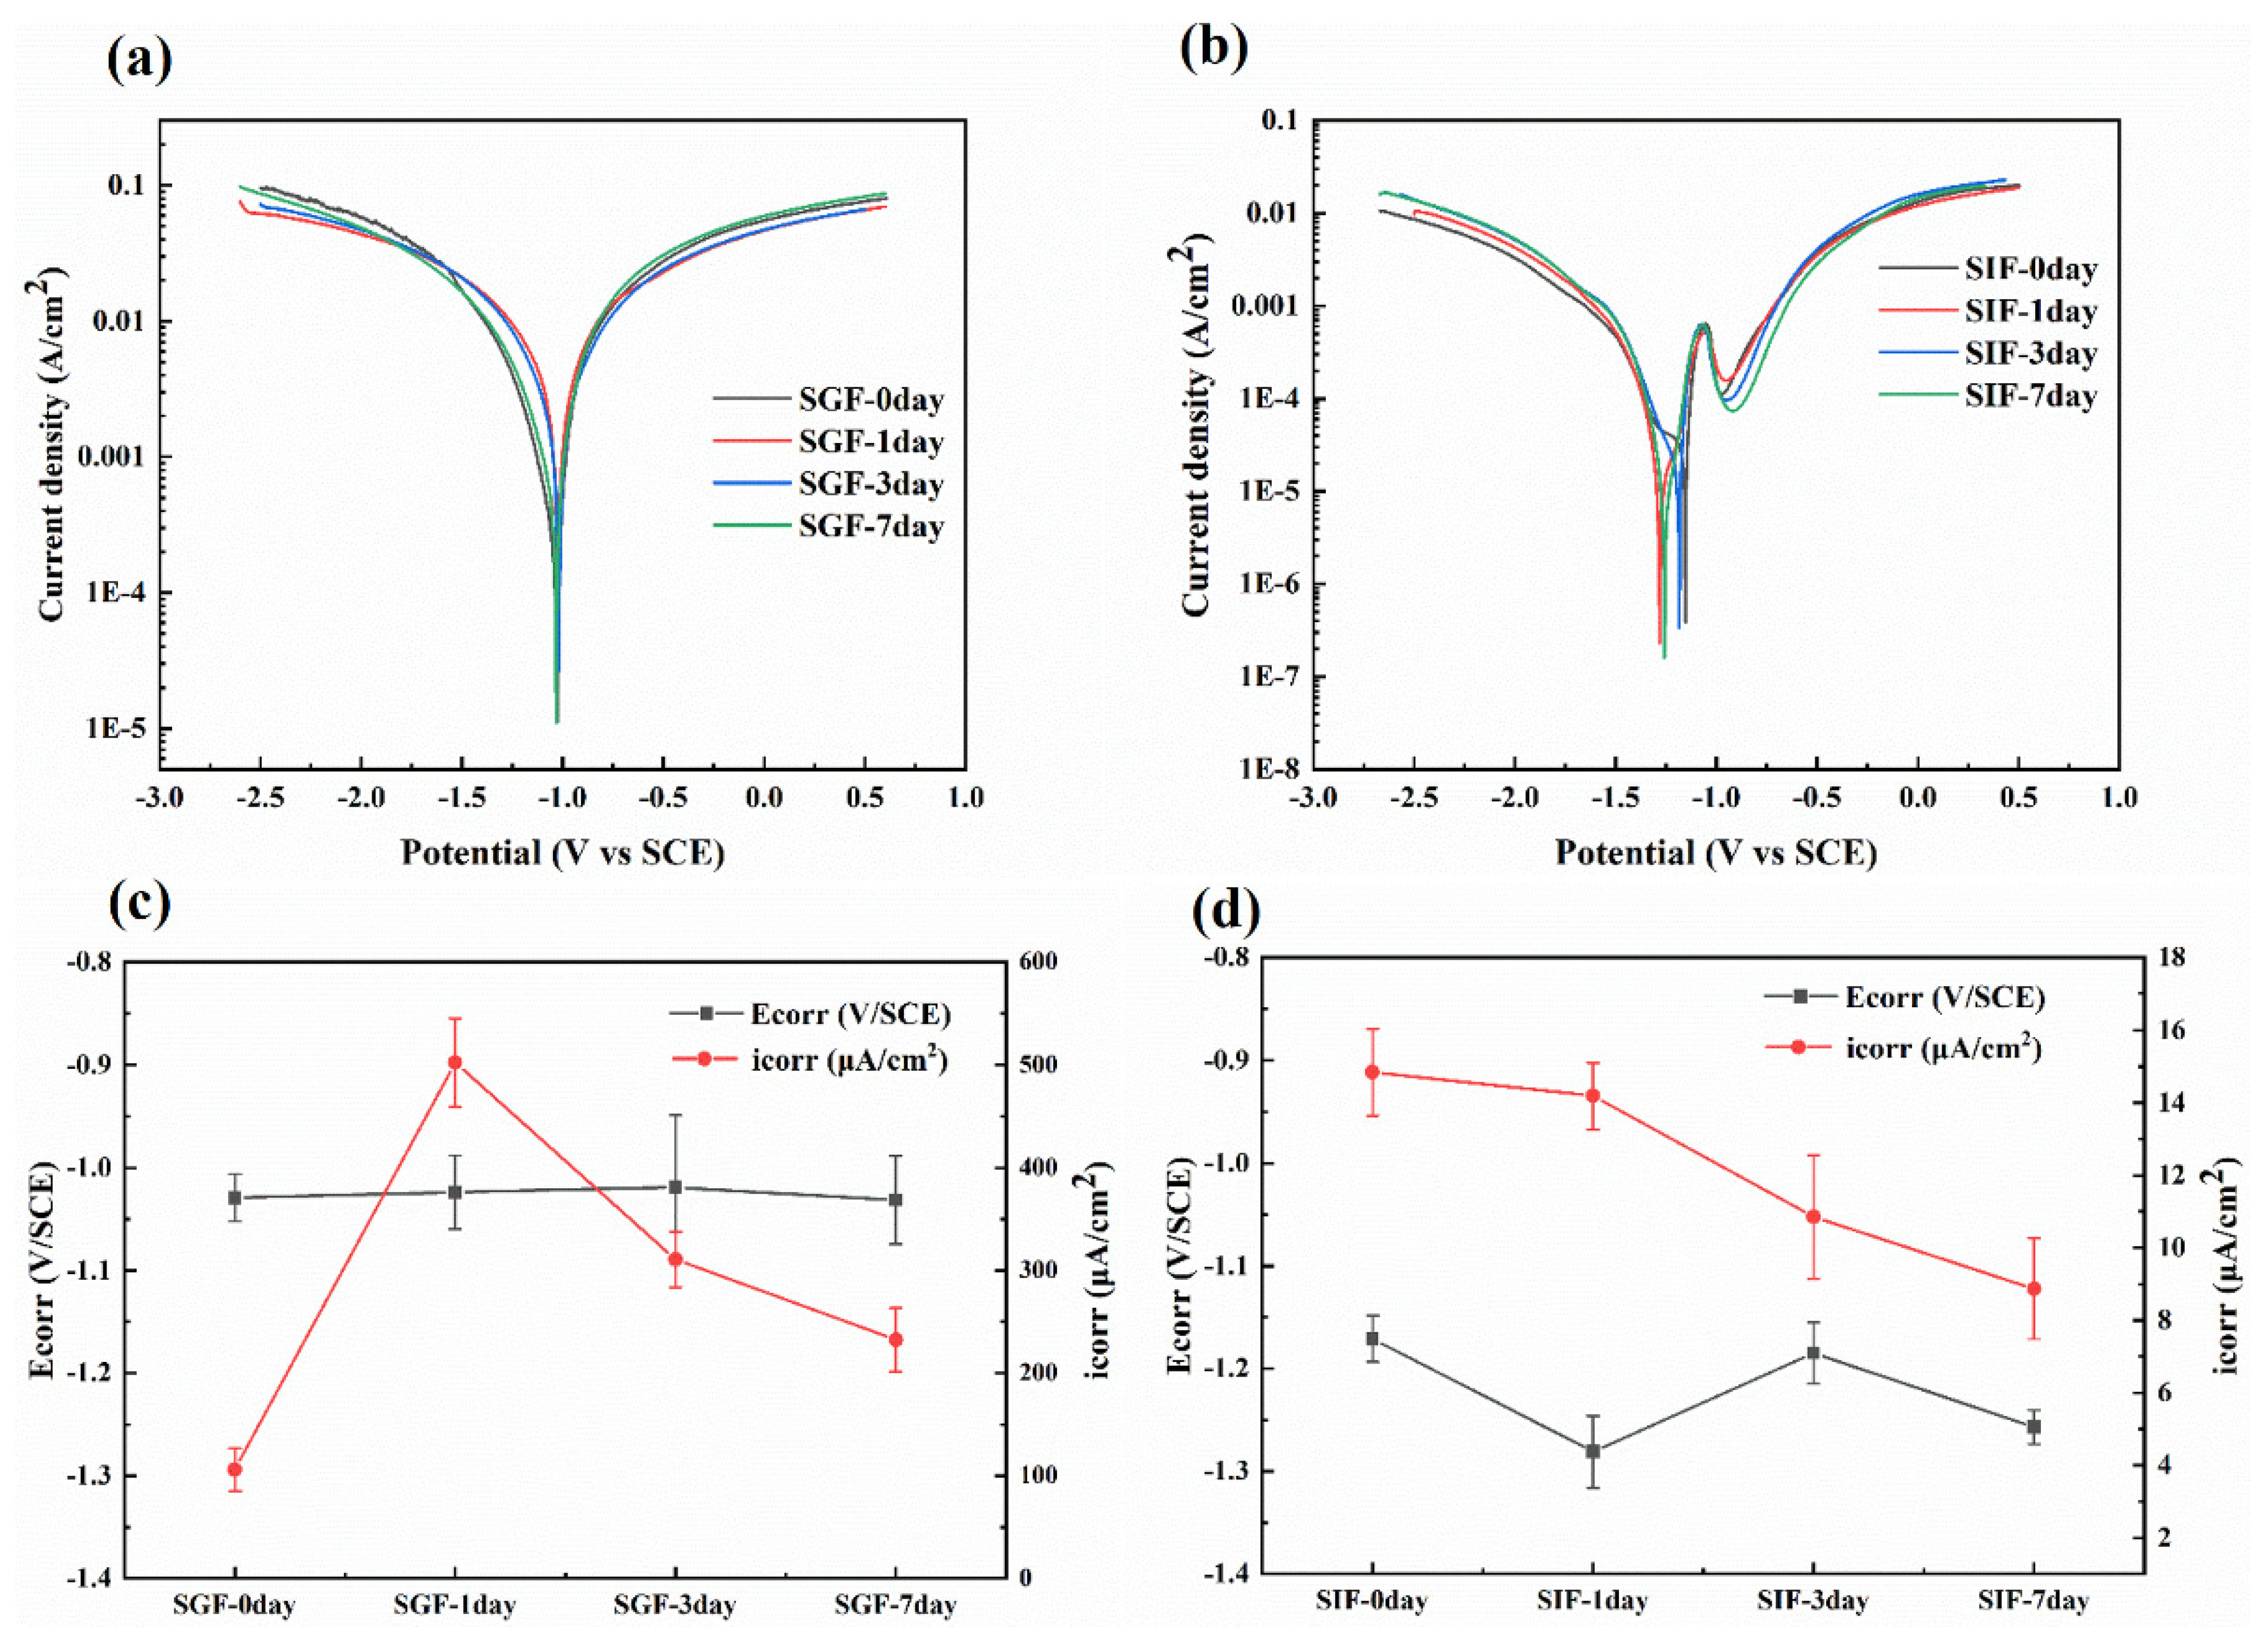
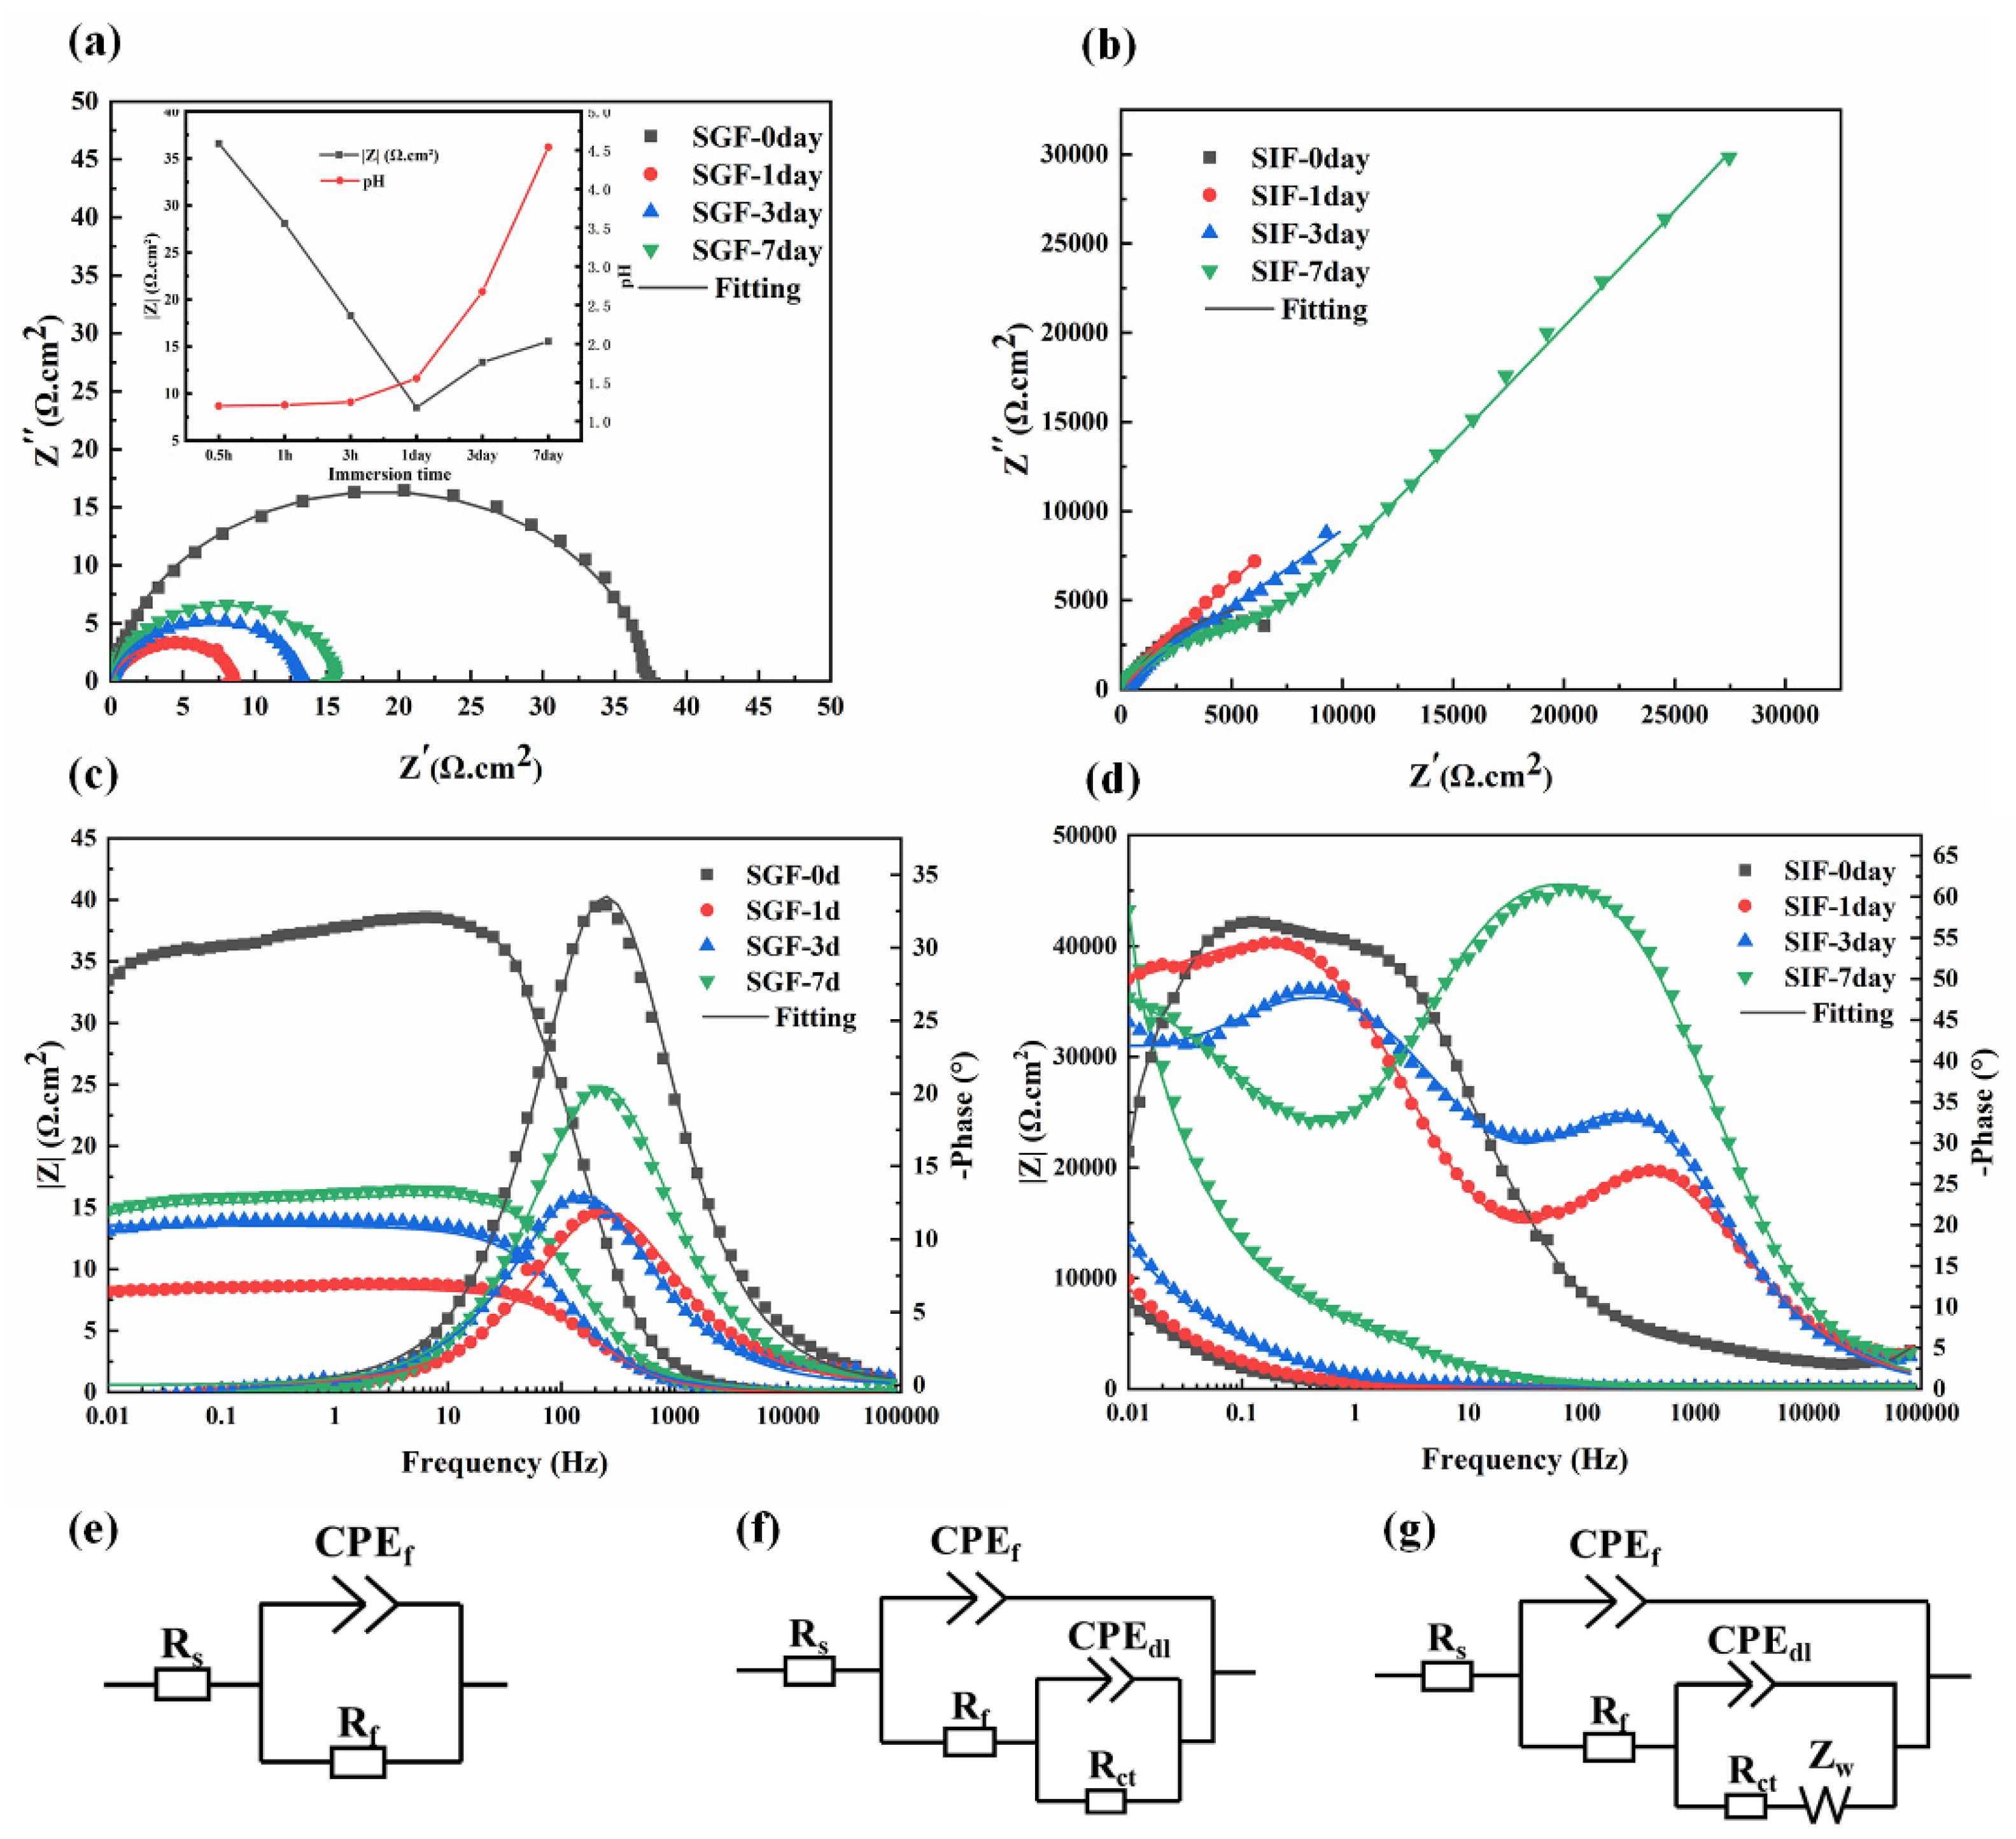
3.5. Electrochemical Characterization
4. Discussion
5. Conclusions
- In SGF, the samples were severely corroded locally, and the corrosion pits had a maximum diameter of over 150 μm. In SIF, the samples were uniformly corroded.
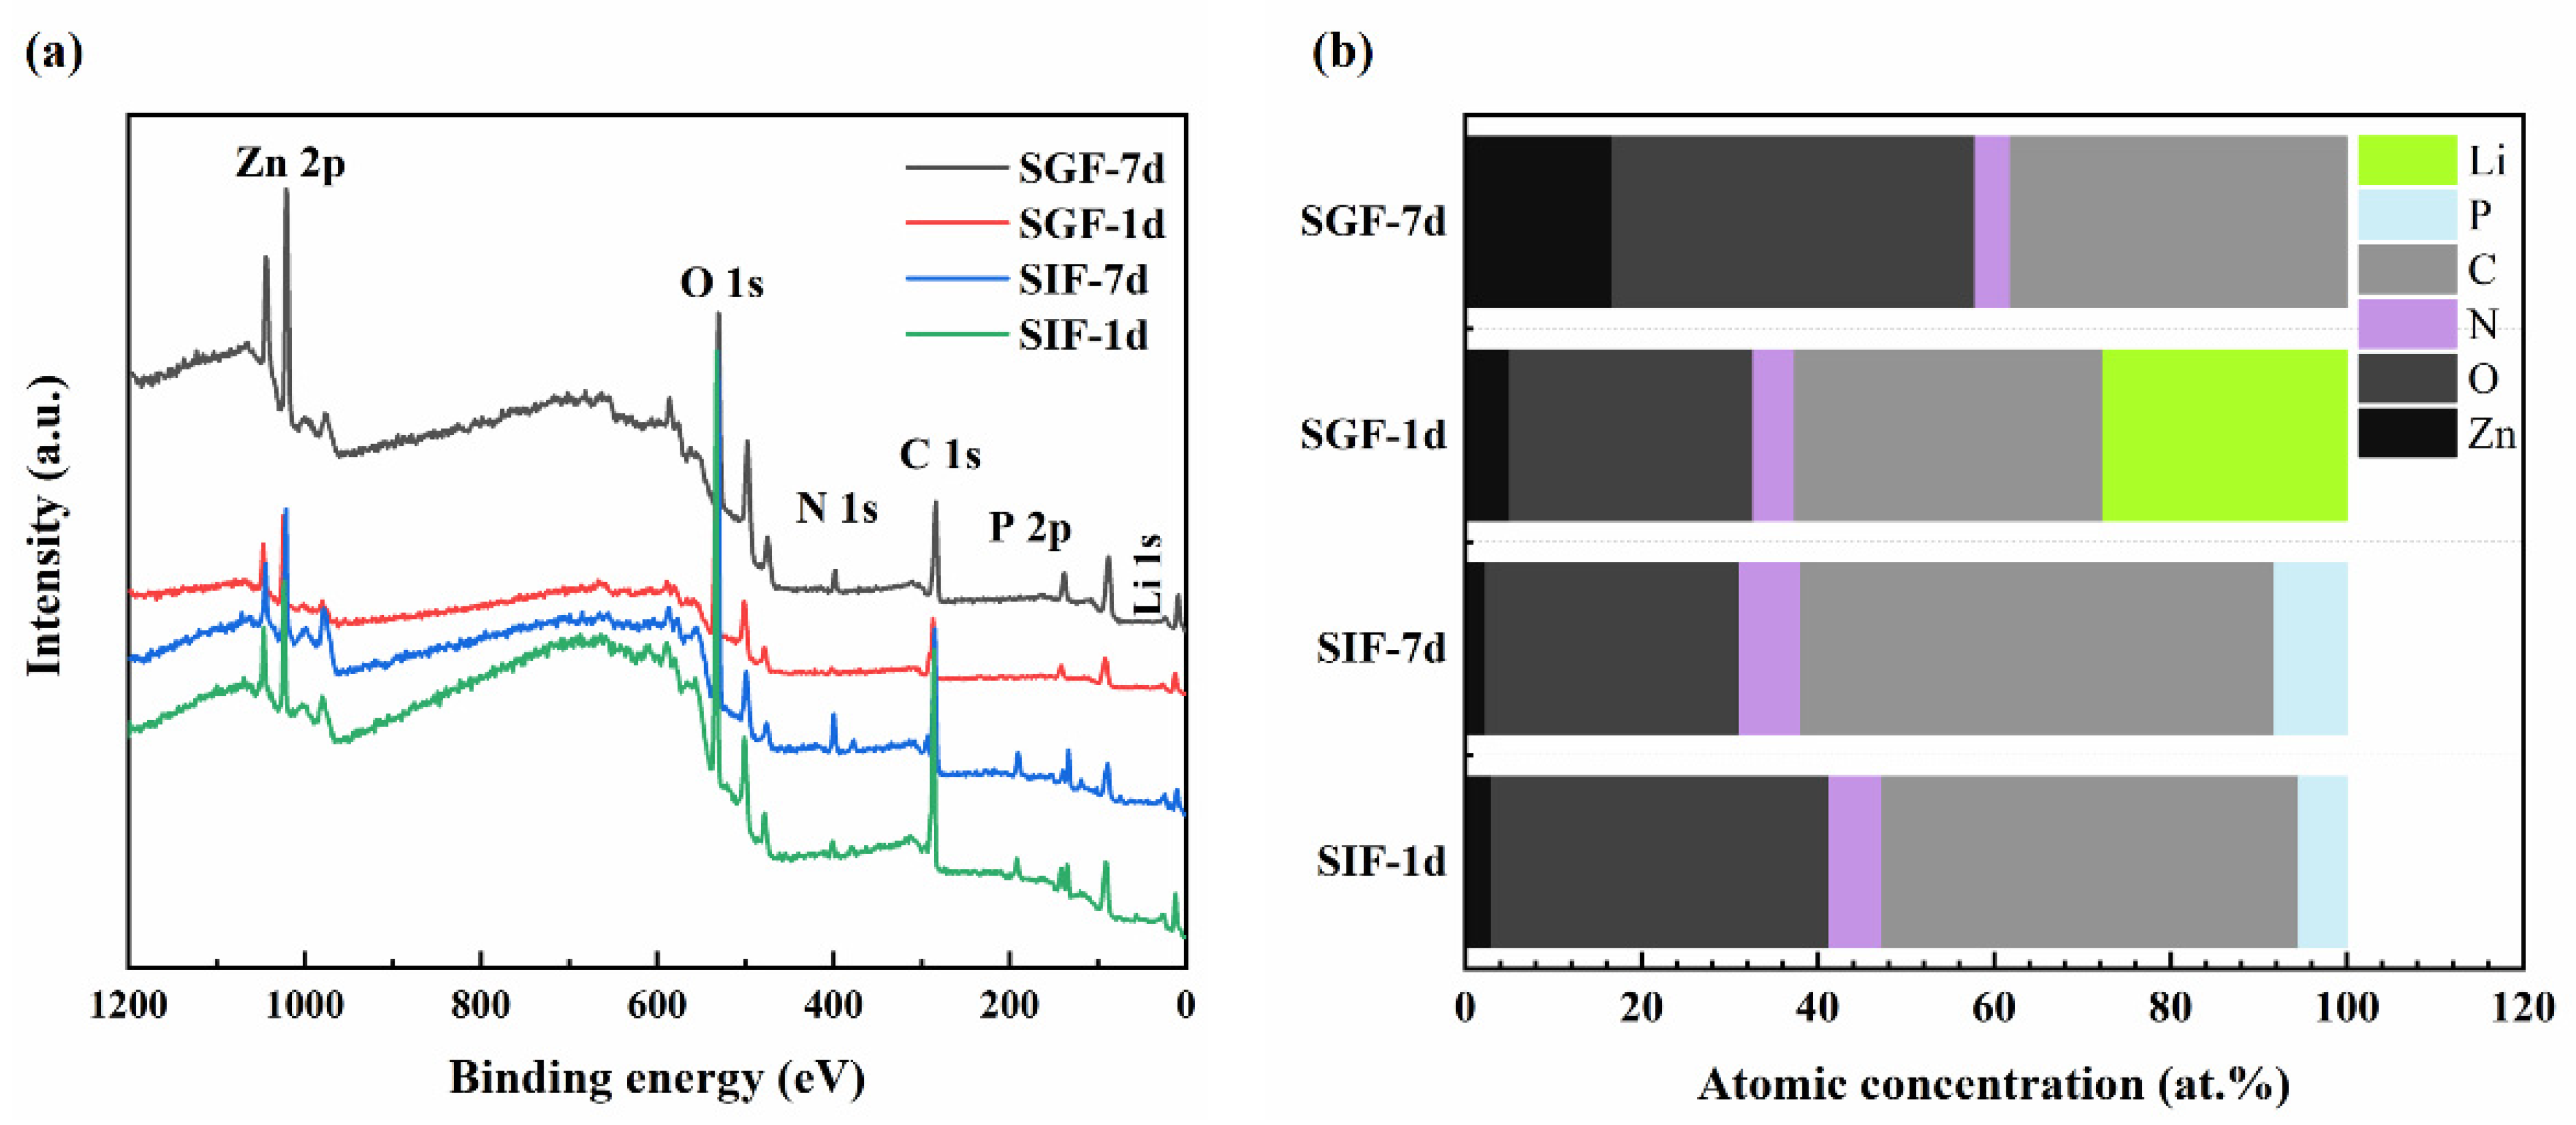
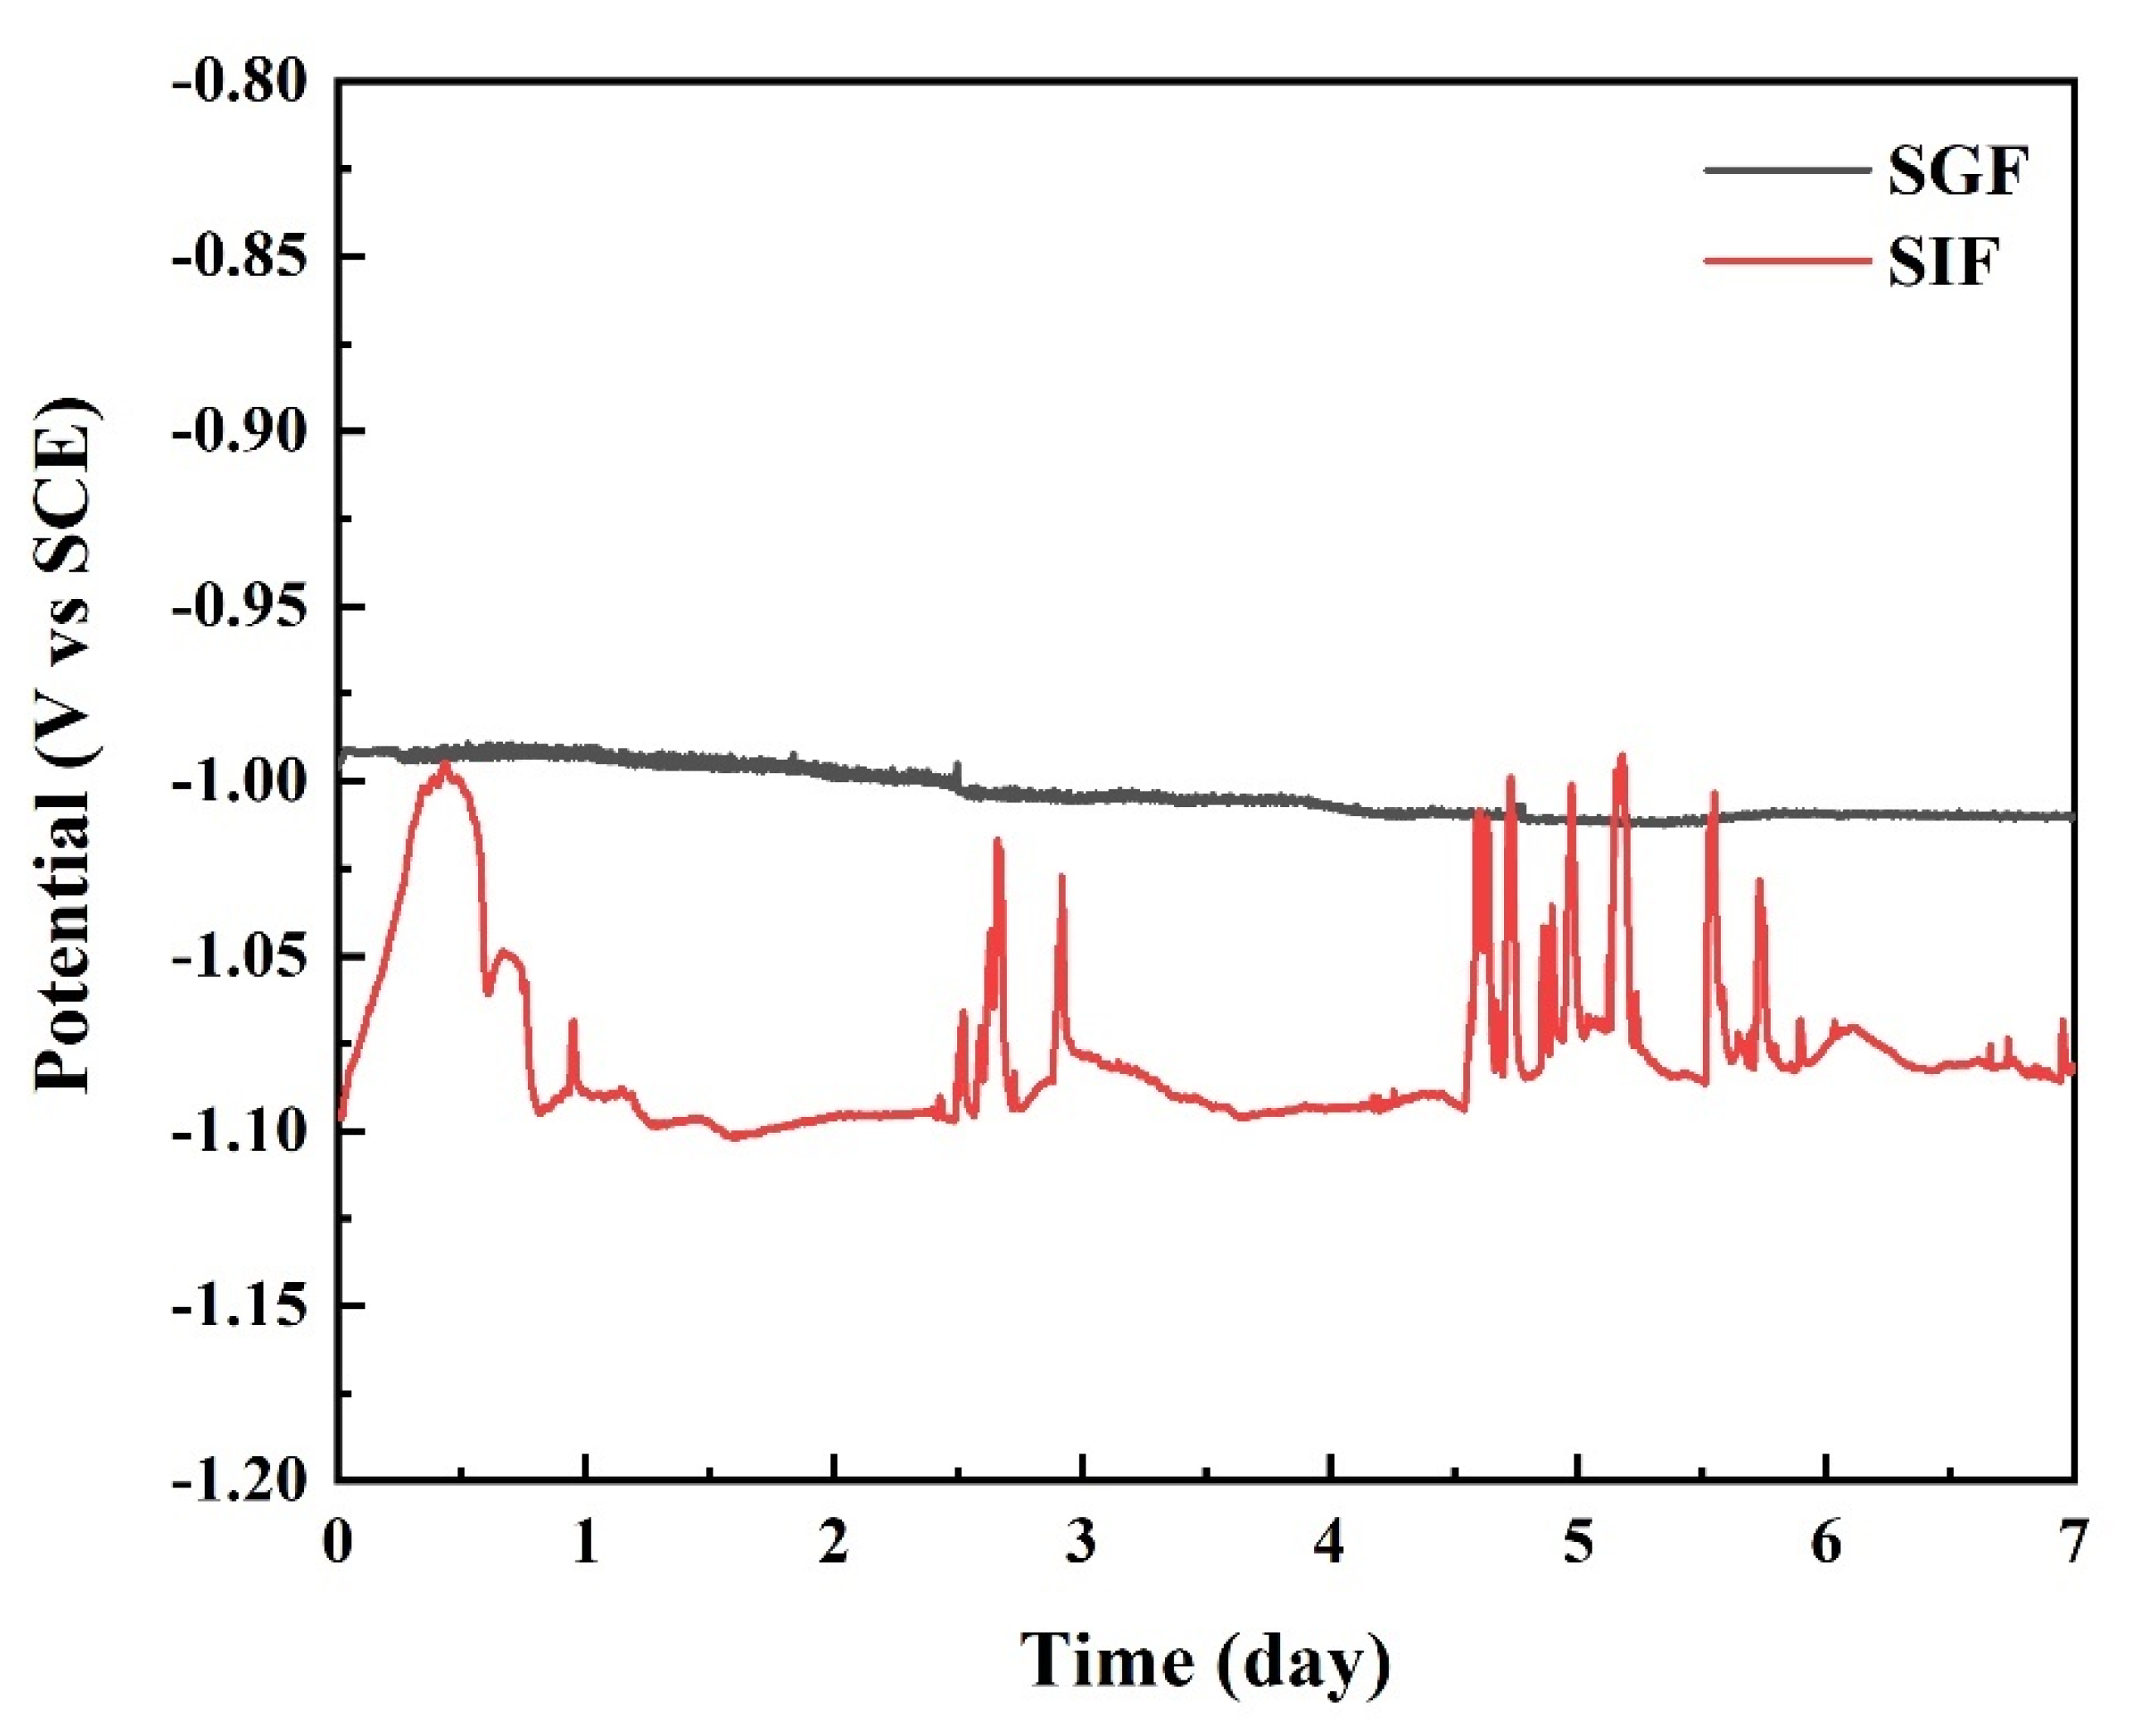
- The generation of the degradation product layer involved the digestive enzymes pepsin and pancreatin. The amount of enzyme attached to the surface of the sample decreased with immersion time because of solution flushing or hydrolysis of enzymes. The adsorption and subsequent desorption of pancreatin or the shedding of corrosion products occurred when the specimens were immersed in SIF.
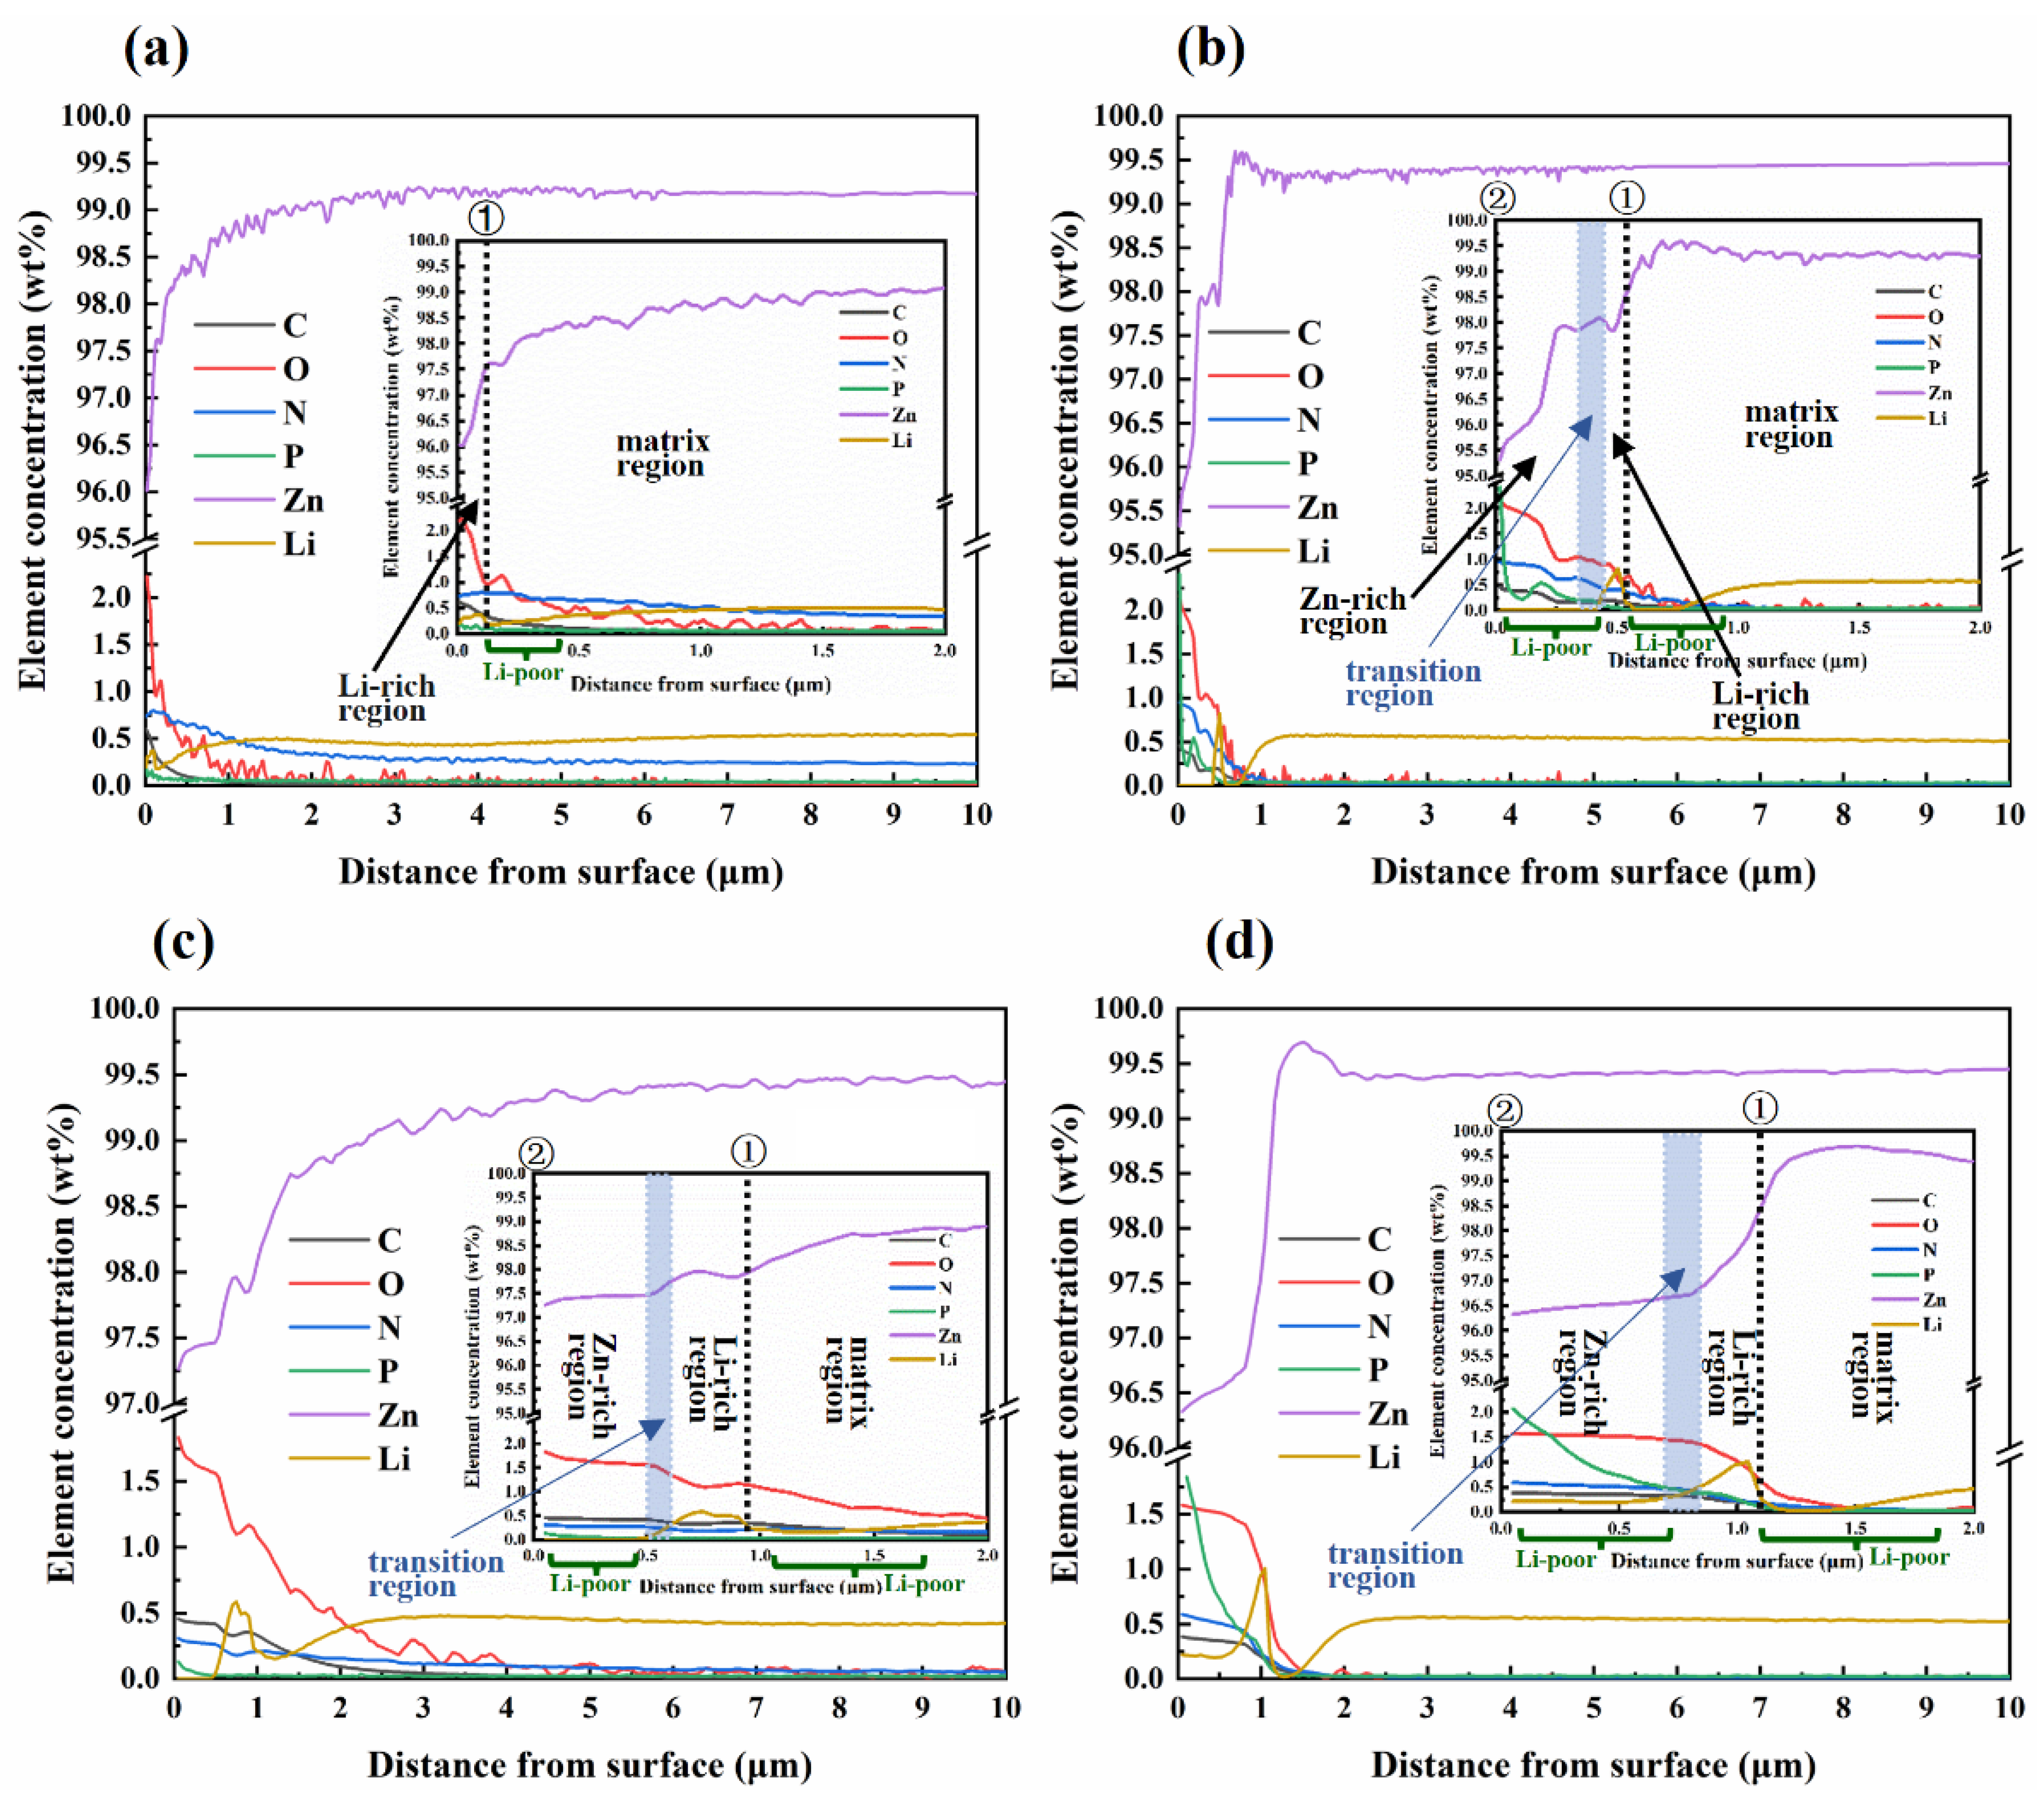
- Following immersion in SGF and SIF, Li-poor and Li-rich regions were observed in the near-surface of the samples. In the surface of samples where direct contact with the solution occurred, Li reacted first and released an amount of Li+ ions. Then Li+ ions reacted dominantly with CO32− to form significant amounts of Li2CO3 to form the Li-rich region. Due to that, Li atoms in the deeper part of the matrix could not diffuse to the surface in time, and the Li-poor region of the substrate beneath the Li-rich region was formed. When Li was depleted, the reaction between Zn and H2O became dominant and formed Zn-rich products with time. The extent of the Li-rich region increased with immersion time because of the accumulation of the corrosion products.
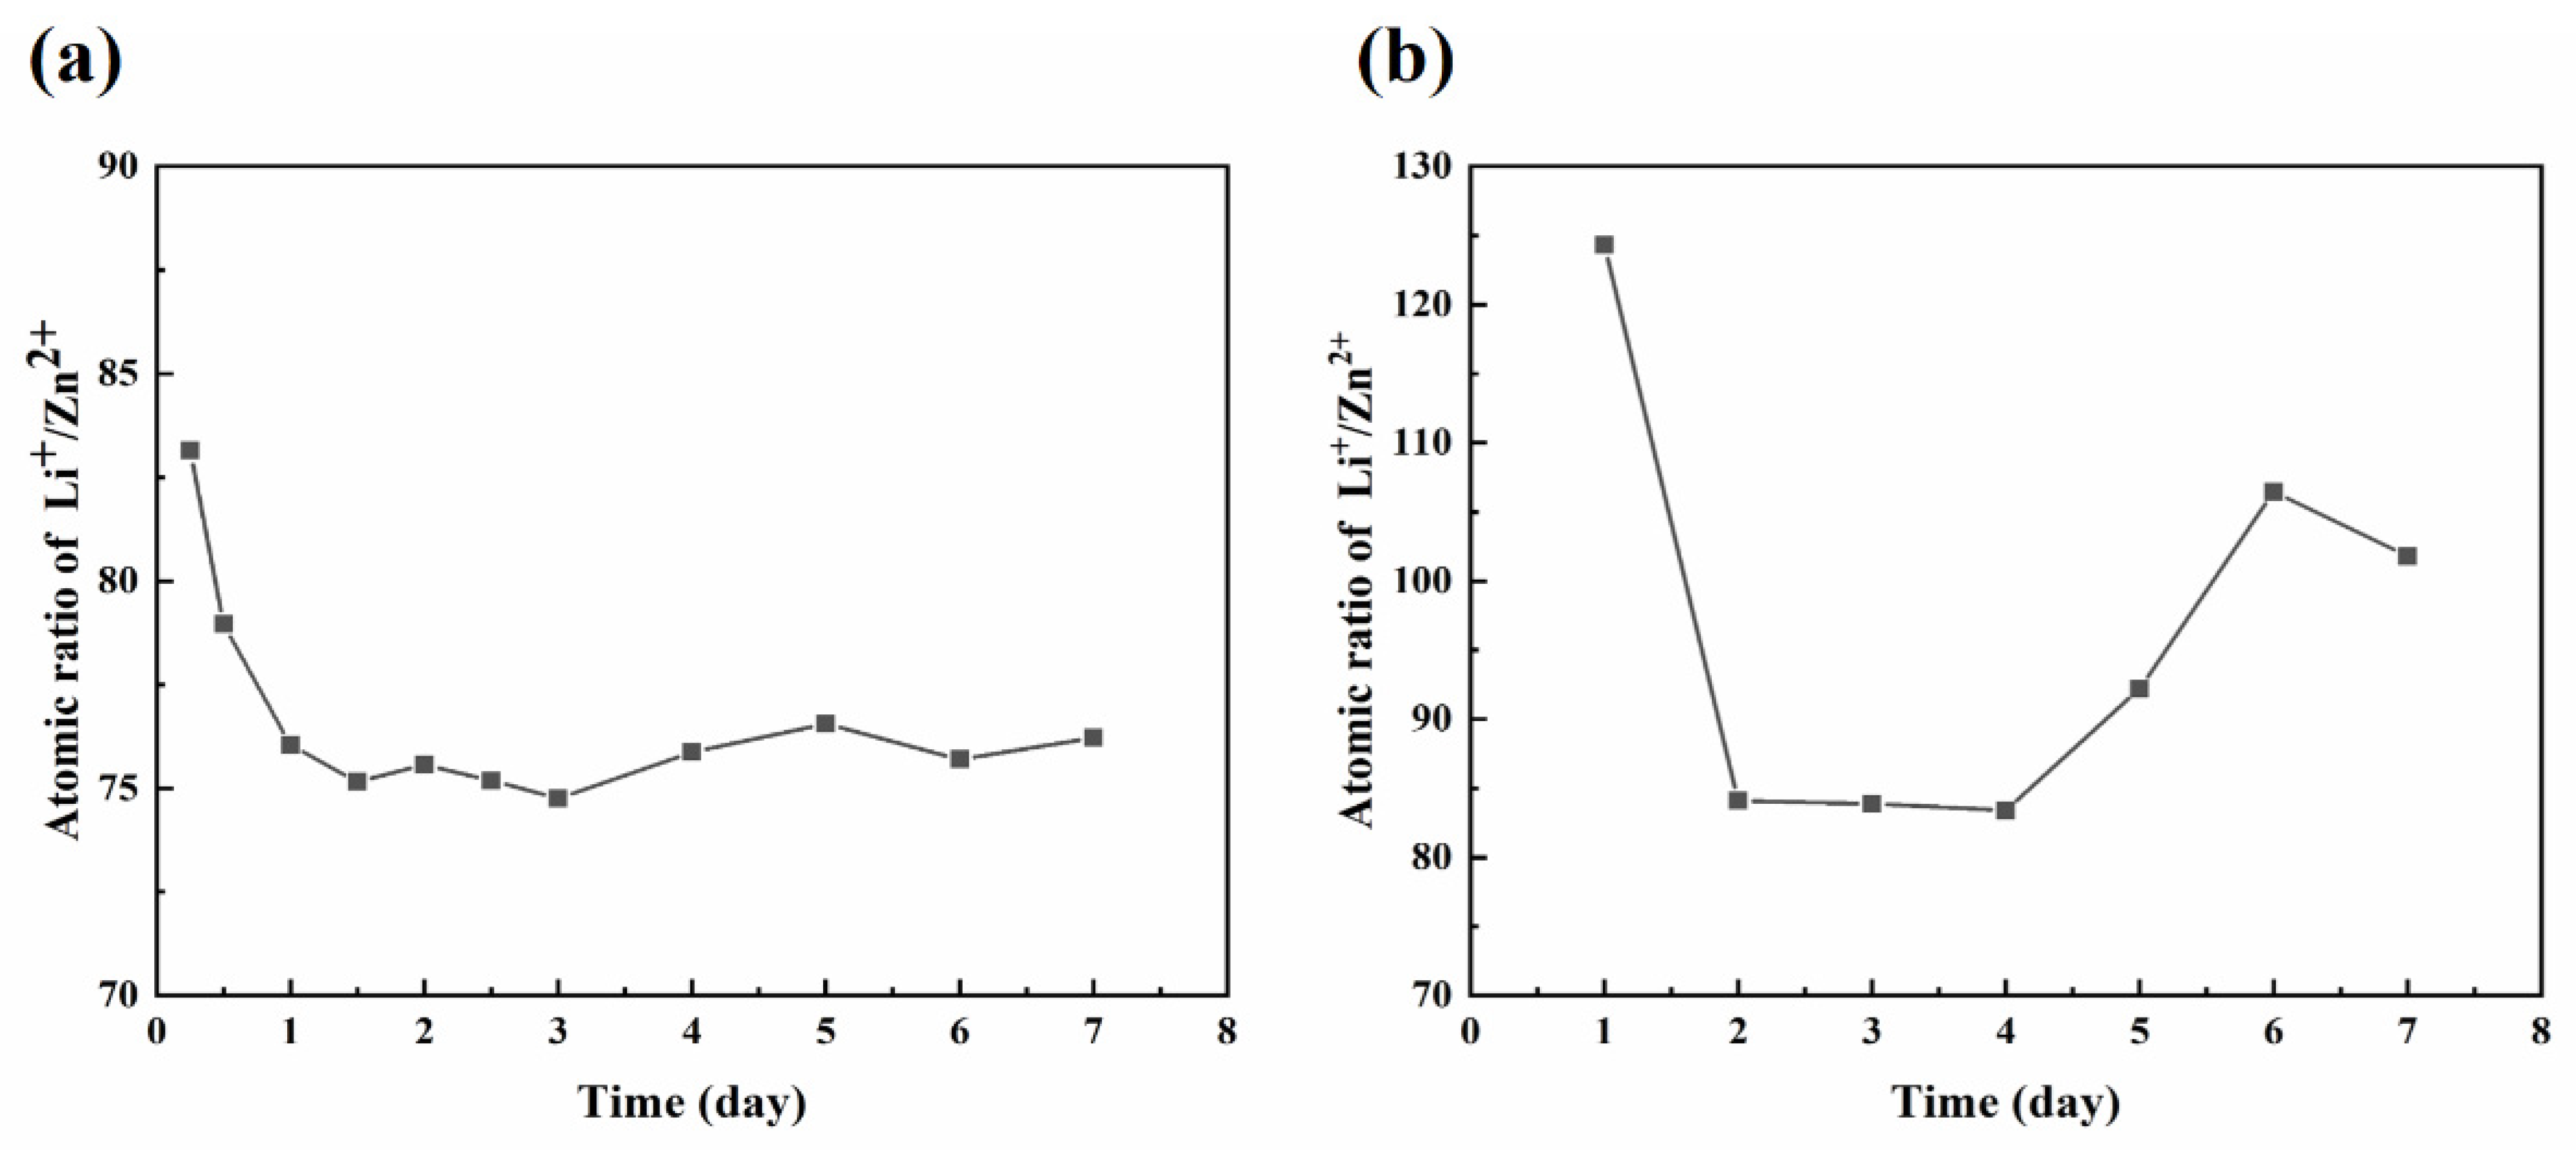
- Li+ releasement dominated over Zn2+ releasement throughout the immersion process in SGF and SIF.
Author Contributions
Funding
Institutional Review Board Statement
Informed Consent Statement
Data Availability Statement
Conflicts of Interest
References
- Du, W.B.; Liu, K.; Ma, K.; Wang, Z.H.; Li, S.B. Effects of trace Ca/Sn addition on corrosion behaviors of biodegradable Mg-4Zn-0.2Mn alloy. J. Magnes. Alloy. 2018, 6, 1–14. [Google Scholar] [CrossRef]
- Yan, J.; Chen, Y.; Yuan, Q.; Wang, X.; Yu, S.; Qiu, W.; Wang, Z.; Ai, K.; Zhang, X.; Zhang, S.; et al. Comparison of the effects of Mg-6Zn and Ti-3Al-2.5V alloys on TGF-beta/TNF-alpha/VEGF/b-FGF in the healing of the intestinal tract in vivo. Biomed. Mater. 2014, 9, 025011. [Google Scholar] [CrossRef]
- Yan, J.; Chen, Y.; Yuan, Q.; Yu, S.; Qiu, W.; Yang, C.; Wang, Z.; Gong, J.; Ai, K.; Zheng, Q.; et al. Comparison of the effects of Mg-6Zn and titanium on intestinal tract in vivo. J. Mater. Sci.-Mater. Med. 2013, 24, 1515–1525. [Google Scholar] [CrossRef]
- Yang, H.T.; Jia, B.; Zhang, Z.C.; Qu, X.H.; Li, G.N.; Lin, W.J.; Zhu, D.H.; Dai, K.R.; Zheng, Y.F. Alloying design of biodegradable zinc as promising bone implants for load-bearing applications. Nat. Commun. 2020, 11, 401. [Google Scholar] [CrossRef] [PubMed] [Green Version]
- Yang, H.T.; Qu, X.H.; Wang, M.Q.; Cheng, H.W.; Jia, B.; Nie, J.F.; Dai, K.R.; Zheng, Y.F. Zn-0.4Li alloy shows great potential for the fixation and healing of bone fractures at load-bearing sites. Chem. Eng. J. 2021, 417, 12. [Google Scholar] [CrossRef]
- Guo, P.S.; Zhu, X.L.; Yang, L.J.; Deng, L.; Zhang, Q.K.; Li, B.Q.; Cho, K.; Sun, W.S.; Ren, T.T.; Song, Z.L. Ultrafine- and uniform-grained biodegradable Zn-0.5Mn alloy: Grain refinement mechanism, corrosion behavior, and biocompatibility in vivo. Mat. Sci. Eng. C-Mater. 2021, 118, 111391. [Google Scholar] [CrossRef] [PubMed]
- Yang, L.J.; Guo, P.S.; Niu, Z.G.; Li, F.X.; Song, Z.L.; Xu, C.; Liu, H.N.; Sun, W.S.; Ren, T.T. Influence of Mg on the mechanical properties and degradation performance of as-extruded Zn-Mg-Ca alloys: In vitro and in vivo behavior. J. Mech. Behav. Biomed. Mater. 2019, 95, 220–231. [Google Scholar] [CrossRef] [PubMed]
- Shi, Y.X.; Yang, L.J.; Wang, L.C.; Zhang, Q.K.; Zhu, X.L.; Sun, W.S.; Shen, J.W.; Lu, T.; Song, Z.L.; Liu, H.N. Corrosion and Biocompatibility of Pure Zn with a Micro-Arc-Oxidized Layer Coated with Calcium Phosphate. Coatings 2021, 11, 1425. [Google Scholar] [CrossRef]
- Guo, H.; He, Y.; Zheng, Y.F.; Cui, Y. In vitro studies of biodegradable Zn-0.1Li alloy for potential esophageal stent application. Mater. Lett. 2020, 275, 4. [Google Scholar] [CrossRef]
- Jia, B.; Yang, H.T.; Han, Y.; Zhang, Z.C.; Qu, X.H.; Zhuang, Y.F.; Wu, Q.; Zheng, Y.F.; Dai, K.R. In vitro and in vivo studies of Zn-Mn biodegradable metals designed for orthopedic applications. Acta Biomater. 2020, 108, 358–372. [Google Scholar] [CrossRef]
- Sun, J.; Zhang, X.; Shi, Z.Z.; Gao, X.X.; Li, H.Y.; Zhao, F.Y.; Wang, J.Q.; Wang, L.N. Development of a high-strength Zn-Mn-Mg alloy for ligament reconstruction fixation. Acta Biomater. 2021, 119, 485–498. [Google Scholar] [CrossRef] [PubMed]
- Yuan, W.; Xia, D.D.; Zheng, Y.F.; Liu, X.M.; Wu, S.L.; Li, B.; Han, Y.; Jia, Z.J.; Zhu, D.H.; Ruan, L.Q.; et al. Controllable biodegradation and enhanced osseointegration of ZrO2-nanofilm coated Zn-Li alloy: In vitro and in vivo studies. Acta Biomater. 2020, 105, 290–303. [Google Scholar] [CrossRef]
- Bordbar-Khiabani, A.; Ebrahimi, S.; Yarmand, B. In-vitro corrosion and bioactivity behavior of tailored calcium phosphate-containing zinc oxide coating prepared by plasma electrolytic oxidation. Corros. Sci. 2020, 173. [Google Scholar] [CrossRef]
- Guo, H.; Hu, J.L.; Shen, Z.Q.; Du, D.X.; Zheng, Y.F.; Peng, J.R. In vitro and in vivo studies of biodegradable Zn-Li-Mn alloy staples designed for gastrointestinal anastomosis. Acta Biomater. 2021, 121, 713–723. [Google Scholar] [CrossRef] [PubMed]
- Fallingborg, J. Intraluminal pH of the human gastrointestinal tract. Dan. Med. Bull. 1999, 46, 183–196. [Google Scholar] [PubMed]
- Vertzoni, M.; Pastelli, E.; Psachoulias, D.; Kalantzi, L.; Reppas, C. Estimation of intragastric solubility of drugs: In what medium? Pharm. Res. 2007, 24, 909–917. [Google Scholar] [CrossRef] [PubMed]
- Falavigna, M.; Klitgaard, M.; Steene, E.; Flaten, G.E. Mimicking regional and fasted/fed state conditions in the intestine with the mucus-PVPA in vitro model: The impact of pH and simulated intestinal fluids on drug permeability. Eur. J. Pharm. Sci. 2019, 132, 44–54. [Google Scholar] [CrossRef]
- Bowen, P.K.; Drelich, J.; Goldman, J. Zinc Exhibits Ideal Physiological Corrosion Behavior for Bioabsorbable Stents. Adv. Mater. 2013, 25, 2577–2582. [Google Scholar] [CrossRef]
- Shi, Z.Z.; Yu, J.; Liu, X.F. Microalloyed Zn-Mn alloys: From extremely brittle to extraordinarily ductile at room temperature. Mater. Des. 2018, 144, 343–352. [Google Scholar] [CrossRef]
- Sikora-Jasinska, M.; Mostaed, E.; Mostaed, A.; Beanland, R.; Mantovani, D.; Vedani, M. Fabrication, mechanical properties and in vitro degradation behavior of newly developed Zn-Ag alloys for degradable implant applications. Mat. Sci. Eng. C-Mater. 2017, 77, 1170–1181. [Google Scholar] [CrossRef]
- Zhao, S.; McNamara, C.T.; Bowen, P.K.; Verhun, N.; Braykovich, J.P.; Goldman, J.; Drelich, J.W. Structural Characteristics and In Vitro Biodegradation of a Novel Zn-Li Alloy Prepared by Induction Melting and Hot Rolling. Met. Mater. Trans. A-Phys. Metall. Mater. Sci. 2017, 48A, 1204–1215. [Google Scholar] [CrossRef]
- Dai, Y.L.; Zhang, Y.; Liu, H.; Fang, H.J.; Li, D.; Xu, X.M.; Yan, Y.; Chen, L.J.; Lu, Y.J.; Yu, K. Mechanical strengthening mechanism of Zn-Li alloy and its mini tube as potential absorbable stent material. Mater. Lett. 2019, 235, 220–223. [Google Scholar] [CrossRef]
- Jin, H.L.; Zhao, S.; Guillory, R.; Bowen, P.K.; Yin, Z.Y.; Griebel, A.; Schaffer, J.; Earley, E.J.; Goldman, J.; Drelich, J.W. Novel high-strength, low-alloys Zn-Mg (<0.1 wt% Mg) and their arterial biodegradation. Mat. Sci. Eng. C-Mater. 2018, 84, 67–79. [Google Scholar] [CrossRef]
- Mostaed, E.; Sikora-Jasinska, M.; Mostaed, A.; Loffredo, S.; Demir, A.G.; Preuitali, B.; Mantouani, D.; Beanland, R.; Vedani, M. Novel Zn-based alloys for biodegradable stent applications: Design, development and in vitro degradation. J. Mech. Behav. Biomed. Mater. 2016, 60, 581–602. [Google Scholar] [CrossRef]
- Tong, X.; Zhang, D.C.; Zhang, X.T.; Su, Y.C.; Shi, Z.M.; Wang, K.; Lin, J.G.; Li, Y.C.; Lin, J.X.; Wen, C. Microstructure, mechanical properties, biocompatibility, and in vitro corrosion and degradation behavior of a new Zn-5Ge alloy for biodegradable implant materials. Acta Biomater. 2018, 82, 197–204. [Google Scholar] [CrossRef] [PubMed]
- Shen, C.; Liu, X.W.; Fan, B.; Lan, P.H.; Zhou, F.Y.; Li, X.K.; Wang, H.L.; Xiao, X.; Li, L.; Zhao, S.; et al. Mechanical properties, in vitro degradation behavior, hemocompatibility and cytotoxicity evaluation of Zn-1.2Mg alloy for biodegradable implants. RSC Adv. 2016, 6, 86410–86419. [Google Scholar] [CrossRef]
- Li, Z.; Shi, Z.Z.; Hao, Y.; Li, H.F.; Liu, X.F.; Volinsky, A.A.; Zhang, H.J.; Wang, L.N. High-performance hot-warm rolled Zn-0.8Li alloy with nano-sized metastable precipitates and sub-micron grains for biodegradable stents. J. Mater. Sci. Technol. 2019, 35, 2618–2624. [Google Scholar] [CrossRef]
- Zhao, S.; Seitz, J.M.; Eifler, R.; Maier, H.J.; Guillory, R.J.; Earley, E.J.; Drelich, A.; Goldman, J.; Drelich, J.W. Zn-Li alloy after extrusion and drawing: Structural, mechanical characterization, and biodegradation in abdominal aorta of rat. Mater. Sci. Eng. C-Mater. Biol. Appl. 2017, 76, 301–312. [Google Scholar] [CrossRef]
- Wang, Z.; Zhang, Q.K.; Bagheri, R.; Guo, P.S.; Yao, Y.R.; Yang, L.J.; Song, Z.L. Influence of laser surface remelting on microstructure and degradation mechanism in simulated body fluid of Zn-0.5Zr alloy. J. Mater. Sci. Technol. 2019, 35, 2705–2713. [Google Scholar] [CrossRef]
- Aral, H.; Vecchio-Sadus, A. Toxicity of lithium to humans and the environment—A literature review. Ecotoxicol. Environ. Saf. 2008, 70, 349–356. [Google Scholar] [CrossRef] [PubMed]
- Chen, P.H.; Hsiao, C.Y.; Chiang, S.J.; Shen, R.S.; Lin, Y.K.; Chung, K.H.; Tsai, S.Y. Cardioprotective potential of lithium and role of fractalkine in euthymic patients with bipolar disorder. Aust. N. Zeal. J. Psychiatry 2021, 57, 104–114. [Google Scholar] [CrossRef]
- Mazor, M.; Kawano, Y.; Zhu, H.N.; Waxman, J.; Kypta, R.M. Inhibition of glycogen synthase kinase-3 represses androgen receptor activity and prostate cancer cell growth. Oncogene 2004, 23, 7882–7892. [Google Scholar] [CrossRef] [PubMed] [Green Version]
- Young, W. Review of Lithium Effects on Brain and Blood. Cell Transplant. 2009, 18, 951–975. [Google Scholar] [CrossRef] [PubMed]
- Witte, F.; Hort, N.; Vogt, C.; Cohen, S.; Kainer, K.U.; Willumeit, R.; Feyerabend, F. Degradable biomaterials based on magnesium corrosion. Curr. Opin. Solid State Mater. Sci. 2008, 12, 63–72. [Google Scholar] [CrossRef] [Green Version]
- Hernandez-Escobar, D.; Champagne, S.; Yilmazer, H.; Dikici, B.; Boehlert, C.J.; Hermawan, H. Current status and perspectives of zinc-based absorbable alloys for biomedical applications. Acta Biomater. 2019, 97, 1–22. [Google Scholar] [CrossRef]
- Zhang, S.X.; Zhang, X.N.; Zhao, C.L.; Li, J.A.; Song, Y.; Xie, C.Y.; Tao, H.R.; Zhang, Y.; He, Y.H.; Jiang, Y.; et al. Research on an Mg-Zn alloy as a degradable biomaterial. Acta Biomater. 2010, 6, 626–640. [Google Scholar] [CrossRef] [PubMed]
- Pelton, A.D. The Li-Zn (Lithium-Zinc) System. J. Phase Equilibria 1991, 12, 42–45. [Google Scholar] [CrossRef]
- Li, Z.; Shi, Z.Z.; Zhang, H.J.; Li, H.F.; Feng, Y.; Wang, L.N. Hierarchical microstructure and two-stage corrosion behavior of a high-performance near-eutectic Zn-Li alloy. J. Mater. Sci. Technol. 2021, 80, 50–65. [Google Scholar] [CrossRef]
- Li, Z.; Shi, Z.Z.; Hao, Y.; Li, H.F.; Zhang, H.J.; Liu, X.F.; Wang, L.N. Insight into role and mechanism of Li on the key aspects of biodegradable Zn-Li alloys: Microstructure evolution, mechanical properties, corrosion behavior and cytotoxicity. Mater. Sci. Eng. C-Mater. Biol. Appl. 2020, 114, 111049. [Google Scholar] [CrossRef]
- Liu, L.J.; Lu, L.L.; Zhang, H.J.; Wang, L.N. Influence of bovine serum albumin on corrosion behaviour of pure Zn in phosphate buffered saline. J. Mater. Sci.-Mater. Med. 2021, 32, 95. [Google Scholar] [CrossRef]
- Song, Y.W.; Shan, D.Y.; Chen, R.S.; Han, E.H. Corrosion characterization of Mg-8Li alloy in NaCl solution. Corros. Sci. 2009, 51, 1087–1094. [Google Scholar] [CrossRef]
- Duchoslav, J.; Steinberger, R.; Arndt, M.; Stifter, D. XPS study of zinc hydroxide as a potential corrosion product of zinc: Rapid X-ray induced conversion into zinc oxide. Corros. Sci. 2014, 82, 356–361. [Google Scholar] [CrossRef]
- Li, Z.; Shi, Z.Z.; Yan, Y.; Zhang, D.W.; Yang, K.; Li, H.F.; Zhang, H.J.; Wang, L.N. Suppression mechanism of initial pitting corrosion of pure Zn by Li alloying. Corros. Sci. 2021, 189, 109564. [Google Scholar] [CrossRef]
- Bautista, B.E.T.; Carvalho, M.L.; Seyeux, A.; Zanna, S.; Cristiani, P.; Tribollet, B.; Marcus, P.; Frateur, I. Effect of protein adsorption on the corrosion behavior of 70Cu-30Ni alloy in artificial seawater. Bioelectrochemistry 2014, 97, 34–42. [Google Scholar] [CrossRef] [PubMed] [Green Version]
- Lee, H.H.; Bae, M.; Jo, S.H.; Shin, J.K.; Son, D.H.; Won, C.H.; Lee, J.H. Differential-mode HEMT-based biosensor for real-time and label-free detection of C-reactive protein. Sens. Actuators B-Chem. 2016, 234, 316–323. [Google Scholar] [CrossRef]
- Vanea, E.; Simon, V. XPS study of protein adsorption onto nanocrystalline aluminosilicate microparticles. Appl. Surf. Sci. 2011, 257, 2346–2352. [Google Scholar] [CrossRef]
- Wan, P.; Lin, X.; Tan, L.L.; Li, L.G.; Li, W.R.; Yang, K. Influence of albumin and inorganic ions on electrochemical corrosion behavior of plasma electrolytic oxidation coated magnesium for surgical implants. Appl. Surf. Sci. 2013, 282, 186–194. [Google Scholar] [CrossRef]
- Wang, M.L.; Yang, L.B.; Zhu, X.L.; Yang, L.J.; Song, Z.L. Influence of Enzymes on the In Vitro Degradation Behavior of Pure Zn in Simulated Gastric and Intestinal Fluids. ACS Omega 2022, 8, 1331–1342. [Google Scholar] [CrossRef]
- Dong, H.Z.; Lin, F.; Boccaccini, A.R.; Virtanen, S. Corrosion behavior of biodegradable metals in two different simulated physiological solutions: Comparison of Mg, Zn and Fe. Corros. Sci. 2021, 182, 109278. [Google Scholar] [CrossRef]
- Yan, Y.; Zhou, P.; Gharbi, O.; Zeng, Z.; Chen, X.; Volovitch, P.; Ogle, K.; Birbilis, N. Investigating ion release using inline ICP during in situ scratch testing of an Mg-Li(-Al-Y-Zr) alloy. Electrochem. Commun. 2019, 99, 46–50. [Google Scholar] [CrossRef]
- Zhao, M.C.; Liu, M.; Song, G.L.; Atrens, A. Influence of pH and chloride ion concentration on the corrosion of Mg alloy ZE41. Corros. Sci. 2008, 50, 3168–3178. [Google Scholar] [CrossRef]
- Jang, Y.; Collins, B.; Sankar, J.; Yun, Y. Effect of biologically relevant ions on the corrosion products formed on alloy AZ31B: An improved understanding of magnesium corrosion. Acta Biomater. 2013, 9, 8761–8770. [Google Scholar] [CrossRef] [PubMed]
- Munoz, A.I.; Mischler, S. Interactive effects of albumin and phosphate ions on the corrosion of CoCrMo implant alloy. J. Electrochem. Soc. 2007, 154, C562–C570. [Google Scholar] [CrossRef]
- Zhang, Y.; Cao, J.; Wang, X.L.; Liu, H.; Shao, Y.; Chu, C.L.; Xue, F.; Bai, J. The effect of enzymes on the in vitro degradation behavior of Mg alloy wires in simulated gastric fluid and intestinal fluid. Bioact. Mater. 2022, 7, 217–226. [Google Scholar] [CrossRef] [PubMed]
- Medhashree, H.; Shetty, A.N. Electrochemical corrosion study of Mg-Al-Zn-Mn alloy in aqueous ethylene glycol containing chloride ions. J. Mater. Res. Technol.-JMRT 2017, 6, 40–49. [Google Scholar] [CrossRef] [Green Version]
- Jamesh, M.I.; Wu, G.; Zhao, Y.; McKenzie, D.R.; Bilek, M.M.M.; Chu, P.K. Electrochemical corrosion behavior of biodegradable Mg-Y-RE and Mg-Zn-Zr alloys in Ringer’s solution and simulated body fluid. Corros. Sci. 2015, 91, 160–184. [Google Scholar] [CrossRef]
- McCafferty, E. Validation of corrosion rates measured by the Tafel extrapolation method. Corros. Sci. 2005, 47, 3202–3215. [Google Scholar] [CrossRef]
- Liu, L.; Meng, Y.; Volinsky, A.A.; Zhang, H.-J.; Wang, L.-N. Influences of albumin on in vitro corrosion of pure Zn in artificial plasma. Corros. Sci. 2019, 153, 341–356. [Google Scholar] [CrossRef]
- Perez, N. Electrochemistry and Corrosion Science, 1st ed.; Springer: New York, NY, USA, 2004. [Google Scholar]
- Rosalbino, F.; De Negri, S.; Scavino, G.; Saccone, A. Microstructure and in vitro degradation performance of Mg-Zn-Mn alloys for biomedical application. J. Biomed. Mater. Res. Part A 2013, 101, 704–711. [Google Scholar] [CrossRef] [PubMed]
- Pouilleau, J.; Devilliers, D.; Garrido, F.; DurandVidal, S. Structure and composition of passive titanium oxide films. Mat. Sci. Eng. B-Solid 1997, 47, 235–243. [Google Scholar] [CrossRef]
- Song, Y.W.; Han, E.H.; Shan, D.Y.; Yim, C.D.; You, B.S. The effect of Zn concentration on the corrosion behavior of Mg-xZn alloys. Corros. Sci. 2012, 65, 322–330. [Google Scholar] [CrossRef]
- Karimi, S.; Nickchi, T.; Alfantazi, A. Effects of bovine serum albumin on the corrosion behaviour of AISI 316L, Co-28Cr-6Mo, and Ti-6Al-4V alloys in phosphate buffered saline solutions. Corros. Sci. 2011, 53, 3262–3272. [Google Scholar] [CrossRef]
- Ye, C.T.; Jia, L.N.; Xu, G.X.; Wang, F.F.; Wang, X.C.; Zhang, H. Microstructure and initial corrosion behavior of double-layer Zn-Al-Mg coatings produced by PVD. Surf. Coat. Technol. 2019, 366, 214–226. [Google Scholar] [CrossRef]
- Wang, C.M.; Shen, J.; Xie, F.X.; Duan, B.; Xie, X. A versatile dopamine-induced intermediate layer for polyether imides (PEI) deposition on magnesium to render robust and high inhibition performance. Corros. Sci. 2017, 122, 32–40. [Google Scholar] [CrossRef]
- King, A.D.; Birbilis, N.; Scully, J.R. Accurate Electrochemical Measurement of Magnesium Corrosion Rates; a Combined Impedance, Mass-Loss and Hydrogen Collection Study. Electrochim. Acta 2014, 121, 394–406. [Google Scholar] [CrossRef]
- Vidal, C.V.; Juan, A.O.; Munoz, A.L. Adsorption of bovine serum albumin on CoCrMo surface: Effect of temperature and protein concentration. Colloid Surf. B 2010, 80, 1–11. [Google Scholar] [CrossRef]
- Zheng, Y.F.; Gu, X.N.; Witte, F. Biodegradable metals. Mat. Sci. Eng. R 2014, 77, 1–34. [Google Scholar] [CrossRef]
- Advincula, M.; Fan, X.W.; Lemons, J.; Advincula, R. Surface modification of surface sol-gel derived titanium oxide films by self-assembled monolayers (SAMS) and non-specific protein adsorption studies. Colloid Surf. B 2005, 42, 29–43. [Google Scholar] [CrossRef]
- Wang, Y.S.; Lim, C.S.; Lim, C.V.; Yong, M.S.; Teo, E.K.; Moh, L.N. In vitro degradation behavior of M1A magnesium alloy in protein-containing simulated body fluid. Mat. Sci. Eng. C-Mater. 2011, 31, 579–587. [Google Scholar] [CrossRef]
- Zeng, R.C.; Sun, L.; Zheng, Y.F.; Cui, H.Z.; Han, E.H. Corrosion and characterisation of dual phase Mg-Li-Ca alloy in Hank’s solution: The influence of microstructural features. Corros. Sci. 2014, 79, 69–82. [Google Scholar] [CrossRef]
- Liu, X.; Yang, H.T.; Liu, Y.; Xiong, P.; Guo, H.; Huang, H.H.; Zheng, Y.F. Comparative Studies on Degradation Behavior of Pure Zinc in Various Simulated Body Fluids. Jom-Us 2019, 71, 1414–1425. [Google Scholar] [CrossRef]
- Graedel, T.E. Corrosion Mechanisms for Zinc Exposed to the Atmosphere. J. Electrochem. Soc. 1989, 136, C193–C203. [Google Scholar] [CrossRef]
- Wang, W.; Mohammadi, F.; Alfantazi, A. Corrosion behaviour of niobium in phosphate buffered saline solutions with different concentrations of bovine serum albumin. Corros. Sci. 2012, 57, 11–21. [Google Scholar] [CrossRef]
- Zeng, R.C.; Hu, Y.; Guan, S.K.; Cui, H.Z.; Han, E.H. Corrosion of magnesium alloy AZ31: The influence of bicarbonate, sulphate, hydrogen phosphate and dihydrogen phosphate ions in saline solution. Corros. Sci. 2014, 86, 171–182. [Google Scholar] [CrossRef]


| Element | Characterized Bonds | Binding Energy (eV) | References |
|---|---|---|---|
| Zn 2p | ZnO | 1022 | [49] |
| Zn5(CO3)2(OH)6 | 1022.3 | [49] | |
| Zn3(PO4)2•4H2O | 1022.5 | [49] | |
| C 1s | C-H/C-C | 284.5 | [44,45] |
| C-N | 285.4 | [44,45] | |
| C-O | 286.2 | [44,45] | |
| C=O | 287.5 | [44,45] | |
| O=C-N | 288.3 | [44,45] | |
| N 1s | C-N | 399.4 | [46,47] |
| C=O-NH | 400.0 | [46,47] |
| Solution | Immersion Time (day) | CPEf (10−4Ω−1cm−2sn1) | n1 | Rf (Ωcm2) | χ2 (10−3) |
|---|---|---|---|---|---|
| SGF | 0 | 0.67 ± 0.08 | 0.91 ± 0.02 | 37.5 ± 3.55 | 1.610 ± 0.108 |
| 1 | 3.51 ± 0.32 | 0.82 ± 0.04 | 8.62 ± 0.89 | 0.233 ± 0.021 | |
| 3 | 2.95 ± 0.19 | 0.85 ± 0.05 | 13.3 ± 1.01 | 0.122 ± 0.011 | |
| 7 | 1.72 ± 0.07 | 0.87 ± 0.02 | 16.1 ± 1.98 | 0.614 ± 0.037 |
| Solution | Immersion Time (day) | CPEf (10−4Ω−1cm−2sn1) | n1 | Rf (Ωcm2) | CPEdl (10−4Ω−1cm−2 sn2) | n2 | Rct (kΩ cm2) | W (10−4Ω−1cm−2s0.5) | χ2 (10−3) |
|---|---|---|---|---|---|---|---|---|---|
| SIF | 0 | 6.39 ± 0.52 | 0.70 ± 0.10 | 6177 ± 354 | 5.83 ± 1.44 | 0.73 ± 0.08 | 8.97 ± 0.65 | - | 0.40 ± 0.018 |
| 1 | 0.50 ± 0.09 | 0.69 ± 0.06 | 175 ± 21.8 | 4.87 ± 0.20 | 0.73 ± 0.11 | 9.15 ± 0.87 | 2.78 ± 0.12 | 0.30 ± 0.022 | |
| 3 | 0.360 ± 0.05 | 0.73 ± 0.05 | 339 ± 30.4 | 2.05 ± 0.13 | 0.68 ± 0.07 | 9.28 ± 0.44 | 2.74 ± 0.23 | 0.44 ± 0.015 | |
| 7 | 0.168 ± 0.01 | 0.8 ± 0.09 | 6755 ± 467 | 1.29 ± 0.41 | 0.63 ± 0.04 | 16.5 ± 0.71 | 0.265 ± 0.04 | 0.85 ± 0.031 |
Disclaimer/Publisher’s Note: The statements, opinions and data contained in all publications are solely those of the individual author(s) and contributor(s) and not of MDPI and/or the editor(s). MDPI and/or the editor(s) disclaim responsibility for any injury to people or property resulting from any ideas, methods, instructions or products referred to in the content. |
© 2023 by the authors. Licensee MDPI, Basel, Switzerland. This article is an open access article distributed under the terms and conditions of the Creative Commons Attribution (CC BY) license (https://creativecommons.org/licenses/by/4.0/).
Share and Cite
Wang, M.; Yang, L.; Zhu, X.; Yang, L.; Shen, J.; Lu, T.; Liu, H.; Song, Z. Corrosion Mechanisms of a Biodegradable Zn-0.4Li Alloy in Simulated Gastrointestinal Environment. Coatings 2023, 13, 529. https://doi.org/10.3390/coatings13030529
Wang M, Yang L, Zhu X, Yang L, Shen J, Lu T, Liu H, Song Z. Corrosion Mechanisms of a Biodegradable Zn-0.4Li Alloy in Simulated Gastrointestinal Environment. Coatings. 2023; 13(3):529. https://doi.org/10.3390/coatings13030529
Chicago/Turabian StyleWang, Manli, Lingbo Yang, Xinglong Zhu, Lijing Yang, Jianwei Shen, Ting Lu, Huinan Liu, and Zhenlun Song. 2023. "Corrosion Mechanisms of a Biodegradable Zn-0.4Li Alloy in Simulated Gastrointestinal Environment" Coatings 13, no. 3: 529. https://doi.org/10.3390/coatings13030529