Abstract
Moisture is a significant problem in standard pavements, causing asphalt mixtures to deteriorate due to insufficient water permeability. This failure from moisture damage is often caused by precipitation accumulation or poor drainage, which allows water to weaken adhesion by seeping between the aggregates and the asphalt. The relationship between permeability and aggregate contact length is believed to be inverse. To effectively assess water permeability performance and moisture damage, an asphalt concrete design criterion was established using the Image Processing and Analysis System (IPAS) to determine aggregate contact lengths. The objective of this research was to use laboratory experiments in conjunction with IPAS to investigate air-void-controlled asphalt mixtures with various material properties and assess the correlation of water permeability with other factors. The results show that AC60/70, AC60/70+Carbon Black, and AC60/70+SBS combinations with coconut peat filler had the lowest permeability coefficient (k) among similar mixtures, with values of 0.056 × 10⁻⁵ cm/s, 0.010 × 10⁻⁵ cm/s, and 1.508 × 10⁻⁵ cm/s, respectively. Both the dense and porous gradations of the modified asphalt binder demonstrated positive linear relationships between TSR and permeability. This study found a strong linear relationship between TSR (tensile strength ratio) and k (permeability coefficient) in both dense and porous modified asphalt binder gradations, with R2 values of 0.79 and 0.74, respectively. Additionally, we found that the number of contact points and contact length in the skeleton strongly influenced the mixes’ permeability, with a linear trend of 0.93 for both indices.
1. Introduction
The degradation of the asphalt mixture caused by moisture is a major cause of pavement failure. Loss of adhesion between asphalt and aggregates as well as loss of asphalt adhesion are the primary mechanisms that reduce asphalt performance. This failure is due to insufficient water permeability, which can be caused by rainwater retention or inadequate drainage, resulting in water penetrating the gap between the asphalt and the aggregates and deteriorating the asphalt’s adhesion. The presence of air voids in asphalt concrete is also crucial for water permeability. Previous studies have examined water permeability measurements in asphalt concrete to assess the effectiveness of road surfaces in influencing water permeability using a simple equation method [1,2]. However, these studies did not explore the impact of the aggregate packing pattern on the relationship between air voids and water permeability in asphalt concrete, which limits the use of image analysis in assessing moisture damage resistance. Nonetheless, recent research has focused on the effectiveness of image analysis and digital image correlation in analyzing surface features such as pore distribution, aggregate characteristics, texture, and microcracking for evaluating the moisture damage resistance and susceptibility of asphalt mixtures. These methods have the potential to provide a reliable, efficient, and accurate means of evaluating the moisture damage resistance of asphalt mixtures and can offer insights into the underlying mechanisms of moisture damage [3,4,5]. However, further research is needed to validate these methods and fully understand their potential for optimizing the design of asphalt pavements for improved moisture resistance. A previous study using the Image Processing and Analysis System (IPAS) found that the compaction pattern of asphalt concrete aggregates with the same density but different aggregate orientations resulted in varying lengths of aggregate contact and affected asphalt concrete performance [6]. Therefore, analyzing water permeability in asphalt concrete with various compacted aggregates is essential to improve efficiency and prevent damage to the pavement surface.
An efficient asphalt concrete design criterion established by analyzing the sum of the aggregate’s contact lengths using IPAS to validate water permeability performance and moisture damage was taken into account. However, studies on the structural factor of aggregate alignment in asphalt concrete with similar air voids with regard to water permeability capacity have not been successful. As a result, the goal of this research is to investigate air-void-controlled asphalt mixtures using various material properties (e.g., filler type, asphalt type, and aggregate gradation) through a laboratory experiment in conjunction with IPAS to assess the correlation of water permeability with other factors.
Water permeability is the primary determinant of the amount of water that can pass through pavement, and it is mainly influenced by the size, number, and connectivity of air voids within the asphalt. Larger air voids increase permeability but decrease pavement stability, resulting in rutting, while decreasing air voids increases pavement resistance to stripping but makes road use hazardous [7]. Therefore, pavement design must balance safety and durability. Asphalt percentage, compaction capacity, aggregate type and size, thickness, aggregate design, and air voids are the primary factors influencing water permeability [8]. Previous studies have suggested that air voids, maximum aggregate size, and dust-to-asphalt ratio affect water absorption [9,10]. According to Wielinski (2007), permeability and stability are inversely correlated [7]. The sum of aggregate contact lengths has been found to be correlated with flow number in rutting resistance [6], thus it is hypothesized that permeability is inversely related to the sum of aggregate contact lengths. An efficient asphalt concrete design criterion involves analyzing the sum of aggregate contact lengths using IPAS to validate water permeability performance and moisture damage. However, studies on the relationship between the structural factor of aggregate alignment and water permeability capacity in systems with similar air voids have been unsuccessful. The goal of this research was to investigate air-void-controlled asphalt mixtures using various material properties (e.g., filler type, asphalt type, and aggregate gradation) through a laboratory experiment in conjunction with IPAS to assess the correlation of water permeability with other factors.
2. Materials and Methods
The objective of this experiment was to investigate the relationship between aggregate structure and permeability in asphalt mixtures. Two commonly used mix designs for road construction, namely dense and porous mixes, were chosen for the study. The air void content was controlled at 4% for the dense mix and 20% for the porous mix. The aggregate gradation followed the Superpave specification (Figure 1), with limestone (Chonburi, Thailand) from Chonburi selected as the aggregate for all mixes. Three different types of fillers, including limestone (Chonburi, Thailand), bagasse (Bangkok, Thailand), and coconut peat (Bangkok, Thailand), were used in the study, with a filler content of 20% by volume of asphalt (TIPCO Asphalt PCL, Bangkok, Thailand). This filler content was found to be workable in previous studies [11]. Three types of asphalt binder were selected, namely AC60/70 (TIPCO Asphalt PCL, Bangkok, Thailand) and AC60/70+Carbon Black for the dense mixes and AC60/70+SBS for the porous mixes. Table 1 summarizes the factors considered in the study. The samples underwent permeability, indirect tensile strength, and IPAS tests. For the IPAS analysis, each sample was cut into four pieces (Figure 2) after the permeability test to assess the aggregate structure [12].
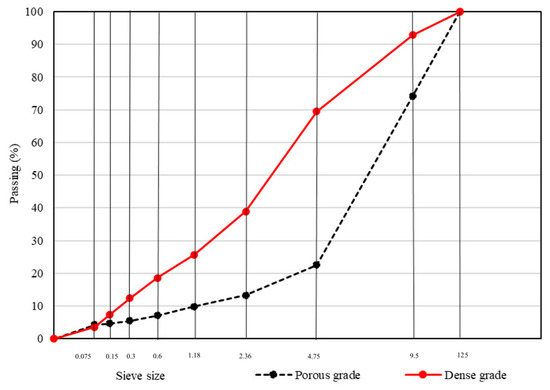
Figure 1.
Aggregate gradation.

Table 1.
Summary of factors to determine aggregate packing of permeability samples.
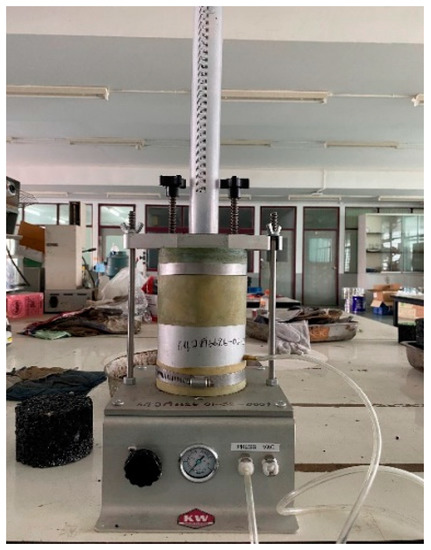
Figure 2.
Florida permeability tester.
In accordance with ASTM D6926 (ASTM 2010a), every material was prepared [13]. To ensure moisture-free conditions, the aggregates were heated at 100 °C for 24 h. The combination samples were heated for two hours at a constant temperature of 150 °C due to the growing viscosity of the asphalt mastic. Specimens with dimensions of 101.6 mm in diameter and 65–75 mm in height were compacted using the Marshall hammer compaction (2 × 75 blows). After the Marshall specimens cured for 24 h, volumetric measurements were taken for all specimens. The Marshall stability test was conducted in line with ASTM D6927-15 [14] after the necessary conditioning. Following that, the samples were evaluated for indirect tensile strength (ITS) in accordance with AASHTO T283.
Bagasse and coconut peat, two separate waste natural fillers, were ground using a grinding machine. Table 2 demonstrates that the water absorption rates of bagasse and coconut peat were significantly greater than those of limestone and granite (1.59% and 0.45%, respectively), at 69.3% and 52.5%, respectively. These values correspond to those from Ratchabut and Chaturabong (2020) [15]. The densities of bagasse and coconut peat were found to be much lower than those of limestone and granite (2.62 and 2.58 g/cm3, respectively). The density of waste natural fillers was found to be 7–10 times lower than that of mineral fillers, hence less bagasse and coconut peat would be used by weight in the asphalt mixture than would be the case with mineral fillers.
Table 2.
Moisture absorption and density for different fillers.
The experiments were divided into two phases to determine the effect of permeability on indirect tensile strength of the asphalt mixture and the relationship between permeability and the aggregate skeleton in the asphalt mixture.
2.1. Experiment Method of Effect of Permeability on Indirect Tensile Strength
In this phase, the aggregate gradations were parted into 2 types, including dense and porous mixes. In addition, the asphalt binders used were based on their ability to produce a certain kind of mix, in which higher performance grade (PG) asphalt binder was used for a porous mix, while lower PG asphalt binder was used for a dense mix. Table 3 presents the PG of each asphalt binder. The volumetric designs were set according to the Department of Highway (DOH) specification shown in Table 4.
Table 3.
PGs of asphalt binders.
Table 4.
Volumetric designs.
2.2. Indirect Tensile Strength Test
It is a standard procedure to measure the asphalt mixture’s resistance to moisture damage using the indirect tensile strength (ITS) test, as described in AASHTO T283. Each specimen’s static indirect tensile strength was assessed using a 51 mm/min loading rate. The split tensile strength was obtained by recording the peak load and dividing it by geometrical factors as shown in Equation (1).
where St = indirect tensile strength (kPa), P = maximum load (N), t = specimen height immediately before test (mm), and D = specimen diameter (mm).
Test were conducted under two conditions: dry and wet. Before being subjected to a test in the dry condition, samples were maintained for 24 h at room temperature. Samples were stored in the wet condition for 24 h in a temperature-controlled water bath set at 60 ± 1 °C. To determine the asphalt mixture’s susceptibility to moisture, the testing procedure was applied to the Superpave system and assessed using the ITS testing device. The samples evaluated under both of the two conditions were measured for tensile strength under each condition. The tensile strength ratio (TSR) was then determined to determine the optimal mixes for moisture resistance, as indicated in Equation (2).
2.3. Permeability Test
To measure permeability in the asphalt mixtures, the Florida permeability method [16] was used. The Florida permeability method is the most widely used asphalt permeability test method. It is used in laboratories to determine the water permeability of asphalt mixtures. This procedure used a falling head permeability tester (Figure 2), which was used to determine the flow rate of water flowing through the asphalt sample. The tester used a gradient cylinder filled with a predetermined volume of water, allowed water to flow through the asphalt sample, and noted the change values using Darcy’s law. If the test time was approaching thirty minutes during the first test run without the water level reaching the lower timing mark, then the tester marked the water level at thirty minutes and recorded this mark and time. In this case, the test needed to be run one more time, after which the mark and time were again recorded. This mark and time resulted in a high permeability value. The permeability coefficient could be calculated according to Equation (3).
where:
- k = coefficient of permeability, cm/s;
- a = inside cross-sectional area of the buret, cm2;
- L = average thickness of the test specimen, cm;
- A = average cross-sectional area of the test specimen, cm2;
- t = elapsed time between h1 and h2, s;
- h1 = initial head across the test specimen, cm;
- h2 = final head across the test specimen, cm;
- tc = temperature correction for viscosity of water.
2.4. Image Processing and Analysis System (IPAS)
IPAS is a tool utilized in the analysis of the internal structure of hot mix asphalt (HMA) by examining images of the aggregates. Using this tool, we can determine the aggregate structure by identifying connections between aggregates and determining their effective load-bearing structure. The IPAS process begins with the collection of HMA samples, which are then cut and scanned to create a digital image. This image is processed using digital image processing algorithms, with the first step being the conversion of the colored RGB image into a binary black-and-white image. This binary image is then transformed into a two-dimensional gray scale matrix representation in MATLAB, with each pixel representing the color intensity of the specific location [12].
To determine the geometry of each phase, analysis must be conducted on the gray-scale image, as the color intensity of the aggregates and mastic differ significantly in a gray-scale image. The gray-scale image is then converted to a black and white image for microstructure analysis, which focuses on the aggregate skeleton or the structure of connected aggregates in the loading direction. Non-skeleton aggregates are disregarded in measuring the internal structure indices.
To improve image quality and separate components, several filters were employed, including median, region maxima, watershed filtering, threshold filtering, and erosion. The process flow of the software is illustrated in Figure 3. Overall, IPAS serves as a valuable tool for analyzing the internal structure of HMA and assessing the effectiveness of different asphalt mixture designs [17].
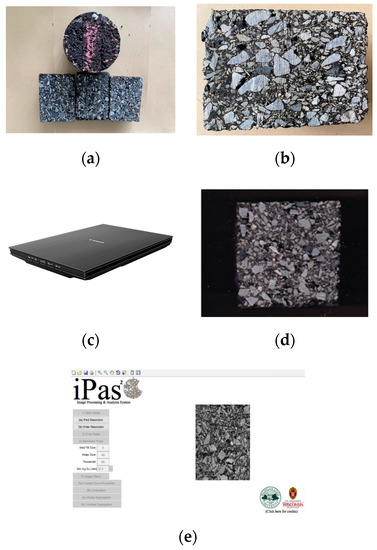
Figure 3.
(a) Prepare the sample; (b) divide the sample into three pieces; (c) use a scanner to capture an image of the sample; (d) adjust the image by cropping it to prepare for input into image processing and analysis software; (e) analyze the sample using software.
In characterizing the internal structure of a mixture, two critical parameters are contact length and orientation. Variations in contact areas (i.e., length in 2D) result in diverse stress intensities and aggregate interlocking, which can impact the overall performance of the mixture. Additionally, contact orientations determine the efficiency of the contacts in bearing the load. The greater the proximity of the normal to the contact orientation to the axial loading direction (i.e., 90 degrees in this context), the more effective the contact is in resisting the axial load. A typical mix under axial loading is illustrated in Figure 4, depicting contact lines.
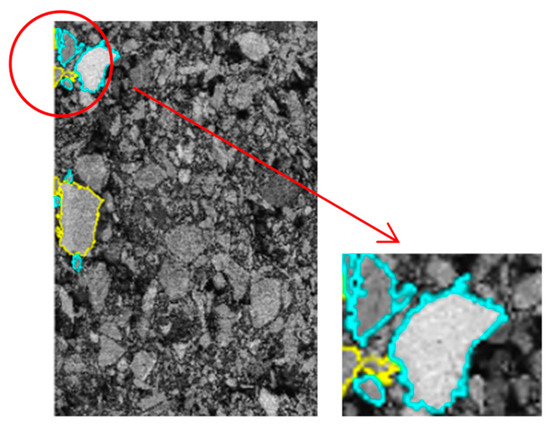
Figure 4.
The processing in IPAS program with an example of contact lines.
3. Results and Discussion
3.1. Effect of Different Filler Types on Water Permeability
The results of the permeability tests provided valuable insights into the impact of permeability on moisture damage resistance in different mix designs with identical air voids (Figure 5). The findings indicate that the mix designs containing AC60/70 asphalt and coconut peat filler had the lowest permeability coefficients compared to those containing limestone and bagasse fillers. This suggests that the AC60/70 and coconut peat mix had a higher resistance to water penetration than other mixes with the same air voids.
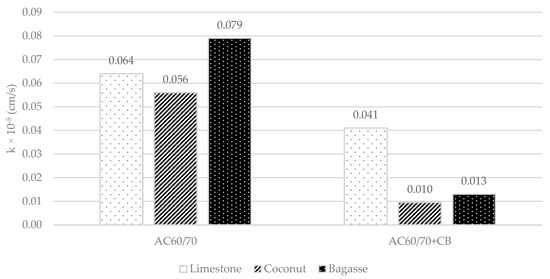
Figure 5.
The coefficient of water permeability in dense asphalt mixtures.
Furthermore, the results also indicate that the AC60/70+CB mixes generally had lower permeability coefficients than the AC60/70 mixes, with the lowest value observed in the mix containing AC60/70+CB and coconut peat filler. However, the k values for AC60/70+CB mixed with limestone filler and bagasse filler were higher than those of AC60/70+CB with coconut peat filler.
These findings are important because they highlight the importance of selecting the right asphalt and filler types in mix designs to enhance moisture damage resistance. The results suggest that using coconut peat as a filler can significantly reduce the permeability of a mix and improve moisture damage resistance. Further research could investigate the impact of other filler types and asphalt grades on the permeability and moisture damage resistance of mix designs with identical air voids.
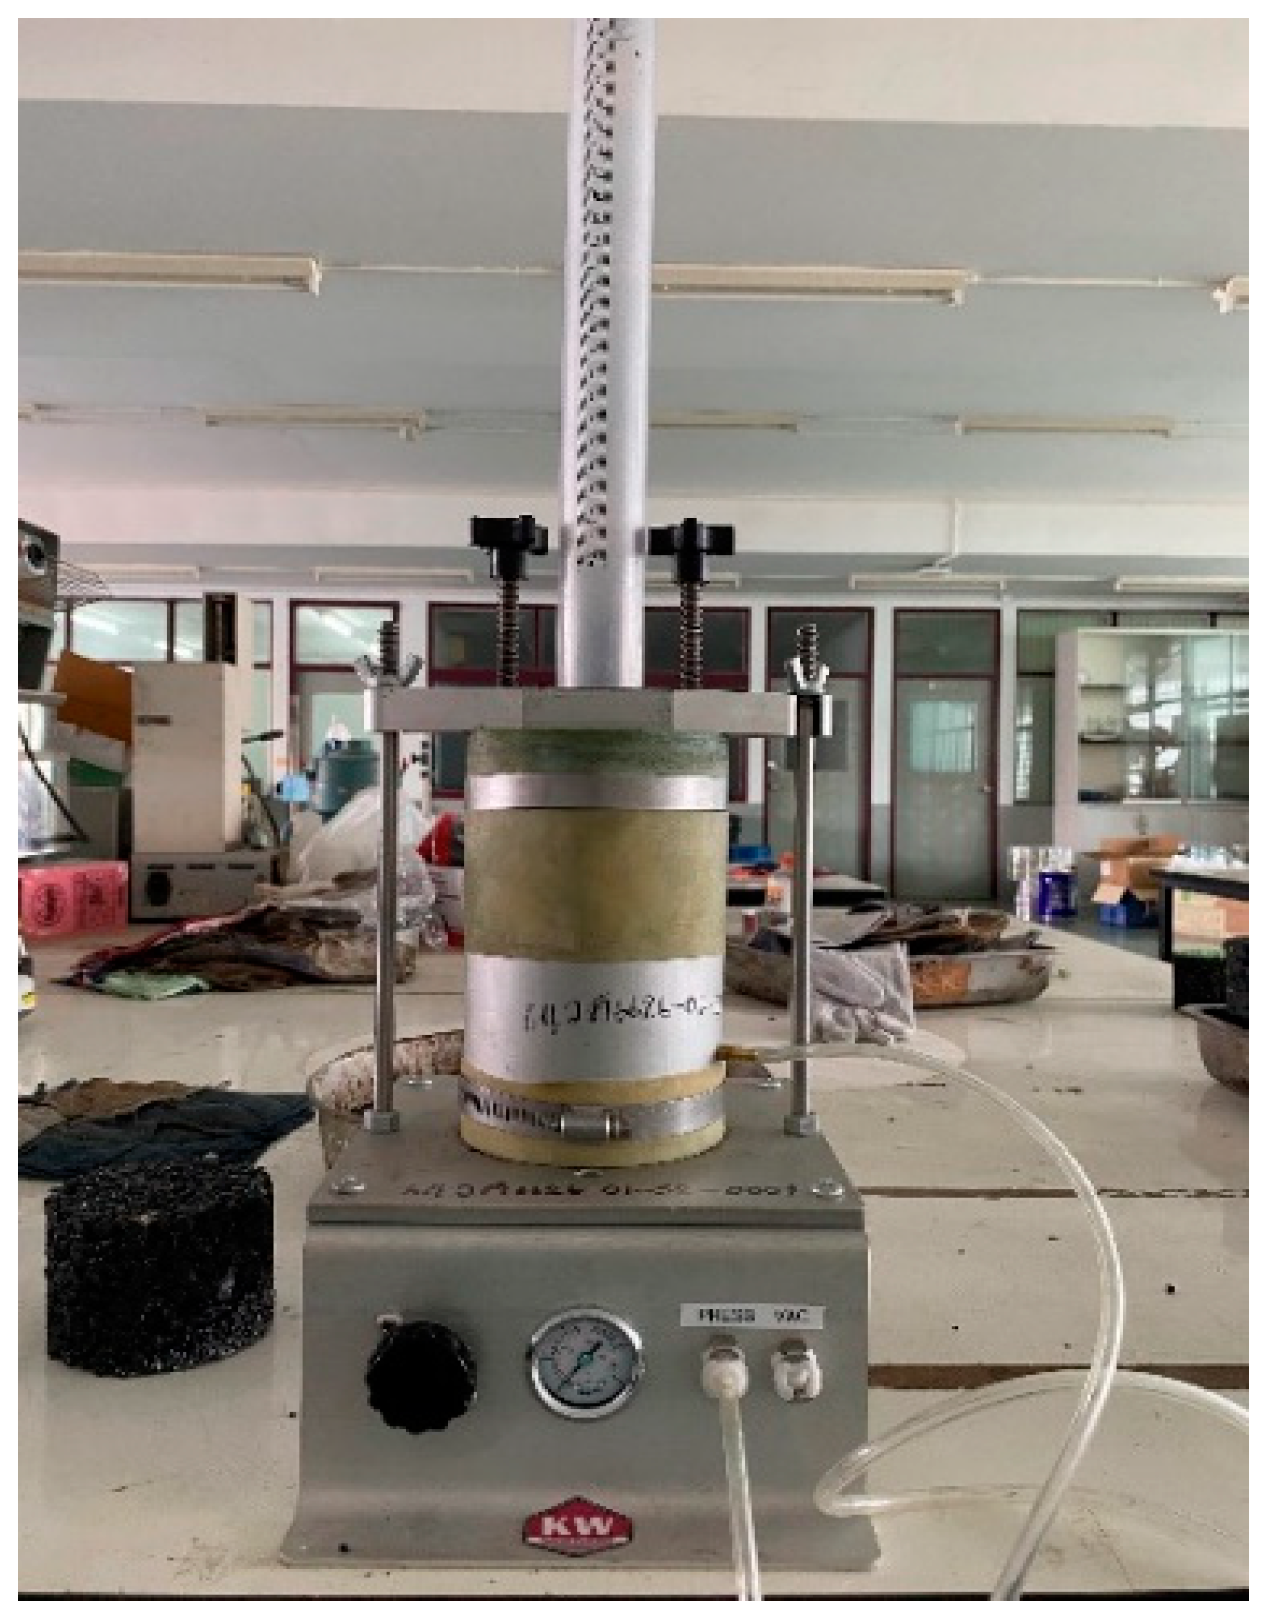
Permeability tests were conducted on porous asphalt mixtures with air voids of 20% for all the mixtures (Figure 6). The results show that the AC60/70+SBS with the coconut filler mixture had the lowest k value of 1.508 × 10⁻⁵ cm/s, which was lower than the k values of AC60/70+SBS mixtures with limestone and bagasse fillers, which had k values of 1.834 × 10⁻⁵ cm/s and 1.933 × 10⁻⁵ cm/s, respectively.

Figure 6.
The coefficient of water permeability in porous asphalt mixtures.
This suggests that the coconut filler in the AC60/70+SBS mixture may be more effective at reducing permeability compared to the limestone and bagasse fillers. The lower permeability in the AC60/70+SBS with coconut filler mixture helped improve the moisture damage resistance of the mixture, which is an important factor in asphalt pavement performance. Overall, the results of the permeability tests on the porous asphalt mixtures provide valuable insights into the performance of different mixtures and could inform the selection of optimal mix designs for asphalt pavement applications.
3.2. Relationship between Water Permeability and Moisture Damage Resistance
A prior research study demonstrated that the type of mineral fillers used can impact the resistance of asphalt mixtures to moisture damage [16]. However, it has not been confirmed if varying filler types and water permeability, while maintaining the same air voids, affect moisture damage resistance. When moisture infiltrates asphalt mixtures, two primary mechanisms can occur: adhesive failure between the asphalt binder and the aggregate surface, or cohesive failure of the asphalt mastic bond due to interaction with moisture.
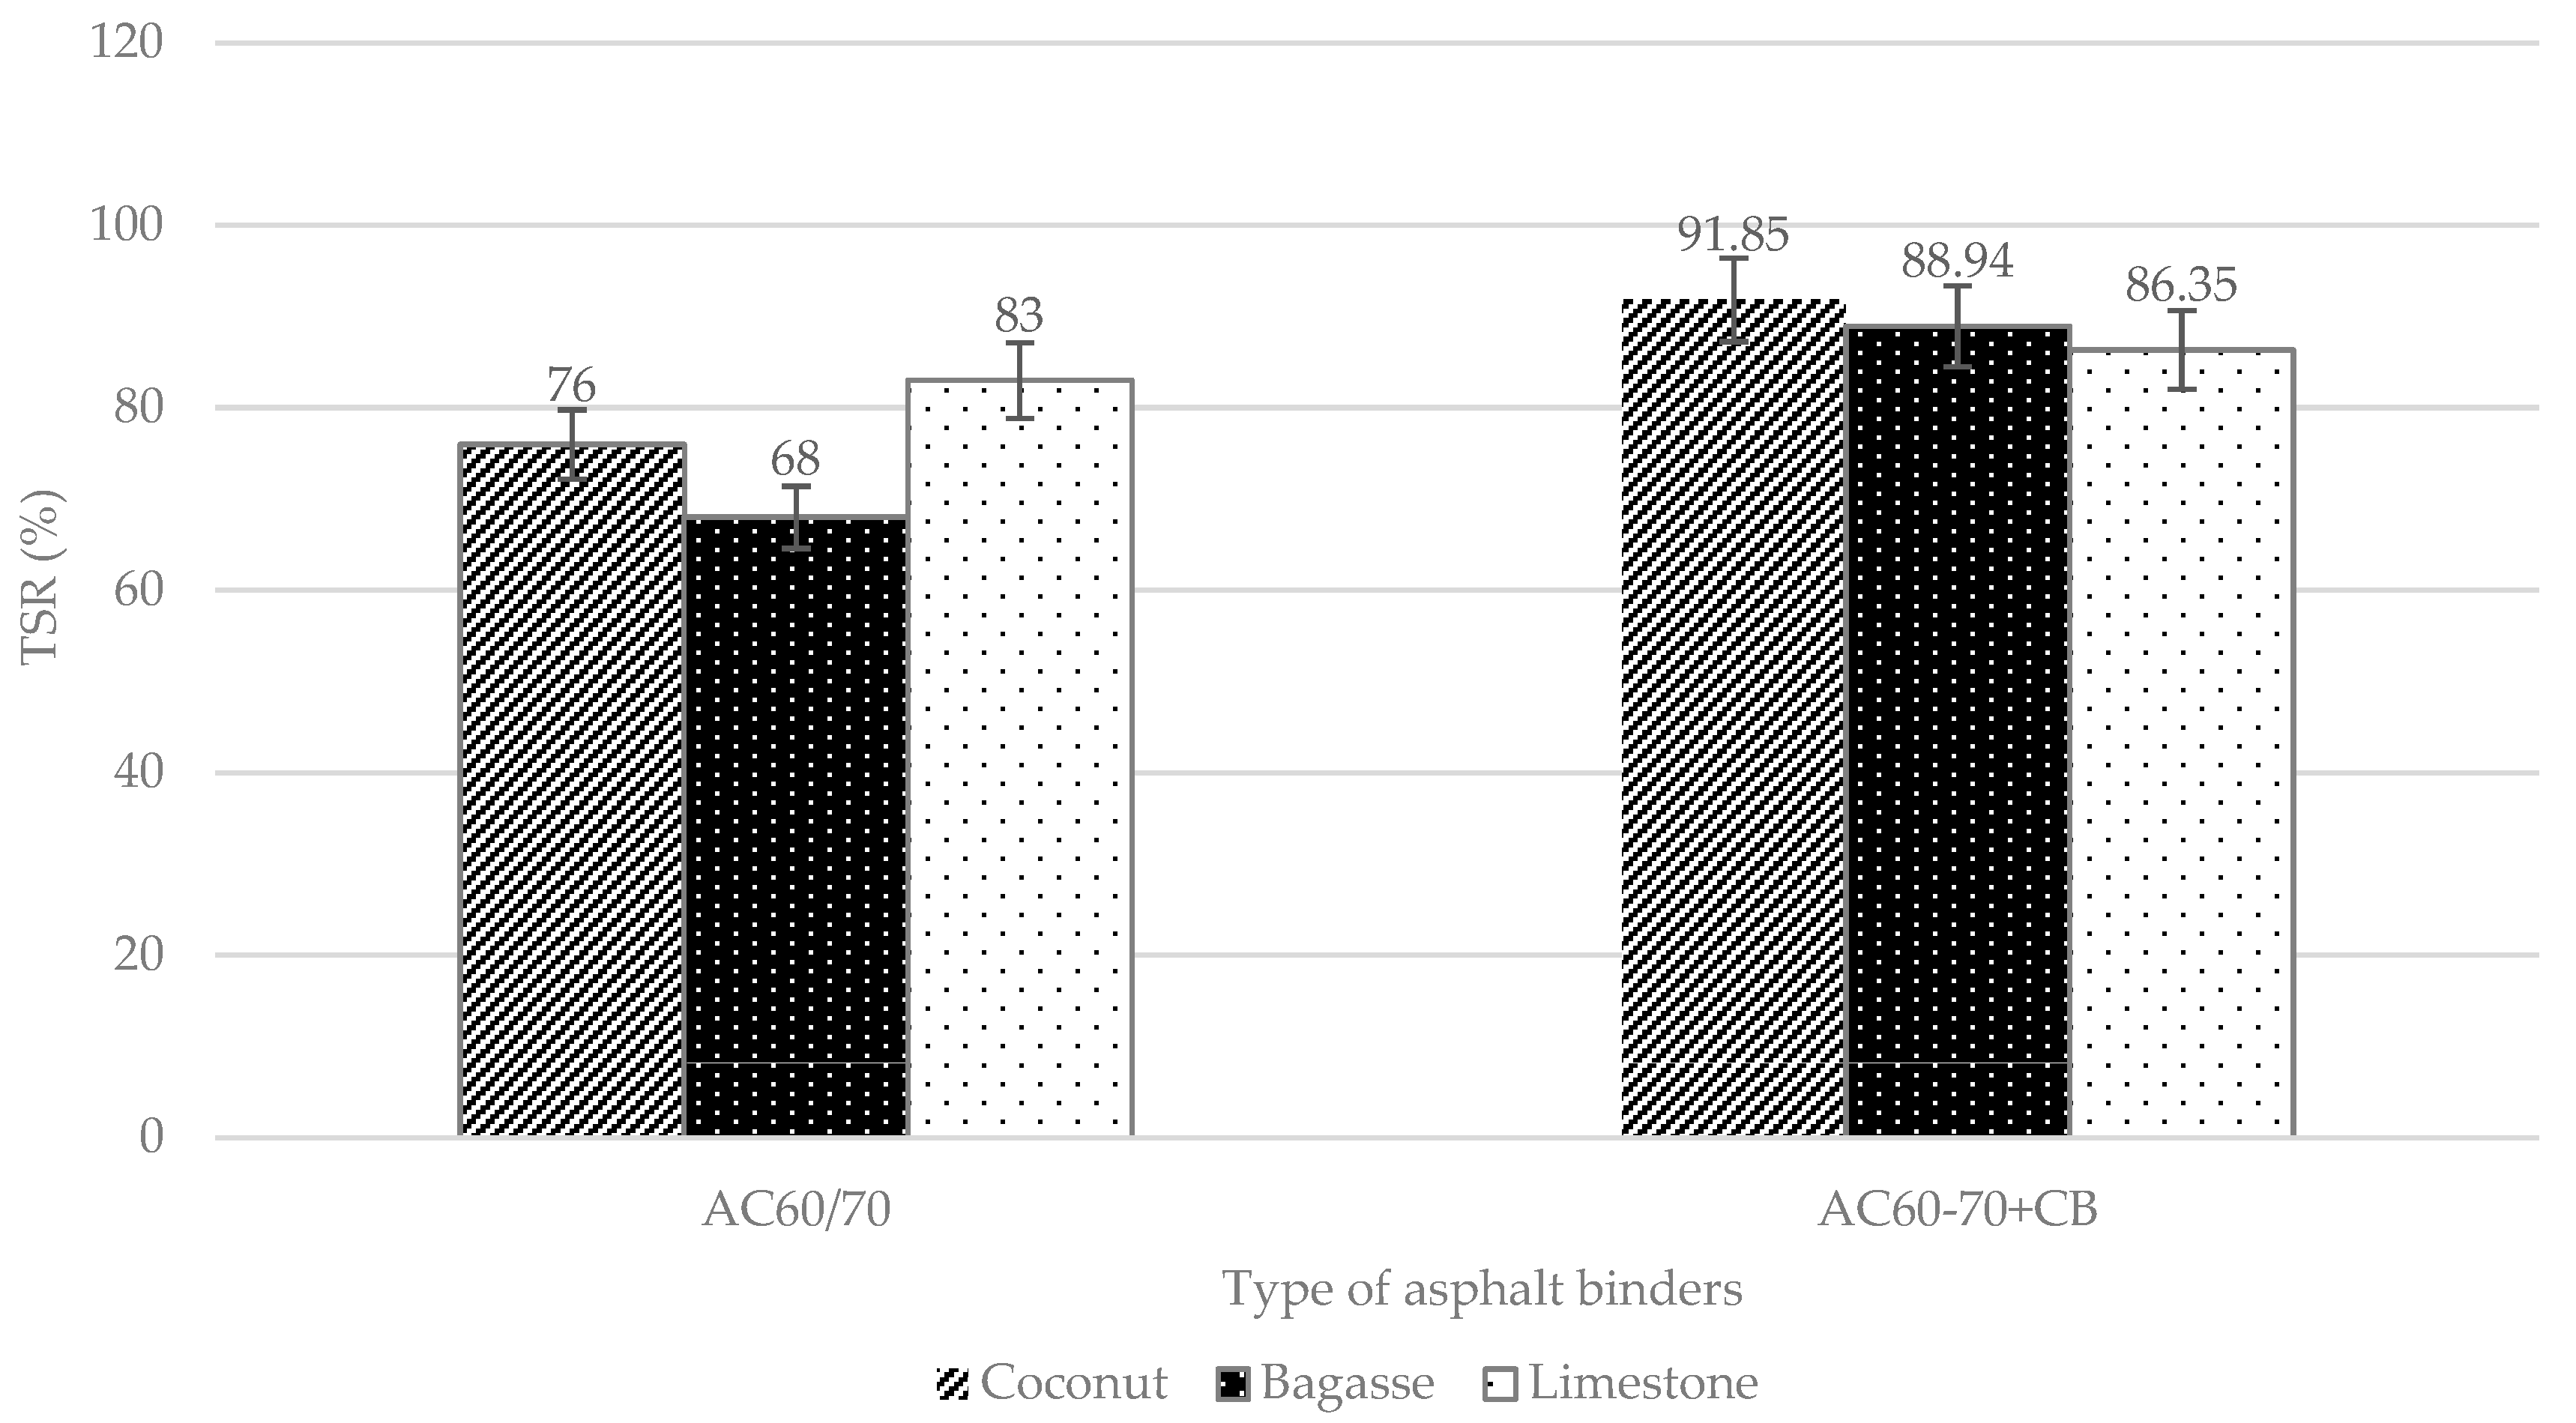
To examine the potential effect of varying permeability on moisture damage resistance, the tensile strength ratio (TSR) was calculated as an indicator from the indirect tensile strength (ITS) testing. Figure 7 displays the ratio of tensile strength after wet conditioning of asphalt mixtures with limestone aggregate for all filler types. In dense gradation, the results indicate that the TSR for asphalt mixtures with limestone filler and both types of asphalt binders consistently produced values of 0.83 and 0.86 for AC60/70 and AC60/70+CB, respectively, which exceeds the minimum threshold of 0.7 for typical specifications for TSR. Similarly, the TSR values for AC60/70 with coconut peat were above the threshold value at 0.76 and 0.92 for AC60/70 and AC60/70+CB, respectively. However, AC60/70 with bagasse presented lower TSR values than the specification, while samples of AC60/70+CB with bagasse exhibited good resistance to moisture damage at TSR of 0.89. These values were subsequently analyzed in relation to the permeability coefficient.

Figure 7.
TSR in dense mixture samples.
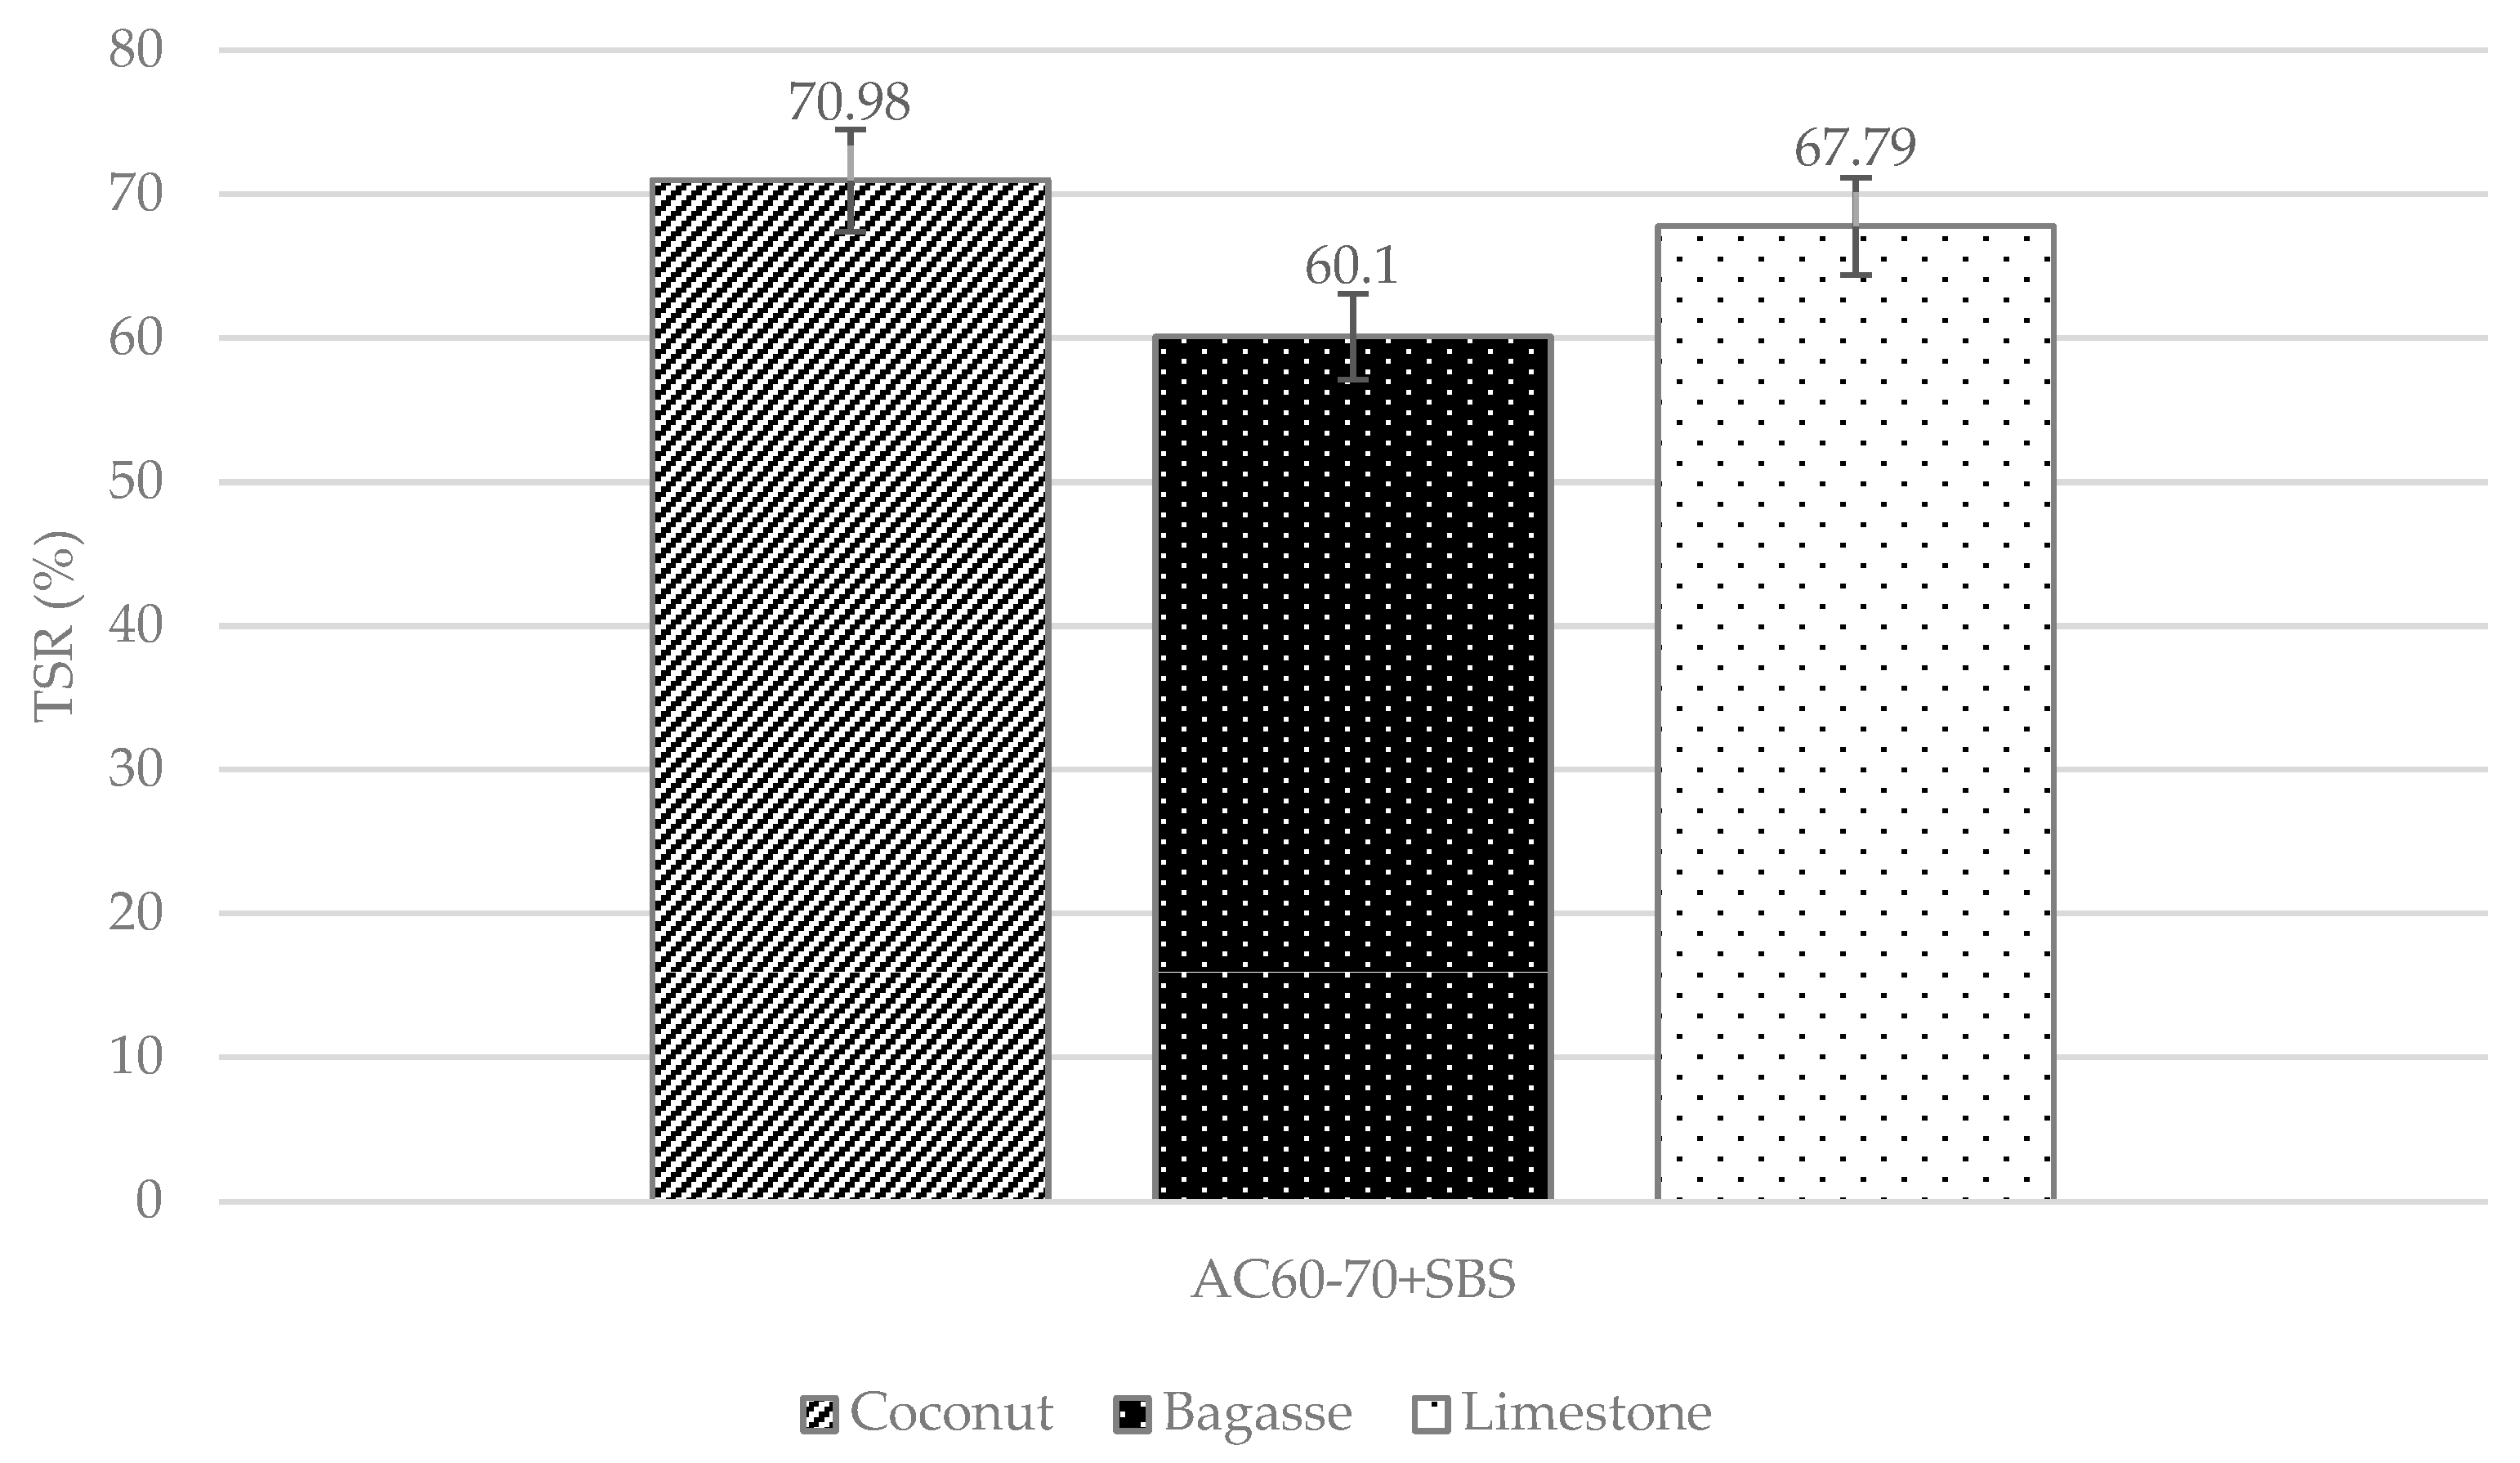
In porous asphalt mixtures, the large amount of air voids could be easily compromised by water, but the TSR results of the samples provide insight into their moisture damage resistance. The sample of AC60/70+SBS with coconut peat filler exhibited a TSR result of 0.71, which was relatively good compared to AC60/70 with bagasse and even limestone fillers, as illustrated in Figure 8.
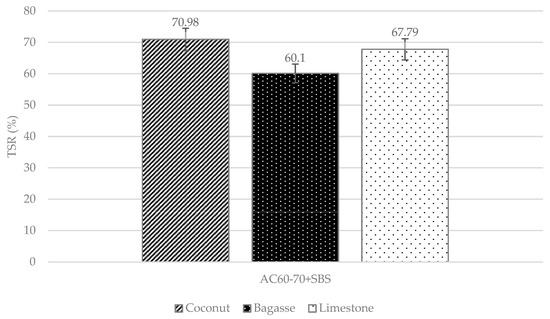
Figure 8.
TSR in porous mixture samples.
Table 5 displays the coefficient of permeability (k) for all mixes of dense and porous asphalt gradation samples. The dense asphalt mixture samples with AC60/70 binder and coconut peat filler exhibited the lowest k value of 0.056 × 10⁻⁵ cm/s, while those with limestone and bagasse fillers had k values of 0.064 × 10⁻⁵ and 0.079 × 10⁻⁵, respectively. Similarly, the trend of k values for porous asphalt mixture samples with AC60/70+SBS binder was consistent with dense asphalt mixture samples with AC60/70 binder. The porous asphalt mixture samples with AC60/70+SBS binder and coconut peat filler exhibited the lowest k value of 1.508 × 10⁻⁵ cm/s, while those with limestone and bagasse fillers had k values of 1.834 × 10⁻⁵ and 1.933 × 10⁻⁵, respectively.
Table 5.
The coefficient of permeability (k) of dense and porous gradation samples.
However, the asphalt mixture samples of dense gradation with AC60/70+CB binder exhibited a different trend from the others. The k values from lowest to highest were observed in samples with coconut peat (i.e., 0.010 × 10⁻⁵), bagasse (i.e., 0.013 × 10⁻⁵), and limestone (i.e., 0.041 × 10⁻⁵) fillers. Although it is commonly believed that the coefficient of permeability would be similar with the same air voids and asphalt binder and aggregate gradation, the filler type may influence the orientation of aggregates in asphalt mixtures, leading to different permeability.
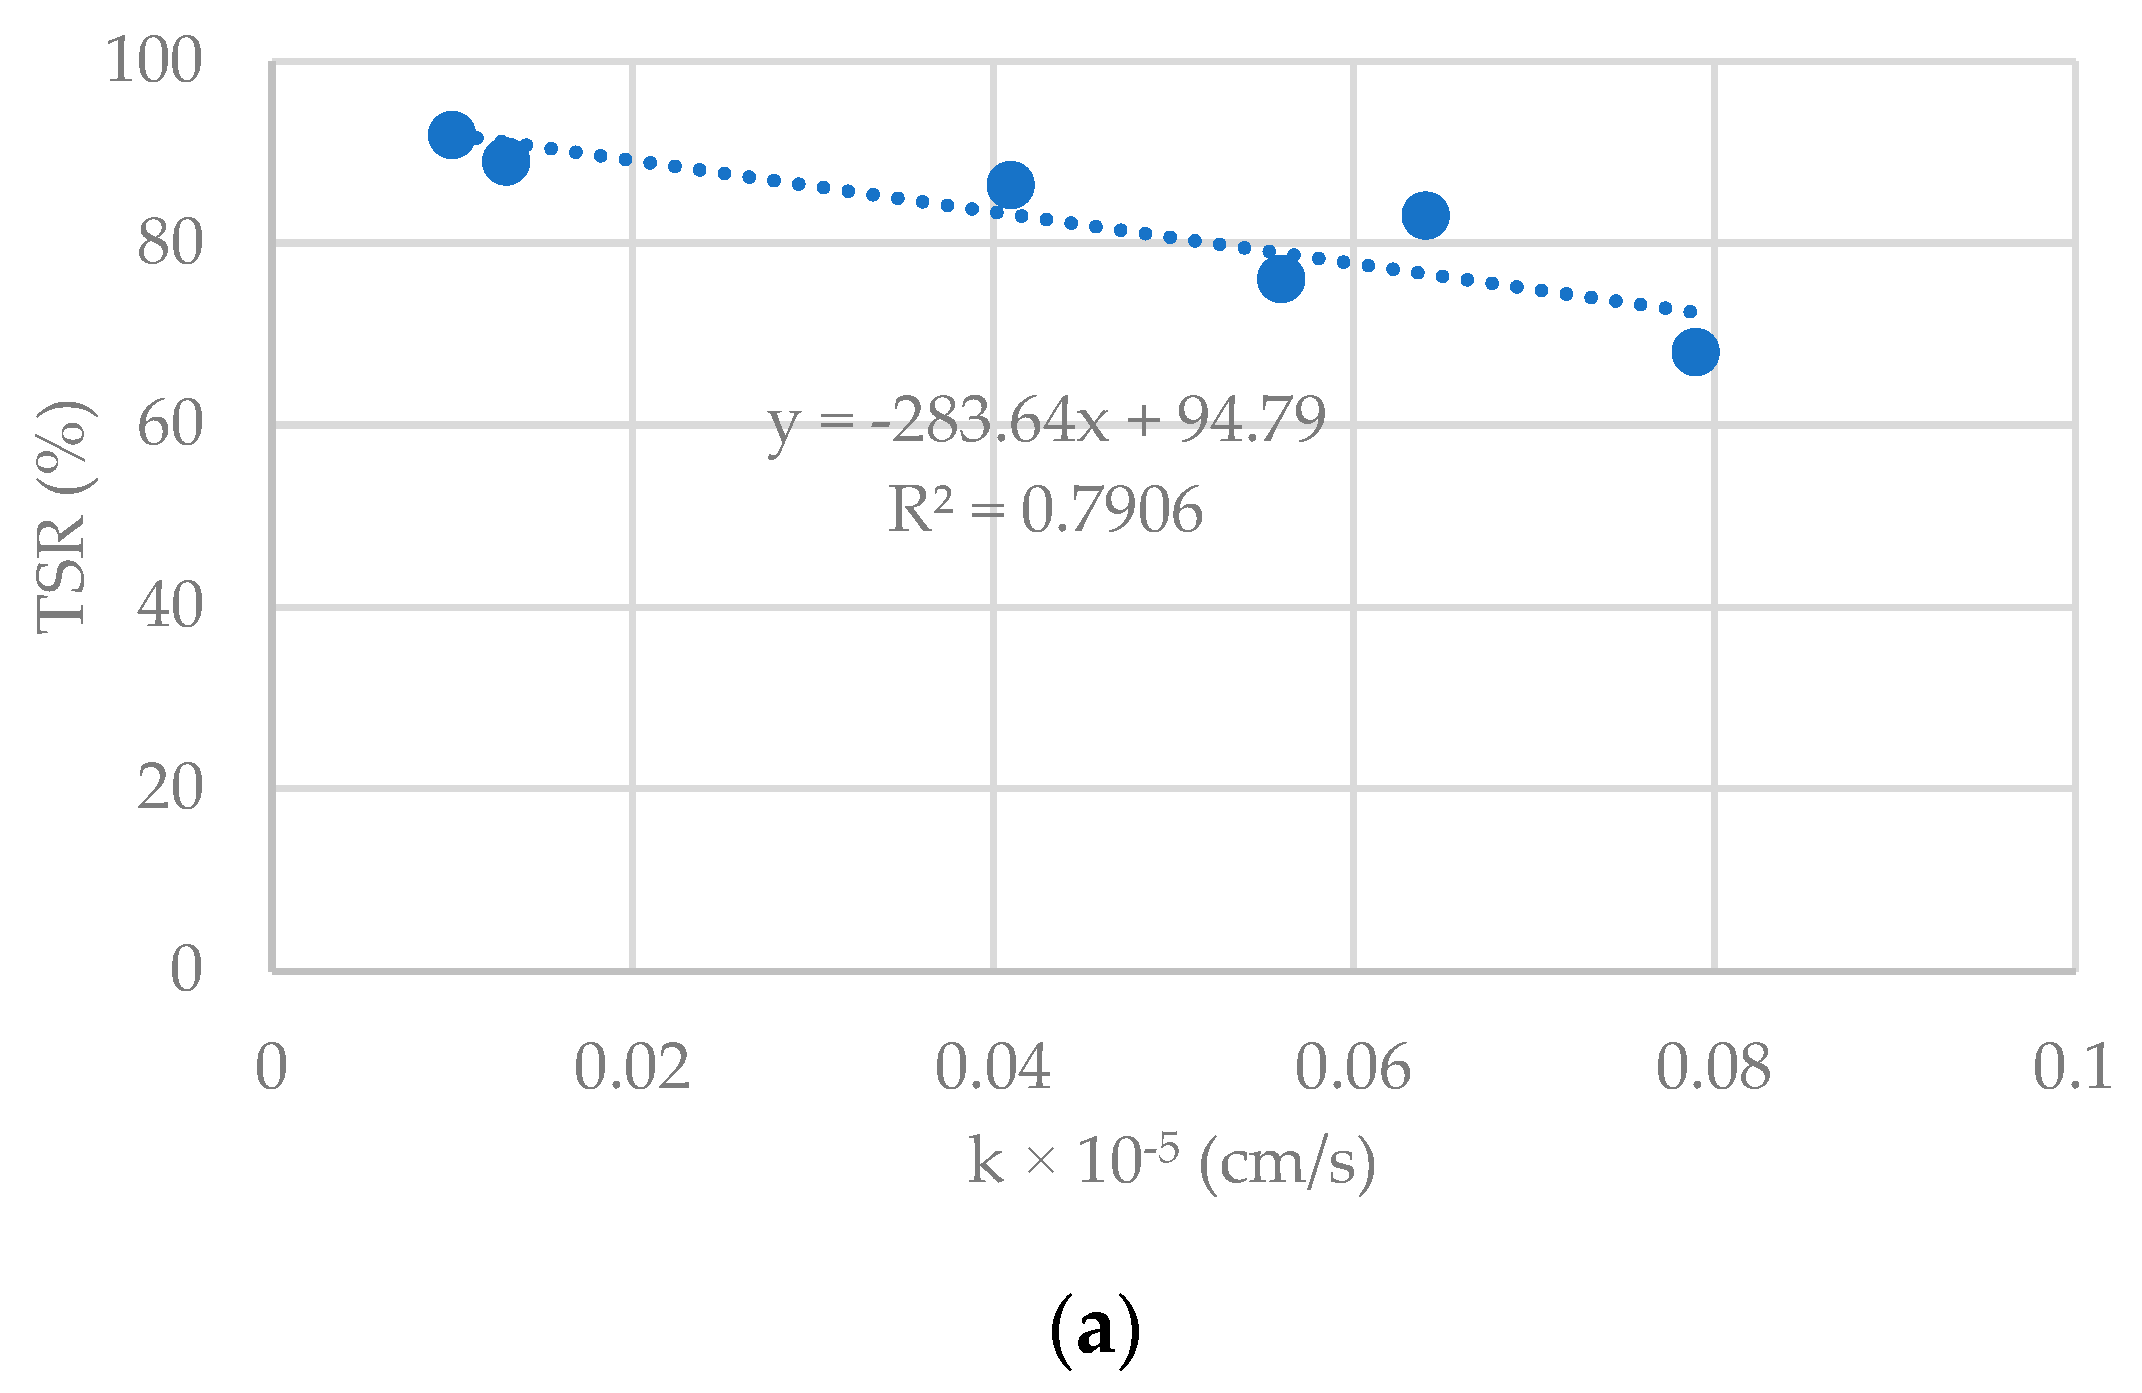
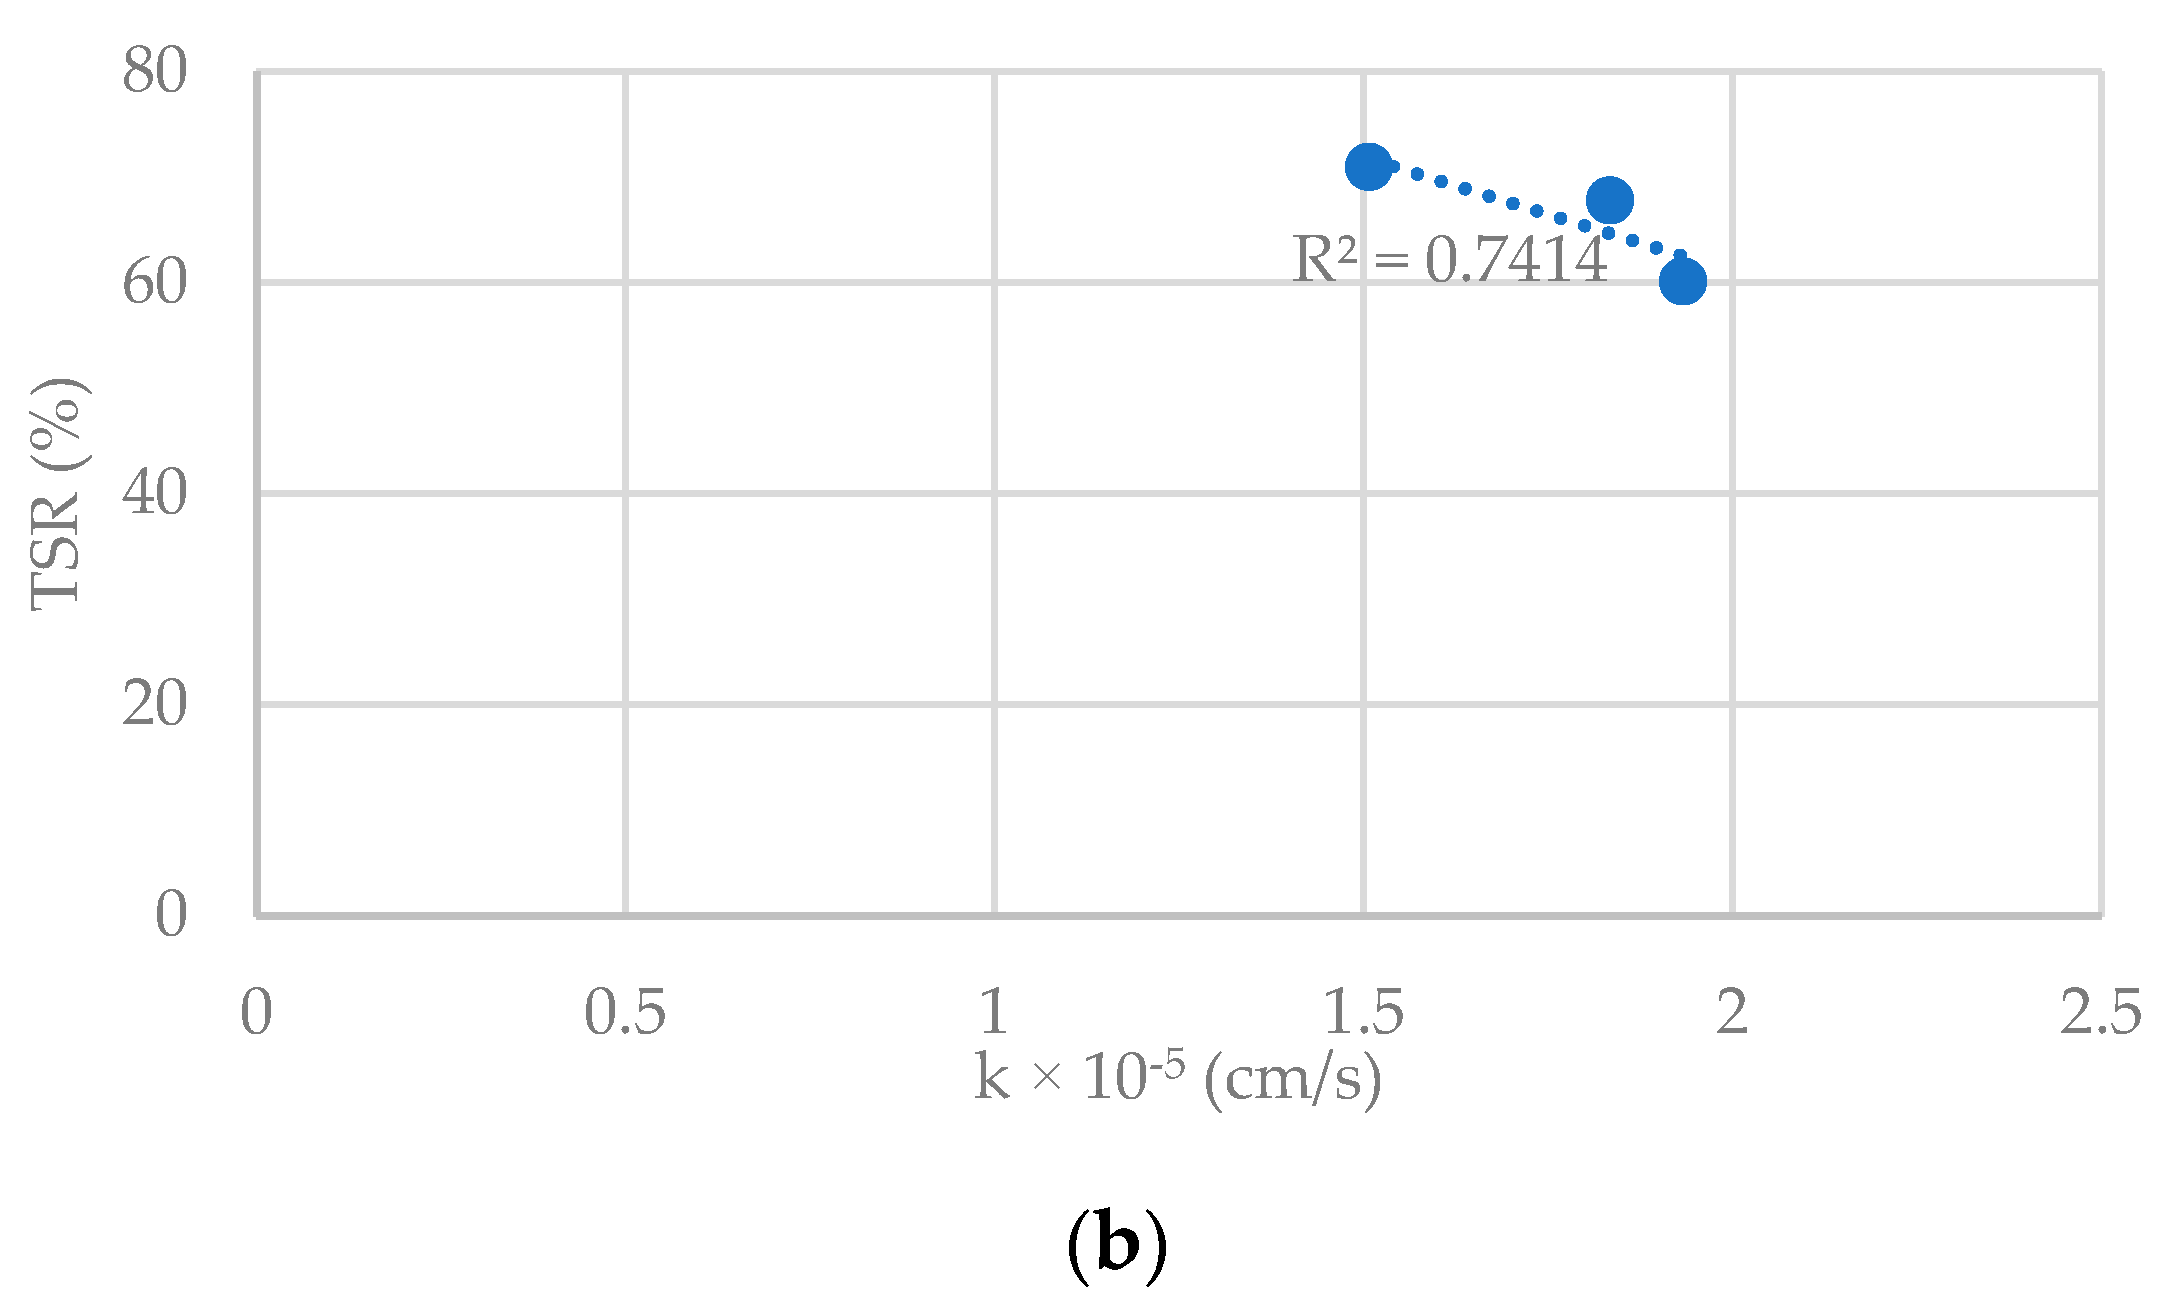
To investigate the impact of coefficient of permeability (k) on moisture damage resistance, a correlation between TSR (tensile strength ratio) and k was established (Figure 9). It was hypothesized that a higher k would result in a lower TSR. The findings reveal a robust linear association between TSR and k in both dense and porous modified asphalt binder gradations, with R2 values of 0.79 and 0.74, respectively. This indicates that TSR and k are related to the same gradation.

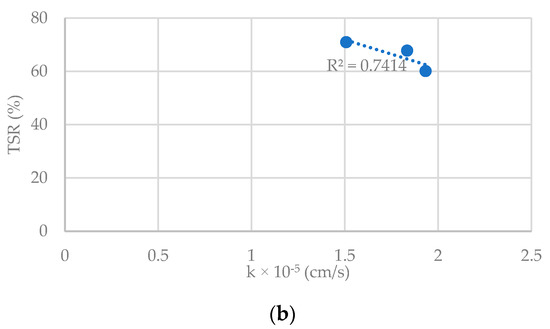
Figure 9.
Relationship between TSR and coefficient of permeability: (a) dense gradation; (b) porous gradation.
The results of this study suggest that varying filler types and water permeability could impact the moisture damage resistance of asphalt mixtures. The TSR results show that the samples with coconut peat filler consistently exhibited good moisture damage resistance, while the samples with bagasse filler presented lower TSR values. The k values of the samples also show that the filler type may influence the permeability of the asphalt mixture.
The correlation between TSR and k demonstrates a strong linear relationship in both dense and porous asphalt mixtures, indicating that they are related to the same gradation. These findings are important for improving the design of asphalt mixtures to enhance their resistance to moisture damage. By selecting fillers that result in lower permeability, the moisture damage resistance of asphalt mixtures could be improved, ultimately leading to longer-lasting and more durable roads.
3.3. Effect of Contact Length on Water Permeability
In this section, laboratory-produced mixes were utilized for the examination of various indices. A total of nine mixtures were created, incorporating three different binders (AC60/70, AC60/70+CB, and AC60/70+SBS), three different fillers (limestone, coconut peat, and bagasse), and two different gradations (dense and porous). The volumetrics and gradation details of each mix are presented in Table 5 and Figure 1, respectively.
Previous research by Sefidmazgi et al. (2012) demonstrated a correlation between IPAS aggregate skeleton indices and flow number, with two indices (number of aggregate contacts and total aggregate contact length) exhibiting strong correlation [6]. Based on this finding, the present study hypothesized that the aggregate skeleton may also influence the permeability of the mixes. The results of the analysis are presented in Table 6.
Table 6.
IPAS analysis of mixtures.
To enhance the visibility of the correlation, linear line charts were constructed. The coefficient of determination (R2) was utilized to assess the degree of correlation between the indices and coefficient of permeability. The correlations between the aggregate skeleton indices and permeability are depicted in Figure 10 and Figure 11.
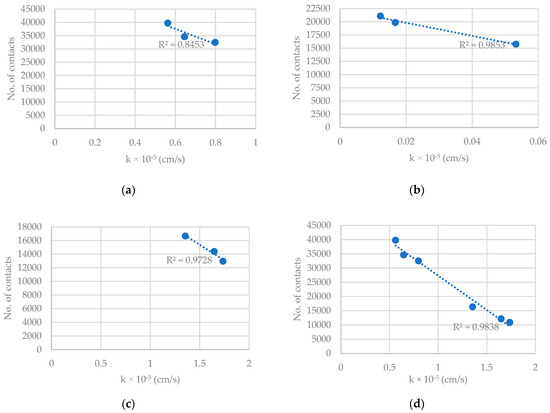
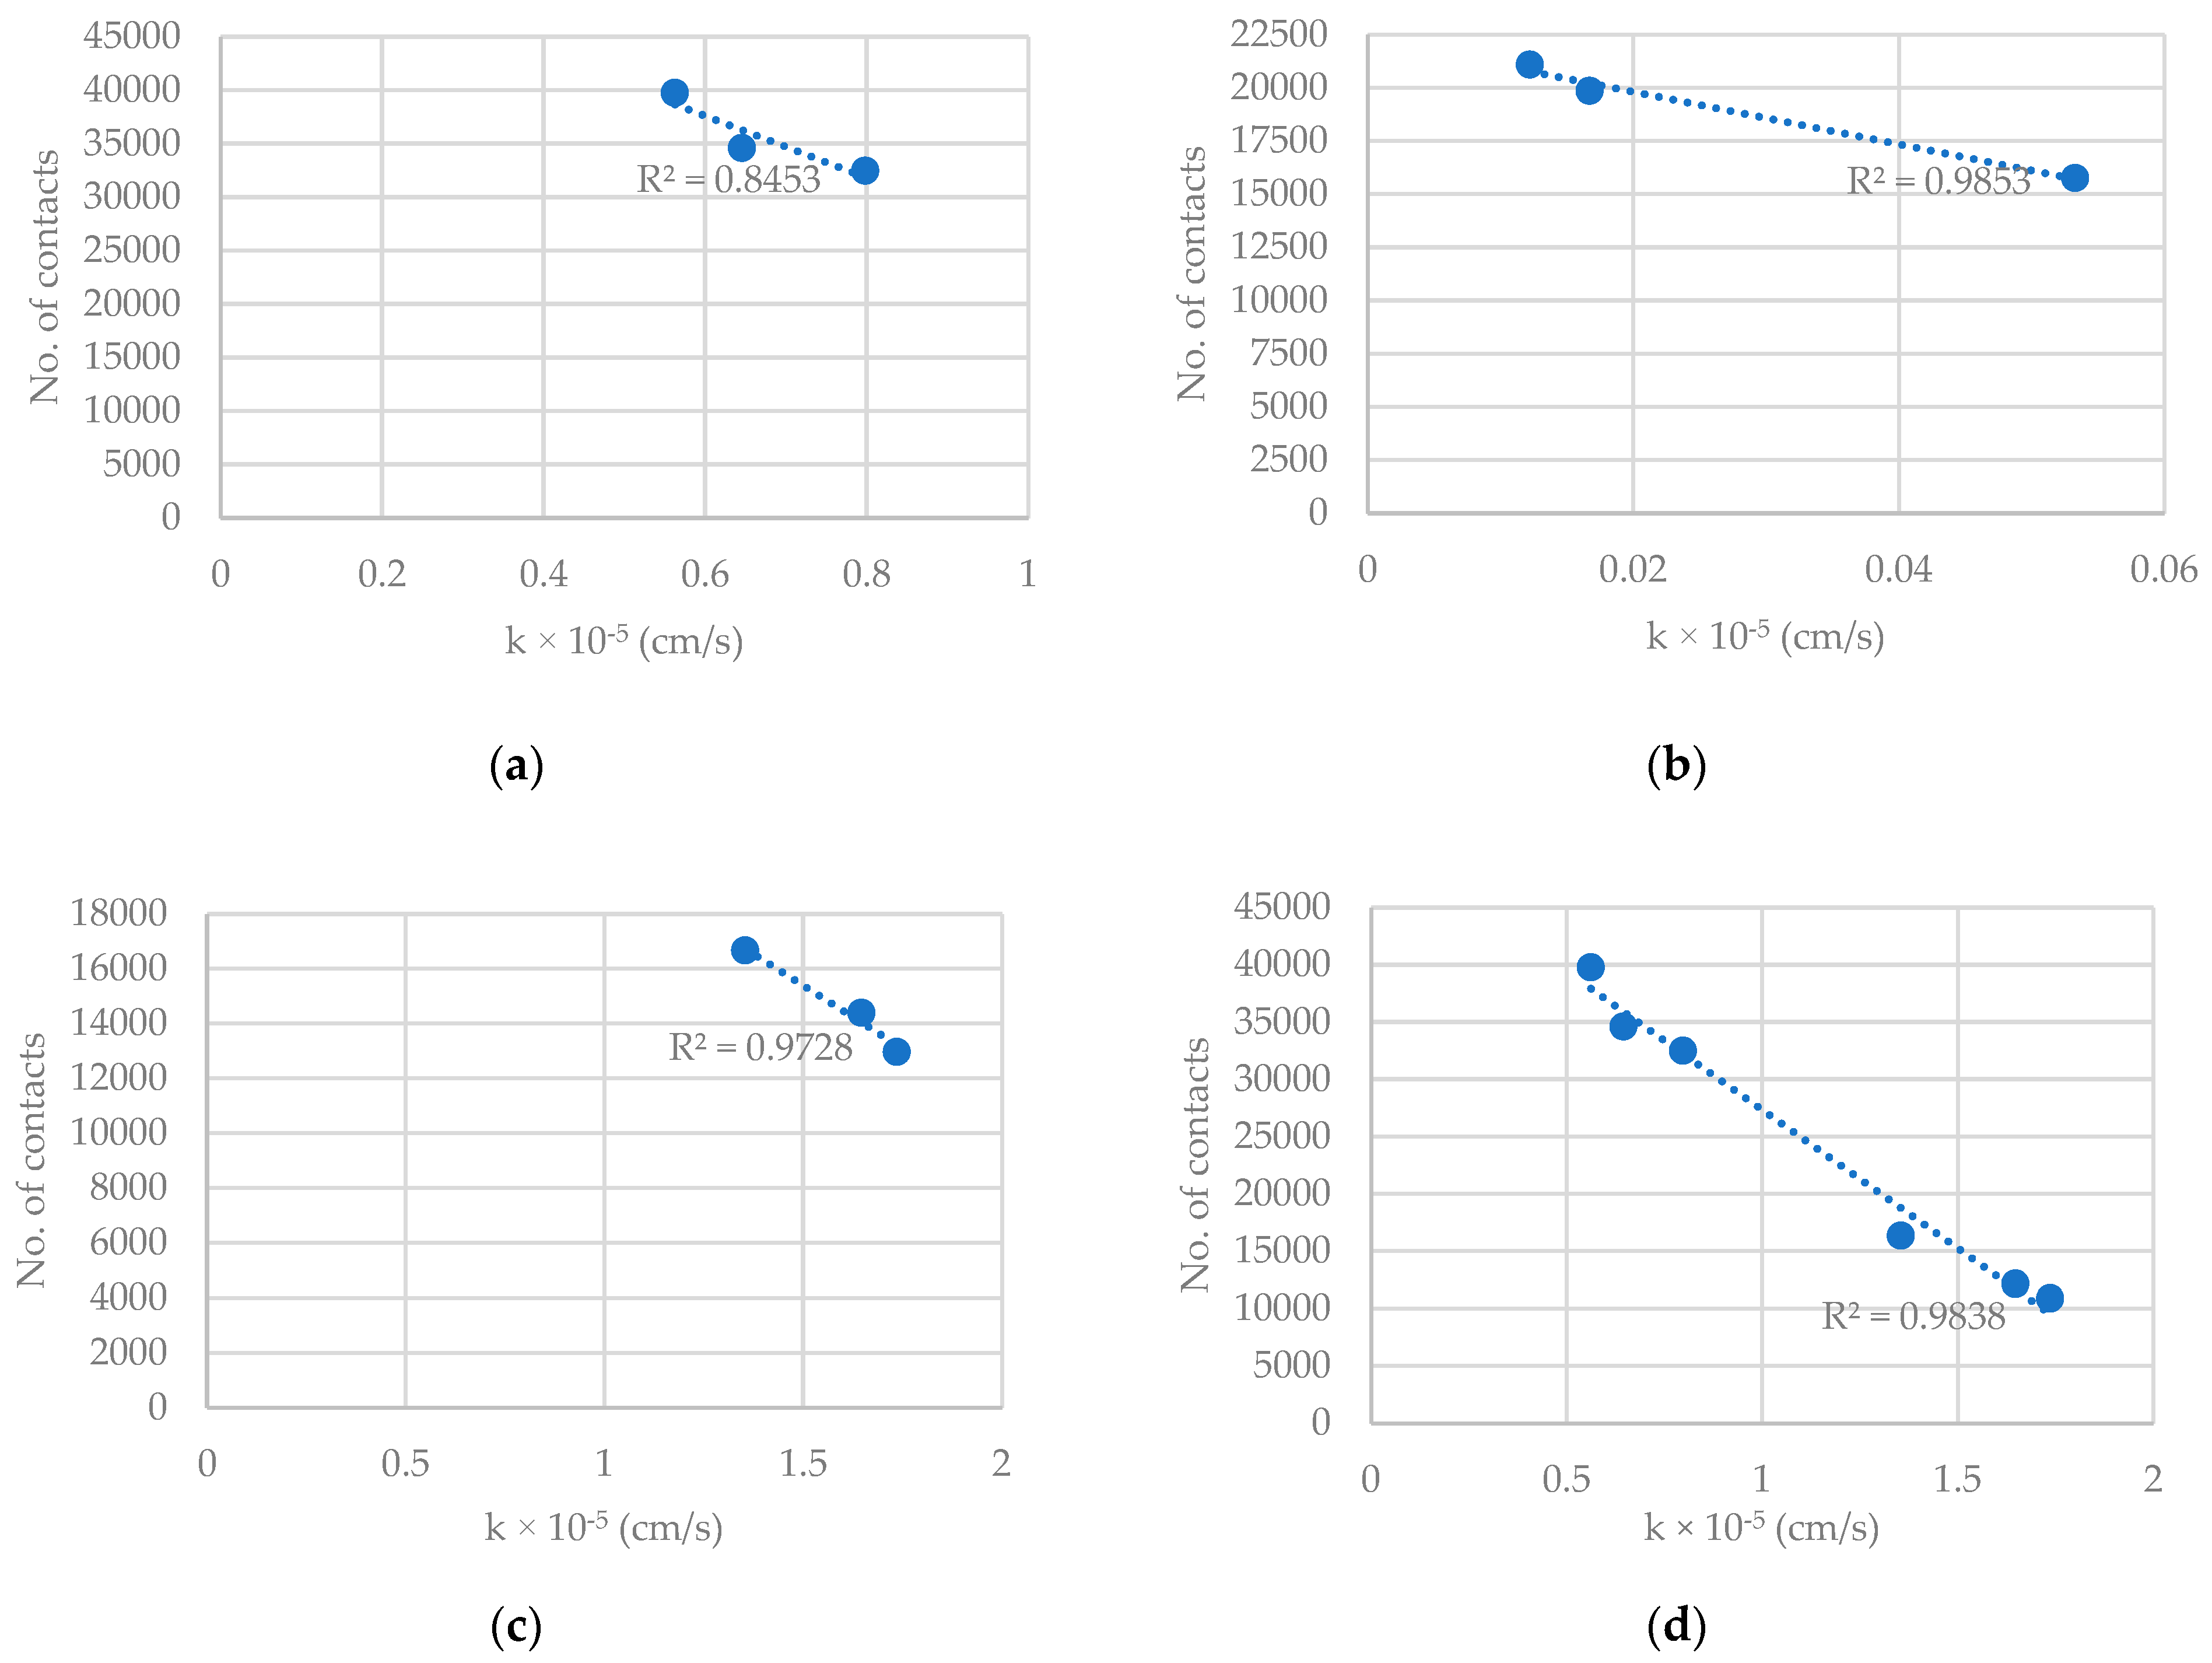
Figure 10.
Correlation of number of contacts calculated for the skeleton with permeability, (a) AC60/70 with dense gradation, (b) AC60/70+CB with dense gradation, (c) AC60/70+SBS with porous gradation, and (d) the combination of dense gradation set (a,b).
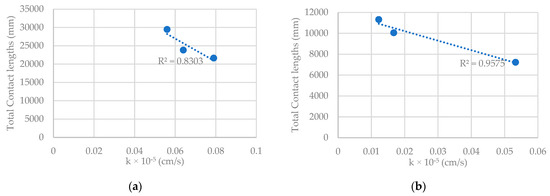
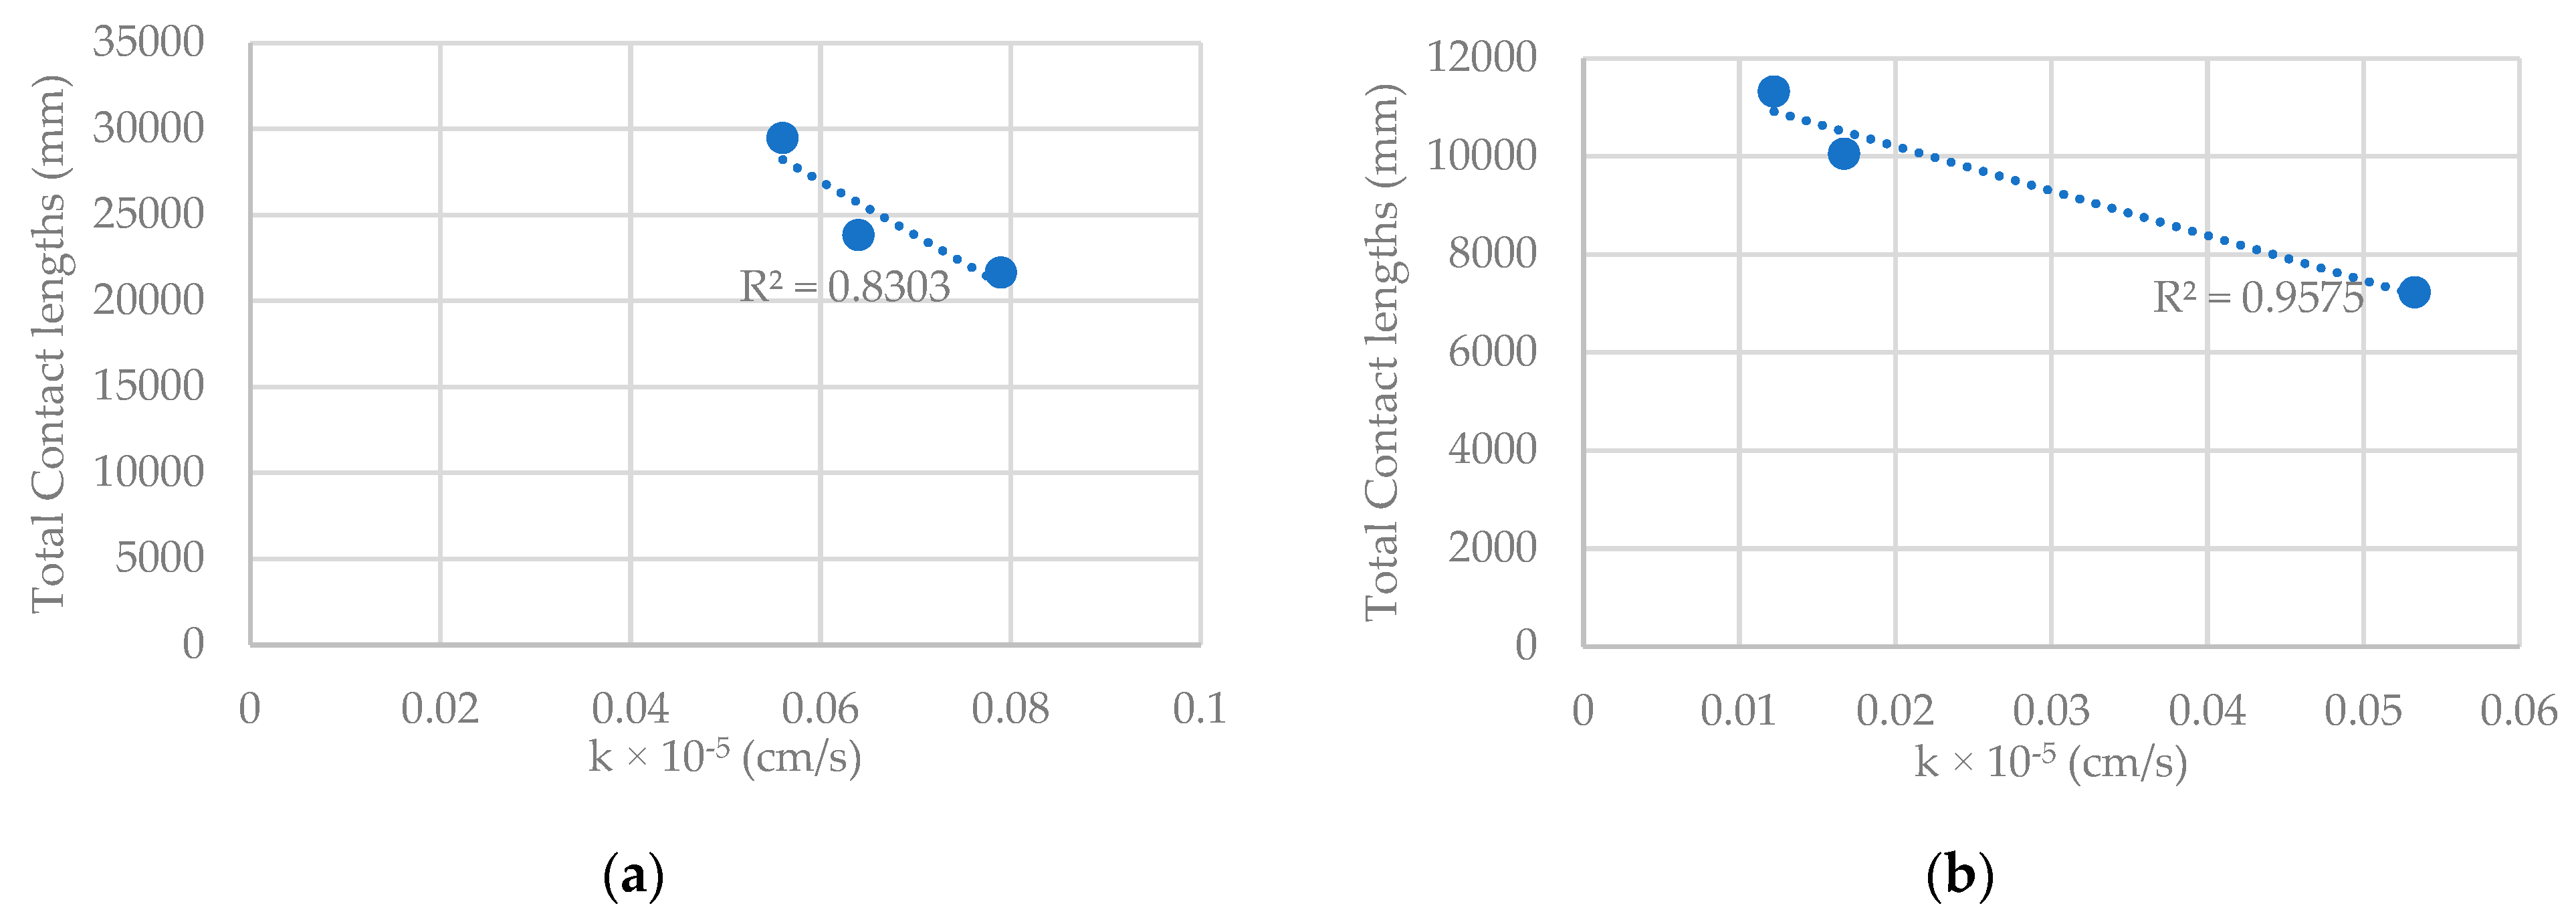
Figure 11.
Correlation of total aggregate contact lengths calculated for the skeleton with permeability, (a) AC60/70 with dense gradation, (b) AC60/70+CB with dense gradation, (c) AC60/70+SBS with porous gradation, and (d) the combination of dense gradation set (a,b).
According to the findings, there was a significant linear correlation observed between the number of contacts and contact length in the aggregate skeleton and the coefficient of permeability. The average value of R2 for the dense and porous gradations, indicating the correlation between the number of contacts in the aggregate skeleton and permeability, was 0.933. Similarly, the average value of R2 for the correlation between the total aggregate contact length in the aggregate skeleton and permeability was 0.93. Nonetheless, upon combining the same gradation for analysis, the relationship between the number of contacts in the aggregate skeleton and permeability remained significant. However, there were no associations observed between the total contact length in the aggregate skeleton and permeability. These findings suggest that the number of contacts may be a more important factor than contact length in determining permeability. These insights can help engineers design more effective and efficient permeable pavements and other applications that utilize aggregate materials.
4. Conclusions
In this study, we investigated the impact of different asphalt types and filler materials on the permeability and moisture damage resistance of asphalt mixtures, as well as the relationship between aggregate structure and permeability in asphalt mixtures. The results show that the mix designs containing AC60/70 asphalt and coconut peat filler had the lowest permeability coefficients compared to those containing limestone and bagasse fillers, indicating a higher resistance to water penetration. The AC60/70+CB mixes generally had lower permeability coefficients than the AC60/70 mixes, with the lowest value observed in the mix containing AC60/70+CB and coconut peat filler. The TSR results suggest that the AC60/70+SBS with coconut peat filler mixture exhibited good resistance to moisture damage. A preliminary study found that the number of contact points and contact length in the skeleton influenced the permeability of the mixes. Our findings suggest that the aggregate skeleton can significantly impact the permeability of mixes, and the two indices identified in this study can serve as useful predictors of permeability in future research.
Based on these results, it is recommended that future research consider the aggregate skeleton indices when designing asphalt mixes to achieve the desired permeability. In addition, it is suggested that the two indices identified in this study be used as predictors of permeability in future research. These findings could potentially be applied to the construction of more durable and sustainable asphalt pavements with improved resistance to moisture damage. Further research should be conducted to validate these findings on a larger scale and investigate the impact of other factors such as temperature and aging on permeability. Additionally, future studies should focus on exploring the effect of other filler types and asphalt grades on the permeability and moisture damage resistance of mix designs with identical air voids. Moreover, the impact of varying permeability on moisture damage resistance should be investigated, and the adhesive failure and cohesive failure mechanisms of asphalt mixtures should be examined. Finally, the effects of other factors such as temperature and loading frequency on the performance of asphalt pavement should be explored.
Author Contributions
Conceptualization, P.C.; methodology, P.C. and N.H.; software, N.H.; validation, P.C. and N.H.; formal analysis, N.H.; investigation, N.H.; resources, N.H.; writing—original draft preparation, N.H.; writing—review and editing, P.C.; visualization, N.H.; supervision, P.C.; project administration, P.C.; funding acquisition, P.C. All authors have read and agreed to the published version of the manuscript.
Funding
This research was funded by NSRF (FRB640085).
Institutional Review Board Statement
Not applicable.
Informed Consent Statement
Not applicable.
Data Availability Statement
Not applicable.
Acknowledgments
Our research, “Optimization of permeability for flexible pavement in Thailand” (contract number RE-KRIS/027/64) by King Mongkut’s Institute of Technology Ladkrabang (KMITL), received funding support from the NSRF (FRB640085). We would like to thank TIPCO Asphalt PCL for providing the asphalt binder for this research. We also appreciate all members in Civil Engineering Department for their support.
Conflicts of Interest
The authors declare no conflict of interest.
References
- Masad, E.; Al-Omari, A.; Lytton, R.; Masad, E.; Lytton, R. Simple Method for Predicting Laboratory and Field Permeability of Hot-Mix Asphalt in Transportation Research Record. J. Transp. Res. Board 2006, 1970, 55–63. [Google Scholar] [CrossRef]
- Kanitpong, K.; Bahia, H.; Russell, J.; Schmitt, R. Predicting Field Permeability from Testing Hot-Mix Asphalt Specimens Produced by Superpave Gyratory Compactor. Transp. Res. Rec. J. Transp. Res. Board 2006, 1929, 52–58. [Google Scholar] [CrossRef]
- Ban, H.; Kim, Y.; Rhee, S. Computational Microstructure Modeling to Estimate Progressive Moisture Damage Behavior of Asphaltic Paving Materials. Int. J. Numer. Anal. Methods Geomech. 2013, 37, 2005–2020. [Google Scholar] [CrossRef]
- Amelian, S.; Abtahi, S.M.; Hejazi, S.M. Moisture Susceptibility Evaluation of Asphalt Mixes Based on Image Analysis. Constr. Build. Mater. 2014, 63, 294–302. [Google Scholar] [CrossRef]
- Khan, R.; Grenfell, J.; Collop, A.; Airey, G.; Gregory, H. Moisture Damage in Asphalt Mixtures using the Modified SATS Test and Image Analysis. Constr. Build. Mater. 2013, 43, 165–173. [Google Scholar] [CrossRef]
- Sefidmazgi, N.R.; Tashman, L.; Bahia, H. Internal Structure Characterization of Asphalt Mixtures for Rutting Performance using Imaging Analysis. Road Mater. Pavement Des. 2012, 13 (Suppl. 1), 21–37. [Google Scholar] [CrossRef]
- Wielinski, J.C. Investigation of Permeable Asphalt Treated Base in Alabama. Master’s Thesis, Auburn University, Auburn, AL, USA, 2007. [Google Scholar]
- Abdullah, W.; Obaidat, M.; Nazem, M. Influence of Aggregate Type and Gradation on Voids of Asphalt Concrete Pavements. J. Mater. Civ. Eng. 1998, 10, 76–85. [Google Scholar] [CrossRef]
- Cooley, L.A., Jr.; Prowell, B.D.; Brown, E.R. Issues Pertaining to the Permeability Characteristics of Coarse-Graded Superpave Mixes; National Center for Asphalt Technology: Auburn, AL, USA, 2002; Volume 13, pp. 433–454. [Google Scholar]
- Tarefder, R.A.; White, L.; Zaman, M. Neural Network Model for Asphalt Concrete Permeability. J. Mater. Civ. Eng. 2005, 17, 19–27. [Google Scholar] [CrossRef]
- Mongkol, K.; Chaturabong, P.; Suwannaplai, A. Effect of Bagasse and Coconut Peat Fillers on Asphalt Mixture Workability. Coatings 2020, 10, 1262. [Google Scholar] [CrossRef]
- Coenen, A.; Kutay, M.E.; Sefidmazgi, N.R.; Bahia, H.U. Aggregate Structure Characterization of Asphalt Mixtures Using 2-Dimensional Image Analysis. Road Mater. Pavement Des. 2011, 13, 433–454. [Google Scholar] [CrossRef]
- ASTM D6926-10; Standard Practice for Preparation of Bituminous Specimens Using Marshall Apparatus. ASTM International: West Conshohocken, PA, USA, 2010.
- ASTM D6927-15; Standard Test Method for Marshall Stability and Flow of Asphalt Mixtures. ASTM International: West Conshohocken, PA, USA, 2015.
- Rachabut, K.; Chaturabong, P. Evaluation of Using Natural Fillers to Improve Moisture Damage Resistance and the Use of Pull-Off Tensile Test in Determining Moisture Damage Resistance in Asphalt Mixture. Appl. Sci. 2020, 10, 4318. [Google Scholar] [CrossRef]
- FM 5-565; Florida Method of Test for Measurement of Water Permeability of Compacted Asphalt Paving Mixtures Designation. Florida Department of Transportation: Tallahassee, FL, USA, 2015.
- Faheem, A.; Bahia, H. Modeling of Asphalt Mastic in Terms of Filler-Bitumen Interaction. J. Road Mater. Pavement Des. 2010, 11, 281–303. [Google Scholar] [CrossRef]


Disclaimer/Publisher’s Note: The statements, opinions and data contained in all publications are solely those of the individual author(s) and contributor(s) and not of MDPI and/or the editor(s). MDPI and/or the editor(s) disclaim responsibility for any injury to people or property resulting from any ideas, methods, instructions or products referred to in the content. |
© 2023 by the authors. Licensee MDPI, Basel, Switzerland. This article is an open access article distributed under the terms and conditions of the Creative Commons Attribution (CC BY) license (https://creativecommons.org/licenses/by/4.0/).