Article

Research of On-Line Monitoring Technology Based on Laser Triangulation for Surface Morphology of Extreme High-Speed Laser Cladding Coating

1
School of Mechanical Engineering, Yanshan University, Qinhuangdao 066004, China
2
Jiangsu Xuzhou Construction Machinery Research Institute Co., Ltd., Xuzhou Construction Machinery Group, Xuzhou 221004, China
3
State Key Laboratory of Intelligent Manufacturing of Advanced Construction Machinery, Xuzhou 221004, China
*
Author to whom correspondence should be addressed.
Coatings 2023, 13(3), 625; https://doi.org/10.3390/coatings13030625
Submission received: 20 February 2023 / Revised: 9 March 2023 / Accepted: 13 March 2023 / Published: 16 March 2023
(This article belongs to the Section Surface Characterization, Deposition and Modification)

Abstract

:
This work aims to develop a novel method for on-line monitoring of coating quality during the Extreme High-speed Laser Cladding (EHLA) process. JG-11 coating was prepared by EHLA, and microstructure, microhardness, corrosion performance, and scratch resistance were investigated. To analyze the influences of fluctuations in processing parameters on coating quality, a single-factor experiment scheme was designed and an on-line monitoring system based on laser triangulation was built. Furthermore, a new forming method for the surface profile of EHLA coating was proposed, and a new comprehensive evaluation index of surface morphology was accordingly designed. Benefitting from the extremely high cooling rate, EHLA JG-11 coating had fine grains, high hardness, and better corrosion resistance and scratch resistance than those of Electroplating Hard Chromium (EHC). The results revealed that the surface morphologies presented different characteristics due to the fluctuations of process parameters, such as high surface flatness, deep pits, small peaks, poor directionality, etc. The comprehensive evaluation index composed of Sa, Ssk, and Str could effectively characterize the surface morphology of EHLA coating, which proved that the monitoring system and evaluation method could realize on-line monitoring of the process parameters during the EHLA process.

1. Introduction

EHLA technology is a new type of surface treatment technology with high efficiency and low cost, which possesses the advantages of low heat input and high surface forming precision and has been widely used in equipment manufacturing industries such as coal mining machinery, automobile industry, and construction machinery [1,2]. As we all know, the digitization and intelligence of the manufacturing process can improve manufacturing efficiency and reduce manufacturing costs [3,4]. In addition, head enterprises in various industries are paying more and more attention to improving the level of intelligence in the manufacturing process to enhance their market competitiveness. Thus, the intelligentization of the melting process will become the development trend of EHLA technology, which has attracted more and more scholars’ attentions.
On-line monitoring of coating quality is a key factor to realize intelligent processing [5]. There are many factors affecting the quality of laser cladding, including the fluctuations of process parameters, the state of the substrate surface, the stability of the laser processing system, the consistency of powders, etc. [6]. However, it is difficult to achieve on-line monitoring of all influencing factors, resulting in the failure to accurately monitor the coating quality. At present, scholars have carried out much research on the on-line monitoring technology of coating quality in the laser cladding process [7,8,9].
Emission spectroscopy is an effective tool for component analysis, and the information of elements in spectral signals can provide a better understanding of physical mechanisms and monitoring processes. Wang et al. [10] achieved on-line monitoring of coating chemical composition during laser cladding by real-time acquisition of the emission spectrum. The relationship model between the elements’ weight ratio and the intensity ratio of spectral lines was built, which indicated that the elements’ weight ratio in the coating was directly affected by the variation of input energy density during processing. Schmidt et al. [11] used a spectrometer to measure the light emission during laser cladding and identify the element lines in the spectrum. The results revealed that the measurement of line or spectral intensity can be used for on-line monitoring of the laser cladding dynamic process. However, the information presented by this kind of method is not intuitive, and the accuracy of test results depends on the effectiveness of data processing and analysis algorithms.
Acoustic sensors have the advantages of non-contact, non-destructive, and flexibility [12], and are very suitable for the monitoring of the laser cladding process. Rieder et al. [13] carried out ultrasonic measurements using a four-channel ultrasonic transmitting and receiving system. The surface dynamics of the laser cladding process can be observed by evaluating the backwall signals. Furthermore, ultrasonic signals can also be used to determine the type of defect and the size of porosity. Shevchik et al. [14] investigated the feasibility of using acoustic emission and machine learning for real-time quality monitoring of laser additive manufacturing processes. The results demonstrated the feasibility of using acoustic emissions with sublayer spatial resolution for in situ quality monitoring. However, such methods are vulnerable to external interference, such as environmental noise and electrical signal of the cladding system. Krauss et al. [15] used an infrared camera to track the solidification process and quality of the cladding layer in selective laser cladding, which could detect variations in coating thickness and residual defects. Nonetheless, this method is mostly used in the research of laser cladding technology, and it cannot accurately evaluate the coating forming quality in the batch manufacturing process.
Visual sensing technology is widely employed in on-line monitoring of the manufacturing process and also widely used in the analysis of the dynamics of the molten pool and the surface morphology of the cladding layer. Asselin et al. [16] designed a trinocular CCD detector for measuring the geometric structure of the cladding layer and developed an algorithm, including a fuzzy adaptive threshold strategy, a perspective image projection method, and an analysis projection image strategy, to achieve real-time extraction of the height, width, and solidification rate of the cladding layer. Zhang et al. [17] proposed an intelligent classification method for quality-level identification of laser cladding processing. The process images were captured using a high-speed camera, and the features of different objects such as melt pools, plumes, and splashes were extracted. Subsequently, the features were used as input for support vector machines and convolutional neural networks. Zhao et al. [18] adopted high-speed synchrotron hard X-ray imaging and diffraction techniques to monitor the laser processing process in real time and found that melt pool dynamics, powder jetting, rapid solidification, and phase transitions can be detected with spatial and temporal resolution. Kanko et al. [19] prepared a 316 L stainless steel coating with a series of process parameters (40–320 W laser power; 50–600 mm/s scan speed; 50–500 µm layer thicknesses) and proposed an on-line monitoring technology for the forming process based on low coherence interference imaging technology. The results showed that the method could capture the geometric contour of the molten pool, and the strong fluctuation of the molten pool affected the trajectory quality. In summary, the above methods can realize the prediction of the forming quality of the cladding layer by monitoring the molten pool geometry. However, owing to the fact that the solidification process of a molten pool is affected by many external factors [20,21], the geometric characteristics of a molten pool cannot directly reflect the forming quality of a cladding layer after solidification.
As we all know, the deposition speed of EHLA is very high, about 20–200 m/min [1,22], and it is usually used to prepare a thin coating on the component surface (≤0.8 mm). In addition, when the process parameters, substrate state, or environmental conditions are abnormal, defects such as pores and cracks may occur inside the cladding layer. Furthermore, small coating thickness is conducive to the rapid movement of internal or shallow surface defects to the coating surface, which eventually form surface defects [23,24]. Based on the above facts, the variations of coating surface morphologies can effectively reflect the fluctuations of process parameters during the EHLA process. Therefore, the on-line monitoring of coating quality and parameter stability in the EHLA process can be realized by evaluating the variation of surface morphologies in real time. However, the data acquisition accuracy of a CCD camera or a CMOS camera is low at high mobile speed. Moreover, the data loss is easily caused by the interference of the manufacturing environment, which cannot meet the requirements of on-line monitoring of surface morphology during the EHLA process.
Laser triangulation technology uses the collimated laser beam emitted by the laser source to project onto the surface of the measured target and then produce a diffused reflection laser beam. Subsequently, the beam passes through the receiving lens and focuses on the photoelectric sensor (such as a CCD, CMOS, etc.) for imaging. As the measured target moves, the light spot imaged on the photoelectric sensor also moves correspondingly. Thus, the position of the measured target can be calculated according to the spot position on the photoelectric sensor [25]. Compared with other displacement sensors, the laser triangulation sensor has the characteristics of non-contact, high accuracy, strong anti-electromagnetic interference [26], and strong adaptability to the industrial production environment.
In this study, a JG-11 martensitic stainless-steel coating was prepared on the surface of 45# steel by EHLA. Subsequently, using a single-factor experiment method, the influences of fluctuations of key process parameters on the forming quality of EHLA JG-11 coatings were studied. Meanwhile, based on the principle of laser triangulation, an on-line monitoring system for the surface morphology of EHLA coating was established and a novel, real-time evaluation method based on 3D roughness parameters was proposed. Furthermore, the accuracy and feasibility of the evaluation system and method for on-line monitoring of surface morphology were discussed. The novelty of the study is that a new surface profile forming method for EHLA coating is proposed, and, accordingly, a set of real-time evaluation methods to realize on-line monitoring of coating quality during the EHLA process is designed. The research results are helpful to realize intelligent processing in the EHLA process, resulting in improving the processing efficiency, and, when the defects are detected, the on-line monitoring system will send an alarm and stop the processing process in time to minimize the losses.

2. Experiment Design

2.1. Experiment Equipment and Materials

The experiments were carried out by an EHLA system (EHLA-Compact, ACUNITY, TianJin, China), as presented in Figure 1, which integrated a laser device, a vertical turntable, a horizontal turntable, a laser deposition head, and a powder feeder. A semiconductor laser device (LDM-6000, Laserline GmbH, Mülheim-Kärlich, Germany) with a wavelength of 900–1080 nm was employed in the experiments, with a maximum output laser power of 6 kW. The system was equipped with vertical and horizontal turntables, which could realize the coating preparations on the plane and cylindrical surfaces of samples. The diameter of the laser spot was φ2 mm, and a high-speed coaxial annular powder feeding nozzle (HINO50-W, Fraunhofer ILT, Aachen, Germany), with the maximum diameter of the powder converging spot being φ1.5 mm, was employed. For powder feeding, a double-cylinder synchronous powder feeder (Infi-Pro-C, ACUNITY, Tianjin, China) with argon as the carrier gas was used, which was suitable for conveying powders with a particle size of 20–100 μm.
The flat samples with a size of φ 100 × 30 × 20 mm3 (outer diameter × inner diameter × thickness) and the shaft samples with a size of φ 50 × 300 mm2 (outer diameter × length) were selected as substrates, and the material of both types of samples was 45# steel. Before EHLA, the dirt such as rust or residual cutting fluid on the surface to be clad was removed by an automatic sand belt polishing machine and cleaned with absolute ethanol. A martensitic stainless-steel powder, named JG-11, with a particle size of 25–53 μm was used, whose microscopic morphology is shown in Figure 2. Before cladding, the powder was dried in a dryer at a temperature of 120 °C for 60 min. The main chemical compositions of the substrate and powder are shown in Table 1.

2.2. Experiment Design

As listed in Table 2, with hardness, corrosion resistance, and scratch resistance as evaluation indicators, the key EHLA process parameters of JG-11 coating were optimized based on the above-mentioned EHLA system. In addition, to conduct a performance comparison analysis, an EHC coating with a thickness of 0.05 mm was prepared on the surface of a 45# steel flat sample.
Due to the external interference factors, the actual output values of process parameters fluctuate in the batch processing of EHLA. In order to simulate the fluctuations of process parameters, an experiment scheme, shown in Table 3, was designed by using a single-factor test method based on the optimal process parameters listed in Table 2. The four key process parameters of laser power, deposition speed, powder feeding speed, and overlapping rate were selected as influencing factors, and each factor includes eight different levels. Based on the experiment scheme, the coatings were prepared on the surface of shaft samples using a horizontal turntable. As displayed in Figure 1, the cladding process started from the clamping side of the samples, and four coating segments with a length L of 60 mm were spaced regularly, about 5–10 mm apart.

2.3. Test Methods

2.3.1. Microstructure and Hardness Test

The JG-11 cladding layer was prepared on the surface of a flat sample using the EHLA process parameters listed in Table 2. After the cladding process, the coating sample was cut to a size of 10 × 10 × 5 mm3 using the wire cutting method. Subsequently, standard metallography measures were employed to fabricate samples for microstructure analysis. After being corroded with aqua regia solution (HCl: HNO3 = 3:1, v/v), an optical microscope (DMI5000M, Leica, München, Germany) was used to characterize the cross-section surfaces. Additionally, the microhardness of the longitudinal section of the coating sample was measured by using a micro-Vickers hardness tester (model 5104, Buehler Co., Ltd., Sacramento, CA, USA). Measuring points were taken every 0.1 mm along the direction parallel to the bonding interface between coating and substrate. The load was 100 gf, and the dwell time was 15 s.

2.3.2. Electrochemical Corrosion Test

The electrochemical corrosion test was conducted in an electrochemical system (CS350, Coster, Wuhan, China) with a common three-electrode cell in 3.5 wt% NaCl aqueous solution at ambient temperature (25 °C). The working electrodes were experimental EHLA shaft samples and EHC shaft samples with an exposed area of 48 cm2. A saturated calomel electrode and a platinum sheet electrode were used as reference and counter electrodes, respectively. All specimens were immersed in the solution until the open circuit corrosion potential reached a balance. The potentiodynamic polarization curves were tested in the range of −0.8 to 0.8 V under a fixed scan rate of 10 mV/s. ZVIEW software (ZVIEW 3.1) was used to analyze the experimental data.

2.3.3. Scratch Test

The EHLA JG-11 coating sample and EHC sample were cut to 10 × 10 × 10 mm3 by wire cutting and successively polished with 400#, 800#, 1200#, and 2000# sandpaper. Subsequently, the scratch tests were carried out by using a scratch tester (RST3, Anton Paar GmbH, Graz, Austria) equipped with an indentation head with a maximum load of 200 N, a load resolution of 0.1 mN, and a depth resolution of 0.05 nm. A diamond indenter with a cone angle of 120 degrees and a tip radius of 0.2 mm was used. The other test parameters were as follows: the scratch speed was 3 mm/min, the loading speed was 100 N/min, the scratch length was 5 mm, and the positive pressure was 180 N. Each coating sample was tested three times, and the end of each residual scratch groove was observed with a scanning electron microscope (TESCAN MIRA, TESCAN, Brno-Kohoutovice, Czech Republic) to obtain the maximum values of width, depth, and volume of scratch grooves. Finally, the average of the above test values was taken as the scratch resistance of each coating.

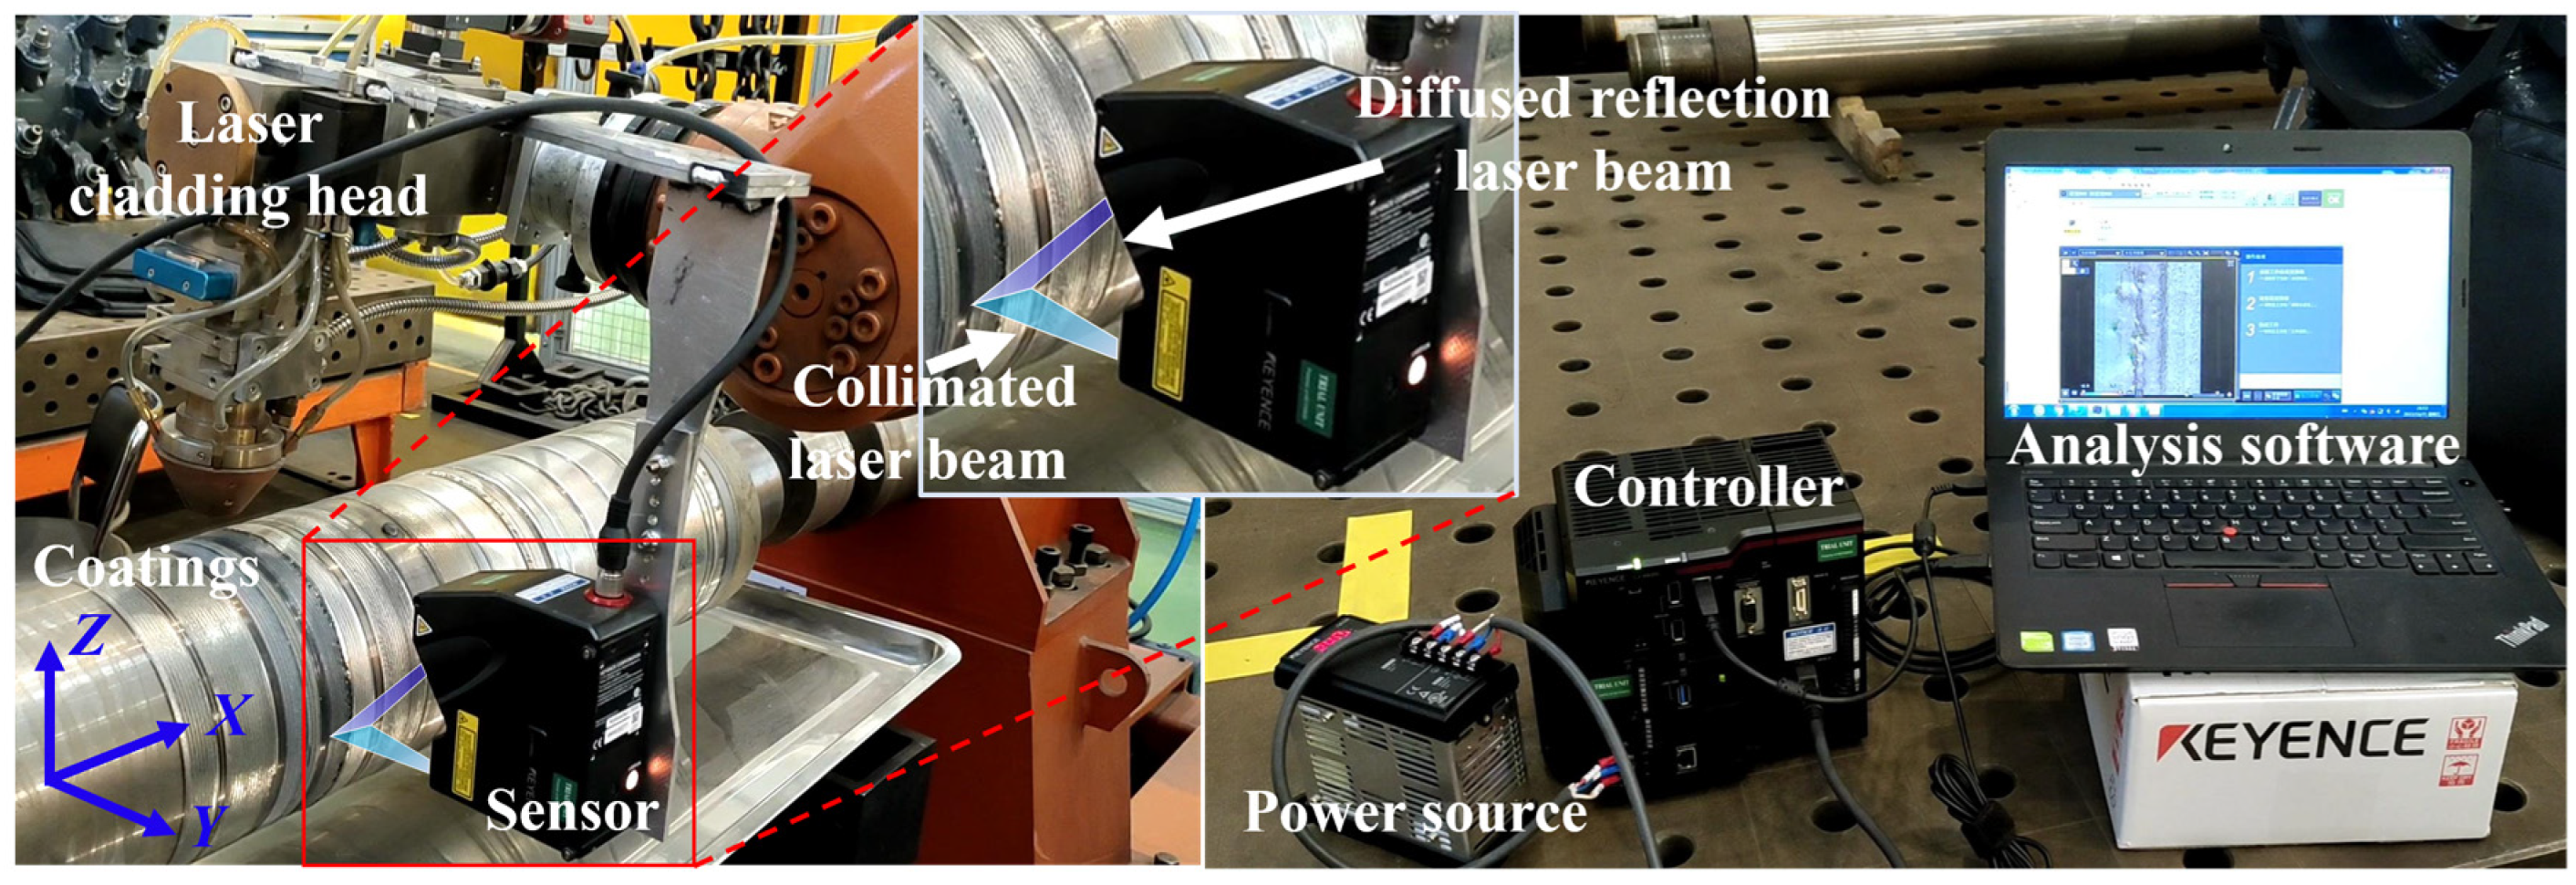
2.3.4. On-Line Monitoring System

As shown in Figure 3, the self-developed on-line monitoring system for surface morphology of EHLA coating mainly included a measurement sensor (LJ-X8060, Kearns, Osaka, Japan), a controller (LJ-X8000A, Kearns, Osaka, Japan), a power supplier (CA-U4, Kearns, Osaka, Japan), and a self-developed analysis software for parameter evaluation. Using a special clamping device, the sensor was fixed on the laser deposition head, which enabled the positions in the X, Y, and Z directions to be adjusted arbitrarily. Furthermore, the relative positions of sensor, deposition head, and component to be clad during the test are displayed in Figure 4. The component rotated clockwise under the drive of a turntable, and the deposition head and the sensor were respectively placed on the top and right side of the component, which was beneficial to shorten the time interval between the solidification and the detection of EHLA coating. The working process of the system is as follows: (1) Clamp the sensor on the deposition head and connect the functional modules of the system. (2) Adjust the position of the sensor according to the size of the measured object, turn on the system power, and start the test analysis software. (3) Start the EHLA system, then the sensor collects the spatial coordinate values of each point on the coating surface in real time, and the analysis software automatically reads the detection data and analyzes the characteristic parameters of the surface morphology. Meanwhile, the threshold values of each characteristic parameter are also set in the analysis software. (4) In the measurement process, the on-line monitoring system can compare the real-time detection results of each characteristic parameter with the threshold values, and then it judges whether there is a defect. Once the system determines that a defect has occurred, it will send an alarm and stop the cladding process.
The on-line monitoring system employed in this study was based on the principle of direct laser triangulation, as presented in Figure 5. First of all, the laser was diffused by a cylindrical objective lens into a line laser and projected on the EHLA coating surface. It should be noted that the line laser was parallel to the normal direction of the surface of the measured region. Subsequently, the line laser was diffusely reflected on the coating surface and imaged on a high-precision CMOS image sensor to form a 2D line profile [27,28]. It can be observed from the geometric relationship in the figure that ΔAOB and ΔA′OB′ are similar, and the following relationship can be obtained from the triangle similarity theorem.
B O ¯ A B ¯ = B O ¯ A B ¯
Furthermore, the following relationship can be calculated based on the trigonometric function relationship.
A B ¯ = z s i n α
A B ¯ = h s i n β
B O ¯ = L z c o s α
B O ¯ = l + h c o s β
Subsequently, substituting Relationships (2)–(5) into Relationship (1), the following relationship can be obtained.
L z c o s α z s i n α = l + h c o s β h s i n β
Through further calculation, the relationship between the height z and the displacement h of the imaging spot can be obtained.
z = L h s i n β l s i n α + h s i n α + β
In Expression (7), the optical structure parameters L, l, α, and β are constants in actual applications, and the imaging spot displacement h can be calculated by the measurement system. Therefore, the height z of all points on the coating surface can be calculated.
The maximum sampling frequency f of the system can reach 16 kHz. The measurement ranges of the system in the X and Z directions are inversely proportional to the sampling frequency. For example, when the sampling frequency f is 1 kHz, the measurement ranges in the X direction and Z direction are 16 mm and 14.6 mm, respectively. In addition, each 2D high-resolution profile in the X direction contains 3200 data points, that is, the distance between 2 adjacent points of the profile in the X direction is 0.5 μm. Therefore, the X coordinate value of the Nth point can be obtained.
X N = 0.5 N 1
The analysis software of the on-line monitoring system can fit a series of 2D line profiles into 3D surface profiles. The calculation formula of the distance Y′ between two adjacent 2D line profiles in the Y direction is as follows.
Y = V 1 1 / f  
where V1 is the moving speed of any point on the coating in the EHLA process. Assuming that the Y coordinate value of the point on the first 2D line profile is 0, it can be deduced that the Y coordinate value of the points of the Mth 2D line profiles is as follows.
Y = Y M 1 = V 1 1 / f M 1
Therefore, the analysis software can calculate the X, Y, and Z coordinate values of any point on the coating surface and further analyze the characteristic parameters of the surface morphology.

3. Design of Evaluation Method for Surface Morphology of EHLA Coating

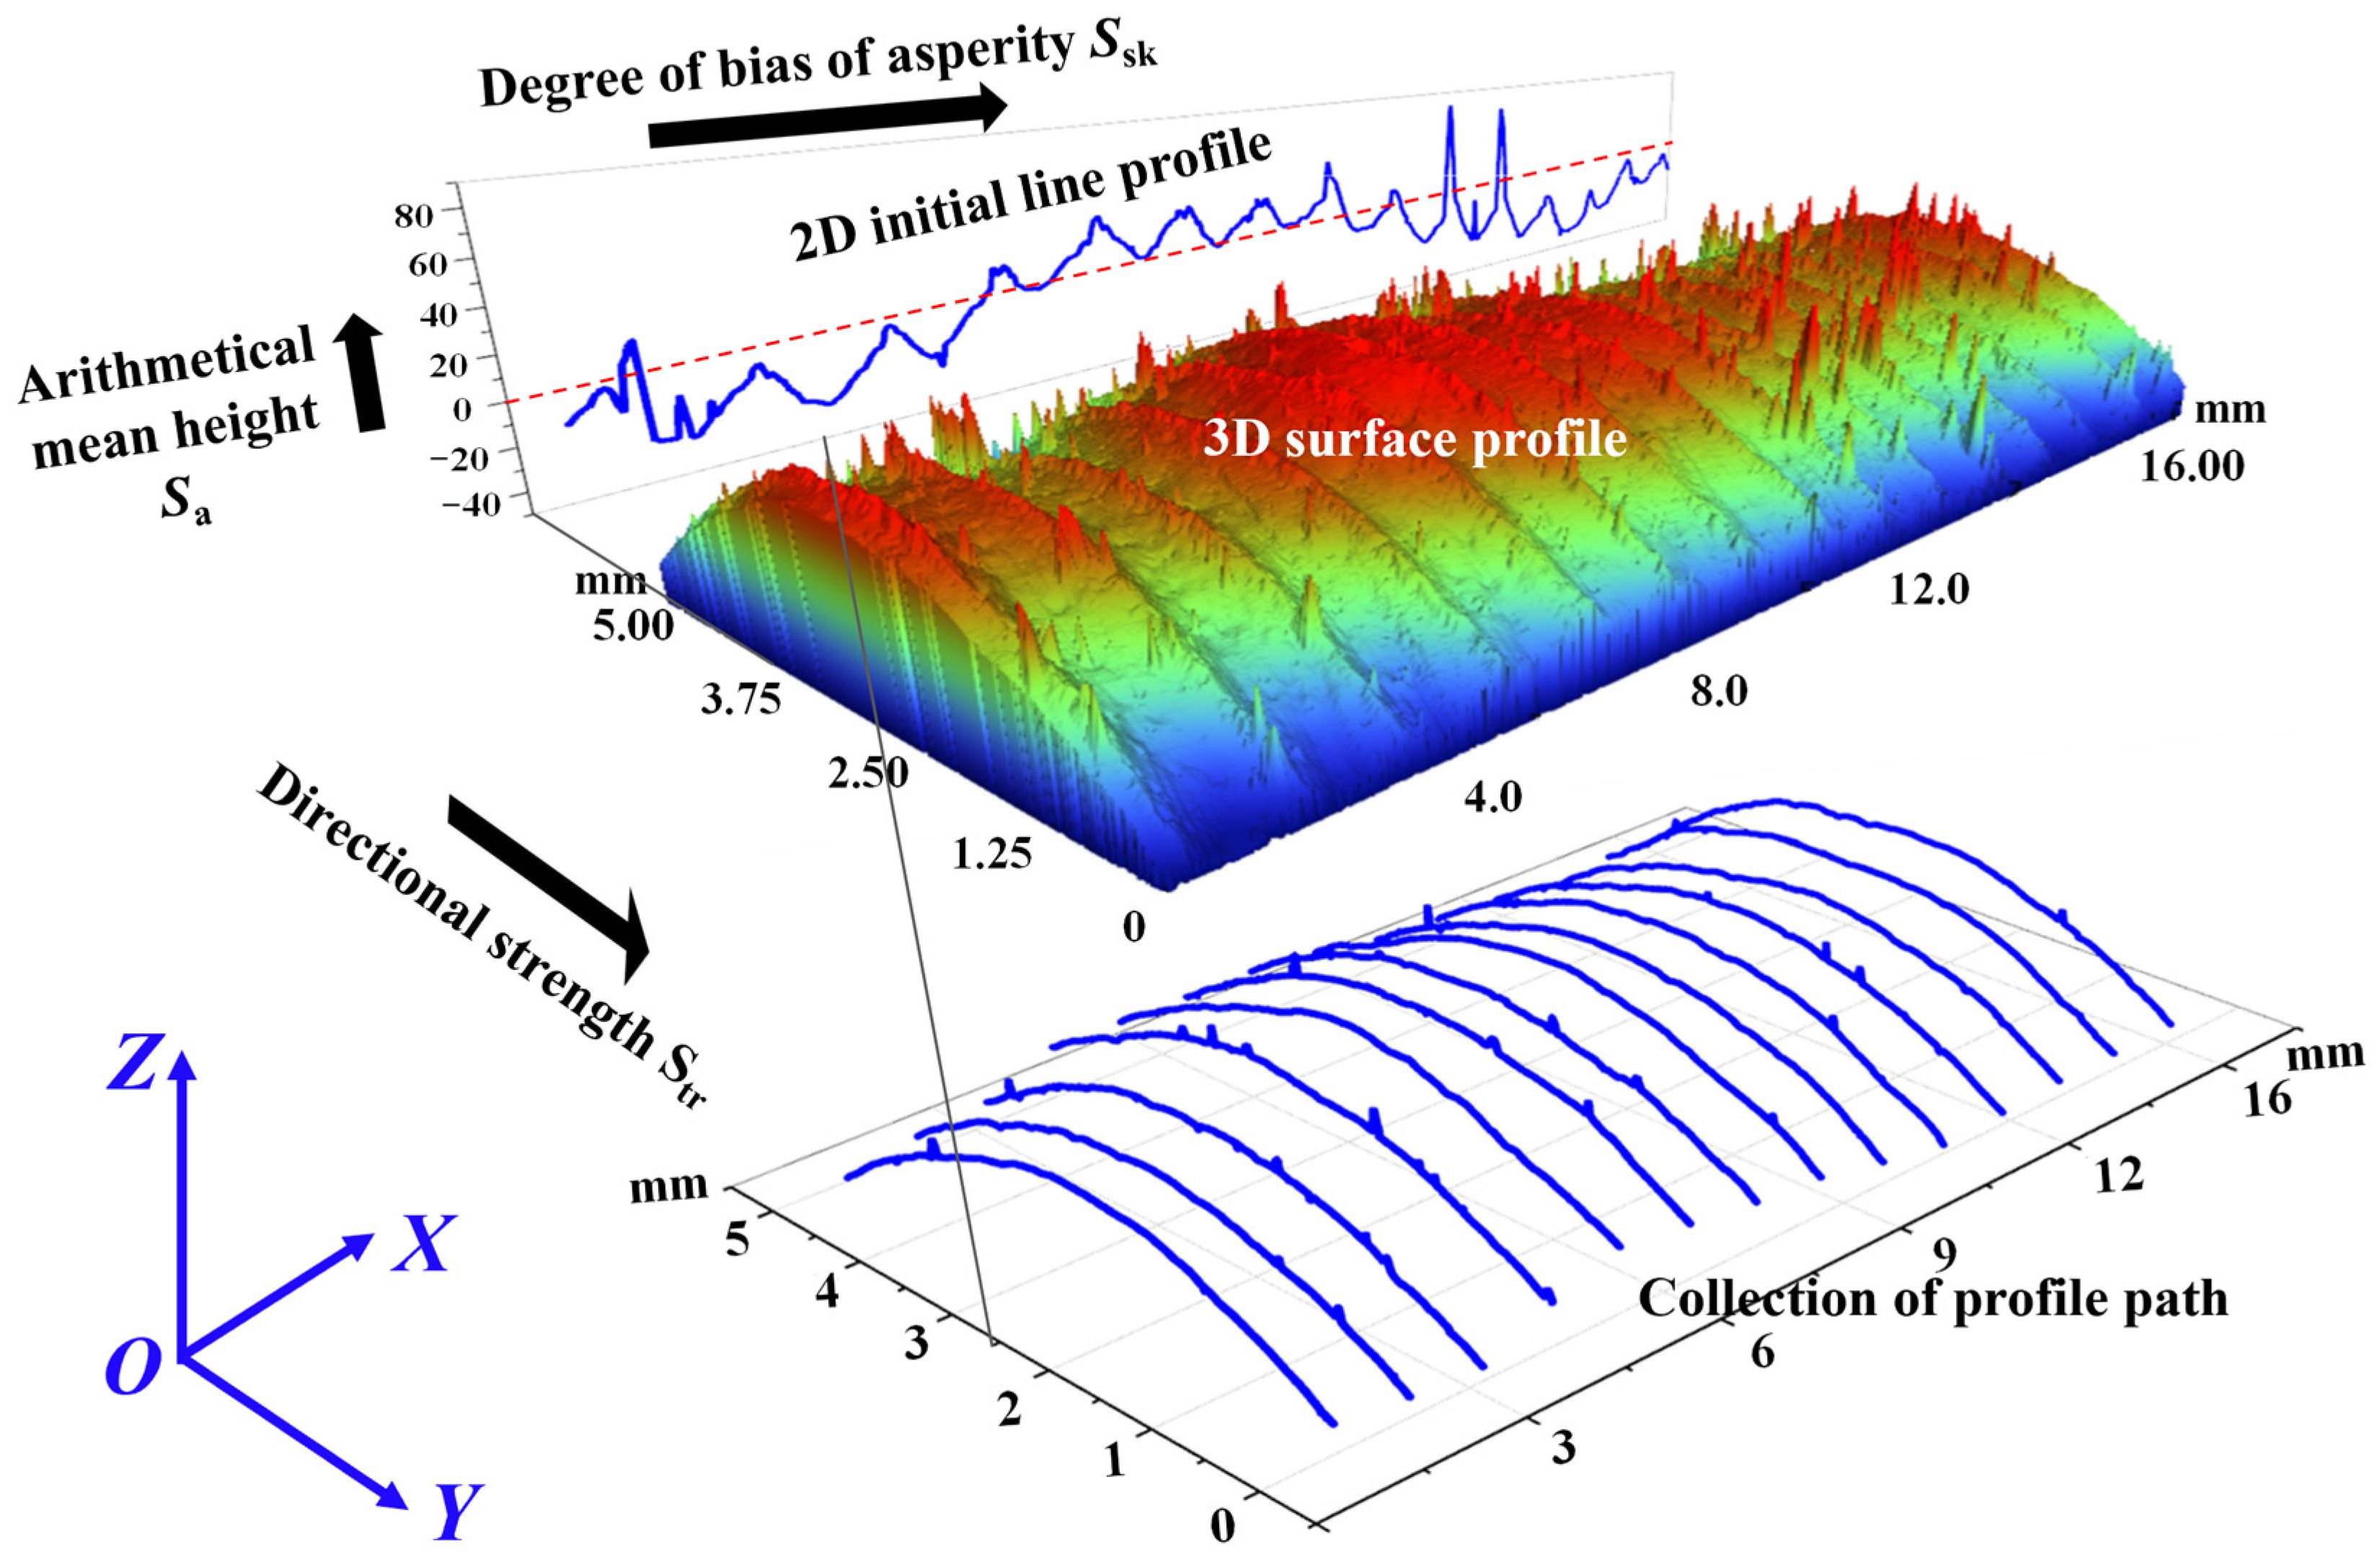
3.1. Design of Equivalent Forming Method of Surface Profile

As we all know, during the EHLA process, the coating on the component surface is formed by overlapping many single cladding layers. By adjusting the laser power, deposition speed, or powder feeding speed, single cladding layers with different widths and heights can be obtained [29]. Meanwhile, the overlapping rate between two adjacent cladding layers directly affects the surface morphology of the EHLA coating. However, when the self-built on-line monitoring system is used to detect an EHLA coating, the sensor emits a line laser to the coating surface to measure a 2D line profile of a certain XOZ section. Meanwhile, relative movement occurs between the sensor and the surface of measured component in the Y direction. As a result, a series of 2D line profiles is collected, and the analysis software subsequently fits all the 2D line profiles along the Y direction to forms a 3D surface profile of the EHLA coating.
Based on the above two surface profile forming processes, a novel equivalent forming method for the surface profile of EHLA coating is proposed in this study, that is, the 3D surface profile of EHLA coating is formed by an initial 2D line profile in the XOZ section moving along a series of paths in the Y direction. As shown in Figure 6, the projection range of a 3D surface profile of a certain section of EHLA coating on the XOY section is 16 × 5 mm2. Assuming the 2D line profile in the XOZ section at Y = 0 mm is the initial line profile, its function can be expressed as follows.
Z = f 0 x
Furthermore, the initial 2D line profile is fitted by N points on the EHLA coating surface, and the coordinates of the ith point on the curve are (xi, 0, f0(xi)), i = 1, 2, 3, …, N. Each point in the initial 2D line profile can move along its own path curve in the Y direction. In other words, there are N path curves, and the function of the jth path curve can be described as Relationship (12).
Z = f j y ,   j = 1 , 2 , 3 N
When the surfaces of flat samples and shaft samples are clad, the path curves are approximated as straight lines and circular arcs, respectively. All the path curves form a path collection. In conclusion, according to the equivalent forming method for the surface profile, each point in the initial 2D line profile moves along its own path and, finally, forms the 3D surface profile of EHLA coating.

3.2. Design of Evaluation Method for Surface Morphology

As we all know, in the process of EHLA, both the component to be cladded and the deposition head move at a constant speed. Therefore, the macro-morphology of the surface of EHLA coating formed with stable process parameters exhibited strong directivity (Figure 7a). However, when the process parameters fluctuated, the shape of the molten pool and the solidification process were inconsistent, leading to the formation of an irregular cladding layer, which ultimately results in poor directivity of the macro-morphology, as given in Figure 7b. In addition, based on the equivalent forming method for surface profile proposed in this study, it could be found that surface morphology characteristics mainly depended on the characteristics of the initial 2D line profile and path curves. As seen from Figure 6, frequently alternating peaks and valleys were distributed in the initial 2D line profile, whose overall characteristics were comprehensively determined by the height difference between peaks and valleys along the Z direction, and the distribution characteristics of peaks and valleys along the X direction.
Based on the above analysis, an evaluation method for surface morphology with 3D roughness parameters Sa, Ssk, and Str as evaluation indexes was proposed. According to ISO 25178-2:2012, the definition and calculation formula of the three parameters are as follows.
Sa, which expands the line roughness parameter Ra three dimensionally, represents the arithmetic mean of the absolute coordinate Z(x, y) in a defined area. The calculation formula is shown in Equation (13).
S a = 1 A 0 A Z x , y d x d y
where A is the area of the evaluation region and Z(x, y) is the function of the surface profile curve. The value of Sa is proportional to the height difference of each point on the coating surface relative to the reference surface.
Ssk, which expands the line roughness parameter Rsk three dimensionally, is used to evaluate deviations in the height distribution. The calculation formula is exhibited in Equation (14).
S s k = 1 S q 3 1 A 0 A z 3 x , y d x d y
where Sq represents the root mean square for Z(x, y) within the evaluation area A. Ssk < 0 means that the height distribution is skewed above the reference plane. The surface morphology represented by Ssk < 0 is shown in Figure 8a, where it is distributed with many pitting defects. Ssk = 0 represents that the height distribution of peaks and pits is symmetrical around the reference plane. As seen in Figure 8b, the coating surface is relatively flat and without obvious defects. Ssk > 0 means that height distribution is skewed below the reference plane. Figure 8c displays the coating surface morphology fabricated under normal process conditions, on which the overlapping area of the two adjacent coatings presents a convex feature, and the variation range of Ssk is about 0.2–0.5. In addition, Figure 8d shows the surface morphology of the coating after bonding semi-melted powders in the local area, which further aggravates the bulge height, with Ssk ≥ 0.5.
Str is a measure of uniformity of the surface texture. The value is obtained by dividing the horizontal distance in the direction in which the auto-correlation function decays to the value s (0.2 by default) the fastest by the horizontal distance in the direction of the slowest decay of the auto-correlation function to the value s. Str can be used to indicate the isotropy or anisotropy of the surface morphology. The calculation formula is as follows.
S t r = R m i n R m a x
where R m i n = τ x 2 + τ y 2 τ x , τ y R m i n , R m a x = τ x 2 + τ y 2 τ x , τ y R m a x , and R = τ x , τ y : A C F τ x , τ y 0.2 . The measured value of Str is generally between 0 and 1. Figure 9a gives the surface morphology when Str is approximately 0, which is anisotropic and has strong directivity as a whole. However, when Str is approximately 1, the surface morphology is exhibited in Figure 9b, which shows, overall, isotropy and poor directivity.
In this study, the self-built online monitoring system was used to collect the surface morphology of EHLA coating in real time. The evaluation software automatically read the detection data of the sensor in the last 1 s at a fixed time interval of 5 s. Five groups of detection data were read respectively to calculate the values of Sa, Ssk, and Str of the surface morphology of EHLA coating prepared with each group of process parameters. Then, the average value of the above test data is taken as the final evaluation result of the surface morphology of EHLA coating.

4. Results and Discussion

4.1. Performance Test Results

4.1.1. Microstructure

Figure 10 illustrates the metallographic structure of EHLA JG-11 coating prepared by using the process parameters listed in Table 2. Due to the low heat input, high deposition speed, and fast cooling speed of EHLA coating, the microstructure was fine and uniform overall [30]. As displayed in Figure 10a, the thickness H was about 0.5 mm and the distance L between the centers of two adjacent cladding layers was about 450 μm. The positions I, II, and III represented the coating–substrate interface bonding area, the overlapping area inside the coating, and the near-surface layer. The metallographic structures of the above regions were respectively shown in Figure 10b–d. To begin with, the microstructure of the coating–substrate interface grew in the form of a plane crystal, and the microstructure near the interface was coarse dendritic. Since the heat dissipation direction of the coating was perpendicular to the interface in the cooling process, the growth direction of the microstructure tended to be perpendicular to the bottom or matrix interface [31]. Secondly, due to the accumulation of heat in the middle of the coating, the heat dissipation gradually slowed down. As a result, the grains formed a dendritic structure with an obvious consistent growth direction along the heat dissipation direction, which exhibited a characteristic of continuous epitaxial growth [30]. In addition, the upper part of the molten pool at the coating surface was directly in contact with the atmospheric environment, where the heat dissipation was faster and the cooling rate was higher. Therefore, the microstructure of the coating surface was fine and uniform dendrites, and the dendrite growth direction was consistent [32].

4.1.2. Microhardness

The microhardness of eight different positions of EHLA coating was measured along the direction of the interface between the coating and substrate. As demonstrated in Figure 11, the average microhardness of EHLA JG-11 coating was 653 ± 56 HV, and the hardness distribution of the coating at different positions was uniform, which indicated that microstructure and element distribution of EHLA JG-11 coating were consistent. By contrast, the average microhardness of EHC was 782 ± 43 HV, which fluctuated slightly and was higher than that of EHLA JG-11 coating. However, the microhardness values of the two coatings were significantly greater than that of the substrate material (262 ± 16 HV).

4.1.3. Corrosion Resistance

Figure 12 shows the potentiodynamic polarization curves of EHLA JG-11 coating and EHC. When the applied potential exceeded the corrosion potential, the corrosion reaction on the surfaces of the two coatings was accelerated and the corrosion current density was increased. As the potential continued to rise, the surface of JG-11 coating entered a passive state. At that moment, the passive film on the coating surface played a protective role and prevented the activation and dissolution of the coating, which led to the stabilization of the current density [30,33]. Nevertheless, due to the formation of a corrosion medium infiltration channel through the micro-cracks in EHC, the corrosion medium could directly react with the substrate, which resulted in the continuous increase of corrosion current density with the increase of corrosion potential [34]. Table 4 displays the self-corrosion current (Icorr) and self-corrosion potential (Ecorr) of the two coatings calculated by the Tafel extrapolation method. It could be found that the self-corrosion current of EHLA JG-11 coating was one order of magnitude lower than that of EHC, and the self-corrosion potential was also significantly increased, which further proved that the corrosion performance of EHLA JG-11 coating was significantly better than that of EHC.

4.1.4. Scratch Tests

Table 5 lists the scratch test results in the form of the depth, width, and volume of residual scratch grooves. It can be observed that the maximum values of the depth, width, and volume of the residual scratch grooves on the surface of EHLA JG-11 coating were significantly smaller than those of EHC. In conclusion, the scratch resistance of EHLA JG-11 coating was better than that of EHC, which was contrary to microhardness test results. Furthermore, the micro-morphologies of the scratch grooves were both observed. As seen from Figure 13a, the surface of the groove formed on EHLA JG-11 coating was smoother after the scratch test, and no defects such as cracks and pits were found. The material on both sides of the groove showed obvious plastic deformation and bulged to form ridges. Nevertheless, there were many micro-cracks on the surface of the EHC scratch groove, and the layer peeled off in some regions (Figure 13b). Both sides of the groove also formed bulges, indicating that plastic deformation had also occurred. According to Greenwood and Williamson’s theory [35], the plastic flow of materials is proportional to the ratio of elastic modulus (E) to hardness (H). Considering the E values found in the literature [36], EHC exhibits the lowest value of E/H, and the substrate shows the highest. Therefore, E/H values from small to large are EHC, EHLA JG-11 coating, and substrate. In the scratch test, EHLA JG-11 coating had a small E/H, exhibiting a high resistance to plastic deformation and a strong scratch resistance. Similarly, EHC also possessed a minimum E/H and showed an excellent resistance to scratches, which was also proved by the test results according to ASTM G65 [37]. However, due to the small thickness of EHC, the positive pressure in the scratch test was mainly borne by the substrate. In addition, owing to the maximum E/H of the substrate, the large plastic deformation of the substrate occurred and finally formed a scratch groove with a large depth, width, and volume. Meanwhile, the bonding strength between EHC and the substrate was poor, and the coating had high hardness and brittleness, which eventually resulted in the cracking or peeling off of EHC.

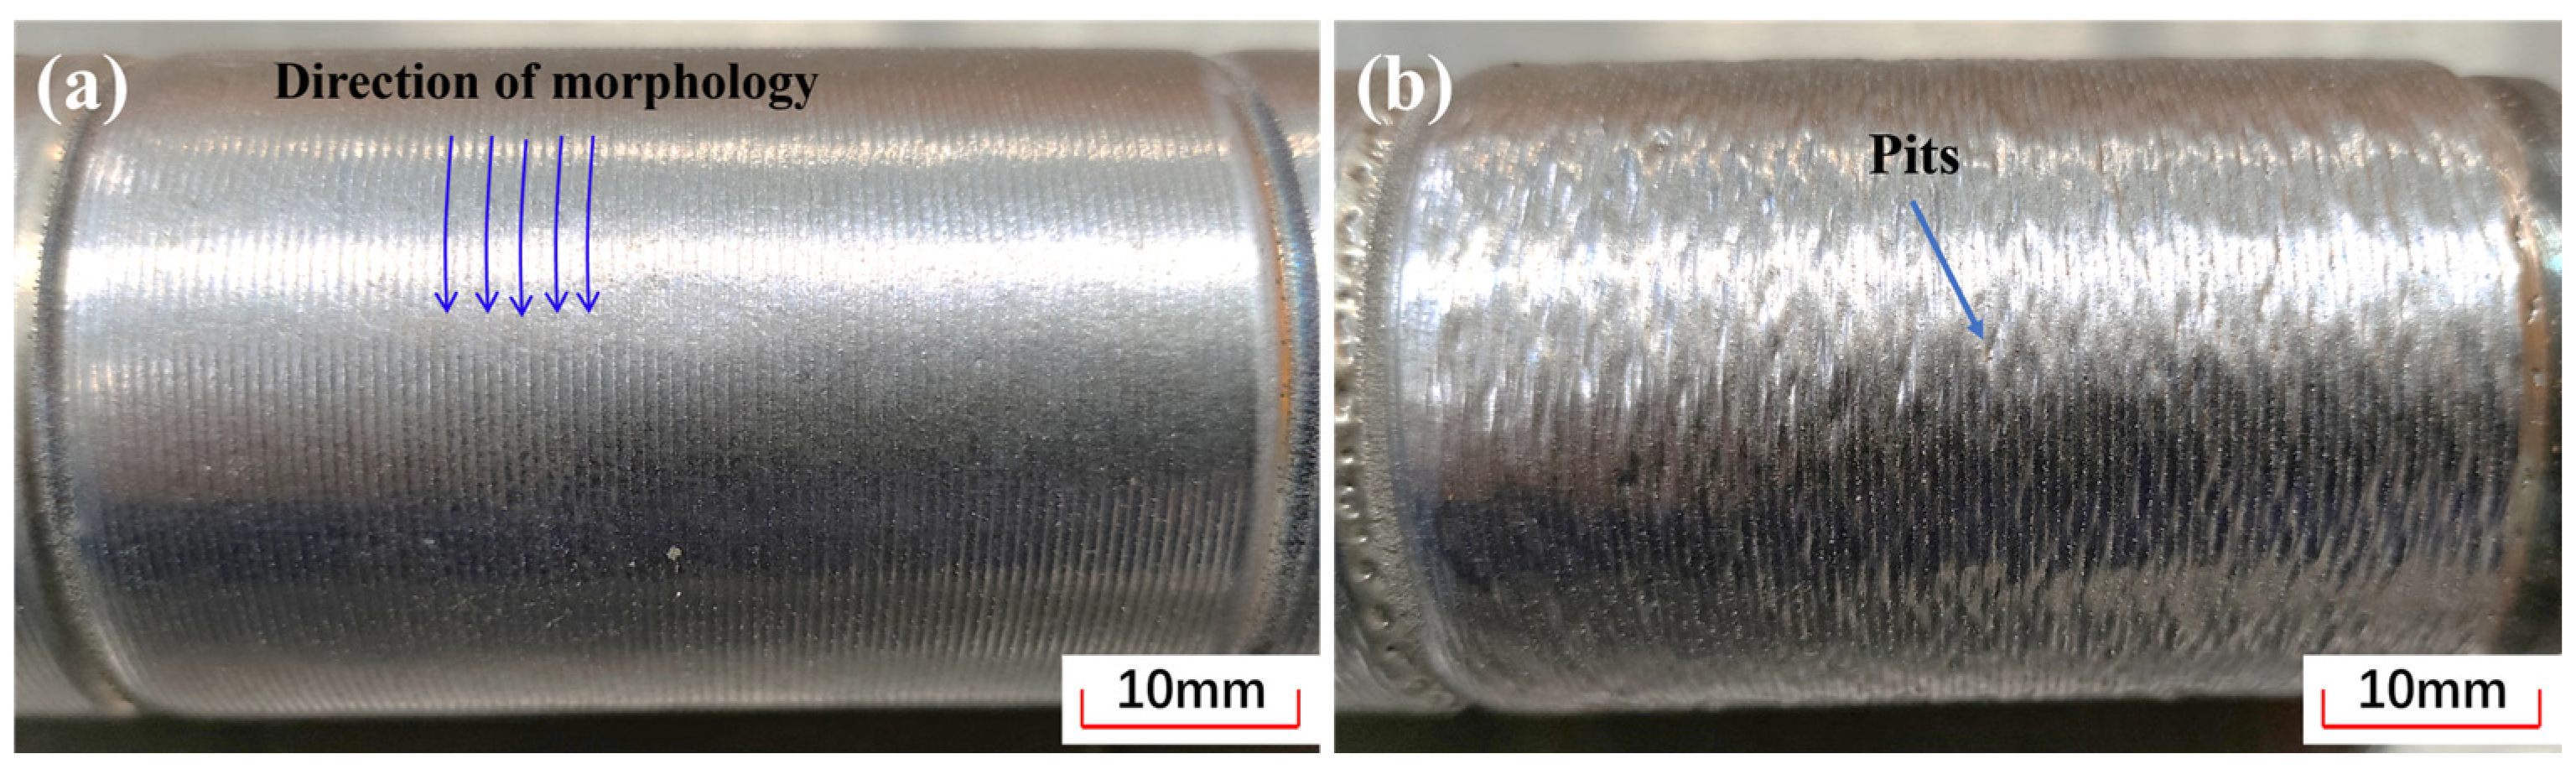
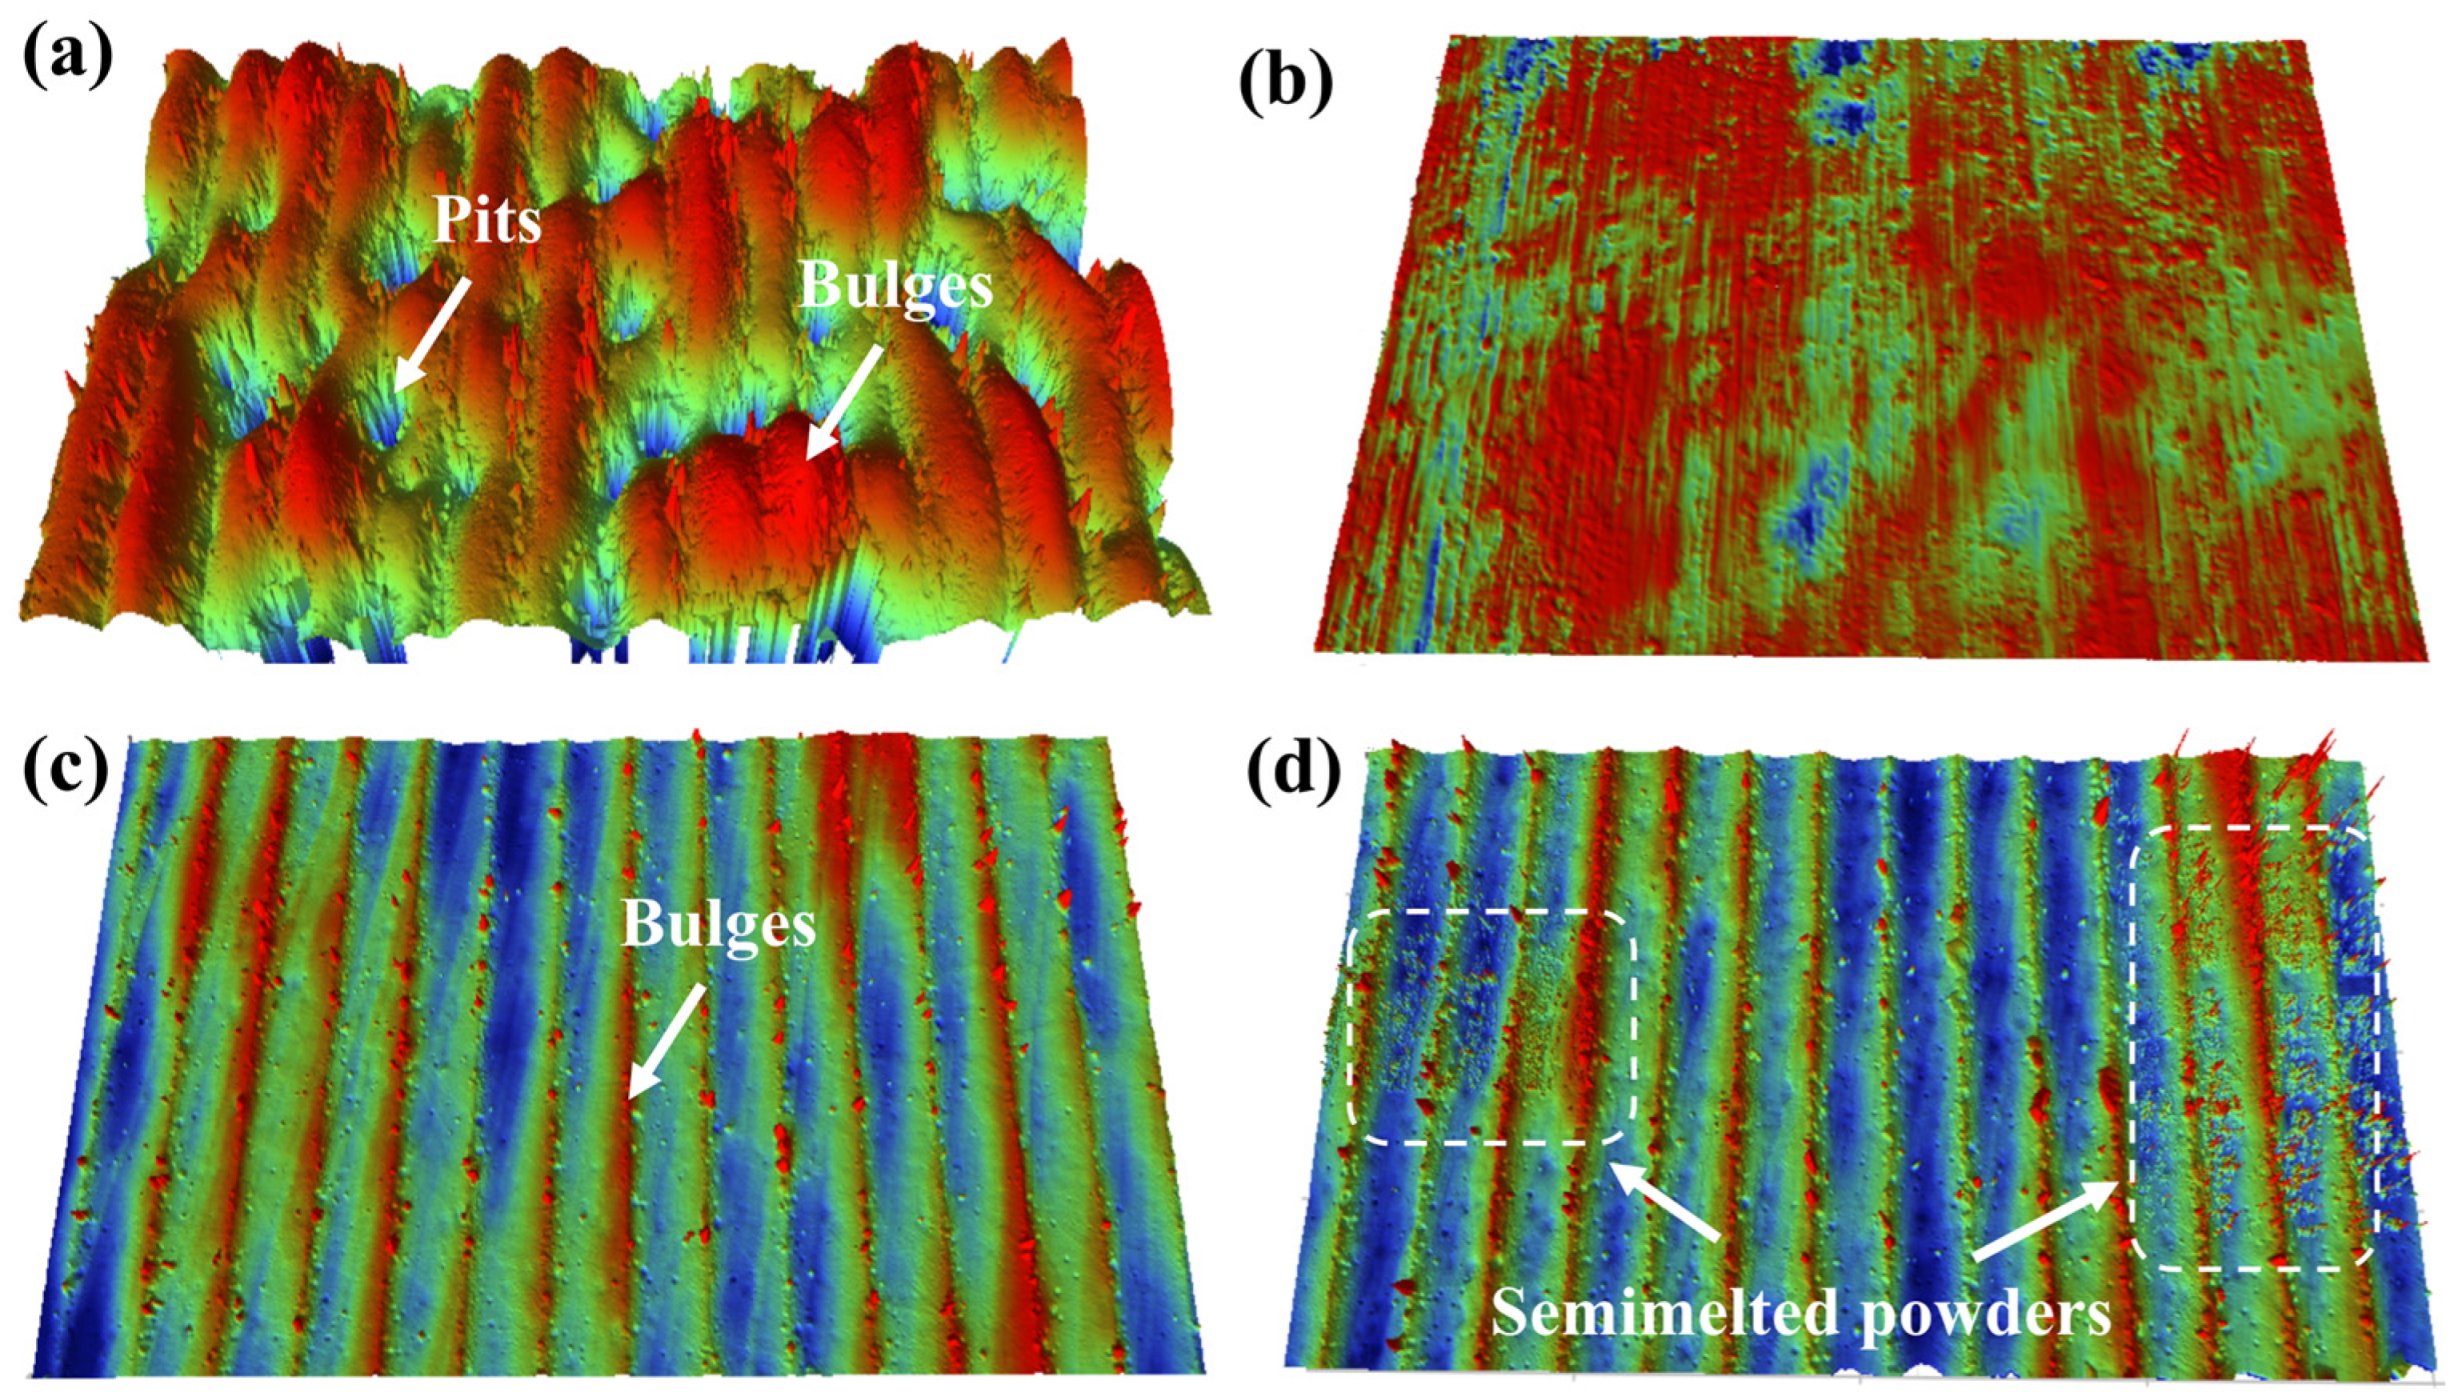
4.2. Analysis of the Influence of Process Parameters on Surface Morphology

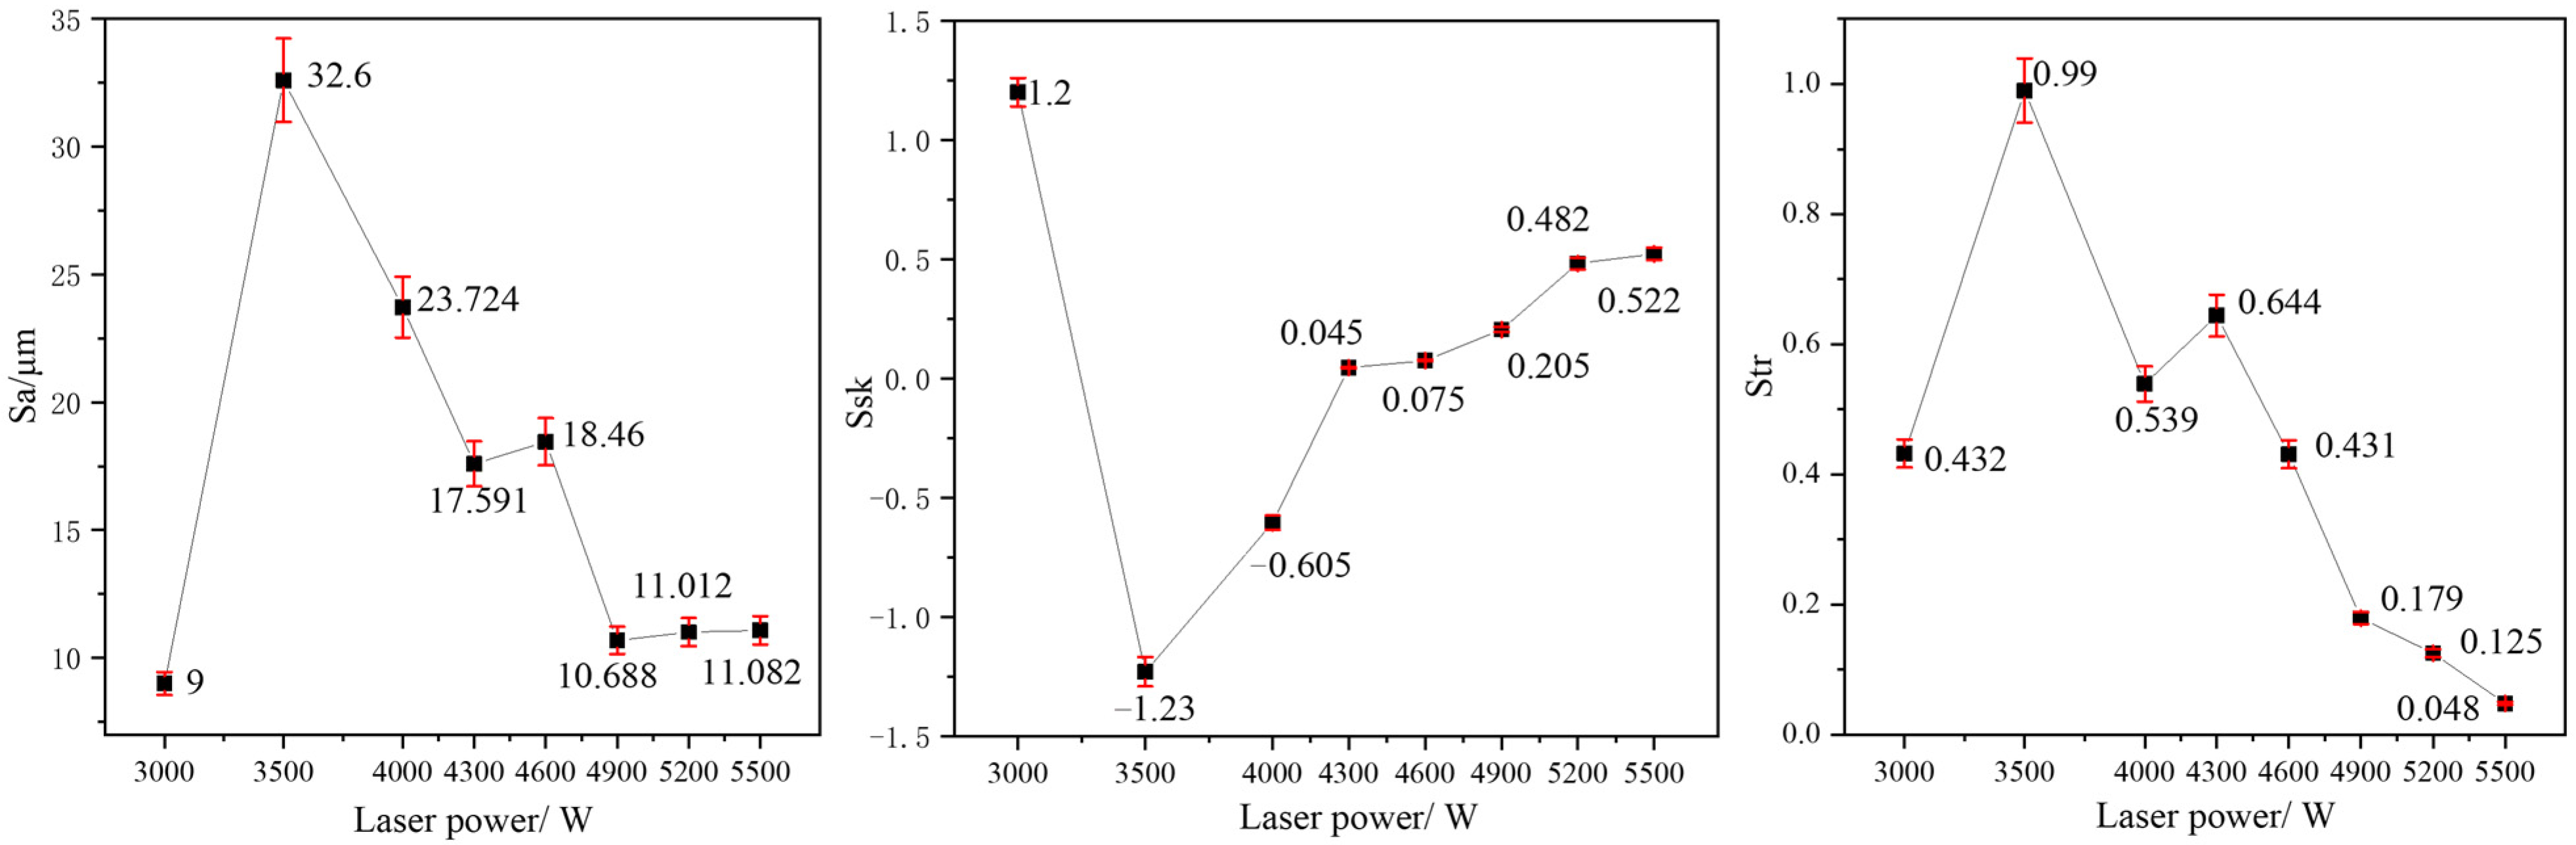
4.2.1. Influence of Laser Power

As we all know, during the EHLA process, a part of the laser energy is absorbed by the powder and the rest is radiated to the substrate surface and then absorbed or reflected by the substrate [38,39]. Figure 14 shows the macro-morphologies of EHLA coatings prepared with different laser powers. When the laser power was 3000 W, the low energy density resulted in the attachment of semi-molten powders on partial regions of the substrate surface. With the increase of laser power to 3500 W, the volume of materials deposited on the substrate surface increased, but the cladding layer was still incomplete. However, the integrity of EHLA coating had been significantly improved, and the forming quality had been continuously improved by increasing the laser power. The reason may be that the increase of laser power can raise the temperature of the molten pool and reduce the cooling rate of the molten pool, resulting in the formation of a large temperature gradient in the molten pool. Subsequently, the large temperature gradient was conducive to form a strong Marangoni flow [40], which ultimately formed a flat and smooth cladding layer.
The macro-morphologies of samples indicated that the fluctuations of laser powers had a significant influence on surface morphology of EHLA coating. Figure 15 shows the variation of Sa, Ssk, and Str of EHLA coating under different laser powers. The excessively low laser power resulted in the attachment of semi-melted powders, leading to the formation of convex characteristics (Figure 14a), with Ssk up to 1.2. However, Sa and Str were both small due to the small bulge height and no obvious directionality. With the increase of laser power, the surface morphology was characterized by pits (Figure 14b–e), and the pit depth gradually decreased, resulting in a gradual decrease of Sa and a gradual increase of Ssk. Meanwhile, the surface morphology was isotropic, but the directionality gradually increased. As a result, the measured value of Str gradually decreased. With the further increase of laser power, the surface morphology became flatter (Figure 14f–h). The main influencing factors of the surface morphologies were the bonded semi-melted powders and the bulges in the overlapping areas. Moreover, the increase of laser power led to more semi-melted powders bonding on the coating surface [41], which resulted in the growth of Sa and Ssk. Nevertheless, the direction of surface morphology was strong, thus Str decreased obviously. Based on the above analysis, it can be concluded that Sa, Ssk, and Str can effectively reflect the variations of the surface morphology caused by the fluctuations of laser power.

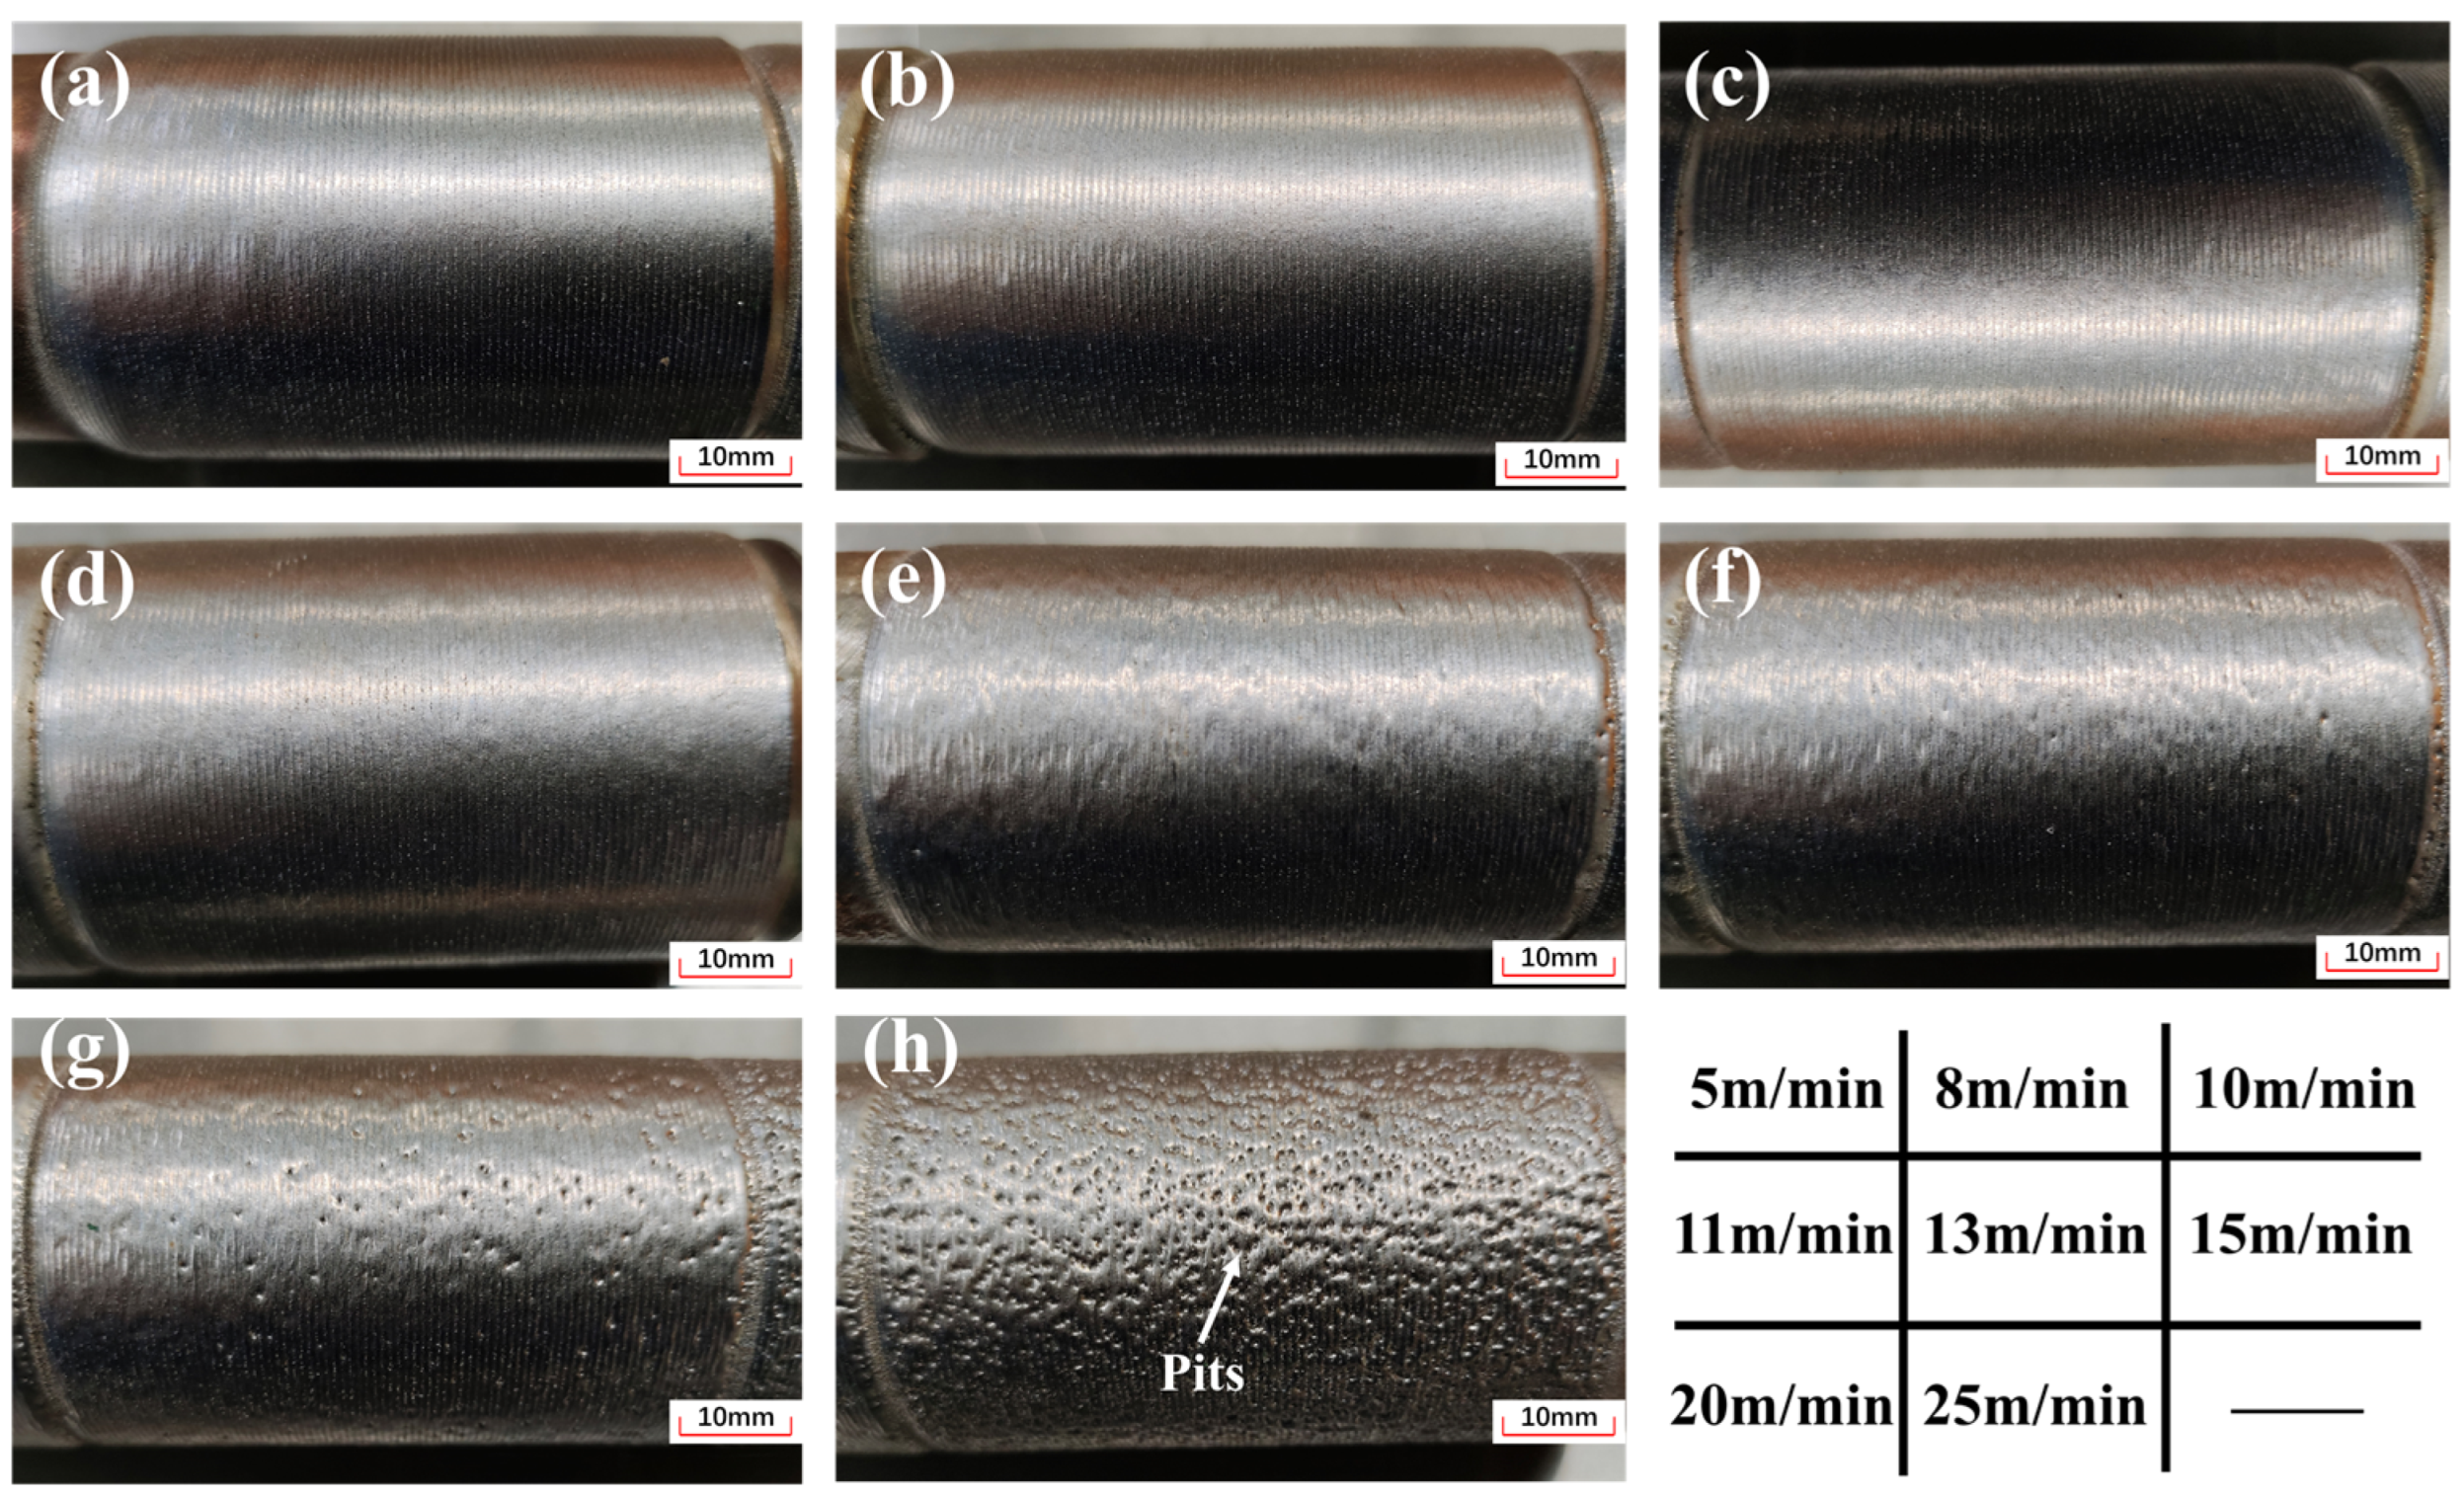
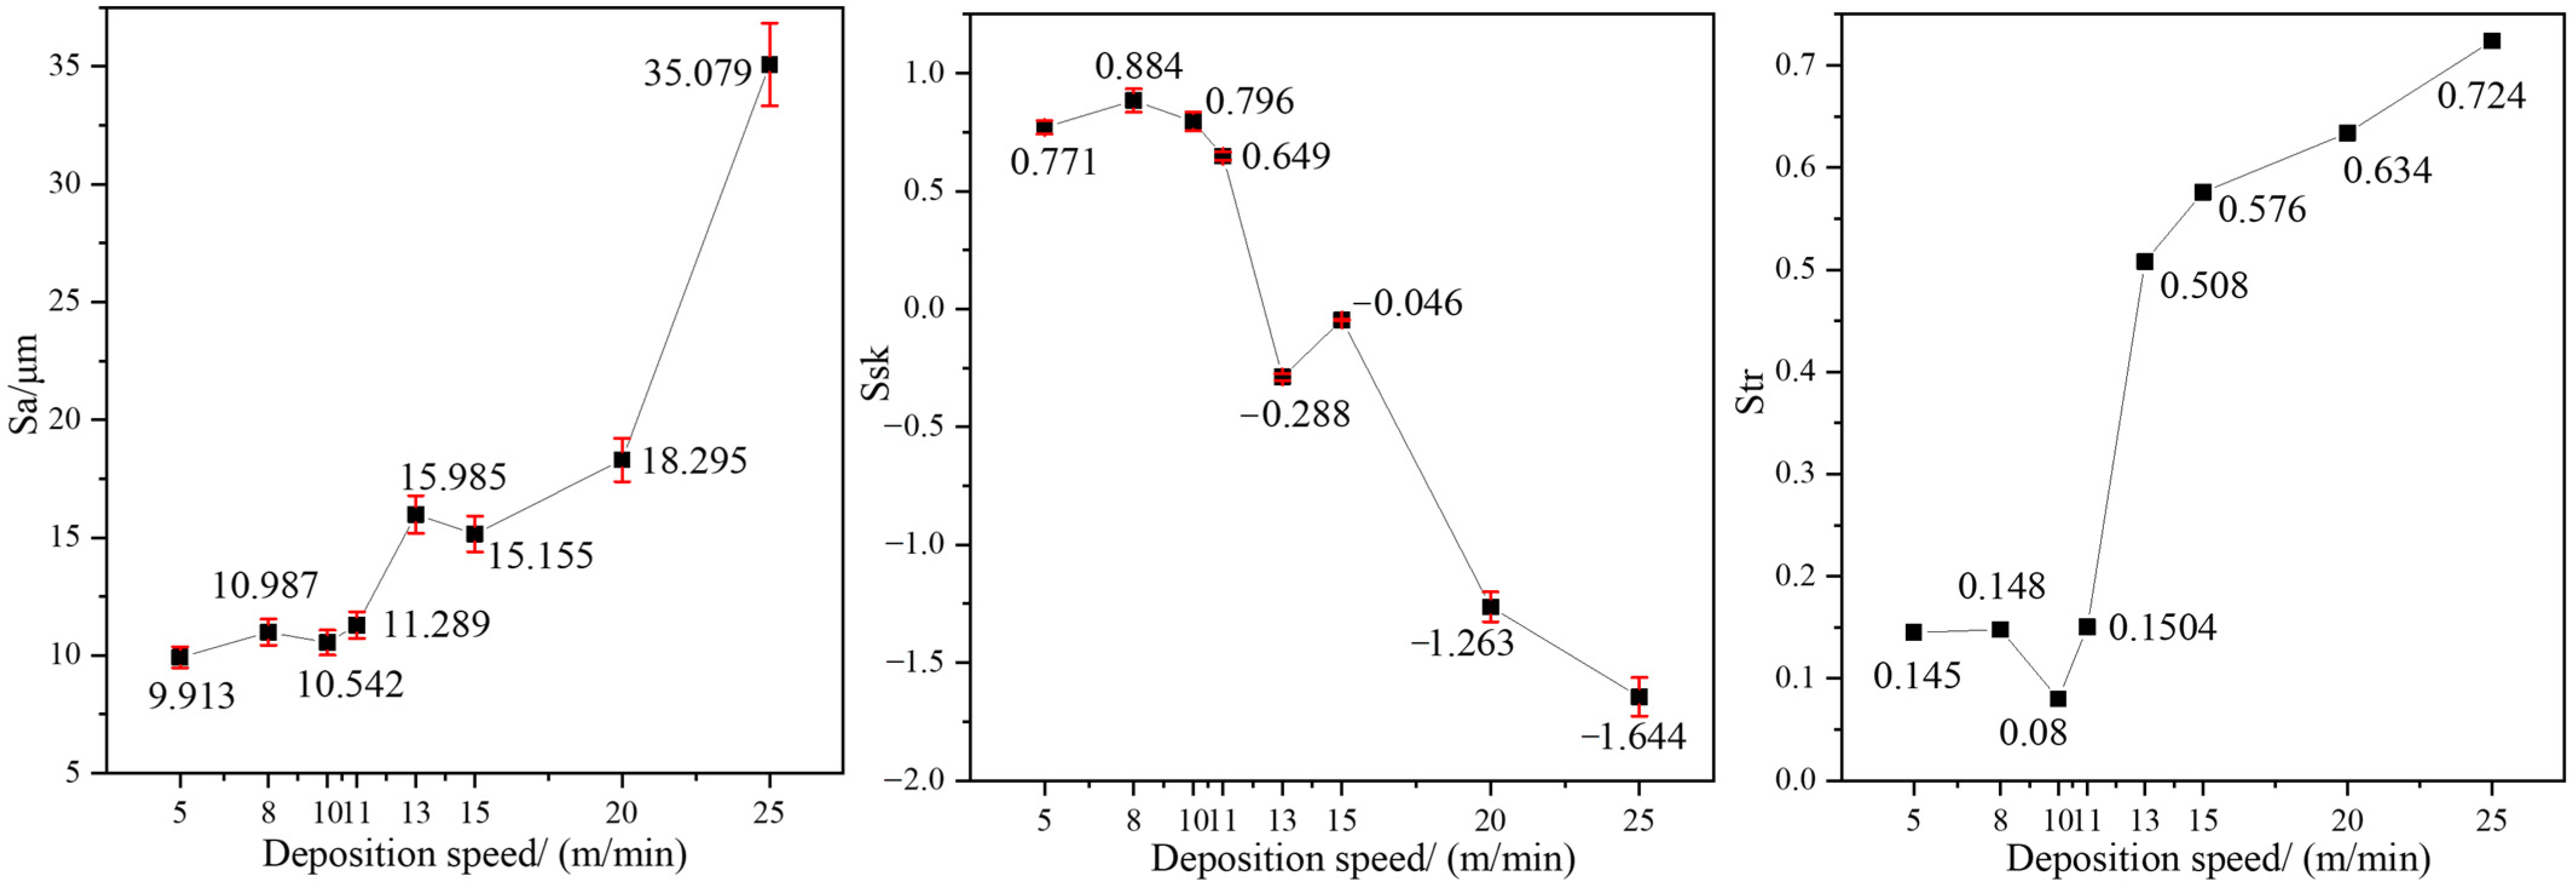
4.2.2. Influence of Deposition Speed

It has been proven that laser energy density increases with the decrease of deposition speed [42]. Figure 16 presents the macro-morphologies of EHLA coatings at different deposition speeds. It can be observed that when the deposition speed was ≤11 m/min, the surface morphology did not change significantly with the increase of deposition speed. However, when the speed was ≥13 m/min, with the further increase of deposition speed, the forming instability of the cladding layer became more serious, and the number of pits on the surface gradually increased. Finally, the EHLA coating surface was randomly distributed with many pits at a deposition speed of 25 m/min. According to the Plateau–Rayleigh instability principle, under the combined effects of axial disturbance harmonics and surface tension of the liquid column, the continuous liquid column tends to become unstable and even break into a series of liquid beads [43,44]. Furthermore, the Plateau–Rayleigh instability principle gives the necessary and sufficient conditions for the liquid column to remain stable under the disturbance harmonic interference as follows [43].
ξ = π D / λ   > 1
where ξ is the stability coefficient of the liquid column, D is the diameter of the liquid column, and λ is the wavelength of the disturbance harmonic. During the EHLA process, an increase in the deposition speed would lead to an increase in the length of the molten pool and a decrease in the width [45]. In other words, the diameter of the molten pool would become smaller. Finally, according to Formula (16), the stability coefficient ξ gradually decreased, and the unstable tendency of the molten pool increased, which resulted in the formation of abnormal surface morphology.
Figure 17 shows the variation of Sa, Ssk, and Str of EHLA JG-11 coatings with different deposition speeds. It could be identified that when the deposition speed was ≤11 m/min, Sa, Ssk, and Str of EHLA coatings had not changed obviously at the four different deposition speeds, which were consistent with the macro-morphologies. With the increase of deposition speed, Sa, Ssk, and Str changed significantly. Overall, Sa and Str gradually increased, while Ssk gradually decreased, which, respectively, represented that the height difference of each point on the coating surface became larger, the overall directionality of the surface morphology was gradually weakened, and the coating surface was characterized by pits. In conclusion, the variation trends of Sa, Ssk, and Str were consistent with the actual macro-morphology of EHLA coatings under different deposition speeds.

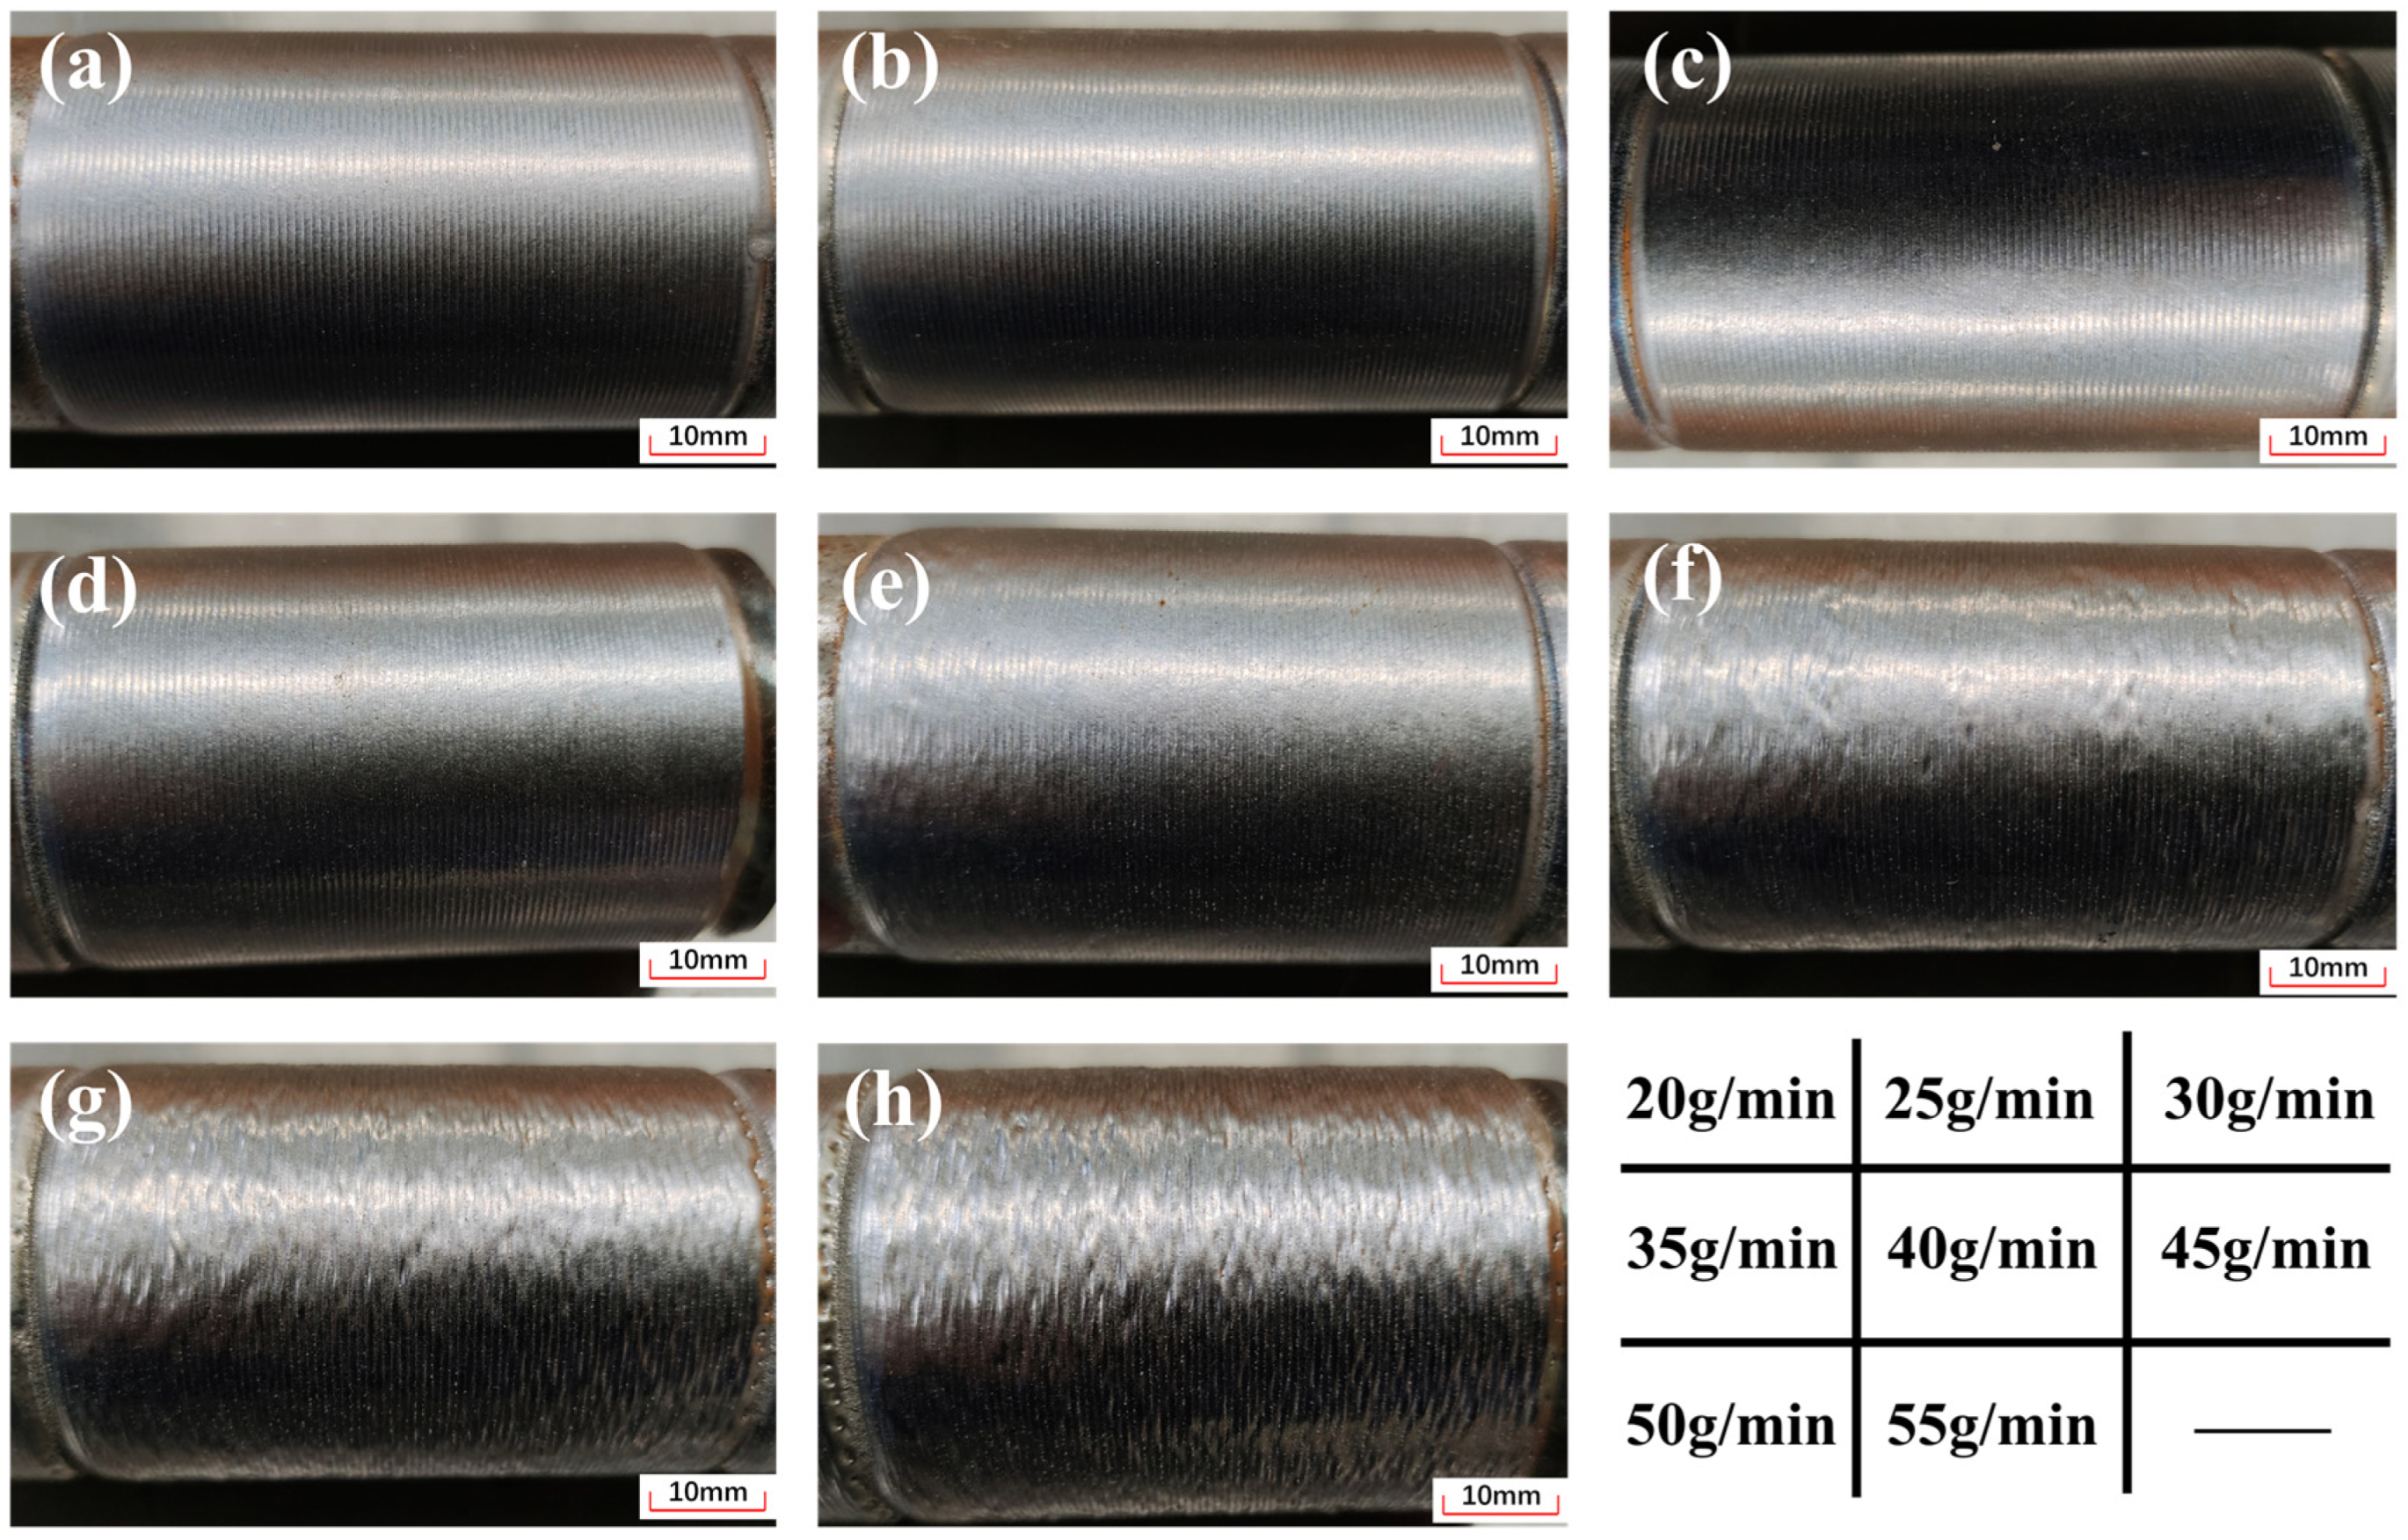
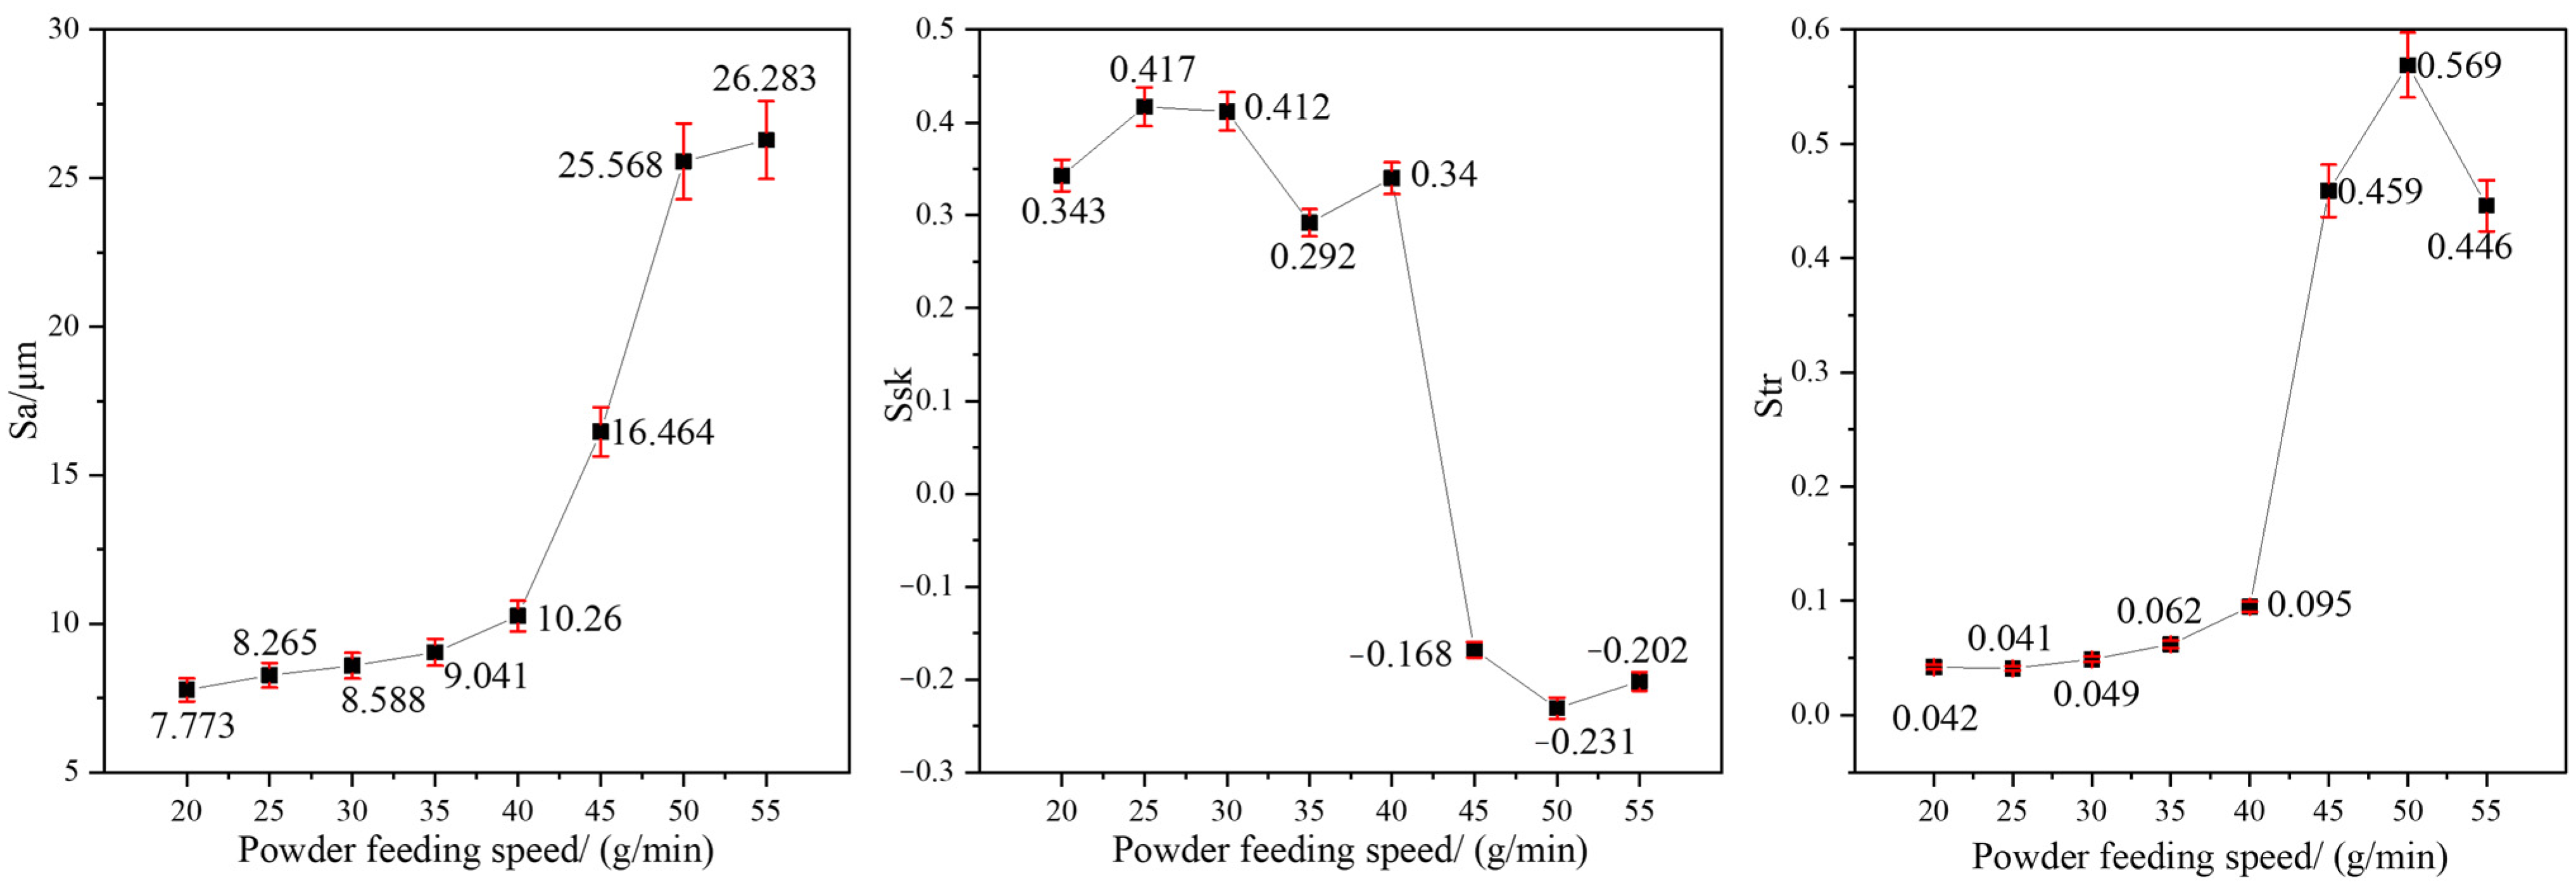
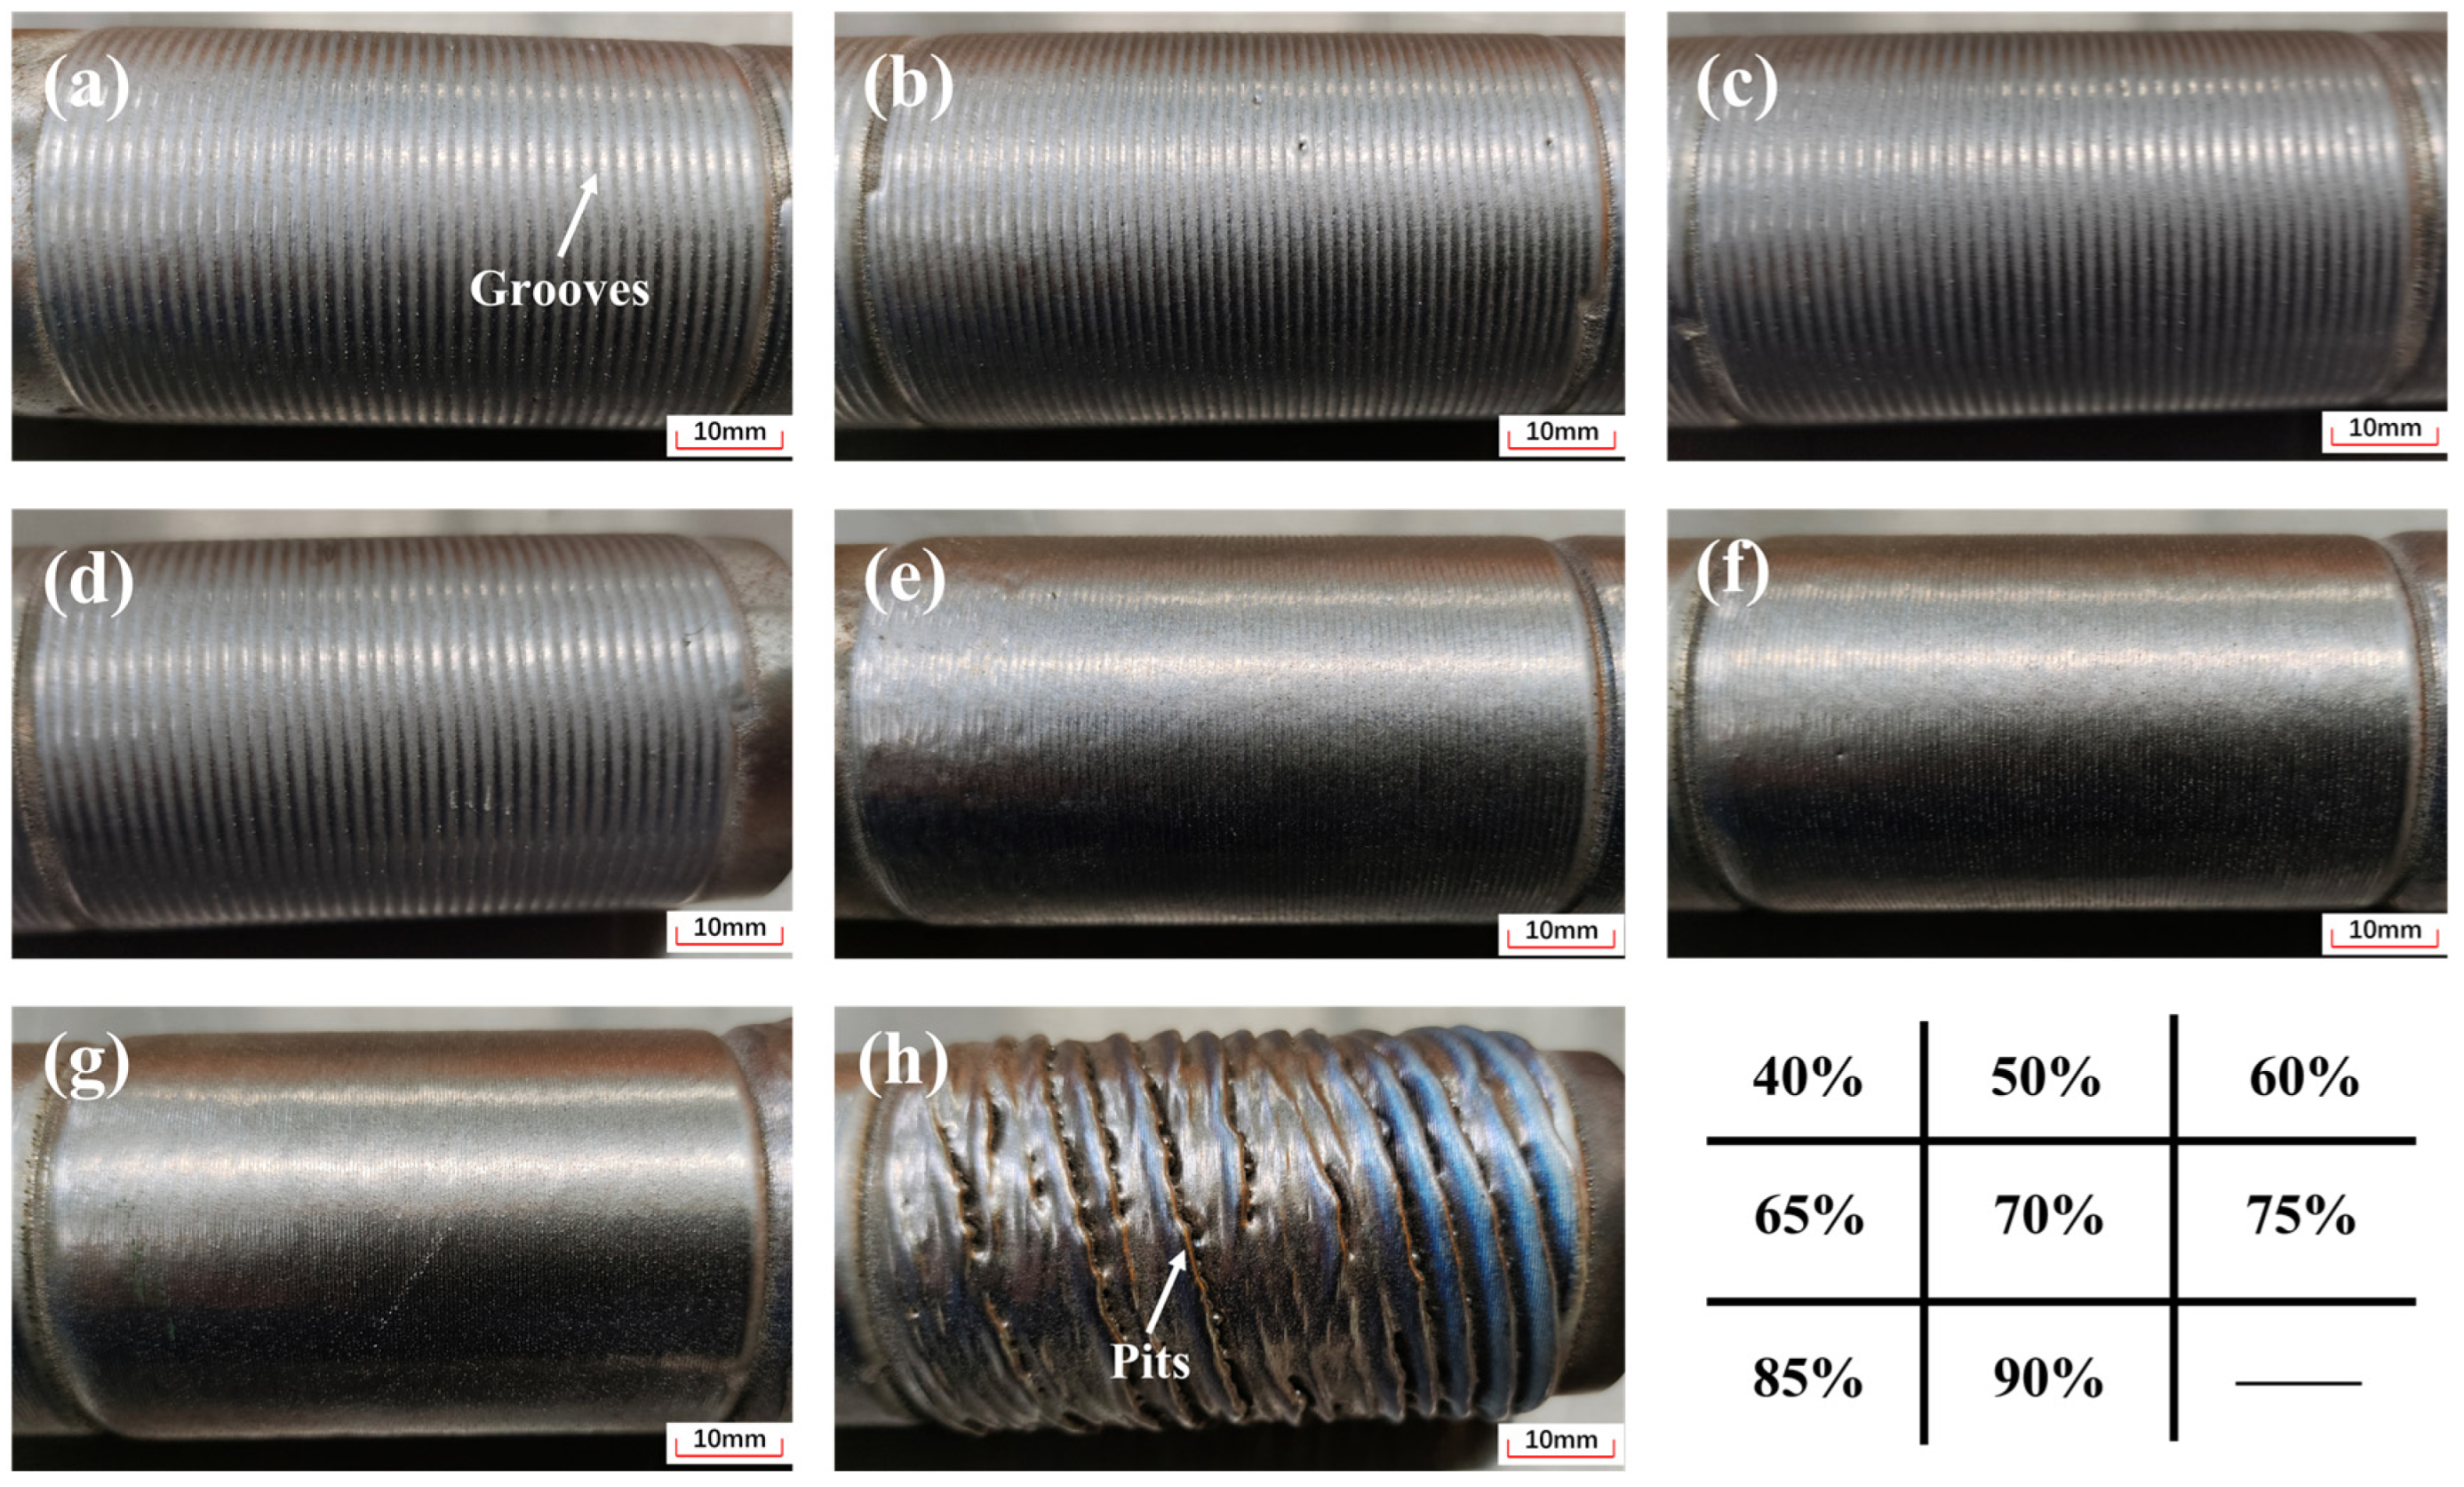
4.2.3. Influence of Powder Feeding Speed

The powder feeding speed will affect the absorption of laser energy by the substrate, the melting degree of powder particles before deposition on the substrate, then, finally influence the shape and stability of the molten pool during processing [38,46]. As shown in Figure 18, with the increase of powder feeding speed from 20 g/min to 40 g/min, the surface macro-morphologies did not change significantly (Figure 18a–e). However, as the powder feeding speed continued to increase to 45 g/min, 50 g/min, and 55 g/min, pits gradually formed on the coating surface, and the height difference became larger and larger (Figure 18f–h). It is well known that when the powder feeding speed is low, the powders only absorb a small amount of laser energy, while a large amount of laser energy directly irradiates on the substrate surface, which increases the width of the molten pool and reduces the coating thickness. According to the Plateau–Rayleigh principle, the stability of the molten pool under this condition is high, which is beneficial to form a cladding layer with regular surface morphology. However, with the increase of powder feeding speed, more and more laser energy is absorbed by powder particles, while the laser energy irradiated on the substrate surface gradually decreases, which eventually leads to a reduction of the width of the molten pool [46,47]. Moreover, the increase of powder feeding speed leads to a larger length of the molten pool [48], which has a negative impact on the stability of the molten pool, resulting in the reduction of forming quality of EHLA coating after solidification.
Figure 19 presents the variation of Sa, Ssk, and Str at different powder feeding speeds. When the powder feeding speed was ≤40 g/min, the three parameters did not change significantly with the increase of powder feeding speed. However, the three parameters changed significantly as the feeding speed continued to increase. Furthermore, the measurement results of Sa, Ssk, and Str indicated that the surface morphologies of the coating were characterized by pits, and the size of pits was larger and larger, which was consistent with the macro-morphological characteristics of EHLA coatings.

4.2.4. Influence of Overlapping Ratio

During the EHLA process, the liquid melt produced by powder melting is subjected to surface tension and gravity. Moreover, surface tension tends to shrink the liquid melt into a sphere to obtain a minimum surface area and hinder the liquid spreading. Gravity reduces the height of the gravity center of the liquid melt and tends to spread the melt [49]. Finally, the combined effects of the two forces make the surface morphology of single-pass coating show the characteristics of a high center and a low edge. As a result, when the overlapping ratio was low, the next cladding layer could not fill the concave area of the edge of the previous cladding layer, and finally formed a groove in the overlapping area (Figure 20a–d). With the increase of overlapping ratio, the distance between two adjacent cladding layers decreased gradually, and the next cladding layer could fill the concave area on the edge of previous cladding layer, which significantly improved the flatness of the cladding layer (Figure 20e–g). However, when the overlapping ratio was increased to 90%, the flatness of the coating surface was seriously reduced, and deep pits were distributed in some regions (Figure 20h). The reason was that heat input per unit area increased sharply as a result of the large overlapping ratio, which led to powder overburning, violent movement of liquid metal in the molten pool, serious oxidation of the cladding layer, and even peeling, then finally resulted in a sharp decline in the forming quality of the cladding layer [21,41]. In addition, it could also be observed that the end of the cladding layer was blue, which further proved that the temperature of the molten pool rose sharply.
Sa, Ssk, and Str of EHLA coatings under different overlapping ratios were tested, and the variation curves are shown in Figure 21. When the overlapping rate was ≤65%, Sa fluctuated around 15 μm, and Ssk was <0, which represented that the coating surface was characterized by pits. However, Str was close to 0, indicating that the cladding layer had strong directionality. As the overlapping ratio continued to increase, Sa firstly decreased and then increased, Ssk firstly increased and then decreased, and Str slightly increased. The reason was that the increase of overlapping ratio was conducive to improving the surface flatness of the cladding layer. Nevertheless, too high overlapping ratios led to excessive heat input, resulting in a sharp decline in the stability of the molten pool and serious concave features formed on the coating surface, which was consistent with the sharp increase of Sa and Str, and the sharp decline of Ssk. To sum up, the morphologic characteristics of cladding layers reflected by the above parameters were consistent with the actual coating surface morphologies.
In conclusion, the comprehensive evaluation index composed of Sa, Ssk, and Str can effectively reflect the variation of surface morphology under different process parameters during the EHLA process. In other words, the monitoring system and evaluation method developed in this study can reflect the stability of coating quality in real time and indirectly reflect the fluctuations of process parameters. Results of the study provide a new solution for the realization of automation and intelligence of the EHLA process. In future research, the mapping relationship between the variation of Sa, Ssk, Str and each process parameter can be established by using big data analysis technology so as to realize accurate judgment and intelligent online regulation of the influencing factors during the EHLA process.

5. Conclusions

In this research, with laser power, deposition speed, powder feeding speed, and overlapping ratio as influencing factors, a single-factor experiment scheme was designed to study the influences of the fluctuations of process parameters on the forming quality of EHLA coatings. In addition, an on-line monitoring system and a comprehensive evaluation index for surface morphology of EHLA coating were designed to realize on-line monitoring of coating forming quality during the EHLA process. The specific research conclusions were as follows.
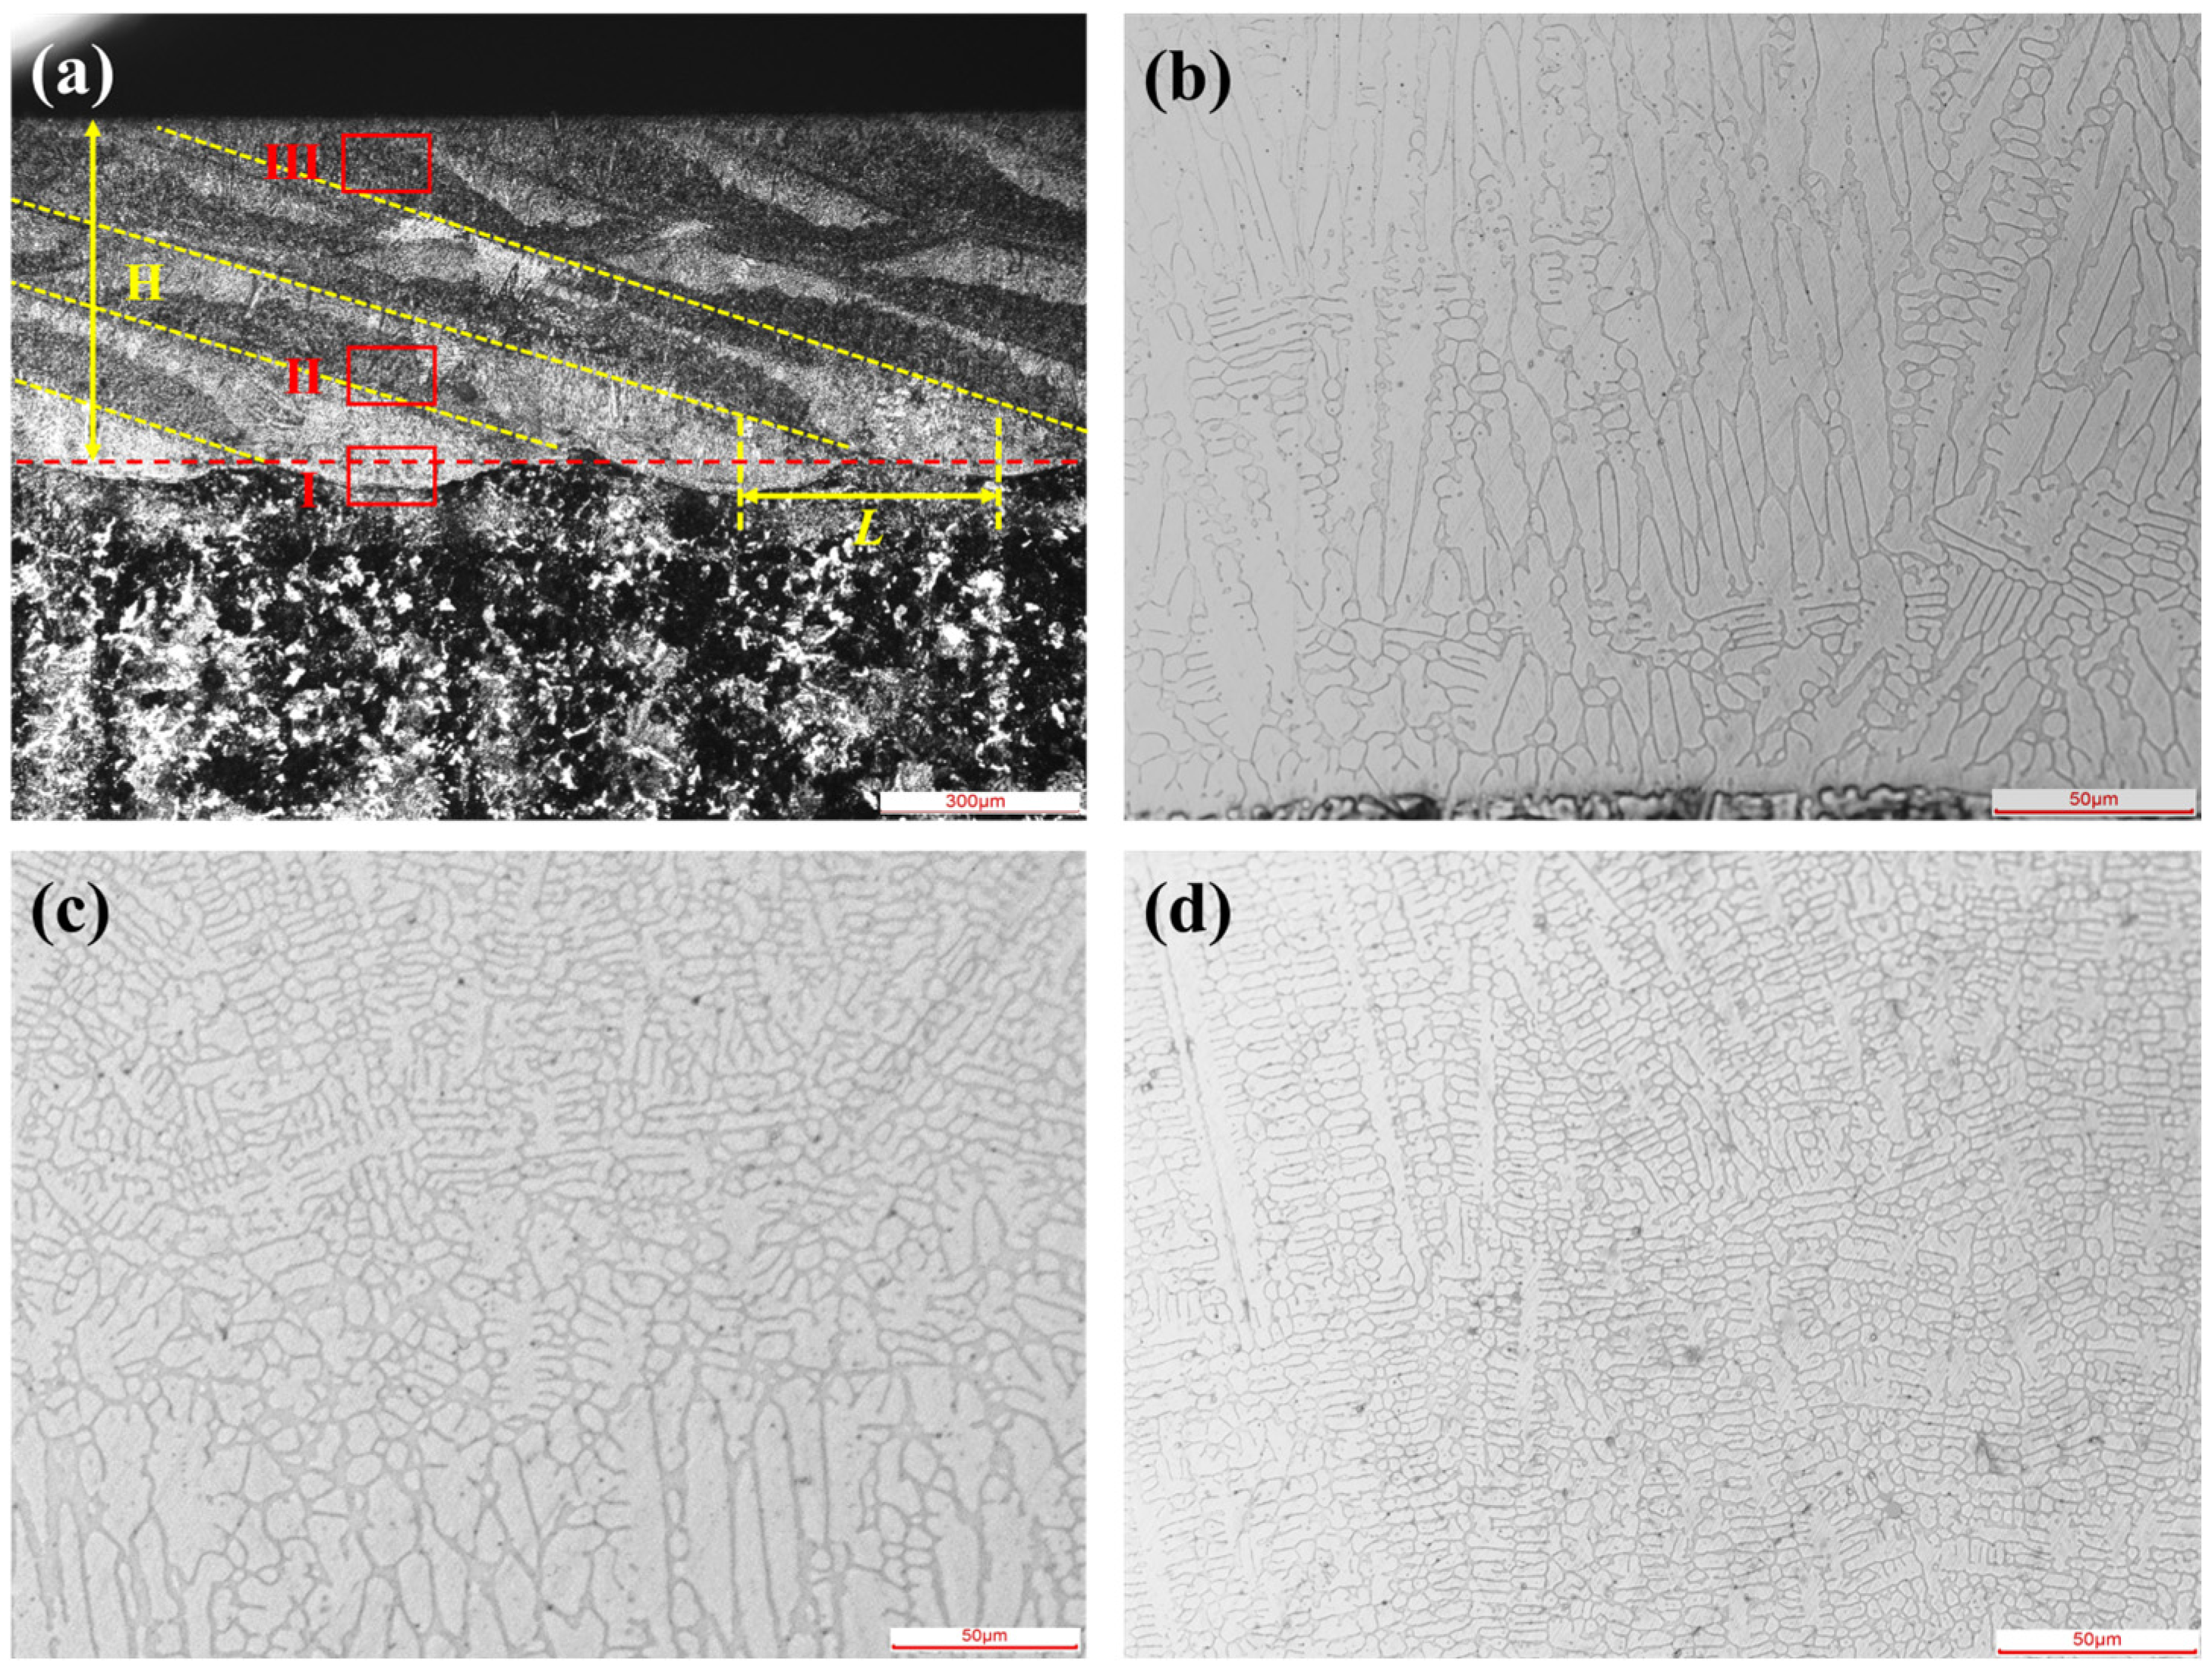
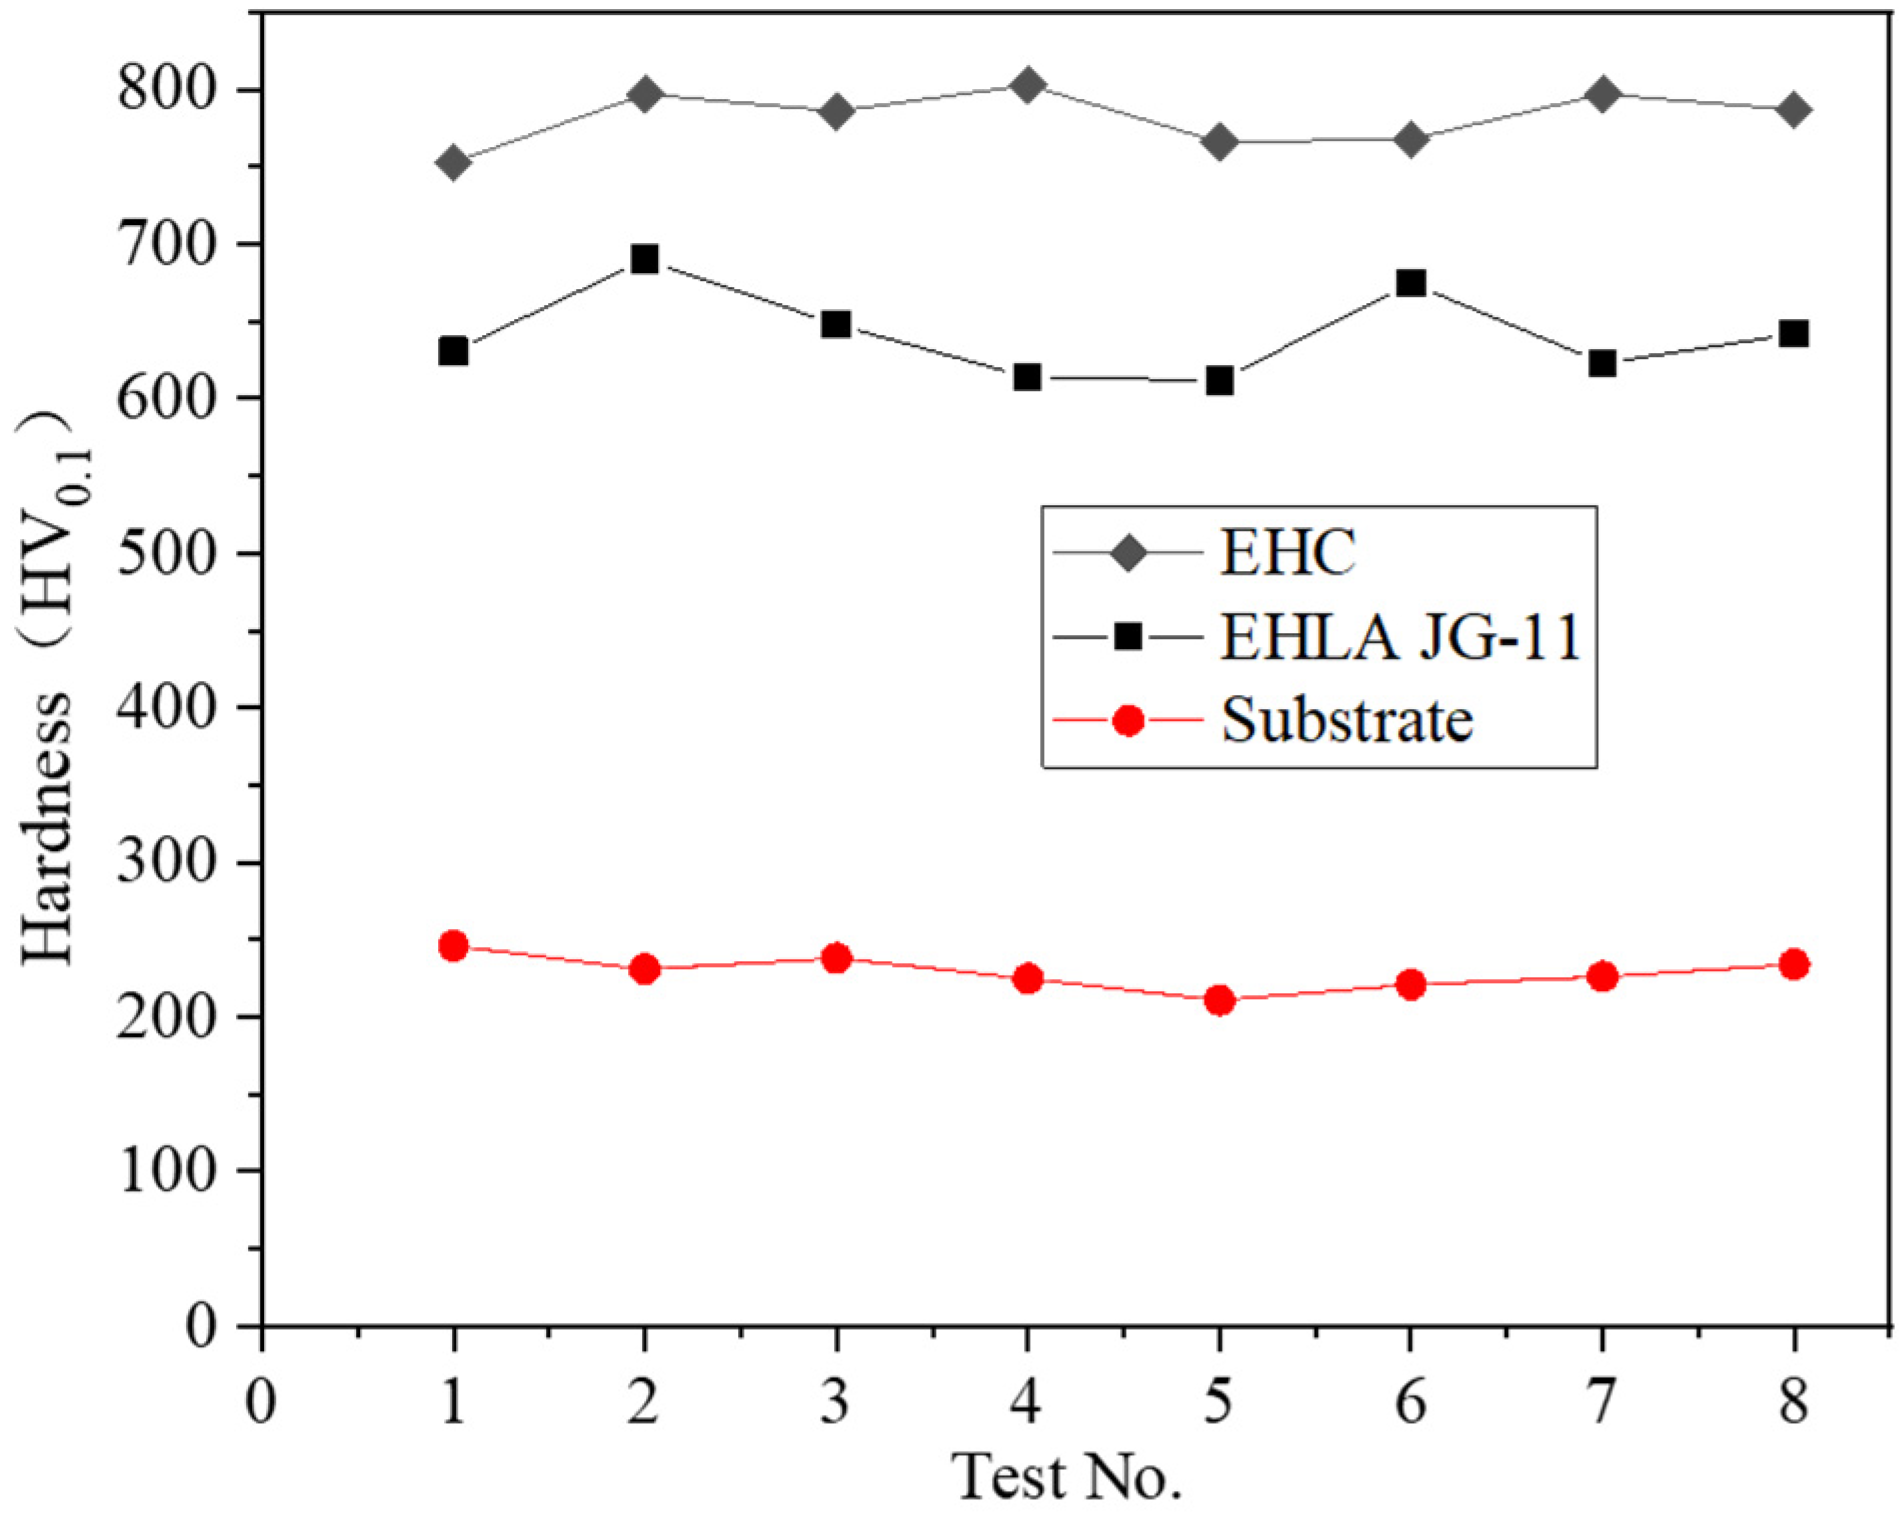
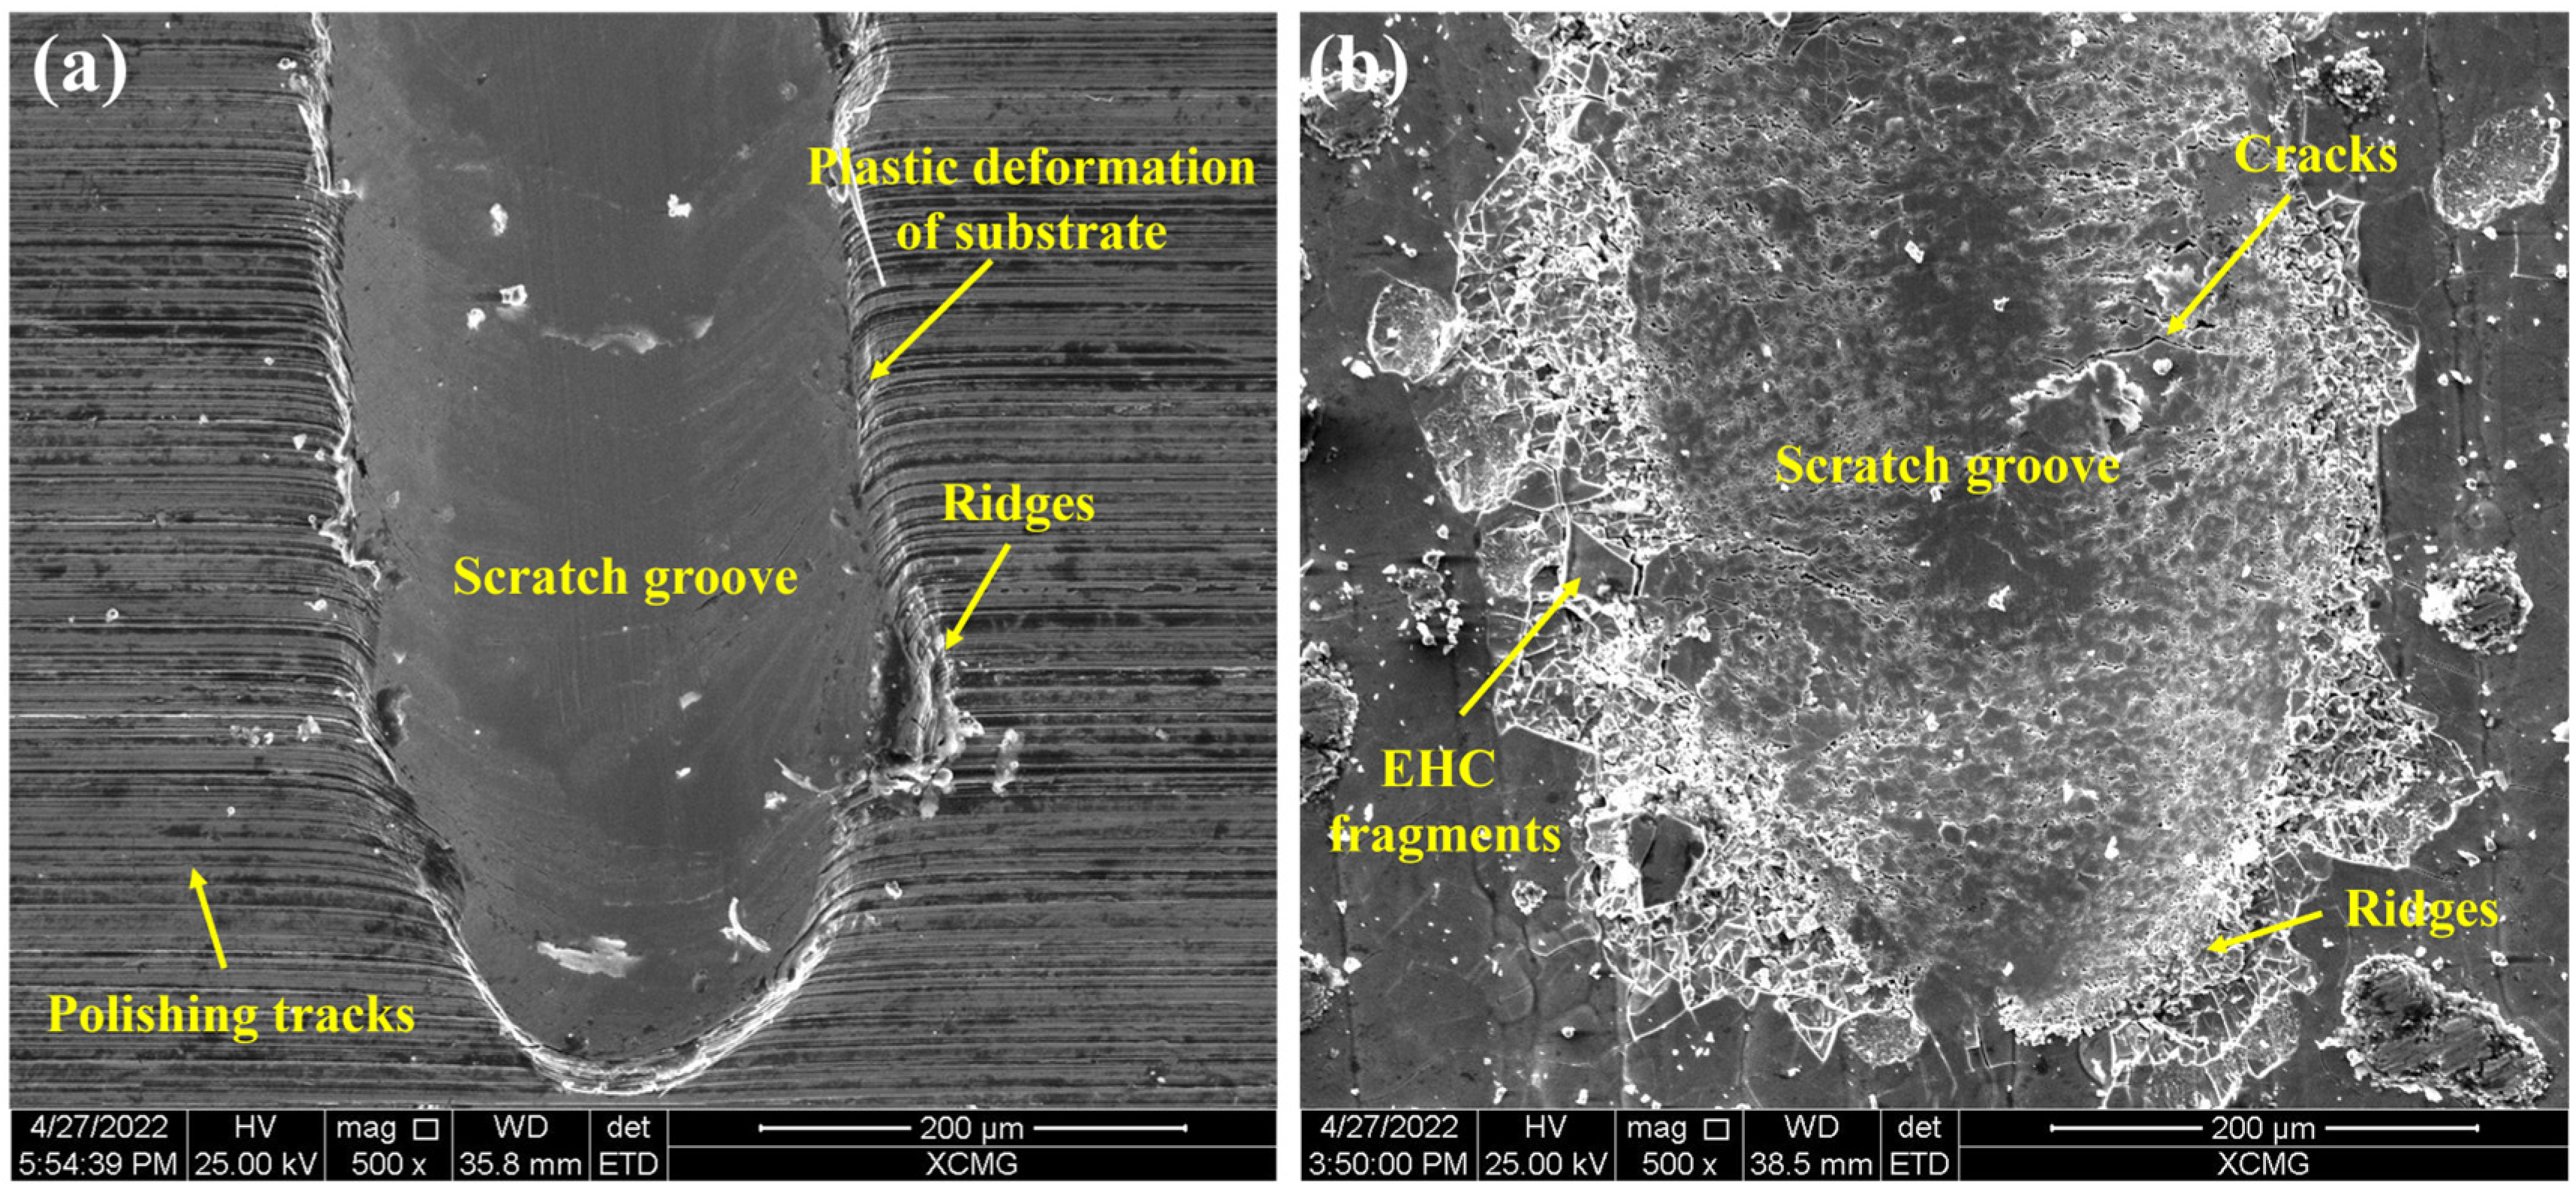
  • The microstructure of EHLA JG-11 coating is fine and uniform, and the microhardness is 653 ± 56 HV on average, which is lower than that of EHC. Due to high density and easy formation of passive film on the surface, JG-11 coating exhibits better electrochemical corrosion resistance than EHC. Moreover, the E/H value of JG-11 coating is small, showing an excellent resistance to scratch wear.
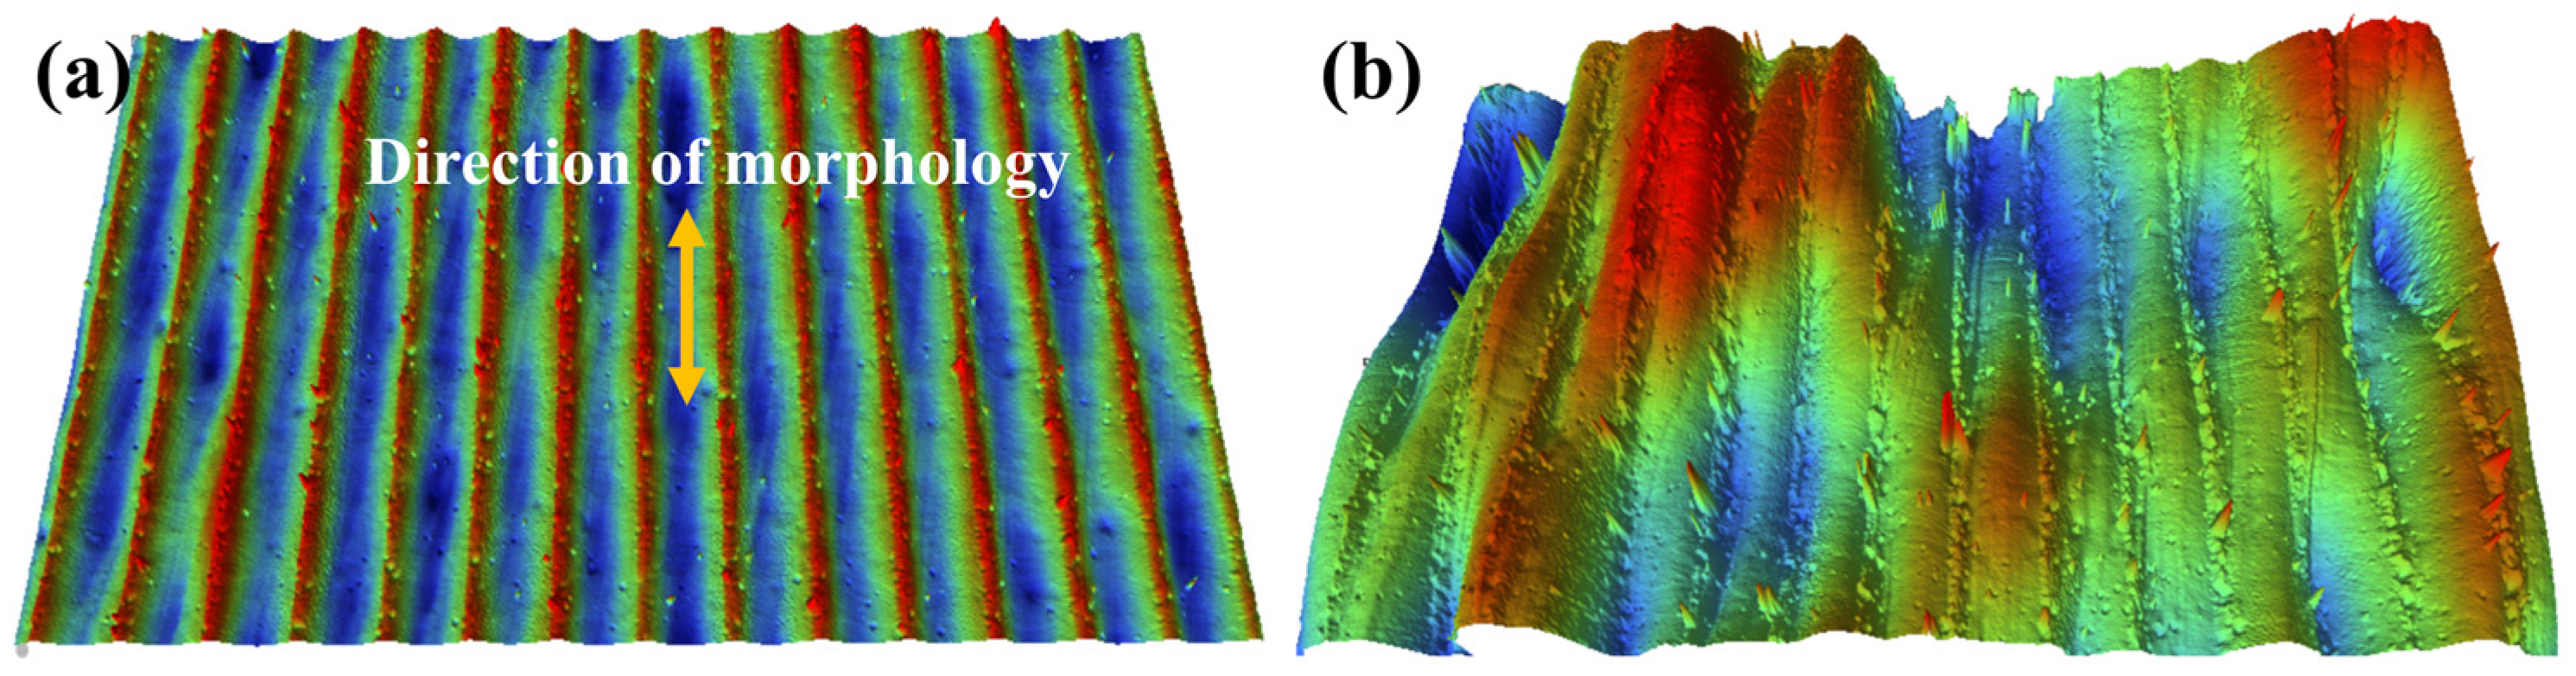
  • The fluctuations of process parameters such as laser power, deposition speed, powder feeding speed, overlapping ratio, etc., adversely affect the stability of the molten pool, resulting in the formation of different surface morphologies on the EHLA JG-11 coatings, which are mainly shown as high surface flatness, deep pits, small peaks, poor directionality, etc.
  • The on-line monitoring system of coating surface morphology based on laser triangulation has the advantages of high resolution and high sampling frequency. In addition, research results indicate that the comprehensive evaluation index composed of Sa, Ssk, and Str can accurately reflect the morphological characteristics of coating surface in real time. In other words, the on-line monitoring system and evaluation method designed in this study can realize the on-line monitoring of the forming quality of EHLA coating under the condition of high-speed moving.

Author Contributions

J.W.: Conceptualization, Methodology, Investigation, Writing—original draft, and Visualization. C.A.: Conceptualization, Resources, Writing—review and editing, Supervision, Project administration, and Funding acquisition. F.G.: Investigation, Writing—review and editing, and Supervision. X.Y.: Conceptualization, Resources, Writing—review and editing, and Supervision. X.Z.: Investigation. All authors have read and agreed to the published version of the manuscript.

Funding

This research was funded by the National Key Technologies Research and Development Program, the number is 2019YFB2005301.

Institutional Review Board Statement

Not applicable.

Informed Consent Statement

Not applicable.

Data Availability Statement

The datasets generated during and/or analyzed during the current study are available from the corresponding author on reasonable request.

Conflicts of Interest

The authors declare no conflict of interest.

Nomenclature

EHLAextreme high-speed laser cladding
EHCelectroplating hard chromium
CCDcharge coupled device
CMOScomplementary metal oxide semiconductor
Zheight of the point on a coating surface
hdisplacement of a laser spot
αangle between the optical axis of imaging lens and laser beam
βangle between the optical axis of imaging lens and photosensitive surface
Lobject distance
limage distance
Ooptical center of imaging lens
Aposition of the laser spot on a component surface
A′position of the imaging spot in a CMOS camera
Icorrself-corrosion current
Ecorrself-corrosion potential
Saarithmetical mean height of the scale-limited surface
Sskskewness of the scale-limited surface
Strtexture aspect ratio

References

  1. Shen, F.; Tao, W.; Li, L.; Zhou, Y.; Wang, W.; Wang, S. Effect of Microstructure on the Corrosion Resistance of Coatings by Extreme High Speed Laser Cladding. Appl. Surf. Sci. 2020, 517, 146085. [Google Scholar] [CrossRef]
  2. Yan, Q.; Yang, K.; Wang, Z.D.; Chen, M.Z.; Sun, G.F.; Ni, Z.H. Surface Roughness Optimization and High-Temperature Wear Performance of H13 Coating Fabricated by Extreme High-Speed Laser Cladding. Opt. Laser Technol. 2022, 149, 107823. [Google Scholar] [CrossRef]
  3. Li, H. Research on Digital, Networked and Intelligent Manufacturing of Modern Ship. J. Phys. Conf. Ser. 2020, 1634, 12052. [Google Scholar] [CrossRef]
  4. Ghobakhloo, M. Determinants of Information and Digital Technology Implementation for Smart Manufacturing. Int. J. Prod. Res. 2020, 58, 2384–2405. [Google Scholar] [CrossRef]
  5. Lu, Z.; Wang, M.; Dai, W. A Condition Monitoring Approach for Machining Process Based on Control Chart Pattern Recognition with Dynamically-Sized Observation Windows. Comput. Ind. Eng. 2020, 142, 106360. [Google Scholar] [CrossRef]
  6. Li, W.; Liu, W.; Saleheen, K.M.; Liu, H.; Xia, Y.; Al-Hammadi, G.; Xue, L.; Wang, F.; Song, X.; Zhang, Y. Research and Prospect of On-Line Monitoring Technology for Laser Additive Manufacturing. Int. J. Adv. Manuf. Technol. 2022, 125, 25–46. [Google Scholar] [CrossRef]
  7. Srisungsitthisunti, P.; Kaewprachum, B.; Yang, Z.; Gao, G. Real-Time Quality Monitoring of Laser Cladding Process on Rail Steel by an Infrared Camera. Metals 2022, 12, 825. [Google Scholar] [CrossRef]
  8. Muvvala, G.; Karmakar, D.P.; Nath, A.K. Online Assessment of TiC Decomposition in Laser Cladding of Metal Matrix Composite Coating. Mater. Des. 2017, 121, 310–320. [Google Scholar] [CrossRef]
  9. Yang, P.; Sun, G.F.; Lu, Y.; Ni, Z. Monitoring of Optical Emissions in Laser Cladding of 316L Stainless Steel. Appl. Opt. 2019, 58, 8733. [Google Scholar] [CrossRef] [PubMed]
  10. Wang, S.; Liu, C. Real-Time Monitoring of Chemical Composition in Nickel-Based Laser Cladding Layer by Emission Spectroscopy Analysis. Materials 2019, 12, 2637. [Google Scholar] [CrossRef] [Green Version]
  11. Schmidt, M.; Huke, P.; Gerhard, C.; Partes, K. In-Line Observation of Laser Cladding Processes via Atomic Emission Spectroscopy. Materials 2021, 14, 4401. [Google Scholar] [CrossRef] [PubMed]
  12. Kapoor, R.; Ramasamy, S.; Gardi, A.; Van Schyndel, R.; Sabatini, R. Acoustic Sensors for Air and Surface Navigation Applications. Sensors 2018, 18, 499. [Google Scholar] [CrossRef] [PubMed] [Green Version]
  13. Rieder, H.; Dillhöfer, A.; Spies, M.; Bamberg, J.; Hess, T. Online Monitoring of Additive Manufacturing Processes Using Ultrasound 2. Additive Manufacturing and Quality Assurance Considerations 3. Ultrasonic Process Monitoring. In Proceedings of the 11th European Conference on Non-Destructive Testing, Prague, Czech Republic, 6–10 October 2014; Volume 1, pp. 2194–2201. [Google Scholar]
  14. Shevchik, S.A.; Kenel, C.; Leinenbach, C.; Wasmer, K. Acoustic Emission for in Situ Quality Monitoring in Additive Manufacturing Using Spectral Convolutional Neural Networks. Addit. Manuf. 2018, 21, 598–604. [Google Scholar] [CrossRef]
  15. Krauss, H.; Eschey, C.; Zaeh, M.F. Thermography for Monitoring the Selective Laser Melting Process. In Proceedings of the 23rd Annual International Solid Freeform Fabrication Symposium—An Additive Manufacturing Conference, SFF 2012, Austin, TX, USA, 6–8 August 2012; pp. 999–1014. [Google Scholar]
  16. Asselin, M.; Toyserkani, E.; Iravani-Tabrizipour, M.; Khajepour, A. Development of Trinocular CCD-Based Optical Detector for Real-Time Monitoring of Laser Cladding. In Proceedings of the IEEE International Conference Mechatronics and Automation, Niagara Falls, ON, Canada, 29 July–1 August 2005; Volume 3, pp. 1190–1196. [Google Scholar]
  17. Zhang, Y.; Hong, G.S.; Ye, D.; Zhu, K.; Fuh, J.Y.H. Extraction and Evaluation of Melt Pool, Plume and Spatter Information for Powder-Bed Fusion AM Process Monitoring. Mater. Des. 2018, 156, 458–469. [Google Scholar] [CrossRef]
  18. Zhao, C.; Fezzaa, K.; Cunningham, R.W.; Wen, H.; De Carlo, F.; Chen, L.; Rollett, A.D.; Sun, T. Real-Time Monitoring of Laser Powder Bed Fusion Process Using High-Speed X-ray Imaging and Diffraction. Sci. Rep. 2017, 7, 3602. [Google Scholar] [CrossRef]
  19. Kanko, J.A.; Sibley, A.P.; Fraser, J.M. In Situ Morphology-Based Defect Detection of Selective Laser Melting through Inline Coherent Imaging. J. Mater. Process. Technol. 2016, 231, 488–500. [Google Scholar] [CrossRef]
  20. Shao, J.; Yu, G.; He, X.; Li, S.; Chen, R.; Zhao, Y. Grain Size Evolution under Different Cooling Rate in Laser Additive Manufacturing of Superalloy. Opt. Laser Technol. 2019, 119, 105662. [Google Scholar] [CrossRef] [Green Version]
  21. Li, S.; Xiao, H.; Liu, K.; Xiao, W.; Li, Y.; Han, X.; Mazumder, J.; Song, L. Melt-Pool Motion, Temperature Variation and Dendritic Morphology of Inconel 718 during Pulsed- and Continuous-Wave Laser Additive Manufacturing: A Comparative Study. Mater. Des. 2017, 119, 351–360. [Google Scholar] [CrossRef]
  22. Liu, M.; Jiang, H.; Chang, G.; Xu, Y.; Ma, F.; Xu, K. Effect of Laser Remelting on Corrosion and Wear Resistance of Fe82Cr16SiB Alloy Coatings Fabricated by Extreme High-Speed Laser Cladding. Mater. Lett. 2022, 325, 132823. [Google Scholar] [CrossRef]
  23. Cheng, J.; Xing, Y.; Dong, E.; Zhao, L.; Liu, H.; Chang, T.; Chen, M.; Wang, J.; Lu, J.; Wan, J. An Overview of Laser Metal Deposition for Cladding: Defect Formation Mechanisms, Defect Suppression Methods and Performance Improvements of Laser-Cladded Layers. Materials 2022, 15, 5522. [Google Scholar] [CrossRef]
  24. Nie, M.H.; Zhang, S.; Wang, Z.Y.; Yin, T.Y.; Zhang, C.H.; Wu, C.L.; Zhang, D.X. Laser Cladding of 17-4 PH Stainless Steel Coatings: Microstructure, Texture Characterization, and Corrosion Resistance. J. Mater. Eng. Perform. 2022, 1–12. [Google Scholar] [CrossRef]
  25. Nan, Z.; Tao, W.; Zhao, H. Automatic Optical Structure Optimization Method of the Laser Triangulation Ranging System under the Scheimpflug Rule. Opt. Express 2022, 30, 18667. [Google Scholar] [CrossRef]
  26. Penney, C.M.; Thomas, B. High Performance Laser Triangulation Ranging. J. Laser Appl. 1989, 1, 51–58. [Google Scholar] [CrossRef]
  27. Yao, Q.; Cao, M. Design of Optical Emission System in 3D Shape Detection with Oblique Laser Triangulation Probe. J. Phys. Conf. Ser. 2021, 1774, 12063. [Google Scholar] [CrossRef]
  28. Adamov, A.A.; Khramov, V.N. The Optimal Parameters of the Laser Triangulation Modified Thickness Meter. J. Phys. Conf. Ser. 2019, 1368, 22001. [Google Scholar] [CrossRef]
  29. Mondal, S.; Bandyopadhyay, A.; Pal, P.K. Application of Artificial Neural Network for the Prediction of Laser Cladding Process Characteristics at Taguchi-Based Optimized Condition. Int. J. Adv. Manuf. Technol. 2014, 70, 2151–2158. [Google Scholar] [CrossRef]
  30. Hemmati, I.; Ocelík, V.; De Hosson, J.T.M. The Effect of Cladding Speed on Phase Constitution and Properties of AISI 431 Stainless Steel Laser Deposited Coatings. Surf. Coat. Technol. 2011, 205, 5235–5239. [Google Scholar] [CrossRef] [Green Version]
  31. Bontha, S.; Klingbeil, N.W.; Kobryn, P.A.; Fraser, H.L. Effects of Process Variables and Size-Scale on Solidification Microstructure in Beam-Based Fabrication of Bulky 3D Structures. Mater. Sci. Eng. A 2009, 513, 311–318. [Google Scholar] [CrossRef]
  32. Hemmati, I.; Ocelík, V.; De Hosson, J.T.M. Microstructural Characterization of AISI 431 Martensitic Stainless Steel Laser-Deposited Coatings. J. Mater. Sci. 2011, 46, 3405–3414. [Google Scholar] [CrossRef] [Green Version]
  33. Li, T.; Liu, L.; Zhang, B.; Li, Y.; Wang, F. An Investigation on the Continuous and Uniform Thin Membrane Passive Film Formed on Sputtered Nanocrystalline Stainless Steel. Corros. Sci. 2016, 104, 71–83. [Google Scholar] [CrossRef]
  34. Dhondt, M.; Shubina, V.; Homette, R.; Chirani, S.A.; Calloch, S. Effect of Mechanical (Monotonic and Cyclic) Stress on the Corrosion Resistance of Chromium-Plated Steel Rods. Procedia Eng. 2018, 213, 598–605. [Google Scholar] [CrossRef]
  35. Greenwood, J.A.; Williamson, J.B.P. Contact of Nominally Flat Surfaces. Proc. R. Soc. London. Ser. A Math. Phys. Sci. 1966, 295, 300–319. [Google Scholar] [CrossRef]
  36. Hutchings, I.; Shipway, P. Tribology: Friction and Wear of Engineering Materials; Butterworth-Heinemann: Oxford, UK, 2017; ISBN 0081009518. [Google Scholar]
  37. Wang, S.; Ma, C.; Walsh, F.C. Alternative Tribological Coatings to Electrodeposited Hard Chromium: A Critical Review. Trans. Inst. Met. Finish. 2020, 98, 173–185. [Google Scholar] [CrossRef]
  38. Neto, O.O.D.; Alcalde, A.M.; Vilar, R. Interaction of a Focused Laser Beam and a Coaxial Powder Jet in Laser Surface Processing. J. Laser Appl. 2007, 19, 84–88. [Google Scholar] [CrossRef]
  39. Schopphoven, T.; Gasser, A.; Wissenbach, K.; Poprawe, R. Investigations on Ultra-High-Speed Laser Material Deposition as Alternative for Hard Chrome Plating and Thermal Spraying. J. Laser Appl. 2016, 28, 022501. [Google Scholar] [CrossRef]
  40. Khairallah, S.A.; Anderson, A. Mesoscopic Simulation Model of Selective Laser Melting of Stainless Steel Powder. J. Mater. Process. Technol. 2014, 214, 2627–2636. [Google Scholar] [CrossRef]
  41. Zhao, Y.; Guan, C.; Chen, L.; Sun, J.; Yu, T. Effect of Process Parameters on the Cladding Track Geometry Fabricated by Laser Cladding. Optik 2020, 223, 165447. [Google Scholar] [CrossRef]
  42. Li, L.; Shen, F.; Zhou, Y.; Tao, W. Comparative Study of Stainless Steel AISI 431 Coatings Prepared by Extreme-High-Speed and Conventional Laser Cladding. J. Laser Appl. 2019, 31, 042009. [Google Scholar] [CrossRef]
  43. Gusarov, A.V.; Smurov, I. Modeling the Interaction of Laser Radiation with Powder Bed at Selective Laser Melting. Phys. Procedia 2010, 5, 381–394. [Google Scholar] [CrossRef] [Green Version]
  44. Yadroitsev, I.; Bertrand, P.; Smurov, I. Parametric Analysis of the Selective Laser Melting Process. Appl. Surf. Sci. 2007, 253, 8064–8069. [Google Scholar] [CrossRef]
  45. Gusarov, A.V.; Yadroitsev, I.; Bertrand, P.; Smurov, I. Heat Transfer Modelling and Stability Analysis of Selective Laser Melting. Appl. Surf. Sci. 2007, 254, 975–979. [Google Scholar] [CrossRef]
  46. Huang, Y.-L.; Liu, J.; Ma, N.-H.; Li, J.-G. Three-Dimensional Analytical Model on Laser-Powder Interaction during Laser Cladding. J. Laser Appl. 2006, 18, 42–46. [Google Scholar] [CrossRef]
  47. Huang, Y.-L.; Liang, G.-Y.; Su, J.-Y.; Li, J.-G. Interaction between Laser Beam and Powder Stream in the Process of Laser Cladding with Powder Feeding. Model. Simul. Mater. Sci. Eng. 2004, 13, 47. [Google Scholar] [CrossRef]
  48. Goodarzi, D.M.; Pekkarinen, J.; Salminen, A. Effect of Process Parameters in Laser Cladding on Substrate Melted Areas and the Substrate Melted Shape. J. Laser Appl. 2015, 27, S29201. [Google Scholar] [CrossRef] [Green Version]
  49. Kumar, A.; Roy, S. Effect of Three-Dimensional Melt Pool Convection on Process Characteristics during Laser Cladding. Comput. Mater. Sci. 2009, 46, 495–506. [Google Scholar] [CrossRef]
Figure 1. EHLA system.
Coatings 13 00625 g001
Figure 2. Microscopic morphology of JG-11 powder.
Coatings 13 00625 g002
Figure 3. On-line monitoring system of forming quality of EHLA coating.
Coatings 13 00625 g003
Figure 4. Schematic diagram of the relative positions of the sensor, deposition head, and component.
Coatings 13 00625 g004
Figure 5. Schematic diagram of the principle of laser triangulation.
Coatings 13 00625 g005
Figure 6. Equivalent forming method of surface profile of EHLA coating.
Coatings 13 00625 g006
Figure 7. Macro-morphology of EHLA coating. (a) Macro-morphology under stable process parameters; (b) macro-morphology under fluctuating process parameters.
Coatings 13 00625 g007
Figure 8. Surface morphology represented by different values of Ssk. (a) Ssk < 0; (b) Ssk = 0; (c) Ssk: 0.2–0.5; (d) Ssk ≥ 0.5.
Coatings 13 00625 g008
Figure 9. Surface morphology with different values of Str. (a) Str is approximately 0; (b) Str is approximately 1.0.
Coatings 13 00625 g009
Figure 10. Microstructure of EHLA JG-11 coating. (a) Overall micro-morphology of coating; (b) micro-morphology of coating/substrate interface (zone Ⅰ); (c) micro-morphology of overlapping area inside the coating (zone Ⅱ); (d) micro-morphology of near-surface layer of coating (zone Ⅲ).
Coatings 13 00625 g010
Figure 11. Microhardness of the samples.
Coatings 13 00625 g011
Figure 12. Potentiodynamic polarization curves of the coatings.
Coatings 13 00625 g012
Figure 13. Micro-morphology of scratch grooves. (a) EHLA JG-11; (b) EHC.
Coatings 13 00625 g013
Figure 14. Macro-morphologies of EHLA coatings under different laser powers. (a) 3000 W; (b) 3500 W; (c) 4000 W; (d) 4300 W; (e) 4600 W; (f) 4900 W; (g) 5200 W; (h) 5500 W.
Coatings 13 00625 g014
Figure 15. Sa, Ssk, and Str as a function of laser power.
Coatings 13 00625 g015
Figure 16. Macro-morphologies of EHLA coatings under different deposition speeds. (a) 5 m/min; (b) 8 m/min; (c) 10 m/min; (d) 11 m/min; (e) 13 m/min; (f) 15 m/min; (g) 20 m/min; (h) 25 m/min.
Coatings 13 00625 g016
Figure 17. Variations of Sa, Ssk, and Str with deposition speeds.
Coatings 13 00625 g017
Figure 18. Macro-morphologies of EHLA coatings under different powder feeding speeds. (a) 20 g/min; (b) 25 g/min; (c) 30 g/min; (d) 35 g/min; (e) 40 g/min; (f) 45 g/min; (g) 50 g/min; (h) 55 g/min.
Coatings 13 00625 g018
Figure 19. Variations of Sa, Ssk, and Str with powder feeding speeds.
Coatings 13 00625 g019
Figure 20. Macro-morphologies of EHLA coatings under different overlapping ratios. (a) 40%; (b) 50%; (c) 60%; (d) 65%; (e) 70%; (f) 75%; (g) 85%; (h) 90%.
Coatings 13 00625 g020
Figure 21. Variations of Sa, Ssk, and Str with different overlapping ratios.
Coatings 13 00625 g021
Table 1. Key chemical composition of 45# steel and JG-11 powder.
MaterialMass Fraction/%
CSiMnCrNiMoBFe
45# steel0.460.270.650.230.3Bal
JG-110.190.850.317.442.321.050.85Bal
Table 2. Key process parameters of EHLA JG-11 coating.
Laser Power
(W)
Deposition Speed
(m/min)
Powder Feeding Speed
(g/min)
Overlapping Ratio
(%)
Flow of Powder Carrier Gas
(L/min)
Flow of Protect Gas
(L/min)
49001140701512
Table 3. Experiment scheme for simulating process parameter fluctuations.
No.Laser Power (W)Deposition Speed (m/min)Powder Feeding Speed (g/min)Overlapping Ratio (%)
13000114070%
23500114070%
34000114070%
44300114070%
54600114070%
64900114070%
75200114070%
85500114070%
9490054070%
10490084070%
114900104070%
124900114070%
134900134070%
144900154070%
154900204070%
164900254070%
174900112070%
184900112570%
194900113070%
204900113570%
214900114070%
224900114570%
234900115070%
244900115570%
254900114040%
264900114050%
274900114060%
284900114065%
294900114070%
304900114075%
314900114085%
324900114090%
Table 4. Fitting results of the polarization curves.
SamplesIcorr (μA/cm2)Ecorr (V)
EHLA JG-111.34−0.289
EHC10.45−0.428
Table 5. Test results of scratch grooves.
SamplesMaximum Depth of Grooves (μm)Maximum Width of Grooves (μm)Maximum Volume of Grooves (mm3)
EHLA JG-1127.33 ± 1.16237.41 ± 10.950.09 ± 0.005
EHC65.16 ± 2.06316.37 ± 13.450.29 ± 0.013
Disclaimer/Publisher’s Note: The statements, opinions and data contained in all publications are solely those of the individual author(s) and contributor(s) and not of MDPI and/or the editor(s). MDPI and/or the editor(s) disclaim responsibility for any injury to people or property resulting from any ideas, methods, instructions or products referred to in the content.

