Article

Direct Liquid Reactor-Injector of Nanoparticles: A Safer-by-Design Aerosol Injection for Nanocomposite Thin-Film Deposition Adapted to Various Plasma-Assisted Processes

by
Guillaume Carnide
1,2,3,†,
Laura Cacot
1,4,†,
Yohan Champouret
1,2,†,
Vincent Pozsgay
1,
Thomas Verdier
1,
Adèle Girardeau
1,2,3,
Marjorie Cavarroc
3,
Andranik Sarkissian
5,
Anne-Françoise Mingotaud
6,
Constantin Vahlas
7,
Myrtil Louise Kahn
2,
Nicolas Naudé
1,
Luc Stafford
4 and
Richard Clergereaux
1,*
1
Laboratory on Plasma and Conversion of Energy (LAPLACE), University of Toulouse, 31062 Toulouse, France
2
Laboratory of Coordination Chemistry (LCC) of CNRS, University of Toulouse, 31077 Toulouse, France
3
Safran Tech, Materials and Processes Department, 78114 Magny-Les-Hameaux, France
4
Department of Physics, University of Montréal, Montreal, QC H2V 0B3, Canada
5
Plasmionique Inc., Varennes, QC J3X 1S2, Canada
6
Laboratory IMRCP, University of Toulouse, CNRS, UPS, 31062 Toulouse, France
7
CIRIMAT Institute, University of Toulouse, CNRS, INPT, BP-44362, 31030 Toulouse, France
*
Author to whom correspondence should be addressed.
These authors contributed equally to this work.
Coatings 2023, 13(3), 630; https://doi.org/10.3390/coatings13030630
Submission received: 3 February 2023 / Revised: 10 March 2023 / Accepted: 12 March 2023 / Published: 16 March 2023
(This article belongs to the Special Issue Functionalities of Polymer-Based Nanocomposite Films and Coatings)

Abstract

:
The requirements of nanocomposite thin films, having non-aggregated nanoparticles homogeneously dispersed in the matrix, have been realized using a new method of Direct Liquid Reactor-Injector (DLRI) of nanoparticles. In this approach, unlike conventional aerosol-assisted plasma deposition, the nanoparticles are synthesized before their injection as an aerosol into plasma. In our experiments, we have used two different plasma reactors, namely an asymmetric low-pressure RF plasma reactor and a parallel plate dielectric barrier discharge at atmospheric pressure. Our results have shown that DLRI can be easily coupled with various plasma processes as this approach allows the deposition of high-quality multifunctional nanocomposite thin films, with embedded nanoparticles of less than 10 nm in diameter. Hence, DLRI coupled with plasma processes meets the specifications for the deposition of multifunctional coatings.

1. Introduction

Nanocomposite thin films are coatings of matrix-embedded nanoparticles targeted for their multifunctional properties. These functions can vary depending on the concentration, size, shape, and distribution of the nanoparticles, as well as the characteristics of the matrix and the interfaces, especially in the case of very small nanoparticles (i.e., when the interfaces, considered as the surface of the nanoparticles, become comparable with their volume) [1]. Usually, the methods for the preparation of nanocomposite materials are complex and should be designed specifically for each process [1,2].
Concerning plasma-assisted approaches, different processes have been developed. The injection of complex molecular precursor(s) in plasma processes is the simplest method. For example, organometallic molecules, i.e., molecular species containing metal atoms or metalloids (for example, silicon) bonded with organic compounds, are widely used as precursors for plasma enhanced chemical vapor deposition (PE-CVD). In specific conditions, it enables the formation of nanocomposite materials with nanoparticles embedded in an organic matrix [3,4]. However, the precursors must be compatible with the experimental conditions (e.g., volatile at the working pressure), as well as stable during storage, manipulation, and use, which limits the range of targeted materials.
Multifunctional nanocomposite thin films may also be prepared in multi-step processes. For example, silicon nano-crystals of 3 nm were produced by post-growth heating sub-stoichiometric silicon nitrides deposited by PE-CVD [5]. These nanoparticles can also be obtained by coupling different physical and chemical processes such as evaporation [6], sputtering [7,8,9], and nucleation in the gas phase [10]. However, all of these techniques are complex, as they require specific experimental conditions (e.g., working pressure, gas mixture, and plasma operating mode).
Recently, new attractive methods based on aerosols have been proposed [11,12]. These approaches implement liquid solutions of pre-prepared nanoparticles directly injected into the plasma in the form of liquid droplets. The aerosols can be produced by bubbling [13,14], nebulizing [15,16,17], or direct liquid injecting (DLI) [18] the liquid solution, as used in chemical vapor deposition (CVD) and atomic layer deposition (ALD) processes [19].
However, the nanoparticles in nanocomposite thin films deposited by aerosol-assisted plasma processes are usually highly aggregated [12]. Aggregation can start in the liquid solution. Hence, colloidal solutions, instead of liquid dispersions of nanoparticles [20], i.e., highly stable suspensions of non-aggregated nanoparticles, must be used. To prepare colloidal solutions, it is necessary to functionalize the nanoobjects, for example, by using ligands. However, this critical step often requires large quantities of stabilizing agents with heteroatoms (e.g., nitrogen for amines or sulfur for thiols) [21]. Therefore, the processes of colloidal solution preparation are not always “green” and can pose serious environmental hazards [22]. In addition, in conflict with the principle of atom economy [23], they introduce new species in the final process, which affect the downstream process and consequently contaminate the coatings with heteroatoms from the ligands.
Aggregation may also arise in the aerosol upon the evaporation of the liquid droplets [16]. Depending on the balance between nanoparticle diffusion in the liquid phase and the solvent evaporation rate, it leads to different types of aggregates [24]. Injected into plasma, the liquid evaporation can be enhanced due to plasma-droplet interactions [25].
Concerning aggregation, the interactions of plasma species with droplets can induce additional phenomena including droplet charging [26] as well as electrostatic droplet breakup [27,28]. The charging of droplets in plasmas also promotes their electrical confinement enhancing their residence time in the plasma volume [29]. Consequently, plasma-droplet interactions can have a significant effect, not only on the plasma behavior (e.g., electron temperatures, plasma densities, and transport properties [30,31,32,33]), but also on the plasma-deposition process (e.g., precursor fragmentation [34], thin-film deposition rates [18,35], and degree of plasma polymerization [36,37]).
Finally, although aerosol-assisted processes are simpler and more versatile than all other processes used to prepare nanocomposite thin films, they require the handling of nanoparticles, at least during the preparation of the colloidal solution, which can adversely impact human health and the environment [38]. Therefore, it is of paramount importance to develop secure processes for the formation of nanocomposite thin films.
Recently, we proposed a safer-by-design method to form small nanoparticles (<10 nm) before their injection as an aerosol in a downstream process. Called the Direct Liquid Reactor-Injector (DLRI) [39], it relies on a pulsed DLI that enables the synthesis of nanoparticles from liquid organometallic compounds before the injection of the as-prepared nanoparticles as aerosols. This study reports plasma processes coupled with DLRI for thin film deposition namely, a low-pressure RF discharge and an atmospheric-pressure dielectric barrier discharge (DBD). Focused on nanocomposite thin films based on ZnO nanoparticles embedded in diamond-like carbon (DLC) matrix, DLRI appears as a versatile, simple, economic, and environmentally friendly method that overcomes the drawbacks of the injection of liquid solutions in plasmas.

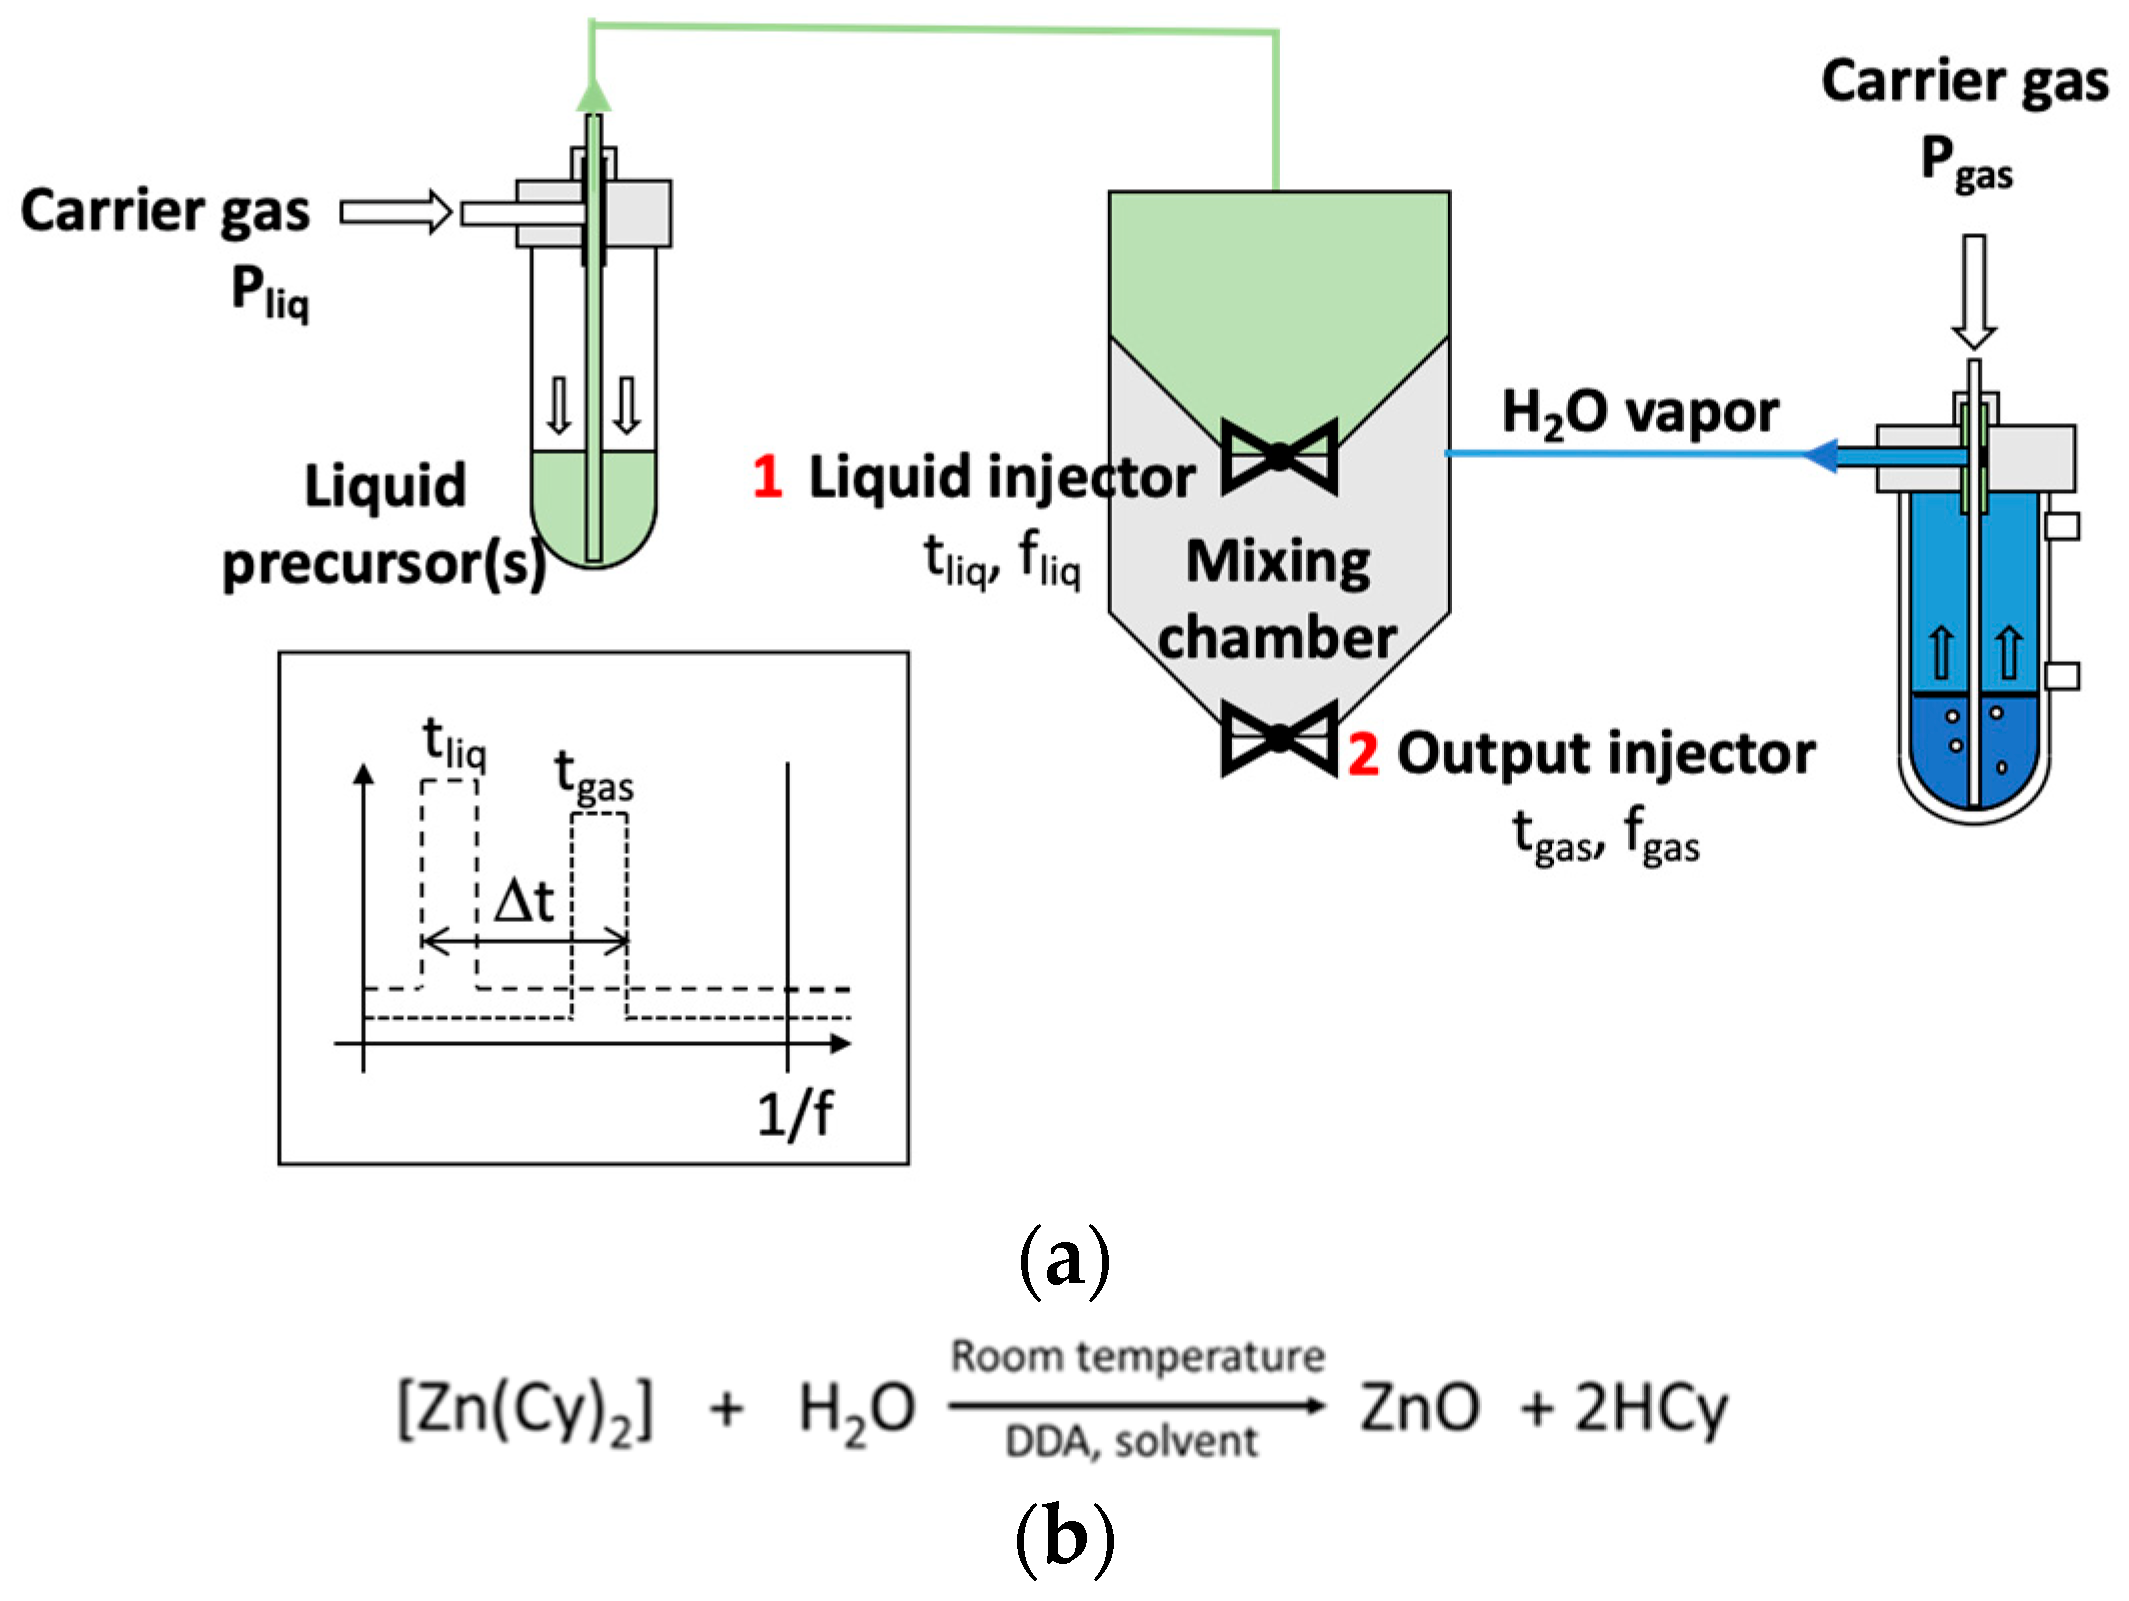
2. Materials and Methods

The DLRI setup used consisted of an Atokit injection atomizer from Kemstream, (Montpellier, France). As shown in Figure 1a, this injection-atomizer operates in two stages: (1) the pulsed injection of a liquid solution containing the organometallic precursors into a mixing chamber fed with a reactive gas leading to the formation of the targeted nanoparticles, and (2) the pulsed injection downstream of the as-synthesized nanoparticles as an aerosol. DLRI is thus a safer-by-design method for the preparation of nanoparticles containing aerosols.
In this paper, ZnO nanoparticles were targeted. The chemical reaction shown in Figure 1b is the hydrolysis of zinc dicyclohexyl, Zn(Cy)2 (from Nanomeps) [20]. The liquid phase consisted of a liquid solution of the organometallic precursor (0.025 mol.L−1) dissolved in dried pentane, with dodecylamine (DDA) used as a stabilizing agent (0.1 eq.). It was introduced (tliq = 5 ms and fliq = 1 Hz) by the liquid injector (1 in Figure 1a) in the mixing chamber and turned in a chemical reaction chamber. In parallel, water vapor was produced by bubbling a neutral gas in water, transported and mixed with the liquid droplets producing ZnO nanoparticles. The latter are then sprayed downstream (tgas = 10 ms, Δt = 2 ms, fgas = 1 Hz) by the output injector (2 in Figure 1a) [39].
To compare DLRI with other conventional aerosol-assisted methods, a colloidal solution of pre-prepared ZnO nanoparticles was injected into the plasma processes in the so-called direct liquid injection (DLI) mode. The solution consisted of a pentane solution with the same ZnO nanoparticles (6 nm in diameter, 0.025 mol.L−1, 15 mL). However, it required a much large quantity of ligands (150 times more DDA) to obtain a stable colloidal solution [40].
DLRI (and DLI) was coupled with either an asymmetric capacitively-coupled radiofrequency (RF—13.56 MHz) plasma reactor at low pressure (0.1 mbar) or a low-frequency (1 kHz) plane-to-plane dielectric barrier discharge (DBD) at atmospheric pressure [41].
At low-pressure plasma, DLRI was connected to the shower electrode system positioned 5 cm above the lower polarized electrode (30 cm in diameter). Argon (Alphagaz 1) was used as the carrier gas and also as it enables it to ignite and sustain the plasma. Different parameters were measured during deposition, including working pressure and the injected RF power (set to 100 W) from a Cesar power supply coupled with an impedance matchbox (in automatic mode).
In the atmospheric-pressure plasma, DLRI was connected to a diffuser, which was supplied with a continuous flow of nitrogen gas between the two plane-to-plane electrodes (3 cm × 3 cm) separated by a 0.1 cm gas gap. nitrogen (Alphagaz 1) used as the carrier gas was favored to work in a Townsend discharge regime [41]. Current-voltage characteristics were measured throughout the deposition process. For all conditions, the amplitude of the applied sinusoidal voltage was set to 13 kV peak-to-peak.
The nanocomposite thin films were deposited on silicon samples for ex situ analyses. The film composition was studied by infrared spectroscopy (Burker—Vertex 70, Billerica, MA, USA) in transmission mode. The film thicknesses were determined using spectroscopic ellipsometry (Semilab—SE 2000, Budapest, Hungary). By assuming a uniform multilayer structure with the thin film described by the Forouhi–Bloomer dispersion law [42] sandwiched between the silicon substrate with its native oxide (2.7 nm thick) and air (classically defined as a void in ellipsometry), the calculated Ψ-Δ angles were compared to the experimental ones and optimized by regression through a minimization of the ki2. The optical indexes (refractive index and extinction coefficient) and the thickness were then obtained. Copper grids were also coated for transmission electron microscopy (TEM) and high-resolution transmission electron microscopy (HRTEM) analyses (JEOL—JEM1011 at 100 kV, JEM 2100F (Akishima, Japan) at 200 kV, and JEM-ARM200F at 200 kV from ‘Centre de microcaractérisation Raimond Castaing’). This type of sample was only collected in low-pressure processes as the presence of metallic grids induces parasitic effects (arcing, contamination, nucleation) in the DBD. The recorded TEM images were magnified by two perpendicular sizes (denoted as d1 and d2) to characterize the sizes of the nanoparticles using the ImageJ software (freeware: https://imagej.nih.gov/ij/). Further processing of these images was conducted according to the 2D size plot method developed by Zhao et al. [16].

3. Results

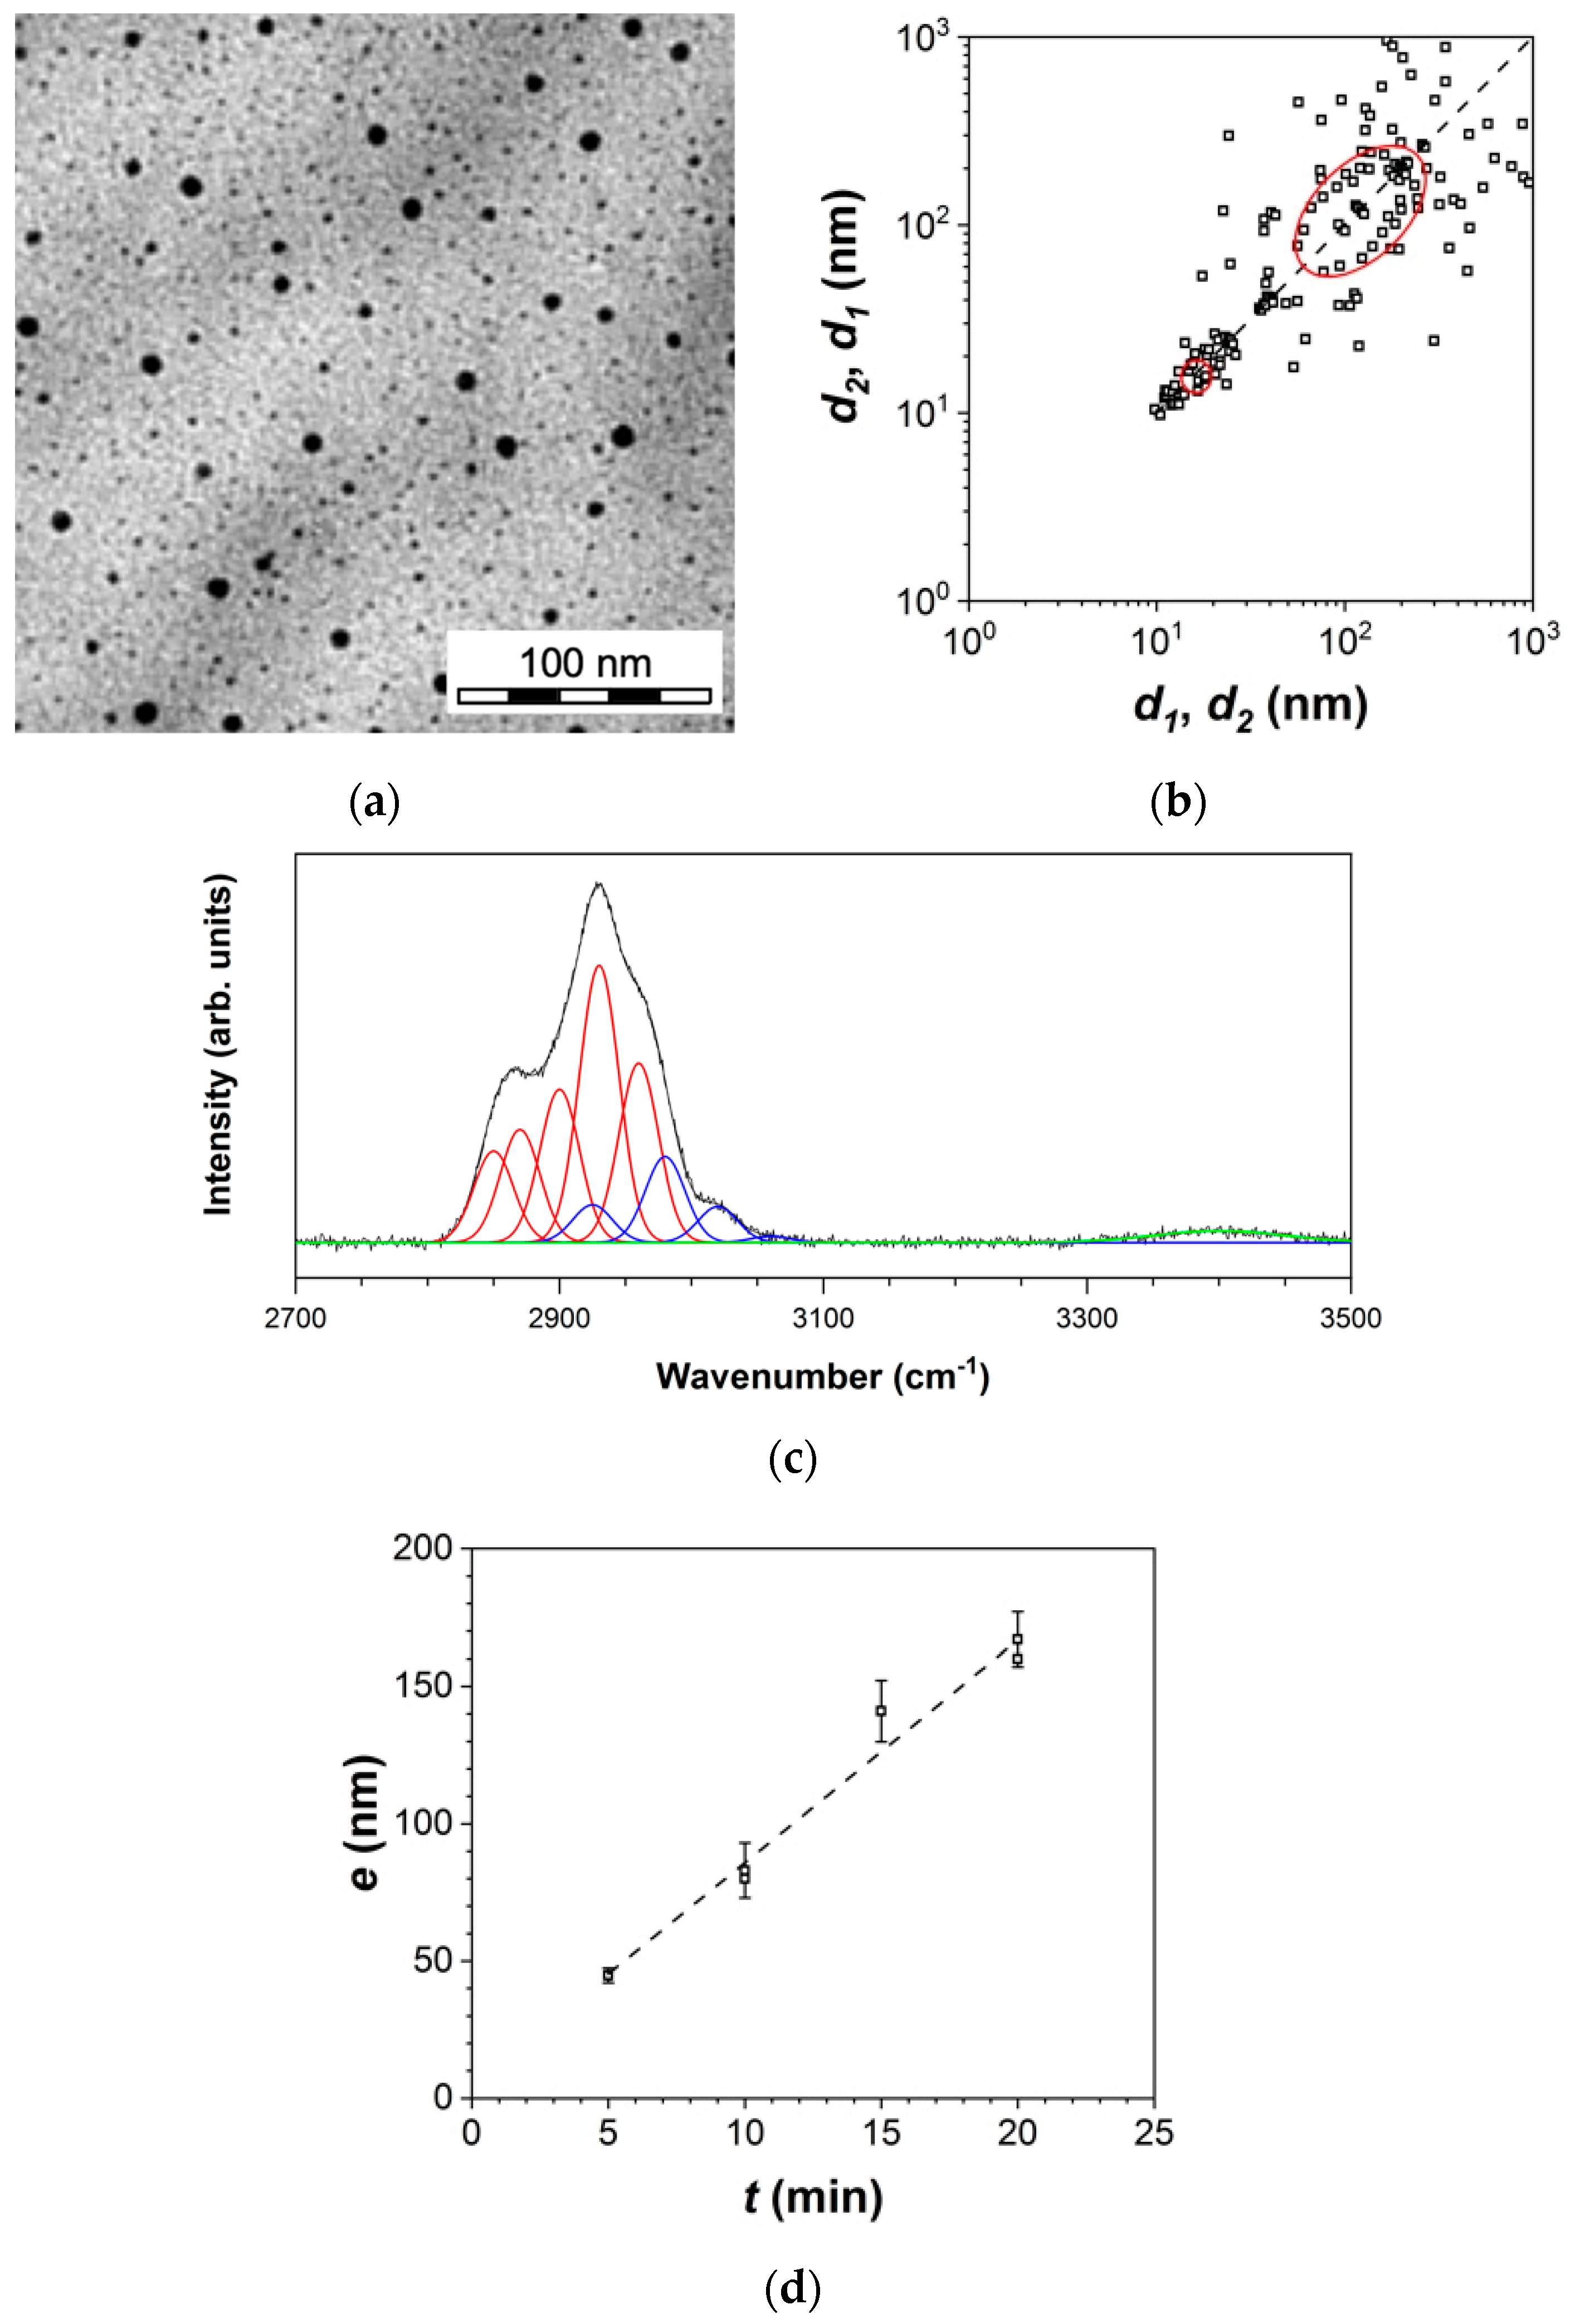
3.1. DLRI in a Low-Pressure Plasma Process

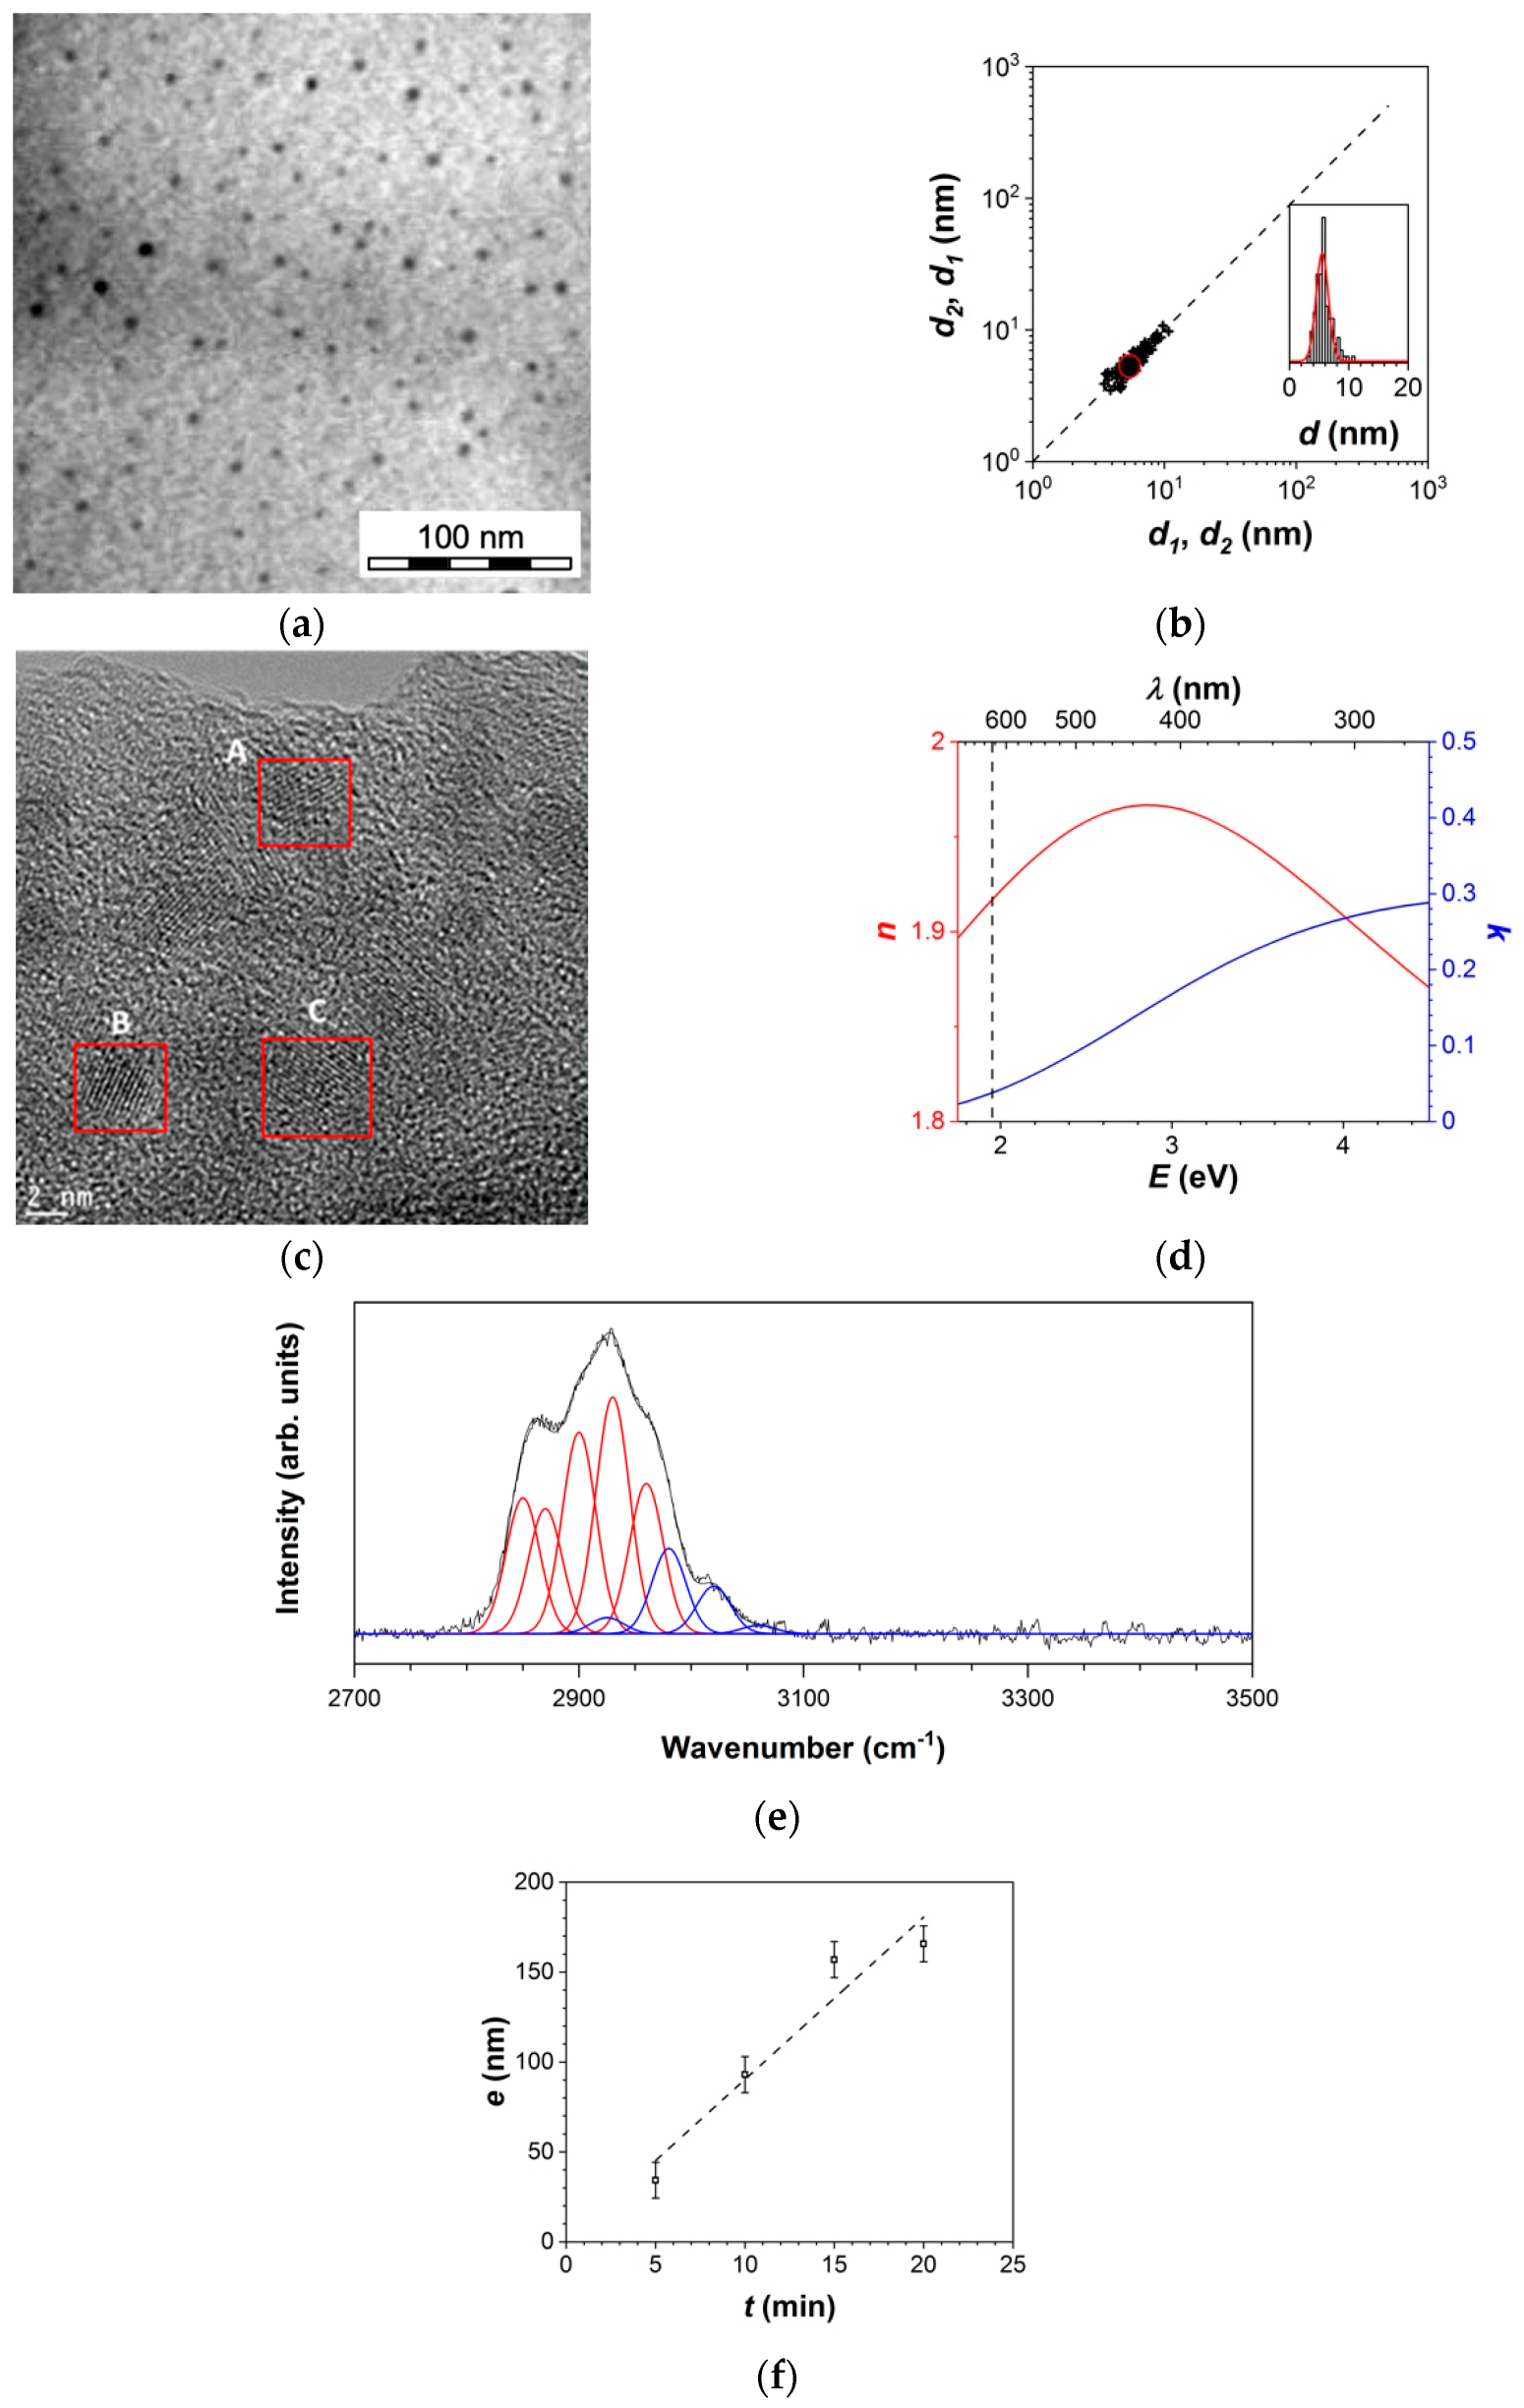
3.1.1. Thin Film Characteristics

Figure 2 reports the characteristics of the nanocomposite thin films obtained by coupling the DLRI with a low-pressure RF discharge. From the typical TEM image reported in Figure 2a, the film is made of nanoparticles homogeneously dispersed in the matrix, the 2D size plot reported in Figure 2b shows the presence of a single population of isotropic nanoparticles, with an average diameter of 6  ±   2   nm . The nanoparticles in the film (A, B and C in Figure 2c) are crystalline: the distances determined by Fourier transformation of the HRTEM images correspond to the (100), (002), (101), and (201) interplanar distances anticipated for wurtzite ZnO (0.281, 0.260, 0.247, and 0.136 nm, respectively) [20]. The TEM images also gave an estimate of ZnO nanoparticles volume fraction of ~5 vol%. With such a load of ZnO nanoparticles, neither the optical indexes obtained by spectroscopic ellipsometry (Figure 2d) nor the IR spectra could be used to further investigate the presence of ZnO nanoparticles. However, both are characteristics of the matrix structure. With optical indexes within (1.92 + 0.04 i) at 1.96 eV (Figure 2d), it consists of a diamond-like carbon (DLC) with a high concentration of hydrogen and a rich sp3 carbon composition [42,43]. This is in good agreement with the IR spectrum on the 2700–3500 cm−1 range (Figure 2e) and its deconvolution that shows a more abundant contribution of sp3 CHx (in red with the stretching bands corresponding to CH3/~2870 cm−1 (symmetrical), and ~2960 cm−1 (asymmetrical), CH2/~2850 cm−1 (sym.) and ~2930 cm−1 (asym.) and CH/~2900 cm−1) than of sp2 CHx (in blue) whether in olefinic (CH2/~2925 cm−1 (sym.) and ~2980 cm−1 (asym.) and CH/~3020 cm−1) or aromatic (CH/~3060 cm−1) compounds [44].
Hence, ZnO/DLC nanocomposite thin films with small (6 nm in diameter) and spatially dispersed nanoparticles are formed with the DLRI coupled with a low-pressure plasma.

3.1.2. Mass Balance

To further characterize the plasma deposition process, the mass balance was estimated. The first point deals with the yield of conversion of pentane into DLC thin film. This is defined as the ratio of the plasma-deposited thin film volume to the precursor injection rate [45]. Figure 2d shows that the film thickness is linear with the deposition time, yielding a thin-film deposition rate of 9.2 ± 1.8 nm.min−1. Compared to the liquid injection rate of 360 µL.min−1 at f = 1 Hz, and considering the deposition rate constant on the whole electrode of 300 mm in diameter, the precursor conversion yield was 0.3 vol%. This value is several orders of magnitude higher than the ones reported for PE-CVD processes in hydrocarbon gases estimated in the 10−4 to 10−2 vol% range [46,47].
For the nanocomposite thin film composition, the theoretical volume fraction of ZnO nanoparticles was estimated. Since the stoichiometry of the reaction in Figure 1b was 1:1 [20] (i.e., one mole of ZnO is produced per mole of [Zn(Cy)2]), the theoretical number of ZnO nanoparticles produced and injected per pulse depends directly on the injection parameters, especially the liquid flow rate and the concentration of nanoparticles in the initial solution. Theoretically, the number of 6 nm ZnO nanoparticles produced per pulse at the Zn(Cy)2 concentration of 0.025 mol.L−1 and liquid flow rate of ~6 µL per pulse was 1.1 × 10¹⁵. Considering that the nanocomposite thin film composition is uniform on the whole electrode surface, the DLRI process yielded a theoretical volume fraction of nanoparticles of ~16 vol%, which was about three times greater than the value determined experimentally. This discrepancy indicates that the transport of nanoparticles to the substrate was incomplete. Thus, the plasma was affecting the ballistic transport of the ZnO nanoparticles from the output of the DLRI to the bottom electrode.
As reported, in dusty plasmas [48], a single object immersed in a collisionless plasma acquires a negative charge given theoretically by the orbital motion limited model (OML). The time needed to charge this nanoparticle may be estimated by:
τ ch = λ D   r N P · ω p  
where λD is the Debye length, ωp the ion plasma frequency, and rNP the nanoparticle size [49]. For instance, in a low-pressure argon plasma with Te = 1 eV, Ti = 300 K, and ne = ni = 1015 m−3 [48], a nanoparticle of rNP ≈ 6 nm will be charged within  τ ch  ≈ 2 ms. If this charging time is less than the residence time of the ZnO nanoparticles in the plasma, then the nanoparticles will be efficiently confined in the plasma volume.
The residence time can be defined as the time to travel the interelectrode distance. The aerosol velocity needs determining. The aerosol produced at low pressure (0.1 mbar) was then imaged by light scattering (Figure 3a), the light intensity recorded by a fast camera being characteristic of the aerosol transport. At different positions, zi, from the injector exhaust, the time evolution of light intensity was extracted and compared to the pulsed injection (Figure 3b). The plot position, zi, versus delay, ti, gave an estimate of the aerosol velocity of ~6 m.s−1 (Figure 3c). Considering that this velocity is comparable for all the species in the aerosol, i.e., the small nanoparticles (diameter < 10 nm) and the micrometric droplets, it leads to a residence time in the interelectrode distance of ~10 ms.
The charging time of nanoparticles was therefore slightly below the residence time, suggesting that most of the ZnO nanoparticles can efficiently be charged. Consequently, a few will be transported to the substrate, while others will undoubtedly remain electrostatically confined in the plasma volume until the next injection pulse (the pulsed flow is evacuating the nanoparticles from the discharge). This explains why the experimentally measured volume fraction of nanoparticles in the final coating is less than the theoretically calculated value.

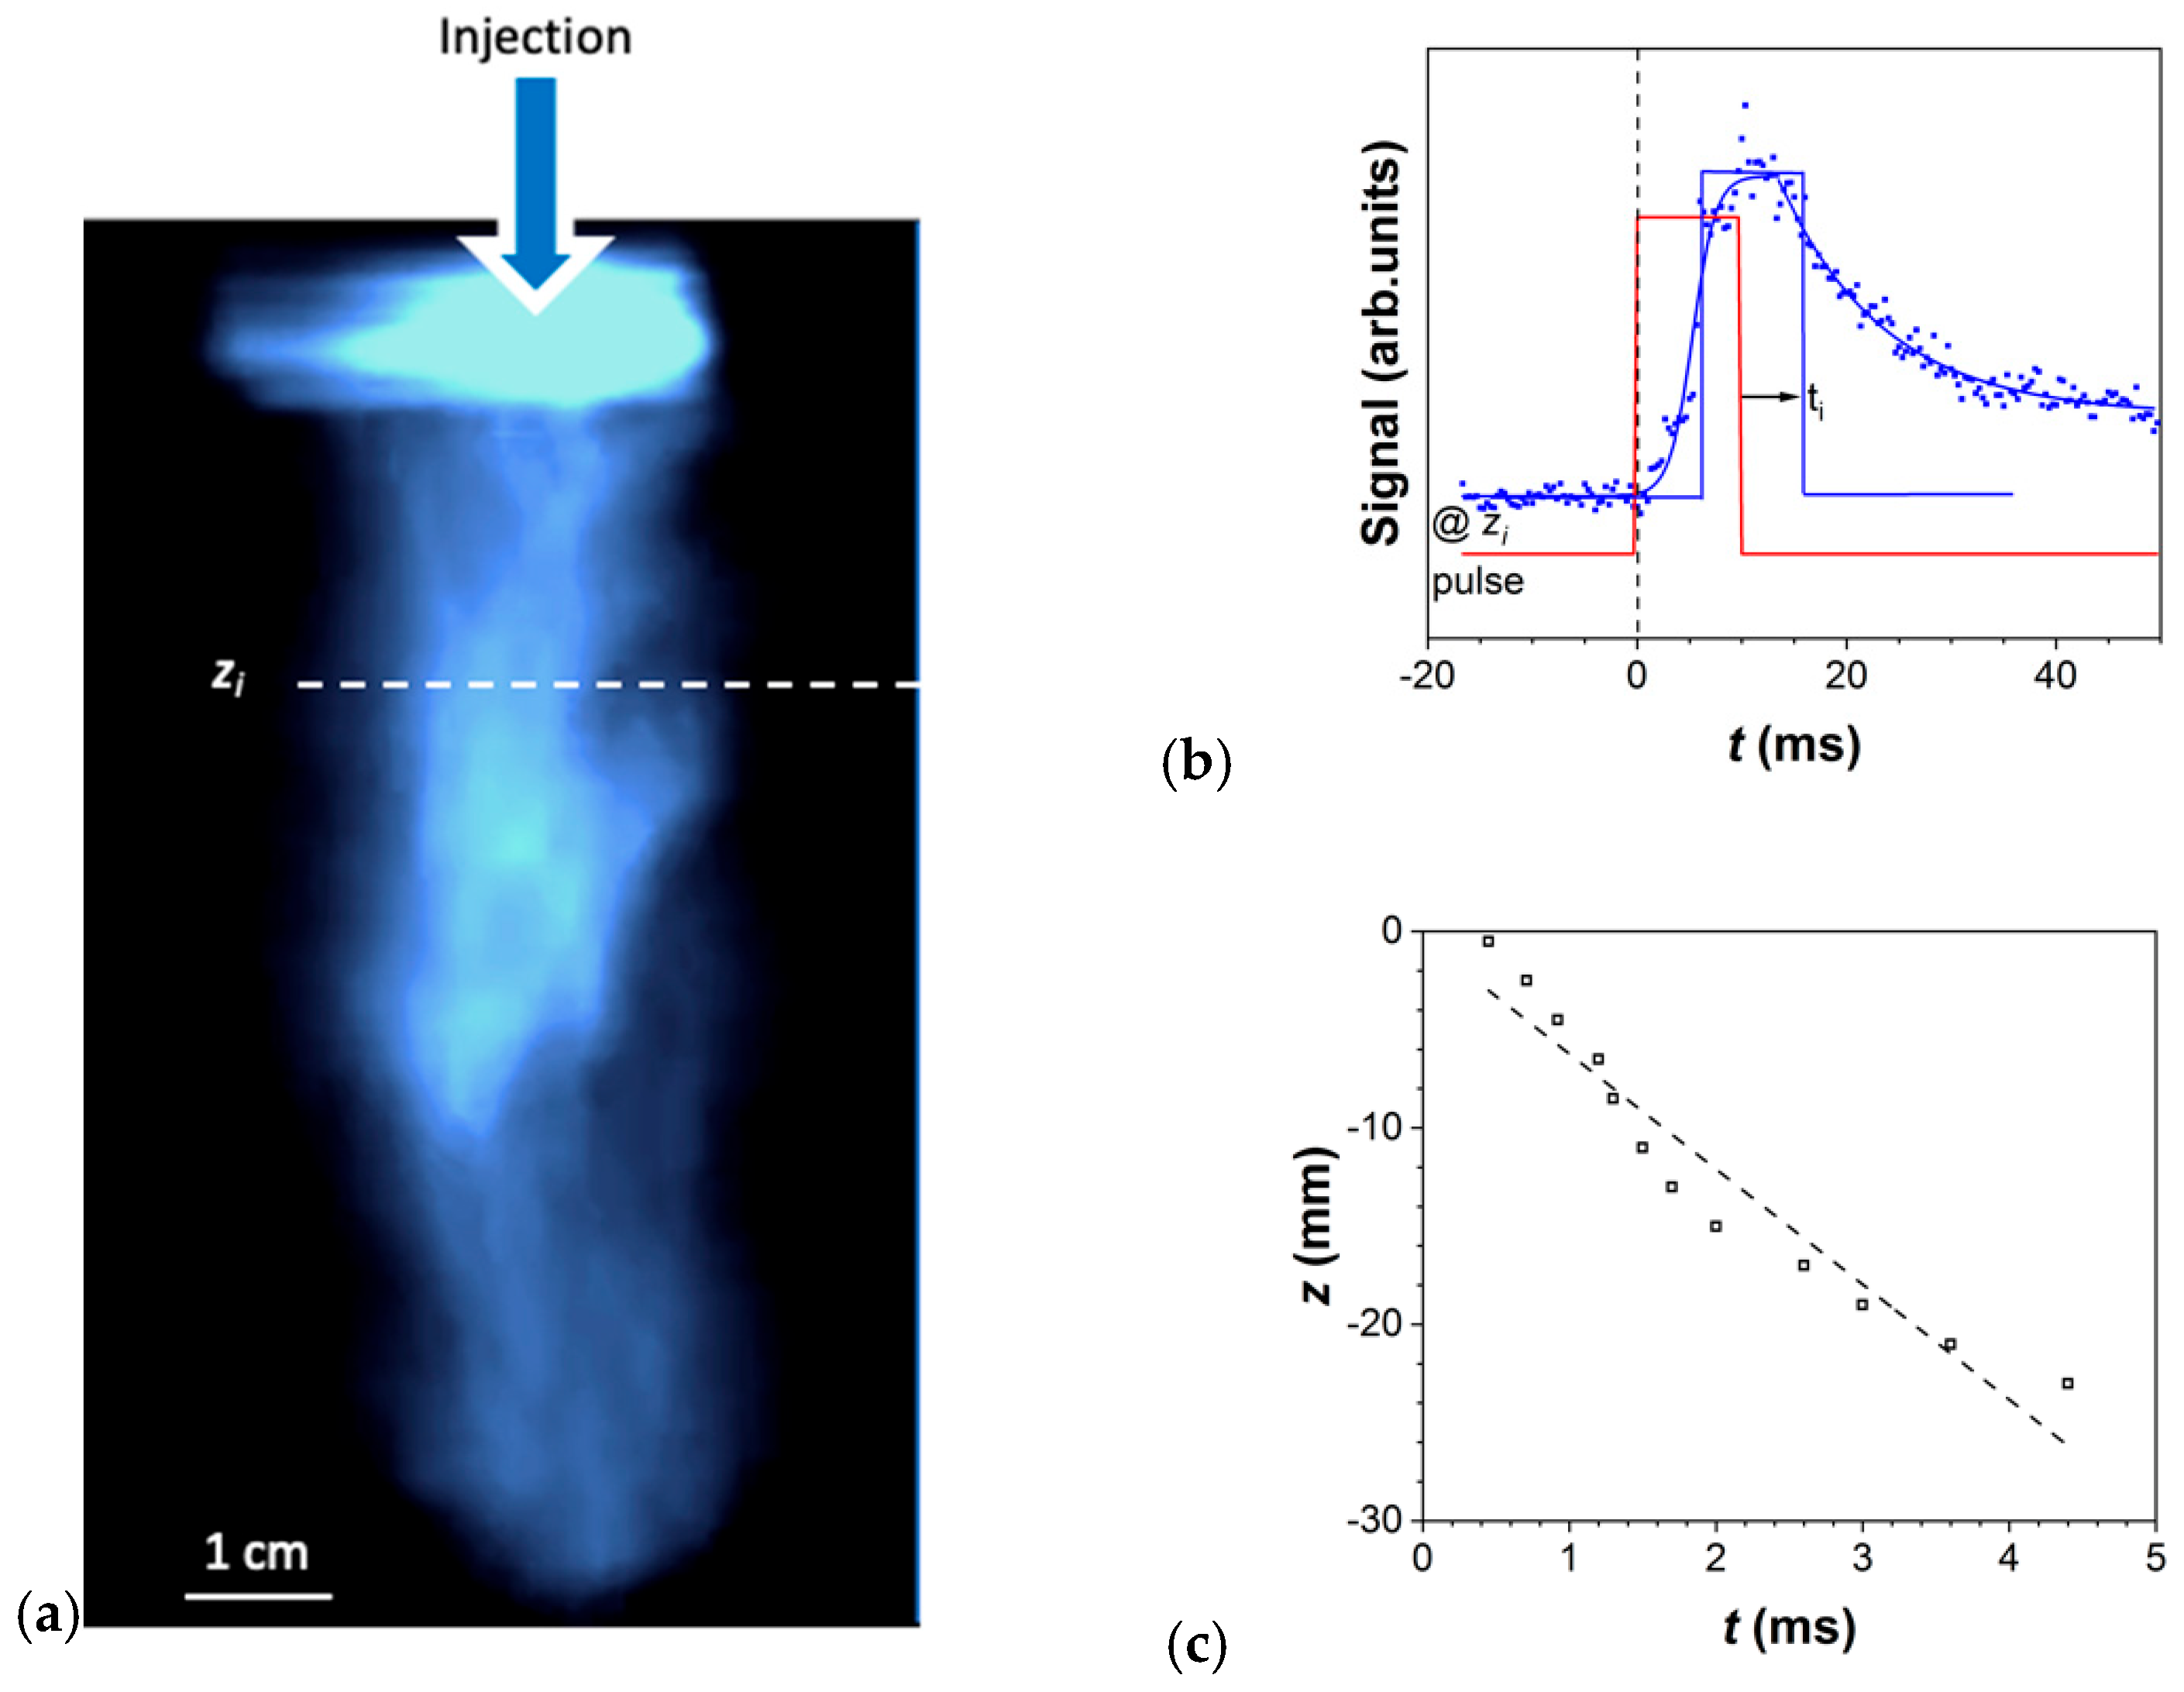
3.1.3. Plasma Behavior

To confirm the confinement of nanoparticles in the plasma volume, the electrical parameters of the discharge were measured. Figure 4a depicts the temporal evolution profile of the power injected in the discharge during a single DLRI pulse (red curve): the injected power decreased down to 30 W within 200–300 ms, until it reached the set value of 100 W just before the injection of the subsequent pulse. Part of this temporal variation is linked to the sudden pressure rise due to the pulsed operation of the DLRI (Figure 4b) [50]. However, this slow return to equilibrium also implied a temporal response of the plasma to the presence of droplets and/or nanoparticles in the plasma volume.
The temporal evolution profile of injected power during a pulse with DLRI was then compared to the one of a pulse with DLI of pure pentane (Figure 4a). Unlike the profile obtained with the DLRI (red curve), the injected power profile corresponding to the DLI (blue curve) attained the set power value faster (~800 ms after pulse injection) and remained constant until the next pulse is injected. The injection of the set power was then more difficult in the presence of nanoparticles (DLRI) than without (DLI), as underlined by the black curve in Figure 4a corresponding to the difference between the two profiles. ZnO nanoparticles were then confined in the plasma volume. They were introducing additional plasma losses (affecting the densities as well as energy distribution functions) as discussed in dusty plasmas [48] that further modified the plasma impedance, and thus the injection of power.
Hence, these results were consistent with the mass balance: both were revealing that the process of nanocomposite thin film deposition by coupling DLRI with a low-pressure plasma was controlled by the plasma through its role in the charging and electrostatic confinement of nanoparticles.

3.1.4. DLRI vs. DLI of Colloidal Solutions

Lastly, a colloidal solution was injected in DLI mode into the low-pressure plasma. Figure 5a presents a typical TEM image of the nanocomposite thin film produced. Again, it showed ZnO nanoparticles homogeneously dispersed in the matrix. However, the 2D size plot, shown in Figure 5b, exhibited two populations of nanoparticles with average sizes of 17 ± 1 and 118 ± 26 nm, respectively. Compared to the initial diameter of nanoparticles in the solution (8 ± 2 nm) [39], it shows that aggregation occurred in this process. Finally, the IR spectrum on the 2700–3500 cm−1 range reported in Figure 5c exhibited the same characteristics of diamond-like carbon (DLC), the spectrum deconvolution showing slight differences in the matrix composition. In addition, a small quantity of amines is detected (Figure 5d; absorption band near 3400 cm−1). These groups originate from the DDA ligand whose concentration in the colloidal solution injected by DLI (15.0 eq.) is much greater than that with the DLRI (0.1 eq.). Therefore, the ligands (DDA) injected in abundance in the DLI mode in the plasma were significantly contaminating the final coating, which may impact its final properties.
However, neither the deposition rate with a deposition rate of 8.1 ± 0.5 nm.min−1 (Figure 5d) nor the volume fraction of nanoparticles estimated at ~5 vol% (Figure 5a) significantly changed. To summarize, DLRI not only led to highly dispersed nanoparticles in the unmodified-pure-DLC matrix process but it was also limiting the aggregation of nanoparticles during the coating’s preparation.
The aggregation of nanoparticles in liquid droplets depends on the solvent, as well as on the concentration of the nanoparticles in the droplets [24]. To have a rough estimation of this mechanism, we considered that the aerosol was a distribution of droplets with a diameter Dd and that each droplet dried and formed an aggregate of diameter DAG. The volume of aggregated ZnO nanoparticles in the volume of injected solution is then only a function of the concentration, the molar mass and the mass density of ZnO, and the theoretical average size of the aggregates formed upon the complete evaporation of the solvent in the liquid droplet is:
D AG = c Z n O   N P · M Z n O   ρ Z n O   1 / 3 · D d
Under the experimental conditions used herein, the factor relating DAG and Dd was 0.03. Since the aggregated ZnO nanoparticles size DAG was of the order of a few hundred nm (Figure 5a), one thus expected that the droplet size Dd at the exhaust of the DLI and DLRI was of a few micrometers.
Nevertheless, since DLI and DLRI were injecting the same concentration of ZnO nanoparticles, it was expected that aggregation would occur in both cases. However, no aggregation was observed with DLRI. In addition, size distributions of nanoparticles obtained with DLRI (Figure 2b) were comparable to the ones obtained in batch synthesis [51]. This suggests that the droplets produced with DLRI were smaller than those injected with DLI. Indeed, while a fog of droplets was easily observed by light scattering with DLI, there was no backscattered light detected with DLRI. Based on the Mie scattering theory, it reveals that the number and/or size of droplets in the DLRI-produced aerosols were much smaller than those obtained with DLI. Therefore, pentane evaporation occurred sooner in the DLRI than in the DLI, as discussed by Carnide et al. [40]. This result was ascribed to exothermic hydrolysis of the organometallic precursor [51]. This means that chemical reaction has also a significant effect on aerosol characteristics, on the plasma process and then on nanocomposite thin film deposition.
Overall, nanocomposite thin films with small (<10 nm) and highly dispersed nanoparticles were produced by coupling DLRI with a low-pressure plasma. In the DLRI system, the film structure was controlled by the chemical reaction, the aerosol type, and the balance of forces on droplets and nanoparticles in the plasma.

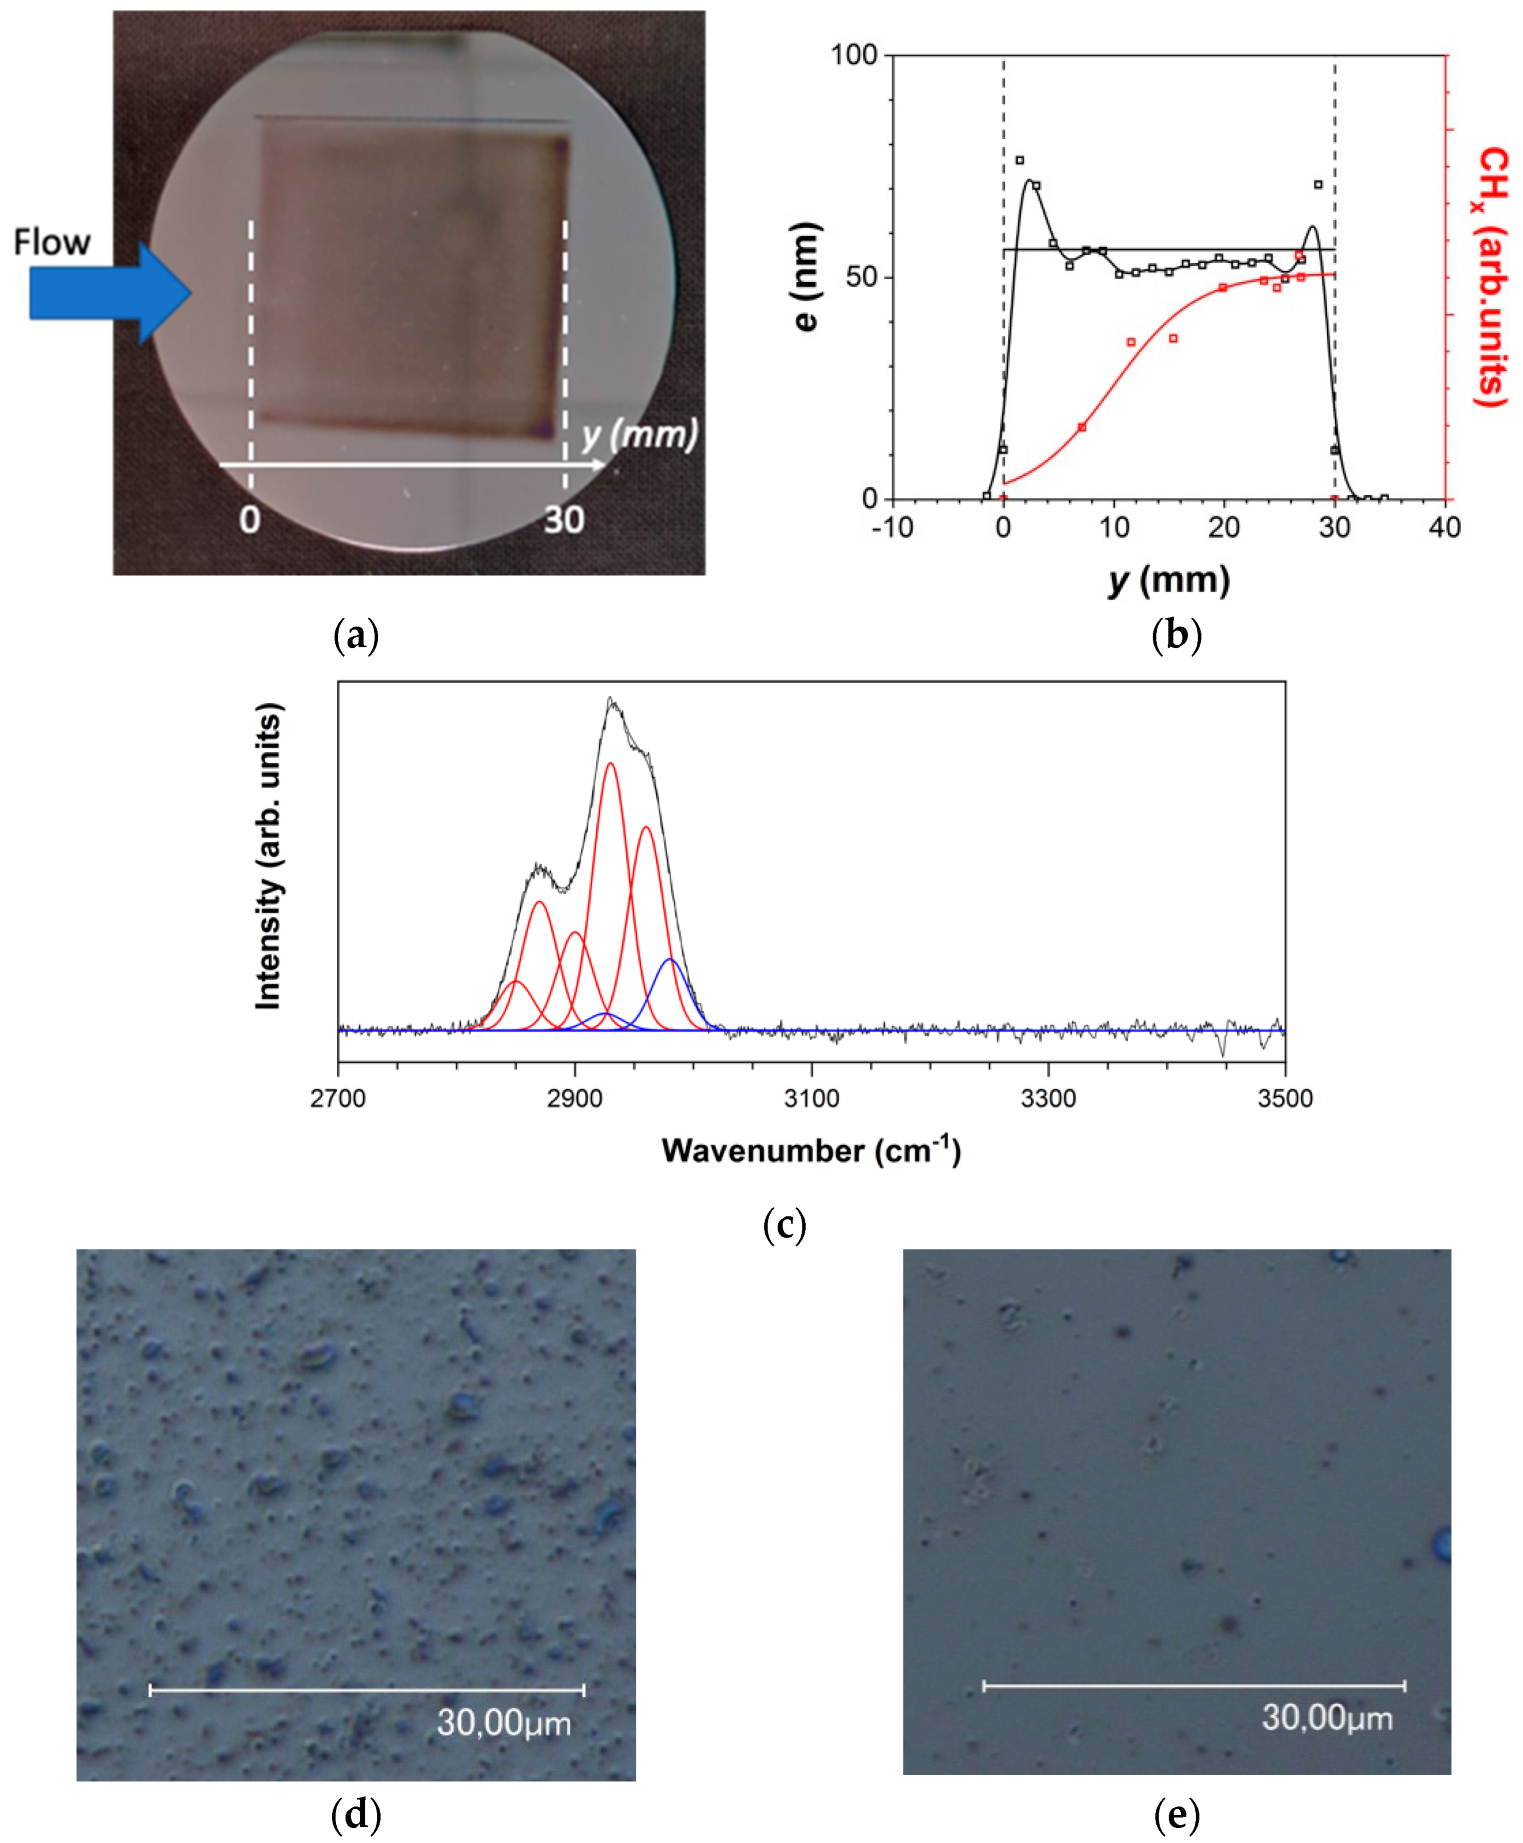
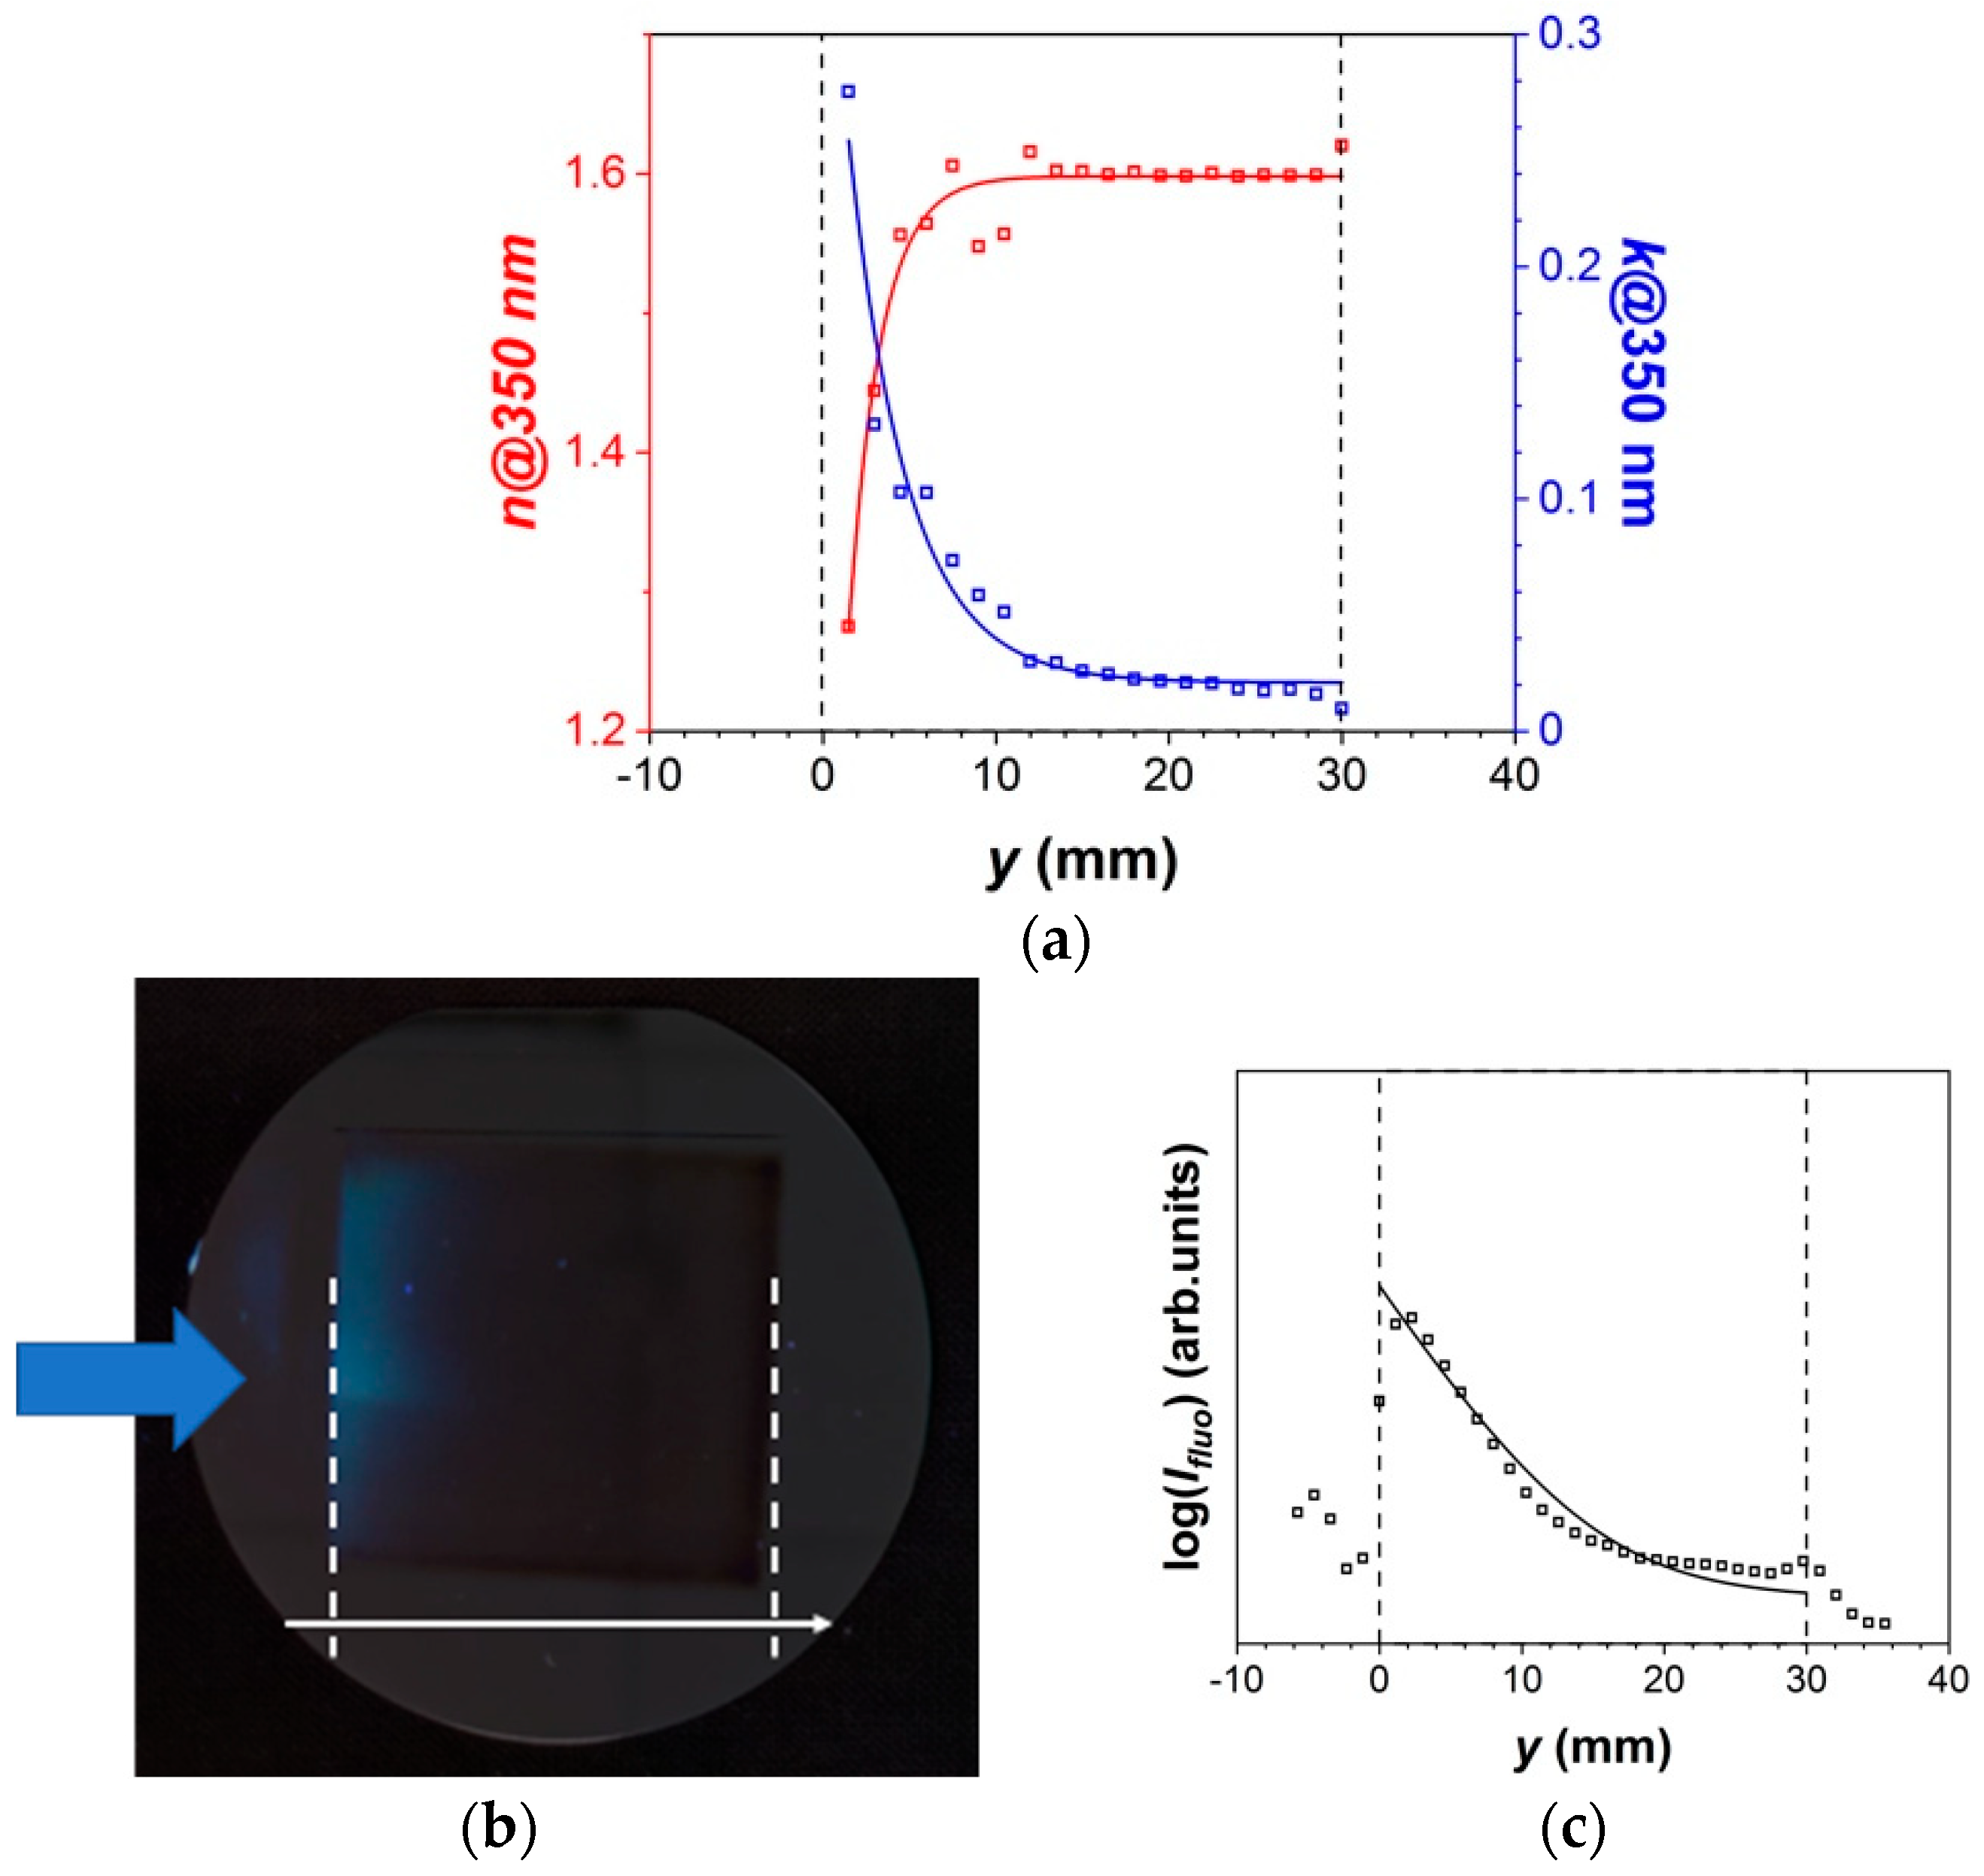
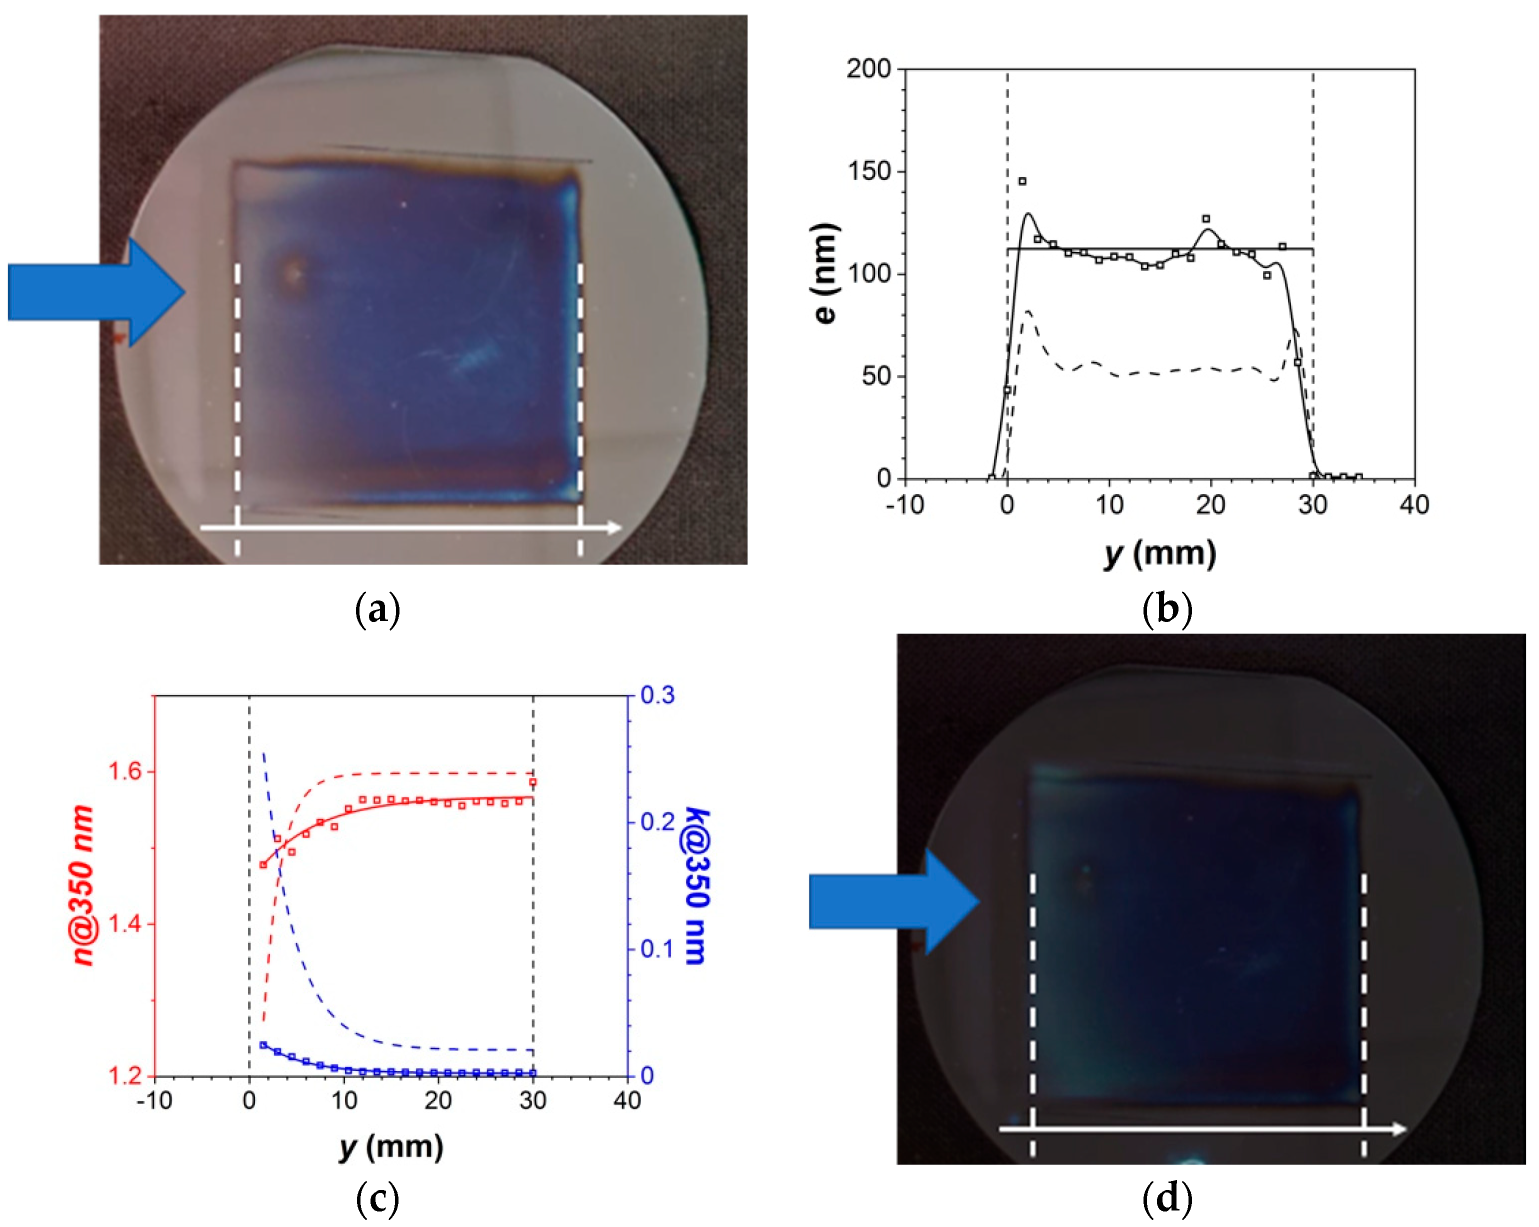
3.2. DLRI in an Atmospheric-Pressure Plasma Process

3.2.1. Thin Film Characteristics

As shown in Figure 6, nanocomposite thin films were also obtained at atmospheric pressure. Figure 6a reports a picture of the coatings deposited on a 4″ (10.16 cm) silicon wafer. The latter was limited to the electrode region (3 cm × 3 cm) [18]. Since no significant deposit was observed outside the discharge region, this reveals that thin-film deposition was resulting from charged species: the aerosol (droplets and nanoparticles) must be charged following their interactions with charged species in the plasma and transported towards the top and bottom electrodes by the low-frequency electric field [18].
Considering a homogeneous film with the same composition and a small volume fraction of ZnO nanoparticles, an ellipsometric model of the plasma-deposited layer was defined for different positions along the gas flow lines in the discharge cell. As shown in Figure 6b, the film thickness obtained by regression was quite homogeneous along the discharge-struck area of ~60 nm corresponding to a deposition rate of ~15 nm.min−1, with slightly thicker coatings at the entrance and exit of the electrodes. However, compared to the gradient observed on Figure 6a, the thin-film composition must be different along the gas flow lines (from left to right).
To investigate the matrix composition, IR spectra were recorded at different points along the gas flow lines. First, as shown in Figure 6c, the matrix was also DLC. CHx bands between 2800 and 3000 cm−1 were integrated on the different spectra and reported as a function of position as a relative matrix thickness. In contrast with the spectroscopic ellipsometry results, the thickness of the matrix was growing along the sample and homogeneous only over the last 20 mm of the discharge-struck area (Figure 6b). This means, first, that matrix deposition did not take place homogeneously along the discharge zone [18]. It suggests that droplets efficiently confined in the discharge were transported along the gas flow lines leading to a matrix gradient, with a more prominent deposition near the exit. Secondly, it suggests a more prominent volume fraction of ZnO nanoparticles close to the entrance of the discharge than at the exit. Unlike pentane, the results presented in Figure 6 indicate that nanoparticles were not transported in liquid droplets and, consequently, were deposited earlier on the substrate. To confirm this, optical microscope images were collected. The results are shown in Figure 6d,e. At the entrance, Figure 6d reveals the presence of numerous submicron structures without a discernable matrix coating between them. In contrast, close to the exit, Figure 6e shows that the number of features strongly decreased. Hence, ZnO nanoparticles were mostly deposited at the entrance, while the matrix deposition took place progressively towards the exit of the DBD.
To confirm these differences in transport between ZnO nanoparticles and the precursors of the matrix, optical measurements were performed. First, ellipsometric data were recorded as a function of position along the discharge cell. The refractive indexes at 350 nm were determined and reported in Figure 7a. Both n and k presented high gradients from the entrance to the exit of the deposit area. For n, the variation from 1.25 to 1.6 agreed very well with the porous aspect of the plasma-deposited coating observed in Figure 6d and e and discussed by Martin et al. [52]. As for k, the behavior was in good agreement with an evolution of the film composition, i.e., of small ZnO nanoparticles being more abundant at the entrance of the discharge cell than at the exit. Indeed, at small scale (<10 nm), these nanoparticles are highly absorbent at 350 nm [53].
The sample was finally exposed to UV illumination (350 nm). Loop-winded Figure 7b shows, the plasma-deposited film exhibiting typical fluorescence of ultrafine (<10 nm) ZnO wurzite nanoparticles (fluorescence at 580 nm) [53]. The plot of the integrated fluorescence signal as a function of position along the gas flow lines (Figure 7c) confirms that nanoparticles were mostly deposited at the entrance of the discharge cell.
Hence, DLRI coupled with atmospheric pressure discharges enabled the formation of ZnO/DLC nanocomposite thin films. However, in contrast with the low-pressure plasma processes, the deposition of the nanoparticles and their spatial dispersion were more evidently controlled by the process conditions (gas flow and electric field amplitude, with both driving the balance of forces on droplets and nanoparticles in the plasma).

3.2.2. Mass Balance

Using the same previous method, for a liquid injection rate of 360 µL.min−1 at f = 1 Hz, and a deposition rate of 15 nm.min−1, the yield of pentane conversion into thin film was lower than at low-pressure of ~0.004 vol% but similar to hydrocarbon thin film deposition. For example, Sarra Bournet et al. [54] obtained a deposition rate up to 60 nm.min−1 in discharge produced with 400 ppm of C2H4 in N2 and a gas flow rate of 1 L.min−1 corresponding to a conversion yield up to 0.015 vol%. Over the range of experimental conditions investigated, the low yield indicates that many droplets remained trapped in the gas gap over multiple low-frequency cycles until they were pushed out of the DBD cell by the gas flow [18]. Indeed, at Te = 1 eV, Ti = 300 K, and ne = ni ~ 1012 cm−3 in filamentary discharges operated in nitrogen [55], a steady-state charge of ~104 electrons per 10 µm pentane droplet (and thus a mass-to-charge ratio ~102 kg/C) can be estimated [16,56]. Consequently, the amplitude of oscillations of the charged droplet in a 4 kV.mm−1 electric field (recall that the electric field is linked to the amplitude of the gas voltage after discharge breakdown and not to the externally applied voltage [57]) at 1 kHz became comparable to the gas gap (~1 mm). Therefore, droplets much smaller than 10 µm were easily collected within half-period of the electric field whereas much larger ones could escape the DBD cell without being deposited [18].
In contrast, the transport and deposition of nanoparticles sprayed with the DLRI were independent of the matrix deposition, leading to a more efficient deposition at the entrance of the discharge. Indeed, a 5 nm nanoparticle will be charged within 5 ns. Since this charging time was much shorter than (i) the period of the applied electric field (1 ms at 1 kHz), and (ii) the gas residence times linked to pulsed (>3 ms) and continuous carrier gas injections (>50 ms), one could safely assume that all nanoparticles were charged [36]. For a steady-state charge of ~5 electrons per 5 nm ZnO nanoparticles (and thus a mass-to-charge ratio ~10−4 kg/C), the amplitude of oscillations of charged nanoparticles in a 4 kV.mm−1 electric field at 1 kHz became much more than to the gas gap (~1 mm). Hence, all nanoparticles would rapidly be transported towards the substrate by the low-frequency electric field as discussed by other authors during the nebulization of colloidal solutions in low-frequency DBDs [15,16]. Hence, DLRI yielded a theoretical volume fraction ranging from 100 to 0 vol% from the entrance to the exit of the discharge cell. Charging in low-frequency DBD thus enabled to maximisation of the deposition of ZnO nanoparticles. Of note, though this process was limited to the discharge entrance, the volume fraction of nanoparticles could be smoothened out by using a substrate displacement method as described by Massines et al. [55] for typical PE-CVD processes at atmospheric pressure.

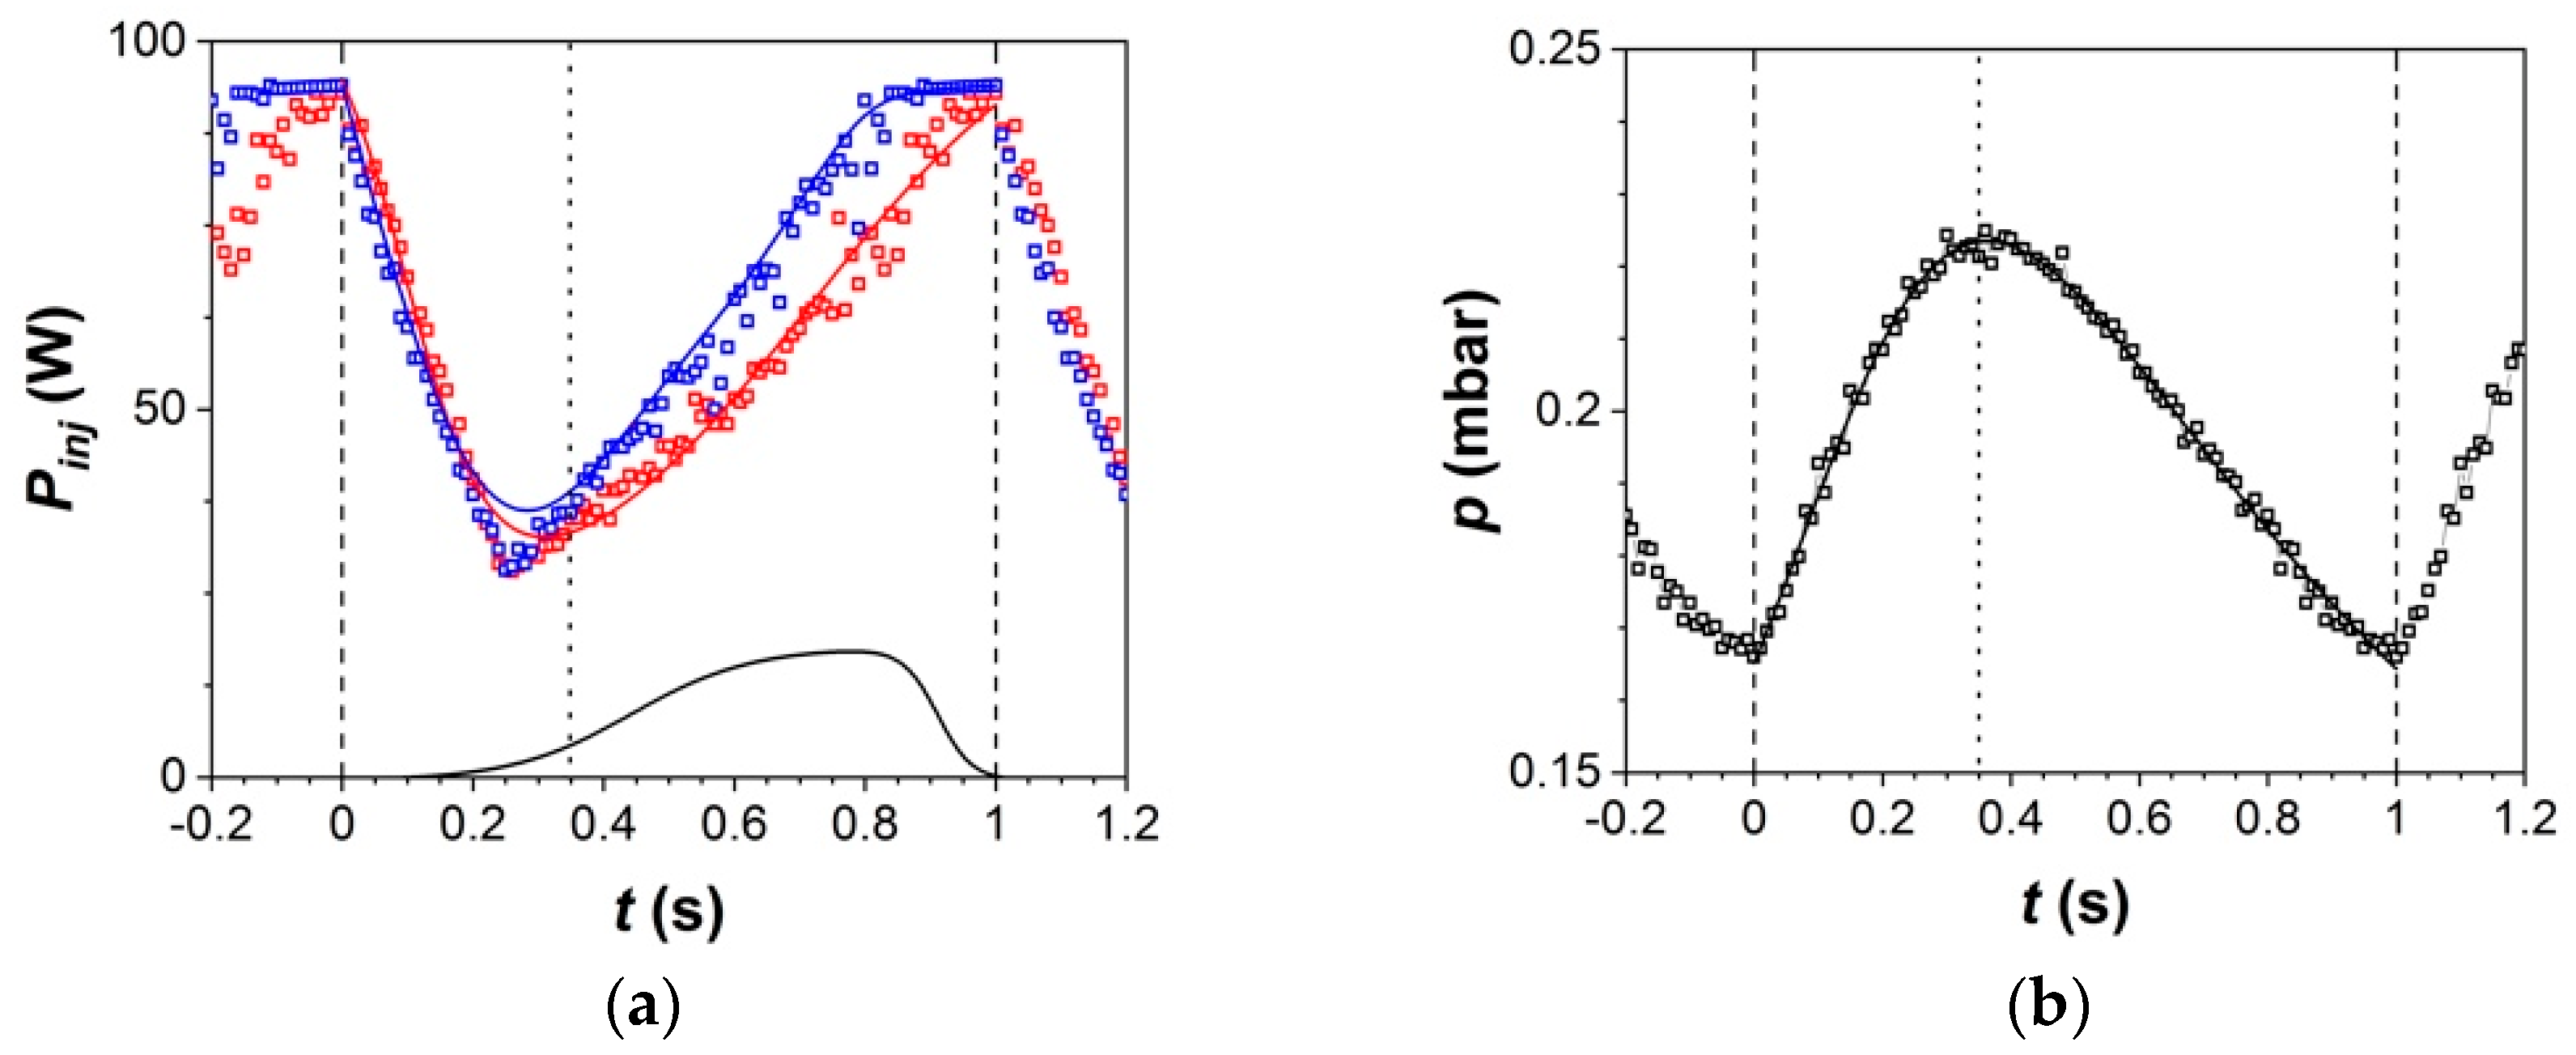
3.2.3. Plasma Behavior

Electrical measurements were conducted to assess the plasma behavior with the DLRI operating at 1 Hz.
Over the range of experimental conditions investigated, discharges operated in nominally pure nitrogen were representative of a homogeneous Townsend discharge with a single peak per half-cycle of the applied voltage [57]. However, as soon as the first pulse of precursor was injected, the onset in Figure 8 shows that the discharge became filamentary, i.e., that micro-discharge channels perpendicular to the electrodes were formed [41]. This is typically accompanied by a significant rise in the power injected into the DBD, as confirmed by Figure 8. This transition from a homogeneous to filamentary regime was attributed to the presence of nanoparticles and droplets in the discharge [18].
In addition, once the discharge has transited to the filamentary regime (t = 0 in Figure 8), the surface power converged to a constant, here, around 0.25 W.cm−2. Hence, in such conditions, variations in discharge properties appeared very fast after injection of the ZnO-containing pentane aerosol and then reached steady-state after a small number of cycles. Of note, the time resolution was too small to discuss the mechanisms arising at the pulse scale and the possible temporal variations from one pulse to another.

3.2.4. DLRI vs. DLI of Colloidal Solution

Nanocomposite thin films were finally deposited by DLI of a colloidal solution into the plane-to-plane DBD. As shown in Figure 9a, the coating deposited on a 4″ (10.16 cm) silicon wafer remained limited to the electrode region (3 cm × 3 cm) but seemed more homogeneous along the gas flow. Considering that thin-film deposition resulted from the charging of the droplets in the aerosol and their transport towards the top and bottom electrodes by the low-frequency electric field [18], it suggests that the aerosol, i.e., the liquid droplets size, was more homogeneous in that case. In addition, as shown in Figure 9b, the film thickness was constant along the discharge-struck area. In contrast with DLRI, it was 2 times higher with the colloidal solution. For the same liquid injection rate, this suggests that the conversion yield was at least 2 times higher with the colloidal solution.
However, as reported in Figure 9c,d, the gradients of n and k and, consequently, the fluorescence previously attributed to ZnO nanoparticles, were smaller in this case. This reveals that the volume fraction was lower than in the DLRI mode. Indeed, trapped in the liquid droplets, ZnO nanoparticles transport and deposition were directly controlled by the droplet transport and deposition [36], i.e., the transport of charged liquid droplets and their evacuation by the carrier gas. The mass balance thus led to a smaller volume fraction of ZnO nanoparticles [36]. Overall, nanocomposite thin films with ultrafine nanoparticles (<10 nm) were prepared by coupling a DLRI system with atmospheric-pressure plasmas. The structure of the deposited film was controlled by the balance of forces (controlling) acting on the droplets and the nanoparticles.

4. Conclusions

By coupling the DLRI system with plasmas, multifunctional nanocomposite thin films were prepared. This robust and fast approach promotes the implementation of nanocomposite thin films in innovative materials and devices to meet current and future societal needs. DLRI is a simple, economic, and environmentally friendly method of nanoparticle injection that enables the control and monitoring of nanoparticle size and morphology. It is also robust and reproducible and, thus, can be easily scaled up and adapted to various plasma processes. Herein, we showed that the nanocomposite thin films prepared by DLRI with low-pressure RF discharge or atmospheric-pressure dielectric barrier discharge exhibited a uniform distribution of ultrafine ZnO nanoparticles (<10 nm). The nanoparticles were formed via a one-pot reaction of [Zn(Cy)2] with water in presence of DDA and pentane was used as a precursor to form the DLC matrix. In addition, to minimize nanoparticle handling and suppress the aggregation of nanoparticles, the processes proposed in this study reduced the emission of the nanoparticle synthesis byproducts by involving these compounds in the matrix deposition. Considering the broad array of organometallic compounds that can be used in DLRI/plasma deposition processes, a wide variety of nanocomposite thin film materials may be prepared using this pulsed injection aerosol method.

5. Patents

DLRI application to dry processes was patented in EP 3275839/WO 2018019862.

Author Contributions

The experiments were performed by G.C., L.C., Y.C. and A.G., V.P. and T.V. developed the high-speed camera experiments. C.V., A.-F.M., M.L.K., N.N., L.S. and R.C. provided their expertise on DLI, soft matter, organometallic chemistry, nanocomposites, and plasma processes. M.C. and A.S. provided their expertise on plasma deposition processes. All authors participated in the discussion and interpretation of data and contributed to the final manuscript. All authors have read and agreed to the published version of the manuscript.

Funding

This work was financially supported by the Centre National de la Recherche Scientifique (CNRS), the STAE-RTRA foundation (Toulouse, France), the latter under the RTRA-STAE/2014/P/VIMA/12 project grant, the National Science and Engineering Research Council in the context of the Alliance project grant, and Prima-Québec. CNRS is also acknowledged for the MITI funding of the Nano online project. Financial support from the CNRS, Université de Montréal and Université de Toulouse III—Paul Sabatier through their contributions to the International Research Network on Controlled Multifunctional Nanomaterials (IRN NMC) is also acknowledged.

Institutional Review Board Statement

Not applicable.

Informed Consent Statement

Not applicable.

Data Availability Statement

Not applicable.

Acknowledgments

Fermat Federation of Research is acknowledged for providing the high-speed camera.

Conflicts of Interest

The authors declare no conflict of interest.

References

  1. Hanemann, T.; Szabó, D.V. Polymer-nanoparticle composites: From synthesis to modern applications. Materials 2010, 3, 3468–3517. [Google Scholar] [CrossRef]
  2. Sanchez, C.; Julián, B.; Belleville, P.; Popall, M. Applications of hybrid organic–inorganic nanocomposites. J. Mater. Chem. 2005, 15, 3559–3592. [Google Scholar] [CrossRef]
  3. Jeong, Y.-M.; Lee, J.-K.; Ha, S.-C.; Kim, S.H. Fabrication of cobalt-organic composite thin film via plasma-enhanced chemical vapor deposition for antibacterial applications. Thin Solid Film. 2009, 517, 2855–2858. [Google Scholar] [CrossRef]
  4. Jiang, X.; Klages, C.-P. Synthesis of diamond/β-SiC composite films by microwave plasma assisted chemical vapor deposition. Appl. Phys. Lett. 1992, 61, 1629–1631. [Google Scholar] [CrossRef]
  5. Perraud, S.; Quesnel, E.; Parola, S.; Barbé, J.; Muffato, V.; Faucherand, P.; Morin, C.; Jarolimek, K.; Van Swaaij, R.A.C.M.M.; Zeman, M.; et al. Silicon nanocrystals: Novel synthesis routes for photovoltaic applications. Phys. Status Solidi A 2013, 210, 649–657. [Google Scholar] [CrossRef]
  6. Sattler, K.; Mühlbach, J.; Recknagel, E. Generation of metal clusters containing from 2 to 500 atoms. Phys. Rev. Lett. 1980, 45, 821–824. [Google Scholar] [CrossRef]
  7. Millière, L.; Makasheva, K.; Laurent, C.; Despax, B.; Boudou, L.; Teyssedre, G. Silver nanoparticles as a key feature of a plasma polymer composite layer in mitigation of charge injection into polyethylene under dc stress. J. Phys. D Appl. Phys. 2015, 49, 015304. [Google Scholar] [CrossRef]
  8. Drabik, M.; Hanus, J.; Kousal, J.; Choukourov, A.; Biederman, H.; Slavinska, D.; Mackova, A.; Pesicka, J. Composite TiOx/hydrocarbon plasma polymer films prepared by magnetron sputtering of TiO2 and poly (propylene). Plasma Process. Polym. 2007, 4, 654–663. [Google Scholar] [CrossRef]
  9. Drewes, J.; Vahl, A.; Carstens, N.; Strunskus, T.; Polonskyi, O.; Faupel, F. Enhancing composition control of alloy nanoparticles from gas aggregation source by in operando optical emission spectroscopy. Plasma Process. Polym. 2021, 18, 2000208. [Google Scholar] [CrossRef]
  10. Calafat, M.; Yuryev, P.; Drenik, A.; Slim, A.; Clergereaux, R. Carbon Nanoparticle/Hydrogenated Amorphous Carbon Composite Thin Films Formed in ECR Plasma. Plasma Process. Polym. 2011, 8, 401–408. [Google Scholar] [CrossRef]
  11. Palumbo, F.; Porto, C.L.; Fracassi, F.; Favia, P. Recent advancements in the use of aerosol-assisted atmospheric pressure plasma deposition. Coatings 2020, 10, 440. [Google Scholar] [CrossRef]
  12. Mitronika, M.; Granier, A.; Goullet, A.; Richard-Plouet, M. Hybrid approaches coupling sol–gel and plasma for the deposition of oxide-based nanocomposite thin films: A review. SN Appl. Sci. 2021, 3, 1–23. [Google Scholar] [CrossRef]
  13. Collette, S.; Hubert, J.; Batan, A.; Baert, K.; Raes, M.; Vandendael, I.; Daniel, A.; Archambeau, C.; Terryn, H.; Reniers, F. Photocatalytic TiO2 thin films synthesized by the post-discharge of an RF atmospheric plasma torch. Surf. Coat. Technol. 2016, 289, 172–178. [Google Scholar] [CrossRef]
  14. Borella, M.; Plissonnier, M.; Belmonte, T. PECVD Synthesis of Polysiloxane-Like Thin Films with Very Low Contact Angle Hysteresis. Plasma Process. Polym. 2007, 4, S771–S775. [Google Scholar] [CrossRef]
  15. Brunet, P.; Rincón, R.; Margot, J.; Massines, F.; Chaker, M. Deposition of homogeneous carbon-TiO2 composites by atmospheric pressure DBD. Plasma Process. Polym. 2017, 14, 1600075. [Google Scholar] [CrossRef]
  16. Profili, J.; Levasseur, O.; Blaisot, J.-B.; Koronai, A.; Stafford, L.; Gherardi, N. Nebulization of nanocolloidal suspensions for the growth of nanocomposite coatings in dielectric barrier discharges. Plasma Process. Polym. 2016, 13, 981–989. [Google Scholar] [CrossRef]
  17. Magnan, R.; Clergereaux, R.; Villeneuve-Faure, C.; Lantin, B.; Carnide, G.; Raynaud, P.; Naudé, N. Aerosol assisted atmospheric pressure plasma jet for a high deposition rate of silica-like thin films. Eur. Phys. J. Appl. Phys. 2022, 97, 37. [Google Scholar] [CrossRef]
  18. Cacot, L.; Carnide, G.; Kahn, M.; Clergereaux, R.; Naudé, N.; Stafford, L. Kinetics driving thin-film deposition in dielectric barrier discharges using a direct liquid injector operated in a pulsed regime. J. Phys. D Appl. Phys. 2022, 55, 475202. [Google Scholar] [CrossRef]
  19. Palgrave, R.G.; Parkin, I.P. Aerosol assisted chemical vapor deposition using nanoparticle precursors: A route to nanocomposite thin films. J. Am. Chem. Soc. 2006, 128, 1587–1597. [Google Scholar] [CrossRef]
  20. Rubio-Garcia, J.; Coppel, Y.; Lecante, P.; Mingotaud, C.; Chaudret, B.; Gauffre, F.; Kahn, M. One-step synthesis of metallic and metal oxide nanoparticles using amino-PEG oligomers as multi-purpose ligands: Size and shape control, and quasi-universal solvent dispersibility. Chem. Commun. 2011, 47, 988–990. [Google Scholar] [CrossRef]
  21. Ramirez, E.; Jansat, S.; Philippot, K.; Lecante, P.; Gomez, M.; Masdeu-Bulto, A.; Chaudret, B. Influence of organic ligands on the stabilization of palladium nanoparticles. J. Organomet. Chem. 2004, 689, 4601–4610. [Google Scholar] [CrossRef]
  22. Anastas, P.; Eghbali, N. Green chemistry: Principles and practice. Chem. Soc. Rev. 2010, 39, 301–312. [Google Scholar] [CrossRef] [PubMed]
  23. Trost, B.M. Atom economy—A challenge for organic synthesis: Homogeneous catalysis leads the way. Angew. Chem. Int. Ed. Engl. 1995, 34, 259–281. [Google Scholar] [CrossRef]
  24. Archer, J.; Walker, J.; Gregson, F.; Hardy, D.; Reid, J.P. Drying kinetics and particle formation from dilute colloidal suspensions in aerosol droplets. Langmuir 2020, 36, 12481–12493. [Google Scholar] [CrossRef]
  25. Ogawa, D.; Saraf, I.; Sra, A.; Timmons, R.; Goeckner, M.; Overzet, L. The direct injection of liquid droplets into low pressure plasmas. J. Vac. Sci. Technol. A Vac. Surf. Film. 2009, 27, 342–351. [Google Scholar] [CrossRef]
  26. Borra, J.-P. Review on water electro-sprays and applications of charged drops with focus on the corona-assisted cone-jet mode for High Efficiency Air Filtration by wet electro-scrubbing of aerosols. J. Aerosol Sci. 2018, 125, 208–236. [Google Scholar] [CrossRef]
  27. Potočňáková, L.; Synek, P.; Hoder, T. Viscous droplet in nonthermal plasma: Instability, fingering process, and droplet fragmentation. Phys. Rev. E 2020, 101, 063201. [Google Scholar] [CrossRef]
  28. Coppins, M. Electrostatic breakup in a misty plasma. Phys. Rev. Lett. 2010, 104, 065003. [Google Scholar] [CrossRef]
  29. Rojo, M.; Glad, X.; Margot, J.; Dap, S.; Clergereaux, R. Charging and heating processes of dust particles in an electron cyclotron resonance plasma. Plasma Sources Sci. Technol. 2019, 28, 085004. [Google Scholar] [CrossRef]
  30. Tardiveau, P.; Marode, E. Point-to-plane discharge dynamics in the presence of dielectric droplets. J. Phys. D Appl. Phys. 2003, 36, 1204–1211. [Google Scholar] [CrossRef]
  31. Garofano, V.; Berard, R.; Boivin, S.; Joblin, C.; Makasheva, K.; Stafford, L. Multi-scale investigation in the frequency domain of Ar/HMDSO dusty plasma with pulsed injection of HMDSO. Plasma Sources Sci. Technol. 2019, 28, 055019. [Google Scholar] [CrossRef]
  32. Chouteau, S.; Mitronika, M.; Goullet, A.; Richard-Plouet, M.; Granier, A.; Stafford, L. Kinetics driving nanocomposite thin film deposition in misty plasma processes. J. Phys. D Appl. Phys. 2022, 55, 505303. [Google Scholar] [CrossRef]
  33. Stancampiano, A.; Gallingani, T.; Gherardi, M.; Machala, Z.; Maguire, P.; Colombo, V.; Pouvesle, J.; Robert, E. Plasma and aerosols: Challenges, opportunities and perspectives. Appl. Sci. 2019, 9, 3861. [Google Scholar] [CrossRef] [Green Version]
  34. Garofano, V.; Berard, R.; Glad, X.; Joblin, C.; Makasheva, K.; Stafford, L. Time-resolved analysis of the precursor fragmentation kinetics in an hybrid PVD/PECVD dusty plasma with pulsed injection of HMDSO. Plasma Process. Polym. 2019, 16, 1900044. [Google Scholar] [CrossRef] [Green Version]
  35. Clergereaux, R.; Escaich, D.; de Larclause, I.; Bernecker, B.; Raynaud, P. Plasma deposition of carbon layer: Correlations between plasma parameters, film structure and properties. Diam. Relat. Mater. 2006, 15, 888–892. [Google Scholar] [CrossRef]
  36. Cacot, L.; Carnide, G.; Kahn, M.; Naudé, N.; Stafford, L.; Clergereaux, R. Soft polymerization of hexamethyldisiloxane by coupling pulsed direct-liquid injections with dielectric barrier discharge. Plasma Process. Polym. 2023, 20, e2200165. [Google Scholar] [CrossRef]
  37. Hegemann, D.; Nisol, B.; Gaiser, S.; Watson, S.; Wertheimer, M.R. Energy conversion efficiency in low-and atmospheric-pressure plasma polymerization processes with hydrocarbons. Phys. Chem. Chem. Phys. 2019, 21, 8698–8708. [Google Scholar] [CrossRef]
  38. Kraegeloh, A.; Suarez-Merino, B.; Sluijters, T.; Micheletti, C. Implementation of safe-by-design for nanomaterial development and safe innovation: Why we need a comprehensive approach. Nanomaterials 2018, 8, 239. [Google Scholar] [CrossRef] [Green Version]
  39. Carnide, G.; Champouret, Y.; Vallapil, D.; Vahlas, C.; Mingotaud, A.; Clergereaux, R.; Kahn, M. Secured Nanosynthesis–Deposition Aerosol Process for Composite Thin Films Incorporating Highly Dispersed Nanoparticles. Adv. Sci. 2023, 10, 2204929. [Google Scholar] [CrossRef]
  40. Levasseur, O.; Stafford, L.; Gherardi, N.; Naudé, N.; Beche, E.; Esvan, J.; Blanchet, P.; Riedl, B.; Sarkissian, A. Role of substrate outgassing on the formation dynamics of either hydrophilic or hydrophobic wood surfaces in atmospheric-pressure, organosilicon plasmas. Surf. Coat. Technol. 2013, 234, 42–47. [Google Scholar] [CrossRef] [Green Version]
  41. Naudé, N.; Cambronne, J.; Gherardi, N.; Massines, F. Electrical model and analysis of the transition from an atmospheric pressure Townsend discharge to a filamentary discharge. J. Phys. D Appl. Phys. 2005, 38, 530. [Google Scholar] [CrossRef]
  42. Hong, J.; Goullet, A.; Turban, G. Ellipsometry and Raman study on hydrogenated amorphous carbon (a-C:H) films deposited in a dual ECR-rf plasma. Thin Solid Film. 1999, 352, 41–48. [Google Scholar] [CrossRef]
  43. Dowling, D.; Donnelly, K.; Monclus, M.; McGuinness, M. The use of refractive index as a measure of diamond-like carbon film quality. Diam. Relat. Mater. 1998, 7, 432–434. [Google Scholar] [CrossRef]
  44. Lazar, G.; Zellama, K.; Vascan, I.; Stamate, M.; Lazar, I.; Rusu, I. Infrared absorption properties of amorphous carbon films. J. Optoelectron. Adv. Mater. 2005, 7, 647–652. [Google Scholar]
  45. Simonnet, C.; Parmar, D.; Zavvou, Z.; Aussonne, A.; Girardot, A.; Pozsgay, V.; Verdier, T.; Carnide, G.; Kahn, M.; Stafford, L.; et al. Pulsed-aerosol-assisted low-pressure plasma deposition of diamond-like carbon coatings. J. Vac. Sci. Technol. A Vac. Surf. Film. 2023. submitted. [Google Scholar]
  46. Pastol, A.; Catherine, Y. Optical emission spectroscopy for diagnostic and monitoring of CH4 plasmas used for a-C:H deposition. J. Phys. D Appl. Phys. 1990, 23, 799. [Google Scholar] [CrossRef]
  47. Peter, S.; Graupner, K.; Grambole, D.; Richter, F. Comparative experimental analysis of the a-C:H deposition processes using CH4 and C2H2 as precursors. J. Appl. Phys. 2007, 102, 053304. [Google Scholar] [CrossRef]
  48. Berndt, J.; Kovačević, E.; Stefanović, I.; Stepanović, O.; Hong, S.; Boufendi, L.; Winter, J. Some Aspects of Reactive Complex Plasmas. Contrib. Plasma Phys. 2009, 49, 107–133. [Google Scholar] [CrossRef]
  49. Laguardia, L.; Cremona, A.; De Angeli, M.; Lazzaro, E.; Ratynskaia, S.; Passoni, M.; Dellasega, D.; Gervasini, G.; Grosso, G.; Shiavone, R. Formation of dust in low-pressure magnetized hydrocarbon plasmas. New J. Phys. 2011, 13, 063006. [Google Scholar] [CrossRef]
  50. Sadek, T.; Vinchon, P.; Durocher-Jean, A.; Carnide, G.; Kahn, M.; Clergereaux, R.; Stafford, L. Time-resolved analysis of the electron temperature in RF magnetron discharges with a pulsed gas injection. Atoms 2022, 10, 147. [Google Scholar] [CrossRef]
  51. Monge, M.; Kahn, M.; Maisonnat, A.; Chaudret, B. Room-Temperature Organometallic Synthesis of Soluble and Crystalline ZnO Nanoparticles of Controlled Size and Shape. Angew. Chem. Int. Ed. 2003, 42, 5321–5324. [Google Scholar] [CrossRef]
  52. Martin, S.; Massines, F.; Gherardi, N.; Jimenez, C. Atmospheric pressure PE-CVD of silicon based coatings using a glow dielectric barrier discharge. Surf. Coat. Technol. 2004, 177, 693–698. [Google Scholar] [CrossRef]
  53. Kahn, M.L.; Cardinal, T.; Bousquet, B.; Monge, M.; Jubera, V.; Chaudret, B. Optical properties of zinc oxide nanoparticles and nanorods synthesized using an organometallic method. ChemPhysChem 2006, 7, 2392–2397. [Google Scholar] [CrossRef]
  54. Sarra-Bournet, C.; Gherardi, N.; Glénat, H.; Laroche, G.; Massines, F. Effect of C2H4/N2 ratio in an atmospheric pressure dielectric barrier discharge on the plasma deposition of hydrogenated amorphous carbon-nitride films (a-C:N:H). Plasma Chem. Plasma Process. 2010, 30, 213–239. [Google Scholar] [CrossRef]
  55. Massines, F.; Sarra-Bournet, C.; Fanelli, F.; Naudé, N.; Gherardi, N. Atmospheric pressure low temperature direct plasma technology: Status and challenges for thin film deposition. Plasma Process. Polym. 2012, 9, 1041–1073. [Google Scholar] [CrossRef]
  56. de Mejanes, N.; Profili, J.; Babaei, S.; Naudé, N.; Stafford, L. Refined analysis of current–voltage characteristics in Townsend dielectric barrier discharges in nitrogen at atmospheric pressure. J. Phys. D Appl. Phys. 2020, 54, 095204. [Google Scholar] [CrossRef]
  57. Naudé, N.; Cambronne, J.-P.; Gherardi, N.; Massines, F. Electrical model of an atmospheric pressure Townsend-like discharge (APTD). Eur. Phys. J. Appl. Phys. 2005, 29, 173–180. [Google Scholar] [CrossRef]
Figure 1. (a) Schematic diagram of the DLRI, the operating parameters and their temporal evolutions are defined in the box below. In this paper, (b) the hydrolysis of dicyclohexyl zinc is involved.
Coatings 13 00630 g001
Figure 2. Characteristics of the coatings obtained with DLRI into an asymmetric low-pressure RF discharge (tliq = 5 ms, tgas = 10 ms, Δt = 2 ms, f = 1 Hz, deposition time 10 min): (a) TEM image (b) and the corresponding 2D size plot of ZnO nanoparticles—the red curve corresponds to the average size, (c) HRTEM image (d) optical indexes spectra and (e) IR spectrum in the 2700–3500 cm−1 range. In (f), the linear evolution of the thickness as a function of deposition time allows the deposition rate to be determined.
Coatings 13 00630 g002
Figure 3. (a) Typical image of the aerosol formed with DLI (pentane, tliq = 5 ms, tgas = 10 ms, Δt = 2 ms, f = 1 Hz) obtained by fast imaging. (b) Temporal evolution of scattered light intensity. The delay ti between pulsed aerosol injection (red curve) and the variation of light intensity (blue one) obtained for different positions zi enables to determine (c) the droplet’s average velocity.
Coatings 13 00630 g003
Figure 4. Temporal evolution of (a) the power injected with either DLRI (red) or DLI (blue) and (b) the pressure with a DLRI (similar values are measured for the DLI) (tliq = 5 ms, tgas = 10 ms, Δt = 2 ms, and f = 1 Hz). In (a), the black curve corresponds to the difference between the red and blue curves.
Coatings 13 00630 g004
Figure 5. Characteristics of the coatings obtained with DLI a colloidal solution into an asymmetric low-pressure RF discharge (tliq = 5 ms, tgas = 10 ms, Δt = 2 ms, f = 1 Hz, deposition time 10 min): (a) TEM image, (b) the corresponding 2D size plot—with the red circles corresponding to the average size of the two populations, and (c) IR spectrum in the range of 2700–3500 cm−1. In (d), the linear evolution of the thickness as a function of deposition time allows to determine the deposition rate.
Coatings 13 00630 g005
Figure 6. Characteristics of the coatings obtained with DLRI into a plane-to-plane DBD (tliq = 5 ms, tgas = 10 ms, Δt = 2 ms, f = 1 Hz): (a) image of the coating and (b) the corresponding spatial evolution of the film thickness along the gas flow line (blue arrow), (c) IR spectrum in the range of 2700–3500 cm−1 and optical microscope images taken (d) at the entrance and (e) close to the exit of the deposit area. The deposition time was 4 min.
Coatings 13 00630 g006
Figure 7. Optical properties of the coatings obtained with DLRI into a plane-to-plane DBD (tliq = 5 ms, tgas = 10 ms, Δt = 2 ms, f = 1 Hz): (a) spatial evolution of the optical indexes, (b) image of the coating (same as in Figure 6a) recorded under UV light illumination and (c) spatial profile of the fluorescence intensity along the gas flow (blue arrow). The deposition time was 4 min.
Coatings 13 00630 g007
Figure 8. Temporal evolution of the power injected into the DBD cell after the first pulse with DLRI (tliq = 5 ms, tgas = 10 ms, Δt = 2 ms, and f = 1 Hz). Typical voltage—current evolutions are reported inset.
Coatings 13 00630 g008
Figure 9. Characteristics of the coatings obtained with DLI of a colloidal solution into a plane-to-plane DBD (tliq = 5 ms, tgas = 10 ms, Δt = 2 ms, f = 1 Hz): the (a) image of the coating, the corresponding spatial evolution along the gas flow (blue arrow) of (b) the film thickness and of (c) the optical indexes and (d) image of the coating (same as in a) recorded under UV light illumination. The deposition time was 4 min.
Coatings 13 00630 g009
Disclaimer/Publisher’s Note: The statements, opinions and data contained in all publications are solely those of the individual author(s) and contributor(s) and not of MDPI and/or the editor(s). MDPI and/or the editor(s) disclaim responsibility for any injury to people or property resulting from any ideas, methods, instructions or products referred to in the content.

