Article

Corrosion Evolution of Nickel Aluminum Bronze in Clean and Sulfide-Polluted Solutions

1
Institute of Metal Research, Chinese Academy of Sciences, Shenyang 110016, China
2
School of Materials Science and Engineering, University of Science and Technology of China, Shenyang 230026, China
*
Author to whom correspondence should be addressed.
Coatings 2023, 13(5), 846; https://doi.org/10.3390/coatings13050846
Submission received: 13 March 2023 / Revised: 3 April 2023 / Accepted: 3 April 2023 / Published: 28 April 2023
(This article belongs to the Section Corrosion, Wear and Erosion)

Abstract

:
Nickel aluminum bronze (NAB) alloys are reported to suffer accelerated local corrosion in sulfide-polluted seawater. In this work, the real-time in situ scanning vibrating electrode technique (SVET) was employed to monitor the evolution of the corrosion product film of a typical NAB alloy immersed in the clean and sulfide-polluted 3.5% NaCl solutions. In the sulfide-free condition, the corrosion current peak surged at the individual point of the NAB surface and receded to calm in 2 h. In the presence of the sulfide, however, multiple active points on the measured metal surface released high corrosion current for a long time, indicating that intense corrosion had occurred. The corrosion mass loss was more than four times the former. Global electrochemical techniques, scanning electron microscopy (SEM), X-ray diffraction (XRD), and X-ray photoelectron spectroscopy (XPS) were adopted to perform a comprehensive analysis of the composition of the corrosion product films. The results show that a dense layer of aluminum and cuprous oxide forms on the NAB surface in the sulfide-free solution, while a loose mixture of cuprous sulfide and cuprous oxide is detected in the sulfide-contaminated solution. This finding is believed to account for the observed distinction between the corrosion behavior of NAB in the two solutions.

1. Introduction

Marine copper alloy is widely used in marine engineering construction because of its excellent corrosion resistance, high electrical conductivity, and resistance to biofouling [1,2,3]. Nickel aluminum bronze (NAB) was first developed by the British Navy during the Second World War for use in ship propellers. The alloying of Al, Fe, and Ni elements enhances the friction corrosion resistance of the material. This is mainly attributed to the formation of a protective oxide film on the surface, which enables NAB to be applied in the condition of fluid flow. It is now widely utilized for manufacturing pipes, pumps, valves, and other marine equipment. Unfortunately, the NAB appeared to be somewhat damaged in practice, especially in sulfide-polluted seawaters [4]. Sulfide is usually introduced to seawater from volcanic eruption, rotting domestic waste, and offshore industrial waste discharge. A typical example is the filter of a ship’s seawater system, where a large amount of domestic waste accumulates. The sulfide released from the domestic waste through the decay process leads to severe degradation of the filter screen made of NAB.
NAB exhibits a complex phase structure in the as-cast form, which is primarily composed of copper-rich α grains, retained β martensite, and intermetallic compounds κ phases (κI, κII, κIII, κIV). The varying components, microstructures, and nobilities of these phases contribute to the uneven corrosion behavior of NAB at the microscopic scale [5,6,7,8,9]. Al-Hashem et al. [8] reported the phase-selective corrosion of NAB. The copper-rich α phase, especially at the boundaries of the intermetallic κ phases, was attacked preferentially, while the κ phases and the precipitate-free zones did not suffer from corrosion. Microcracks were also caused by phase-selective corrosion and cavitation stress in the cavitation environment. Moreover, the priority of corrosion on phases is controlled by the change in the pH value of the solution. Lv et al. [9] used atomic force microscopy electrical modes to further investigate the phase-selective corrosion behavior as a function of the pH value. It was reported that the Al-rich κ phase exhibited the priority of corrosion due to the lower nobility than the α phase. In the neutral solution, the α phase preferentially corroded, because the κ phase was protected by the local Al2O3 film. In contrast, the κ phase corroded first when the protective film was destroyed in an acidic environment with a pH below 3.5.
The oxide film formed on the NAB alloy surface plays a vital role in the corrosion resistance performance in seawater [10,11,12,13]. The protective film is generally vulnerable in environments polluted by impurities, resulting in an accelerated attack on the alloy and premature failure of facilities. For example, the impeller of a seawater pump made of NAB was found to be severely corroded after only 3500 h of use [14]. The serious failure of NAB butterfly valves working in Persian Gulf seawater has been noted due to the synergistic effect of erosion corrosion and sulfide attack [15]. Numerous studies on the deleterious effect of sulfide on copper alloys have been carried out for a long time [16,17,18,19,20,21,22,23,24,25]. It is known that the severity of copper corrosion damage caused by sulfide is related to the oxygen content in the solution. Bates [18] claimed that the corrosion rate increased slightly in a de-aerated sulfide-polluted environment due to limited cathodic oxygen reduction, and that was of the same order as that in a sulfide-free aerated environment. Horrible attacks in a failure pipe only occur when sulfide and oxygen co-exist in seawater. Work in this regard has focused on the special properties of corrosion products [19,20]. Yuan et al. [21] found a protective Cu2O and CuO layer on a 70/30 Cu-Ni alloy surface in pristine seawater and a porous corrosion product film in aerated sulfide-containing seawater. Awad et al. [22] reported that a Cu2S-doped Cu2O structure formed on a Cu-Ni-Zn alloy in a natural aeration NaCl solution containing Na2S. It is acknowledged that the special film structure accounts for severe corrosion. The sulfide concentration and velocity of seawater are also essential factors affecting corrosion rate. Al-Hajji et al. [23] reported that the corrosion rates of Cu-Ni alloy ascended with the increase in sulfide concentrations. Song et al. [24] claimed that the corrosion damage degree of NAB and MAB alloys first rose and then fell when the sulfide concentration was from 20 to 200 ppm. In the non-static condition, the fluctuation and the pressure of the solution also affect the corrosion progress, which can be seen from the extremely severe damage of alloys under the synergistic effect of cavitation and erosion [25].
Global electrochemical research methods provide overall rather than local corrosion information on the surface. With the advancement of localized electrochemical technology, the local information on the surface can be tracked in real time. Isaacs [26] first employed the scanning vibrating electrode technique (SVET) in the examination of metal corrosion, and defects in the vapor deposition film of aluminum on steel were detected. Nowadays, various localized electrochemical techniques are applied to investigate the diverse aspects of metal corrosion. One of these methods is local electrochemical impedance spectroscopy (LEIS), which is used to obtain the impedance distribution of a sample. Scanning Kelvin probe force microscopy (SKPFM) is a high-resolution method that combines the classical scanning Kelvin probe (SKP) with atomic force microscopy (AFM). Nakhaie et al. [27] have established a correlation between SKP results and work function values to determine the relative Volta potential of various phases in NAB. The SVET is an effective tool for investigating the real-time corrosion behavior of metals in aqueous solutions, in contrast to SKPFM, which is limited to air medium measurements. Moreover, the SVET provides a more intuitive insight into the distribution of anode and cathode current densities on the surface. Wu et al. [28] used the SVET to study the electrochemical behaviors of graphene coatings on a copper surface and found that the corrosion resistance depends on the defect density rather than the graphene layer’s number. The study of pitting corrosion is another focus in the use of the localized electrochemical method. Araujo et al. [29] used the SVET to investigate the time-dependent susceptibility of Al-Cu-Li alloy to pitting corrosion.
It is an interesting finding that all previous works could only hypothesize the corrosion mechanism by characterizing the final state of the corrosion product film. The lack of initiation and evolution information makes it impossible to clarify the mechanism of copper corrosion in the sulfide environment. In the present work, the SVET was chosen to monitor the corrosion evolution of an NAB alloy in clean and sulfide-polluted solutions. The aim was to acquire visual information about the corrosion initiation and passivation process on the NAB active sites. By combining these visualized results and the information obtained with global electrochemistry, morphology observation, and composition analysis methods, the corrosion mechanism of typical Navy copper could be further clarified.

2. Experimental Section

2.1. Materials and Solution Preparation

A kind of as-received NAB specimen with grade QAl9-4-4-2 was used to perform the experiments. The chemical composition of the alloy is shown in Table 1. The cast ingot was cut into cubes with a size of 10 × 10 × 4 mm for electrochemical experiments and microscopic observation. The specimens with dimensions of 5 × 5 × 2 mm were prepared for the X-ray photoelectron spectroscopy (XPS) test. The working surfaces of all the samples were ground with SiC papers of varying grits from 200 to 2000, rinsed with distilled water, cleaned and degreased in ethanol and acetone in an ultrasonic bath, and finally dried with an air blower. The electrolytes of neutral 3.5% NaCl and 3.5% NaCl + 0.0005 M Na2S (pH = 10.1) were prepared to simulate the clean and sulfide-polluted seawater. Analytical-grade chemicals and deionized water were used. The solution was placed in a natural atmosphere of 27 °C. The concentration of dissolved oxygen was approximately 5.5 mg/L. The solutions were replaced regularly to prevent the sulfide concentration from decreasing due to oxidation by oxygen.

2.2. SVET Measurement

The SVET measurements were performed using a VersaSCAN scanning electrochemical system (AMETEK) in clean and Na2S-polluted 3.5% NaCl solutions. The 10 × 10 mm bare NAB was embedded in a φ30 resin sample. To avoid signal distortion, the scanning area should not involve the edge of the sample. However, a large area should be scanned as much as possible to ensure that the random pitting corrosion is detected. A microprobe with a 10 µm tip moved 400 µm/step over an 8 × 8 mm electrode region to record the potential difference ΔV of 21 × 21 points. The measuring speed of the probe is 500 µm/s. The step of 400 µm enables the test to be completed in a short time to avoid dramatic changes in the local environment under prolonged corrosion. The SVET microprobe vibrates above the tested region at a frequency of 80 Hz with an amplitude of 30 µm, which is applicable to obtain a signal that is large enough to be distinguished, and to avoid excessive disturbance to the solution. The probe tip was set at a distance of 100 μm from the sample surface, which was considered as the preferred height for obtaining a stable signal. The current density is obtained from the potential difference converted by the following formula:
i = σ Δ V A
where i represents current density (A/m2), σ represents solution conductivity (S/m), ΔV represents potential difference (V), and A represents probe amplitude (m).

2.3. Electrochemical Measurements

The global electrochemical measurements were performed using a Parstst4000A electrochemical workstation (AMETEK) in the corresponding aqueous solution. A conventional three-electrode cell was used, consisting of a platinum sheet as the counter electrode, a saturated calomel electrode (SCE) as the reference electrode, and a mounted specimen with an exposed area of 1 cm2 to the electrolyte as the working electrode. Three samples were repeatedly measured to ensure reproducibility. All the tests were carried out after the three electrodes were immersed for at least 30 min and the open circuit potential had stabilized. The electrochemical impedance spectroscopy (EIS) tests were carried out at open circuit potential using a 10 mV perturbation ranging from 100 kHz to 0.01 Hz. Zview software was used for EIS data modeling and curve-fitting. The potentiodynamic polarization curves of the specimens were conducted from −0.25 VOCP to 1.5 VSCE at the rate of 0.33 mV/s. The step height was 1 mV.

2.4. Microstructure and Chemical Analyses

The morphology and elemental composition of the specimen surface were obtained by scanning electron microscopy (SEM) equipped with an energy-dispersive X-ray spectroscopy (EDS) analyzer (Philips XL 30 type Field Emission ESEM, FEI, Morristown, NJ, USA). The specimens soaked for 1 and 40 days were selected to characterize the corrosion product film for the short and long-term immersion, respectively. The phase composition of long-term corrosion products was analyzed by X-ray diffraction (XRD, Bruker D8 DISCOVER, Billerica, MA, USA) with Kα radiation. The diffraction angle range was from 10° to 90°. X-ray photoelectron spectroscopy (XPS) was carried out to examine the elemental composition and the corresponding valence information of the subsurface layer using the Escalab250 spectrometer (Thermo, Waltham, MA, USA) with an XPS Ar+ ion beam sputtering rate of approximately 0.1 nm/s.

3. Results and Discussion

3.1. SVET Test Result

The SVET measurement was performed to obtain the variation of the local electrochemical corrosion signal for the onset of the immersion test. Figure 1 shows the distribution and the evolution of the current in an 8 × 8 mm area of the NAB samples immersed in a clean 3.5% NaCl solution. Positive values represent the anode current and negative values represent the cathode current in the 3D diagram. The maximum and minimum values are shown in the color scale on the right of the diagram. At the initial stage of the test, a strong anodic current density peak (Site 1) of 13.3 μA/cm2 was observed after 50 min of immersion, as shown in Figure 1b. Then, the current density peak diminished gradually until it disappeared at the end of 3 h (Figure 1c,d). After 5 h of immersion, another active point, with a current density of 8.55 μA/cm2, appeared (Site 2) at the top right of Site 1. The third point of 1.71 μA/cm2 arose on the bottom right of Site 1 after 9 h of immersion when the current at Point 2 had been exhausted.
In this test, the corresponding imaging methods, including optical micrographs and scanning electron microscopy graphs, were adopted to clarify the local electrochemical process. Figure 1 shows that the large-size second phases gathered in the center of the corrosion sites. The second phase is identified as the κI phase, which usually appears where the local iron content is higher than 4.5% [30]. Uneven casting may result in the overgrowth and aggregation of the second phase, which is also the main cause of localized corrosion [31]. Al2O3 will develop on the local surface of κ phases to form corrosion microcells with a copper matrix; thus, the α phases corroded preferentially as the anode. That is to say, the large κ phase is the critical factor of local corrosion. At the initial stage, the cathodic oxygen reduction is dominated by the diffusion of O2. The accumulation of the protective oxide film transformed the reaction into charge transfer resistance control. Then, the corrosion current decreased, and the surface was eventually passivated. In this work, after Active Site 1 was passivated, other sites were activated by micro-galvanic corrosion. It can be seen that the value of current density is Site 1 > Site 2 > Site 3, which is consistent with the order of volume fractions of aggregated κ phases. It can be assumed that the priority of corrosion and the intensity of the current are both related to the distribution of the κ phases in the NAB surface.
After 40 days of immersion, the flat and uniform current density image on the surface was observed (Figure 2). The average current density is no more than 0.1 μA/cm2, indicating that the metal surface is covered with a layer of uniform protective film. Then, mechanical scratching was applied on the passivated film to simulate the shifting sand damage on the workpiece in practical applications. When the fresh substrate was exposed to the solution for 1 h, an obvious anode current density peak of 1.85 μA/cm2 was detected, then it diminished to 1.005 μA/cm2 in 1 d. This time interval is assumed to be the half-life of decay. On the fifth day, the anode current peak on the metal surface disappeared completely, proving the completion of the self-repair process of the passivation film [32].
As for the corrosion in the sulfide-polluted solution, the anodic current density peaks observed in Figure 3 were approximately 10 μA/cm2, similar to those in the clean solution. However, its anodic area is much larger than that in the sulfide-free environment. With prolonged exposure, the peak slowly decreased, and even after 8 h of immersion, the current density still reached 5.7 μA/cm2, indicating that the surface had not been passivated yet. The SEM images show a large number of aggregated pitting corrosion sites, which correspond to the high anodic peaks. It is not possible to present every current peak caused by individual corrosion sites due to the limitation of the instrument resolution. The magnified images of the pitting site reveal the accelerated local corrosion damage, but no passivation existed on the surface. Similarly, the local corrosion is induced by the micro-galvanic corrosion, but the formation of cuprous sulfide becomes the anode reaction in the presence of sulfide due to its lower potential than that of copper oxide. The anode corrosion current remains fairly high, indicating that the surface is not passivated. The statement that sulfide prevents the formation of a protective corrosion product layer is justified [19].
The mass loss of NAB in both solutions can be estimated according to the following formula:
m = KQ = KIt = MIt Fn
where m represents the loss of metal mass, K electrochemical equivalent, Q the passing charge, I current (only the anode current is integrated), t corrosion times, M molar mass of metal, F Faraday constant, and n is the absolute value of the total number of positive or negative valence in the compound.
The total anode current value of the surface was integrated by Origin software. In the sulfide-free condition, the total transient current is 0.328 μA in Figure 1b and 0.152 μA in Figure 1c. Assuming that the current decreases linearly with time, the mass loss can be estimated as 0.000236 mg during this period of 50 min. In the sulfide-polluted case, however, the mass loss within the same 50 min is estimated to be up to 0.0011 mg, which is more than four times that in the sulfide-free condition.
Upon extended exposure to corrosion, the surface current density of the sample remained high and uneven, as shown in Figure 4. Despite the application of mechanical scratches, no significant changes in the local current were observed. This suggests that the potential difference between the exposed and covered areas was insufficient to induce galvanic corrosion. That is, the surface was not in a well-passivated state due to the poor protection by corrosion products.

3.2. Electrochemical Properties

To study the influence of sulfide on the electrochemical behavior, potentiodynamic polarization measurements for the NAB alloys in solutions of 3.5% NaCl and 3.5% NaCl + 0.0005 M Na2S were carried out. The corresponding plots displayed in Figure 5 were obtained after being stabilized in solution for one hour. It can be noticed that in the presence of sulfide, the corrosion potential shifted negatively from −326 mV to −746 mV. The anodic branch in the sulfide condition is different from that in the sulfide-free condition. The quasi-passivation region from Ecorr to E0 responded to the formation of copper sulfide film. E0 was regarded as the breakdown potential of sulfide film [33]. The current density increased dramatically with the increase in voltage. It is worth noting that the two curves overlap in the range of potential −0.25 to 0 V. This can infer the oxide film growth on the sample in the sulfide-containing solution. In the above potential range, under the sulfide-free environment, the anodic dissolved to form an oxide film. The subsequent deviation of anode curves is caused by aggressive sulfur ions, which interfered with the normal growth of copper oxide film. The polarization curve and SVET results were basically the same in reflecting the nature of corrosion, proving that the SVET is feasible in investigating the local corrosion of copper alloys.
The resistance property of the formed passive film on the NAB alloy after different immersion times was investigated using electrochemical impedance spectroscopy (EIS). Two electrochemical equivalent circuits, as shown in Figure 6, were employed to simulate the corrosion progress. The spectra of 1 d and 5 d in the non-sulfide environment were fitted with equivalent circuit (a), and the rest were analyzed by (b).
As shown in Figure 7a, the increase in the semicircle diameters with the immersion time reveals an enhancement of the corrosion resistance of NAB in the absence of sulfide in the solution. The shape of the Nyquist curves also reflects the properties of the surface film. The Nyquist curves consist of the capacitive reactance arcs in the higher frequency (HF) and a straight Warburg line in the lower frequency (LF) range at early immersion. The HF capacitive arc reflects the information of the charge transfer resistance contributed by the surface corrosion film, and the LF Warburg impedance represents the diffusion process of cathodic oxygen reduction. It can be imagined that the diffusion of redox reactants from the bulk solution to the metal surface dominated the corrosion progress due to the incomplete formation of the surface film in case of the onset of immersion. The disappearance of Warburg impedance with the increase in capacitive reactance arc diameter indicates the accumulation of thick and dense corrosion products. At this stage, the interfacial charge transfer reaction became the decisive step. The corresponding Bode diagram is shown in Figure 7b. The total impedance |Z| presented increases with the corrosion time, demonstrating the accelerated growth of the corrosion product film. In the prolonged immersion time, the gradual increase in the maximum phase angle from 62.3 to 76.3 deg indicates a growth of corrosion resistance.
The Nyquist curves and the corresponding Bode diagram of the NAB exposed in sulfide-polluted solution are shown in Figure 7c,d, respectively. The impedance quickly dropped from nearly 3 kΩ at the initial immersion to around 1 kΩ in 5 days, which indicates that the surface of the sample was destroyed quickly upon contact with the sulfide. The continuous attack by corrosive ions made it impossible to form an effective protective film on the surface.

3.3. Surface Corrosion Morphology

The surface corrosion morphologies of the NAB after 24 h of corrosion are shown in Figure 8a–d. In the sulfide-free condition, local corrosion between the lamellar structure on grain boundaries uniformly distributes on the entire surface (Figure 8a). With the locally enlarged image, it has been found that the κ phase remains, while the adjacent α phase is preferentially dissolved (Figure 8b). The galvanic couples between the α phase and κI, κII, and κIII triggered the initial corrosion. In the polluted solution, obvious pitting damage was generated, and a large amount of corrosion product accumulated around the pits (Figure 8c,d). The prolonged corrosion views along with the corresponding energy spectra are shown in Figure 8e–h and Figure 9, respectively. The corrosion product in the sulfide-free solution is a basic layer of Cu2O covered with scattered Cu2(OH)2Cl. The dense and stable corrosion product was responsible for the superior ability to resist corrosion ions permeation, which was consistent with previous findings. In the sulfide-containing environment, however, the corrosion products on the surface are noticeably looser and thicker. It has been discovered that the components of these porous corrosion products are Cu2O and Cu2S. The dealloying phenomenon has been noticed in some local areas where the primary corrosion product includes iron and aluminum oxides or chloride.

3.4. Corrosion Product Analysis

According to the XRD results shown in Figure 10, copper oxides (CuO and Cu2O) are the main corrosion product of the NAB in chloride solution. Al2O3 has also been detected, and it is considered to provide an excellent protective effect though its content is low [31]. The Cu2(OH)3Cl detected with XRD corresponds to the loose corrosion product distributed in the outermost layer, as seen in the SEM image. The existence of copper sulfide (Cu2S) in the sulfide-containing condition was also confirmed with the XRD result.
The X-ray photoelectron spectroscopy (XPS) technique was used to identify the composition of the corrosion product film and the valence information on the surface of the NAB after 40 days of exposure (Figure 11). The 240 s of sputtering was applied to remove impurities usually formed as a result of oxide deposition during operation. The spectra of the NAB immersed in the clean sodium chloride solution are presented in Figure 11b. The 2p3/2 peaks of Cu at 932.64 eV and 933.1 eV represent the Cu(I) and Cu(II) state, which indicates the presence of copper oxide (Cu2O and CuO) and copper chloride hydroxide (Cu2(OH)3Cl) [34]. Cu2O is the main corrosion product according to the area ratio in the graph. The presence of Al2O3 was confirmed by the peak at the binding energy of 74.82 eV of Al 2p. From the Fe 2p spectrum, the peak at BE of 710.82 eV represented the Fe3+, which was regarded as γ-FeOOH by several authors, and the peak at BE of 709.5 eV is attributed to Fe2+. The Ni 2p spectrum shows NiO and Ni(OH)2 at BE of 852.95 eV and 856.66 eV. In addition to XPS profiles of anode metal ions, the spectra of anions of O and Cl were also provided. The O 1s spectrum was divided into two peak components with BE of 530.44 eV and 531.61 eV [35], indicating the existence of the oxides and hydroxides. The Cl 2p1/2 spectrum at 200.45 eV and the Cl 2p3/2 spectrum at 198.8 eV were also identified.
Figure 11c shows the detection results of NAB exposed in the sulfide-polluted environment after the same sputtering. The spectra were remarkably similar to that in the sulfide-free condition, which revealed the same elemental components of corrosion film. Different from expected, the peak intensity of S 2p in the spectrum is weaker, which may be due to the low S2− content in the solution or the continuous oxidation of Cu2S to Cu2O. It can be seen that even if there is a small amount of sulfide in the solution, the film structure can be significantly altered.

3.5. Discussion

A comprehensive corrosion mechanism of NAB in a sulfide-containing environment is derived based on previous studies on two types of corrosion mechanisms of NAB in clean seawater [36] and pure copper in sulfide-containing environments [34]. The corrosion mechanisms of the NAB are schematically shown in Figure 12.
The standard equilibrium potential of copper is noble than hydrogen, so the corrosion of copper in the aerated solution involves the cathodic reduction of oxygen:
O 2 + 2 H 2 O + 4 e 4 OH ,
When the present NAB was exposed to the sulfide-containing or sulfide-free sodium chloride solutions, the Al2O3 film formed rapidly on the local surface to protect κ phases. The Cu-rich α phase, being an anode to the κ phase in the form of micro-couples, corroded preferentially. Similarly, the eutectoid phase consisting of α and κIII phases also suffered severe damage. The corrosion products composed of copper and aluminum oxides were generated by the anodic dissolution of metals and the hydrolysis of metallic chlorides [37]:
Cu Cu + + e ,
Cu + + 2 Cl CuCl 2 ,
Al + 4 Cl AlCl 4 + 3 e ,
2 CuCl 2 + 2 OH Cu 2 O + 4 Cl + H 2 O ,
2 AlCl 4 + 3 H 2 O Al 2 O 3 + 8 Cl + 6 H + ,
Over time, the corrosion products accumulate to enhance the corrosion resistance of the surface. Unfortunately, the gaps between the uncorroded κ phases or Al2O3 and the surrounding Cu2O are detrimental to the corrosion resistance. The chloride ions penetrate through the defect to the substrate, causing the continuous growth of the corrosion product film. The Fe and Ni precipitated in the film also increase the corrosion resistance by replacing the cationic vacancies [38,39]. The oxidation progress of the cuprous oxide continued with the immersion time to form the Cu2(OH)3Cl, as can be observed from the SEM.
Cu 2 O + Cl + 2 H 2 O Cu 2 ( OH ) 3 Cl + H + + 2 e ,
In the aeration sulfide solutions, the anodic process of the corrosion reaction has alerted dramatically, while the cathode reaction is still the reduction of oxygen. Firstly, the S2− underwent a hydrolysis reaction:
S 2 + H 2 O SH + OH ,
Then the HS was absorbed on the NAB surface, which is related to the sharply dropped Ecorr.
Cu + SH Cu ( SH ) ads + e ,
Cuprous sulfide was then produced under the sufficient SH supply:
Cu + Cu ( SH ) ads + SH Cu 2 S + H 2 S + e ,
The reaction above was controlled by the diffusion of SH in the solution. After the initial reaction, with the consumption of SH, the situation of a high concentration of Cl and a low concentration of SH will appear on the surface, and Cl will participate in the reaction. Due to the reduction in sulfide content, the existing Cu2S will be oxidized to Cu2O [34]:
Cu ( SH ) ads + 2 Cl CuCl 2 + SH ,
2 CuCl 2 + SH Cu 2 S + 4 Cl + H + ,
Cu 2 S + 2 OH Cu 2 O + H 2 O + S + 2 e ,
The transformation of larger radius Cu2S to Cu2O results in the porosity of the film. Even if a continuous film is formed on the surface, copper ions can easily penetrate the pores in the film to react with ions in solution at the interface between the film and the solution. The continuous dissolution of the NAB makes the film thicker, which means that this film has a poor protective effect in the sulfide-containing environment.

4. Conclusions

The corrosion behaviors of NAB immersed in clean and sulfide-polluted sodium chloride solutions have been comparatively investigated. The main conclusions of this study are as follows:
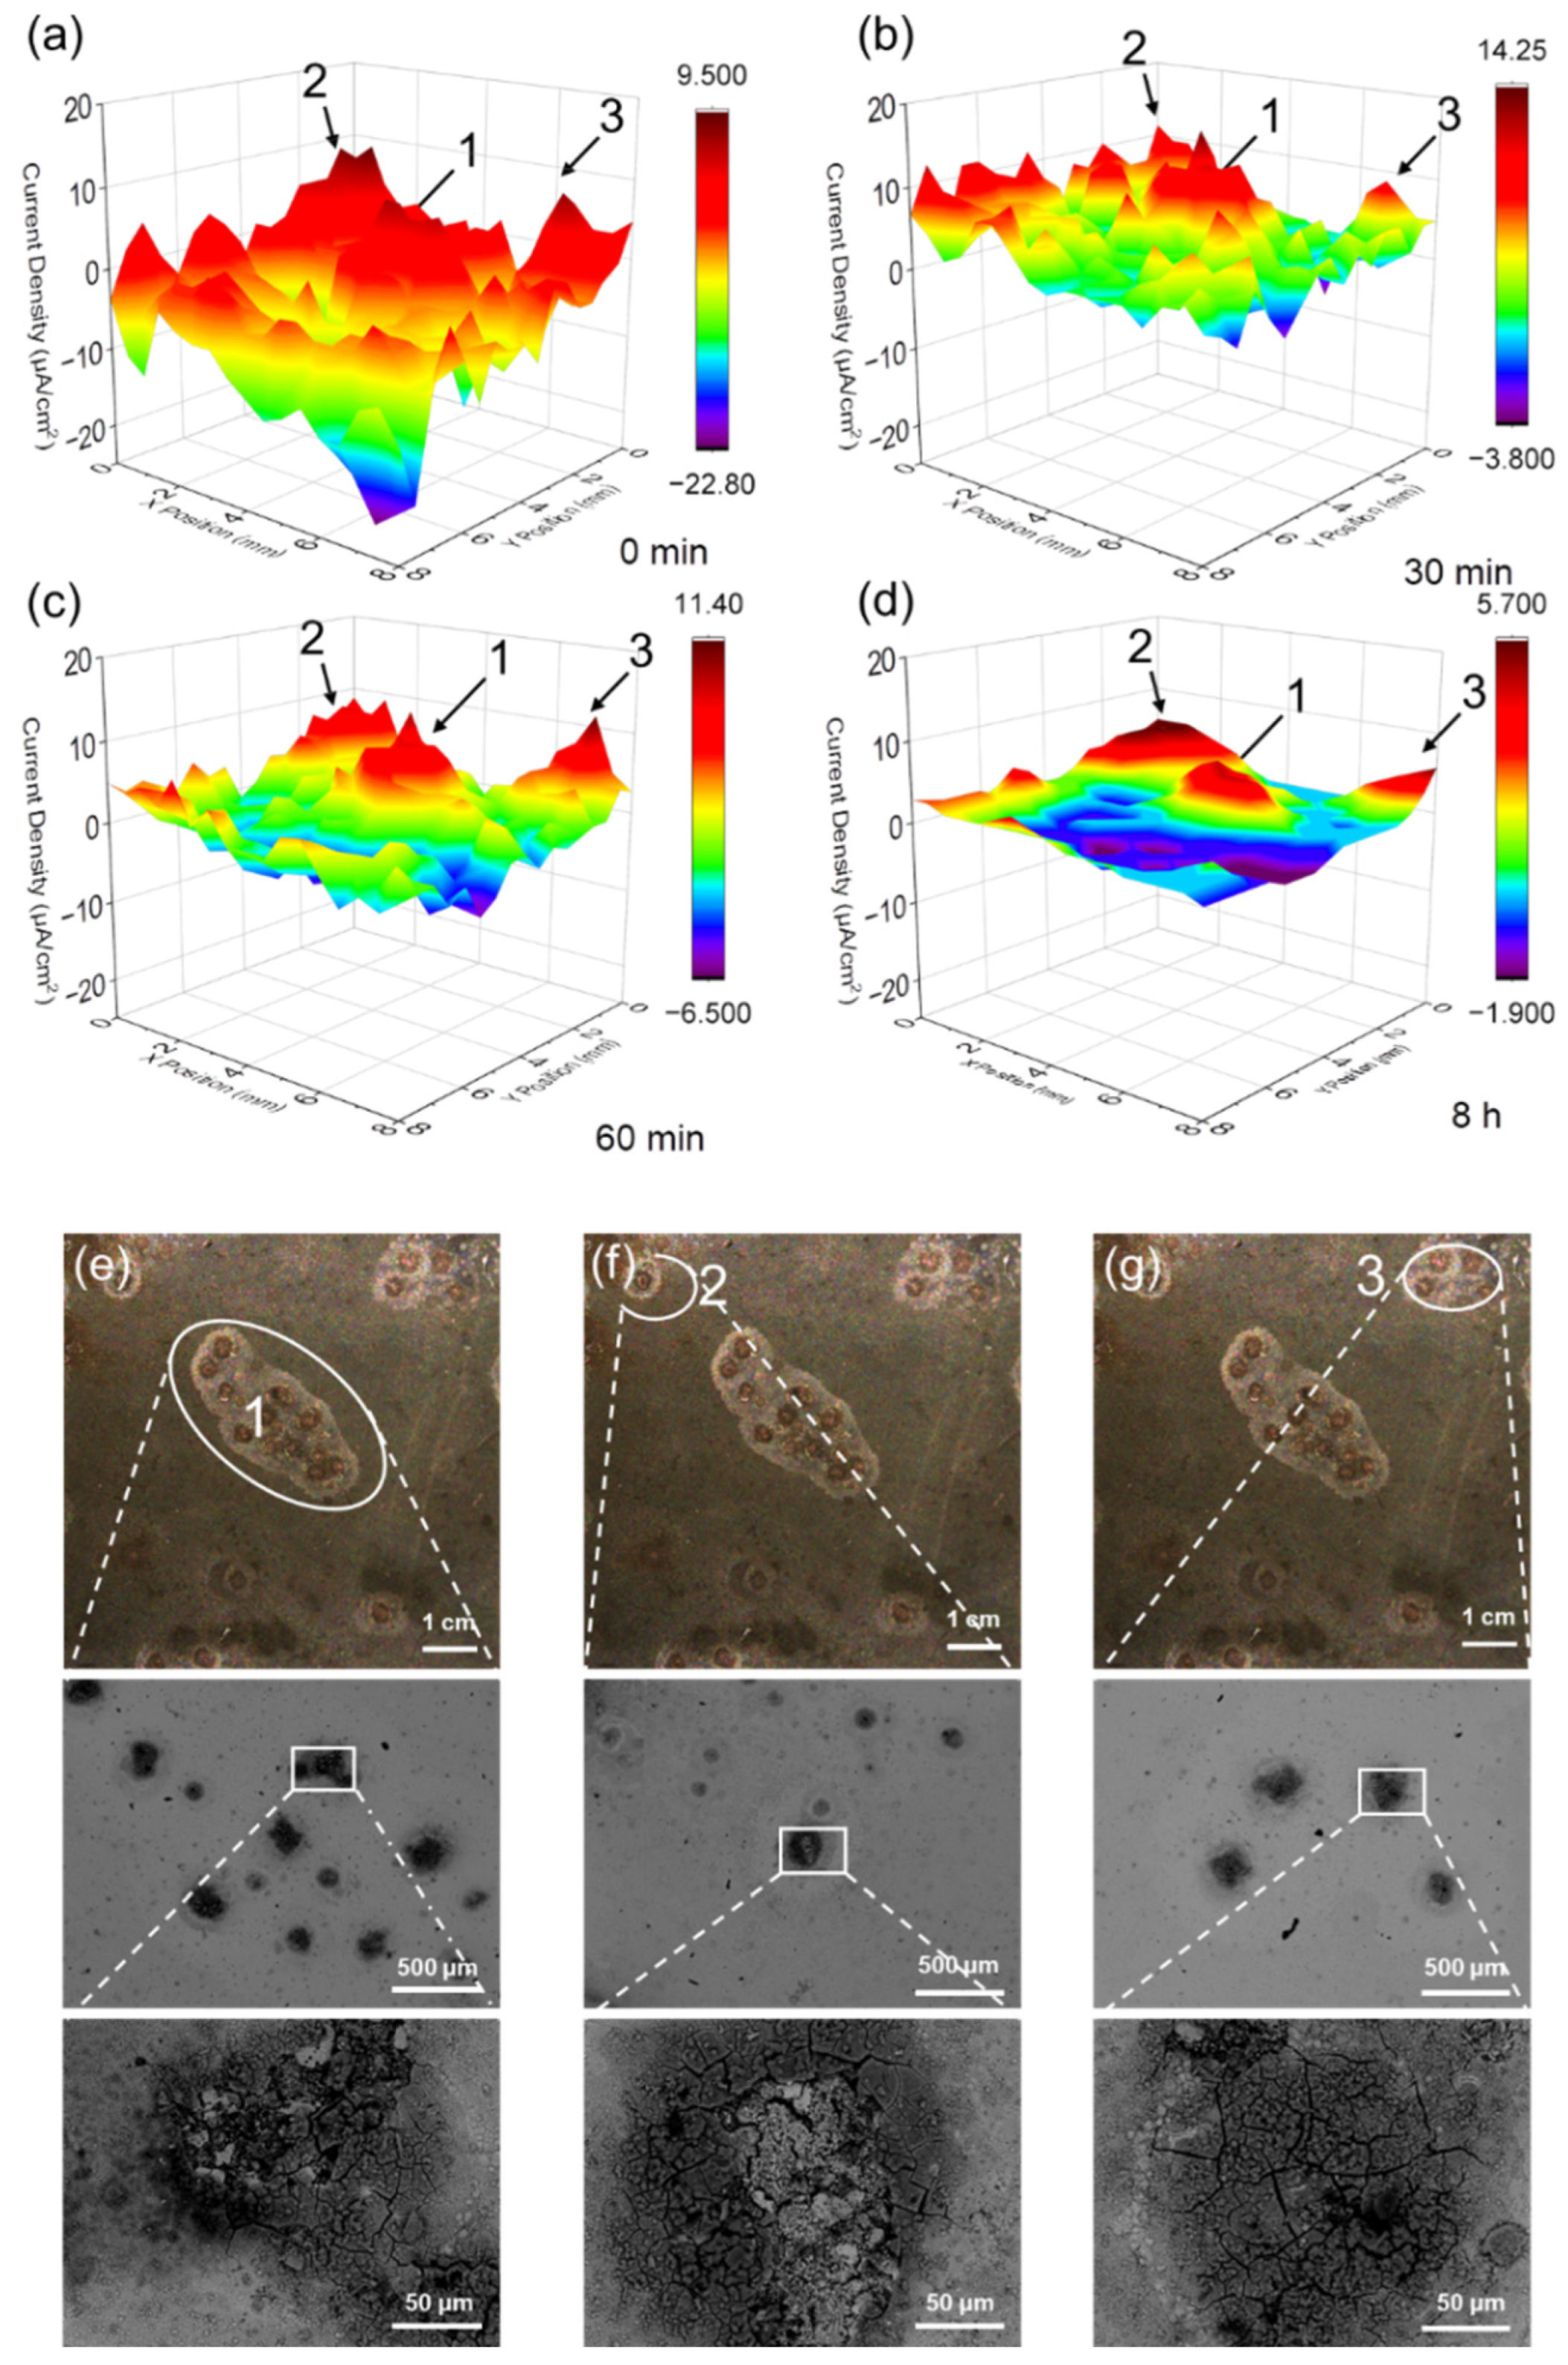
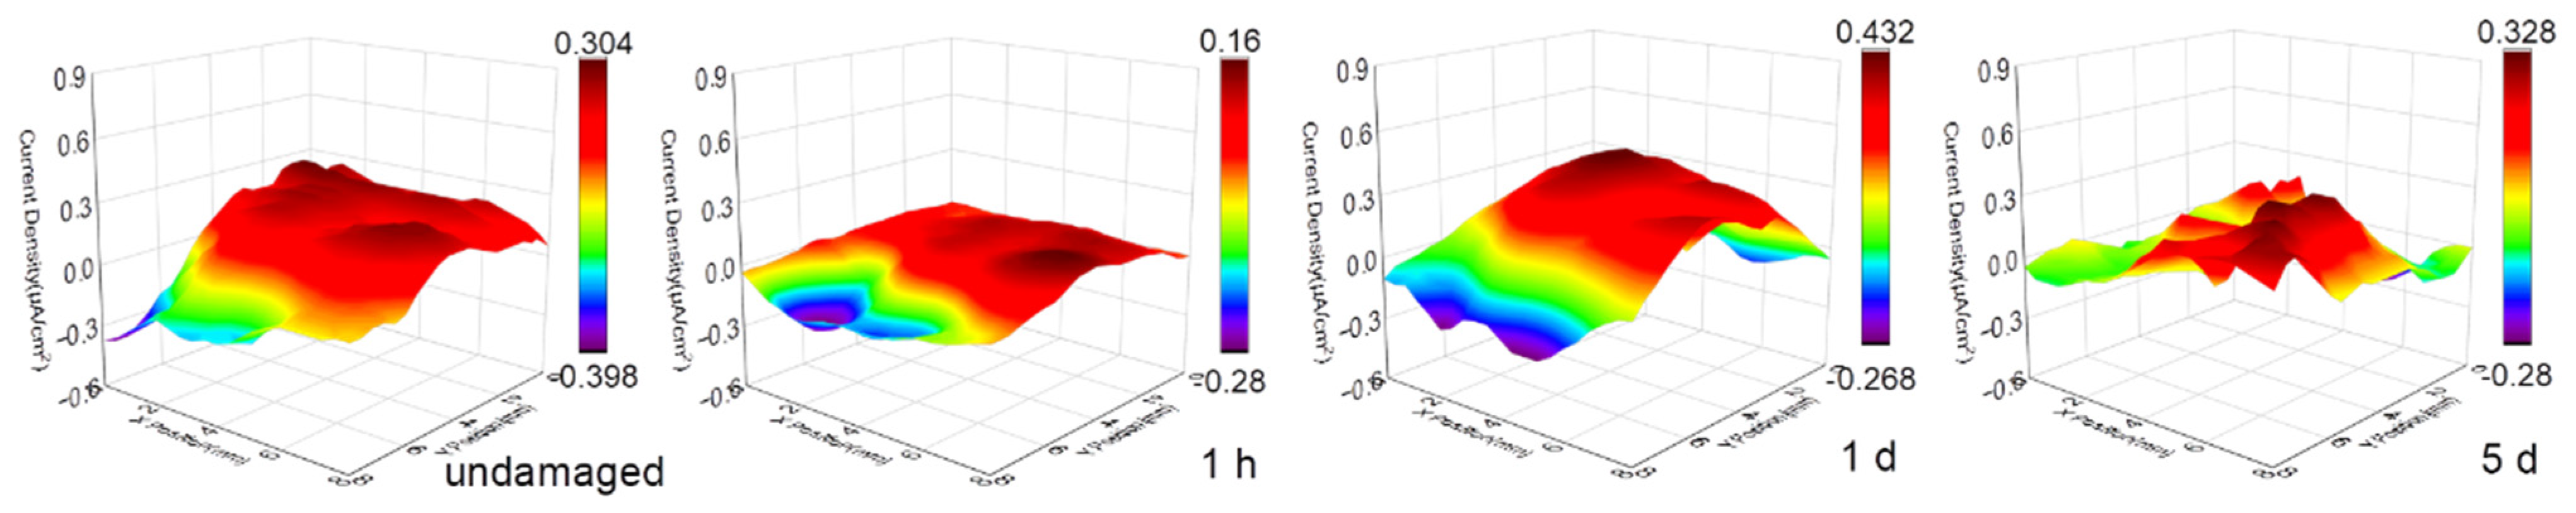
  • The SVET measurement was carried out to monitor the in situ corrosion evolution in real time. The SVET results provide visual evidence of the corrosion activation and self-passivation of NAB under sulfide-free conditions. The addition of sulfide does not significantly increase the corrosion strength of the single point, but initiates multiple corrosion points simultaneously and maintains long-term high corrosion current density. By this technique, we estimated that the corrosion mass loss after a period of immersion in the sulfide-polluted solution is more than four times that in the clean environment.
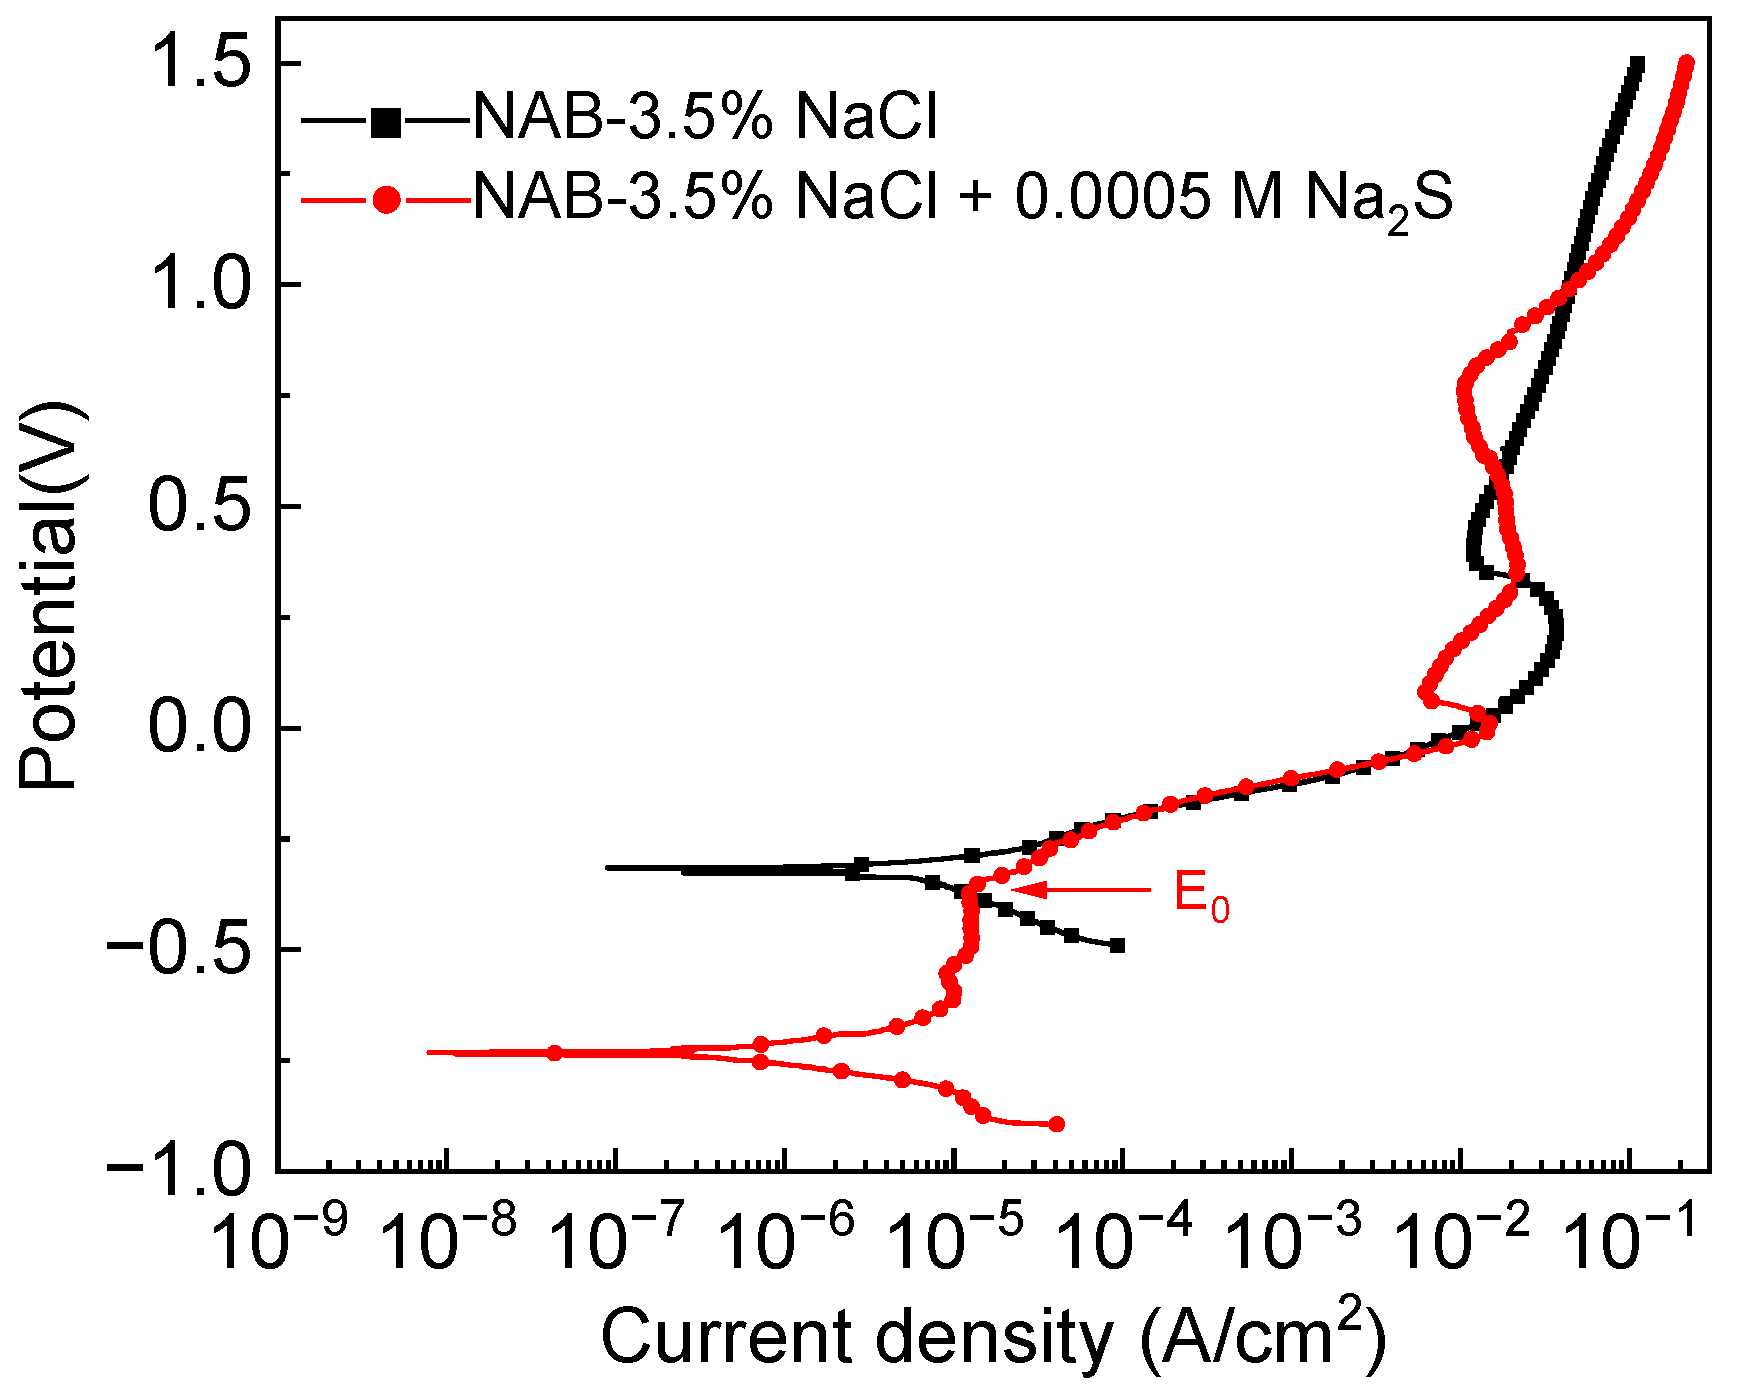
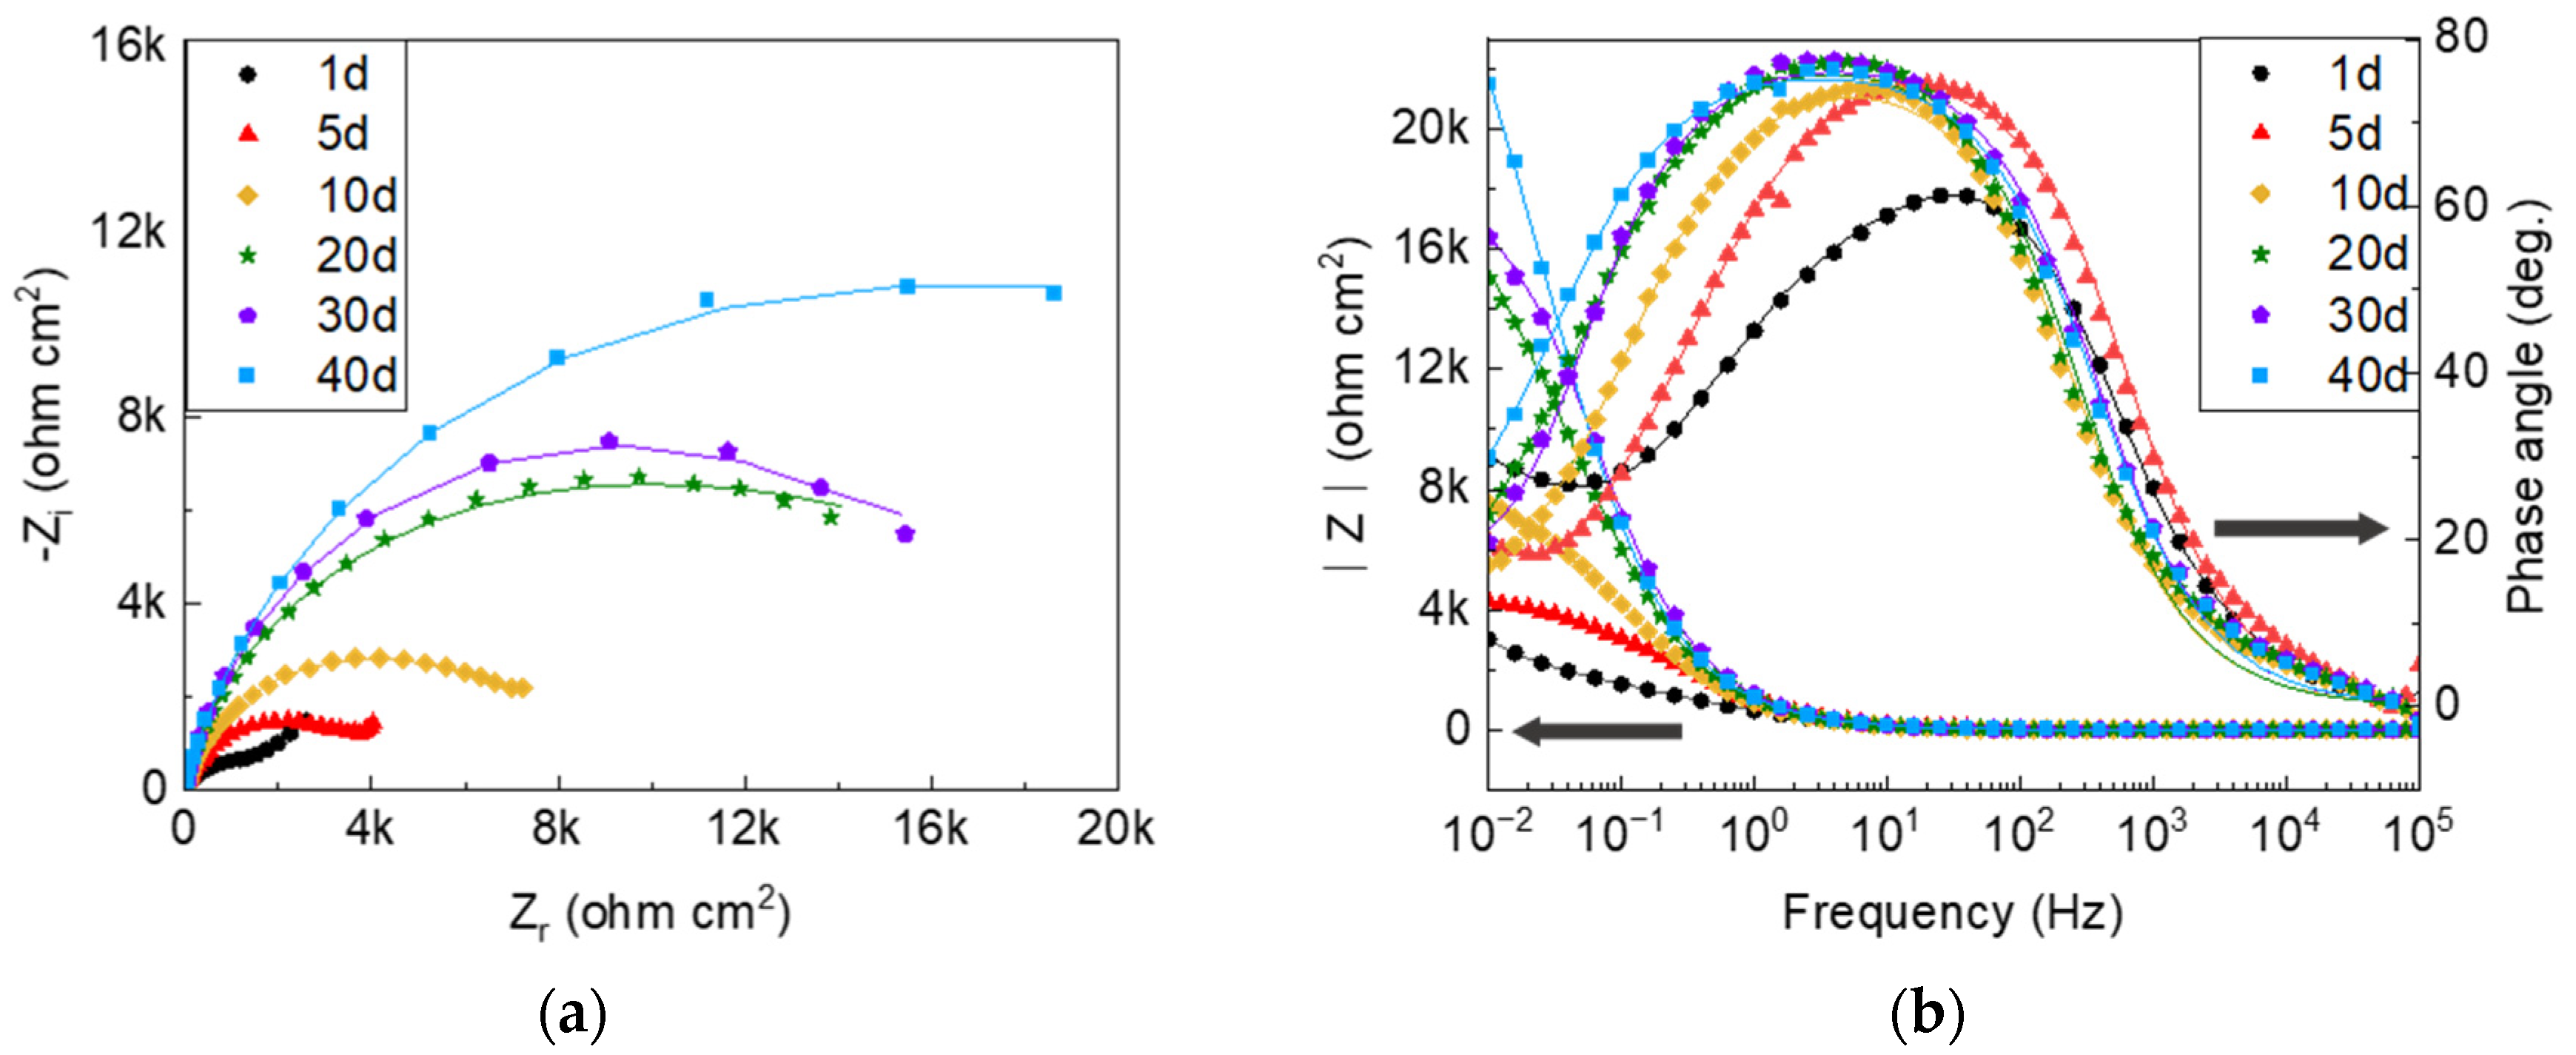
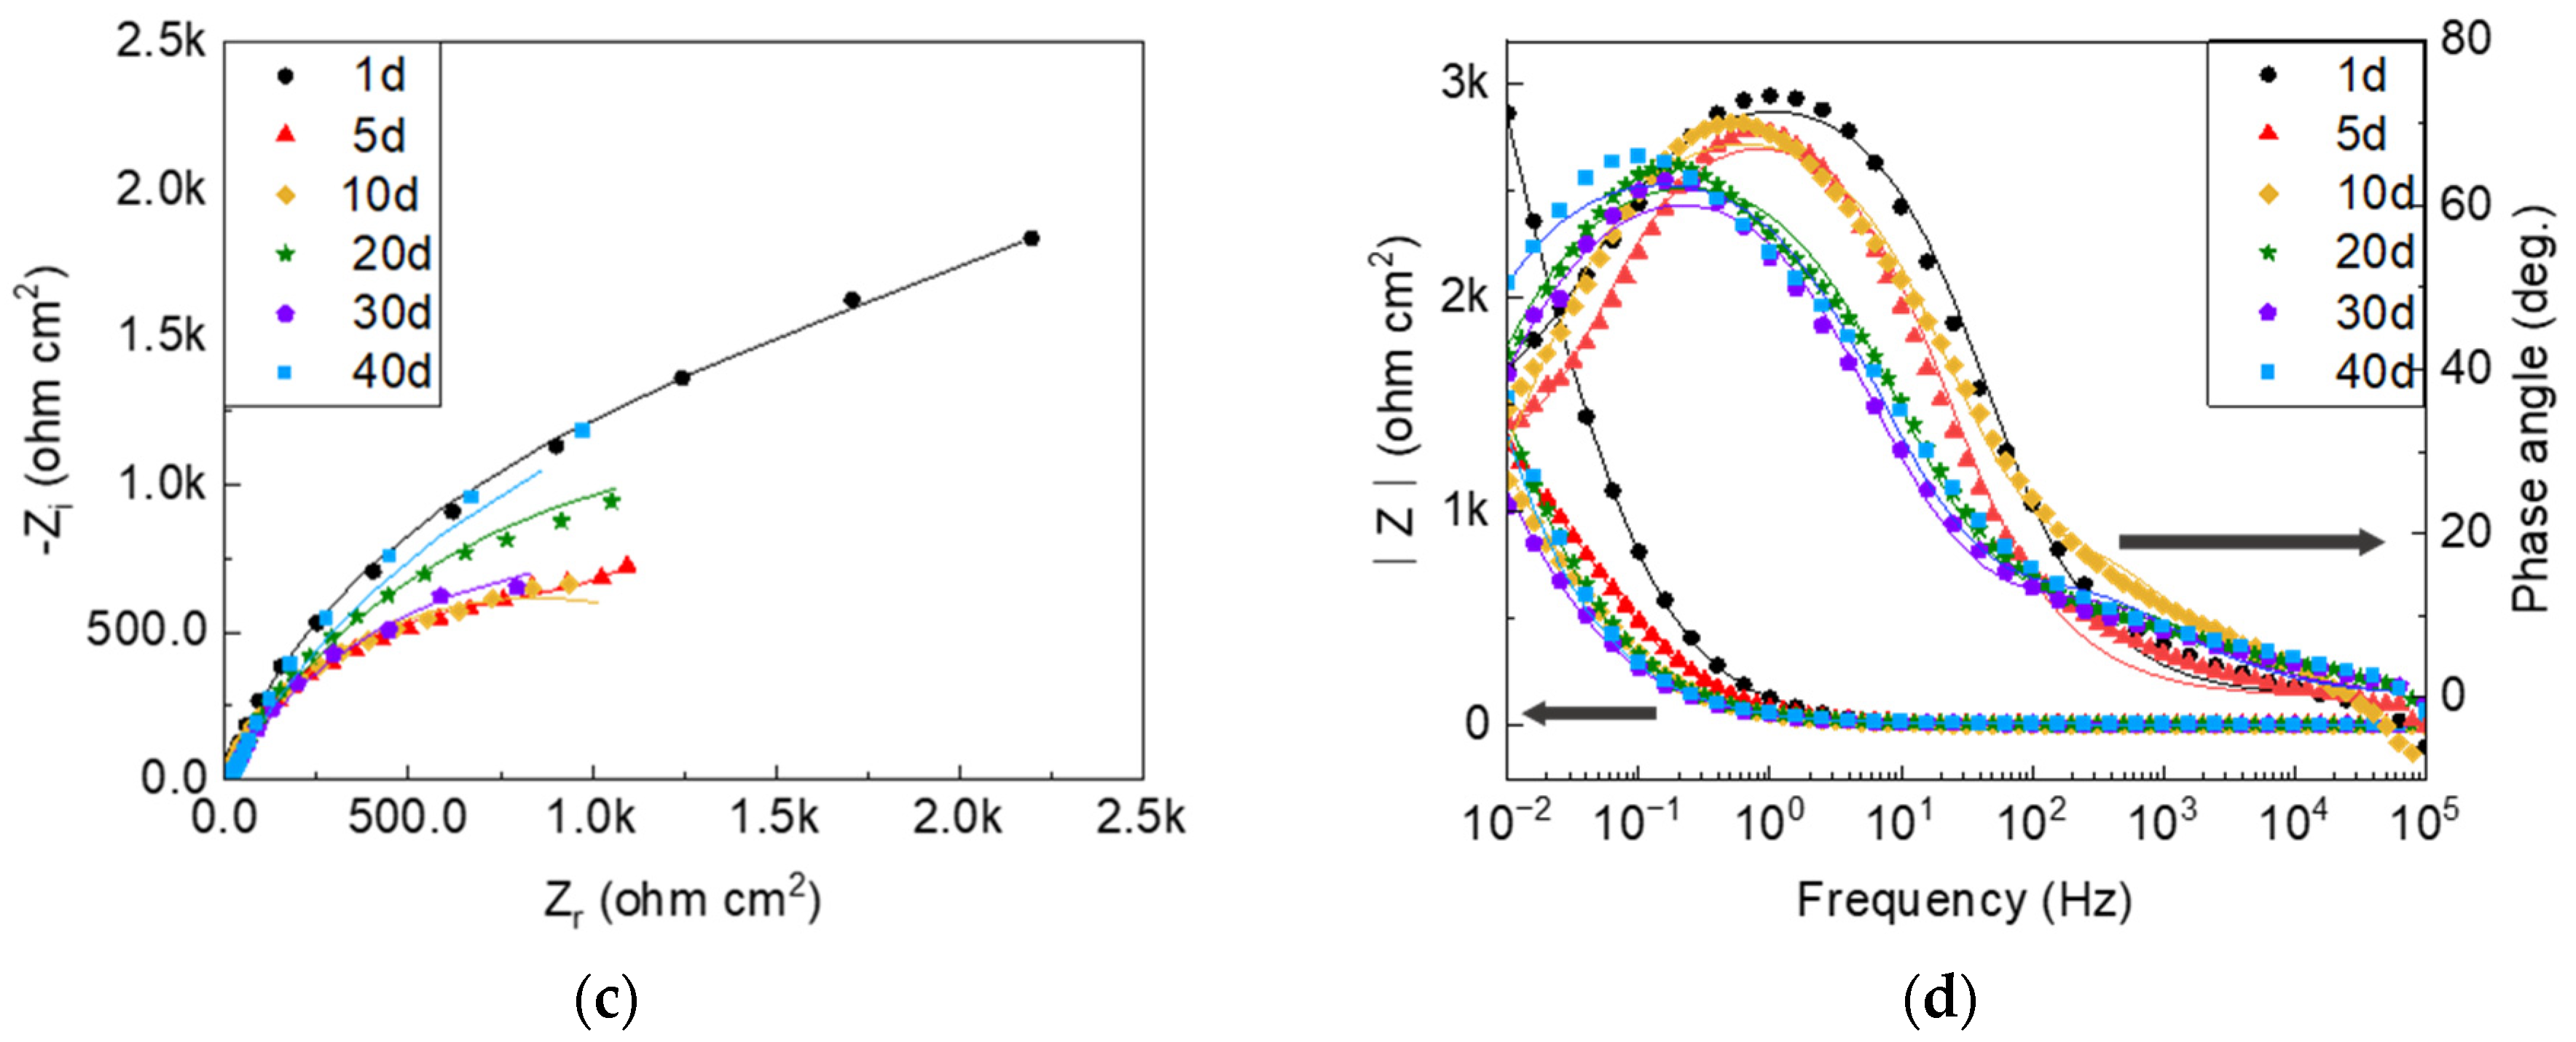
  • Global electrochemical techniques were employed to complete the results of the SVET. In the presence of sulfide, the reduced potential in the PDP shows that the corrosion is more severe due to the modification of the anodic reaction process. It is inferred from the EIS results that the variable nature of the corrosion product films is the main factor that causes the discrepancy in the protection performance.
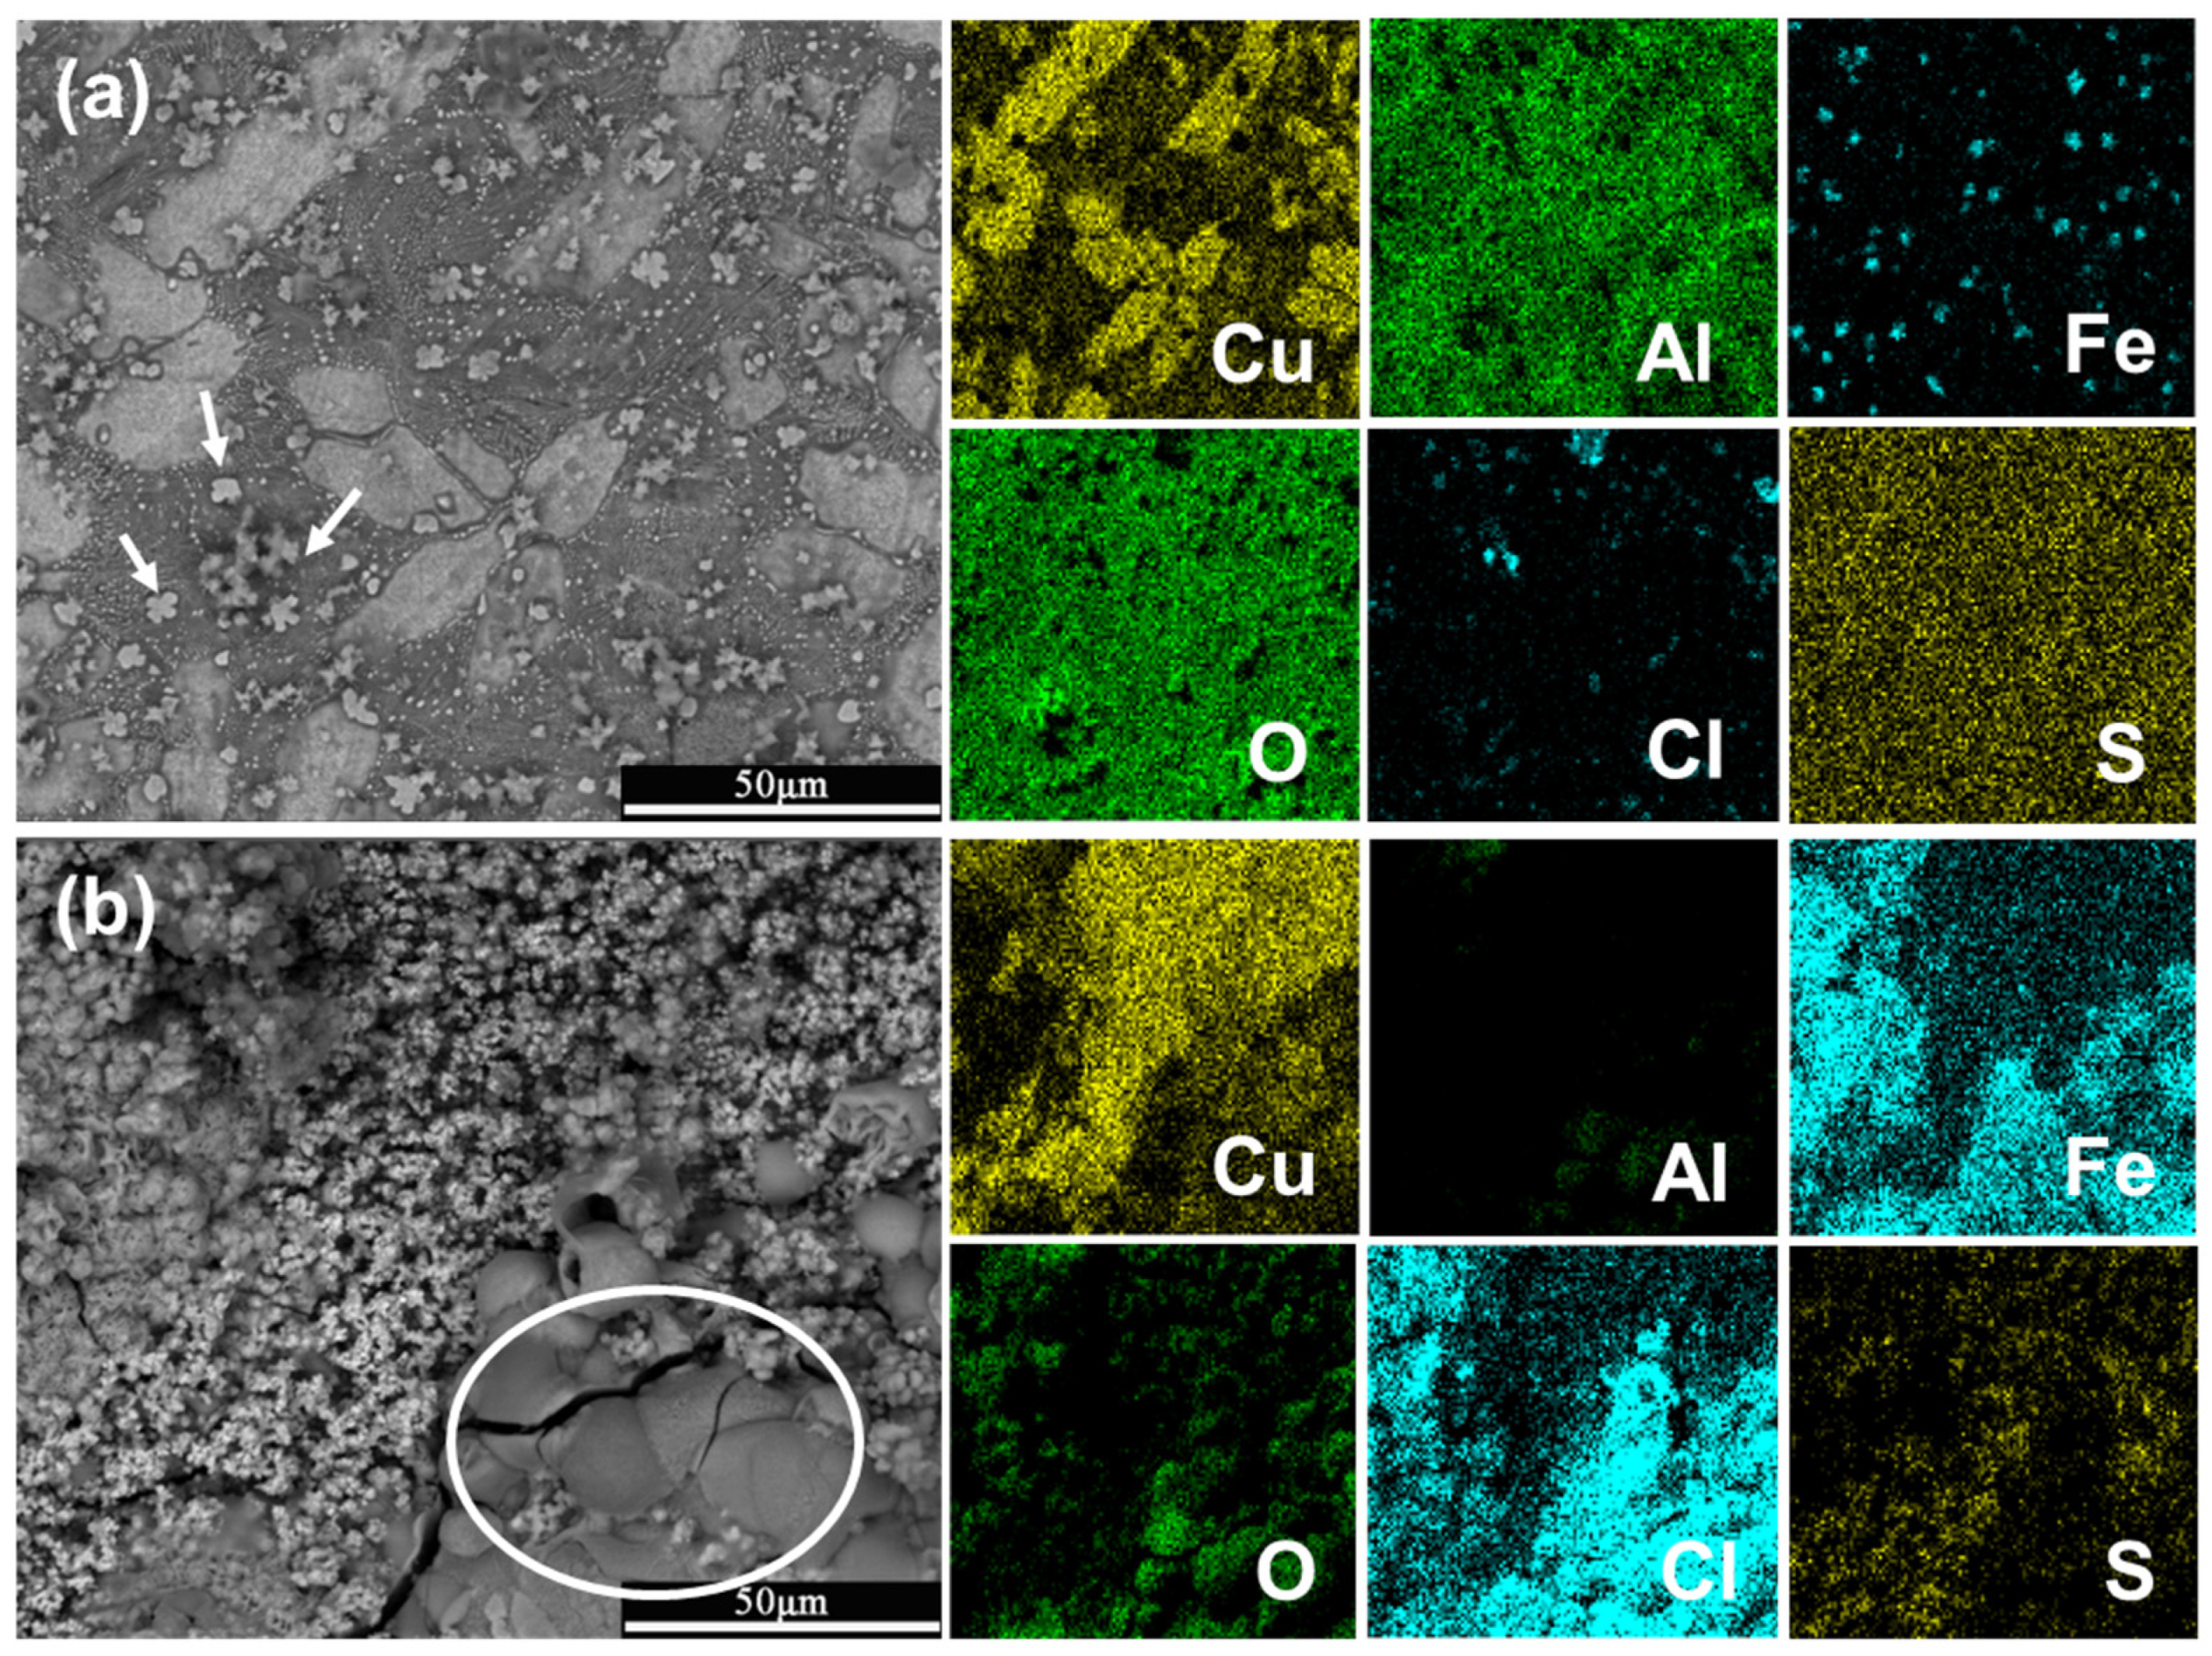
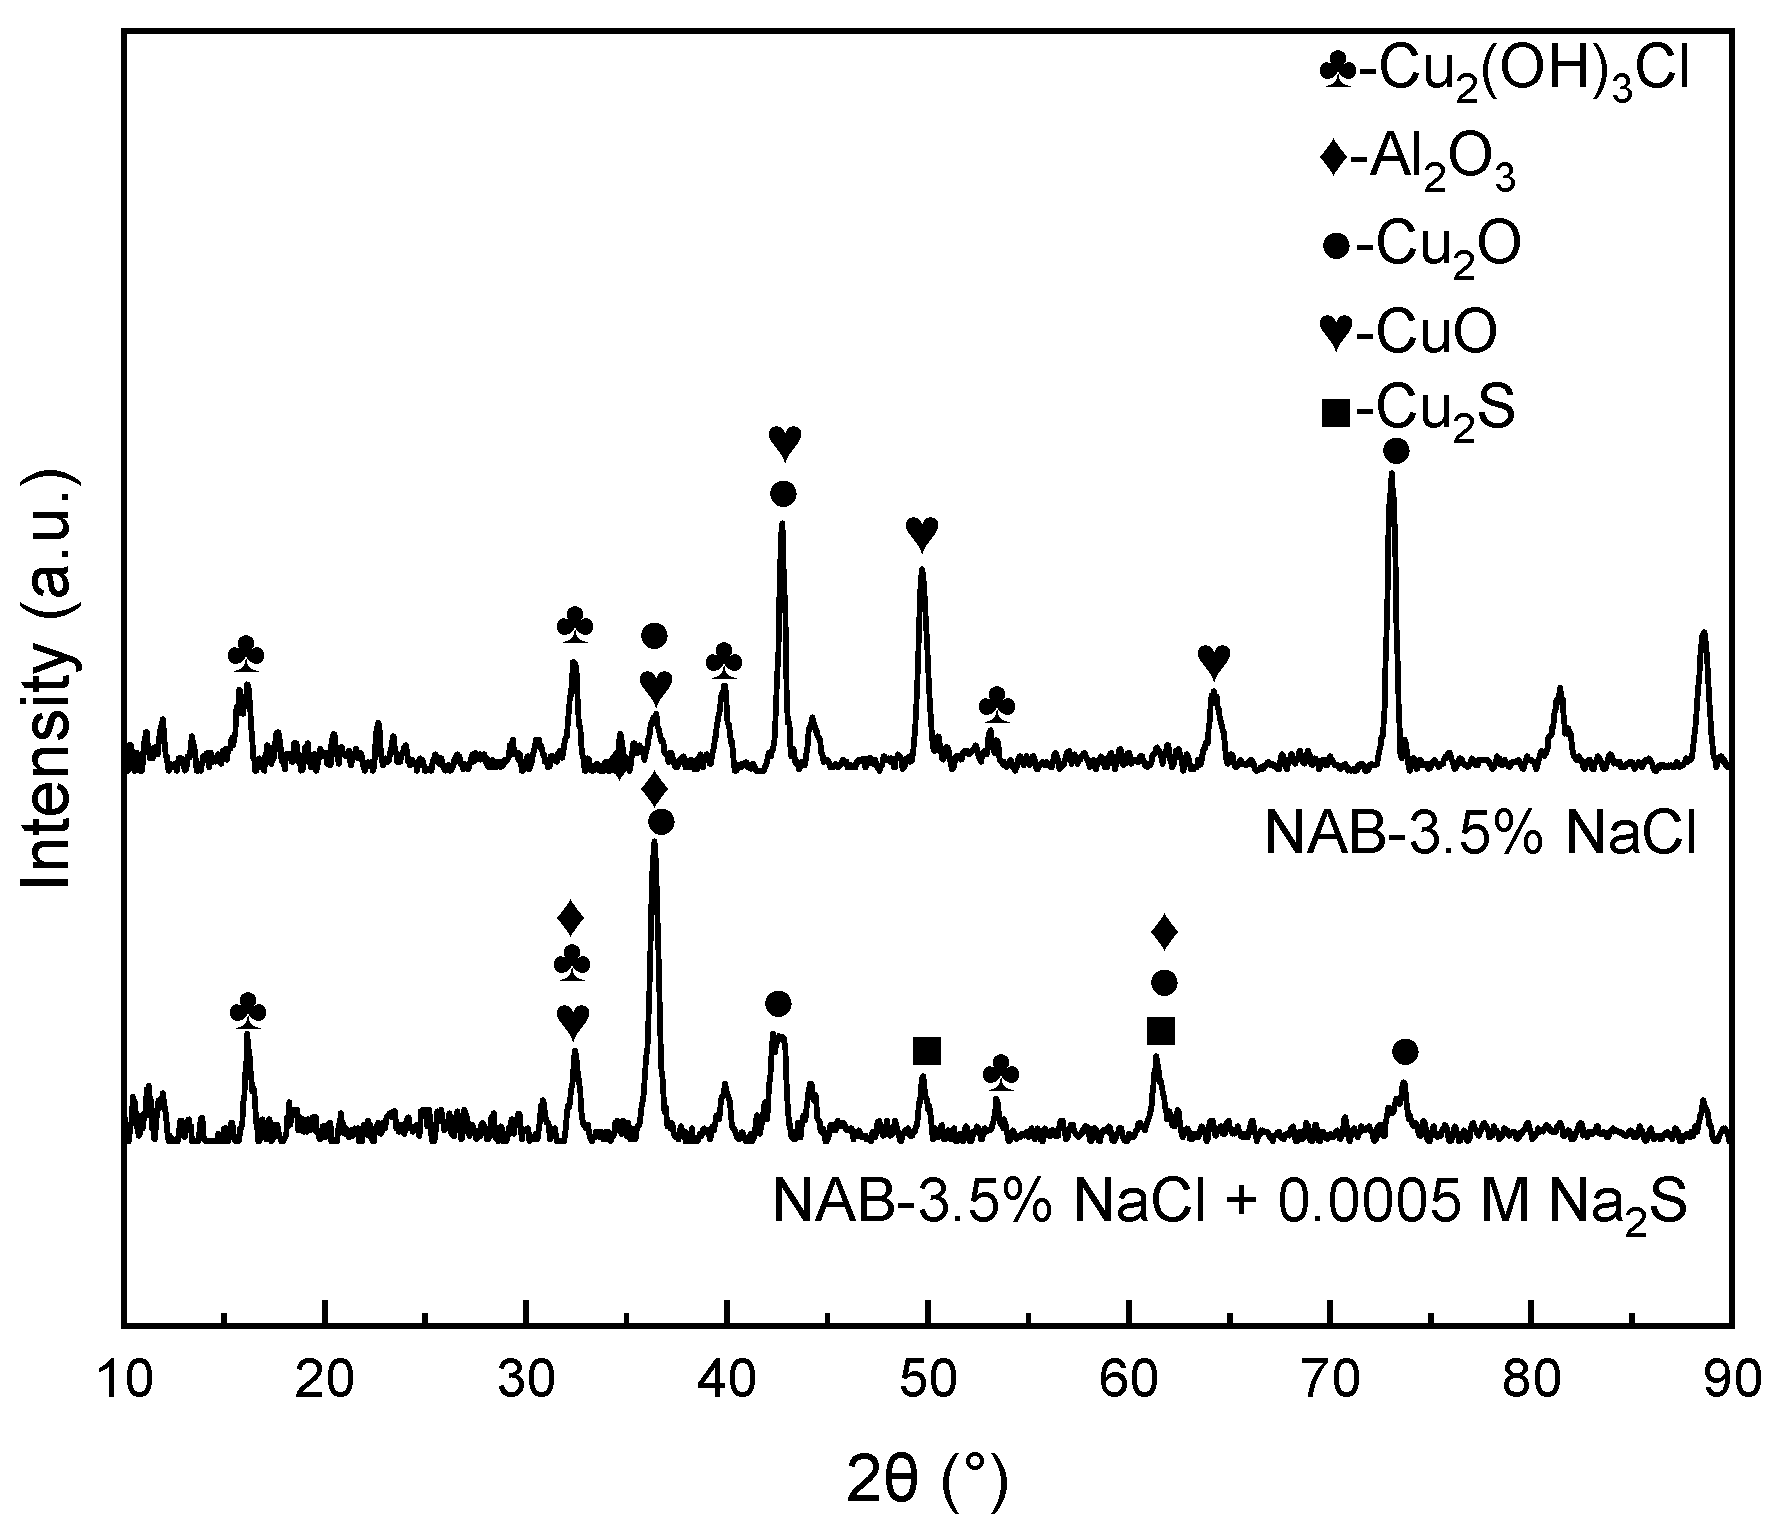
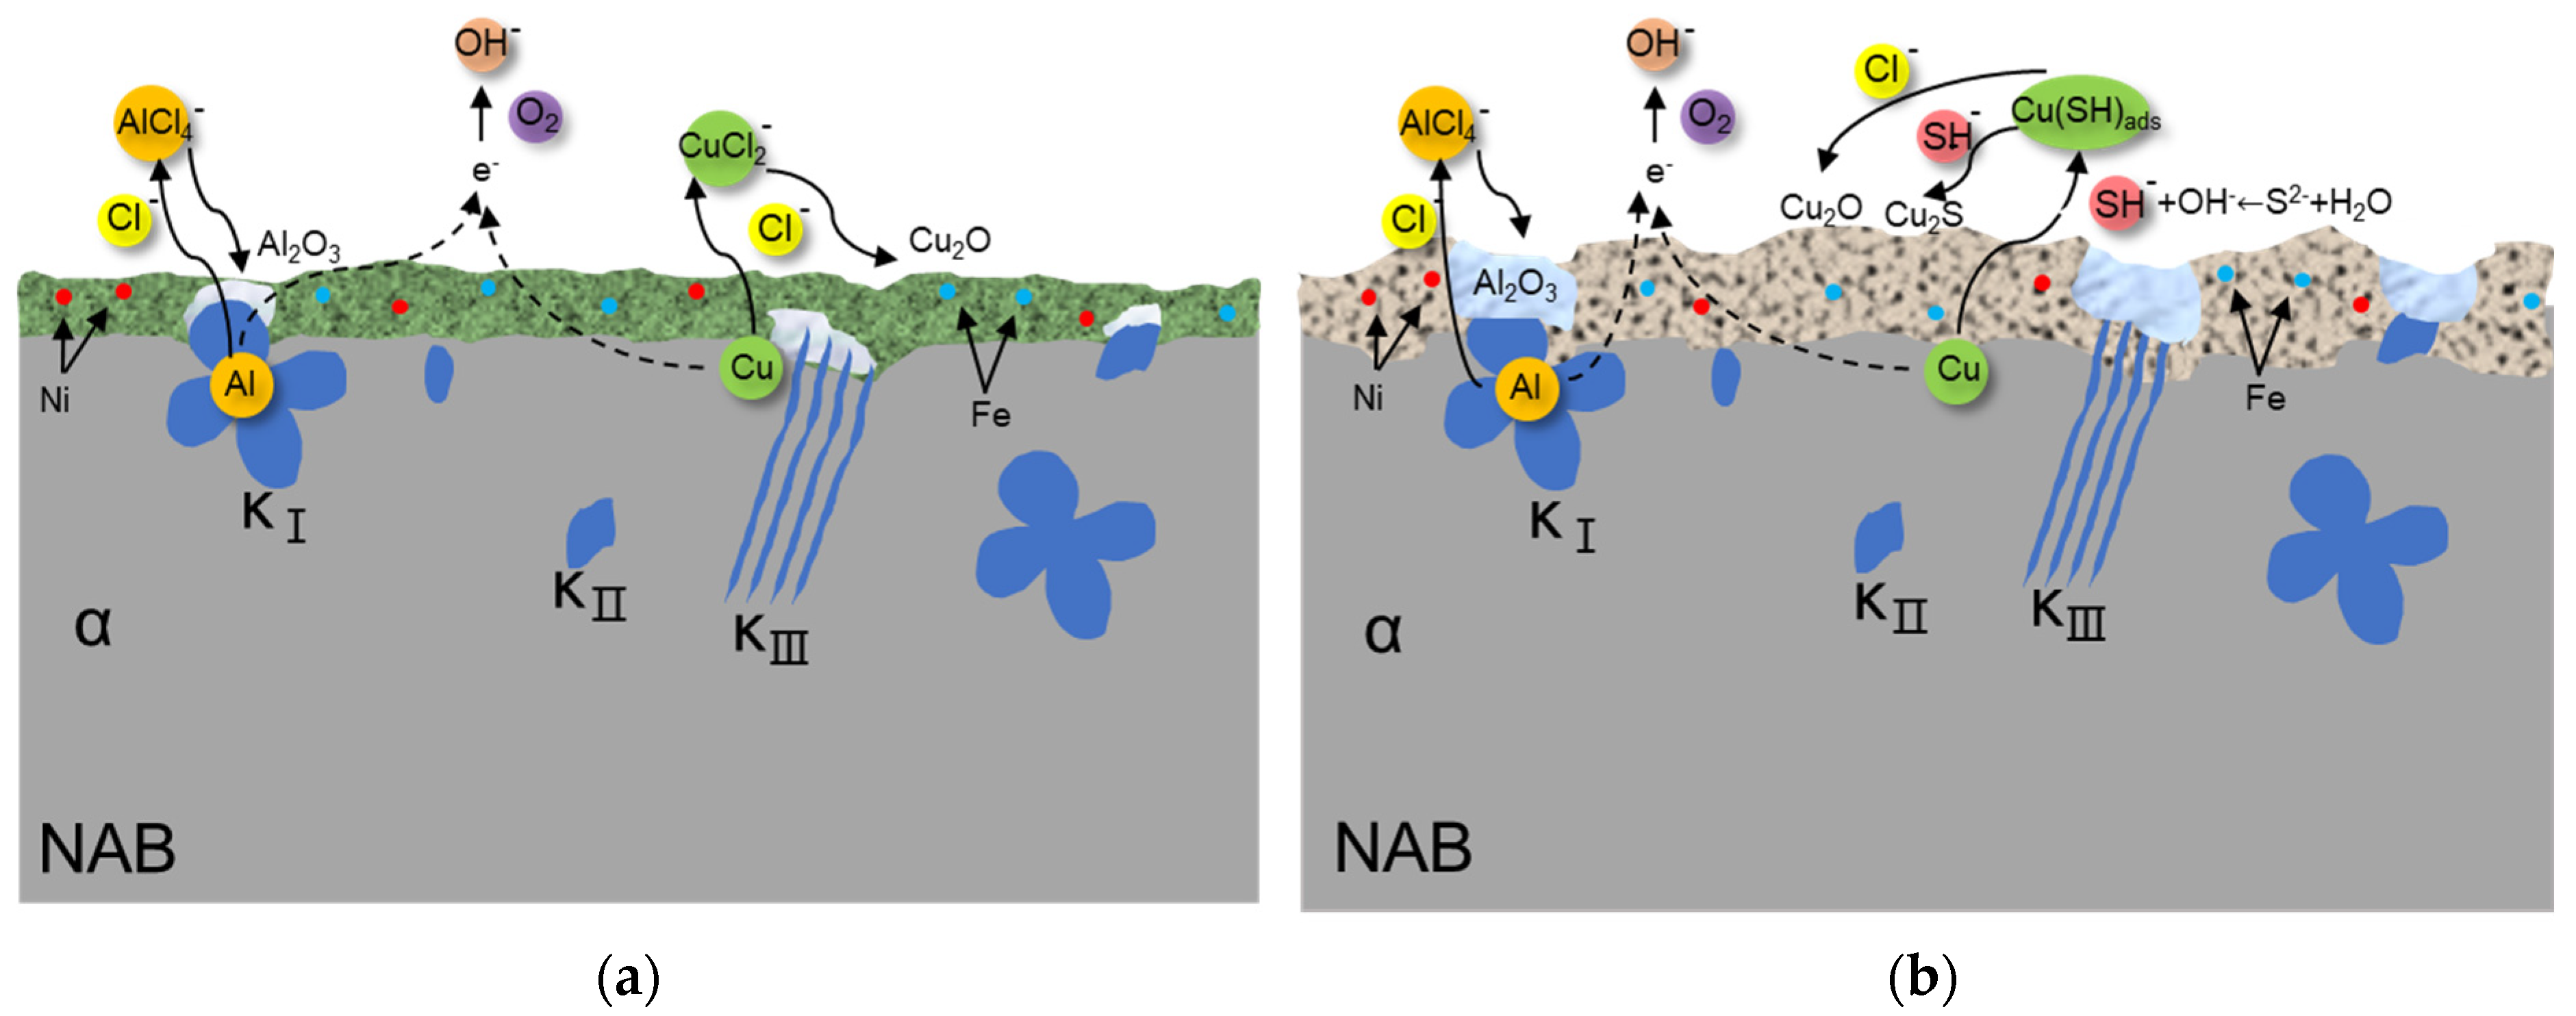
  • The further morphology and composition analysis of the corrosion product films reveals that in the sulfide-free solution, a dense layer consisting mainly of Cu2O and Al2O3 is formed on the surface of NAB, while in the sulfide-polluted environment, the film containing Cu2O and Cu2S is loose and vulnerable to aggressive ions.
  • The findings in this article may provide guidance for the copper alloy composition design, estimation of pitting corrosion degree, and available protective measures such as heat treatment, friction-stir processing, or coating protection.

Author Contributions

Conceptualization, Y.W.; methodology, L.Y.; formal analysis, L.Y.; investigation, L.Y.; resources, Y.W.; data curation, L.Y.; writing—original draft preparation, L.Y.; writing—review and editing, Y.W.; visualization, L.Y.; supervision, Y.W. All authors have read and agreed to the published version of the manuscript.

Funding

This research was funded by the Strategic Precursor Research Program of the Chinese Academy of Sciences (No. XDA 13040501).

Institutional Review Board Statement

Not applicable.

Informed Consent Statement

Not applicable.

Data Availability Statement

Not applicable.

Conflicts of Interest

The authors declare no conflict of interest.

References

  1. Tang, C.H.; Cheng, F.T.; Man, H.C. Effect of laser surface melting on the corrosion and cavitation erosion behaviors of a manganese–nickel–aluminium bronze. Mater. Sci. Eng. A 2004, 373, 195–203. [Google Scholar] [CrossRef]
  2. Fonlupt, S.; Bayle, B.; Delafosse, D.; Heuze, J.-L. Role of second phases in the stress corrosion cracking of a nickel–aluminium bronze in saline water. Corros. Sci. 2005, 47, 2792–2806. [Google Scholar] [CrossRef]
  3. Tang, C.H.; Cheng, F.T.; Man, H.C. Laser surface alloying of a marine propeller bronze using aluminium powder. Surf. Coat. Technol. 2006, 200, 2602–2609. [Google Scholar] [CrossRef]
  4. Alhajji, J.N.; Reda, M.R. On the Effects of Common Pollutants on the Corrosion of Copper-Nickel-Alloys in Sulfide Polluted Seawater. J. Electrochem. Soc. 1995, 142, 2944–2953. [Google Scholar] [CrossRef]
  5. Culpan, E.A.; Rose, G. Microstructual characterization of cast nickel aluminium bronze. J. Mater. Sci. 1978, 13, 1647–1657. [Google Scholar] [CrossRef]
  6. Chen, R.-P.; Liang, Z.-Q.; Zhang, W.-W.; Zhang, D.-T.; Luo, Z.-Q.; Li, Y.-Y. Effect of heat treatment on microstructure and properties of hot-extruded nickel-aluminum bronze. Trans. Nonferrous Met. Soc. China 2007, 17, 1254–1258. [Google Scholar] [CrossRef]
  7. Anantapong, J.; Uthaisangsuk, V.; Suranuntchai, S.; Manonukul, A. Effect of hot working on microstructure evolution of as-cast Nickel Aluminum Bronze alloy. Mater. Des. 2014, 60, 233–243. [Google Scholar] [CrossRef]
  8. Al-Hashem, A.; Riad, W. The role of microstructure of nickel–aluminium–bronze alloy on its cavitation corrosion behavior in natural seawater. Mater. Charact. 2002, 48, 37–41. [Google Scholar] [CrossRef]
  9. Lv, Y.; Guo, J.; Zhang, G.; Cao, L.; Sun, X.; Qin, Z.; Xia, D.-H. Insights into the selective phase corrosion of as cast NiAl bronze alloy: Effect of electrical properties of each phase’s protective film. J. Alloys Compd. 2022, 891, 162008. [Google Scholar] [CrossRef]
  10. Schussler, A.; Exner, H.E. The corrosion of nickel-aluminium bronzes in seawater-I. protecive layer formation and the passivation mechanism. Corros. Sci. 1993, 34, 1793–1802. [Google Scholar] [CrossRef]
  11. Wharton, J.A.; Barik, R.C.; Kear, G.; Wood, R.J.K.; Stokes, K.R.; Walsh, F.C. The corrosion of nickel–aluminium bronze in seawater. Corros. Sci. 2005, 47, 3336–3367. [Google Scholar] [CrossRef]
  12. Thakur, A.; Kumar, A.; Kaya, S.; Marzouki, R.; Zhang, F.; Guo, L. Recent Advancements in Surface Modification, Characterization and Functionalization for Enhancing the Biocompatibility and Corrosion Resistance of Biomedical Implants. Coatings 2022, 12, 1459. [Google Scholar] [CrossRef]
  13. Thakur, A.; Kaya, S.; Abousalem, A.S.; Kumar, A. Experimental, DFT and MC simulation analysis of Vicia Sativa weed aerial extract as sustainable and eco-benign corrosion inhibitor for mild steel in acidic environment. Sustain. Chem. Pharm. 2022, 29, 100785. [Google Scholar] [CrossRef]
  14. Hazra, M.; Balan, K.P. Failure of a nickel aluminium bronze (NAB) canned motor pump impeller working under polluted sea water—Influence of material selection, section thickness dependent microstructure and temper annealing heat treatment. Eng. Fail. Anal. 2016, 70, 141–156. [Google Scholar] [CrossRef]
  15. Hosseini, R.K.; Yareiee, S. Failure analysis of a nickel aluminium bronze butterfly valve in a seawater line. Eng. Fail. Anal. 2021, 129, 105686. [Google Scholar] [CrossRef]
  16. Schüssler, A.; Exner, H.E. The corrosion of nickel-aluminium bronzes in seawater—II. The corrosion mechanism in the presence of sulphide pollution. Corros. Sci. 1993, 34, 1803–1815. [Google Scholar] [CrossRef]
  17. Rahmouni, K.; Keddam, M.; Srhiri, A.; Takenouti, H. Corrosion of copper in 3% NaCl solution polluted by sulphide ions. Corros. Sci. 2005, 47, 3249–3266. [Google Scholar] [CrossRef]
  18. Bates, J.F.; Popplewell, J.M. Corrosion of Condenser Tube Alloys in Sulfide Contaminated Brine. Corrosion 1975, 31, 269–275. [Google Scholar] [CrossRef]
  19. Eiselstein, L.E.; Syrett, B.C.; Wing, S.S.; Caligiuri, R.D. The accelerated corrosion of Cu-Ni alloys in sulphide-polluted seawater: Mechanism no. 2. Corros. Sci. 1983, 23, 223–239. [Google Scholar] [CrossRef]
  20. Syrett, B.C. The mechanism of accelerated corrosion of copper-nickel alloys in sulphide-polluted seawater. Corros. Sci. 1981, 21, 187–209. [Google Scholar] [CrossRef]
  21. Yuan, S.J.; Pehkonen, S.O. Surface characterization and corrosion behavior of 70/30 Cu–Ni alloy in pristine and sulfide-containing simulated seawater. Corros. Sci. 2007, 49, 1276–1304. [Google Scholar] [CrossRef]
  22. Awad, N.K.; Ashour, E.A.; Allam, N.K. Unravelling the composition of the surface layers formed on Cu, Cu-Ni, Cu-Zn and Cu-Ni-Zn in clean and polluted environments. Appl. Surf. Sci. 2015, 346, 158–164. [Google Scholar] [CrossRef]
  23. Al-Hajji, J.N.; Reda, M.R. the corrosion of copper-nickel alloys in sulfide polluted seawater: The effect of sulfide concentration. Corros. Sci. 1993, 34, 163–177. [Google Scholar] [CrossRef]
  24. Song, Q.-N.; Xu, N.; Bao, Y.-F.; Jiang, Y.-F.; Gu, W.; Zheng, Y.-G.; Qiao, Y.-X. Corrosion and Cavitation Erosion Behaviors of Two Marine Propeller Materials in Clean and Sulfide-Polluted 3.5% NaCl Solutions. Acta Metall. Sin. (Engl. Lett.) 2017, 30, 712–720. [Google Scholar] [CrossRef]
  25. Song, Q.-N.; Xu, N.; Tong, Y.; Huang, C.-M.; Sun, S.-Y.; Xu, C.-B.; Bao, Y.-F.; Jiang, Y.-F.; Qiao, Y.-X.; Zhu, Z.-Y.; et al. Corrosion and Cavitation Erosion Behaviours of Cast Nickel Aluminium Bronze in 3.5% NaCl Solution with Different Sulphide Concentrations. Acta Metall. Sin. (Engl. Lett.) 2019, 32, 1470–1482. [Google Scholar] [CrossRef] [Green Version]
  26. Isaacs, H.S. The measurement of the galvanic corrosion of soldered copper using the scanning vibrating electrode technique. Corros. Sci. 1988, 28, 547–558. [Google Scholar] [CrossRef]
  27. Nakhaie, D.; Davoodi, A.; Imani, A. The role of constituent phases on corrosion initiation of NiAl bronze in acidic media studied by SEM-EDS, AFM and SKPFM. Corros. Sci. 2014, 80, 104–110. [Google Scholar] [CrossRef]
  28. Wu, Y.; Yu, J.; Zhao, W.; Wu, W.; Dong, J.; Zhou, K.; Xue, Q. Excellent corrosion resistance of graphene coating on copper due to the low defect overlapping structure. Surf. Topogr. Metrol. Prop. 2019, 7, 015014. [Google Scholar] [CrossRef]
  29. de Sousa Araujo, J.V.; Donatus, U.; Queiroz, F.M.; Terada, M.; Milagre, M.X.; de Alencar, M.C.; Costa, I. On the severe localized corrosion susceptibility of the AA2198-T851 alloy. Corros. Sci. 2018, 133, 132–140. [Google Scholar] [CrossRef]
  30. Hasan, F.; Jahanafrooz, A.; Lorimer, G.W.; Ridley, N. The Morphology, Crystallography, and Chemistry of Phases in As-Cast Nickel-Aluminum Bronze. Metall. Trans. A 1982, 13, 1337–1345. [Google Scholar] [CrossRef]
  31. Zhao, X.; Qi, Y.H.; Wang, J.T.; Zhang, Z.P.; Zhu, J.; Quan, L.L.; He, D.C. Effect of Cast Defects on the Corrosion Behavior and Mechanism of UNS C95810 Alloy in Artificial Seawater. Materials 2020, 13, 1790. [Google Scholar] [CrossRef] [PubMed] [Green Version]
  32. Ding, Y.; Zhao, R.; Qin, Z.B.; Wu, Z.; Wang, L.Q.; Liu, L.; Lu, W.J. Evolution of the Corrosion Product Film on Nickel-Aluminum Bronze and Its Corrosion Behavior in 3.5 wt % NaCl Solution. Materials 2019, 12, 209. [Google Scholar] [CrossRef] [PubMed] [Green Version]
  33. Kong, D.C.; Dong, C.F.; Ni, X.Q.; Xu, A.N.; He, C.; Xiao, K.; Li, X.G. Long-term polarisation and immersion for copper corrosion in high-level nuclear waste environment. Mater. Corros. 2017, 68, 1070–1079. [Google Scholar] [CrossRef]
  34. Chen, J.; Qin, Z.; Shoesmith, D.W. Kinetics of Corrosion Film Growth on Copper in Neutral Chloride Solutions Containing Small Concentrations of Sulfide. J. Electrochem. Soc. 2010, 157, 338–345. [Google Scholar] [CrossRef]
  35. Awad, N.K.; Ashour, E.A.; Fouda, A.S.; Allam, N.K. Effect of alloying elements on the electrochemical behavior of Cu–Ni–Zn ternary system in sulfide-polluted saltwater. Appl. Surf. Sci. 2014, 307, 621–630. [Google Scholar] [CrossRef]
  36. Qin, Z.; Xia, D.-H.; Zhang, Y.; Wu, Z.; Liu, L.; Lv, Y.; Liu, Y.; Hu, W. Microstructure modification and improving corrosion resistance of laser surface quenched nickel–aluminum bronze alloy. Corros. Sci. 2020, 174, 108744. [Google Scholar] [CrossRef]
  37. Qin, Z.B.; Zhang, Q.; Luo, Q.; Wu, Z.; Shen, B.; Liu, L.; Hu, W.B. Microstructure design to improve the corrosion and cavitation corrosion resistance of a nickel-aluminum bronze. Corros. Sci. 2018, 139, 255–266. [Google Scholar] [CrossRef]
  38. North, R.F.; Pryor, M.J. the influence of corrosion product structure on the corrosion rate of Cu-Ni alloys. Corros. Sci. 1970, 10, 297–311. [Google Scholar] [CrossRef]
  39. Ma, A.L.; Jiang, S.L.; Zheng, Y.G.; Ke, W. Corrosion product film formed on the 90/10 copper–nickel tube in natural seawater: Composition/structure and formation mechanism. Corros. Sci. 2015, 91, 245–261. [Google Scholar] [CrossRef]
Figure 1. Scanning vibrating electrode technique (SVET) mappings (af) of the initial corrosion of NAB and the corresponding scanning electron microscope (SEM) photographs (gi) in 3.5% NaCl solution.
Coatings 13 00846 g001
Figure 2. Scanning vibrating electrode technique (SVET) mappings of the NAB surface before and after mechanical scratch in sulfide–free condition.
Coatings 13 00846 g002
Figure 3. Scanning vibrating electrode technique (SVET) mappings (ad) of the initial corrosion of NAB and the corresponding scanning electron microscope (SEM) photographs (eg) in 3.5% NaCl + 0.0005 M Na2S solution.
Coatings 13 00846 g003
Figure 4. Scanning vibrating electrode technique (SVET) mappings of the NAB surface before and after mechanical scratch in sulfide–polluted condition.
Coatings 13 00846 g004
Figure 5. Polarization curves of NAB in 3.5% NaCl and 3.5% NaCl + 0.0005 M Na2S solutions.
Coatings 13 00846 g005
Figure 6. Electrical equivalent circuit used to simulate the electrochemical impedance spectroscopy (EIS) data of NAB in 3.5% NaCl and 3.5% NaCl + 0.0005 M Na2S solutions for 1–5 d (a) and 10–40 d (b).
Coatings 13 00846 g006
Figure 7. Electrochemical impedance spectroscopy (EIS) of NAB in 3.5% NaCl: (a) Nyquist plots; (b) Bode plots with impedance and phase angle; and in 3.5% NaCl + 0.0005 M Na2S: (c) Nyquist plots; (d) Bode plots with impedance and phase angle.
Coatings 13 00846 g007aCoatings 13 00846 g007b
Figure 8. Scanning electron microscope (SEM) photograph of the NAB exposed to (a,b): 3.5% NaCl solution for 24 h; (c,d): 3.5% NaCl + 0.0005 M Na2S solution for 24 h; (e,f): 3.5% NaCl solution for 40 days; (g,h): 3.5% NaCl + 0.0005 M Na2S solution for 40 days.
Coatings 13 00846 g008
Figure 9. Scanning electron microscope (SEM) and energy-dispersive spectroscopy (EDS) results of the NAB corrosion products in (a) 3.5% NaCl; (b) 3.5% NaCl + 0.0005 M Na2S solution for 40 days.
Coatings 13 00846 g009
Figure 10. X-ray diffraction (XRD) pattern of the NAB corrosion products in 3.5% NaCl and 3.5% NaCl + 0.0005 M Na2S solution for 40 days.
Coatings 13 00846 g010
Figure 11. X-ray photoelectron spectroscopy (XPS) survey spectra of the NAB corrosion products: (a) the total spectra; (b) the spectrum of different elements in 3.5% NaCl solution; (c) the spectrum of different elements in 3.5% NaCl + 0.0005 M Na2S solution for 40 days.
Coatings 13 00846 g011
Figure 12. Schematic of the corrosion mechanism when the NAB is exposed to: (a) 3.5% NaCl solution; (b) 3.5% NaCl + 0.0005 M Na2S solution.
Coatings 13 00846 g012
Table 1. Chemical composition of nickel aluminum bronze (NAB).
ElementAlMnFeNiCu
wt.%9.21.54.64.380.4
Disclaimer/Publisher’s Note: The statements, opinions and data contained in all publications are solely those of the individual author(s) and contributor(s) and not of MDPI and/or the editor(s). MDPI and/or the editor(s) disclaim responsibility for any injury to people or property resulting from any ideas, methods, instructions or products referred to in the content.

