Article

Optical Characterization of Inhomogeneous Thin Films Deposited onto Non-Absorbing Substrates

Department of Physical Electronics, Faculty of Science, Masaryk University, Kotlářská 2, 611 37 Brno, Czech Republic
*
Author to whom correspondence should be addressed.
Coatings 2023, 13(5), 873; https://doi.org/10.3390/coatings13050873
Submission received: 31 March 2023 / Revised: 2 May 2023 / Accepted: 3 May 2023 / Published: 5 May 2023

Abstract

:
In this study, a novel approach for characterizing the optical properties of inhomogeneous thin films is presented, with a particular focus on samples exhibiting absorption in some part of the measured spectral range. Conventional methods of measuring the samples only from the film side can be limited by incomplete information at the lower boundary of the film, leading to potentially unreliable results. To address this issue, depositing the thin films onto non-absorbing substrates to enable measurements from both sides of the sample is proposed. To demonstrate the efficacy of this approach, a combination of variable-angle spectroscopic ellipsometry and spectrophotometry at near-normal incidence was employed to optically characterize three inhomogeneous polymer-like thin films. The spectral dependencies of the optical constants were modeled using the Kramers–Kronig consistent model. It was found that it is necessary to consider thin, weakly absorbing transition layers between the films and the substrates. The obtained results show excellent agreement between the fits and the measured data, providing validation of the structural and dispersion models, as well as the overall characterization procedure. The proposed approach offers a method for optically characterizing a diverse range of inhomogeneous thin films, providing more reliable results when compared to traditional one-sided measurements.

1. Introduction

Efficient and reliable characterization techniques for thin films are essential for investigating their optical properties in various fields, including fundamental research, applied research, and industrial innovations. As a result, the development of such methods is imperative.
While significant attention has been dedicated to developing suitable methods for the optical characterization of homogeneous thin films, as evidenced by the abundance of publications on the subject represented here by a small selection [1,2,3,4,5,6,7,8,9], much less attention has been paid to the optical characterization of inhomogeneous thin films with refractive index profiles along the axis perpendicular to the film boundaries. Nevertheless, several papers have addressed this issue [10,11,12,13,14,15,16,17,18,19,20,21,22,23,24]. The optical characterization of inhomogeneous thin films is more complicated than that of homogeneous thin films, mainly due to a larger number of parameters that need to be determined. Despite this, interest in the optical characterization of inhomogeneous thin films has been growing in recent years for three reasons.
First, the production of multilayer systems tends towards inhomogeneous thin films that can substitute these systems. A typical example of this is represented by Rugate filters formed by inhomogeneous thin films with special refractive index profiles. These Rugate filters are employed as optical devices with high reflectance in certain spectral ranges (see, e.g., [25]). Optical devices based on inhomogeneous thin films exhibit several advantages from a practical point of view. For example, they exhibit a substantially lower scattering of light, caused by boundary roughness rather than the multilayer systems containing homogeneous thin films.
Second, the development in the optics industry, solar energetics, semiconductor technology, and other modern industrial branches requires creating new thin films consisting of complex materials. These complex thin films often exhibit optical inhomogeneity that must be characterized by specific optical methods. The typical examples of such films are represented by various thin films containing nanometric structures.
Third, some special methods of optical characterization for inhomogeneous thin films are also utilized for checking their growth in technological equipment (in situ methods). A sufficient speed must be achieved using efficient computer algorithms utilized within these in situ methods. Such methods enable us to accomplish real-time monitoring and feedback control of the inhomogeneous thin films during their depositions.
Both homogeneous and inhomogeneous thin films often exhibit various types of defects, including thickness non-uniformity, random roughness at boundaries, overlayers, and transition layers. The inhomogeneity of intended homogeneous thin films is also considered an unwanted defect. Optical characterization of thin films with defects is significantly more complex than that of films without defects, irrespective of film homogeneity. Similarly, just as less attention is given to inhomogeneous films compared to homogeneous ones, fewer resources are devoted to analyzing films with defects compared to those without, regardless of the homogeneity of the samples. The method allowing to carry out the optical characterization of homogeneous thin films exhibiting thickness non-uniformity is presented and applied in papers [26,27,28,29]. The methods of the optical characterization of the inhomogeneous thin films with the non-uniformity in thickness are described and applied in papers [30,31]. By means of the application of the methods published in papers [26,27,28,30,31] the spectral dependencies of the optical constants and thickness values describing the films together with the parameters characterizing their thickness non-uniformity were determined. The methods for the optical characterization of homogeneous thin films with randomly rough boundaries were described, for example, in [32,33,34]. The methods presented in [35,36] enable to perform the optical characterization of the inhomogeneous thin films exhibiting randomly rough boundaries. The results of the optical characterization of the homogeneous and inhomogeneous thin films with randomly rough boundaries consist in the determined spectral dependencies of the optical constants, thickness values, and values of the parameters describing random roughness of the boundaries (see papers [32,33,34,35,36]). The results concerning the optical characterization of the homogeneous thin films with overlayers are published, for example, in papers [37,38]. In these papers, the thickness values of the overlayers are determined together with the values of the other parameters describing the films under these overlayers. The overlayers exhibiting inhomogeneity were characterized, for example, in [39,40]. The optical characterization of the transition layers was realized, for instance, in [41,42,43,44,45,46]. The spectral dependencies of the optical constants and thickness values of these transition layers are determined within this characterization. Simultaneously, the complete optical characterization of the films occurring above the transition layers is performed too (see, e.g., [43]). It should be noted that the optical characterization of the thin films and their overlayers or transition layers presented in the literature was carried out using the optical quantities corresponding to reflected light (see, e.g., [38,39,40,41,42,43,44,45,46]).
From this, one can see that the optical characterization of thin films is a continually developing branch of optical thin films.
In this paper, the method enabling us to perform the reliable and efficient optical characterization of inhomogeneous partially absorbing thin films placed on non-absorbing substrates is described. Within this method, the optical characterization of the transition layers occurring at the lower boundaries of these films is also performed. The method is based on the simultaneous processing of experimental data obtained by means of variable angle spectroscopic ellipsometry and spectroscopic photometry. Indispensable parts of the method are ellipsometric and reflectometric measurements from both sides of the samples as well as the measurements of transmittance. The method will be illustrated through the optical characterization of samples of polymer-like thin films deposited onto fused silica (Lithosil) substrates.

2. Experiment

The results concerning three samples of inhomogeneous polymer-like thin films are presented in this paper. All the samples were prepared such that they should differ only in the thickness of the films.

2.1. Sample Preparation

The studied films were deposited onto LithosilQ1 fused silica optical substrates using plasma-enhanced chemical vapor deposition (PECVD) in a capacitively coupled radio frequency–glow discharge at a working frequency of 13.56 MHz. PECVD is a versatile technique for developing advanced thin film materials from various vapors and gases. The advantage of this technique lies in the possibility to change the parameters of the deposited material only by changing deposition process parameters, such as the applied power, negative bias voltage, flow rates of precursors and carrier gases, deposition pressure, etc. Using this method, it is possible to prepare inorganic materials (such as SiO x and diamond-like carbon) as well as polymer-like materials (so-called plasma-polymer). Plasma polymers (polymer-like materials) differ from conventional polymers from a chemical and physical point of view. One of the main differences is the more random organization and the deviation from the chemical structure of the monomer used [47]. One of the most well-known polymer-like thin film materials prepared using PECVD is the polymer-like carbon [48,49,50]. Another group of well-known polymer-like layers are organosilicon (SiO x C y H z ) plasma polymers [51,52]. A combination of these two types of materials in films with a gradient structure may serve as protective coatings on plastic materials with a gradient change from a softer transparent polymer-like structure with similar mechanical properties as polycarbonate to a harder but more absorbing polymer-like a-C:H/SiO x film structure [53,54,55]. The presented work uses this type of gradient polymer-like layers to illustrate the novel approach to optical characterization.
The gradient film deposition was carried out using a parallel plate reactor made of a glass cylinder closed by two stainless steel flanges and with two parallel electrodes made of graphite. The RF power was applied to the lower electrode, together with a negative DC self-bias voltage induced in order to control the ion bombardment of the sample surface. Prior to film deposition, the substrates were pretreated for 5 min in an argon discharge at an applied power of 50 W, a bias voltage of −240 V, and a flow rate of argon of 5 sccm. The discharge used for film deposition was ignited in a mixture of methane (CH 4 ) and hexamethyldisiloxane (C 6 H 18 Si 2 O—HMDSO) supplied into the reactor chamber by a glass torus with many outlets on its perimeter, in order to achieve a homogeneous distribution of the gas mixture. The flow of HMDSO was maintained at 1 sccm. To vary the composition of the growing films, the methane flow rate was gradually increased from 0 sccm to 5 sccm for three different deposition times (170 s, 220 s, and 360 s) to create three samples with different thicknesses. The supplied power was 50 W. The negative self-bias voltage on the bottom electrode gradually increased from −110 V at the beginning of the deposition to −190 V at its end. The pressure at the beginning of the deposition was 33 Pa and decreased to 15 Pa at the end. The process of film preparation is summarized in Table 1.

2.2. Experimental Arrangement

Experimental data were acquired using variable angle spectroscopic phase modulated ellipsometer Horiba Jobin Yvon UVISEL and spectrophotometer Perkin Elmer Lambda 1050. Concrete experimental arrangements of such instruments can be found, for example, in [55,56]. Spectrophotometric data were obtained with a near-normal incidence regime, the ellipsometric data at the angle of incidence in the range from 55° to 75° with the step of 5°. The data cover the spectral range of 0.6 to 6.5 eV (190–2066 nm) and 190–1800 nm (0.688 to 6.5 eV) for ellipsometry and spectrophotometry, respectively.
The complete set of experimental data for each sample consists of ellipsometric measurements from the side of the deposited film (front side), ellipsometric measurements from the substrate side (back side), reflectance measurements from both sides of the sample, and transmittance measurements.
In the region of transparency, reflectance data exhibit small differences between measurements taken from the front and back sides with the dominant features corresponding to the substrate. To mitigate the influence of the substrate and enhance the sensitivity to the properties of the film, this set of data was extended with the values of relative reflectance. The relative reflectance, denoted by R fb , represents the ratio between the front-side ( R f ) and back-side ( R b ) reflectances:
R fb = R f R b
These additional datasets are not independent of the already included experimental data, but they help to stabilize the fits. The complete list of datasets used for optical characterization is summarized in Table 2.

3. Structural Model

The samples consist of LithosilQ1 fused silica substrates with a nominal thickness of 0.5 mm, onto which inhomogeneous polymer-like thin films were deposited. The substrate is assumed to be plan-parallel and isotropic with smooth boundaries. However, the harsh cleaning procedure necessary for adequate adhesion of the polymer-like thin film to the substrate resulted in the alteration of excitation states near the surface, necessitating the introduction of a thin transition layer into the structural model. The film itself is considered to be inhomogeneous but with smooth boundaries, and its inhomogeneity is mathematically described as a stack of homogeneous films with changing parameters. In this study, we divided the inhomogeneous film into 64 homogeneous layers.
The profile of the optical constants is modeled by assuming profiles of the dispersion parameters p α ( z ) , where the index α distinguishes individual dispersion parameters and z is the depth inside the film. The optical constants for the given photon energy E and depth inside the inhomogeneous film were then calculated using the considered dispersion model and the values of the dispersion parameters corresponding to this depth. In particular, the susceptibility as a function of the photon energy and the position inside the inhomogeneous film can be expressed as
χ ^ ( E , z ) = χ ^ ( E ; p α ( z ) ) .
The profile of the dispersion parameters was assumed to be in the form of
p α ( z ) = p α U + p α L p α U z d k ,
where d is the thickness of the inhomogeneous film and the upper indices U and L denote the values of said parameters at the upper and lower boundary. The k exponent allows for modeling the shape of the profile (for k = 1 , the resulting profile is linear).
The used structural model of the samples is schematically depicted in Figure 1.
To summarize:
The surrounding medium is assumed to be air.
Studied film is optically isotropic and inhomogeneous with the profile of optical constants perpendicular to the film boundary.
The transition layer is modeled by an isotropic homogeneous thin layer.
The substrate is also isotropic, homogeneous, and of sufficient thickness to disregard light interference within the substrate.
All boundaries are assumed to be smooth and parallel.

4. Dispersion Model of the Inhomogeneous Film

The model of the dielectric response of the inhomogeneous films is based on the universal dispersion model [57,58], which makes it easy to construct complex models fulfilling the basic requirements of physically correct models, namely, time-reversal symmetry, Kramers–Kronig relations, and consistency with sum rules. In this model, the dielectric response is expressed as a sum of contributions representing individual absorption processes. The polymer-like thin films containing larger amounts of carbon, especially those transitioning to diamond-like carbon, often exhibit complicated dielectric response. To correctly interpret their dielectric response, it is necessary to think about the sp 2 and sp 3 orbital hybridization. In the model of dielectric response, it is useful to distinguish between the contributions from σ electrons which exhibit stronger bonding, and the contribution from weakly bonded π electrons. In our model, this is accomplished by describing the interband transitions using two separate (but partially overlapping) absorption bands, each having its own band-gap energy. In particular, the susceptibility is written as
χ ^ ( E ) = N 0 , σ χ ^ ibt 0 ( E ; E g , σ ) + N σ χ ^ CC 0 ( E ; E g , σ , E c , σ , B σ ) + N π χ ^ CC 0 ( E ; E g , π , E c , π , B π ) ,
where the first two contributions describe the absorption band corresponding to electrons exhibiting stronger bonding and the last contribution represents the absorption band corresponding to weakly bonded π electrons. The functions with superscript 0 denote contributions to susceptibility normalized using the sum rule integral, such that
0 E χ ν , i 0 ( E ; ) d E = 1 ,
where ν = ibt , CC and the symbols χ ν , i 0 ( E ; ) denote the imaginary parts of the normalized contributions to susceptibility. The factors with N σ , 0 , N σ and N π then determine the strengths of individual contributions. The symbols E g , σ and E g , π denote the band gap energies of the two absorption bands. It is obvious that total transition strength, which can be calculated using the sum rule integral, is given as
0 E χ i ( E ) d E = N 0 , σ + N σ + N π ,
where χ i ( E ) is the imaginary part of susceptibility.
The contribution χ ^ ibt 0 ( E ; E g , σ ) represents the absorption band starting at the band gap energy E g , σ and extending to infinity. Its imaginary part is given as
χ ibt , i 0 ( E ; E g , σ ) = 0 , for E E g , σ , 3 E g , σ ( E E g , σ ) 2 E 5 , for E > E g , σ , .
The contributions χ ^ CC 0 ( E ; E g , j , E c , j , B j ) , with j = σ , π correspond to the Campi–Coriasso dispersion model with imaginary part given as [58,59]
χ CC , i 0 ( E ; E g , j , E c , j , B j ) = 0 , for E E g , j , 2 π E B j ( E E g , j ) 2 [ ( E c , j E g , j ) 2 ( E E g , j ) 2 ] 2 + B j 2 ( E E g , j ) 2 , for E > E g , j ,
where the parameters E c , j (with E c , j > E g , j ) and B j determine the position and width of the absorption peak. Note that the contributions χ ^ ibt 0 and χ ^ CC 0 fulfill the Tauc’s law above the band gap energy and have classical E 3 decay at large energies [60,61,62].
The real parts of the above contributions can be calculated from their imaginary parts using the Kramers–Kronig relations. Details can be found in [63].

5. Dispersion Model of the Transition Layer

It is assumed that the transition layer corresponds mostly to the upper layer of the fused silica substrate modified by cleaning in the argon plasma prior to the deposition of the inhomogeneous film. Because the number of dispersion parameters needed to describe the inhomogeneous film is already large, it was desirable to use as few parameters as possible in the dispersion model of the transition layer. The reason for using a simple model for the transition layer is also motivated by the fact that this layer is very thin; therefore, the sensitivity of the experimental data to the precise course of its optical constants is low. It was found that it was sufficient to use a model assuming the susceptibility given as a sum of the susceptibility of the substrate χ ^ substrate multiplied by dimensionless scaling factor f and a contribution corresponding to the exponential tail, which models weak absorption below the band gap energy. The susceptibility is given as
χ ^ tl ( E ) = f χ ^ substrate ( E ) + N et χ ^ et 0 ( E ; E g , E et ) ,
where N et determines the strength of the contribution representing the exponential tail. The susceptibility of the substrate χ ^ substrate ( E ) corresponds to fixed values of the optical constants, which were determined separately by the optical characterization of bare substrates without deposited films. The imaginary part of the contribution representing the exponential tail is given as
χ et , i 0 ( E ; E g , E et ) = C et e E / E et + e E / E et 2 E , for E E g , C et A x ( E E x ) 2 E 5 , for E > E g , ,
where E et is the energy determining the decay rate of the exponentials and the value of C et is calculated such that this function fulfills the normalization condition (4). This function is chosen such that below the band gap energy E g it is modeled using exponentials and above the band gap energy it transitions to a function having the same shape as the function χ ibt , i 0 (6), but with E x in place of E g , σ . The values of E x and A x are not independent parameters, they are calculated such that the function χ et , i 0 and its first derivative are continuous at E = E g . The real part of the susceptibility is calculated from the imaginary part using the Kramers–Kronig relations.
Only three dispersion parameters f, N et , and E et are used in the dispersion model of the transition layer, the value of E g used in the formulae for the exponential tail was fixed in the value 8.352 eV determined for the substrate. In fact, only two of the parameters were free, as the parameter f tended towards zero for all samples and was, therefore, fixed at that value. Consequently, the susceptibility of the transition layer is solely described by the exponential term.

6. Data Processing

The quantities obtained through phase-modulated ellipsometry, called associated ellipsometric parameters, are not immediately self-explanatory, unlike the measured quantities of spectrophotometry. These parameters, denoted by I s , I c , and I n , correspond to the three independent elements of the normalized Mueller matrix of isotropic systems, which can be expressed as
M = R 1 I n 0 0 I n 1 0 0 0 0 I c I s 0 0 I s I c ,
where R = ( R p + R s ) / 2 is the average reflectance with R p and R s being reflectances of p- and s-polarized light, respectively. The relationships between the associated ellipsometric parameters and well-known ellipsometric angles are given by
I s = P sin 2 Ψ sin Δ ,
I c = P sin 2 Ψ cos Δ ,
I n = P cos 2 Ψ ,
where P represents the observed degree of polarization.
When conducting measurements on a non-absorbing substrate, it is necessary to consider the reflections that occur on the back side of the substrate. There are an infinite number of internal reflections within the substrate that must be taken into account. For measurements taken at near-normal incidence, such as reflectance and transmittance measurements, the task is relatively straightforward. However, for measurements taken at oblique incidence, such as in ellipsometry, it is necessary to consider the finite width of the incident beam. This is because the beam undergoes multiple reflections inside the substrate, causing it to shift in relation to the beam reflected from the top interface of the substrate. In this case, the Mueller matrix for the reflection in the case of front-side and back-side measurement can be calculated as
R = R f + c 1 T f U R a U T f + c 2 T f U R a U R f U R a U T f + = R f + n = 0 c n + 1 T f U R a U R f U R a U n T f ,
R = R a + c 1 T a U R f U T a + c 2 T a U R f U R a U R f U T a + = R a + n = 0 c n + 1 T a U R f U R a U R f U n T a ,
where the notations R and T denote the Mueller matrices that correspond to reflection and transmission, respectively. The subscripts f and a are used to distinguish the substrate interfaces facing the film and facing the ambient (back side of the sample). The prime is used for quantities corresponding to light incident from the ambient side (back side), while the quantities without prime correspond to incidence from the film side. The propagation through the isotropic substrate, which results in the attenuation of the beam, is described by the Mueller matrix U , which, in the special case of the non-absorbing substrate, is equal to the identity matrix. The beams corresponding to the second and subsequent terms in the sum are shifted due to propagation through the substrate and as a result, only part of them falls onto the detector. Therefore, their contribution to the sum must be appropriately reduced, which is accomplished by introducing the factors c n . For example, the R f Mueller matrix representing reflection on the boundary between the film and substrate in the situation when the wave is incident from the film side has the following form:
R f = 1 2 | r ^ p | 2 + | r ^ s | 2 | r ^ p | 2 | r ^ s | 2 0 0 | r ^ p | 2 | r ^ s | 2 | r ^ p | 2 + | r ^ s | 2 0 0 0 0 r ^ p * r ^ s * + r ^ p * r ^ s * i r ^ p * r ^ s * i r ^ p * r ^ s * 0 0 i r ^ p * r ^ s * i r ^ p * r ^ s * r ^ p * r ^ s * + r ^ p * r ^ s * ,
with r ^ p and r ^ s being the Fresnel coefficient for p and s polarization, respectively. The rest of the matrices in Equations (13) and (14) has a similar form. Further details on these concepts are provided in [20,64].
Ellipsometry and spectrophotometry are commonly used methods in optical characterization, and while they are commonly used independently, combining them can offer advantages by leveraging their strengths.
To ensure the reliability of the obtained results, all data for each sample, i.e., data from both ellipsometric and spectrophotometric measurements, were processed simultaneously using the least-squares method with our in-house developed newAD2 software [65] for optical characterization. The contribution of individual datasets from different instruments with different systematic errors and spectral ranges to the residual sum of squares is not trivial to equalize in general, but newAD2 automatically accounts for these differences. By using this approach, the reliability of the results is improved.
Two values of the thickness of each sample of the inhomogeneous film were determined, one from the spectrophotometric measurements, and the other one from the ellipsometric measurements. This division is necessary due to the different systematic errors of the instruments. The second reason for the division lies in the fact that the samples might exhibit slight non-uniformity in thickness and it is not possible to ensure that all measurements were at the exact same spot on the sample.

7. Results and Discussion

This section presents the results of the optical characterization of the investigated samples. Although three samples differing in thickness were evaluated, full results for just one sample are shown, specifically for sample #2, due to the vast amount of data. The quality of the fits for the other two samples is comparable.
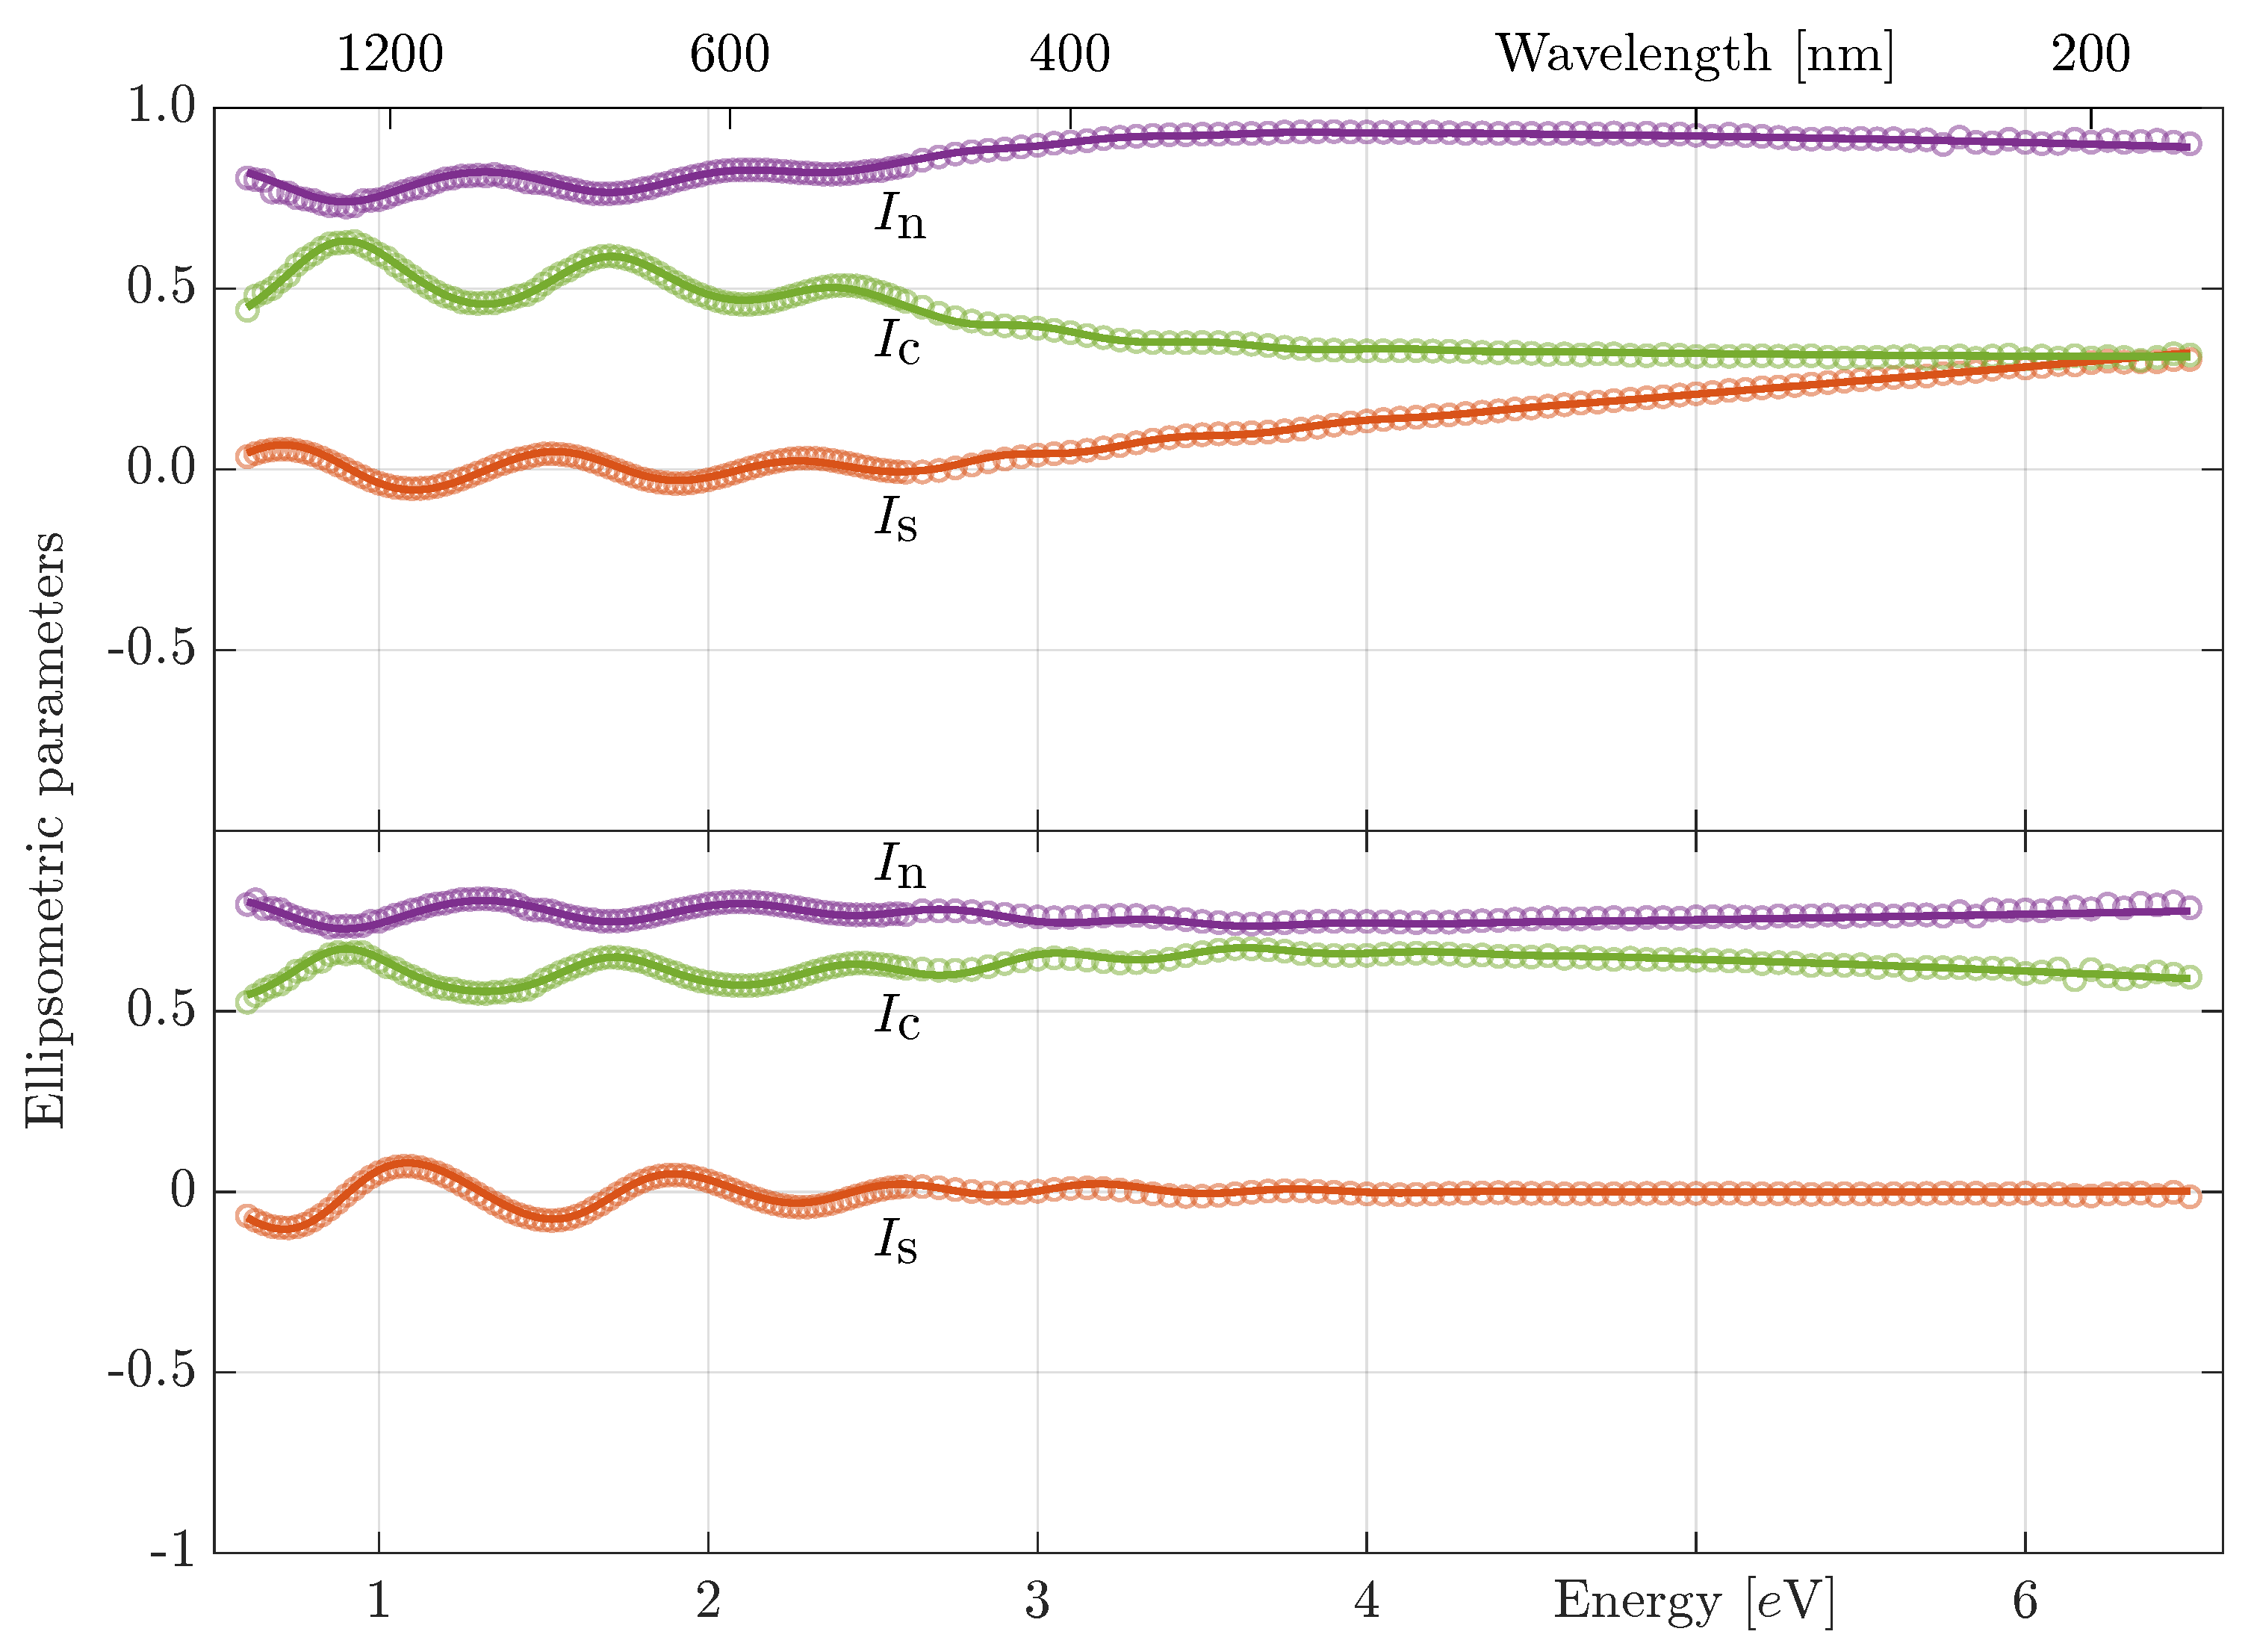
Figure 2 shows the spectral dependencies of the ellipsometric parameters and their respective fits. The figure displays measured data from both sides of the sample and indicates good agreement between experimental data and theoretical fits.
In the experiment, as mentioned, ellipsometric measurements were performed using the Horiba Jobin Yvon UVISEL ellipsometer. Typical measurements require approximately eight hours to complete. However, it should be noted that this particular ellipsometer features a monochromator located after the sample, which can be problematic for samples that are sensitive to UV radiation, such as our samples. This is due to the fact that during the whole measurement process, the entire intensity and all wavelengths of light interact with the sample, which could potentially damage the thin film. To mitigate this issue, the ellipsometric measurements were divided into two procedures. The first procedure utilized classical settings and a UV filter and was performed for energies below 2.5 eV. The second procedure involved a smaller number of measured data points and was used for higher energies in order to reduce the exposure to UV radiation and accelerate the measurement process.
The top panel of Figure 3 depicts the spectral dependencies of reflectance measurements. Similar to the ellipsometric measurements, front-side and back-side measurements are shown, with a small mismatch observed in the data around 1.5 eV. To cover the wide spectral range of the spectrophotometric measurements, the experiment had to be split into two parts. Each part was measured with different settings and with different reference samples, resulting in the observed mismatch. However, the presented fitting procedure accounts for this mismatch, as evidenced by the fitted curves. It is worth noting that the front-side and back-side data almost overlap each other in the transparent region (approximately below 2 eV). This behavior was expected and it is one of the reasons why previously mentioned additional relative reflectance data were included in the dataset. This additional relative reflectance is plotted in the lower panel of Figure 3.
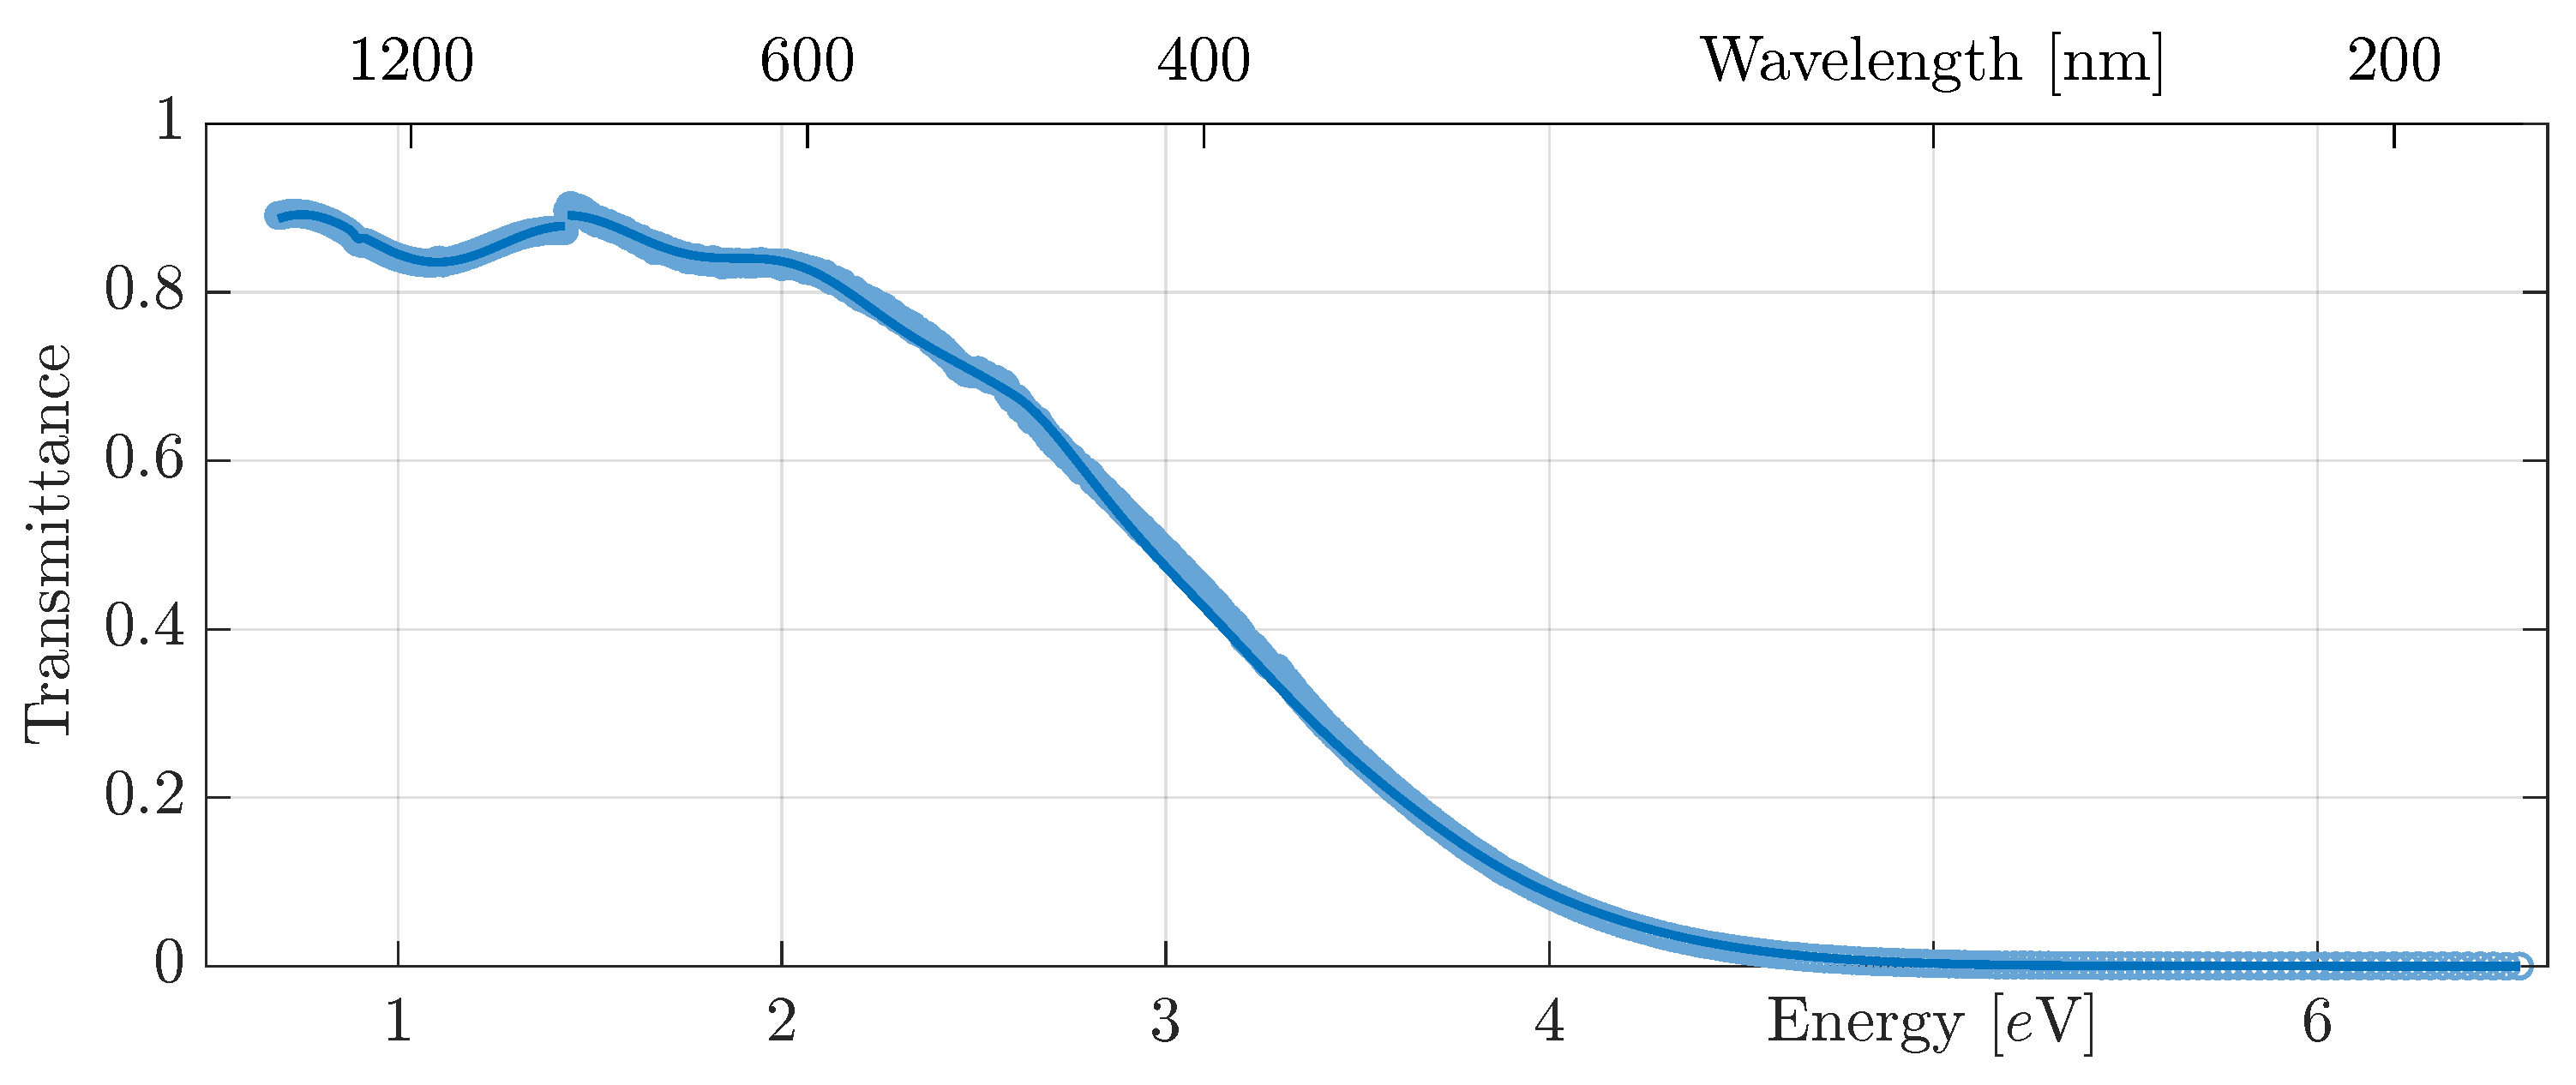
All the datasets have been described, with the exception of one. The final set of data used for optical characterization corresponds to the transmittance measurement and it is depicted in Figure 4.
The good quality of the fits is readily apparent and serves as compelling evidence for the validity of the performed optical analysis. This optical analysis resulted in a set of structural and dispersion parameters, which are listed in the following tables. Table 3 provides an overview of the structural parameters obtained during the optical characterization.
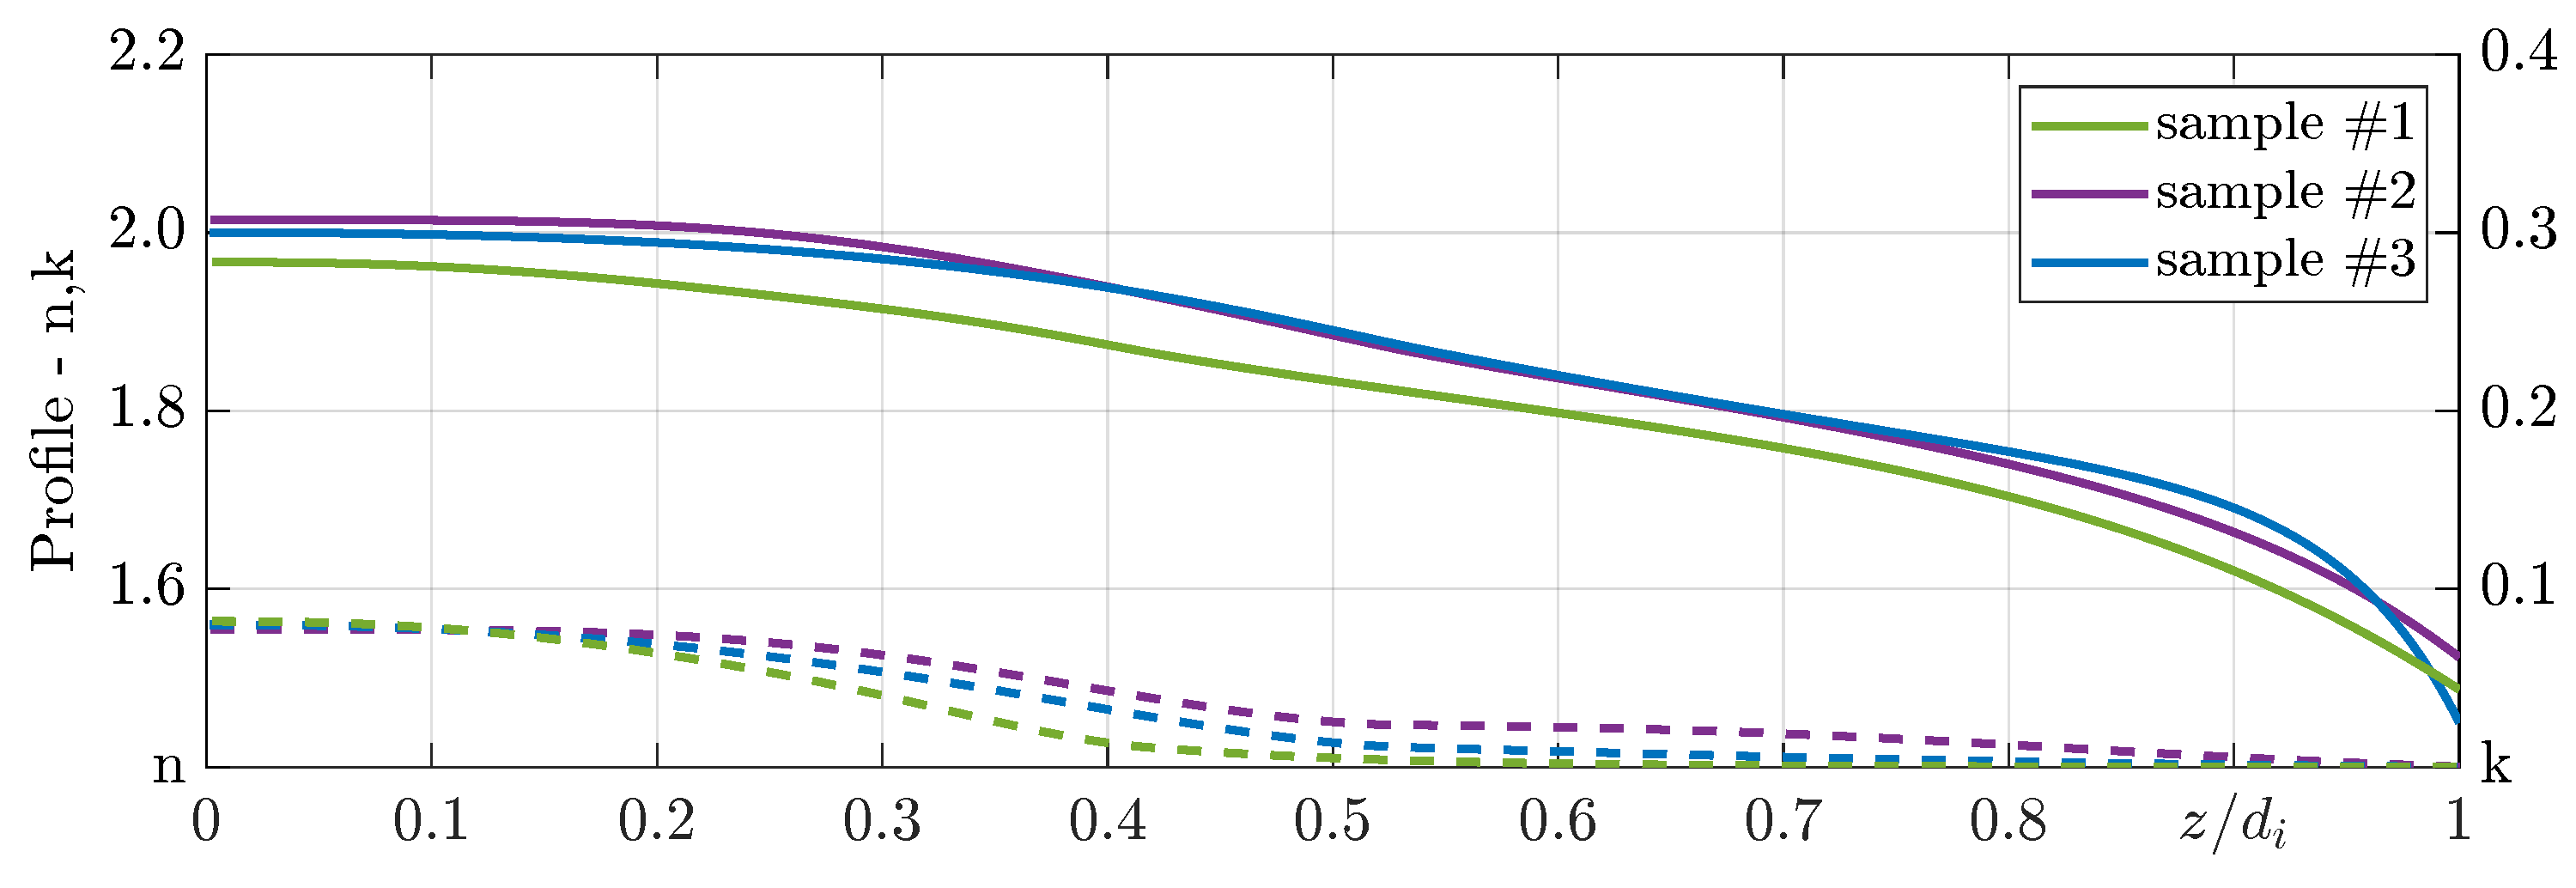
As previously stated, two thicknesses were determined for each sample, one corresponding to the ellipsometric and the other to the spectrophotometric measurements. As can be seen, the two values differ only slightly, which supports the correctness of the fit. The thicknesses of the transition layers which exhibit good correspondence with each other are also included in the table. The last line of the table focuses on the k parameter of the inhomogeneity profile described by the Equation (2). While the k parameter differs from sample to sample, the profiles of the optical constants obtained are consistent across all samples, despite said variations in parameters and the uncertain repeatability of the deposition process. Figure 5 depicts a comparison of the profile shapes of the optical constants for the selected photon energies among the three samples. Note the small influence of the k parameter on the resulting profiles.
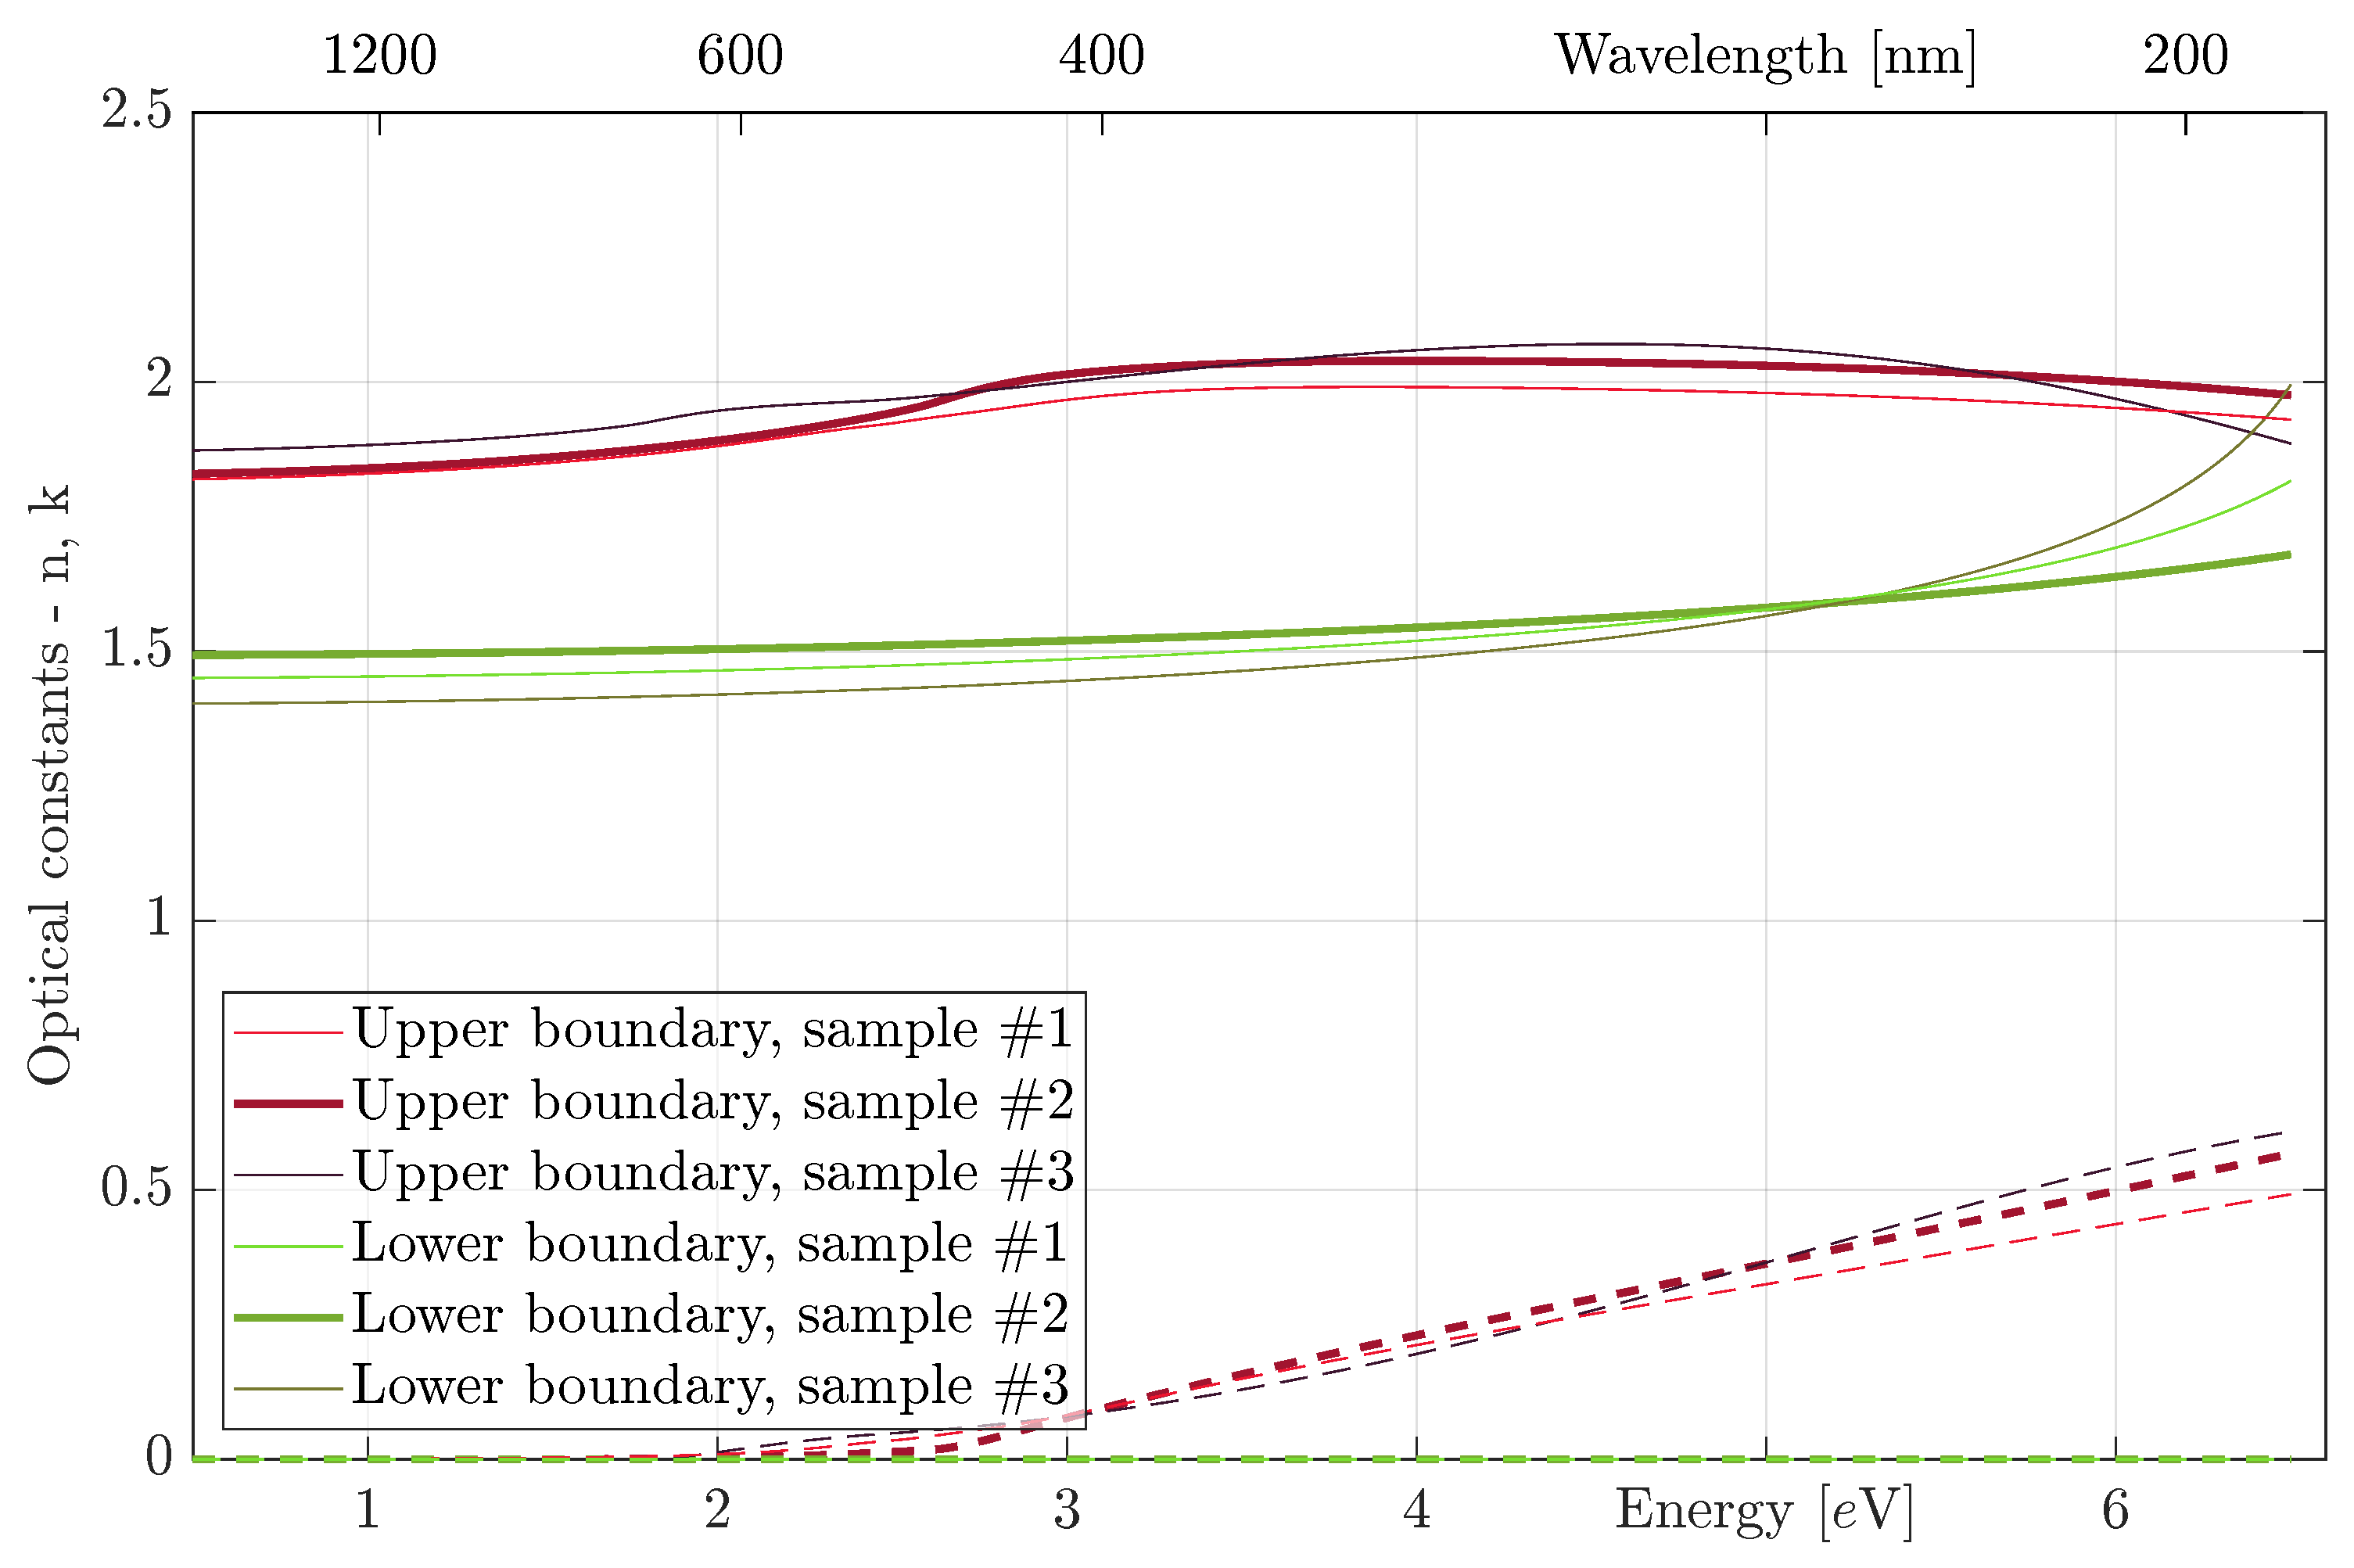
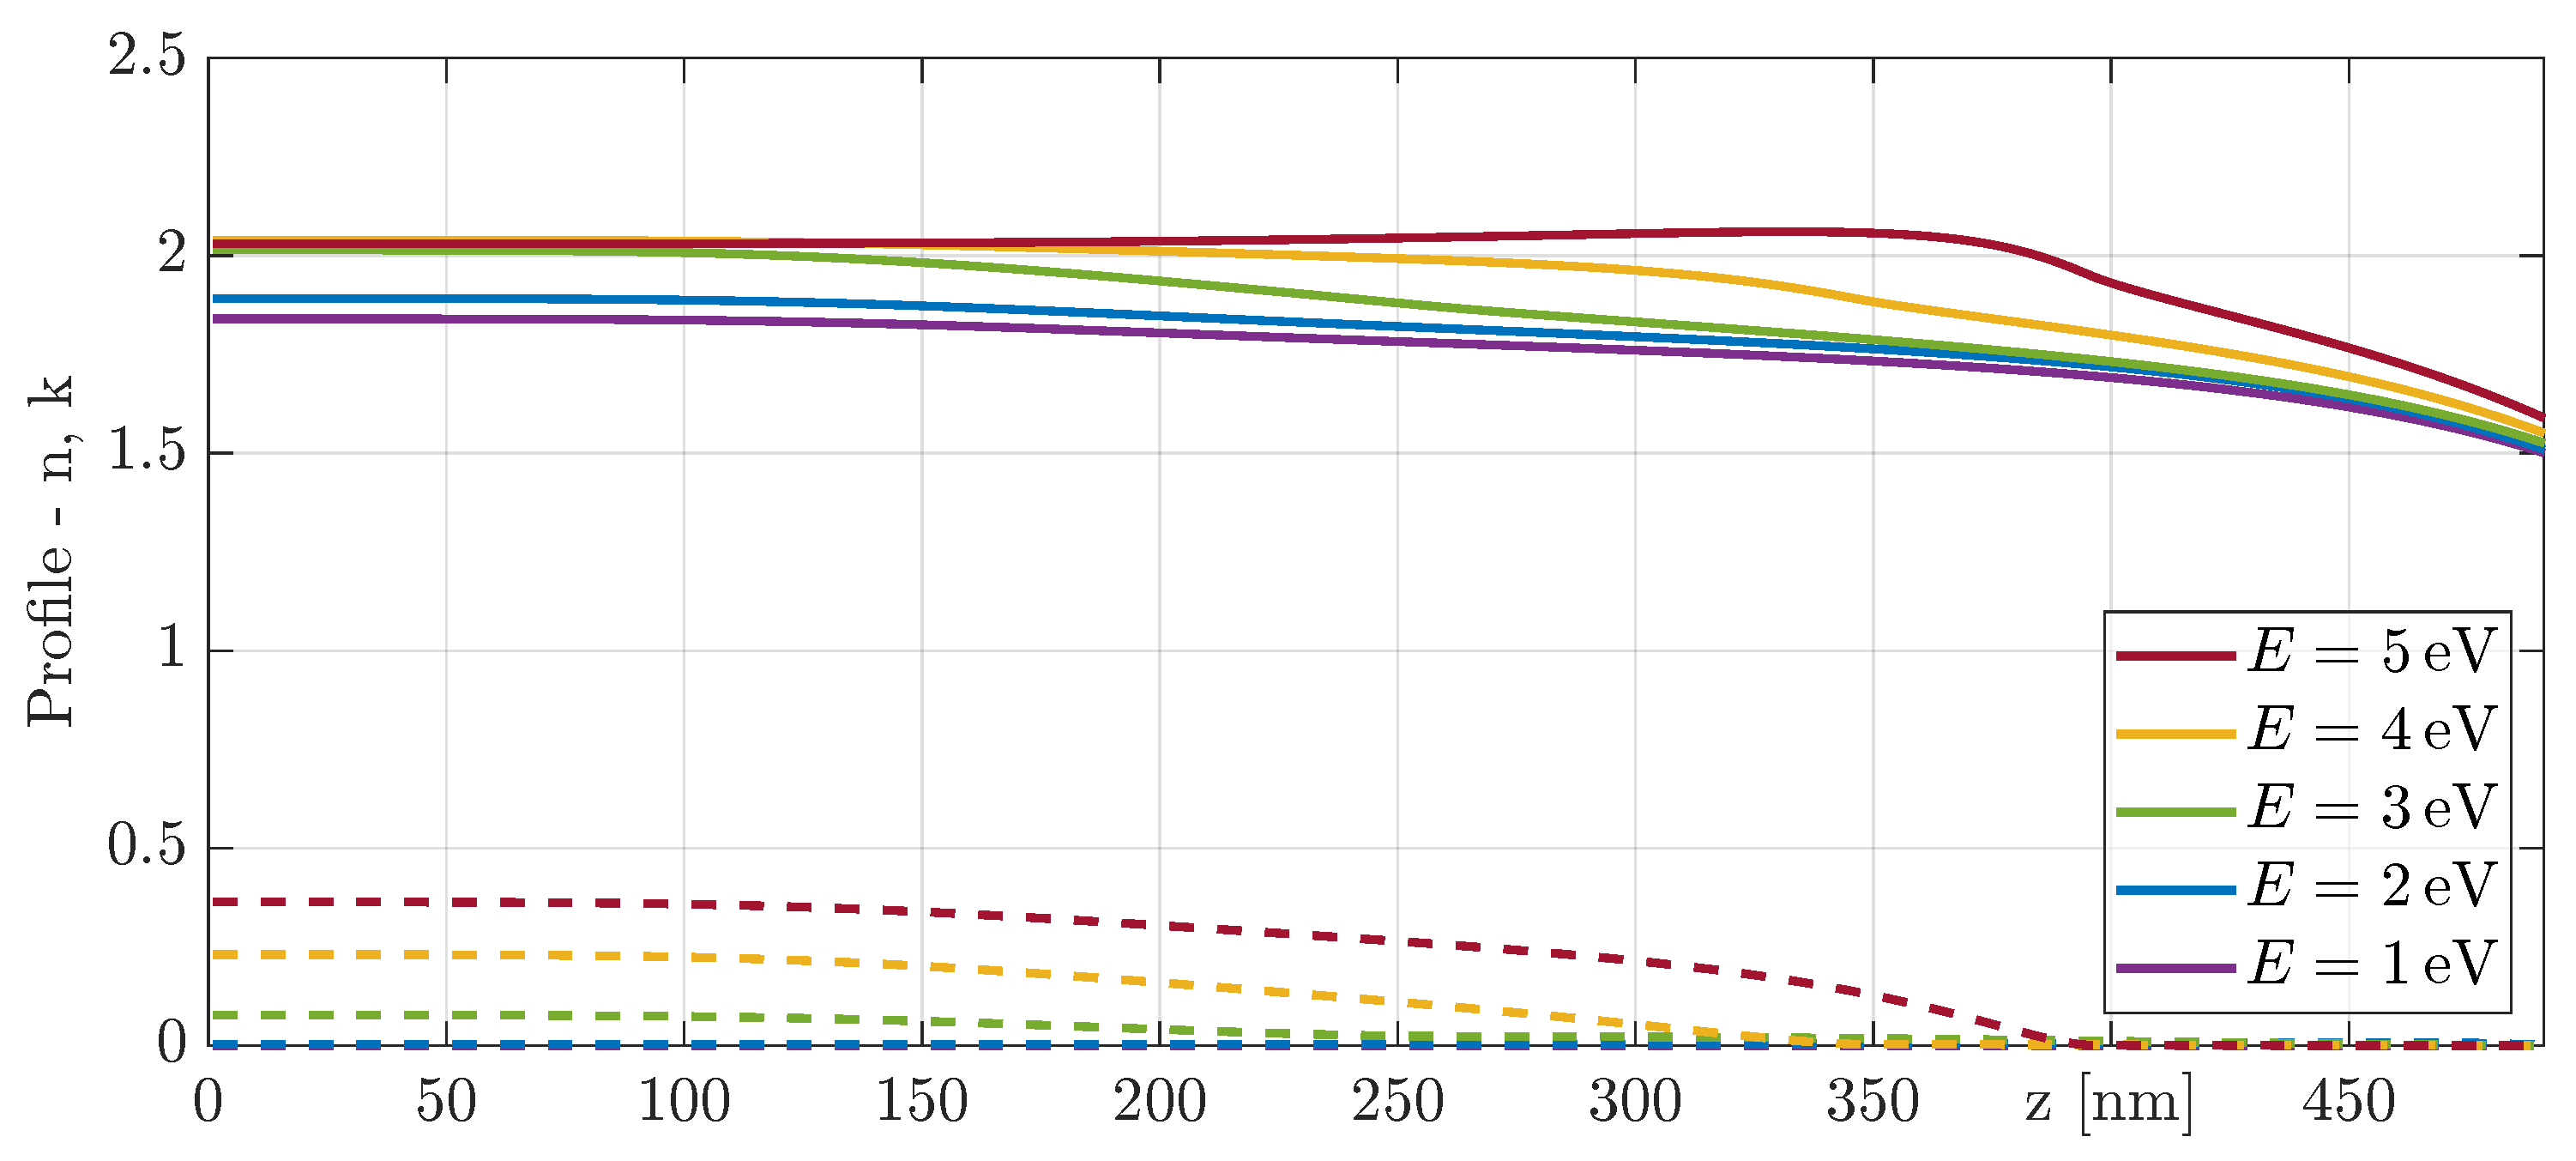
The dispersion parameters obtained for the inhomogeneous polymer-like thin film discussed in Section 4 and Section 5 are summarized in a tabular form in Table 4. Additionally, the table includes transition layer parameters. The optical constants of the inhomogeneous films are illustrated in Figure 6, which depicts the optical constants at the upper and lower boundaries. Moreover, Figure 7 displays detailed profiles of the optical properties at several photon energies.
Several of the parameters in the model were tied to other variables, as indicated by the name of the variable to which the parameter is tied. The parameters for the upper and lower boundaries were differentiated by superscripts U and L, respectively. In the case of the σ electron peak, the peak position was found to be significantly higher than the spectral range of our measurements, resulting in limited information about its shape. To stabilize the variables, the parameters B σ U and B σ L were tied together. Similar reasoning holds to tying parameter E c , σ L to E g , σ L . Because of the position above the measured data, the position of σ electron peak converges to the band gap energy of the σ electrons which leads to the simpler band gap model.

Transition Layer

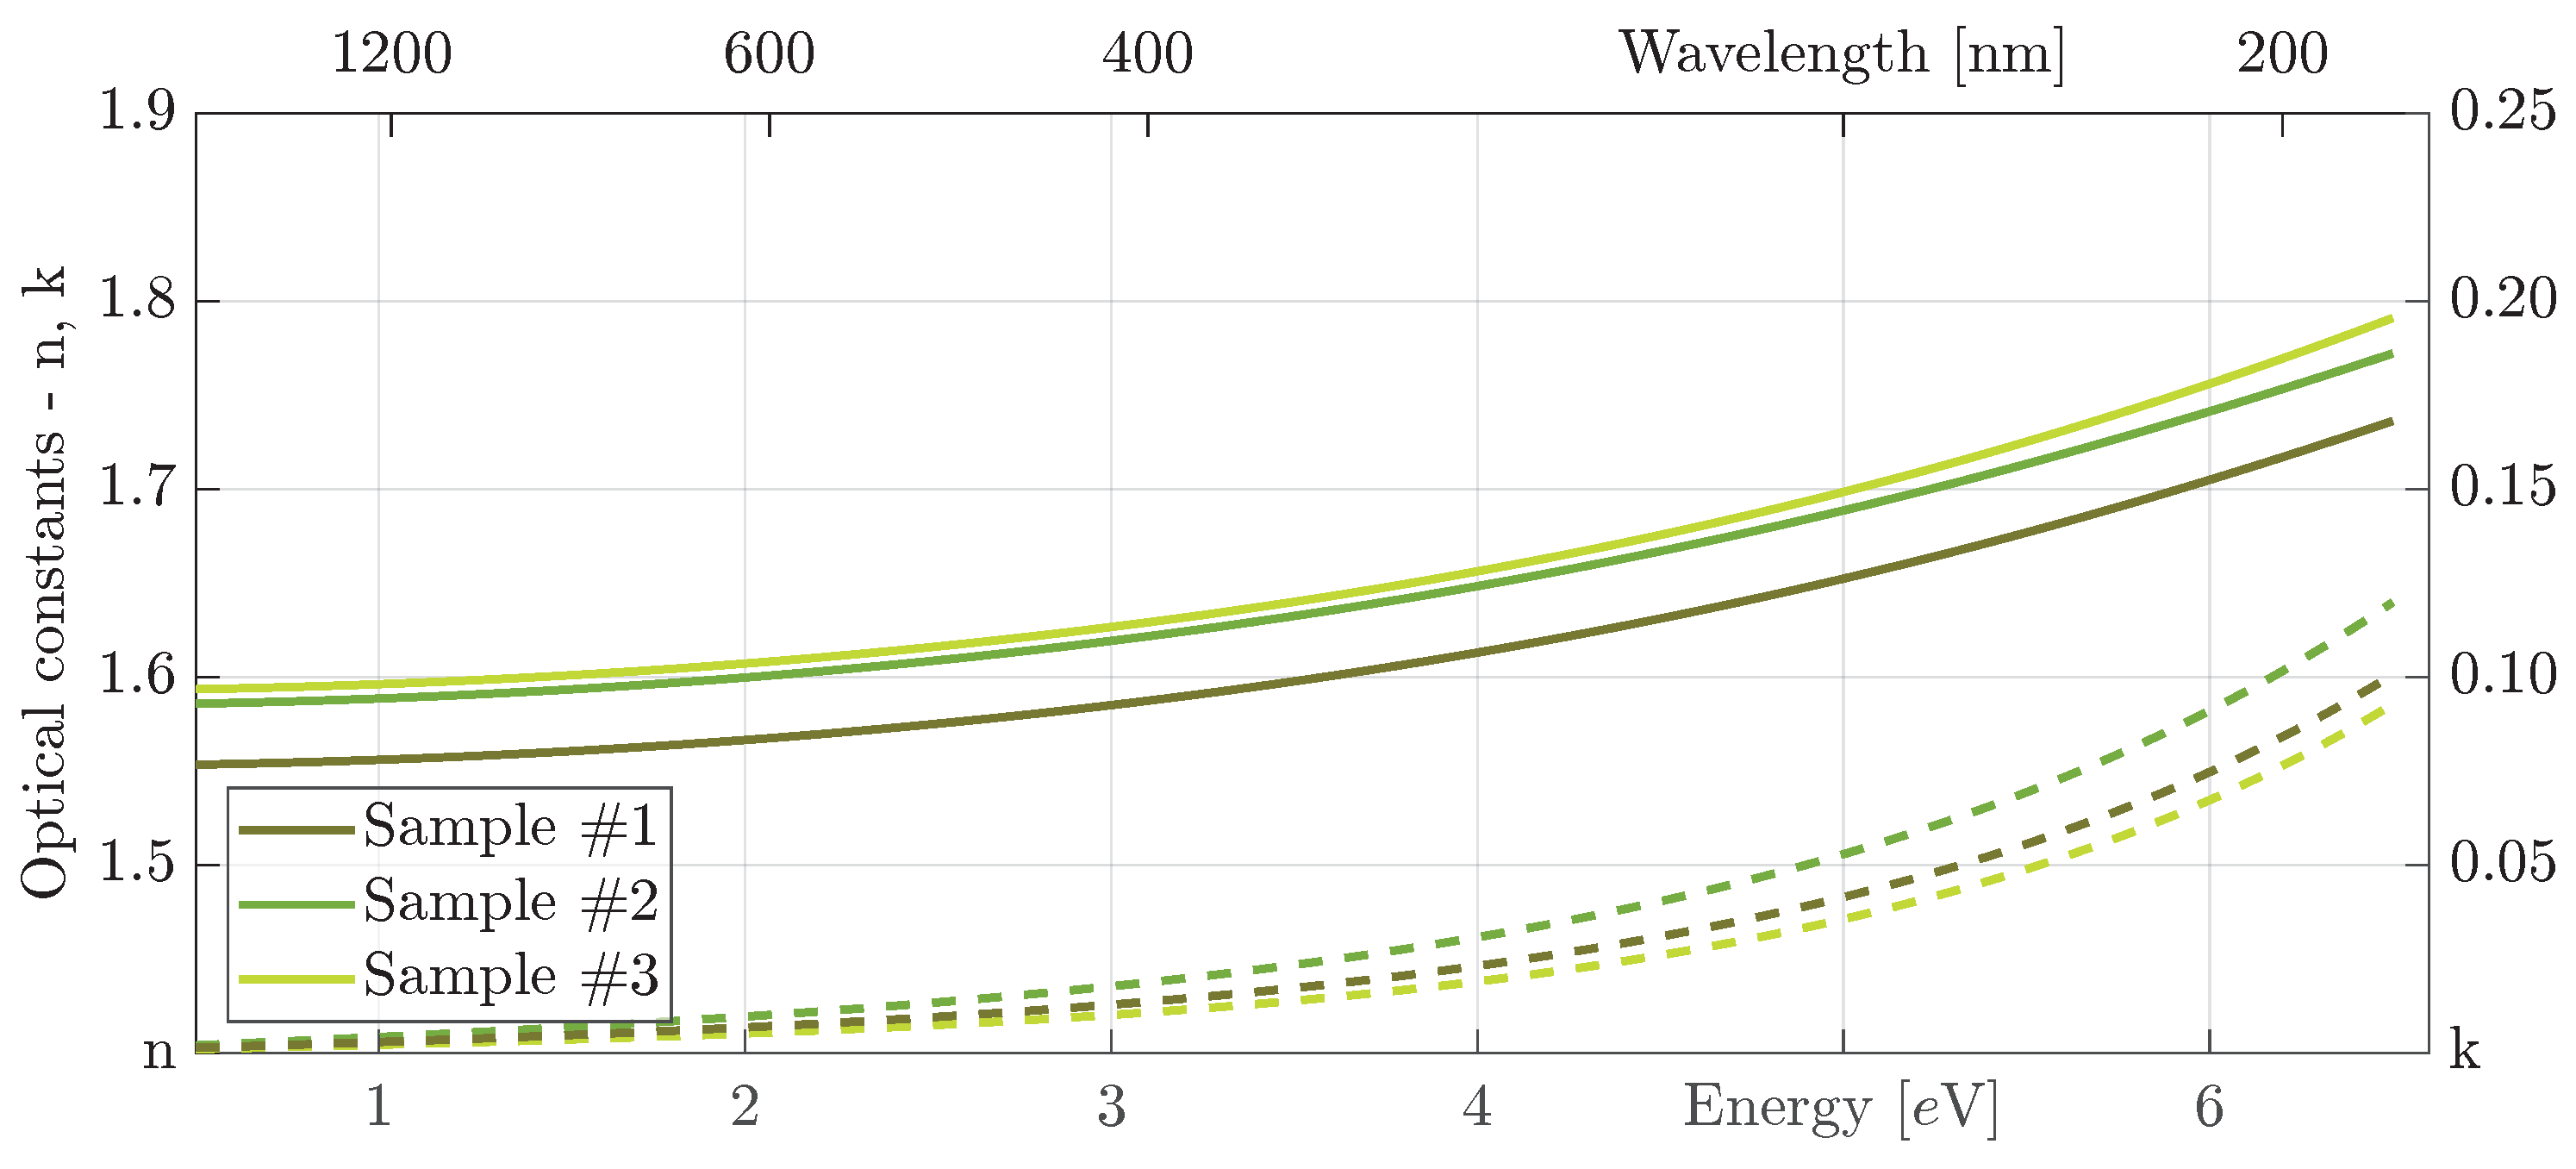
Transition layers between the polymer-like films and the substrates have been detected. The most plausible explanation is that they were created by the argon plasma cleaning process. It should be noted that in order to confirm this hypothesis, a sample of fused silica substrate cleaned in the argon plasma but without a deposited layer was prepared. The optical measurements confirmed that the cleaned surface exhibits different optical properties compared to the uncleaned surface. This cleaning process is crucial in achieving sufficient adhesion between the polymer-like thin film and the substrate, and, hence, cannot be skipped. Due to the high-energy nature of the argon ions, the excitation states near the substrate surface were disrupted, leading to the formation of a transition layer that exhibits absorption in a significant part of the measured spectral range. The resulting optical properties of this layer are presented in Figure 8, which shows that transition layers with similar optical properties were detected across all samples. These findings, when considered alongside the measured thicknesses summarized in Table 3, support the selected dispersion and structural models.

8. Conclusions

The significance of inhomogeneous thin films cannot be overstated, and their importance is rapidly increasing in various fields, including the development of optical devices, solar energetics, semiconductor technology, and other modern industrial branches, as well as in the field of real-time optical monitoring of thin film growth. As a result, there is a growing need to develop more sophisticated techniques to accurately and efficiently determine the parameters of these films to fully exploit their potential applications. However, the optical characterization of inhomogeneous thin films presents a challenging task due to the large number of parameters that need to be determined. The difficulty is worsened when the inhomogeneous film exhibits absorption in a significant part of the measured spectral range. The experimental setup using non-transparent substrates (e.g., silicon) or substrates with roughened back sides and measurements only from the film side is often used. However, this approach provides limited information about the lower boundary of the inhomogeneous thin films, leading to greater uncertainty and decreased reliability of the obtained results.
To address these limitations, this study proposes a novel approach to achieve reliable optical characterization of such samples by depositing them on non-absorbing substrates, allowing for measurements from both sides of the sample. This approach provides more independent measurements, which increases the certainty of the results obtained.
To test this approach, three inhomogeneous polymer-like thin film samples were optically characterized using a combination of variable-angle spectroscopic ellipsometry and near-normal incidence spectrophotometry. The Kramers–Kronig consistent model that included contributions representing interband transitions was used to describe the spectral dependencies of the optical constants. To correctly interpret the optical response of the film, two partially overlapping absorption bands were considered in the dispersion model, one representing σ electrons and one representing π electrons. The inhomogeneity of the films was modeled by assuming profiles of the dispersion parameters. To reduce the number of sought parameters, a very simple dispersion model was used to describe the transition layer that exhibited unexpected absorption in a wide spectral range.
The resulting fits demonstrated excellent agreement with the measured data, supporting the validity of the structural and dispersion models and the overall characterization procedure.
The method of optical characterization presented in this study exhibits versatility in its applicability, being well-suited for the analysis of a diverse range of dielectric materials that exhibit inhomogeneity in their optical constants.

Author Contributions

Conceptualization, J.D.; methodology, J.D. and I.O.; software, D.F. and J.V.; formal analysis, J.D.; investigation, J.D. and J.V.; resources, V.B.; data curation, J.D., J.V. and D.F.; writing—original draft preparation, J.D., J.V. and I.O.; writing—review and editing, J.D., J.V. and I.O.; visualization, J.D.; supervision, I.O.; funding acquisition, I.O. All authors have read and agreed to the published version of the manuscript.

Funding

This work was supported by the project LM2018097 and LM2023039 funded by the Ministry of Education, Youth and Sports of the Czech Republic.

Institutional Review Board Statement

Not applicable.

Informed Consent Statement

Not applicable.

Data Availability Statement

Data presented in this study are available upon reasonable request from the corresponding author.

Conflicts of Interest

The authors declare no conflict of interest. The funders had no role in the design of the study; in the collection, analyses, or interpretation of data; in the writing of the manuscript; or in the decision to publish the results.

References

  1. Vašíček, A. Polarimetric Methods for the Determination of the Refractive Index and the Thickness of Thin Films on Glass. J. Opt. Soc. Am. 1947, 37, 145–153. [Google Scholar] [CrossRef] [PubMed]
  2. Ohlídal, I.; Navrátil, K.; Schmidt, E. Simple method for the complete optical analysis of very thick and weakly absorbing films: Application to magnetic garnet-films. Appl. Phys. A 1982, 29, 157–162. [Google Scholar] [CrossRef]
  3. Lohner, T.; Kumar, K.J.; Petrik, P.; Subrahmanyam, A.; Bársony, I. Optical analysis of room temperature magnetron sputtered ITO films by reflectometry and spectroscopic ellipsometry. J. Mater. Res. 2014, 29, 1528–1536. [Google Scholar] [CrossRef]
  4. Pei, L.; Jiaqi, Z.; Yuankun, Z.; Jiecai, H. Preparation and optical properties of sputtered-deposition yttrium fluoride film. Nucl. Instrum. Methods Phys. Res. B 2013, 307, 429–433. [Google Scholar] [CrossRef]
  5. Jin, J.; Jin, C.; Li, C.; Deng, W.; Yao, S. Influence of substrate temperatures on the properties of GdF 3 thin films with quarter-wave thickness in the ultraviolet region. Appl. Opt. 2015, 54, 5117–5122. [Google Scholar] [CrossRef] [PubMed]
  6. Wang, J.; Maier, R.; Dewa, P.G.; Schreiber, H.; Bellman, R.A.; Elli, D.D. Nanoporous structure of a GdF 3 thin film evaluated by variable angle spectroscopic ellipsometry. Appl. Opt. 2007, 46, 3221–3226. [Google Scholar] [CrossRef] [PubMed]
  7. Franta, D.; Ohlídal, I.; Nečas, D.; Vižďa, F.; Caha, O.; Hasoň, M.; Pokorný, P. Optical characterization of HfO2 thin films. Thin Solid Films 2011, 519, 6085–6091. [Google Scholar]
  8. Franta, D.; Ohlídal, I.; Frumar, M.; Jedelský, J. Optical Characterization of Chalcogenide Thin Films. Appl. Surf. Sci. 2001, 175–176, 555–561. [Google Scholar] [CrossRef]
  9. Franta, D.; Ohlídal, I.; Frumar, M.; Jedelský, J. Expression of the Optical Constants of Chalcogenide Thin Films Using the New Parameterization Dispersion Model. Appl. Surf. Sci. 2003, 212–213, 116–121. [Google Scholar] [CrossRef]
  10. Kildemo, M.; Brenot, R.; Drévillon, B. Spectroellipsometric method for process monitoring semiconductor thin films and interfaces. Appl. Opt. 1998, 37, 5145–5149. [Google Scholar] [CrossRef]
  11. Kildemo, M. Real-Time Monitoring and Growth Control of Si-Gradient-Index Structures by Multiwavelength Ellipsometry. Appl. Opt. 1998, 37, 113–124. [Google Scholar] [CrossRef] [PubMed]
  12. Carniglia, C.K. Ellipsometric calculations for nonabsorbing thin films with linear refractive-index gradients. J. Opt. Soc. Am. A 1990, 7, 848–856. [Google Scholar] [CrossRef]
  13. Vedam, K.; McMarr, P.J.; Narayan, J. Nondestructive depth profiling by spectroscopic ellipsometry. Appl. Phys. Lett. 1985, 47, 339–341. [Google Scholar] [CrossRef]
  14. Franta, D.; Ohlídal, I. Optical characterization of inhomogeneous thin films of ZrO2 by spectroscopic ellipsometry and spectroscopic reflectometry. Surf. Interface Anal. 2000, 30, 574–579. [Google Scholar] [CrossRef]
  15. Jacobsson, R. Matching a Multilayer Stack to a High-Refractive Index Substrate by Means of an Inhomogeneous Layer. J. Opt. Soc. Am. 1964, 54, 422–423. [Google Scholar] [CrossRef]
  16. Jacobsson, R. Light Reflection from Films of Continuously Varying Refractive Index. In Progress in Optics; Wolf, E., Ed.; Elsevier: Amsterdam, The Netherlands, 1966; Volume 5, pp. 247–286. [Google Scholar]
  17. Chindaudom, P.; Vedam, K. Characterization of inhomogeneous transparent thin films on transparent substrates by spectroscopic ellipsometry: Refractive indices n (λ) of some fluoride coating materials. Appl. Opt. 1994, 33, 2664–2671. [Google Scholar] [CrossRef]
  18. Vohánka, J.; Ohlídal, I.; Ženíšek, J.; Vašina, P.; Čermák, M.; Franta, D. Use of the Richardson extrapolation in optics of inhomogeneous layers: Application to optical characterization. Surf. Interface Anal. 2018, 50, 757–765. [Google Scholar] [CrossRef]
  19. Nečas, D.; Franta, D.; Ohlídal, I.; Poruba, A.; Wostrý, P. Ellipsometric characterization of inhomogeneous non-stoichiometric silicon nitride films. Surf. Interface Anal. 2013, 45, 1188–1192. [Google Scholar] [CrossRef]
  20. Vohánka, J.; Ohlídal, I.; Ohlídal, M.; Šustek, v.; Čermák, M.; Šulc, V.; Vašina, P.; Ženíšek, J.; Franta, D. Optical Characterization of Non-Stoichiometric Silicon Nitride Films Exhibiting Combined Defects. Coatings 2019, 9, 416. [Google Scholar] [CrossRef]
  21. Franta, D.; Vohánka, J.; Dvořák, J.; Franta, P.; Ohlídal, I.; Klapetek, P.; Březina, J.; Škoda, D. Optical Characterization of Gadolinium Fluoride Films Using Universal Dispersion Model. Coatings 2023, 13, 218. [Google Scholar] [CrossRef]
  22. Fainman, Y.; Yang, M.; Gao, C.; Lin, H.; Friedman, A.; Belogolovskii, D. Nonlinear optical properties of inhomogeneous thin films. In Proceedings of the Ultrafast Nonlinear Imaging and Spectroscopy X, San Diego, CA, USA, 21–26 August 2022; p. PC122280I. [Google Scholar]
  23. Qiao, J. Simulation of Optical Properties of Inhomogeneous Molecular Contamination Thin Film Outgassed from Non-Metallic Materials. Teh. Vjesn. 2021, 28, 1539–1545. [Google Scholar]
  24. Todorov, R.; Tasseva, J.; Lozanova, V.; Lalova, A.; Iliev, T.; Paneva, A. Ellipsometric characterization of thin films from multicomponent chalcogenide glasses for application in modern optical devices. Adv. Cond. Matter Phys. 2013, 2013, 308258. [Google Scholar] [CrossRef]
  25. Bovard, B.G. Rugate filter design: The modified Fourier transform technique. Appl. Opt. 1990, 29, 24–30. [Google Scholar] [CrossRef]
  26. Vohánka, J.; Šustek, Š.; Buršíková, V.; Šklíbová, V.; Šulc, V.; Homola, V.; Franta, D.; Čermák, M.; Ohlídal, M.; Ohlídal, I. Determining shape of thickness non-uniformity using variable-angle spectroscopic ellipsometry. Appl. Surf. Sci. 2020, 534, 147625. [Google Scholar] [CrossRef]
  27. Nečas, D.; Ohlídal, I.; Franta, D. Variable-angle spectroscopic ellipsometry of considerably non-uniform thin films. J. Opt. 2011, 13, 085705. [Google Scholar] [CrossRef]
  28. Nečas, D.; Ohlídal, I.; Franta, D. The reflectance of non-uniform thin films. J. Opt. A Pure Appl. Opt. 2009, 11, 045202. [Google Scholar] [CrossRef]
  29. Ohlídal, M.; Ohlídal, I.; Klapetek, P.; Nečas, D.; Majumdar, A. Measurement of the thickness distribution and optical constants of non-uniform thin films. Meas. Sci. Technol. 2011, 22, 085104. [Google Scholar] [CrossRef]
  30. Ohlídal, I.; Vohánka, J.; Buršíková, V.; Franta, D.; Čermák, M. Spectroscopic ellipsometry of inhomogeneous thin films exhibiting thickness non-uniformity and transition layers. Opt. Express 2020, 28, 160–174. [Google Scholar] [CrossRef] [PubMed]
  31. Ohlídal, I.; Vohánka, J.; Buršíková, V.; Šulc, V.; Šustek, Š.; Ohlídal, M. Ellipsometric characterization of inhomogeneous thin films with complicated thickness non-uniformity: Application to inhomogeneous polymer-like thin films. Opt. Eng. 2020, 28, 36796–36811. [Google Scholar] [CrossRef] [PubMed]
  32. Ohlídal, I.; Navrátil, K.; Lukeš, F. Reflection of Light on a System of Non-absorbing Isotropic Film–Non-absorbing Isotropic Substrate with Rough Boundaries. Opt. Commun. 1971, 3, 40–44. [Google Scholar] [CrossRef]
  33. Ohlídal, I.; Lukeš, F. Ellipsometric Parameters of Rough Surfaces and of a System Substrate-Thin Film with Rough Boundaries. Opt. Acta 1972, 19, 817–843. [Google Scholar] [CrossRef]
  34. Bauer, J. Optical properties, band gap, and surface roughness of Si3N4. Phys. Status Solidi A 1977, 39, 411–418. [Google Scholar] [CrossRef]
  35. Ohlídal, I.; Vohánka, J.; Buršíková, V.; Dvořák, J.; Klapetek, P.; Kaur, N.J. Optical characterization of inhomogeneous thin films with randomly rough boundaries exhibiting wide intervals of spatial frequencies. Opt. Eng. 2022, 30, 39068–39085. [Google Scholar] [CrossRef]
  36. Vohánka, J.; Ohlídal, I.; Buršíková, V.; Klapetek, P.; Kaur, N.J. Optical characterization of inhomogeneous thin films with randomly rough boundaries. Opt. Express 2022, 30, 2033–2047. [Google Scholar] [CrossRef]
  37. Ohlídal, I.; Franta, D.; Nečas, D. Ellipsometric and reflectometric characterization of thin films exhibiting thickness non-uniformity and boundary roughness. Appl. Surf. Sci. 2017, 421, 687–696. [Google Scholar] [CrossRef]
  38. Ohlídal, I.; Vohánka, J.; Čermák, M.; Franta, D. Optical characterization of randomly microrough surfaces covered with very thin overlayers using effective medium approximation and Rayleigh–Rice theory. Appl. Surf. Sci. 2017, 419, 942–956. [Google Scholar] [CrossRef]
  39. Ohlídal, M.; Ohlídal, I.; Lukeš, F. Ellipsometric studies of polished silicon surfaces. Surf. Sci. 1976, 55, 467–476. [Google Scholar] [CrossRef]
  40. Franta, D.; Ohlídal, I.; Klapetek, P.; Pokorný, P.; Ohlídal, M. Analysis of Inhomogeneous Thin Films of ZrO2 by the Combined Optical Method and Atomic Force Microscopy. Surf. Interface Anal. 2001, 32, 91–94. [Google Scholar] [CrossRef]
  41. Taft, E.; Cordes, L. Optical Evidence for a Silicon-Silicon Oxide Interlayer. J. Electrochem. Soc. 1979, 126, 131–134. [Google Scholar] [CrossRef]
  42. Aspnes, D.E.; Theeten, J.B. Dielectric function of Si-SiO2 and Si-Si3N4 mixtures. J. Appl. Phys. 1979, 50, 4928–4935. [Google Scholar] [CrossRef]
  43. Ohlídal, I.; Vohánka, J.; Buršíková, V.; Ženíšek, J.; Vašina, P.; Čermák, M.; Franta, D. Optical characterization of inhomogeneous thin films containing transition layers using the combined method of spectroscopic ellipsometry and spectroscopic reflectometry based on multiple-beam interference model. J. Vac. Sci. Technol. B 2019, 37, 062921. [Google Scholar] [CrossRef]
  44. Jellison Jr, G.; Aytug, T.; Lupini, A.; Paranthaman, M.; Joshi, P.C. Optical properties of a nanostructured glass-based film using spectroscopic ellipsometry. Thin Solid Films 2016, 617, 38–43. [Google Scholar] [CrossRef]
  45. Kostruba, A.; Stetsyshyn, Y.; Vlokh, R. Method for determination of the parameters of transparent ultrathin films deposited on transparent substrates under conditions of low optical contrast. Appl. Opt. 2015, 54, 6208–6216. [Google Scholar] [CrossRef] [PubMed]
  46. Yoshida, S.; Hijikata, Y.; Yaguchi, H. Investigation of SiC/Oxide interface structures by spectroscopic ellipsometry. In Advanced Silicon Carbide Devices and Processing; IntechOpen: Rijeka, Croatia, 2015; pp. 97–140. [Google Scholar]
  47. Nisol, B.; Reniers, F. Challenges in the characterization of plasma polymers using XPS. J. Electron. Spectrosc. 2015, 200, 311–331. [Google Scholar] [CrossRef]
  48. Robertson, J. Diamond-like amorphous carbon. Mater. Sci. Eng. R 2002, 37, 129–281. [Google Scholar] [CrossRef]
  49. Ohtake, N.; Hiratsuka, M.; Kanda, K.; Akasaka, H.; Tsujioka, M.; Hirakuri, K.; Hirata, A.; Ohana, T.; Inaba, H.; Kano, M.; et al. Properties and classification of diamond-like carbon films. Materials 2021, 14, 315. [Google Scholar] [CrossRef] [PubMed]
  50. Jacob, W.; Möller, W. On the structure of thin hydrocarbon films. Appl. Phys. Lett. 1993, 63, 1771–1773. [Google Scholar] [CrossRef]
  51. Gosar, Ž.; Kovač, J.; Mozetič, M.; Primc, G.; Vesel, A.; Zaplotnik, R. Deposition of SiOxCyHz protective coatings on polymer substrates in an industrial-scale PECVD reactor. Coatings 2019, 9, 234. [Google Scholar] [CrossRef]
  52. Aumaille, K.; Vallée, C.; Granier, A.; Goullet, A.; Gaboriau, F.; Turban, G. A comparative study of oxygen/organosilicon plasmas and thin SiOxCyHz films deposited in a helicon reactor. Thin Solid Films 2000, 359, 188–196. [Google Scholar] [CrossRef]
  53. Čermák, M.; Kelarová, Š.; Jurmanová, J.; Kührová, P.; Buršíková, V. The wide range optical spectrum characterization of the silicon and oxygen doped diamond like carbon inhomogeneous thin films. Diam. Relat. Mater. 2022, 128, 109245. [Google Scholar] [CrossRef]
  54. Zajíčková, L.; Buršíková, V.; Kučerová, Z.; Franta, D.; Dvořák, P.; Šmíd, R.; Peřina, V.; Macková, A. Deposition of protective coatings in rf organosilicon discharges. Plasma Sources Sci. Technol. 2007, 16, S123. [Google Scholar] [CrossRef]
  55. Fujiwara, H. Spectroscopic Ellipsometry: Principles and Applications; Wiley: Hoboken, NJ, USA, 2007. [Google Scholar]
  56. Germer, T.; Zwinkels, J.C.; Tsai, B.K. Spectrophotometry: Accurate Measurement of Optical Properties of Materials; Elsevier: Amsterdam, The Netherlands, 2014. [Google Scholar]
  57. Franta, D.; Nečas, D.; Ohlídal, I. Universal dispersion model for characterization of optical thin films over wide spectral range: Application to hafnia. Appl. Opt. 2015, 54, 9108–9119. [Google Scholar] [CrossRef]
  58. Franta, D.; Vohánka, J.; Čermák, M. Universal Dispersion Model for Characterisation of Thin Films Over Wide Spectral Range. In Optical Characterization of Thin Solid Films; Stenzel, O., Ohlídal, M., Eds.; Springer International Publishing: Cham, Swizterland, 2018; pp. 31–82. [Google Scholar]
  59. Campi, D.; Coriasso, C. Prediction of Optical Properties of Amorphous Tetrahedrally Bounded Materials. J. Appl. Phys. 1988, 64, 4128–4134. [Google Scholar] [CrossRef]
  60. Tauc, J.; Menth, A. States in the gap. J. Non-Cryst. Solids 1972, 8, 569–585. [Google Scholar] [CrossRef]
  61. Zanatta, A.R. Revisiting the optical bandgap of semiconductors and the proposal of a unified methodology to its determination. Sci. Rep. 2019, 9, 11225. [Google Scholar] [CrossRef]
  62. Dolgonos, A.; Mason, T.O.; Poeppelmeier, K.R. Direct optical band gap measurement in polycrystalline semiconductors: A critical look at the Tauc method. J. Solid State Chem. 2016, 240, 43–48. [Google Scholar] [CrossRef]
  63. Franta, D.; Mureșan, M.G. Wide spectral range optical characterization of yttrium aluminum garnet (YAG) single crystal by the universal dispersion model. Opt. Mater. Express 2021, 11, 3930–3945. [Google Scholar] [CrossRef]
  64. Ohlídal, I.; Vohánka, J.; Čermák, M.; Franta, D. Ellipsometry of Layered Systems. In Optical Characterization of Thin Solid Films; Stenzel, O., Ohlídal, M., Eds.; Springer International Publishing: Cham, Switzerland, 2018; pp. 233–267. [Google Scholar]
  65. Franta, D.; Nečas, D.; Vohánka, J. Software for Optical Characterization newAD2. Available online: http://newad.physics.muni.cz/ (accessed on 28 March 2023).
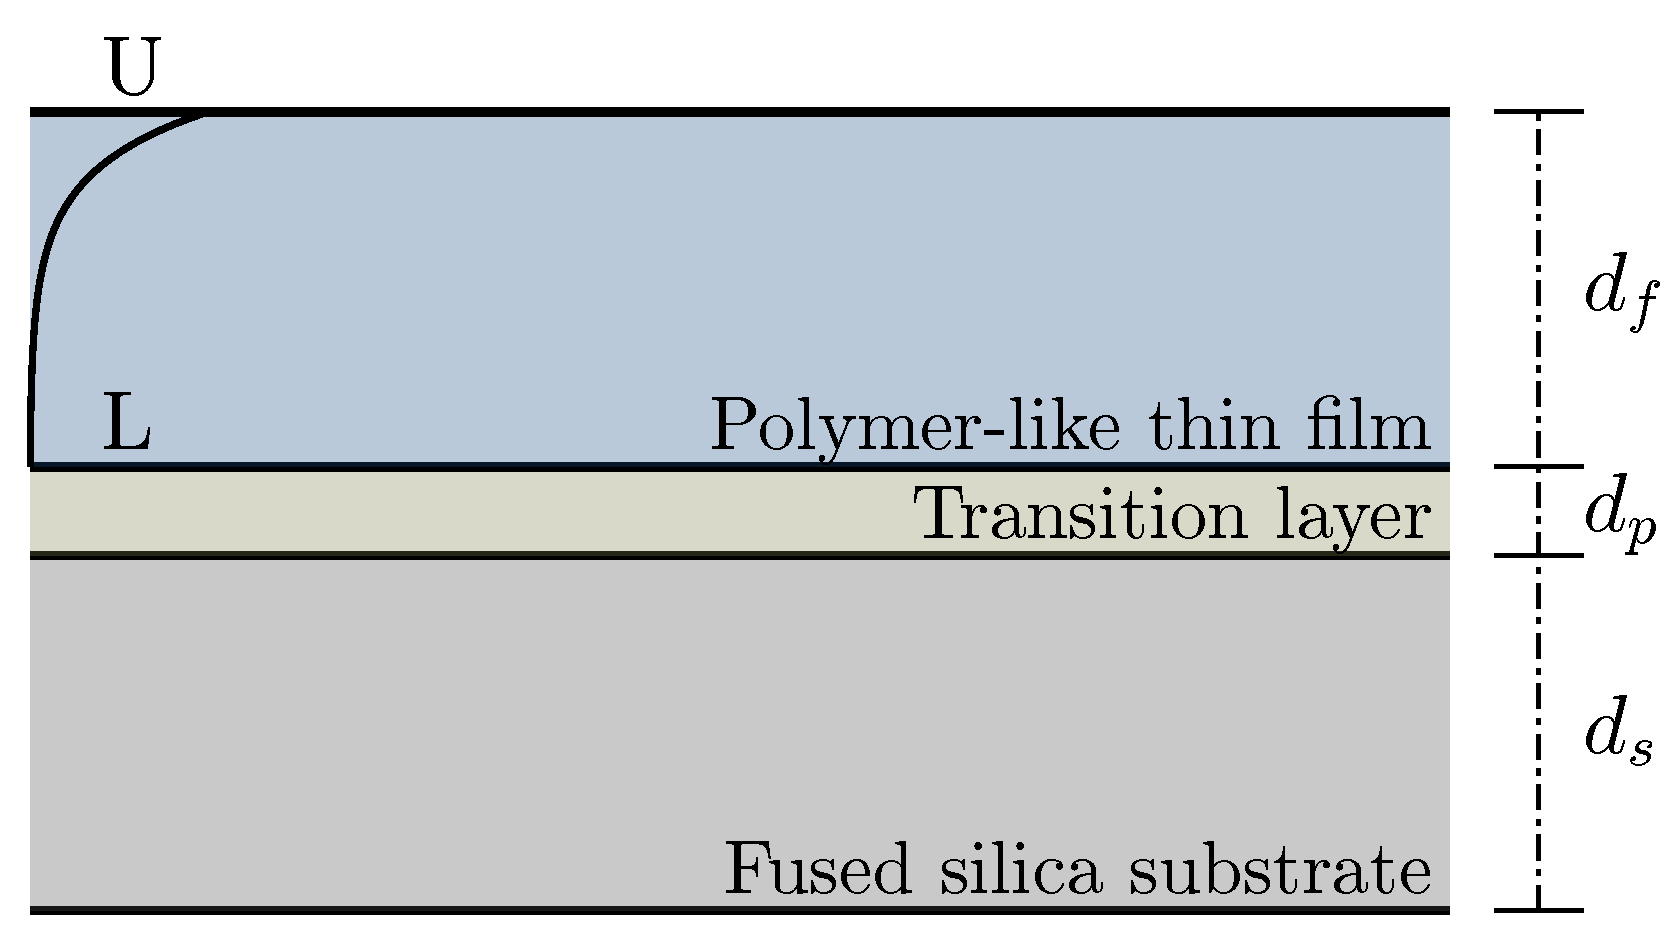
Figure 1. Schematic diagram of the structural model.
Coatings 13 00873 g001
Figure 2. Measured ellipsometric data (points) with their respective fits (solid lines) at angle of incidence of 70°. The top panel of the figure represents measurements obtained from the front side of the sample, while the bottom panel shows data obtained from the back side of the sample.
Coatings 13 00873 g002
Figure 3. Top panel: measured reflectance data (points) with their respective fits (solid lines). Front-side and back-side measurements are shown. Bottom panel: relative reflectance with its fit.
Coatings 13 00873 g003
Figure 4. Measured transmittance data (points) with its respective fit (solid line).
Coatings 13 00873 g004
Figure 5. Comparison of the profiles of the optical constants for all the samples for the selected photon energy ( E = 3 e V ). Solid lines depict the refractive index (left axis), dashed lines are extinction coefficients (right axis).
Coatings 13 00873 g005
Figure 6. Optical constants at the upper and lower boundaries of the inhomogeneous films. The solid lines depict the refractive index, while the dashed lines represent the extinction coefficient. The thicker lines represent the optical properties of sample #2, while the thinner lines represent the optical properties of the other two samples used for comparison.
Coatings 13 00873 g006
Figure 7. Profiles of the optical constants of sample #2 for several photon energies. The solid lines depict the refractive index and the dashed ones the extinction coefficient.
Coatings 13 00873 g007
Figure 8. Optical constants of thin transition layers of all samples. The solid lines depict the refractive index (left axis), the dashed lines represent the extinction coefficient (right axis).
Coatings 13 00873 g008
Table 1. Summary of the film preparation process.
Step Conditions
1.Argon plasma treatment of the substrateApplied power: 50 W; Argon flow rate: 5 sccm; Self-bias voltage on the substrate holder electrode: −240 V; Pressure: 17 Pa; Deposition time: 5 min
2.Deposition input parametersApplied power: 50 W; HMDSO flow rate: 1 sccm; CH 4 flow rate: 5 sccm; Self bias voltage on the substrate holder electrode: −110 V; Pressure: 33 Pa
3.Gradual change of methane flow rateApplied power: 50 W; HMDSO flow rate: maintained at 1 sccm; CH 4 flow rate: decrease from 5 to 0 sccm; Self-bias voltage: decrease from −110 to −190 V; Deposition pressure: decrease from 33 to 15 Pa;
4.Process conditions before the end of the depositionApplied power 50 W; HMDSO flow rate: 1 sccm; CH 4 flow rate: 0 sccm; Self-bias voltage: −190 V; Deposition pressure: 15 Pa
Table 2. List of datasets used for optical characterization.
InstrumentQuantityModeSpectral RangeAOI
Horiba Jobin Yvon UVISEL I s , I c , I n front0.6–6.5 eV55–75°, step 5°
Horiba Jobin Yvon UVISEL I s , I c , I n back0.6–6.5 eV55–75°, step 5°
Perkin Elmer Lambda 1050 R f front190–1800 nm
Perkin Elmer Lambda 1050 R b back190–1800 nm
Perkin Elmer Lambda 1050 R f / R b relative190–1800 nm
Perkin Elmer Lambda 1050T 190–1800 nm
Table 3. Structural parameters of inhomogeneous polymer-like thin films determined in the optical characterization.
Sample #1#2#3
Thickness (ellipsometry) d fe [nm] 398.9 ± 0.8 492.5 ± 0.6 693.5 ± 1.0
Thickness (spectrophotometry) d fs [nm] 399.5 ± 0.8 495.2 ± 0.6 695.9 ± 0.7
Transition layer thickness d p [nm] 20.1 ± 0.9 21.1 ± 0.8 21.4 ± 0.3
Profile parameterk 2.52 ± 0.03 4.21 ± 0.04 2.22 ± 0.03
Table 4. Dispersion parameters of sample #2 and its corresponding transition layer.
Parameter Upper BoundaryLower BoundaryTransition Layer
Transition strength of σ electrons—ibt term N 0 , σ [ eV 2 ] 32.34 ± 0.15 0.76 ± 2.21
Band gap energy of σ electrons E g , σ [ eV ] 2.59 ± 0.01 8.56 ± 0.10
Transition strength of σ electrons—CC term N σ [ eV 2 ] 586.40 ± 0.47 567.20 ± 1.40
Peak position of σ electrons E c , σ [ eV ] 11.16 ± 0.04 E g , σ L
Peak broadening of σ electrons B σ [ eV ] 12.83 ± 0.18 B σ U
Transition strength of π electrons N π [ eV 2 ] 0.47 ± 0.01 0
Band gap energy of π electrons E g π [ eV ] 1.38 ± 0.02 E g π U
Peak position of π electrons E c π [ eV ] 2.96 ± 0.01 2.06 ± 0.02
Peak broadening of π electrons B π [ eV ] 1.04 ± 0.02 0.69 ± 0.04
Transition strength of exponential tail N et [ eV 2 ] 965.53 ± 5.50
Decay rate of exponential tail E et [ eV ] 1.37 ± 0.01
Disclaimer/Publisher’s Note: The statements, opinions and data contained in all publications are solely those of the individual author(s) and contributor(s) and not of MDPI and/or the editor(s). MDPI and/or the editor(s) disclaim responsibility for any injury to people or property resulting from any ideas, methods, instructions or products referred to in the content.