Article

EIS and LEIS Study on In Vitro Corrosion Resistance of Anodic Oxide Nanotubes on Ti–13Zr–13Nb Alloy in Saline Solution

1
Institute of Materials Engineering, Faculty of Science and Technology, University of Silesia in Katowice, 75 Pułku Piechoty 1A, 41-500 Chorzów, Poland
2
Department of Physics, Faculty of Science, University of Hradec Králové, Rokitanského 62, 500 03 Hradec Králové, Czech Republic
*
Author to whom correspondence should be addressed.
Coatings 2023, 13(5), 875; https://doi.org/10.3390/coatings13050875
Submission received: 28 February 2023 / Revised: 11 April 2023 / Accepted: 25 April 2023 / Published: 6 May 2023

Abstract

:
This work concerns the search for new ways to modify the surface of the biomedical Ti–13Zr–13Nb alloy for applications in regenerative medicine and personalized medicine. Obtained for the first time, oxide nanotubes (ONTs) layers of first-generation (1G) on a Ti–13Zr–13Nb alloy were produced by anodizing in 0.5% HF electrolyte at 20 V for 120 min. The physico-chemical characterization of the obtained bamboo-inspired 1G ONTs was conducted using TEM and ATR-FTIR methods. In vitro corrosion resistance of the 1G ONTs and comparative Ti–13Zr–13Nb substrate in saline solution at 37 °C was conducted by open-circuit potential, Tafel curves, anodic polarization curves, and EIS methods. LEIS and SVET study of local corrosion resistance was also carried out. It was found that surface modification by anodizing of the Ti–13Zr–13Nb alloy under proposed conditions allowed to obtain porous ONTs highly resistant to pitting corrosion. The obtained results give a new insight into the relationship between the morphological parameters of first-generation oxide nanotubes and in vitro corrosion resistance of the Ti–13Zr–13Nb alloy in saline solution at the macro- and microscale.

1. Introduction

The human body is a very demanding environment for engineering materials due to the need to use implant materials that must be highly resistant to corrosion, especially pitting, in the environment of tissues and body fluids [1,2,3,4,5,6,7]. Titanium and its alloys are currently one of the most commonly used biomaterials in modern medicine. The self-passive oxide layer formed naturally in the air or the passive oxide layer obtained as a result of forced passivation on the surface of the titanium-based implants provides their protection against harmful environmental factors of the human body, thanks to which these biomaterials can be commonly used in implantology, e.g., for the production of short- and long-term implants, such as stents, orthodontic wires, dental implants, knee and hip endoprostheses, plates, bone screws, etc. [1,2]. Insufficient resistance of metallic biomaterials to corrosion may become a source of elements that have a toxic effect on tissues or cause carcinogenic reactions in the body [8].
Titanium alloys used in implantology contain toxic elements such as Al, V, and Ni, the release of which can lead to many diseases such as Alzheimer’s, metallosis, neuropathy, or a broadly understood allergic reaction [8]. To eliminate the harmful effects of toxic elements, new alloys based on biocompatible elements such as niobium, zirconium, molybdenum, and tantalum have been developed at the turn of the last few years, which act as stabilizers of the β structure in titanium [9,10,11,12,13,14,15,16,17,18,19,20,21]. Therefore, emphasis is placed on the production of new titanium-based alloys with mechanical properties similar to the Ni-Ti alloy and greater corrosion resistance, not containing harmful elements such as Ti–Nb–Zr, Ti–Mo–Zr, Ti–Nb–Ta, Ti–Mo, Ti–Zr, or Ti–Ta [1,2,9,10,11,12,13,14,15,16,17,18,19,20,21]. In addition, the surface of titanium and titanium alloys is additionally modified by various methods, from mechanical, through plasma, to electrochemical, in order to increase their corrosion resistance and biocompatibility [1,2,3,4,5,6,9,10,12,22,23,24,25,26]. Electrochemical methods such as electrochemically assisted deposition (ECAD) [5,24], electrophoretic deposition (EPD) [6], or anodizing [7,9,10,11,12,14,15,16,17,18,25,26,27,28,29,30,31,32,33], the latest development of which is plasma electrolytic oxidation (PEO), have a great potential for development, as they enable a wide modification of the chemical composition, surface morphology, and are cheap and easy to implement for large-scale production.
One of the electrochemical methods most often used to modify the self-passive oxide layer on titanium and its alloys, which ensures the possibility of producing self-assembled oxide nanotubes (ONTs), is anodizing [7,9,10,11,12,14,15,16,17,18,25,26,27,28,29,30,31,32,33]. Oxidation of titanium in an electric field in an aqueous electrolyte occurs according to the commonly accepted Guntershulze–Betz model [34]. The process of electrochemical production of a matrix of ONTs on the titanium and its alloys can be divided into several steps, which depend on the current density. In the first and shortest step, a compact, barrier oxide layer is produced. The beginning of the second step is associated with the activation of the barrier oxide layer by fluoride ions, which, in dissolving the oxide layer, cause the formation of randomly distributed pores. The start of this step is associated with an increase in the current intensity, which is caused by reducing the thickness of the oxide layer at the bottom of the pores. This leads to further deepening of the pores, which, after some time, begin to branch, overlapping each other competing for the flow of current. Under optimal conditions, the current flows evenly between the pores leading to the self-assembly of the porous layer, which begins to take the shape of the ONTs matrix. This is the third step of the process, characterized by a relative stabilization of the current. After reaching the equilibrium, the oxide layer thickness, both at the bottom of the nanotubes and in the space between the nanotubes, is constant as the result of the titanium oxidation rate equaling the dissolution rate of the formed oxide layer by fluoride ions. This process leads to a gradual increase in the length of the ONTs, which can be vividly described as the movement of the barrier layer into the titanium or its alloy, with a relatively small change in the position of the upper surface of the nanotubes associated with slow, chemical dissolution. Sometimes, the increase in the length of ONTs is distinguished as the fourth step of the whole process, but most authors treat it as a further part of the third step. The growth rate of the ONTs gradually decreases during the anodizing process. Since this rate is the same as the chemical dissolution rate taking place on the top surface of the layer, further anodizing does not elongate the formed ONTs [34,35].
The properties of ONTs layers are mainly determined by the chemical composition of the electrolyte and its temperature, the applied anodizing voltage or current density, and the substrate material [7,9,10,11,12,14,15,16,17,18,25,26,27,28,29,30,31,32,33,34,35]. An increase in the anodizing voltage increases the pore size by merging small pores into large ones, thereby reducing the number of pores. Increasing the surface roughness of the implant at the nanoscale contributes to facilitating the adhesion of osteogenic cells. Due to the similarity of the structure of ONTs layers to the structure of bone tissue in chemical and morphological terms, the porous surface of the implant improves the osseointegration as a result of faster growth of bone tissue and the formation of a stronger bond between the bone and the implant surface [32]. Obtaining ONTs with a high level of pore organization has become a very useful technology to functionalize the surface of surgical implants, production of biomedical sensors, or drug carriers [7].
In this paper, we continue our study on surface functionalization of the Ti–13Zr–13Nb alloy using anodizing [10,14,15,16,17,18,25,26]. The subject of the research was tuning the surface properties of this alloy towards biomedical applications by producing first-generation (1G) ONTs layers under new anodizing conditions in hydrofluoric acid solution. Due to the potential use for long-term implants, the newly developed 1G ONTs layers were subjected for the first time to in vitro corrosion resistance characteristics in a biological environment. Considering that usually used direct current (DC) and alternating current (AC) methods do not provide full information on the corrosion behavior of biomaterials because they allow the measurement of only the average current values for the entire electrode surface in contact with the electrolyte, both electrochemical impedance spectroscopy (EIS) and localized electrochemical impedance spectroscopy (LEIS) were applied at the macro- and microscale, respectively. Both EIS and LEIS were based on the same principles that a small sinusoidal voltage disturbance was applied to the electrode under test and the current response was measured, allowing the impedance to be calculated. The difference was that in the EIS method, the bulk current was measured, and in the case of the LEIS method, a microprobe scanning close to the electrode surface was used, which allowed the measurement of the local current in the electrolyte and the calculation of the local impedance.

2. Materials and Methods

2.1. Substrate Preparation

The substrate material used for anodizing was a commercial Ti–Zr–Nb alloy with a chemical composition (wt.%): 74—Ti, 13—Zr, and 13—Nb (BIMO TECH, Wrocław, Poland). This bi-phase (α + β) alloy was obtained as a bar 20 mm in diameter and 1000 mm long. The bar was in the annealed state and before the tests, it was plastically processed in the two-phase range with air cooling in accordance with the specifications of ASTM F1713-08(2021)e1 [36]. Tested samples prepared in the form of discs 3 mm thick were embedded in duracryl, and then wet-ground on abrasive papers with silicon carbide of various grits of gradation of 600, 800, 1200, and 2500 (Buehler Ltd., Lake Bluff, IL, USA) using a metallographic grinding and polishing machine Forcipol 202 (Metkon Instruments Inc., Bursa, Turkey). Then the samples were polished using polishing cloths and suspensions. After polishing, the samples were placed in an ultrasonic cleaner USC-TH (VWR International, Radnor, PA, USA) with ultrapure water (Milli-Q Advantage A10 Water Purification System, Millipore SAS, Molsheim, France) for 20 min to remove unwanted impurities. Then the samples were degreased with acetone (Avantor Performance Materials Poland S.A., Gliwice, Poland). The sample cleaning procedure was repeated twice.

2.2. Anodizing Conditions of Ti–13Zr–13Nb Alloy

For the purposes of anodizing, electrodes were made from the prepared alloy samples. Electrical contact was provided by an insulated copper wire that was attached to the back side of the alloy samples with epoxy resin. The back side of the alloy samples and the side walls were protected using a two-component epoxy resin, which was chemically resistant. The native oxide layer was removed from the electrode surface immediately before anodizing using depassivation in 25% v/v HNO3 (Avantor Performance Materials Poland S.A., Gliwice, Poland) for 10 min. The electrodes were then cleaned with Milli-Q water in an ultrasonic bath for 20 min and placed in an electrochemical cell.
Anodizing was carried out in an aqueous solution of 0.5% hydrofluoric acid (ACS-grade HF, 48%, Sigma-Aldrich, Saint Louis, MI, USA) at a temperature of 22(1) °C at a voltage of 20 V for 120 min using the PWR800H high-current power supply (Kikusui Electronics Corporation, Yokohama, Japan). The distance between the sample (anode) with a geometric area of 0.64 cm2 and the platinum foil (cathode) with an area of 16 cm2 was constant and amounted to 25 mm. After the anodizing process, the electrodes were rinsed in Milli-Q water and dried in air at ambient temperature.

2.3. TEM Measurements

The structure of 1G ONTs on Ti–13Zr–13Nb alloy was examined by high resolution electron microscopy (HREM) method using a JEOL JEM-3010 Transmission Electron Microscope (TEM, JEOL Ltd., Tokyo, Japan) operating at an acceleration voltage of 30 kV, equipped with a Gatan 2 k × 2 k OriusTM 833 SC200D CCD camera. During TEM studies, the microstructure of ONTs without the presence of a substrate was observed. For this purpose, the anodized Ti–13Zr–13Nb alloy was immersed in isopropanol and sonicated for 60 min in an ultrasonic bath. Then, the ONTs layer detached from the substrate was deposited on a copper mesh covered with an amorphous carbon foil standardized to prepare a sample for TEM observations.

2.4. ATR-FTIR Measurements

To determine the functional groups of the tested materials, the Attenuated Total Reflectance-Fourier Transform Infrared Spectroscopy (ATR-FTIR) method was used. ATR-FTIR absorption spectra were recorded using an IR Trace-100 spectrophotometer (Shimadzu, Kyoto, Japan) equipped with ATR attachment with a diamond crystal for testing solid-states. All measurements were conducted in the spectral region of 4000–400 cm−1 at 100 scans per sample at 21(1) °C. The radiation was split into two beams, one of which ran along a path of constant length, and the other was generated by an interferometer with a moving mirror moving at a constant speed. The changing path length difference of the two beams caused mutual interference, resulting in an interferogram. The use of the Fourier transform allowed to transform the interferogram from the time domain to the frequency domain receiving a spectrum. The infrared (IR) beam penetrated the sample to a depth of several microns before being reflected. During the measurements, the crystal and the material under study stayed in contact.

2.5. DC and AC Measurements in Saline

In vitro tests of the corrosion resistance of the studied material were conducted in a saline solution at the temperature of 37(1) °C using the method of open-circuit potential (OCP), polarization curves, and electrochemical impedance spectroscopy (EIS). A solution of 0.9% NaCl pH = 7.4(1) was deaerated for 30 min with argon; 4% NaOH and 1% C3H6O3 were used to adjust the pH. For preparation of the saline solution, analytically pure reagents (Avantor Performance Materials Poland S.A., Gliwice, Poland) and ultrapure water were used.
All electrochemical tests were performed using the Autolab/PGSTAT12 computer controlled electrochemical system (Metrohm Autolab B.V., Utrecht, The Netherlands). Electrochemical measurements were carried out in a three-electrode system consisting of a working electrode (WE) in the form of the tested material, a counter electrode (CE) as a platinum mesh, and a reference electrode (RE) placed in the Luggin capillary against which all potential values were measured. The RE was a saturated calomel electrode (SCE) with a potential of 244.4(1) mV. The method of preparation of WE was described in the work [7]. After stabilization of open-circuit potential (Eoc) for 2 h, the polarization curves j = f(E) were recorded using the potentiodynamic method in the potential range ±50 mV in relation to the EOC with the electrode polarization rate v = 1 mV s−1. The obtained polarization curves were the basis for determining the corrosion resistance parameters.
Subsequently, the EIS spectra were recorded at the EOC in the frequency range from 20 kHz to 1 mHz using 10 frequencies per decade. A sine wave with an amplitude of 10 mV as an excitation signal was applied. Kramers–Kronig relations (K–K test) were used to assess the correctness of the obtained EIS data [37]. The analysis of the experimental EIS spectra was carried out based on the equivalent electrical analogs using the EQUIVCRT program with Boukamp’s circuit description and the method of complex nonlinear least squares (CNLS) with modulus weighting [38]. The Fisher–Snedecor test F for the confidence level of α = 0.01 corresponding to 99% probability was used to check the significance of the parameters of the equivalent electrical circuits used [37]. The χ2 (chi-square) test was used for verification of the EIS fit quality.
Susceptibility to pitting corrosion was tested using anodic polarization curves in the potential window from EOC minus 150 mV to 9.4 V at v = 1 mV s−1. To accurately visualize and interpret the obtained results, electrochemical noise was eliminated using the Savitzky–Golay smoothing algorithm and OriginPro 2018 software (OriginLab, Northampton, MA, USA).
Each type of measurement was repeated thrice, and the values of the determined parameters were given as mean values with standard deviation (SD).

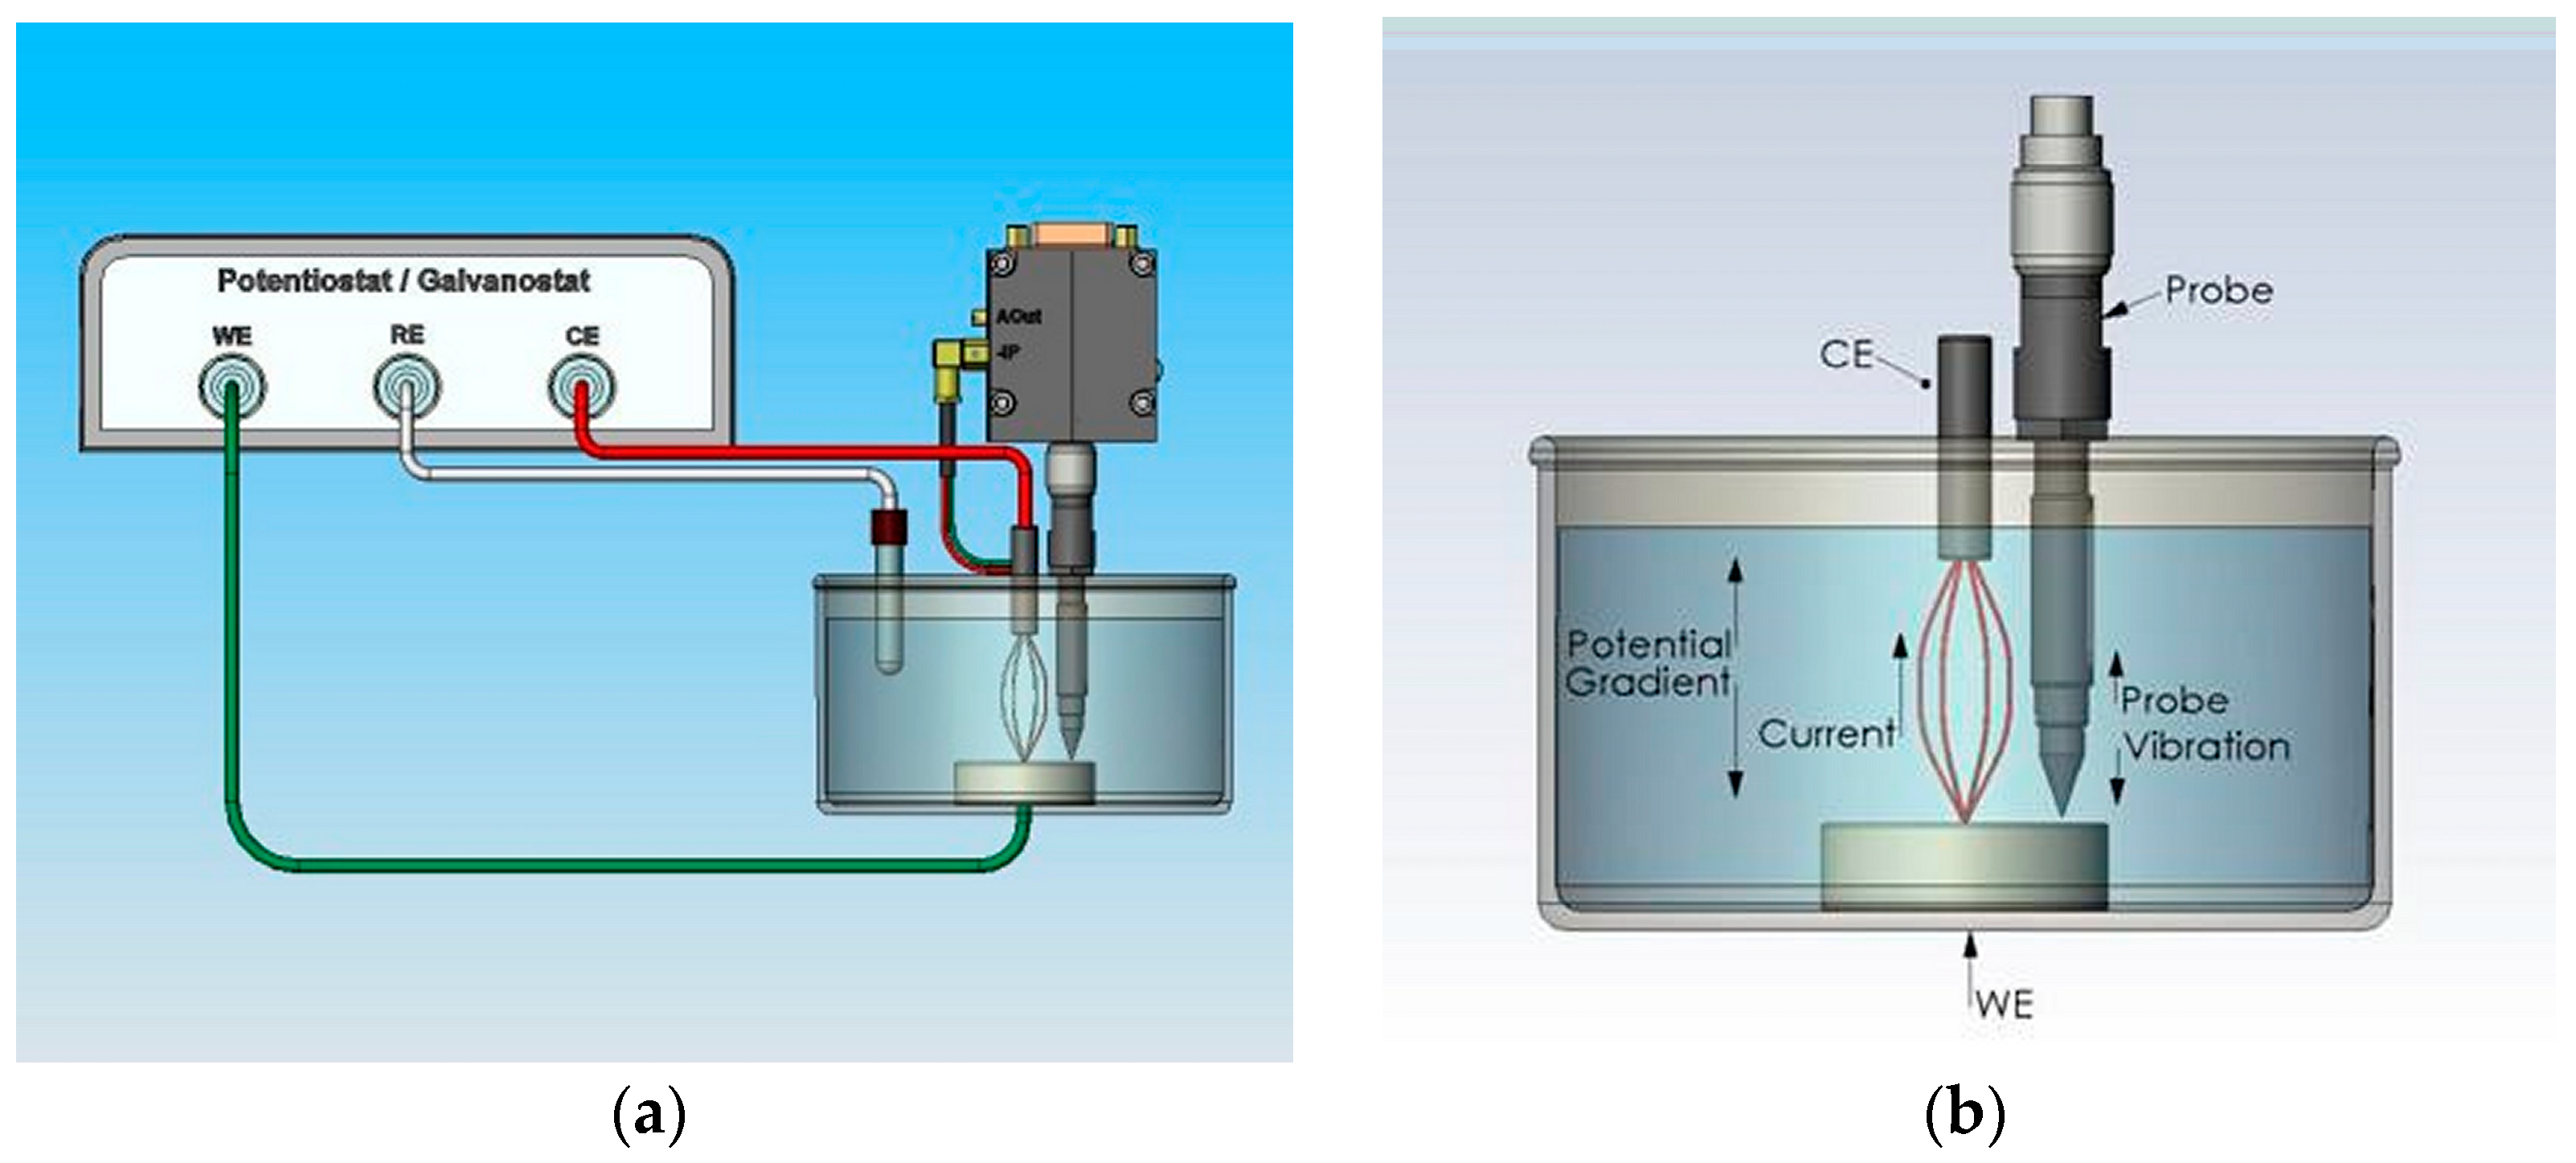
2.6. Scanning Electrochemical Measurements in Saline

To analyze local changes in the corrosion resistance of the Ti–13Zr–Nb alloy before and after electrochemical oxidation, the scanning vibration probe technique (SVET) and LEIS were used. The SVET and LEIS techniques allowed to determine the distribution of the ion current density (j) and the impedance modulus (|Z|), respectively, above the surface of the sample in an aqueous solution of 0.9% NaCl with a conductivity of 16.32 mS cm−1. Distribution maps of a specific parameter over the material surface (j or |Z|) were recorded using a PAR Model 370 Scanning Electrochemical Workstation (Princeton Applied Research, Oak Ridge, TN, USA). SVET and LEIS measurements were carried out in a four-electrode system: WE, CE as a platinum grid in the SVET technique and a platinum ring applied to the probe in the LEIS method, RE as SCE, and SVET or LEIS probe. All electrodes were immersed in a saline solution contained in a glass cell known as the TriCell. For both techniques, the probe–sample distance was determined using a video camera to be approximately 150 µm
The SVET technique measured the localized current in a saline above a sample by virtue of the IR drop in the electrolyte [39]. The connection mode of a sample under potentiostatic control with an isolated potentiostat was used, which reduced noise (Figure 1a). A potential gradient between the WE and the CE in the saline was directly proportional to the current and the conductivity of the electrolyte (Figure 1b). A probe immersed in the electrolyte was perpendicular to the WE. The probe was mounted on a precision vibrating stage, which vibrated in the vertical plane. The potential of the probe was directly proportional to its position in the potential gradient. The amplitude of the AC potential on the probe was therefore directly proportional to the current. The probe was scanned in the saline electrolyte such that the distribution of current on the surface of a sample might be mapped in the X and Y planes.
The maps of the ion current density distribution were recorded at a fixed anode current density in the passive range of 60 µA cm−2, which corresponded to a potential of about 2 V vs. SCE on a potentiodynamic curve and a fixed microprobe vibration amplitude of 30 µm. The scanned area was 512 × 512 µm with a step of 16 µm. Using a gold electrode with a diameter of 200 µm immersed in the same solution as the tested materials, a calibration was performed, which enabled the conversion of the voltage recorded by the SVET microprobe into the values of the ion current density.
The LEIS technique was used to monitor corrosion mechanisms and kinetics. The maps of the impedance modulus distribution were measured at the EOC, considered approximately as the corrosion potential (Ecor) of the material and the selected frequency, i.e., 500 mHz. More details about the LEIS technique are available in [40,41].

3. Results and Discussion

3.1. TEM Characterization of 1G ONTs on Ti–13Zr–13Nb Alloy

The 1G ONTs layers were produced by anodizing Ti–13Zr–13Nb alloy at 20 V for 120 min in 0.5% HF solution and then detached from the substrate. Figure 2a,b show examples of TEM images of the surface morphology of the formed ONTs layer at different scales. The on-top general view of the obtained ONTs layer in a selected micro-region revealed a uniform distribution of densely packed ONTs with single and very smooth walls and a high degree of self-organization. In the TEM image of a single oxide nanotube, its regular shape can be observed without any fraying at the top of ONT. The cross-section of a single oxide nanotube has a cylindrical shape. The obtained bamboo-like ONTs showed a vertical arrangement. No bundles of 1G ONTs growing locally were observed as was the case with 2G [17] and 3G [18] ONTs on the Ti–13Zr–13Nb alloy.
On the basis of TEM microscopic images, the morphological parameters of the produced 1G ONTs were determined, such as the average inner and outer diameter of the oxide nanotube and its length. Under the proposed anodizing conditions, the ONTs with an average inner diameter of 70(8) nm and an average outer diameter of 90(13) nm were formed. The average length of the ONTs was 0.91(7) μm. The obtained results are consistent within the limit of error with the values of morphological parameters determined on the basis of FE-SEM images in selected local areas of the 1G ONTs surface, formed under comparable conditions [15]. The mechanism of multi-step formation of 1G ONTs layer on the Ti–13Zr–13Nb alloy surface based on activity of fluoride ions in aqueous inorganic solutions was explained in detail in the previous work [18]. For comparison, 2G ONTs with the inner diameter of 61(11) nm, outer diameter of 103(16) nm, and length of 3.9(2) were formed on the same substrate surface in a 1M (NH4)2SO4 + 2% NH4F solution at 20 V for 120 min [17]. On the other hand, 3G ONTs on the Ti–13Zr–13Nb alloy formed in 1M C2H6O2 + 4%NH4F at 50 V for 80 min were characterized by the inner diameter of 218(39) nm, outer diameter of 362(44) nm, and length of 9.7(6) μm [14]. These results show that anodizing conditions, and in particular the type of electrolyte, have a significant impact on the morphological parameters of the obtained ONTs.
The proposed ONTs can be saturated with antibiotics and bactericidal/bacteriostatic substances, which will make it possible to omit the oral route of dosing the drug. The drug will act directly in the bone tissue, inhibiting the growth of bacteria already at the implantation site. Medicinal substances will be released from the inside of the ONTs in the place of the newly inserted implant. Innovative implants with a layer of ONTs on their surface can therefore be proposed as intelligent drug carriers in drug delivery systems, especially for personalized medicine [7]. They will also allow for painless application, faster healing, and significant acceleration of bone tissue regeneration [1,2,32].

3.2. ATR-FTIR Characterization of Ti–13Zr–13Nb Alloy before and after Anodizing

Measurements of transmittance in the fundamental IR range were based on the phenomenon of total internal reflection of light from the interface of two materials with different refractive indices. The ATR-FTIR spectroscopy, as one of the most accurate spectroscopic methods, allowed to assign particular functional groups to specific areas with characteristic absorption bands. The non-anodized Ti–13Zr–13Nb alloy along with the 1G ONTs layer was investigated by ATR-FTIR spectroscopy in the range of 4000–400 cm−1 (Figure 3).
Several characteristic bands for TiO2 are visible in both obtained ATR-FTIR spectra in Figure 3. The broad TiO2 peak observed at 3896–3577 cm−1 is related to the stretching vibrations of the hydroxyl group –OH, which represents water as moisture present on the surface of the material or in the vicinity of the tested sample [42]. Both the ATR-FTIR absorption spectrum recorded for the non-anodized Ti–13Zr–13Nb alloy and the 1G ONTs layer produced show a band at the wavelength of 1630 cm−1, which corresponds to bending modes of water Ti-OH [43]. The peak in the range of 873–558 cm−1 visible in the ATR-FTIR absorption spectrum for the 1G ONTs/Ti–13Zr–13Nb sample indicates the presence of TiO2 in the anodic oxide layer on the alloy substrate surface. The peak at 580 cm−1 in both obtained spectra corresponds to vibrations of the Ti-O bond [44]. This is a peak characteristic of TiO2 present on the surface of the material [45,46]. Bands in the range of 495–453 cm−1 correspond to the frequency of TiO2 in the rutile phase. Bands at 451 and 410 cm−1 correspond to the frequencies of the anatase nanocrystalline phase and/or the rutile phase [47]. The results obtained using ATR-FTIR spectroscopy confirmed the presence of the anodic ONTs layer on the Ti–13Zr–13Nb alloy surface. They are also in good agreement with the results obtained using the grazing incidence X-ray diffraction (GIXD) for the obtained 1G ONTs layer, which confirmed the presence of both α-Ti phase and β-Ti phase from the substrate and titanium oxides such as TiO2 (rutile), TiO3, and TiO [15].

3.3. Assessment of In Vitro Corrosion Resistance Measurements in Saline Solution

3.3.1. Open-Circuit Potential Measurements

The preliminary assessment of the effect of anodizing the Ti–13Zr–13Nb alloy in the proposed conditions on the corrosion resistance in vitro in saline solution was carried out based on the measurement of open-circuit potential. The conditions of the in vitro electrochemical measurements with the potentiostat open loop corresponded to the in vivo conditions in the human body. The EOC value was determined as the potential difference measured between WE and RE without using an external current source in the electrochemical system for 2 h as shown in Figure 4.
After 2 h of immersion, a stable EOC value for both tested electrodes was reached. After this time, the rate of Eoc change was slower than 1 mV min−1. For the non-anodized Ti–13Zr–13Nb electrode, the stable EOC was −42 mV(8) V, while for the 1G ONTs/Ti–13Zr–13Nb electrode, the EOC shift towards cathode potentials was observed. The significant decrease in the EOC value to −486 mV(24) V for the anodized Ti–13Zr–13Nb electrode indicates that the initiation of electrochemical corrosion will occur more easily on the porous surface of ONTs. Such a character of EOC changes initially indicates a greater thermodynamic tendency to the corrosion of porous 1G ONTs/Ti–13Zr–13Nb electrode. Figure 4 also shows the influence of the Ti–13Zr–13Nb alloy anodizing on the course of the EOC = f(t) curve. The observed changes in EOC reflect various trends in the metal | solution interface variability with increasing immersion time. As shown in Figure 4, the Eoc value for the non-anodized Ti–13Zr–13Nb electrode gradually shifted in time towards the anodic potentials. This phenomenon resulted from a spontaneous formation and thickening of an ultrathin oxide layer on the electrode surface with time [22]. The self-passive oxide layer protected the Ti–13Zr–13Nb electrode from dissolving in the electrolyte. In the case of the 1G ONTs/Ti13Zr-13Nb electrode, in the initial phase of the measurements, the EOC rapidly shifted towards the cathode potentials, and then the rate of its changes gradually decreased until it finally reached a stable value.

3.3.2. Analysis of Tafel Curves

Figure 5 shows the Tafel curves recorded in a narrow range of potentials ±50 mV relative to the EOC for the Ti–13Zr–13Nb electrode before and after anodizing in saline solution at 37 °C. The obtained log|j| = f(E) dependences were the basis for determining the corrosion resistance parameters, which are summarized in Table 1.
The values of corrosion resistance parameters, such as corrosion potential (Ecor), corrosion current density (jcor), and cathodic (bc) and anodic (ba) Tafel slope were determined numerically by fitting the parameters of the Butler–Volmer Equation (1) to the experimentally obtained dependence j = f(E) [48]:
j = j cor exp 2.303 ( E E cor ) b a exp 2.303 ( E E cor ) b c
Polarization resistance (Rp) and general corrosion rate at Ecor were calculated using Equations (2) and (3), respectively, according to ASTM G102:89(2015)e1 [49]:
R p = B j kor
CR = K 1 EW ρ j kor
where B—Stern–Geary coefficient, K1—conversion constant, EW—equivalent weight, and ρ—density.
The EW for the Ti–13Zr–13Nb electrode was calculated at 12.5 assuming the thermodynamically stable forms of Ti4+, Zr2+, and Nb5+ based on the Pourbaix diagram of Ti-H2O, Zr-H2O, and Nb-H2O system, respectively [50]. CR is expressed in mm yr−1 assuming in the Equation (3) the value of K1 equal to 3.27 × 10⁻³ mm g μA−1 cm−1 yr−1 and taking into account jcor expressed in μA cm−2.
The potentiodynamic polarization curves presented in Figure 5 illustrate the course of anodic and cathodic reactions in the corrosion process of the non-anodized and anodized Ti–13Zr–13Nb electrodes in saline solution. One of the most important electrochemical parameters that quantify the changes in the corrosion resistance of the materials under study is the Ecor (Table 1). This thermodynamic quantity has values similar to the EOC. The Ecor can be used as a comparative parameter for the assessment of the corrosion resistance of various materials in the same corrosive environment. Figure 5 shows the Ecor shift towards the cathodic potentials for 1G ONTs/Ti–13Zr–13Nb electrode in comparison with the Ti–13Zr–13Nb electrode before anodizing. Such electrochemical behavior indicates a lower corrosion tendency for the Ti–13Zr–13Nb electrode covered with a self-passive oxide layer with stronger barrier properties [10,14,22,51,52].
The jcor value for the porous 1G ONTs/Ti–13Zr–13Nb electrode is ca. 15 times higher as compared to the jcor determined for the non-anodized substrate (Table 1). The obtained values are directly proportional to the CR at the Ecor. These results indicate faster dissolution rate of the anodic 1G ONTs layer as compared to the self-passive oxide layer formed spontaneously. However, it should be emphasized that the material consumption of both tested electrodes is on the same order of 10−3 mm yr−1 (Table 1).
The Tafel slope for the cathodic (bc) and anodic (ba) branch were determined based on the Equations (4) and (5), respectively [48]:
b c = 2.3 RT α nF
b a = 2.3 RT ( 1 - α ) nF
In the above equations, R is assigned to the gas constant equal to 8.314 J K−1 mol−1, T denotes the temperature in K, α means the cathodic transfer coefficient, n is the number of electrons involved in the reaction, and F is the Faraday constant equal to 96,500 C mol−1.
For both tested electrodes bc > ba, i.e., the rate determining step of the corrosion process is the slower anodic reaction (Table 1). Based on the results obtained, it is possible to propose the corrosion mechanism of the investigated materials, which is consistent with the passive dissolution under anaerobic conditions in a neutral aqueous solution [3,53].
The course of the charge transfer reaction can be described by the following general reaction in which H2O acts as the oxidation agent:
Me + n H 2 O Me ( OH ) n + n 2 H 2
The Me(OH)n products in Reaction (6) can be metal oxides, hydroxides, or hydrated oxides. Gaseous hydrogen is also evolved as a product of this reaction.
The Reaction (6) is coupled with the water reduction consuming electrons from the oxidation reaction. The Reactions (7) and (8) also proceed in a neutral solution:
O 2 + 2 H 2 O + 4 e - 4 OH -
2 H 2 O + 2 e - H 2 + 2 OH -
Based on the bc and ba values in Table 1, one can see that the rate of anodic reaction described by Equation (6) is slower as compared to the rate of the reduction reactions represented by Equations (7) and (8). It can be concluded that anodizing does not change the nature of the electrochemical processes occurring on the Ti–13Zr–13Nb electrode in saline solution. However, a strong decrease in the Rp value is observed for the Ti–13Zr–13Nb electrode covered with the 1G ONTs layer compared to the non-anodized electrode with an amorphous native oxide layer (Table 1) [10]. The corrosion resistance of such electrodes is dependent on both the structure and thickness of the oxide layer [15].

3.3.3. EIS Study on Mechanism and Kinetics of Electrochemical Corrosion in Saline Solution

EIS method was used for characterization of the interfacial properties of the Ti–13Zr–13Nb |oxide layer| saline solution system. The experimental Nyquist diagrams for the Ti–13Zr–13Nb electrode before [10] and after anodizing recorded at EOC in saline solution at 37 °C are shown as symbols in Figure 6a and b, respectively. The corresponding phase angle Bode diagrams are presented in Figure 7. Symbols in Figure 6 and Figure 7 are experimental data and continuous lines are CNLS fit. The CNLS fitting procedure used the concept of electrical equivalent circuits in which, instead of capacitors, the constant phase element (CPE) was applied. The impedance of CPE ( Z ^ CPE ) was defined by the Equation (9) [10]:
Z ^ CPE = 1 T ( j ω ) ϕ
where T is the capacitance parameter expressed in F sϕ−1 cm−2 dependent on the potential of electrode potential, and ϕ relates to the angle of rotation of purely capacitive line on the complex plane plots of α = 90 °(1 – ϕ). The CPE is a leaking capacitor with nonzero real and imaginary components. For ϕ = 1, T is equal to the capacitance of the double layer (Cdl), and purely capacitive behavior is observed. According to Equation (9), pure capacitance is for ϕ equal to 1, infinite Warburg impedance for ϕ equal to 0.5, pure resistance for ϕ equal to 0, and pure inductance for ϕ equal to 1 [37].
The maximum value of φ is slightly less than 90° in the case of the non-anodized and anodized Ti–13Zr–13Nb electrodes (Figure 7). For the non-anodized electrode, only one time constant is present in the electrical circuit (Figure 6a and Figure 7a). Such impedance behavior characterizes titanium and its alloys coated with a thin oxide layer in a biological milieu [3,6,10,14,52]. Two time constants are visible in the electrical circuit for the Ti–13Zr–13Nb electrode with anodic 1G ONTs layer (Figure 6b and Figure 7b). The obtained results are in accordance with our previous study on the EIS behavior of the autoclaved alloy with a sintered HAp/nSiO2/Ag hybrid coating [6] and the Ti–13Zr–13Nb alloy with formed ONTs layers of second- and third-generation [10,14]. The experimental high values of |Z|f→0 are typical for materials with capacitive behavior and high corrosion resistance [37].
The EIS experimental data on the protective properties of a self-passive oxide layer on the surface of the non-anodized Ti–13Zr–13Nb electrode were approximated using the equivalent electrical circuit model for the pitting corrosion process which is called one-CPE model (Figure 6a) [10,37]. This model with four adjustable parameters as R1, CPE1-T, CPE1-ϕ, and R2 displays only one semicircle on the Nyquist plot [3,6,10,14,37,52]. In this model, R1 is the solution resistance, CPE1-T denotes the CPE1 capacitive parameter, CPE1-ϕ is the CPE1 exponent associated with the Cdl, and R2 is the charge transfer resistance through the interface of electrode |oxide layer| electrolyte. The construction of such equivalent electrical circuits as well as the physical meaning of the individual circuit parameters have been described in detail in earlier work [10,37].
In the case of the Ti–13Zr–13Nb electrode with the layer of 1G ONT, to approximate the experimental EIS data, the equivalent electrical circuit model for the pitting corrosion process illustrated in Figure 6b was used. This two-CPE model is described by seven adjustable parameters, R1, CPE1-T, CPE1-ϕ, R2, CPE2-T, CPE2-ϕ, R3, and displays two semicircles on the Nyquist plot [6,10,37]. In this model, presence of a two-layered structure of the passive oxide film on the surface of the metallic electrode is assumed. The semicircle at high frequencies (HF) refers to the outer oxide layer with a porous structure (ONTs) and is described by the circuit parameters such as R1, CPE-T1, CPE-ϕ1, and R2. R1 is the solution resistance, CPE1-T is the capacitance of porous ONTs layer, CPE1-ϕ is the CPE1 exponent, and R2 corresponds to the resistance of the ONTs layer. The remaining parameters of the circuit as CPE2-T, CPE2-ϕ, and R3 describe the second semicircle at low frequencies (LF) which refers to the inner-barrier oxide layer directly adjacent to the alloy substrate and showing strong protective properties. CPE2-T and CPE2-ϕ are the CPE2 capacitive parameter and the CPE2 exponent, respectively, related to the barrier oxide layer. R3 is the resistance of this barrier oxide layer.
Figure 6 and Figure 7 illustrate the CNLS-fitted data marked as continuous lines which were obtained using the described electrical equivalent circuits. The very good quality of the CNLS fit is observed. All CNLS-fit parameters determined using the one-CPE equivalent electrical circuit model shown in Figure 6a for the Ti–13Zr–13Nb electrode before anodizing are summarized in Table 2. Table 3 presents all CNLS-fit parameters determined using the two-CPE equivalent electrical circuit model shown in Figure 6b for the Ti–13Zr–13Nb electrode with 1G ONTs layer.
The value of R2 = 1.01(1) kΩ cm2 is obtained for the Ti–13Zr–13Nb electrode before anodizing (Table 2), which is close to the Rp parameter determined based on the polarization curves near the EOC (Table 1). The obtained results prove the correctness of the performed EIS tests. In physical and chemical terms, the parameters R2 and Rp mean the same and refer to the ongoing corrosion process according to Equation (6). In the case of the Ti–13Zr–13Nb electrode with 1G ONTs layer, the charge transfer resistance associated with the outer oxide layer, R3 of 916(12) Ω cm2, is over 627 times higher in comparison with R2 (Table 3). This phenomenon may result from the fact that the local electrolyte concentration inside the oxide nanotubes strongly increases compared to the pH in the volume of the electrolyte, which intensifies the destructive processes at the bottom of the oxide nanotubes. The deviation of CPE-ϕ parameter from 1 can be related to physico-chemical or geometrical inhomogeneities [37].

3.3.4. LEIS and SVET Study of Local Corrosion Resistance in Saline

Figure 8 shows the distributions of the local values of the impedance modulus |Z| over the surface of the Ti–13Zr–Nb alloy before and after electrochemical oxidation in 0.9% NaCl solution. The average value of impedance irregularities determined for non-anodized Ti–13Zr–Nb and after electrochemical oxidation are approximately 1.6 kΩ and 13 Ω, respectively. On this basis, it can be concluded that the surface of the non-anodized Ti–13Zr–Nb alloy is characterized by a relatively heterogeneous distribution of impedance values compared to the Ti–13Zr–Nb alloy with 1G ONTs layer. The cause of local impedance fluctuations (of the order of several kΩ cm2) is probably the non-uniform thickness of the natural passive layer formed on Ti–13Zr–Nb in the initial state. From a thermodynamic viewpoint, Ti and its alloys can react quickly with oxygen and produce stable metal oxides on the surface. Native oxide films formed in the air are ultrathin [3,22,51]. The thickness of the native oxide film exposed to air increases over time. Its composition and microstructure are dependent on the temperature and pH of the environment. The native oxide film on the surface of Ti and its alloys often becomes inhomogeneous as it grows, which may be the cause of a relatively heterogeneous distribution of local impedance values. Therefore, in order to increase the stability of the native oxide layer on the titanium and its alloys, ensuring high corrosion resistance of implants, forced passivation is often used in clinical practice. It should be noted that the average value of the impedance modulus determined for the non-anodized Ti–13Zr–Nb is over 8 times higher compared to Ti–13Zr–Nb after electrochemical oxidation. For Ti–13Zr–Nb in the initial state, it is 20.3 kΩ cm2, and for Ti–13Zr–Nb after electrochemical oxidation, it is equal to 2.5 kΩ cm2. This effect is related to the formation of a porous layer of ONTs as the outer part of the passive layer. The analysis of the impedance distribution maps recorded at EOC confirms and complements the results obtained with the EIS method (Figure 6 and Figure 7).
The scanning vibrating electrode (SVET) technique also known as scanning vibrating probe (SVP) technique was used to measure the localized current flowing in a saline electrolyte above the tested samples. Figure 9 presents distributions of local values of ion current density (j) over the surface of the non-anodized and anodized Ti–13Zr–Nb alloy in a 0.9% NaCl solution.
The obtained SVET maps show that the average value j determined for the Ti–13Zr–Nb alloy in the initial state is about 2 times higher compared to the anodized sample. For the non-anodized Ti–13Zr–13Nb alloy, the average j is 81 µA cm−2, and for the Ti–13Zr–Nb substrate covered with a layer of 1G ONTs, it is 41 µA cm−2. The observed difference in the anodic current values indicates that the electrochemical oxidation process is faster/easier on the non-anodized surface of the Ti–13Zr–Nb alloy compared to the material on which the oxide layer has already been formed. It proves that it is easier to oxidize the fresh surface of the Ti–13Zr–Nb alloy than to thicken the already existing oxide layer. The average value of current density irregularities determined for the Ti–13Zr–Nb alloy before and after anodizing are about 10 µA cm−2 and 9 µA cm−2, respectively. On this basis, it can be concluded that the surface of the Ti–13Zr–Nb alloy, both in the initial state and after electrochemical oxidation, is characterized by a relatively homogeneous distribution of ion current density values.

3.3.5. Study of Anodic Polarization Curves on Susceptibility to Pitting Corrosion in Saline

The susceptibility of the Ti–13Zr–13Nb alloy without and with the 1G ONTs layer to pitting corrosion in the saline environment was determined on the basis of recording the anodic polarization curves obtained by the potentiodynamic method. A continuous change of the WE potential was recorded with the electrode polarization rate v = 1 mV s−1 with the simultaneous recording of the current flowing through the interface electrode | solution. The measurement was carried out from the potential 150 mV as more negative in relation to the EOC towards the anodic potentials to the value of 9.4 V, recording the cathode–anode transition. Comparison of anodic polarization curves in the form of log|j|=f(E) for the non-anodized and anodized Ti–13Zr–13Nb electrodes is shown in Figure 10.
Based on the obtained potentiodynamic characteristics in a very wide range of potentials, a similar course for both tested electrodes and their passive anodic behavior can be stated. However, one can observe that the formation of the 1G ONTs layer by anodizing of the Ti–13Zr–13Nb electrode causes the shift of the anodic polarization curve towards cathodic potentials. This is due to the decrease in the corrosion resistance of the porous 1G ONTs layer in comparison to the smooth and ultrathin oxide layer formed spontaneously on the surface of Ti–13Zr–13Nb. The lower passive current densities of the order of 10−5 A cm−2 were also observed for the non-anodized Ti–13Zr–13Nb electrode, which indicate the slower anodic dissolution according to Equation (6) in the case of the self-passive layer. Importantly, on both recorded anodic polarization curves, no increase in the measured passive current density is observed up to 9.4 V, which would be associated with the initiation of pitting corrosion in saline solution. Determination of the breakdown potential of the oxide layers on the Ti–13Zr–13Nb electrode above the applied anodic limit was impossible due to the limitations of the potentiostat and the stability of RE. The obtained anodic characteristics confirm the excellent corrosion resistance in vitro of both the non-anodized and anodized Ti–13Zr–13Nb electrodes in saline solution containing aggressive chloride ions, which is required for long-term implants.

4. Conclusions

Based on the conducted studies using TEM and ATR-FTIR methods, it was found that the surface modification of the biomedical Ti–13Zr–13Nb alloy via anodizing in a 0.5% HF electrolyte at 20 V for 120 min allowed to produce nanotubular oxide layers.
The obtained 1G ONTs with a rutile structure have the average inner diameter of 70(8) nm, average outer diameter of 90(13) nm, and average length of 0.91(7) μm. EIS study of the anodized Ti–13Zr–13Nb electrode revealed the impedance behavior typical for titanium and its alloys covered with a porous oxide layer, which was confirmed by local corrosion resistance parameters obtained by LEIS and SVET methods. The slight decrease in corrosion resistance of the anodized Ti–13Zr–13Nb electrode in comparison with the self-passive Ti–13Zr–13Nb electrode was revealed. However, no susceptibility to pitting corrosion up to 9.4 V was found in potentiodynamic studies for both the non-anodized and anodized Ti–13Zr–13Nb electrode, confirming their excellent in vitro corrosion resistance in saline solution. Thanks to the ability to control the diameter and length of the nanotubes, the porous surface of the 1G ONTs layer can also be used as an intelligent drug carrier and accelerate the process of osseointegration.

Author Contributions

Conceptualization, B.Ł.; methodology, B.Ł., A.S. and J.K.; software, B.Ł. and J.K.; validation, A.S., J.K., P.O. and M.Z.; formal analysis, A.S., J.K., P.O. and M.Z.; investigation, A.S., J.K., P.O. and M.Z.; resources, B.Ł.; data curation, A.S., J.K., P.O. and M.Z.; writing—original draft preparation, B.Ł., A.S., J.K. and P.O.; writing—review and editing, M.Z.; visualization, A.S., J.K. and P.O.; supervision, B.Ł.; project administration, B.Ł.; funding acquisition, B.Ł. All authors have read and agreed to the published version of the manuscript.

Funding

This research received no external funding.

Institutional Review Board Statement

Not applicable.

Informed Consent Statement

Not applicable.

Data Availability Statement

Not applicable.

Conflicts of Interest

The authors declare no conflict of interest.

References

  1. Jakubowicz, J. Ti-Based Biomaterials: Synthesis, Properties and Applications; MDPI AG: Basel, Switzerland, 2020. [Google Scholar] [CrossRef]
  2. Anene, F.; Jaafar, C.A.; Zainol, I.; Hanim, M.A.; Suraya, M. Biomedical materials: A review of titanium based alloys. Proc. Inst. Mech. Eng. Part C J. Mech. Eng. Sci. 2020, 235, 3792–3805. [Google Scholar] [CrossRef]
  3. Łosiewicz, B.; Osak, P.; Maszybrocka, J.; Kubisztal, J.; Stach, S. Effect of autoclaving time on corrosion resistance of sandblasted Ti G4 in artificial saliva. Materials 2020, 13, 4154. [Google Scholar] [CrossRef] [PubMed]
  4. Aniołek, K.; Łosiewicz, B.; Kubisztal, J.; Osak, P.; Stróż, A.; Barylski, A.; Kaptacz, S. Mechanical properties, corrosion resistance and bioactivity of oxide layers formed by isothermal oxidation of Ti-6Al-7Nb alloy. Coatings 2021, 11, 505. [Google Scholar] [CrossRef]
  5. Osak, P.; Maszybrocka, J.; Kubisztal, J.; Ratajczak, P.; Łosiewicz, B. Long-Term Assessment of the In Vitro Corrosion Resistance of Biomimetic ACP Coatings Electrodeposited from an Acetate Bath. J. Funct. Biomater. 2021, 12, 12. [Google Scholar] [CrossRef]
  6. Dudek, K.; Dulski, M.; Łosiewicz, B. Functionalization of the NiTi Shape Memory Alloy Surface by HAp/SiO2/Ag Hybrid Coatings Formed on SiO2-TiO2 Glass Interlayer. Materials 2020, 13, 1648. [Google Scholar] [CrossRef]
  7. Łosiewicz, B.; Stróż, A.; Osak, P.; Maszybrocka, J.; Gerle, A.; Dudek, K.; Balin, K.; Łukowiec, D.; Gawlikowski, M.; Bogunia, S. Production, Characterization and Application of Oxide Nanotubes on Ti–6Al–7Nb Alloy as a Potential Drug Carrier. Materials 2021, 14, 6142. [Google Scholar] [CrossRef]
  8. Costa, B.C.; Tokuhara, C.; Rocha, L.A.; Oliveira, R.C.; Lisboa-Filho, P.N.; Pessoa, J. Vanadium ionic species from degradation of Ti-6Al-4V metallic implants: In vitro cytotoxicity and speciation evaluation. Mater. Sci. Eng. C 2019, 96, 730–739. [Google Scholar] [CrossRef] [PubMed]
  9. Ossowska, A.; Zieliński, A.; Supernak, M. Formation of High Corrosion Resistant Nanotubular Layers on Titanium Alloy Ti13Nb13Zr. Solid State Phenom. 2011, 183, 137–142. [Google Scholar] [CrossRef]
  10. Smołka, A.; Dercz, G.; Rodak, K.; Łosiewicz, B. Evaluation of corrosion resistance of nanotubular oxide layers on the Ti13Zr13Nb alloy in physiological saline solution. Arch. Metall. Mater. 2015, 60, 2681–2686. [Google Scholar] [CrossRef]
  11. Luz, A.R.; de Souza, G.B.; Lepienski, C.M.; Siqueira, C.J.M.; Kuromoto, N.K. Tribological properties of nanotubes grown on Ti-35Nb alloy by anodization. Thin Solid Film. 2018, 660, 529–537. [Google Scholar] [CrossRef]
  12. Stróż, A.; Goryczka, T.; Łosiewicz, B. Electrochemical formation of self-organized nanotubular oxide layers on niobium (Review). Curr. Nanosci. 2019, 15, 42–48. [Google Scholar] [CrossRef]
  13. Schneider, S.G.; Nunes, C.A.; Rogero, S.P.; Higa, O.Z.; Bressiani, J.C. Mechanical properties and cytotoxic evaluation of the Ti-13Nb-13Zr alloy. Biomecánica 2000, 8, 84–87. [Google Scholar] [CrossRef]
  14. Stróż, A.; Łosiewicz, B.; Zubko, M.; Chmiela, B.; Balin, K.; Dercz, G.; Gawlikowski, M.; Goryczka, T. Production, structure and biocompatible properties of oxide nanotubes on Ti13Nb13Zr alloy for medical applications. Mater. Charact. 2017, 132, 363–372. [Google Scholar] [CrossRef]
  15. Stróż, A.; Dercz, G.; Chmiela, B.; Łosiewicz, B. Electrochemical synthesis of oxide nanotubes on biomedical Ti13Nb13Zr alloy with potential use as bone implant. AIP Conf. Proc. 2019, 2083, 030004. [Google Scholar] [CrossRef]
  16. Smołka, A.; Rodak, K.; Dercz, G.; Dudek, K.; Łosiewicz, B. Electrochemical Formation of Self-Organized Nanotubular Oxide Layers on Ti13Zr13Nb Alloy for Biomedical Applications. Acta Phys. Pol. 2014, 125, 932–935. [Google Scholar] [CrossRef]
  17. Stróż, A.; Dercz, G.; Chmiela, B.; Stróż, D.; Łosiewicz, B. Electrochemical formation of second generation TiO2 nanotubes on Ti13Nb13Zr alloy for biomedical applications. Acta Phys. Pol. 2016, 130, 1079–1080. [Google Scholar] [CrossRef]
  18. Łosiewicz, B.; Skwarek, S.; Stróż, A.; Osak, P.; Dudek, K.; Kubisztal, J.; Maszybrocka, J. Production and Characterization of the Third-Generation Oxide Nanotubes on Ti-13Zr-13Nb Alloy. Materials 2022, 15, 2321. [Google Scholar] [CrossRef]
  19. Lee, T. Variation in Mechanical Properties of Ti-13Nb-13Zr Depending on Annealing Temperature. Appl. Sci. 2020, 10, 7896. [Google Scholar] [CrossRef]
  20. Davidson, J.A.; Kovacs, P. New Biocompatible, Low Modulus Titanium Alloy for Medical Implants. U.S. Patent No. 5,169,597, 8 December 1992. [Google Scholar]
  21. Lee, M.; Kim, I.-S.; Moon, Y.H.; Yoon, H.S.; Park, C.H.; Lee, T. Kinetics of Capability Aging in Ti-13Nb-13Zr Alloy. Crystals 2020, 10, 693. [Google Scholar] [CrossRef]
  22. Szklarska, M.; Dercz, G.; Simka, W.; Łosiewicz, B.A.c. impedance study on the interfacial properties of passivated Ti13Zr13Nb alloy in physiological saline solution. Surf. Interface Anal. 2014, 46, 698–701. [Google Scholar] [CrossRef]
  23. Osak, P.; Maszybrocka, J.; Zubko, M.; Rak, J.; Bogunia, S.; Łosiewicz, B. Influence of Sandblasting Process on Tribological Properties of Titanium Grade 4 in Artificial Saliva for Dentistry Applications. Materials 2021, 14, 7536. [Google Scholar] [CrossRef] [PubMed]
  24. Osak, P.; Maszybrocka, J.; Kubisztal, J.; Łosiewicz, B. Effect of amorphous calcium phosphate coatings on tribological properties of titanium grade 4 in protein-free artificial saliva. Biotribology 2022, 32, 100219. [Google Scholar] [CrossRef]
  25. Stróż, A.; Maszybrocka, J.; Goryczka, T.; Dudek, K.; Osak, P.; Łosiewicz, B. Influence of Anodizing Conditions on Biotribological and Micromechanical Properties of Ti–13Zr–13Nb Alloy. Materials 2023, 16, 1237. [Google Scholar] [CrossRef] [PubMed]
  26. Stróż, A.; Luxbacher, T.; Dudek, K.; Chmiela, B.; Osak, P.; Łosiewicz, B. In Vitro Bioelectrochemical Properties of Second-Generation Oxide Nanotubes on Ti–13Zr–13Nb Biomedical Alloy. Materials 2023, 16, 1408. [Google Scholar] [CrossRef] [PubMed]
  27. Durdu, S.; Cihan, G.; Yalcin, E.; Altinkok, A. Characterization and mechanical properties of TiO2 nanotubes formed on titanium by anodic oxidation. Ceram. Int. 2021, 47, 10972–10979. [Google Scholar] [CrossRef]
  28. Ossowska, A.; Olive, J.-M.; Zielinski, A.; Wojtowicz, A. Effect of double thermal and electrochemical oxidation on titanium alloys for medical applications. Appl. Surf. Sci. 2021, 563, 150340. [Google Scholar] [CrossRef]
  29. Ossowska, A.; Zieliński, A.; Olive, J.-M.; Wojtowicz, A.; Szweda, P. Influence of Two-Stage Anodization on Properties of the Oxide Coatings on the Ti–13Nb–13Zr Alloy. Coatings 2020, 10, 707. [Google Scholar] [CrossRef]
  30. Handzlik, P.; Gutkowski, K. Synthesis of oxide nanotubes on Ti13Nb13Zr alloy by the electrochemical method. J. Porous Mater. 2019, 26, 1631–1637. [Google Scholar] [CrossRef]
  31. Stępień, M.; Handzlik, P.; Fitzner, K. Electrochemical synthesis of oxide nanotubes on Ti6Al7Nb alloy and their interaction with the simulated body fluid. J. Solid State Electrochem. 2016, 20, 2651–2661. [Google Scholar] [CrossRef]
  32. Wu, S.; Wang, S.; Liu, W.; Yu, X.; Wang, G.; Chang, Z.; Wen, D. Microstructure and properties of TiO2 nanotube coatings on bone plate surface fabrication by anodic oxidation. Surf. Coat. Technol. 2019, 374, 362–373. [Google Scholar] [CrossRef]
  33. Zhang, S.; Qin, J.; Yang, C.; Zhang, X.; Liu, R. Effect of Zr addition on the microstructure and tribological property of the anodization of Ti-6Al-4V alloy. Surf. Coat. Technol. 2018, 356, 38–48. [Google Scholar] [CrossRef]
  34. Guntherschulze, A.; Betz, H. Neue Untersuchungen Uber die elektrolytische Ventilwirkung: I. Die Oxydschicht des Tantals. Z. Fur Phys. 1931, 68, 145–161. [Google Scholar] [CrossRef]
  35. Kowalski, D.; Kim, D.; Schmuki, P. TiO2 nanotubes, nanochannels and mesosponge: Self-organized formation and applications. Nano Today 2013, 8, 235–264. [Google Scholar] [CrossRef]
  36. ASTM F1713-08(2021)e1; Standard Specification for Wrought Titanium-13Niobium-13Zirconium Alloy for Surgical Implant Applications (UNS R58130). ASTM: West Conshohocken, PA, USA, 2021.
  37. Lasia, A. Electrochemical Impedance Spectroscopy and Its Applications; Springer Science + Business Media: New York, NY, USA, 2014; ISBN 978-1-4614-8932-0. [Google Scholar] [CrossRef]
  38. User Manual for Frequency Response Analysis (FRA) for Windows, version 4.9; Eco Chemie, B.V.: Utrecht, The Netherlands, 2001.
  39. Łosiewicz, B.; Popczyk, M.; Szklarska, M.; Smołka, A.; Osak, P.; Budniok, A. Use of Scanning Vibrating Electrode Technique to Localized Corrosion Evaluation. Solid State Phenom. 2015, 228, 353–368. [Google Scholar] [CrossRef]
  40. Łosiewicz, B.; Popczyk, M.; Smołka, A.; Szklarska, M.; Osak, P.; Budniok, A. Localized Electrochemical Impedance Spectroscopy for Studying the Corrosion Processes in a Nanoscale. Solid State Phenom. 2015, 228, 383–393. [Google Scholar] [CrossRef]
  41. Łosiewicz, B.; Kubisztal, J. Effect of hydrogen electrosorption on corrosion resistance of Pd80Rh20 alloy in sulfuric acid: EIS and LEIS study. Int. J. Hydrogen Energy 2018, 43, 20004–20010. [Google Scholar] [CrossRef]
  42. Pezhooli, N.; Rahimi, J.; Hasti, F.; Maleki, A. Synthesis and Evaluation of Composite TiO2@ZnO Quantum Dots on Hybrid Nanostructure Perovskite Solar Cell. Sci. Rep. 2022, 12, 9885. [Google Scholar] [CrossRef]
  43. León, A.; Reuquen, P.; Garín, C.; Segura, R.; Vargas, P.; Zapata, P.; Orihuela, P.A. FTIR and Raman Characterization of TiO2 Nanoparticles Coated with Polyethylene Glycol as Carrier for 2-Methoxyestradiol. Appl. Sci. 2017, 7, 49. [Google Scholar] [CrossRef]
  44. Ghann, W.; Kang, H.; Sheikh, T.; Yadav, S.; Chavez-Gil, T.; Nesbitt, F.; Uddin, J. Fabrication, Optimization and Characterization of Natural Dye Sensitized Solar Cell. Sci. Rep. 2017, 7, 41470. [Google Scholar] [CrossRef]
  45. Al-Amin, M.; Dey, S.; Rashid, T.; Ashaduzzaman, M.; Shamsuddin, S. Solar Assisted Photocatalytic Degradation of Reactive Azo Dyes in Presence of Anatase Titanium Dioxide. Int. J. Latest Res. Eng. Technol. 2016, 2, 14–21. [Google Scholar]
  46. Zhu, Y. Insight into the Structure and Formation of Titanium Oxide Nanotubes. Funct. Mater. Lett. 2008, 1, 239–246. [Google Scholar] [CrossRef]
  47. Petrović, B.; Kisić, D.; Jokanović, B.; Rakočević, Z.; Nasov, I.; Trajkovska Petkoska, A.; Jokanović, V. Wetting Properties of 700 Titanium Oxides, Oxynitrides and Nitrides Obtained by DC and Pulsed Magnetron Sputtering and Cathodic Arc Evaporation. Mater. Sci.-Pol. 2019, 37, 173–181. [Google Scholar] [CrossRef]
  48. Bard, A.J.; Faulkner, L.R. Electrochemical Methods. In Fundamentals and Applications, 2nd ed.; Wiley: New York, NY, USA, 2001. [Google Scholar]
  49. ASTM G102:89(2015)e1; Standard Practice for Calculation of Corrosion Rates and Related Information from Electrochemical Measurements. ASTM: West Conshohocken, PA, USA, 2015.
  50. Pourbaix, M. Atlas of Electrochemical Equilibria in Aqueous Solutions, 2nd ed.; NACE International, National Association of Corrosion Engineers: Houston, TX, USA, 1974; ISBN 10: 0915567989. [Google Scholar]
  51. Freitag, M.; Łosiewicz, B.; Goryczka, T.; Lelątko, J. Application of EIS to study the corrosion resistance of passivated NiTi shape memory alloy in simulated body fluid. Solid State Phenom. 2012, 183, 57–64. [Google Scholar] [CrossRef]
  52. Osak, P.; Łosiewicz, B. EIS study on interfacial properties of passivated Nitinol orthodontic wire in saliva modified with 711 Eludril® Mouthwash. Prot. Met. Phys. Chem. Surf. 2018, 54, 680–688. [Google Scholar] [CrossRef]
  53. Brunette, D.M.; Tengvall, P.; Textor, M.; Thomsen, P. Titanium in Medicine. In Material Science, Surface Science, Engineering, Biological Responses and Medical Applications; Springer: Berlin, Germany, 2001; pp. 145–162. ISBN 978-3-642-56486-4. [Google Scholar]
Figure 1. Scheme of the SVET setup with Scanning Electrochemical Workstation Software M370, Version 1.20: (a) Sample under potentiostatic control with isolated potentiostat; (b) TriCell with a four-electrode configuration.
Coatings 13 00875 g001
Figure 2. TEM microscopic image of 1G ONTs produced by anodizing Ti–13Zr–13Nb alloy at 20 V for 120 min in 0.5% HF solution and then detached from the substrate: (a) On-top general view of the ONTs layer; (b) On-top general view of the ONTs layer at higher magnification; (c) Single oxide nanotube.
Coatings 13 00875 g002
Figure 3. The ATR-FTIR absorption spectrum of the non-anodized Ti–13Zr–13Nb alloy and with 1G ONTs layer formed at 20 V for 120 min in 0.5% HF solution.
Coatings 13 00875 g003
Figure 4. Dependence of open-circuit potential (EOC) on immersion time (t) for the Ti–13Zr–13Nb electrode without and with 1G ONTs layer in saline solution at 37 °C.
Coatings 13 00875 g004
Figure 5. Tafel curves for the Ti–13Zr–13Nb electrode before [10] and after anodizing in saline solution at 37 °C. The polarization scan rate was v = 1 mV s−1.
Coatings 13 00875 g005
Figure 6. Nyquist diagram for the Ti–13Zr–13Nb electrode in saline solution at 37 °C with the equivalent electrical circuit model for the pitting corrosion process: (a) Non-anodized [10]; (b) After formation of 1G ONTs layer.
Coatings 13 00875 g006
Figure 7. Phase angle Bode diagram for the Ti–13Zr–13Nb electrode in saline solution at 37 °C: (a) Non-anodized [10]; (b) After formation of 1G ONTs layer.
Coatings 13 00875 g007
Figure 8. LEIS maps recorded at EOC in saline solution at 37 °C for the Ti–13Zr–13Nb: (a) |Z| for the non-anodized alloy; (b) φ for the non-anodized alloy; (c) |Z| for the anodized alloy; (d) φ for the anodized alloy.
Coatings 13 00875 g008
Figure 9. Ion current density maps for the Ti–13Zr–13N alloy in saline solution at 37 °C: (a) Non-anodized; (b) Anodized. X and Y coordinates denote the length of the mapping in µm.
Coatings 13 00875 g009
Figure 10. Anodic polarization curves for the non-anodized and anodized Ti–13Zr–13Nb electrode in saline solution at 37 °C.
Coatings 13 00875 g010
Table 1. In vitro corrosion resistance parameters determined based on the Tafel curves for the Ti–13Zr–13Nb electrode before and after anodizing in saline solution at 37 °C (see Figure 5).
Electrode TypeEcor
(V)
jcor
(A cm−2)
bc
(V dec−1)
ba
(V dec−1)
Rp
(Ω cm2)
CR at Ecor
(mm yr−1)
Ti–13Zr–13Nb [10]−0.038(8)3.3(7) × 10−7−0.018(4)0.012(2)460(92)0.003(1)
1G ONTs/Ti–13Zr–13Nb−0.497(26)4.9(9) × 10−6−0.033(8)0.032(7)50(7)0.004(1)
Table 2. The parameters with standard deviations determined by approximation of the experimental EIS data for the non-anodized Ti–13Zr–13Nb electrode in saline solution at 37 °C [10] and the one-CPE equivalent electrical circuit model for the pitting corrosion process (see Figure 6a).
Electrode TypeR1
(Ω cm2)
CPE1-T
(F cm−2 s ϕ−1)
CPE1R2
(kΩ cm2)
Non-anodized Ti–13Zr–13Nb20.69(2)0.73(5) × 10−50.877(8)1.01(1)
Table 3. The parameters with standard deviations determined by approximation of the experimental EIS data for the anodized Ti–13Zr–13Nb electrode in saline solution at 37 °C and the two-CPE equivalent electrical circuit model for pitting corrosion process (see Figure 6b).
Electrode TypeR1
(Ω cm2)
CPE1-T
(F cm−2 s ϕ−1)
CPE1R2
(Ω cm2)
CPE2-T
(F cm−2 s ϕ−1)
CPE2R3
(Ω cm2)
1G ONTs/
Ti–13Zr–13Nb
0.57(1)5.08(34) × 10−30.805(9)1.46(3)1.87(2) × 10−20.821(1)916(12)
Disclaimer/Publisher’s Note: The statements, opinions and data contained in all publications are solely those of the individual author(s) and contributor(s) and not of MDPI and/or the editor(s). MDPI and/or the editor(s) disclaim responsibility for any injury to people or property resulting from any ideas, methods, instructions or products referred to in the content.

