Article

Thermo-Mechanical Coupling Numerical Simulation for Extreme High-Speed Laser Cladding of Chrome-Iron Alloy

1
China Academy of Machinery Science and Technology Group Co., Ltd., Beijing 100044, China
2
Beijing National Innovation Institute of Lightweight Co., Ltd., Beijing 100083, China
3
China Machinery Institute of Advanced Materials Co., Ltd., Zhengzhou 450001, China
*
Author to whom correspondence should be addressed.
Coatings 2023, 13(5), 879; https://doi.org/10.3390/coatings13050879
Submission received: 15 April 2023 / Revised: 29 April 2023 / Accepted: 4 May 2023 / Published: 7 May 2023

Abstract

:
With the aim to improve cladding coating quality and prevent cracking, this paper established an extreme high-speed laser cladding thermo-mechanical coupling simulation model to study the evolution of the temperature field and the residual stress distribution. Process parameters that impacted the macroscopic morphology of single-pass coatings were investigated. Numerical calculations and temperature field simulations were performed based on the process parameter data to validate the effects of the temperature gradient and cooling rate on the coating structure and the residual stress distribution. The results showed that a good coating quality could be achieved using a laser power of 2400 W, a cladding speed of 20 m/min, and a powder feeding rate of 20.32 g/min. The coatings’ cross-sectional morphology corresponded well with the temperature distribution predicted by the numerical modeling of the melt pool. The microstructure of the molten coatings was affected by the temperature gradient and the cooling rate, which varied greatly from the bottom to the middle to the top. Maximum residual stress appeared between the bonding region of the coatings and the substrate, and the coatings themselves had significant residual stress in the form of tensile strains, that were mostly distributed in the direction of the laser cladding.

1. Introduction

45 steel shaft parts are extensively utilized in the military, aerospace, power, and shipbuilding sectors due to their ability to load bear and transfer torque while the machinery is in operation. High-speed rotation, extreme friction, and prolonged corrosion make these components fragile and prone to failure [1,2,3]. Therefore, the service life of components can be effectively increased by the use of laser cladding technology to provide wear- and corrosion-resistant coatings on the surface of the components [4,5]. There is a great potential for extreme high-speed laser cladding technology to displace hard chromium plating and green manufacturing due to its high cladding efficiency, high powder utilization rate, small heat-affected zone, low dilution rate, and pollution-free manufacturing process [6,7,8]. Powder particles are melted above the melt pool by optimizing the coupling of process parameters, causing the substrate and cladding materials to combine and solidify in the molten state, resulting in a metallurgical bond coating, and thereby preparing high-performance coatings in a cost-effective and time-efficient manner [9,10]. However, due to the late start of extreme high-speed laser cladding technology, the research are still in the exploration stage of process parameters, improving coating performance, and promoting technology, and it relies primarily on experimental experience and the trial-and-error method to optimize the process parameters and thereby improve the coating quality [11].
Progress has been achieved in the study of the numerical simulation and technology of extreme high-speed laser cladding by researchers both at home and abroad. Experimental comparisons of the microstructure performance of conventional laser cladding and extreme high-speed laser cladding conducted by Li et al. [12], revealed that the latter had finer and more uniform coating microstructures. Comparative experiments conducted by Wang et al. [13] on conventional laser cladding and extreme high-speed laser cladding of iron-based amorphous coatings revealed that the latter had a superior performance due to their fine microstructure and hardness of more than 1300 HV in terms of wear and corrosion resistance. Preparing an extreme high-speed laser-clad M2 alloy coating, Zheng et al. [14] investigated the influence of the process parameters on the creation of the cladded layer, and characterized the coating in terms of its shape, microhardness, and wear resistance. The impact of the powder particle size and the bonding rate on coating quality was investigated by Lou et al. [15], who looked at the morphology of the coating’s microstructures when applied using low-power, ultra-high-speed laser cladding. To better understand why laser cladding speeds affect mechanical properties, Ding et al. [16] compared the microstructure of Inconel 625 coatings produced using extreme high-speed laser cladding and conventional laser cladding. They found that increasing the laser’s melting speed and converting coarse columnar crystals into fine dendrites improved the coatings’ hardness, wear resistance, and corrosion resistance. Li et al. [17,18] established a combined heat source model based on the finite element method, studied the temperature distribution of the extreme high-speed laser-cladding AISI 4140 melt pool, and used this model to investigate the impact of laser power and cladding speed on the resulting temperature field and stress field. In conclusion, there has been a great deal of study on the process optimization and coating quality assessment of extreme high-speed laser cladding, but only a smattering of studies on the temperature development law and residual stress of coating under such conditions.
Numerical simulation studies of extreme high-speed laser cladding can accurately predict the temperature change and residual stress distribution during the cladding process, which is essential as it is difficult to measure the melt pool temperature and residual stress in real time [19]. By combining the numerical simulations with the experiments, the relationship between the melt pool temperature and the tissue properties of the clad coating can be effectively established, thereby laying the foundation for process parameter optimization and subsequent multi-pass cladding laps.
In this work, experiments on the extreme high-speed laser cladding of chrome-iron alloy were conducted, and the impact of various process factors on the extreme high-speed laser single-pass coating was analyzed. A numerical model of the thermal coupling of the ultra-high-speed laser cladding was established based on the chosen process parameters. The relationship between the melt pool temperature gradient, cooling rate, and coating structure during the extreme high-speed laser cladding process was analyzed, and the residual stress distribution of the cladding coatings was predicted.

2. Materials and Methods

In this experiment, the 45 steel shaft with a diameter of 40 mm was employed as the base material, and the 431 stainless steel powder with a particle size of 50–150 μm was used as the cladding material. The chemical compositions of the cladding powder and the substrate material are listed in Table 1.
Extreme high-speed laser cladding experiments were performed utilizing the entire suite of machinery from the China Machinery Institute of Advanced Materials Co., Ltd. (Zhengzhou, China). The laser beam spot diameter was 1 mm, and the highest power was 3300 W, with the powder being fed in a coaxial fashion. The extreme high-speed laser cladding’s single-channel forming size was primarily considered by analyzing the effects of laser power, cladding speed, and powder feeding speed using the single-factor experiment method, which took into account previous process experiments [14,20], theoretical research, and industrial application practice. Parameters used in the experiment are listed in Table 2. When performing numerical calculations, the set of parameters with the optimum surface state, width, and height dimensions were selected for the calculations.
In order to observe the microstructure of the coatings and measure the width and height of the coatings, a 5 × 5 × 10 mm3 square specimen was cut out of the surface of a 45 steel shaft part using the wire-cutting method, and the surface was cleaned of stains using alcohol, inlaid, ground, and polished. The width and height of the molten layer were observed and measured using an optical display, and when measuring the height and width of the coating, each value was measured three times and then averaged. A schematic diagram of the coating width and height measurement is shown in Figure 1. W is the coating width, and H is the coating height. When the coating’s surface has the phenomenon of sticky powder, the powder particles were then excluded when measuring the coating’s width and height dimensions. When conducting the observation of the coating’s microstructure, a corrosion treatment was carried out using a 10% FeCl3 hydrochloric acid solution and a 4% HNO3 alcohol solution for 10 s each. After the corrosion treatment was completed, the microstructure was observed using either scanning electron microscopy or optical microscopy.

3. Finite Element Simulation

3.1. The Control Equation and Boundary Conditions

Extreme high-speed laser cladding is a rapid-heating and rapid-cooling technique that involves intricate heat and mass transport processes. As heat conduction occurs mostly inside a material, and because material properties vary greatly with temperature, the heat transfer process is subsequently very nonlinear, and its control equation is [21,22]:
ρ c T t = λ ( 2 T 2 x + 2 T 2 y + 2 T 2 z ) + Q
where ρ is the material density; c is the material’s specific heat; T is the temperature; t is the heat transfer time; λ is the material’s thermal conductivity; and Q is the internal heat source, including phase change latent heat and the heat source load’s heat generation, where ρ, c, and λ are all functions of temperature.
In the laser cladding process, thermal radiation and thermal convection are the main heat transfer boundary conditions, and the boundary condition equation is as follows [23]:
λ n T + h ( T s T 0 ) + σ ε ( T s 4 T 0 4 ) = A Q ( x , y , t )
where λ is the material thermal conductivity; T is the temperature; T0 is the initial ambient temperature; h is the convection heat transfer coefficient; Ts is the material surface temperature; σ is the Stefan–Boltzmann constant; ε is the material surface radiation coefficient; and A is the material surface absorption coefficient for laser energy.

3.2. Heat Source Model

Laser cladding involves melting material above the substrate with a high-energy laser beam, and then applying some of that energy to the substrate to create a metallurgical bond layer. The accuracy of the findings obtained from the numerical simulations is heavily influenced by the energy distribution. Since the laser energy distribution features in the cladding process include both a high-order Gaussian distribution and a variable-density distribution, a combined heat source model was employed for modeling. The powder material was subjected mostly to the high-order Gaussian energy distribution, whereas the substrate material was subjected primarily to the variable-density heat source model [18,24]. Energy was distributed according to a high-order Gaussian, as seen below:
q ( x , y ) = η ξ 1 P π r 2 e x p { 3 ( ( x 2 + y 2 ) R 2 ) n } z > 0
where P is the laser power; η is the utilization efficiency of the laser energy; ξ1 is the proportion of energy allocated to the high-order Gaussian heat source, which is 0.8; r is the distance from the center of the laser beam; R is the radius of the laser beam; and n is the order of the heat source.
A variable-density heat source was used to simulate the heating of the substrate, and the energy distribution is as follows:
q ( x , y , z ) = η ξ 2 P π r 2 e x p { 3 ( x 2 + y 2 ) ( R · exp ( a 1 · z ) ) 2 } h z 0
where P is the laser power; η is the utilization rate of laser energy; ξ2 is the energy ratio allocated to the variable-density heat source, taken as 0.2; R is the distance from the center of the laser beam; r is the radius of the laser beam; a1 is an empirical parameter, taken as 1.6; and h0 is the depth of laser heating on the substrate.

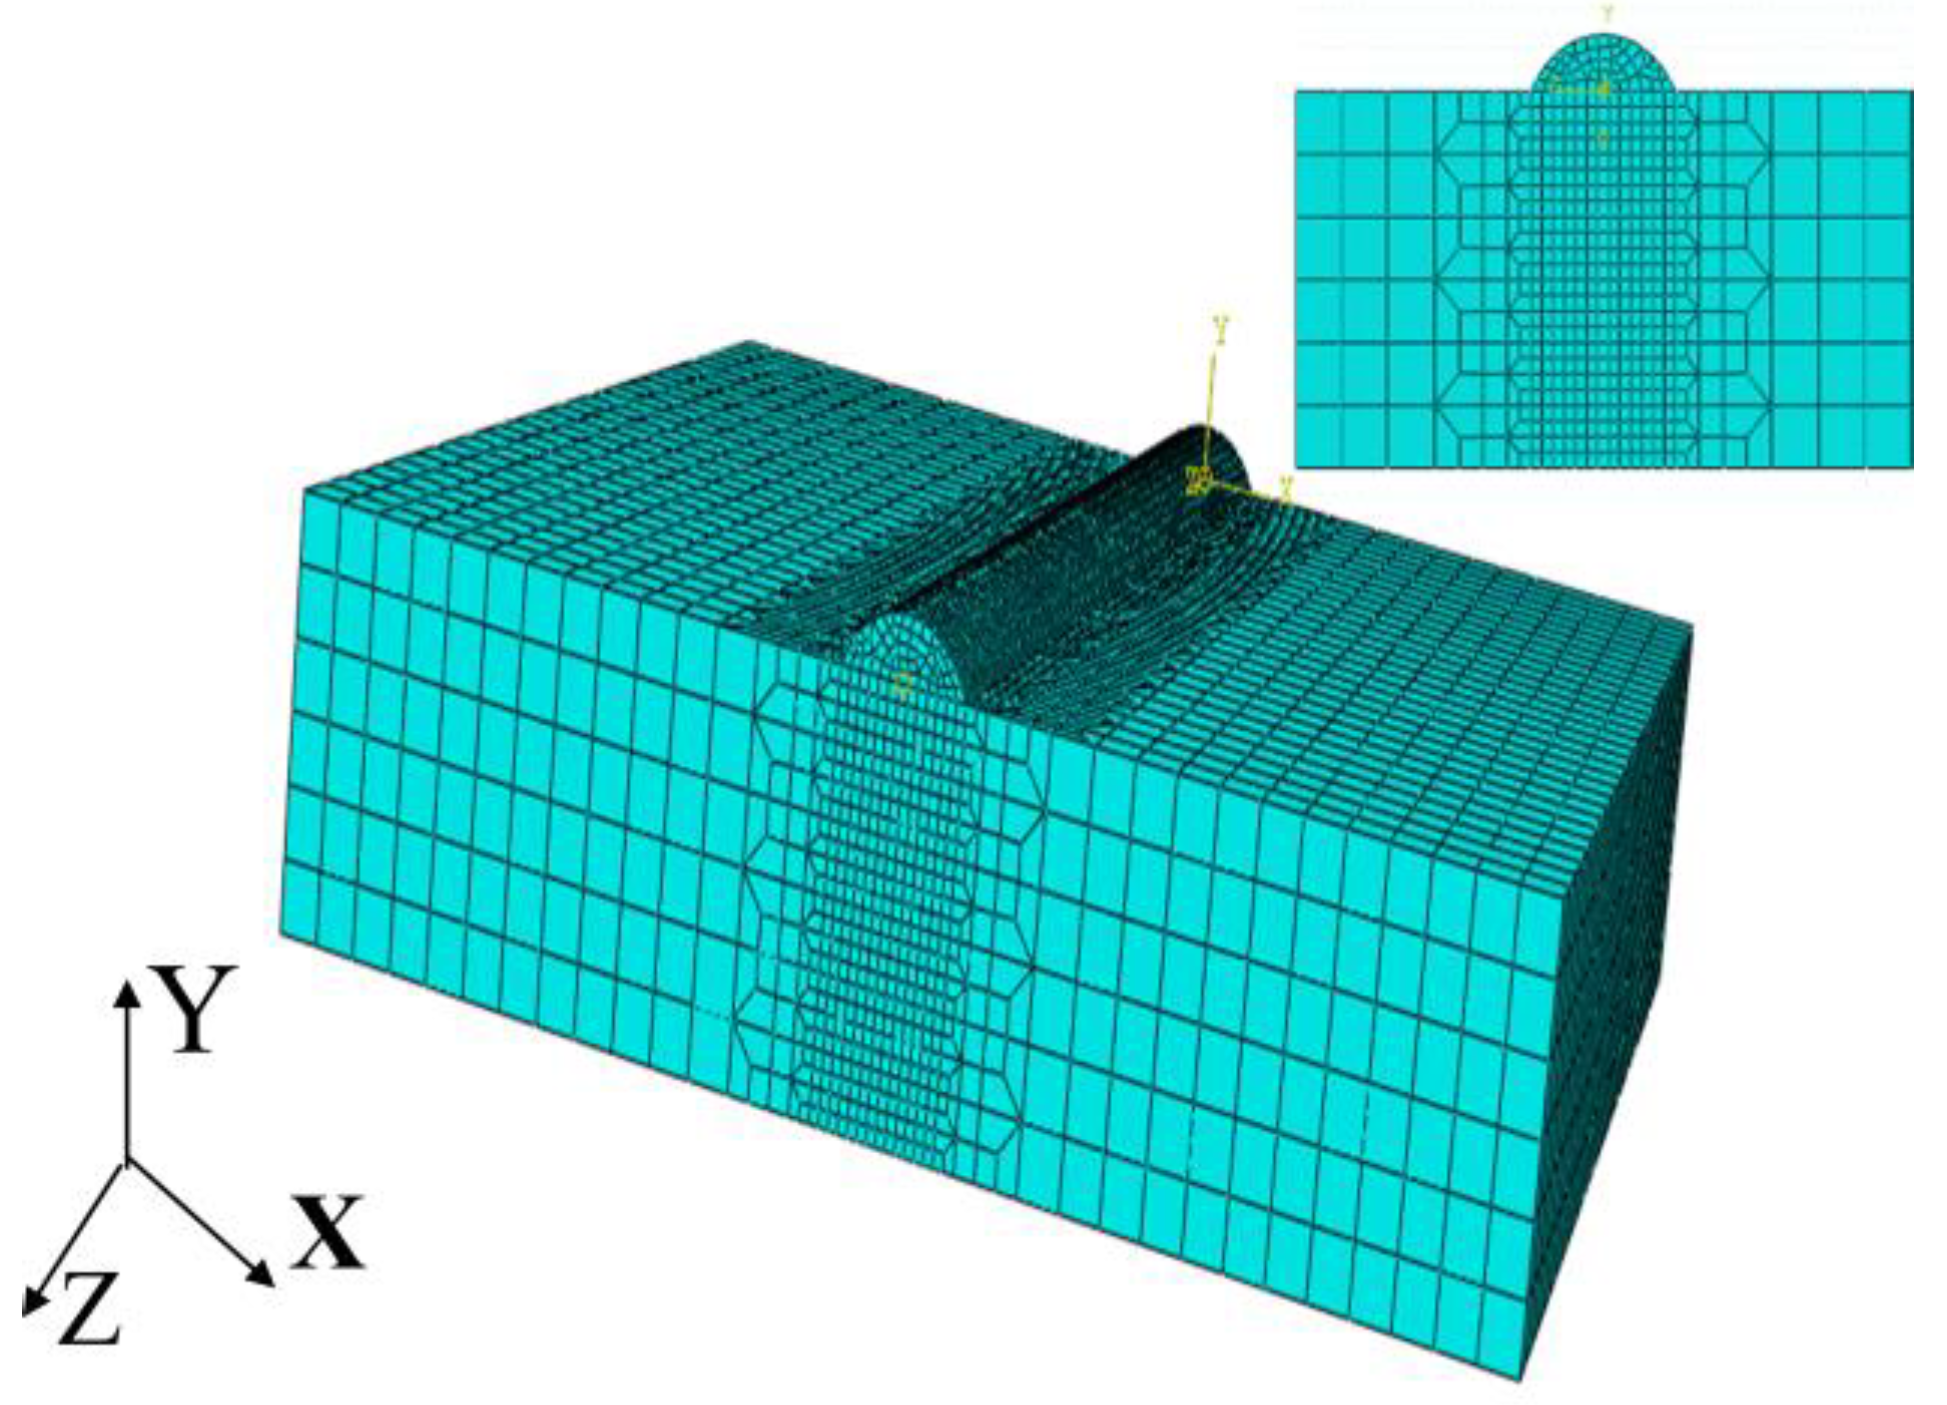
3.3. Finite Element Model

Abaqus software was used to create a geometric model based on the actual procedure of the 431 stainless steel coating on the surface of 45 steel shaft parts; the finite element model and mesh division are displayed in Figure 2; the substrate was sized at 10 mm × 10 mm × 3 mm, and the coatings had height and width parameters of 0.2 mm and 1 mm, respectively. The mesh was fine-tuned close to the coating layer, with a minimum mesh size of 0.05 mm, and coarsened further from the coating layer, with a maximum mesh size of 0.3 mm, to improve the computation accuracy and efficiency. Grids were numbered as 59,760, and the nodes added up to 252,367 in total. The DC3D8 hexahedral linear heat transfer cell was used for the temperature field computations, whereas the C3D8R hexahedral linear stress cell was used for the stress field calculations. Living and dead element technology was used in the model, and the coatings were already set in place. Coaxial powder feeding characteristics were more accurately simulated by progressively adding the coating to the heating calculation model as the heat source was shifted. To accomplish the goal of simultaneous material addition and heat source loading, the Fortran language was used to create a subroutine for the heat source, and “Model Change” was used to put the subroutine into action.
The thermal coupling calculations for extreme high-speed laser cladding were performed using a sequential coupling method to increase the efficiency and guarantee convergence. When the temperature field calculation was completed, the mesh division used in the temperature field calculation was not changed; instead, the model was transformed into a stress analysis and stress calculation mesh cell, and the obtained results were incorporated into the calculation as predefined loads. When the temperature cooled down to room temperature, the stress field results were considered as residual stresses at the time.

3.4. Material Parameter Model

The process of extreme high-speed laser cladding involves rapid melting, rapid cooling, and solidification of the material. Physical parameters such as material density, specific heat capacity, Young’s modulus, coefficient of expansion, and yield strength vary considerably at different temperatures; therefore, temperature-dependent material parameter models were required to improve the accuracy of the thermo-mechanical coupling numerical simulation results. Calculations and interpolation using the JmatPro 6.0 calculation program, based on the material composition shown in Table 1, can provide the high-temperature physical properties of the material. Table 3 and Table 4 display the obtained data. The thermal and mechanical material parameters from Table 3 and Table 4 were defined in the Abaqus 2016 finite element software, and the material parameters were called upon when conducting thermal calculations for the temperature and stress solutions.

4. Results and Discussion

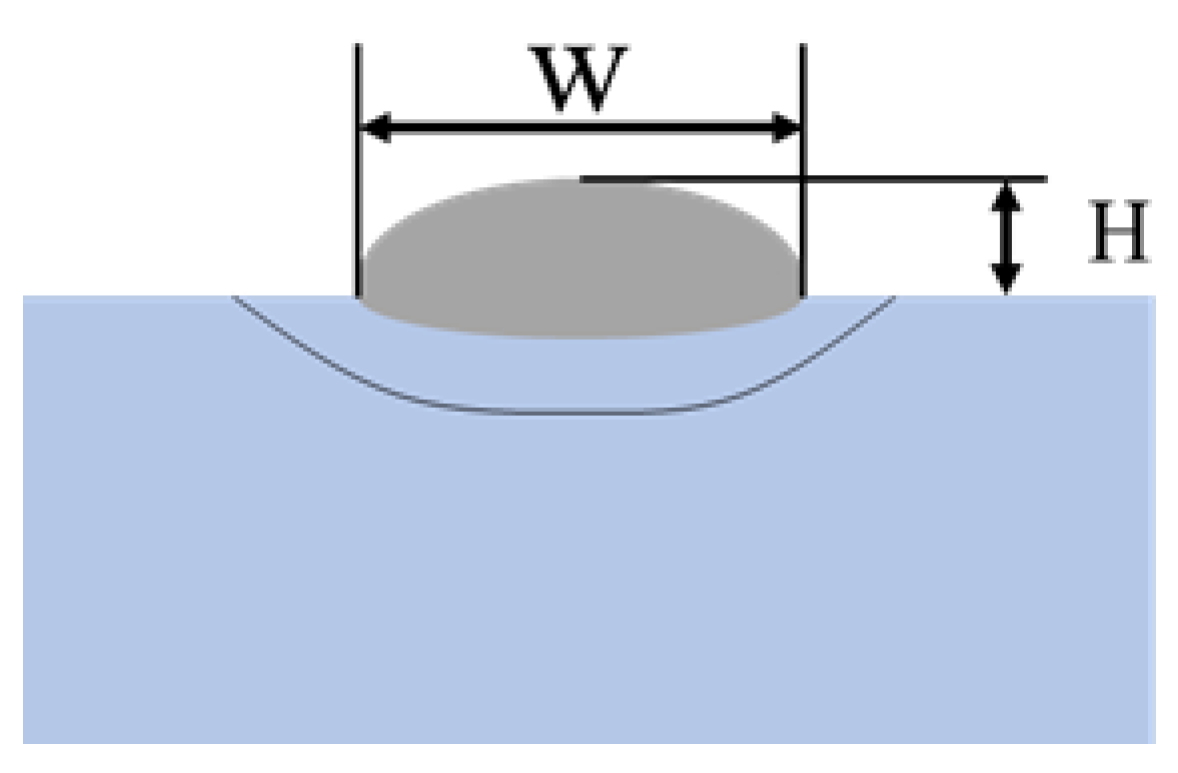
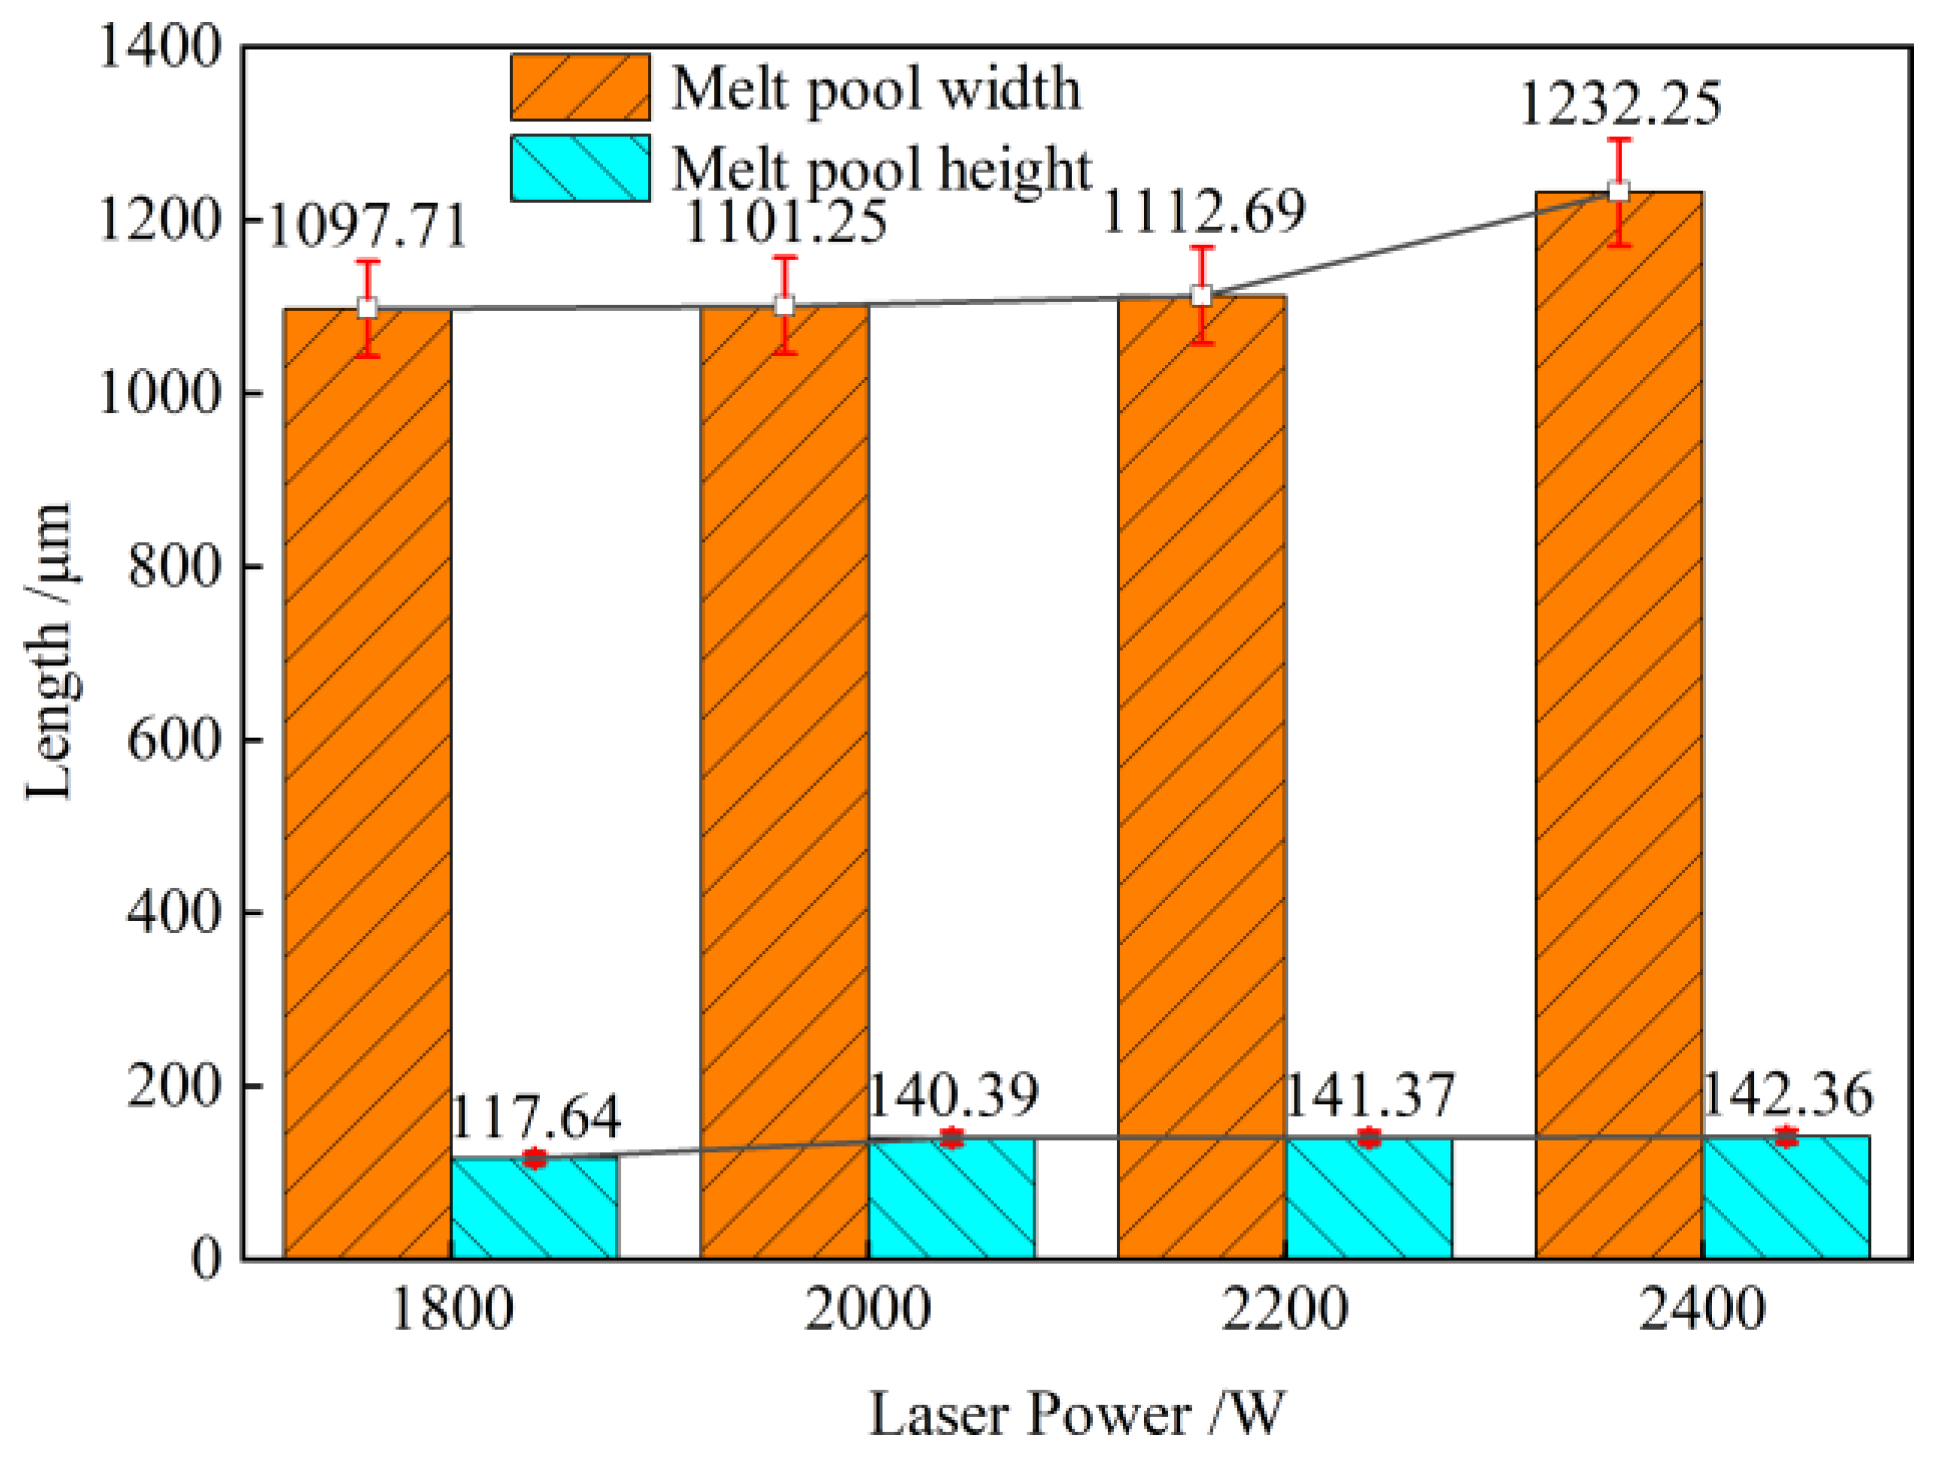
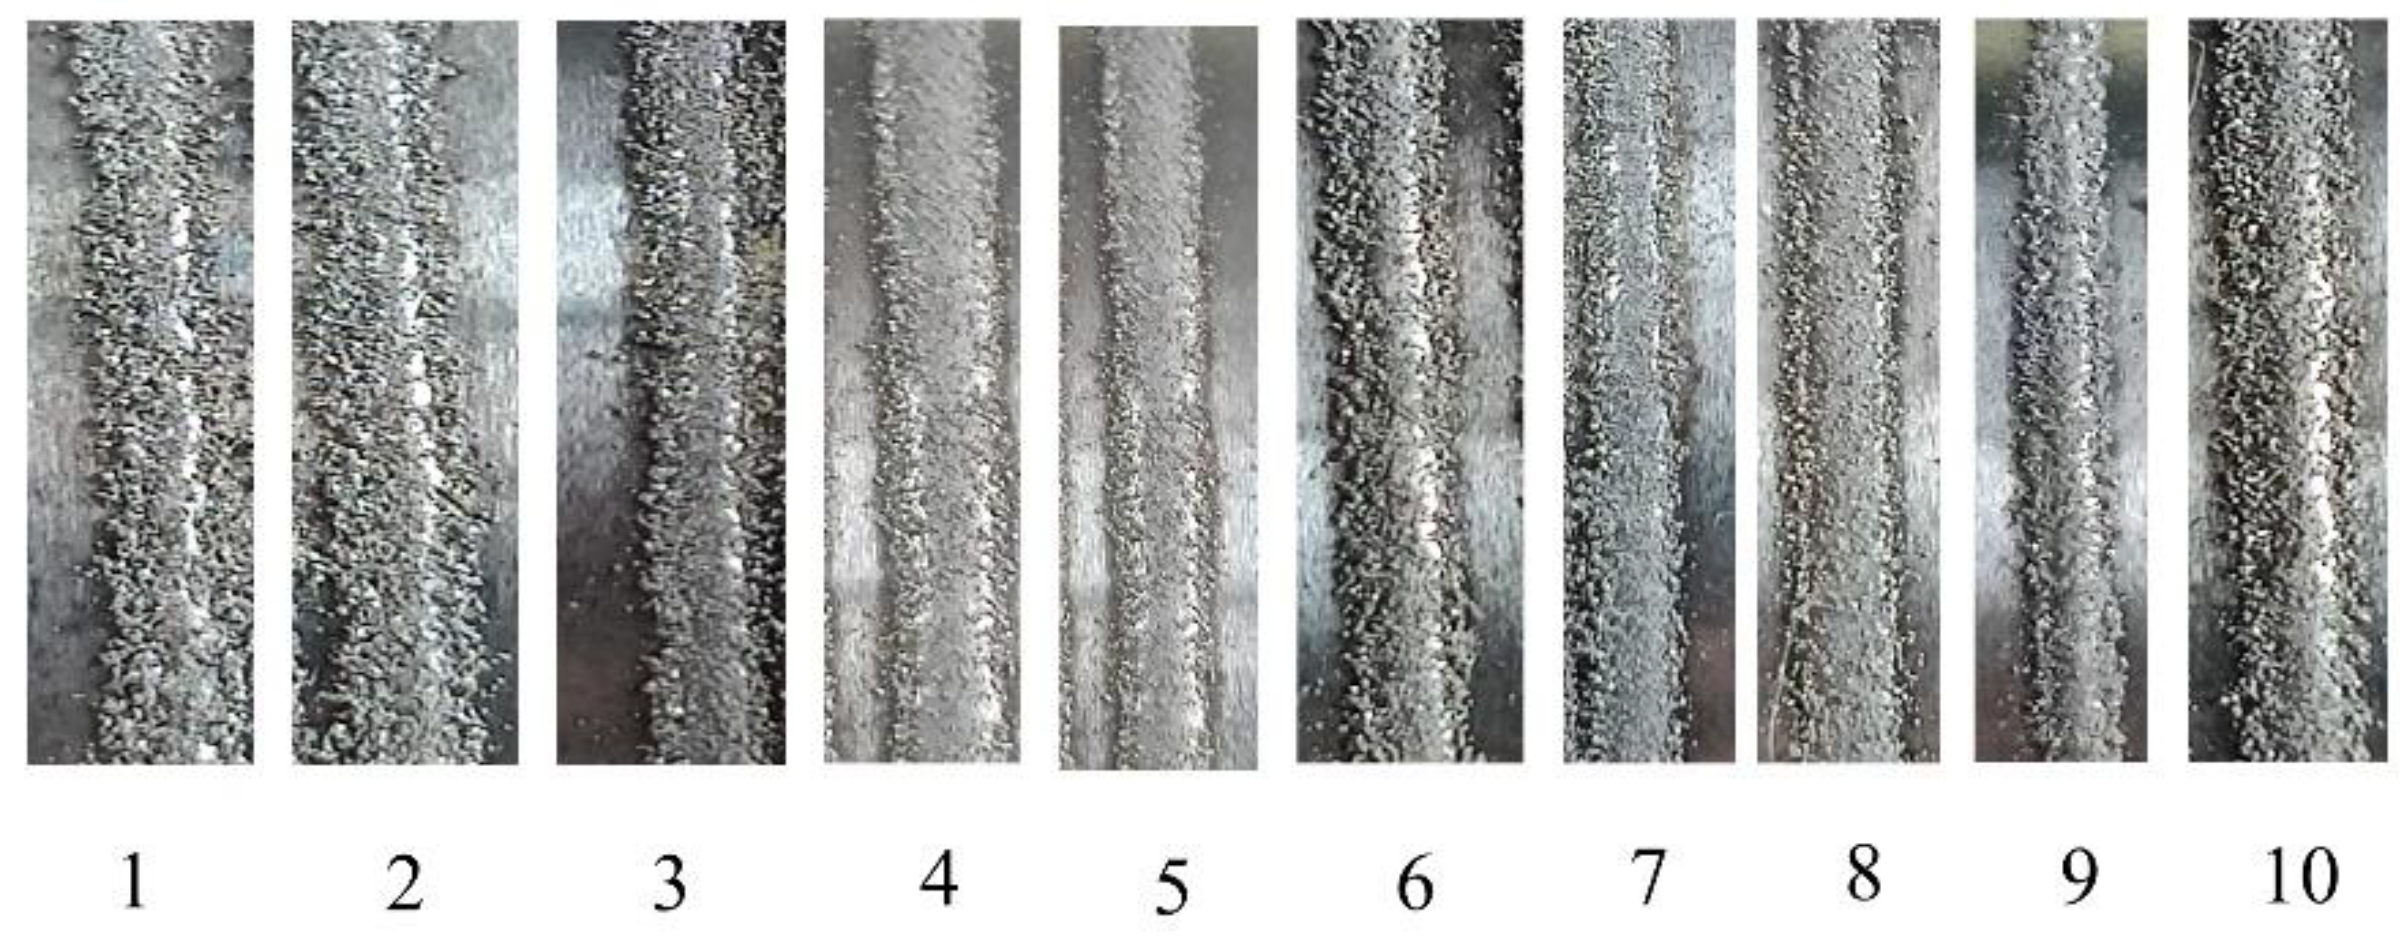
4.1. The Influence of the Process Parameters on the Macro-Shape of the Coating Layer

Figure 3 shows how the laser power from 1800 to 2400 W affected the coating section size at a 20 m/min laser cladding speed and 20.32 g/min powder feeding. Figure 3 indicates that laser power increased the coating section width and height. The laser power increased from 1800 to 2400 W, making the coating 12.3% wider and 21.0% higher. Even when the powder feeding rate and laser cladding speed remained unchanged, the melt pool became wider and higher as the laser power increased, the laser energy density rose, and more materials were melted. The coatings’ width was affected more by the laser power than the coating height as the melt pool lasts longer, has more laser energy, and flows more in the width direction [25].
The coating’s single-channel cross-sectional size, and melting rate were investigated in the research shown in Figure 4; the powder feeding rate was held unchanged at 20.32 g/min, and the laser power was set at 2400 W. Figure 4 shows that when the laser cladding speed was raised from 15 to 30 m/min, both the width and height of the coating dropped. The reduction in width was 33.4%, and the fall in height was 30.8%, respectively. Powder particles and substrates spent less time under the laser’s irradiation when the laser cladding speed was increased, resulting in less energy being absorbed per unit time of the material, less material being melted, and the molten pool becoming unstable, thereby resulting in a reduction in both the breadth and height [26].
As shown in Figure 5, the effect of the powder feed rate on the coating section size was investigated while maintaining a constant laser power of 2400 W, and a laser cladding speed of 20 m/min. Figure 5 demonstrates that the cladding layer grows in both height and breadth when the powder feed rate was increased. When the powder feed rate was raised from 16.54 g/min to 35.79 g/min, the coating grew in width by 22.34%, and in height by 155.03%, respectively. This was due to the higher powder feed rate, more material and laser energy being delivered into the melt pool, and a large increase in coating height and width [27].
Figure 6 shows the unpolished surface state of the melted coating, which must be considered when choosing the process parameters for the laser cladding process in the numerical simulation analysis. Samples 1 to 10 of Figure 6 correspond to experimental serial numbers 1 to 10 in Table 2, respectively. Samples No. 1 and No. 2 had many unmelted powder particles present at the edges of the coatings due to the low laser power, which led to an insufficient melting of the powder particles, and failed to form a stable melt pool; sample No. 3 was able to form a temperature melt pool, but the coatings had a serious sticky powder phenomenon; samples Nos. 4 and No. 5 had a good surface condition; samples Nos. 6, No. 7, and No. 8 were able to form a melt pool; there was a great deal of unmelted powder on the top of Nos. 9 and No. 10. So, sample No. 4’s process parameters were chosen for the numerical simulation study after considering the influence of the laser cladding speed and the laser power on the size of the melting section, and the results of the surface condition analysis.
When comparing the surfaces of samples 1, 2, 3, and 4 in Figure 3 and Figure 6, it was clear that the sticky powder phenomenon on the coating surface progressively reduces and the surface flatness rises when the laser power is increased, with both the width and height of the coating increasing. Figure 4 and Figure 6 demonstrate that when laser cladding rises, the coating width and height decrease, with tiny particles emerging at the coating margins, and surface flatness progressively declining. These results were based on comparing the surfaces of samples 4, 5, 6, and 7. Figure 5 and Figure 6 demonstrate that when the powder feed rate was increased, the width and height of the coating also increased, a high number of unmelted particles formed on the surface of the coating, and the surface flatness was greatly reduced, as shown by comparing the surfaces of samples 4, 8, 9, and 10.

4.2. Temperature Field Numerical Simulation and Verification

The laser cladding time was calculated as 0.03 s, and the other process was cooling. Based on the findings of the process experiment, the parameter of sample No. 4 was chosen as the numerical simulation parameter, with a total calculation time of 600 s. The melt pool’s temperature field distribution at t = 0.015 s was selected for analysis as it provided the most consistent results. Figure 7 depicts the temperature distribution in progress during ultra-high laser cladding. The maximum melting temperature was 2780 °C, with a tiny heat-affected zone forming where the molten layer bonded to the substrate at temperatures close to its melting point. A long molten pool was created due to the high melting rate, with a big temperature gradient in the front half of the pool, and a tiny temperature gradient in the back, giving the pool an oval shape. Figure 8 shows a comparison between the transverse section of an experimental molten layer and the numerical simulation molten pool section. The results show that the size of the numerical simulation molten pool is in good agreement with the actual melting size, that the heat-affected zone is in good agreement with the numerical simulation results, that the dilution rate is low, and that the statistical error was found to be less than 6.42%. Therefore, it could be demonstrated that the outcomes of the numerical simulation of the temperature field are, to a certain extent, correct.

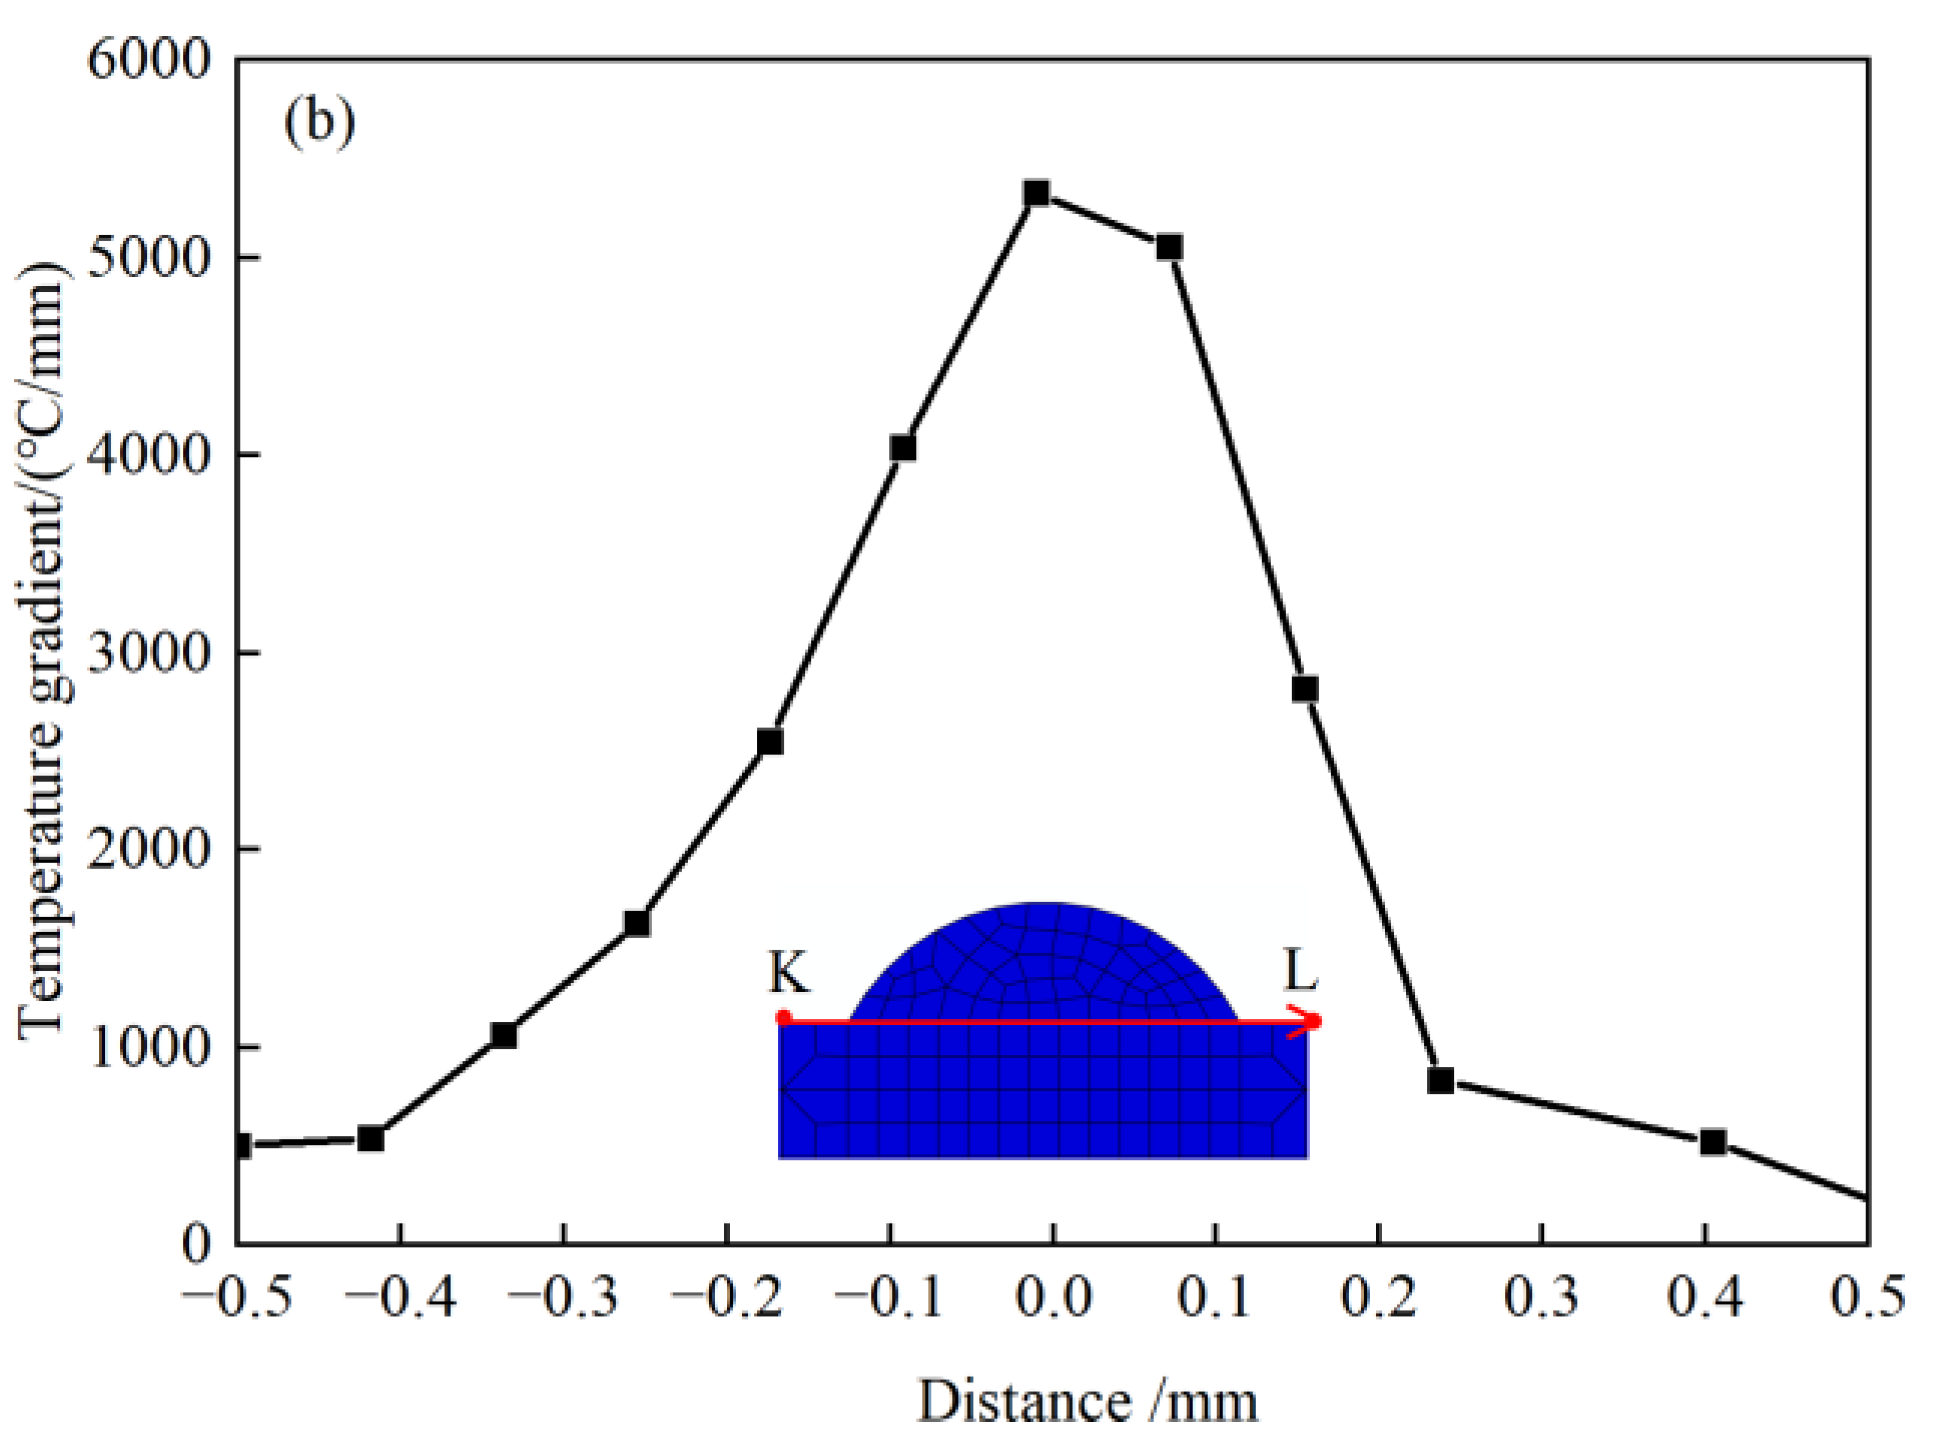
4.3. The Influence of the Cooling Rate and Temperature Gradient on the Coating Structure

To study the melting and solidification heat transfer processes, Figure 9 plots the thermal cycling curve and heating-cooling curve with four points in the direction of the molten pool section depth. From Figure 9, it could be deduced that the maximum cooling rate occurs between points A and B at the top of the molten pool, where the temperature is approximately 2780 °C and the cooling rate is approximately 3.8 × 10⁶ °C/s, respectively; the maximum temperature occurs between the point C at the interface between the substrate and the molten layer, where the temperature is approximately 1753 °C and the cooling rate is approximately 8 × 10⁵ °C/s, respectively. The melt pool temperature tends to decrease from top to bottom, and the cooling rate was found to be higher at the top of the melt pool and lower at the bottom of the melt pool, due to the obvious convective heat exchange arising on the surface of the melt pool and the obvious heat conduction occurring at the bottom [28].
Figure 10 depicts the distribution of the melt pool temperature gradient in different directions. As could be seen from the figure, in the melt pool depth MN path, the temperature gradient first decreases and then increases, with a maximum temperature gradient of 6545 °C/mm and a minimum of 457 °C/mm, respectively; in the melt pool width KL path, the temperature gradient was symmetrically distributed about the center of the melt pool, with a maximum temperature gradient of 5321 °C/mm and a minimum temperature gradient of 500 °C/mm, respectively. This was due to the significant difference observed in the thermal conductivity of the material in the bonding area between the coating and the substrate [29].
During the solidification of a cladding coating, the microstructure’s form and size were directly related to the temperature gradient G and the tissue growth rate R. The shape control factor K = G × R determined the structural morphology of the microstructure, with larger values of K indicating a flat crystal, medium values indicating a cellular crystal, and smaller values indicating a dendrite or equiaxed crystal. The cooling rate V = G/R determines the size of the microstructure, with larger values of V indicating smaller microstructures [30,31].
Table 5 displays the results of the calculation of the shape control factor K and the growth rate, as well as the temperature gradient and the cooling rate at locations A, B, and C at the time of solidification of the melt pool, based on the results of a finite element numerical simulation.
Figure 11 depicts the microstructure of the top, middle, and bottom of a single cross-section of the ultra-high-speed laser cladding coatings. Small, flat crystals formed near the metallurgical bond between the substrate and the coatings at the coating’s bottom, while large, dendritic crystals grew vertically along the bonding surface in a relatively uniform fashion, indicating that the temperature gradient was greatest in this region, making it suitable for crystallization and tissue development. There were smaller dendritic crystals found with a fine slatted structure and a reasonably consistent growth direction observed in the cladding layer’s middle region, parallel to the heat dissipation axis. The coating’s top section displayed both fine dendritic and equiaxed crystals, with the dendrites being noticeably larger than those in the coating’s bottom and middle regions.
During solidification, the single-pass coating’s temperature gradient was highest at the bottom of the melt pool, then in the middle, and finally at the top; the cooling rate increased gradually with increasing depth of the melt pool; the value of the shape control factor was relatively large at the top and bottom of the melt pool and smaller at the middle; and the tissue growth rate was highest at the middle of the melt pool and smaller at the bottom. Figure 11 shows the results of a fifty time scribing experiment that determined the average dendritic spacing to be 1.62 μm, 1.03 μm, and 0.98 μm for the top, middle, and bottom regions of the coating, respectively. The comparison study showed a considerable correlation between the coating structure and the temperature gradient distribution and cooling rate, demonstrating that the accuracy of the numerical simulation results in accurately predicting the coating structure and morphology.

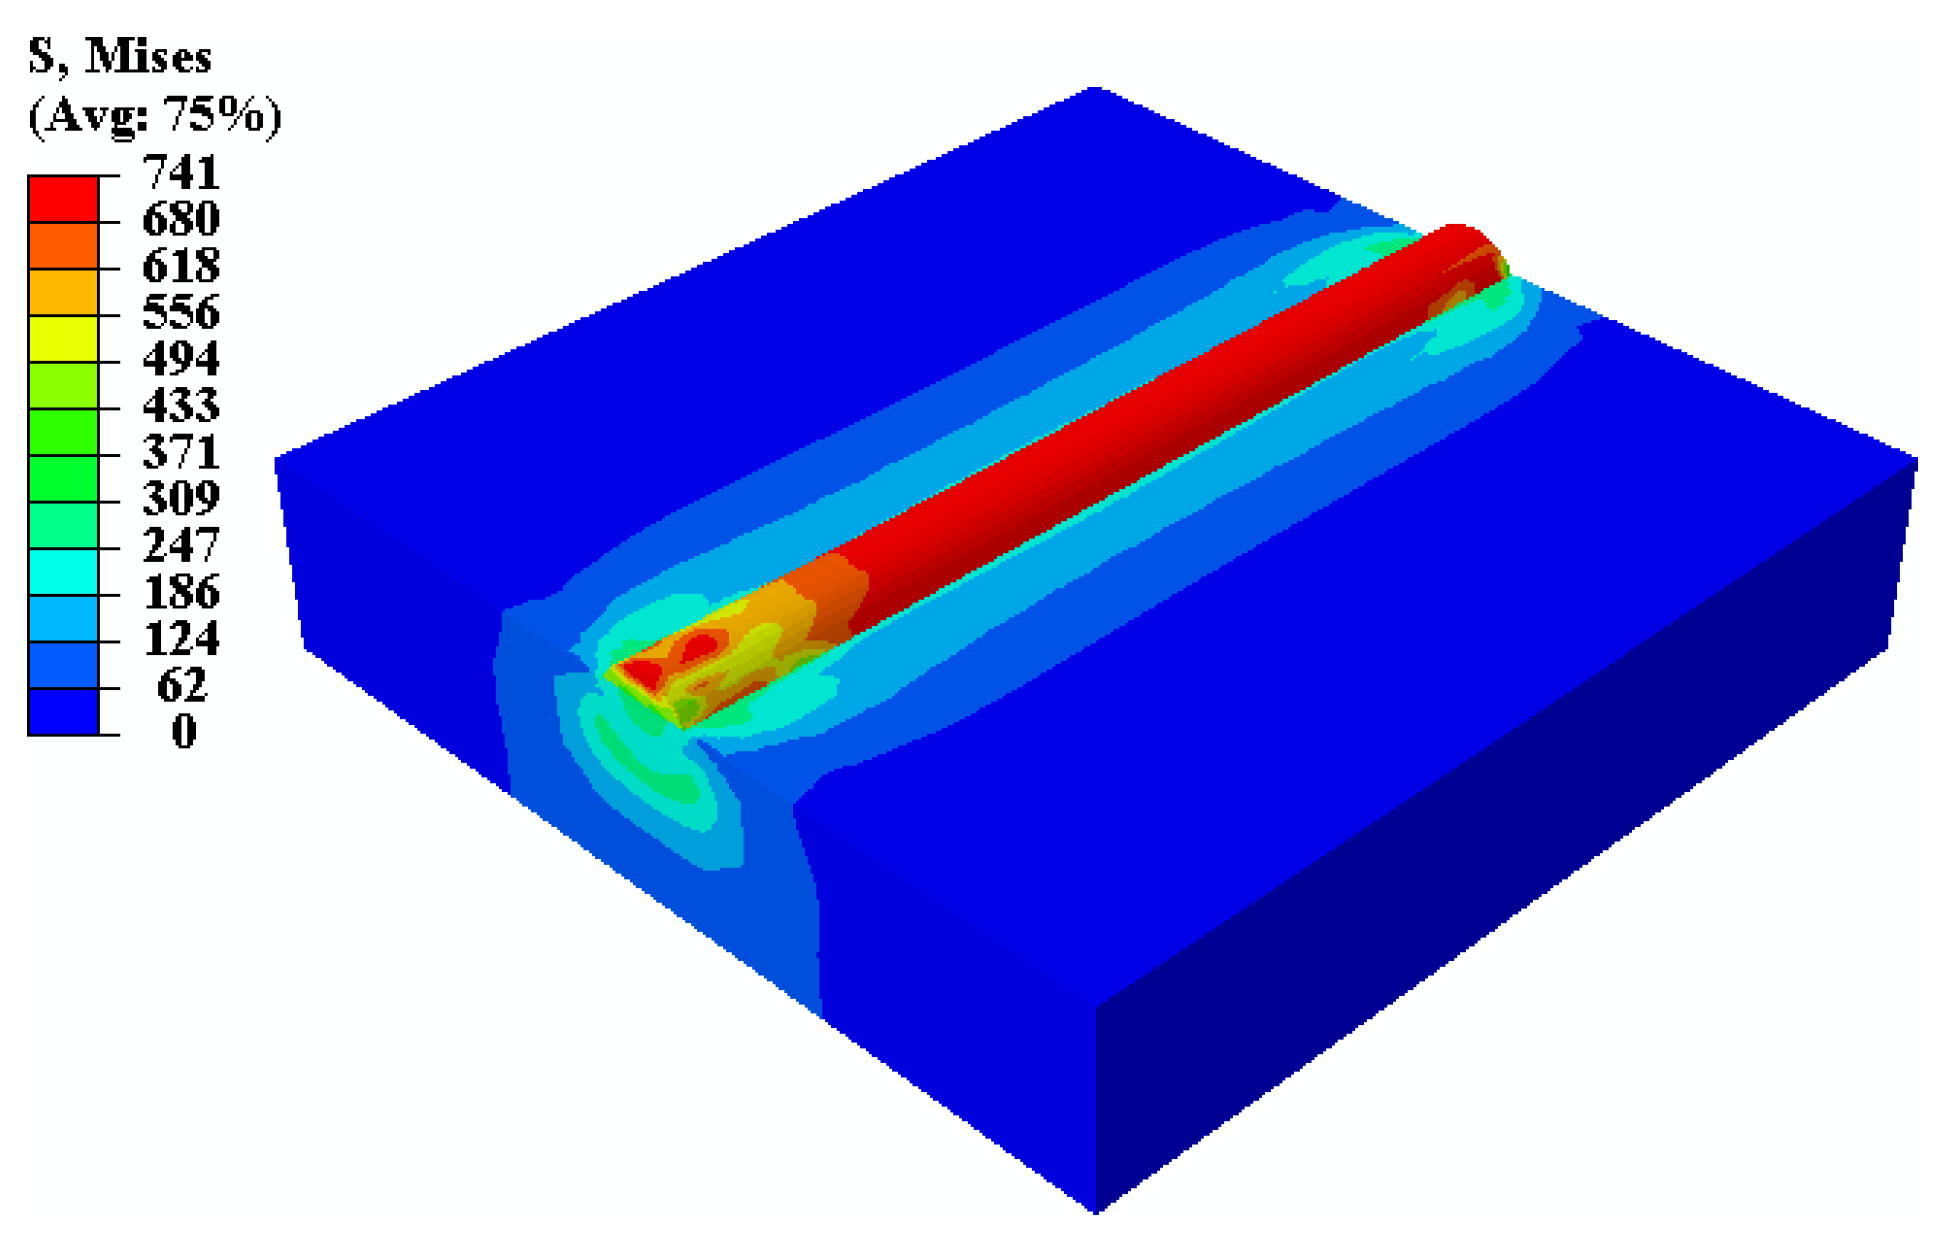
4.4. Stress Field Simulation Analysis and Prediction

The residual stress distribution cloud map in Figure 12 was obtained by first obtaining the results of a numerical simulation of the temperature field, then modifying the type of calculation unit, then loading the model with the results of the numerical simulation of the temperature field, and finally imposing boundary conditions on the stress field. Figure 12 shows that the coating’s residual stress was concentrated in the fusion coating region, with a maximum value of 741 MPa. This value was higher than the matrix’s yield strength at the fusion layer and matrix bonding positions, resulting in plastic deformation of the matrix. Cracking in coatings is significantly affected by residual stress [32,33]. As a result, we chose to examine the coating section pathways KL and MN, as well as the coating surface path GH.
Figure 13a depicts the residual stress curve along the KL-coated section route. Stress values on the coating were relatively large, with the tensile stress reaching a maximum of 406 MPa in the z-direction, and the residual stress in the x-direction and y-direction changing from tensile stress to compressive stress along the KL path (as seen in Figure 13a). The stress in the melted layer region was relatively large, and the stress away from the melted layer was relatively small due to the extremely short action time of the laser in the melted layer region and the high cooling rate, which caused a relatively high temperature gradient at the symmetrical center of the melted layer and the material shrinkage phenomenon. A substantial residual stress was present in the coating bonding zone because of the substantial thermal expansion coefficient difference between the melted material and the substrate, as well as the uneven shrinkage [34].
The residual stress curve on the MN coating section route is shown in Figure 13b. Figure 13b shows that the cladding layer had a high residual stress throughout, with the highest residual stress of 741 MPa occurring at the interface between the cladding layer and the substrate. Maximum x-direction stress occurred at the cladding layer’s top, whereas y-direction stress was often less intense, and z-direction stress was greatest at the cladding layer’s contact with the substrate. The coating’s temperature differential was greatest at the cladding/substrate contact, and a substantial tensile tension was created when the melt pool rapidly cooled and solidified.
The coating’s surface route GH is shown as a residual stress curve (Figure 13c). Figure 13c shows that the melt pool flowed steadily throughout the cladding process, showing that the residual stress can be managed. This was shown by the fact that the stress and primary stress of the cladding surface fluctuated within a given range. In conjunction with Figure 12a, it could be seen that the surface residual stress was similar to that at the substrate/substrate interface (210 MPa), indicating no tendency of cracking in the coatings; however, the large residual stress in the z direction will lead to an increase in the tendency of coating cracking.
Comparing Figure 8, Figure 12 and Figure 13, it is clear that the temperature gradient and residual stresses are greatest in the bonded area of the coating; there is a large temperature gradient on the coating surface; and the temperature gradient and residual stress curves of the coating and the bonded area follow the same trend. Consequently, the temperature gradient is the primary cause of residual stresses, which could be mitigated by decreasing the temperature gradient.

5. Conclusions

(1)
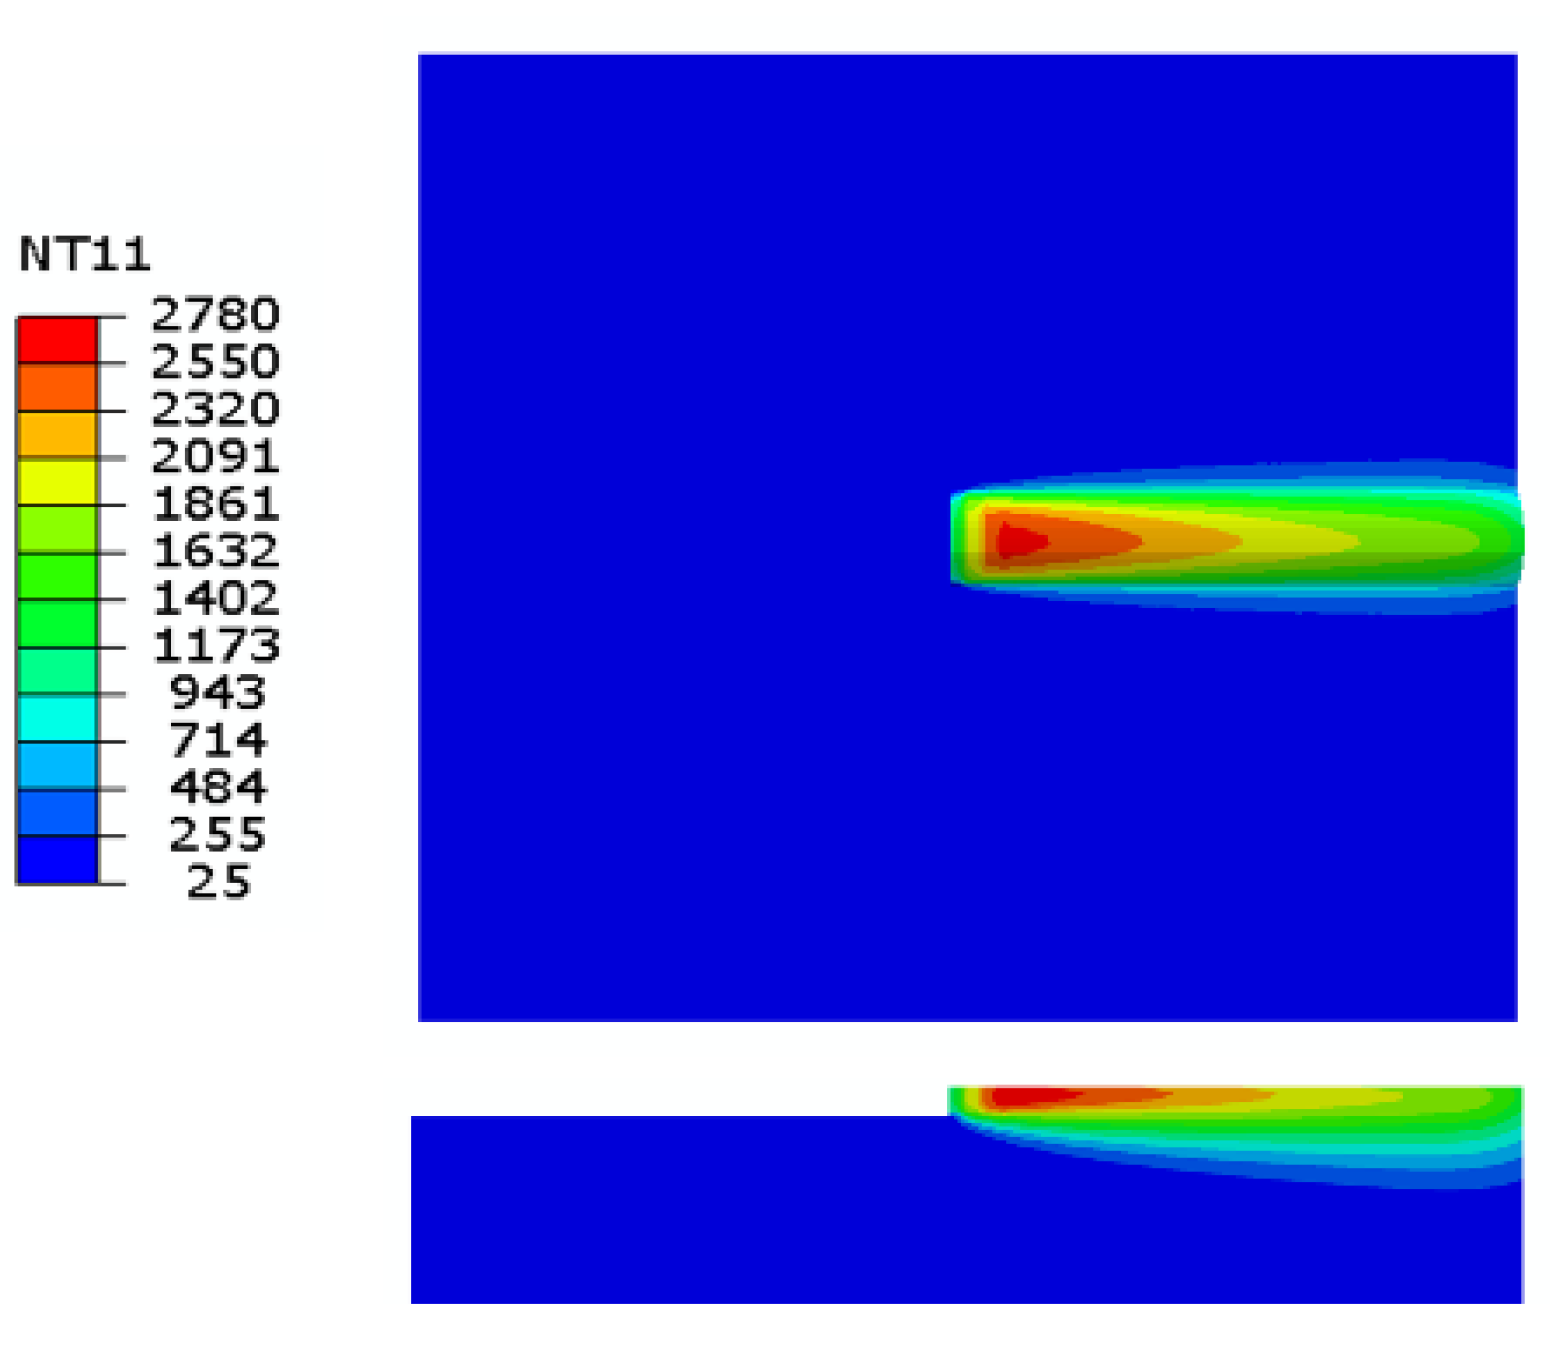
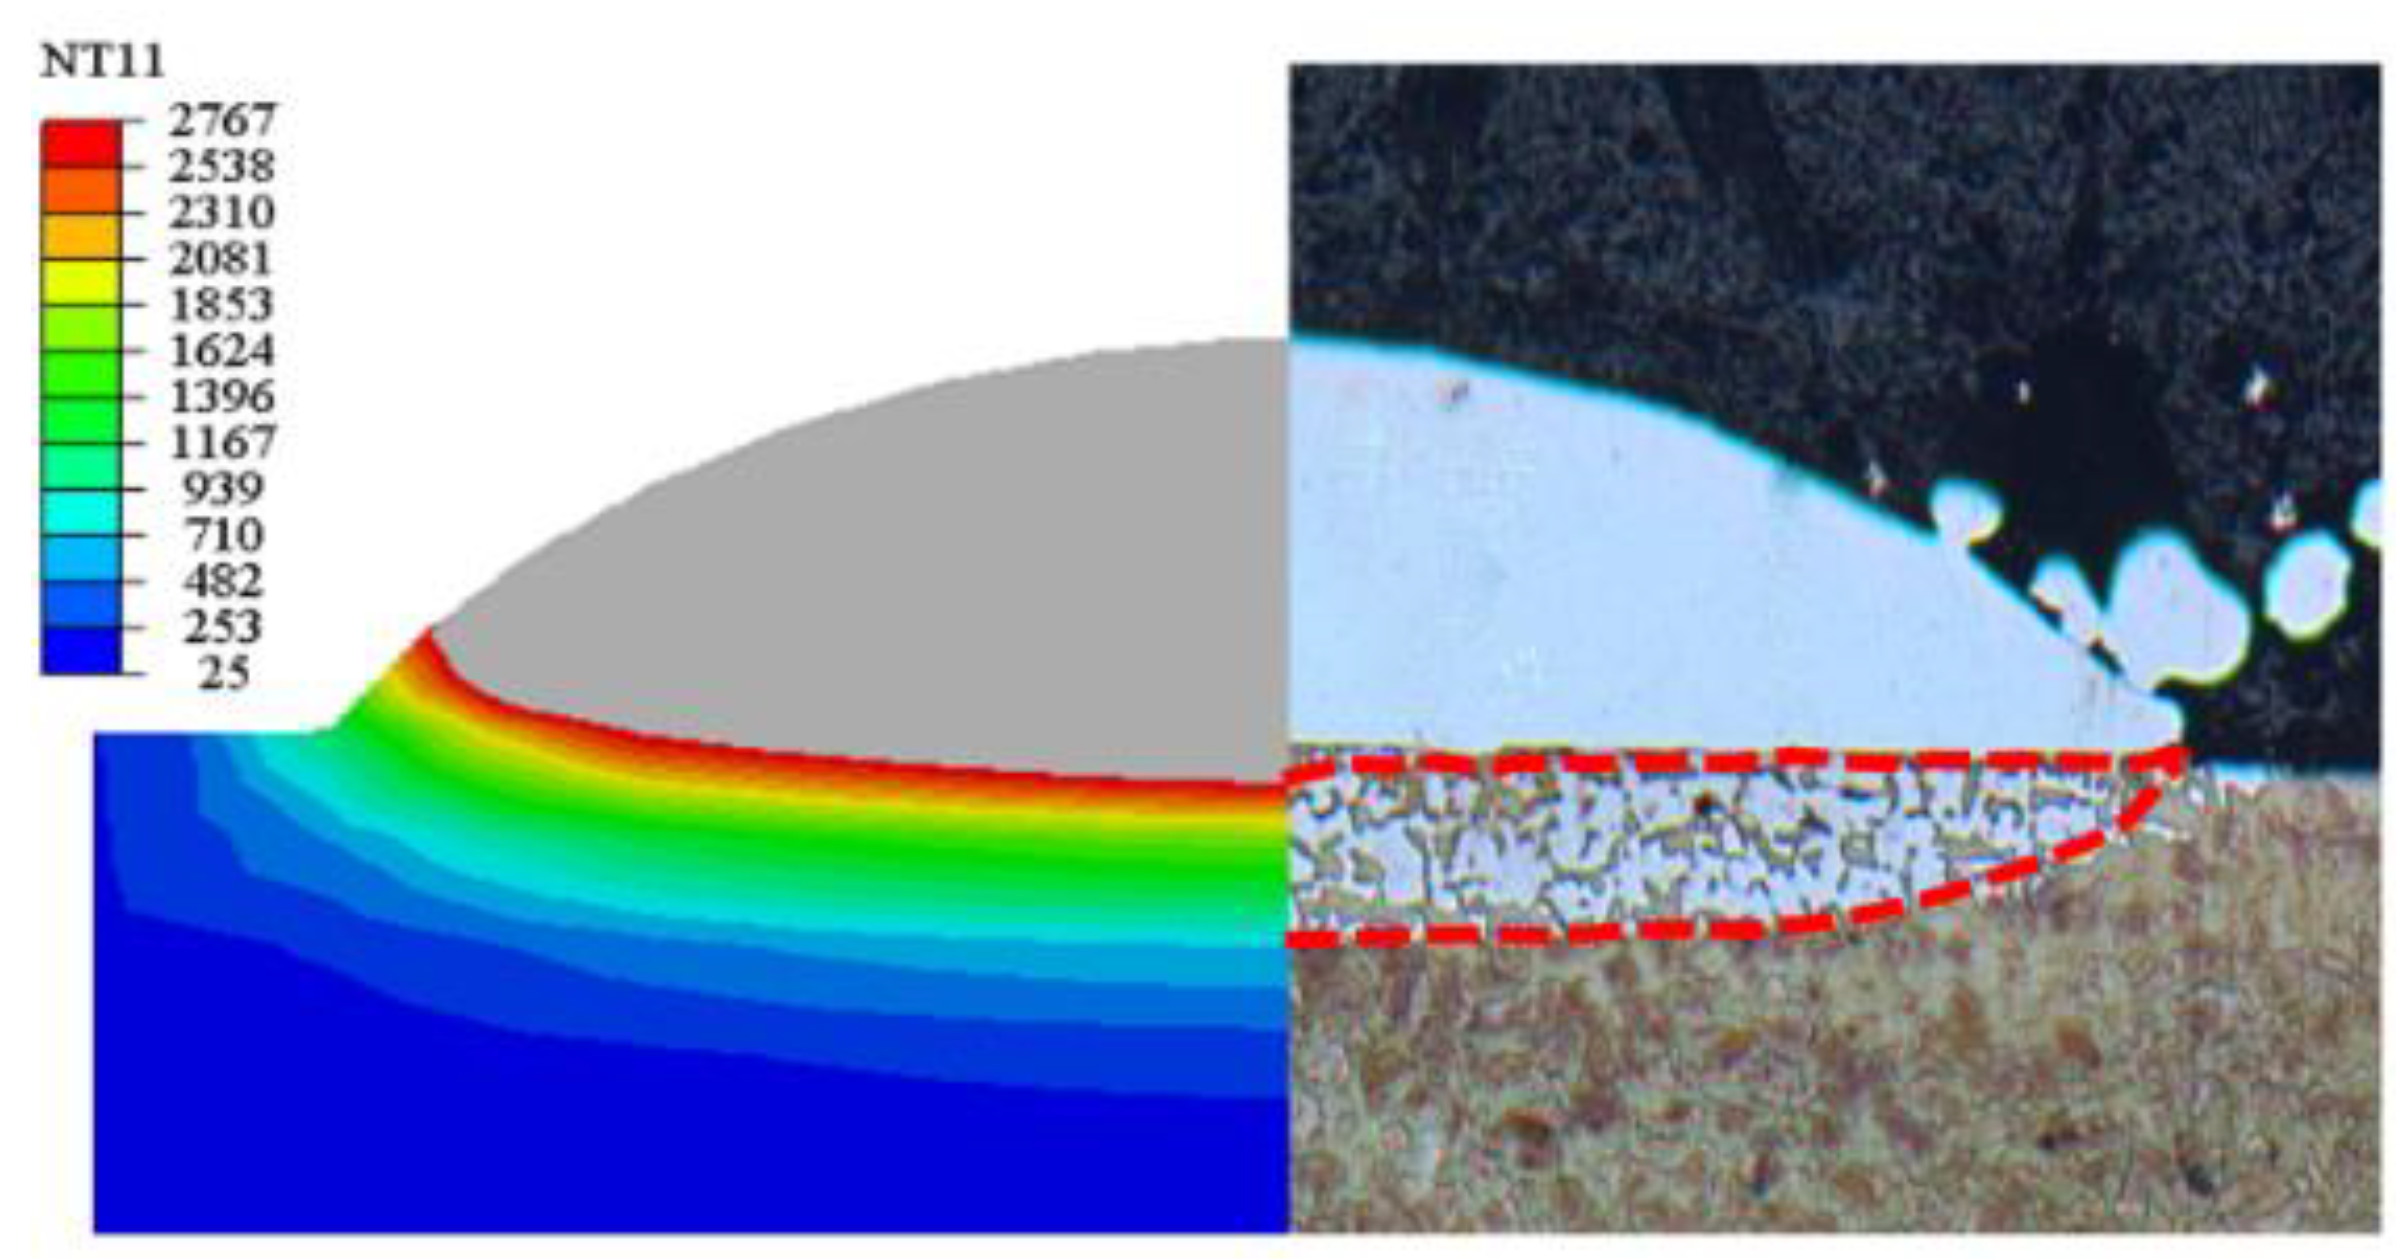
Abaqus finite element software was used to create a numerical model for extreme high-speed laser cladding based on a composite heat source and the live-dead cell approach. An analysis of the effects of the laser power and the cladding speed on the cladding section size and surface morphology was performed after a 431 stainless steel coating was clad onto a 45 steel shaft. A laser power of 2400 W, a cladding speed of 20 m/min, and a powder feeding rate of 20.32 g/min were chosen as the ideal process parameters for numerical simulation computation. The maximum temperature of the melt pool was calculated to be 2780 °C using this parameter and was found by a temperature field calculation. The numerical model was shown to be accurate, as the predicted size and heat effect zone of the melt pool were in good agreement with the experimental data.
(2)
The influence of different process parameters on the melt pool size was also analyzed. The laser power and the powder feed rate were found to be positively correlated to the melt pool’s width and height, while the laser cladding rate was found to be negatively correlated to the melt pool’s width and height.
(3)
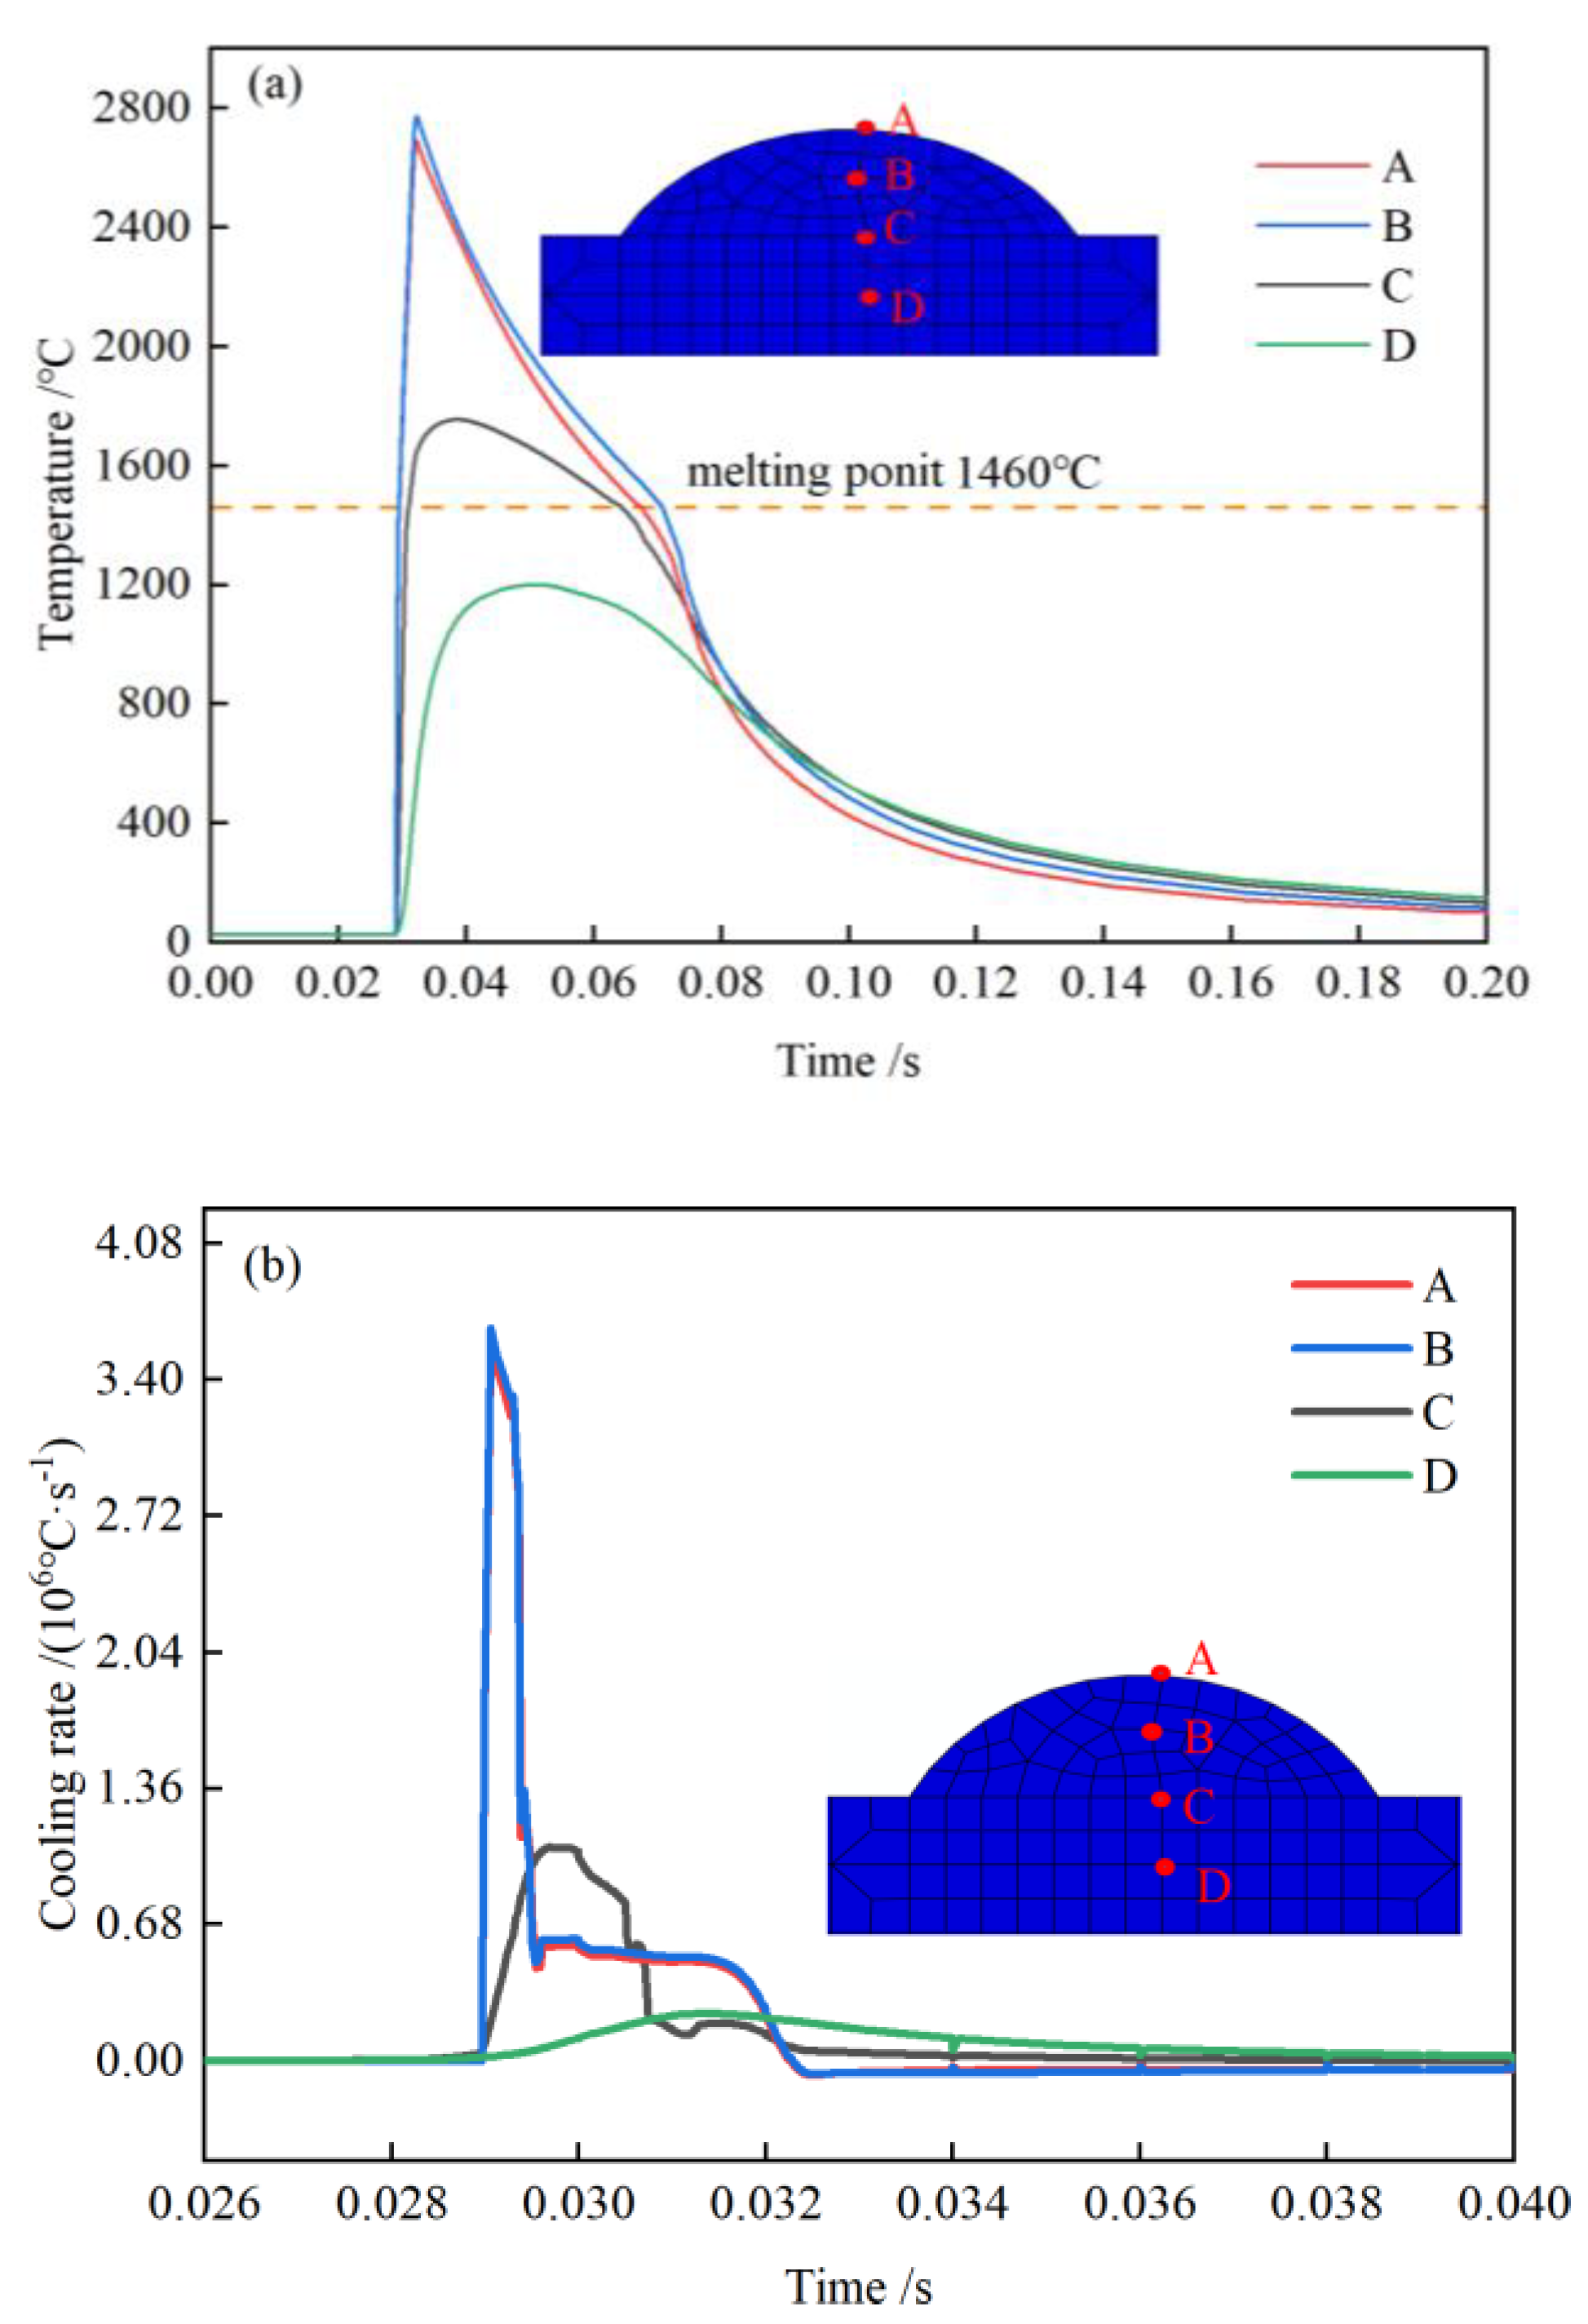
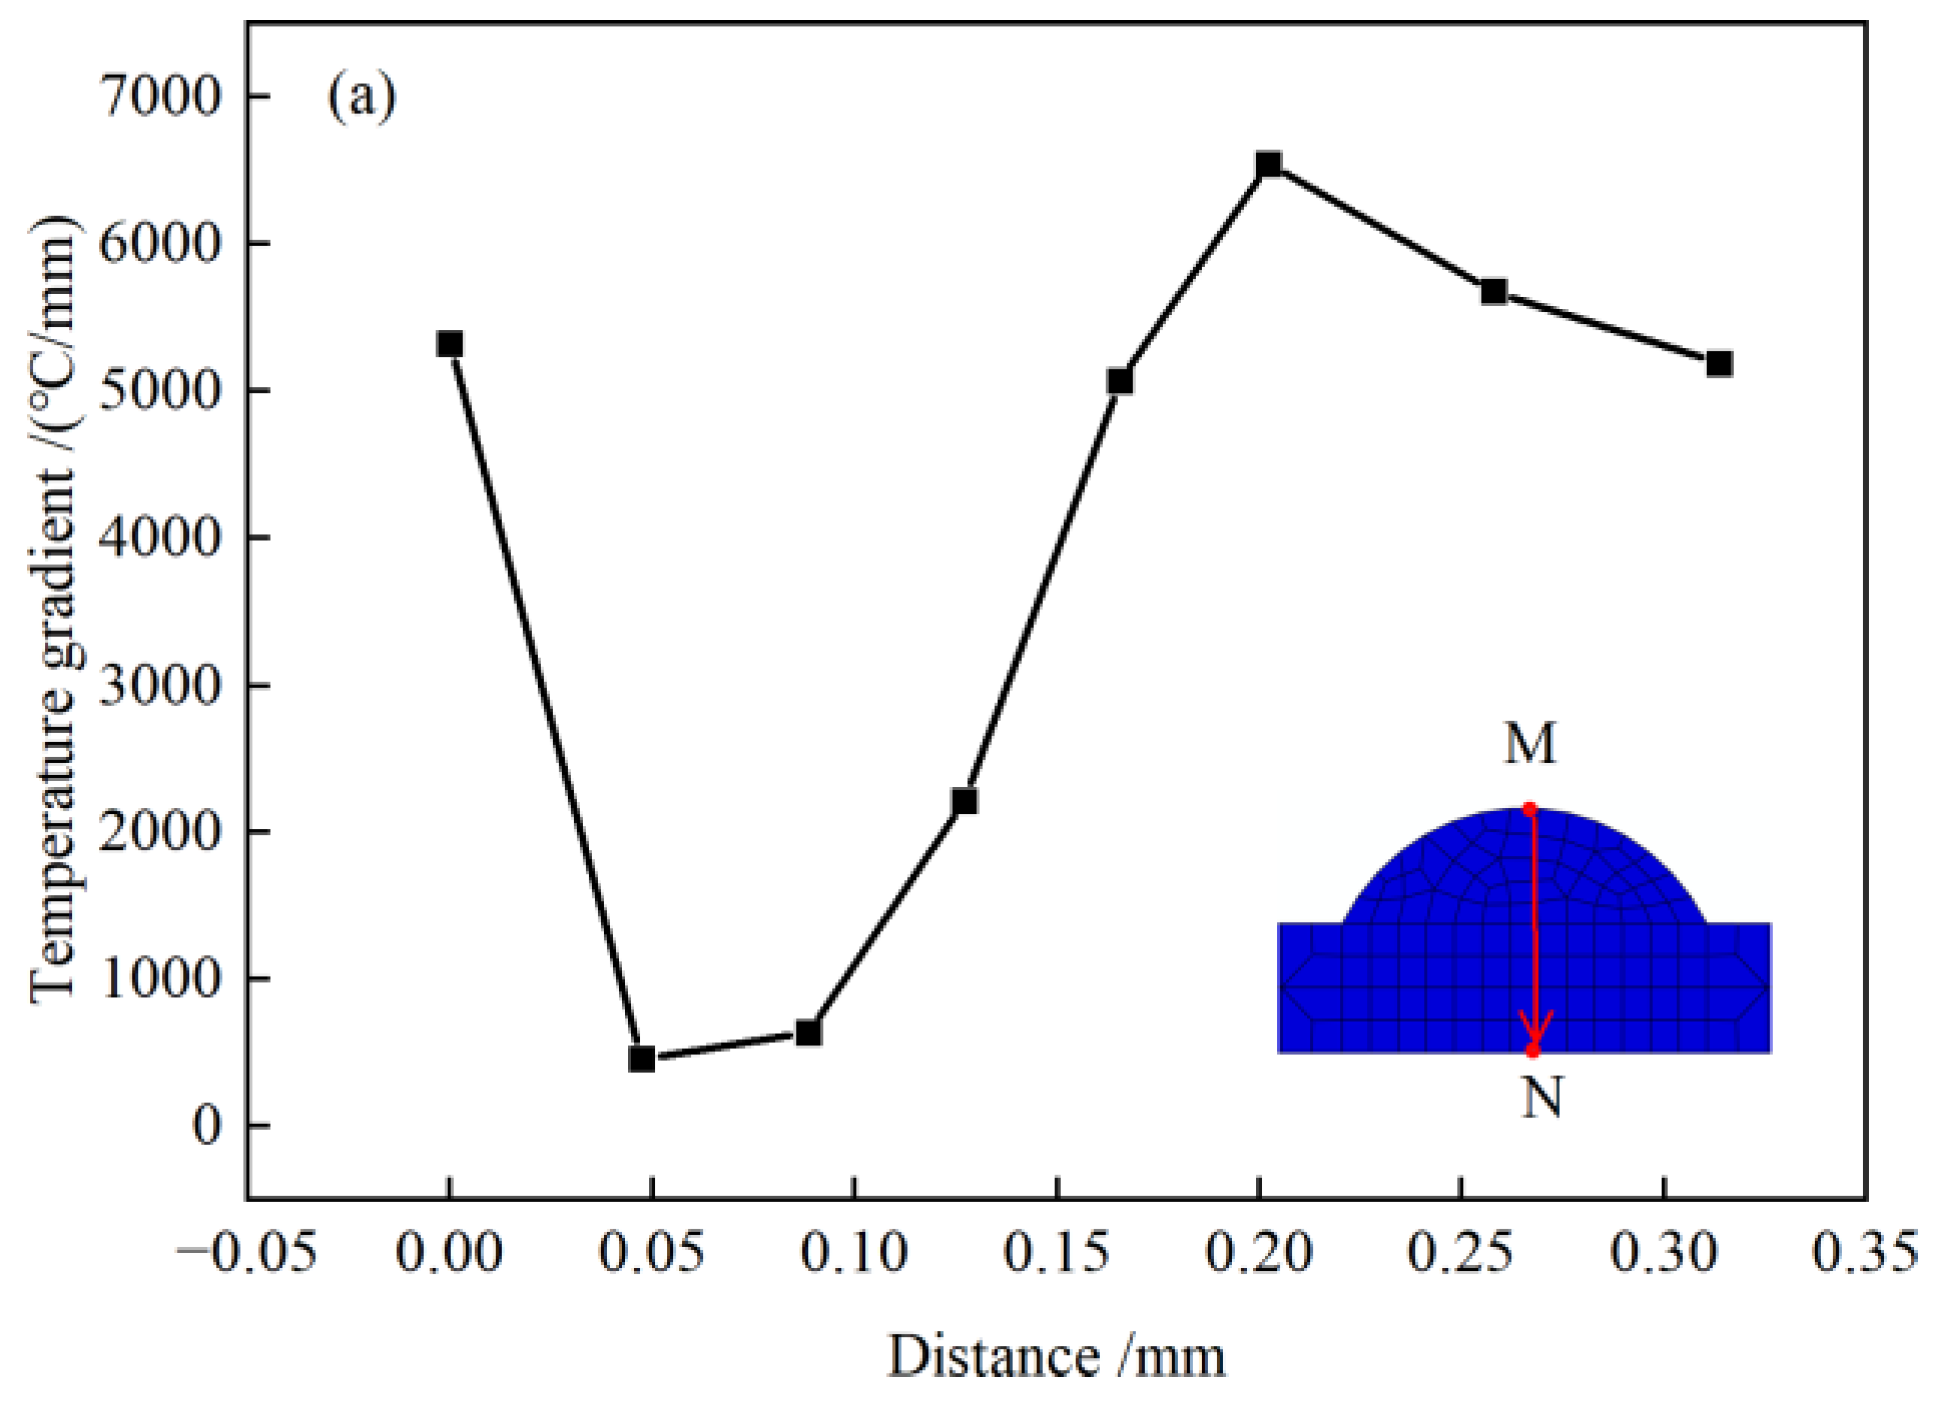
To examine the cladding section’s microstructure, a numerical simulation of the temperature gradient and the cooling rate was performed. The microstructure of the clad layer varied depending on its location: at the top, the cooling rate was highest, the temperature gradient was largest, and the clad layer’s dendrite crystals were chaotic and fine; in the middle, the cooling rate was highest, the temperature gradient was smaller, and the clad layer’s dendrite crystals were coarse and long.
(4)
Cladding layer residual stress curve analysis was also performed. There was a lot of tension at the coating–substrate interface, more tension on the clad layer’s surface than in its interior, and a lot of tension in the coating itself. The clad layer’s residual stress was found to have mostly originated in the laser’s scanning direction.

Author Contributions

Conceptualization, L.N. and M.W.; methodology, L.N., M.W. and X.W.; software, X.W. and L.N.; validation, L.N. and Y.X.; investigation, L.N. and Y.X.; resources, M.W.; data curation, L.N. and X.G.; writing—original draft preparation, L.N.; writing—review and editing, X.W., Y.X. and X.G.; supervision, M.W.; project administration, M.W.; funding acquisition, M.W. All authors have read and agreed to the published version of the manuscript.

Funding

The authors acknowledge funding support from the National Natural Science Foundation of China, under Grant No. 51975240.

Institutional Review Board Statement

Not applicable.

Informed Consent Statement

Not applicable.

Data Availability Statement

All data are available from the corresponding author upon reasonable request.

Conflicts of Interest

The authors declare no conflict of interest.

References

  1. Cao, W.; Li, Y.; Wang, Z. Study on Microstructure and Properties of Wear-resistant Coating on 45Steel Surface by Laser Cladding. Appl. Laser 2022, 42, 41–47. [Google Scholar]
  2. Findik, F. Structural materials, fire and protection. Herit. Sustain. Dev. 2022, 4, 134–144. [Google Scholar] [CrossRef]
  3. Chen, J.; Li, X.; Xue, Y. Friction and Wear Properties of Laser Cladding Fe901 Alloy Coating on 45 Steel Surface. Chin. J. Lasers 2019, 46, 0502001. [Google Scholar] [CrossRef]
  4. Findik, F. Laser cladding and applications. Sustain. Eng. Innov. 2023, 5, 1–14. [Google Scholar] [CrossRef]
  5. Imamović, A.; Žuna, Š.; Mulaosmanović, E.; Alibašić, Z.; Kosec, B. Comparison of mechanical and microstructure properties of tungsten alloys for special purposes. Sustain. Eng. Innov. 2022, 4, 191–197. [Google Scholar] [CrossRef]
  6. Hu, Z.; Li, Y.; Liu, J.; Cai, L.; Tan, N. Research Progress of Ultra-High-Speed Laser Cladding Coating Forming and Key Properties. Laser Optoelectron. Prog. 2023, 60, 0100003. [Google Scholar] [CrossRef]
  7. Stephan, K.; Holzer, A.; Megahed, S.; Ziegler, S.; Schleifenbaum, J.H.; Schmitz, K. Investigation of the coating of hydrodynamic plain bearing contact surfaces by means of Extreme High-Speed Laser Material Deposition (EHLA). In Proceedings of the 19th Drive Train Technology Conference (ATK 2021), Aachen, Germany, 9–11 March 2021; Volume 1097. [Google Scholar]
  8. Ge, T.; Chen, L.; Gu, P.; Ren, X.; Chen, X. Microstructure and corrosion resistance of TiC/Inconel 625 composite coatings by extreme high speed laser cladding. Opt. Laser Technol. 2022, 150, 107919. [Google Scholar] [CrossRef]
  9. Schaible, J.; Sayk, L.; Schopphoven, T.; Schleifenbaum, J.H.; Häfner, C. Development of a high-speed laser material deposition process for additive manufacturing. J. Laser Appl. 2021, 33, 12021. [Google Scholar] [CrossRef]
  10. Schopphoven, T.; Gasser, A.; Wissenbach, K.; Poprawe, R. Investigations on ultra-high-speed laser material deposition as alternative for hard chrome plating and thermal spraying. J. Laser Appl. 2016, 28, 022501. [Google Scholar] [CrossRef]
  11. Marimuthu, P.; Durakovic, B.; Kunda, S.R. Modelling the effect of feed rate on residual stresses induced due to milling using experimental and numerical methods. Period. Eng. Nat. Sci. (PEN) 2021, 9, 76–81. [Google Scholar] [CrossRef]
  12. Li, L.; Shen, F.; Zhou, Y.; Tao, W.; Wang, W.; Wang, S. Comparison of Microstructure and Corrosion Resistance of 431 Stainless Steel Coatings Prepared by Extreme High-Speed Laser Cladding and Conventional Laser Cladding. Chin. J. Lasers 2019, 46, 1002010. [Google Scholar] [CrossRef]
  13. Wang, H.; Cheng, Y.; Geng, R.; Wang, B.; Chen, Y.; Liang, X. Comparative study on microstructure and properties of Fe-based amorphous coatings prepared by conventional and high-speed laser cladding. J. Alloys Compd. 2023, 952, 169842. [Google Scholar] [CrossRef]
  14. Zheng, H.; Wang, M.; Qiao, P.; Ge, X.; Wang, X. M2 Coatings Formed by Extreme High Speed Laser Cladding. China Surf. Eng. 2022, 35, 191–202. [Google Scholar] [CrossRef]
  15. Lou, L.; Zhang, Y.; Li, C.X.; Li, C.J.; Tian, H.; Tantai, F. Microstructure and surface morphology evolution of FeCr alloy thin coatings deposited by ultra-high speed laser cladding with low laser power. J. Yanshan Univ. 2020, 44, 116–124. [Google Scholar] [CrossRef]
  16. Ding, Y.; Bi, W.; Zhong, C.; Wu, T.; Gui, W. A Comparative Study on Microstructure and Properties of Ultra-High-Speed Laser Cladding and Traditional Laser Cladding of Inconel625 Coatings. Materials 2022, 15, 6400. [Google Scholar] [CrossRef]
  17. Li, T.; Zhang, L.; Chen, G.; Schopphoven, T.; Gasser, A.; Poprawe, R. Eigenstrain reconstruction of residual stress and its application in extreme high-speed laser material deposition. J. Manuf. Process. 2023, 85, 1054–1065. [Google Scholar] [CrossRef]
  18. Li, T.; Zhang, L.; Chen, G.; Pirch, N.; Schopphoven, T.; Gasser, A.; Poprawe, R. A combined heat source model for the prediction of residual stress post extreme high-speed laser material deposition. J. Manuf. Process. 2022, 78, 265–277. [Google Scholar] [CrossRef]
  19. Li, R.; Jin, Y.; Li, Z.; Zhu, Y.; Wu, M. Effect of the remelting scanning speed on the amorphous forming ability of Ni-based alloy using laser cladding plus a laser remelting process. Surf. Coat. Technol. 2014, 259, 725–731. [Google Scholar] [CrossRef]
  20. Shen, F.; Tao, W.; Li, L.; Zhou, Y.; Wang, W.; Wang, S. Effect of microstructure on the corrosion resistance of coatings by extreme high speed laser cladding. Appl. Surf. Sci. 2020, 517, 146085. [Google Scholar] [CrossRef]
  21. Guo, W.; Jian, H.; Chai, R. Numerical Simulation and Verification of Laser Cladding on 27SiMn Steel Surface. Hot Work. Technol. 2016, 45, 1–6. [Google Scholar]
  22. Walker, T.; Bennett, C.; Lee, T.; Clare, A. A validated analytical-numerical modelling strategy to predict residual stresses in single-track laser deposited IN718. Int. J. Mech. Sci. 2018, 151, 609–621. [Google Scholar] [CrossRef]
  23. Schaible, J.; Hausch, D.; Schopphoven, T.; Häfner, C. Deposition strategies for generating cuboid volumes using extreme high-speed directed energy deposition. J. Laser Appl. 2022, 34, 42034. [Google Scholar] [CrossRef]
  24. Gong, X.; Wang, J.; Feng, H. Lateral powder transport model with Gaussian distribution in laser cladding. Int. J. Adv. Manuf. Technol. 2019, 102, 3747–3756. [Google Scholar] [CrossRef]
  25. Jian, Z.; Jin-chao, Z.; Xiao-ming, P.; Yu, C.; Ai-xin, F. Coupling Rules Between Broadband Beam and Coaxial Powder Flow and Forming Characteristics of Cladding. China Surf. Eng. 2017, 30, 141–149. [Google Scholar]
  26. Lian, G.F.; Yao, M.P.; Chen, C.R. Control of the Quality and Efficiency of Multi-track Overlapping Laser Cladding. Surf. Technol. 2018, 47, 229–239. [Google Scholar]
  27. Li, D.; Zhang, J.; Meng, P.; Yang, L. Forming Characteristics of Ni+20% Cr_3C_2Coating by Laser Cladding. Appl. Laser 2021, 41, 447–453. [Google Scholar]
  28. Lanyun, Q.; Lili, X.; Guang, Y.; Qi, L.; Wei, W. Correlations of Thermal Accumulation and Melt Pool Geometry during Laser Deposition Manufacturing of Titanium Alloy. Rare Met. Mater. Eng. 2017, 46, 2645–2650. [Google Scholar]
  29. Liu, H.; Li, M.; Qin, X.; Huang, S.; Hong, F. Numerical simulation and experimental analysis of wide-beam laser cladding. Int. J. Adv. Manuf. Technol. 2019, 100, 237–249. [Google Scholar] [CrossRef]
  30. DebRoy, T.; Wei, H.L.; Zuback, J.S.; Mukherjee, T.; Elmer, J.W.; Milewski, J.O.; Beese, A.M.; Wilson-Heid, A.D.; De, A.; Zhang, W. Additive manufacturing of metallic components—Process, structure and properties. Prog. Mater. Sci. 2018, 92, 112–224. [Google Scholar] [CrossRef]
  31. Raghavan, A.; Wei, H.L.; Palmer, T.A.; DebRoy, T. Heat transfer and fluid flow in additive manufacturing. J. Laser Appl. 2013, 25, 052006. [Google Scholar] [CrossRef]
  32. Xie, L.Y.; Shi, W.Q.; Wu, T. Numerical Simulation of Temperature Field and Stress Field of Laser Cladding on Curved Substrate Workpiece. Surf. Technol. 2022, 51, 296–303. [Google Scholar]
  33. Zhang, T.; Zhang, Q.; Yao, B.; Li, B. Numerical Simulation of Temperature Field and Stress Field of Ni-Based Laser Cladding Layer on TC4 Surface. Laser Optoelectron. 2021, 58, 220–228. [Google Scholar] [CrossRef]
  34. Zhang, T.; Sun, R. Finite element analysis of crack in laser clad Ni60 coating on TC4 surface. Heat Treat. Met. 2018, 43, 190–194. [Google Scholar]
Figure 1. Schematic diagram for the cross-sectional measurement of single-pass fusion coatings.
Coatings 13 00879 g001
Figure 2. Finite element model and mesh division.
Coatings 13 00879 g002
Figure 3. Influence of laser power on the size of the coatings.
Coatings 13 00879 g003
Figure 4. Influence of cladding speed on the size of the coatings.
Coatings 13 00879 g004
Figure 5. Influence of cladding powder feeding rate on the size of the coatings.
Coatings 13 00879 g005
Figure 6. Surface condition of unpolished single-pass fusion coatings.
Coatings 13 00879 g006
Figure 7. Ultra-high-speed laser cladding temperature field distribution.
Coatings 13 00879 g007
Figure 8. Numerical simulation of the melt pool cross-section compared with experimental coating morphology.
Coatings 13 00879 g008
Figure 9. Temperature law curve of the selected node. (a) Thermal cycle curve in the depth direction of the melt pool; and (b) heat-up-cooling rate curve of nodes.
Coatings 13 00879 g009
Figure 10. Temperature gradient profile of the selected path. (a) Temperature gradient in the depth direction MN of the melt pool; and (b) temperature gradient in the direction KL of the melt pool width.
Coatings 13 00879 g010aCoatings 13 00879 g010b
Figure 11. Microstructures of different locations of the cladding layer. (a) Top; (b) middle; and (c) bottom.
Coatings 13 00879 g011
Figure 12. Residual stress distribution diagram.
Coatings 13 00879 g012
Figure 13. Residual stress on different paths of the coating. (a) Path KL; (b) path MN; and (c) path GH.
Coatings 13 00879 g013
Table 1. Chemical compositions of 431 stainless steel and 45 steel (wt.%).
MaterialsCCrMnNiSiPFe
4310.1917.190.811.360.920.04Bal
450.420.250.720.350.030.03Bal
Table 2. Experimental process parameters.
Experiment No.Laser Power/WCladding Speed/(m/min)Powder Feeding Rate/(g/min)
118002020.32
220002020.32
322002020.32
424002020.32
524001520.32
624002520.32
724003020.32
824002016.54
924002030.36
1024002035.79
Table 3. Thermophysical and mechanical properties of 431 stainless steel.
Temperature
/°C
Specific Heat Capacity
/(J·kg/°C)
Thermal Conductivity
/(W·m/°C)
Density
/(g/cm3)
Elastic Modulus
/GPa
Expansion Coefficient
/10−6/°C
Poisson’s Ratio
25457.6217.297.74196.3517.560.29
300539.3520.357.62177.3218.280.31
600667.4823.697.49151.5619.120.34
900681.7626.977.35121.4820.920.34
1200754.5730.357.1987.9721.510.37
1300855.9831.487.1472.3421.920.39
14001054.3132.367.0735.3523.020.39
14501948.4732.397.0215.6724.100.42
Table 4. Thermophysical and mechanical properties of 45 steel.
Temperature
/°C
Specific Heat Capacity
/(J·kg/°C)
Thermal Conductivity
/(W·m/°C)
Density
/(g/cm3)
Elastic Modulus
/GPa
Expansion Coefficient
/10−6/°C
Poisson’s Ratio
25453.6316.948.04210.328.260.29
200498.5219.037.93199.689.350.33
400535.9821.417.82165.4210.510.33
600567.7623.87.71147.6511.870.35
800598.1326.187.60128.5314.850.37
1000629.9828.567.49108.9814.960.42
1200661.3130.947.3988.6214.950.42
1400698.6433.337.2967.7515.040.42
Table 5. G, V, K, and R at the top, middle and bottom of the melt pool during solidification.
PointABC
Temperature gradient
G/(°C/mm)
1.63 × 1035.36 × 1038.72 × 103
Cooling rate
V/(°C/s)
2.12 × 1042.67 × 1043.68 × 104
Shape control factor
K/(°C/(mm2·s))
125.331076.012066.26
Growth rate
R/(mm/s)
1.304.981.42
Disclaimer/Publisher’s Note: The statements, opinions and data contained in all publications are solely those of the individual author(s) and contributor(s) and not of MDPI and/or the editor(s). MDPI and/or the editor(s) disclaim responsibility for any injury to people or property resulting from any ideas, methods, instructions or products referred to in the content.

