

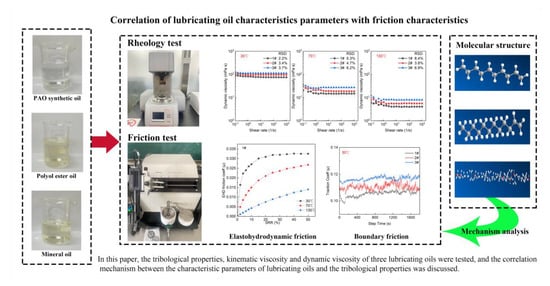
Correlation between Lubricating Oil Characteristic Parameters and Friction Characteristics


 ,
,
Abstract
:
1. Introduction
2. Materials and Experiments
2.1. Lubricating Oil Samples
2.2. Experimental Equipment and Details
2.2.1. Kinematic Viscosity-Temperature Test
2.2.2. Rheology Test
2.2.3. Elastohydrodynamic Friction Experiment
2.2.4. Boundary Friction Experiment
3. Results and Analysis
3.1. Viscosity-Temperature Characteristics
3.2. Rheological Properties
3.3. Elastohydrodynamic Friction Characteristics
3.3.1. Effect of Rolling Speed on Friction Characteristics of Three Lubricating Oils
3.3.2. Effect of Contact Load on Friction Characteristics of Three Lubricating Oils
3.3.3. Effect of Ambient Temperature on Friction Characteristics of Three Lubricating Oils
3.4. Boundary Friction Characteristics
4. Correlation between Lubricant Oil Characteristic Parameters and Friction Characteristics and Their Underlying Mechanisms
4.1. Correlation between Viscosity-Temperature Performance and Friction Characteristics
4.2. Correlation between Viscosity and Friction Characteristics
4.3. Correlation between Viscosity-Pressure Coefficient and Friction Characteristics
4.4. Correlation between Viscosity Index and Friction Characteristics
4.5. Mechanism of Correlation between Lubricating Oil Characteristic Parameters and Friction Characteristics
5. Conclusions
- Kinematic viscosity does not directly determine the COF of the lubricating oil. However, the larger the dynamic viscosity and viscosity-pressure coefficient of the lubricating oil, the larger the COF. Mineral oils have the largest COF, followed by polyalcohol esters and PAO synthetic oils. The kinematic viscosity-temperature behavior does not account for the shift of the elastic hydrodynamic and boundary friction properties with temperature;
- Branching chains in mineral oils reduce the free volume, and there is not enough room for adaptation between molecules. Therefore, the viscosity changes greatly with the pressure and temperature to result in a lower viscosity index (poor viscosity-temperature performance), a higher viscosity-pressure coefficient and a higher COF;
- Due to the presence of linear chains and flexible groups, PAO synthetic oils and polyol ester oils have high inter-molecular polarity and strong adaptability to temperature and pressure changes, so they have a higher viscosity index (better viscosity-temperature performance), a lower viscosity-pressure coefficient and a lower friction.
- Lubricating oils with high viscosity-pressure coefficient or low viscosity index or poor viscosity-temperature properties have high elastohydrodynamic and boundary COF.
Author Contributions
Funding
Institutional Review Board Statement
Informed Consent Statement
Data Availability Statement
Conflicts of Interest
Abbreviations
| VFT | Vogel–Fulcher–Tammann |
| COF | coefficient of friction |
Appendix A

| Temperature/°C | 30 | 50 | 70 | 90 | 110 | 130 | 150 |
|---|---|---|---|---|---|---|---|
| PAO synthetic oil | 107.27 ± 0.03 | 44.2 ± 0.04 | 22.61 ± 0.05 | 12.84 ± 0.03 | 8.2 ± 0.1 | 5.7 ± 0.09 | 3.99 ± 0.03 |
| Polyol ester oil | 101.58 ± 0.02 | 40.92 ± 0.03 | 20.41 ± 0.07 | 11.84 ± 0.06 | 7.55 ± 0.08 | 5.12 ± 0.06 | 3.79 ± 0.1 |
| Paraffin-based mineral oil | 119.96 ± 0.03 | 41.94 ± 0.05 | 21.4 ± 0.04 | 11.62 ± 0.08 | 7.14 ± 0.02 | 4.66 ± 0.04 | 3.41 ± 0.06 |
References
- Kanazawa, Y.; De Laurentis, N.; Kadiric, A. Studies of Friction in Grease-Lubricated Rolling Bearings Using Ball-on-Disc and Full Bearing Tests. Tribol. Trans. 2019, 63, 77–89. [Google Scholar] [CrossRef]
- De Laurentis, N.; Cann, P.; Lugt, P.M.; Kadiric, A. The Influence of Base Oil Properties on the Friction Behaviour of Lithium Greases in Rolling/Sliding Concentrated Contacts. Tribol. Lett. 2017, 65, 128. [Google Scholar] [CrossRef]
- Gunsel, S.; Korcek, S.; Smeeth, M.; Spikes, H.A. The Elastohydrodynamic Friction and Film Forming Properties of Lubricant Base Oils. Tribol. Trans. 1999, 42, 559–569. [Google Scholar] [CrossRef]
- Rounds, F.G. Effects of Lubricant Composition on Friction as Measured with Thrust Ball Bearings. J. Chem. Eng. Data 1960, 5, 499–507. [Google Scholar] [CrossRef]
- Yang, S.; Reddyhoff, T.; Spikes, H. Influence of Lubricant Properties on ARKL Temperature Rise and Transmission Efficiency. Tribol. Trans. 2013, 56, 1119–1136. [Google Scholar] [CrossRef]
- Wu, N.; Hu, N.; Zhou, G.; Wu, J. Tribological properties of lubricating oil with micro/nano-scale WS2 particles. J. Exp. Nanosci. 2017, 13, 27–38. [Google Scholar] [CrossRef]
- Hu, N.; Zhang, X.; Wang, X.; Wu, N.; Wang, S. Study on Tribological Properties and Mechanisms of Different Morphology WS2 as Lubricant Additives. Materials 2020, 13, 1522. [Google Scholar] [CrossRef]
- Tóth-Nagy, C.; Szabó, Á.I. Experimental investigation of the friction modifying effects of different nanoforms of graphene additives in engine lubricating oil. FME Trans. 2022, 50, 248–259. [Google Scholar] [CrossRef]
- Yu, B.; Wang, K.; Hu, Y.; Nan, F.; Pu, J.; Zhao, H.; Ju, P. Tribological properties of synthetic base oil containing polyhedral oligomeric silsesquioxane grafted graphene oxide. RSC Adv. 2018, 8, 23606–23614. [Google Scholar] [CrossRef]
- Zheng, D.; Wu, Y.-P.; Li, Z.-Y.; Cai, Z.-B. Tribological properties of WS2/graphene nanocomposites as lubricating oil additives. RSC Adv. 2017, 7, 14060–14068. [Google Scholar] [CrossRef]
- Ding, J.; Fang, J.; Chen, B.; Zhang, N.; Fan, X.; Zheng, Z. Improved biodegradability and tribological performances of mineral lubricating oil by two synthetic nitrogenous heterocyclic additives. Ind. Lubr. Tribol. 2019, 71, 578–585. [Google Scholar] [CrossRef]
- Jin, Y.; Duan, H.; Wei, L.; Chen, S.; Qian, X.; Jia, D.; Li, J. Online infrared spectra detection of lubricating oil during friction process at high temperature. Ind. Lubr. Tribol. 2018, 70, 1294–1302. [Google Scholar] [CrossRef]
- Hentschel, K.-H. The influence of molecular structure on the frictional behaviour of lubricating fluids. J. Synth. Lubr. 1985, 2, 143–165. [Google Scholar] [CrossRef]
- Muraki, M. Molecular structure of synthetic hydrocarbon oils and their rheological properties governing traction characteristics. Tribol. Int. 1987, 20, 347–354. [Google Scholar] [CrossRef]
- Chang, H.-S.; Spikes, H.A.; Bunemann, T.F. The shear stress properties of ester lubricants in elastohydrodynamic contacts. J. Synth. Lubr. 1992, 9, 91–114. [Google Scholar] [CrossRef]
- Michaelis, K.; Höhn, B.; Hinterstoiβer, M. Influence factors on gearbox power loss. Ind. Lubr. Tribol. 2011, 63, 46–55. [Google Scholar] [CrossRef]
- Robinson, J.W.; Zhou, Y.; Qu, J.; Bays, J.T.; Cosimbescu, L. Highly branched polyethylenes as lubricant viscosity and friction modifiers. React. Funct. Polym. 2016, 109, 52–55. [Google Scholar] [CrossRef]
- Hu, C.; Ai, J.; Ma, L.; Wen, P.; Fan, M.; Zhou, F.; Liu, W. Ester Oils Prepared from Fully Renewable Resources and Their Lubricant Base Oil Properties. ACS Omega 2021, 6, 16343–16355. [Google Scholar] [CrossRef]
- Guan, S.; Liu, X.; Zhang, Y.; Liu, Y.; Wang, L.; Liu, Y. Synthesis and Characterization of Polycaprolactone Modified Trimellitate Nano-Lubricant. Materials 2019, 12, 2273. [Google Scholar] [CrossRef]
- Biresaw, G.; Bantchev, G.B. Pressure Viscosity Coefficient of Vegetable Oils. Tribol. Lett. 2013, 49, 501–512. [Google Scholar] [CrossRef]
- Wen, S.; Huang, P. Principles of Tribology; John Wiley and Sons: Hoboken, NJ, USA, 2011. [Google Scholar] [CrossRef]
- Hamrock, B.J.; Dowson, D. Isothermal Elastohydrodynamic Lubrication of Point Contacts: Part III—Fully Flooded Results. J. Lubr. Technol. 1977, 99, 264–276. [Google Scholar] [CrossRef]
- Tammann, G.; Hesse, W. Die Abhängigkeit der Viscosität von der Temperatur bie unterkühlten Flüssigkeiten. Z. Anorg. Allg. Chem. 1926, 156, 245–257. [Google Scholar] [CrossRef]
- Ewoldt, R.H.; Johnston, M.T.; Caretta, L.M. Experimental challenges in shear rheology: How to avoid bad data. In Complex Fluids in Biological Systems; Springer: New York, NY, USA, 2015; pp. 207–241. [Google Scholar] [CrossRef]
- Habchi, W.; Bair, S.; Vergne, P. On friction regimes in quantitative elastohydrodynamics. Tribol. Int. 2013, 58, 107–117. [Google Scholar] [CrossRef]
- Fan, M.; Ai, J.; Zhang, S.; Yang, C.; Du, X.; Wen, P.; Ye, X.; Zhou, F.; Liu, W. Lubricating properties of ester oil prepared from bio-based 2,5-furandicarboxylic acid. Friction 2019, 8, 360–369. [Google Scholar] [CrossRef]
- Gentle, C.R.; Cameron, A. An Investigation of Traction in Elastohydrodynamic Point Contacts Using Optical Interferometry. A S L E Trans. 1975, 18, 222–228. [Google Scholar] [CrossRef]
- Spikes, H. Basics of EHL for practical application. Lubr. Sci. 2014, 27, 45–67. [Google Scholar] [CrossRef]
- Zhang, J.; Tan, A.; Spikes, H. Effect of Base Oil Structure on Elastohydrodynamic Friction. Tribol. Lett. 2016, 65, 13. [Google Scholar] [CrossRef]
- Spikes, H. A Thermodynamic Approach to Viscosity. Tribol. Trans. 1990, 33, 140–148. [Google Scholar] [CrossRef]
- Wang, W.; Li, P.; Sheng, S.; Tian, H.; Zhang, H.; Zhang, X. Influence of Hydrocarbon Base Oil Molecular Structure on Lubricating Properties in Nano-scale Thin Film. Tribol. Lett. 2019, 67, 111. [Google Scholar] [CrossRef]


| Number | Test Sample | Viscosity at 40 °C (mm2/s) | Viscosity at 100 °C (mm2/s) | Viscosity Index (VI) | Viscosity-Pressure Coefficient at 25 °C (Pa−1) [21] |
|---|---|---|---|---|---|
| 1# | poly alpha olefin (PAO) synthetic oil | 68 | 10.06 | 132 | 1.7 × 10⁻⁸ |
| 2# | Polyol ester oil | 68 | 9.72 | 124 | 1.85 × 10⁻⁸ |
| 3# | Paraffin-based mineral oil | 68 | 9.53 | 120 | 2.21 × 10⁻⁸ |
| Temperature/°C | 30 | 50 | 70 | 90 | 110 | 130 | 150 |
|---|---|---|---|---|---|---|---|
| Inner diameter of viscometer/mm | 1.5 | 1.2 | 1.0 | 0.8 | 0.8 | 0.6 | 0.6 |
Disclaimer/Publisher’s Note: The statements, opinions and data contained in all publications are solely those of the individual author(s) and contributor(s) and not of MDPI and/or the editor(s). MDPI and/or the editor(s) disclaim responsibility for any injury to people or property resulting from any ideas, methods, instructions or products referred to in the content. |
© 2023 by the authors. Licensee MDPI, Basel, Switzerland. This article is an open access article distributed under the terms and conditions of the Creative Commons Attribution (CC BY) license (https://creativecommons.org/licenses/by/4.0/).
Share and Cite
Wang, Y.; Qiu, Q.; Zhang, P.; Gao, X.; Zhang, Z.; Huang, P. Correlation between Lubricating Oil Characteristic Parameters and Friction Characteristics. Coatings 2023, 13, 881. https://doi.org/10.3390/coatings13050881
Wang Y, Qiu Q, Zhang P, Gao X, Zhang Z, Huang P. Correlation between Lubricating Oil Characteristic Parameters and Friction Characteristics. Coatings. 2023; 13(5):881. https://doi.org/10.3390/coatings13050881
Chicago/Turabian StyleWang, Yanshuang, Qingguo Qiu, Pu Zhang, Xudong Gao, Zhen Zhang, and Pengcheng Huang. 2023. "Correlation between Lubricating Oil Characteristic Parameters and Friction Characteristics" Coatings 13, no. 5: 881. https://doi.org/10.3390/coatings13050881
APA StyleWang, Y., Qiu, Q., Zhang, P., Gao, X., Zhang, Z., & Huang, P. (2023). Correlation between Lubricating Oil Characteristic Parameters and Friction Characteristics. Coatings, 13(5), 881. https://doi.org/10.3390/coatings13050881