Article

Migration of TiO2 from PET/TiO2 Composite Films Used for Polymer-Laminated Steel Cans in Acidic Solution

1
Chemical Engineering and Technology, Shanghai University, Shanghai 200444, China
2
Shanghai Bao Steel Packaging Co., Ltd., Shanghai 200949, China
*
Authors to whom correspondence should be addressed.
Coatings 2023, 13(5), 887; https://doi.org/10.3390/coatings13050887
Submission received: 28 March 2023 / Revised: 30 April 2023 / Accepted: 5 May 2023 / Published: 8 May 2023

Abstract

:
Nano-TiO2 is widely used as a commercial food contact material (FCM), which poses potential risks to food. Therefore, the migration of TiO2 is crucial for the safety of FCM. Since PET/TiO2 composite films are food contact layers used for producing polymer-laminated steel cans and the majority of beverages contained in cans are acidic, it is necessary to study the migration of TiO2 from PET/TiO2 composite films in acidic solutions. The migration of TiO2 in 4% (v/v) acetic acid was studied through the ICP-OES method. The corrosion process that occurred during the migration process was studied using electrochemical impedance spectroscopy (EIS). The morphology of Ti nanoparticles and films was measured by SEM, TEM, and dynamic light scattering (DLS) techniques. The results indicate that, at a temperature of 60 °C, the maximum migration concentration of TiO2 is 0.32 mg/kg. The TiO2 particles released during the migration process are unstable and tend to aggregate in the simulated material, with most of the Ti being present in the form of particles. Therefore, the migration of TiO2 does not follow the Fick law of diffusion but rather conforms to the Weibull model based on the non-Fick law of diffusion.

1. Introduction

Polymer-laminated steel cans are composed of a metal substrate coated with a polymer film and utilized as a form of food contact material (FCM); the polymer film effectively reduces the risk of the occurrence of metal element migration from a metal substrate to the food. In order to improve the barrier properties and antibacterial activity of the product and prolong the shelf life of the package, the polymer film is usually incorporated with nanomaterials, such as nano-titanium dioxide (nano-TiO2), nano-zinc oxide (nano-ZnO), and nano-alumina (nano-Al2O3) [1].
These nanomaterials are stably inlaid in polymer matrices without chemical interactions and can improve the properties of films [2]. In the research, it has been observed that ascorbic acid, total phenolic, and nutritional concentrations are better retained in strawberries by using nano-TiO2 low-density polyethylene packaging [3]. TiO2 nanoparticles incorporated with ethylene vinyl alcohol copolymers displayed an unprecedented performance in killing Gram-positive and Gram-negative bacteria [4]. The nano-TiO2–PLA and nano-Ag–PLA composite films showed that they could maintain good cheese quality and prolong its shelf life to 25 days [5].
However, these nanomaterials used in packaging can cause potential risks to consumers. Both in vivo and in vitro studies determined that nanomaterials presented toxic effects on human cells, including the generation of oxidative stress, the induction of emphysema and proinflammatory status, and damage to DNA [6,7,8]. Numerous studies have also revealed the potential migration of nanomaterials from polymer nanocomposites into food simulants and real foods [9,10,11,12]. In general, the risk of nanomaterials, produced by FCMs, transferring to consumers mainly occurs through oral exposure [13]. The exposure level present in organs of human beings depends on the concentration of nanomaterials that migrate from FCMs into the food that is consumed [14]. Therefore, it is necessary to evaluate the migration behavior of nanomaterials to food.
The migration activity of nanomaterials is, indeed, complicated. In a previous study, Noonan summarized the occurrence of 4D release phenomena during the life cycle of any nanocomposite material, including the desorption, diffusion, dissolution, and degradation of the relevant matrix [15]. Furthermore, the different migration processes may have occurred simultaneously and were affected by the nanomaterials, foods, and polymer matrices. PET/TiO2 composite films are widely used to produce polymer-laminated steel cans to package acid beverages. Therefore, we found it necessary to study the migration of TiO2 from PET/TiO2 composite films in an acidic solution.
Electrochemical impedance spectroscopy (EIS) is a method used in the research to perform rapid coating detection. By applying a low-amplitude sinusoidal interference signal to the system, the electrochemical parameters related to the coating performance can be obtained after collecting the data and conducting a simulation analysis. Therefore, it is convenient to use physical models for quantitatively analyze the corrosion damage process of a composite film during the titanium migration process.
PET/TiO2 films are a type of food contact material widely used to produce polymer-laminated steel cans. However, there have been few reports on the process of migration occurring in food cans. Therefore, studying the migration of composite films will establish a standard for the safety evaluation of polymer-laminated steel cans.
In this study, the migration of TiO2 in 4% (v/v) acetic acid is studied using ICP-OES. Moreover, the corrosion process of food cans during the migration process is studied using electrochemical impedance spectroscopy (EIS). The morphological changes in TiO2 and the performance changes in the films are studied by scanning electron microscope (SEM), transmission electron microscope (TEM), dynamic light scattering (DLS), infrared attenuated total reflection (IR-ATR), and differential scanning calorimetry (DSC) tests. The migration mechanism of PET/TiO2 thin films in an acidic solution is also explored.

2. Materials and Methods

2.1. Samples and Reagents

The samples of PET/TiO2 films used in polymer-laminated steel cans were supplied by Shanghai Si Jiang New Material Technology Co., Ltd. (Shanghai, China). Polymer-laminated steel cans were obtained from Shanghai Bao Steel Packaging Co., Ltd. (Shanghai, China). Nitric acid (guaranteed reagent, 65% HNO3), hydrogen peroxide aqueous solution (analytical reagent, 30 wt. % H2O2), and acetic acid (guaranteed reagent) were obtained from Sinopharm Chemical Reagent Co., Ltd. (Shanghai, China). A standard solution of Ti (100 μg/mL) was provided by Tanmo Quality Inspection Co., Ltd. (Beijing, China).

2.2. Initial TiO2 Content in the Composite Film

We washed the composite film with distilled water and cut it into slices following a natural-drying stage. We then weighed 0.1 g of the sample and placed it in a polytetrafluoroethylene tube (PTFE). We added 10 mL of nitric acid and 2 mL of hydrogen peroxide to the sample. We placed it into a high-pressure microwave reactor for the digestion phase and kept the microwave and voltage heating rates consistent, heated the solution up to 200 °C from room temperature, and maintain the solution at 200 °C for an additional 10 min. Following the digestion phase, we transferred the digested sample to a digital constant-temperature heating plate, evaporated it to 1–2 mL, collected the remaining solution in a 100 mL volumetric flask, and diluted it to the scale line with 2% nitric acid. The TiO2 content is calculated using the following formula [16]:
M   = ( C i C 0 ) V × 10 3 /   m × 10 3
where M is the content of TiO2 present in the composite membrane (mg/kg); Ci and C0 are the concentrations (mg/L) of the experimental and blank samples, respectively; m is the mass of the sample prior to digestion (g); and V is the constant volume of the sample (mL).

2.3. Migration of TiO2 in 4% (v/v) Acetic Acid

Based on EU No. 10/2011 [17] and GB 31604.1-2015 [18], the PET/TiO2 composite films were completely immersed in 50 mL of simulants (the surface-to-volume ratio was 30 cm2 of film/50 mL of simulant). 4% (v/v) acetic acid was used as the acid simulant. The migration temperature levels was 40, 50, and 60 °C, and the migration times were 0.5, 1, 2, 4, 6, 8, and 10 days.
The migration solution was sampled at different time points during the process, evaporated on a hot plate until dry, dissolved with 2% nitric acid aqueous solution, and then filtered prior to testing.
The migration of TiO2 is calculated using Equation (2):
Mt = M1/M2
where Mt is the concentration of TiO2 (mg/kg), M1 is the quantity of TiO2 in the simulants (mg), and M2 is the quantity of the food simulant (kg).

2.4. Soaking Process of Polymer-Laminated Steel Cans

We poured 4% (v/v) acetic acid into the polymer-laminated steel cans, and then sealed and placed them into 60 °C drying ovens for a period of 10 days. During the soaking stage, we periodically removed the food cans from the ovens to perform an electrochemical impedance spectroscopy test.

2.5. Stripping Process of the Polymer-Laminated Steel Cans

The polymer-laminated steel cans, unsoaked and soaked in 4% (v/v) acetic acid solution at 60 °C for 240 h, were cut into 2 cm × 2 cm sizes at the same height and placed into beakers; the same volume of 30 (v/v) % H2O2 solutions was then added to the samples. Then, the beakers were sealed and placed in an oven heated to 50 °C for 6 h to strip away the composite film. The stripped composite films were washed and dried in an oven at 60 °C for 1 h. The composite films we obtained following this process were then used for the subsequent tests to analyze the changes that occurred in the composite films.

2.6. Analysis Method

Microwave digestion was conducted using a microwave high-pressure reactor (W6-GSH, China). The Ti concentration was analyzed by ICP-OES (Avio 200, PerkinElmer, Waltham, MA, USA). The surface morphology of the film was observed by SEM (Quanta FEG 250, FEI, Hillsboro, OR, USA), a Depth of Field 3D Microscope System (VHX-2000, Keyence Corporation, Shanghai, China), and AFM (Bruker Multi Mode 8, Massachusetts, USA). The performance changes in the film were analyzed using IR-ATR (i410, ThermoFisher Scientific Corporation, Waltham, MA, USA), DSC (Netsch 200F3, Selb, Germany), and X-ray diffraction (D8 Advance, Bruker Corporation, Karlsruhe, Germany). A TEM (Zoom-1 HD-1, Hitachi, Tokyo, Japan) operated at 100 kV was used to characterize the particle sizes. The hydration particle diameters and distribution of TiO2 particles were measured by DLS (Dyna Pro Nano Star DLS, Wyatt Technology Corporation, Goleta, CA, USA). The zeta potential (ζ) value of dispersion was estimated by DLS (particle size test, Malvern DSL, Malvern, UK). To track the size distribution of the TiO2 particles released during the experiment and the ζ of the simulant, the simulant collected following the migration stage was shaken and measured immediately after it reached the specified time (1 day, 10 days). The “placed 10 days” sample was the “10 days” sample measured again after being kept for 10 days.
The open-circuit potential (OCP) measurement and electrochemical impedance spectroscopy (EIS) test of polymer-laminated steel cans following their immersion process were performed by the CHI604E electrochemical workstation (CH Instruments, Shanghai, China). An EIS measurement was conducted to obtain the stable open-circuit potential, the scanning frequency range was 10−2−104 Hz, and the amplitude of the sinusoidal voltage signal was 20 mV. A traditional three-electrode cell was used at room temperature, where a saturated calomel electrode was the reference electrode, a platinum electrode was the auxiliary electrode, and the polymer-laminated steel was the working electrode.
The ICP-OES operating conditions were as follows: RF power: 1300 W; plasma gas flow rate: 10.0 L/min; auxiliary gas flow rate: 0.2 L/min; nebulizer gas flow rate: 0.7 L/min; pump flow rate: 1.0 mL/min; replicates: 3.0 times; delay time: 20.0 s; sample flow rate: 1.0 mL/min; and Ti wavelength: 334.94 nm.

3. Results and Discussion

3.1. Method Validation

In order to determine the amount of titanium dioxide present in the migration solution by ICP-OES, it was first necessary to generate a standard curve using 1, 5, 10, 50, 100, 200, 500 and 1000 µg/L titanium standard solutions. The responses were linear over the concentration ranges tested with a correlation coefficient of 0.9999. The linear equation was y = 7533.56x + 1087.38. The standard curve was shown in Figure S1. The limit of detection (LOD) and limit of quantitation (LOQ) values were 0.6 and 1.8 µg/L, respectively. The 20, 100, and 500 µg/L titanium standard solutions were added to a known concentration solution. Prior to ICP-OES analysis, the mixed solutions were evaporated, dissolved and filtered. Six sets of parallel experiments were carried out, and the results are shown in Table 1. As shown in Table 1, the recovery ranges from 98% to 105% and the relative standard deviations (RSDs) range from 1.7 to 3.5%.

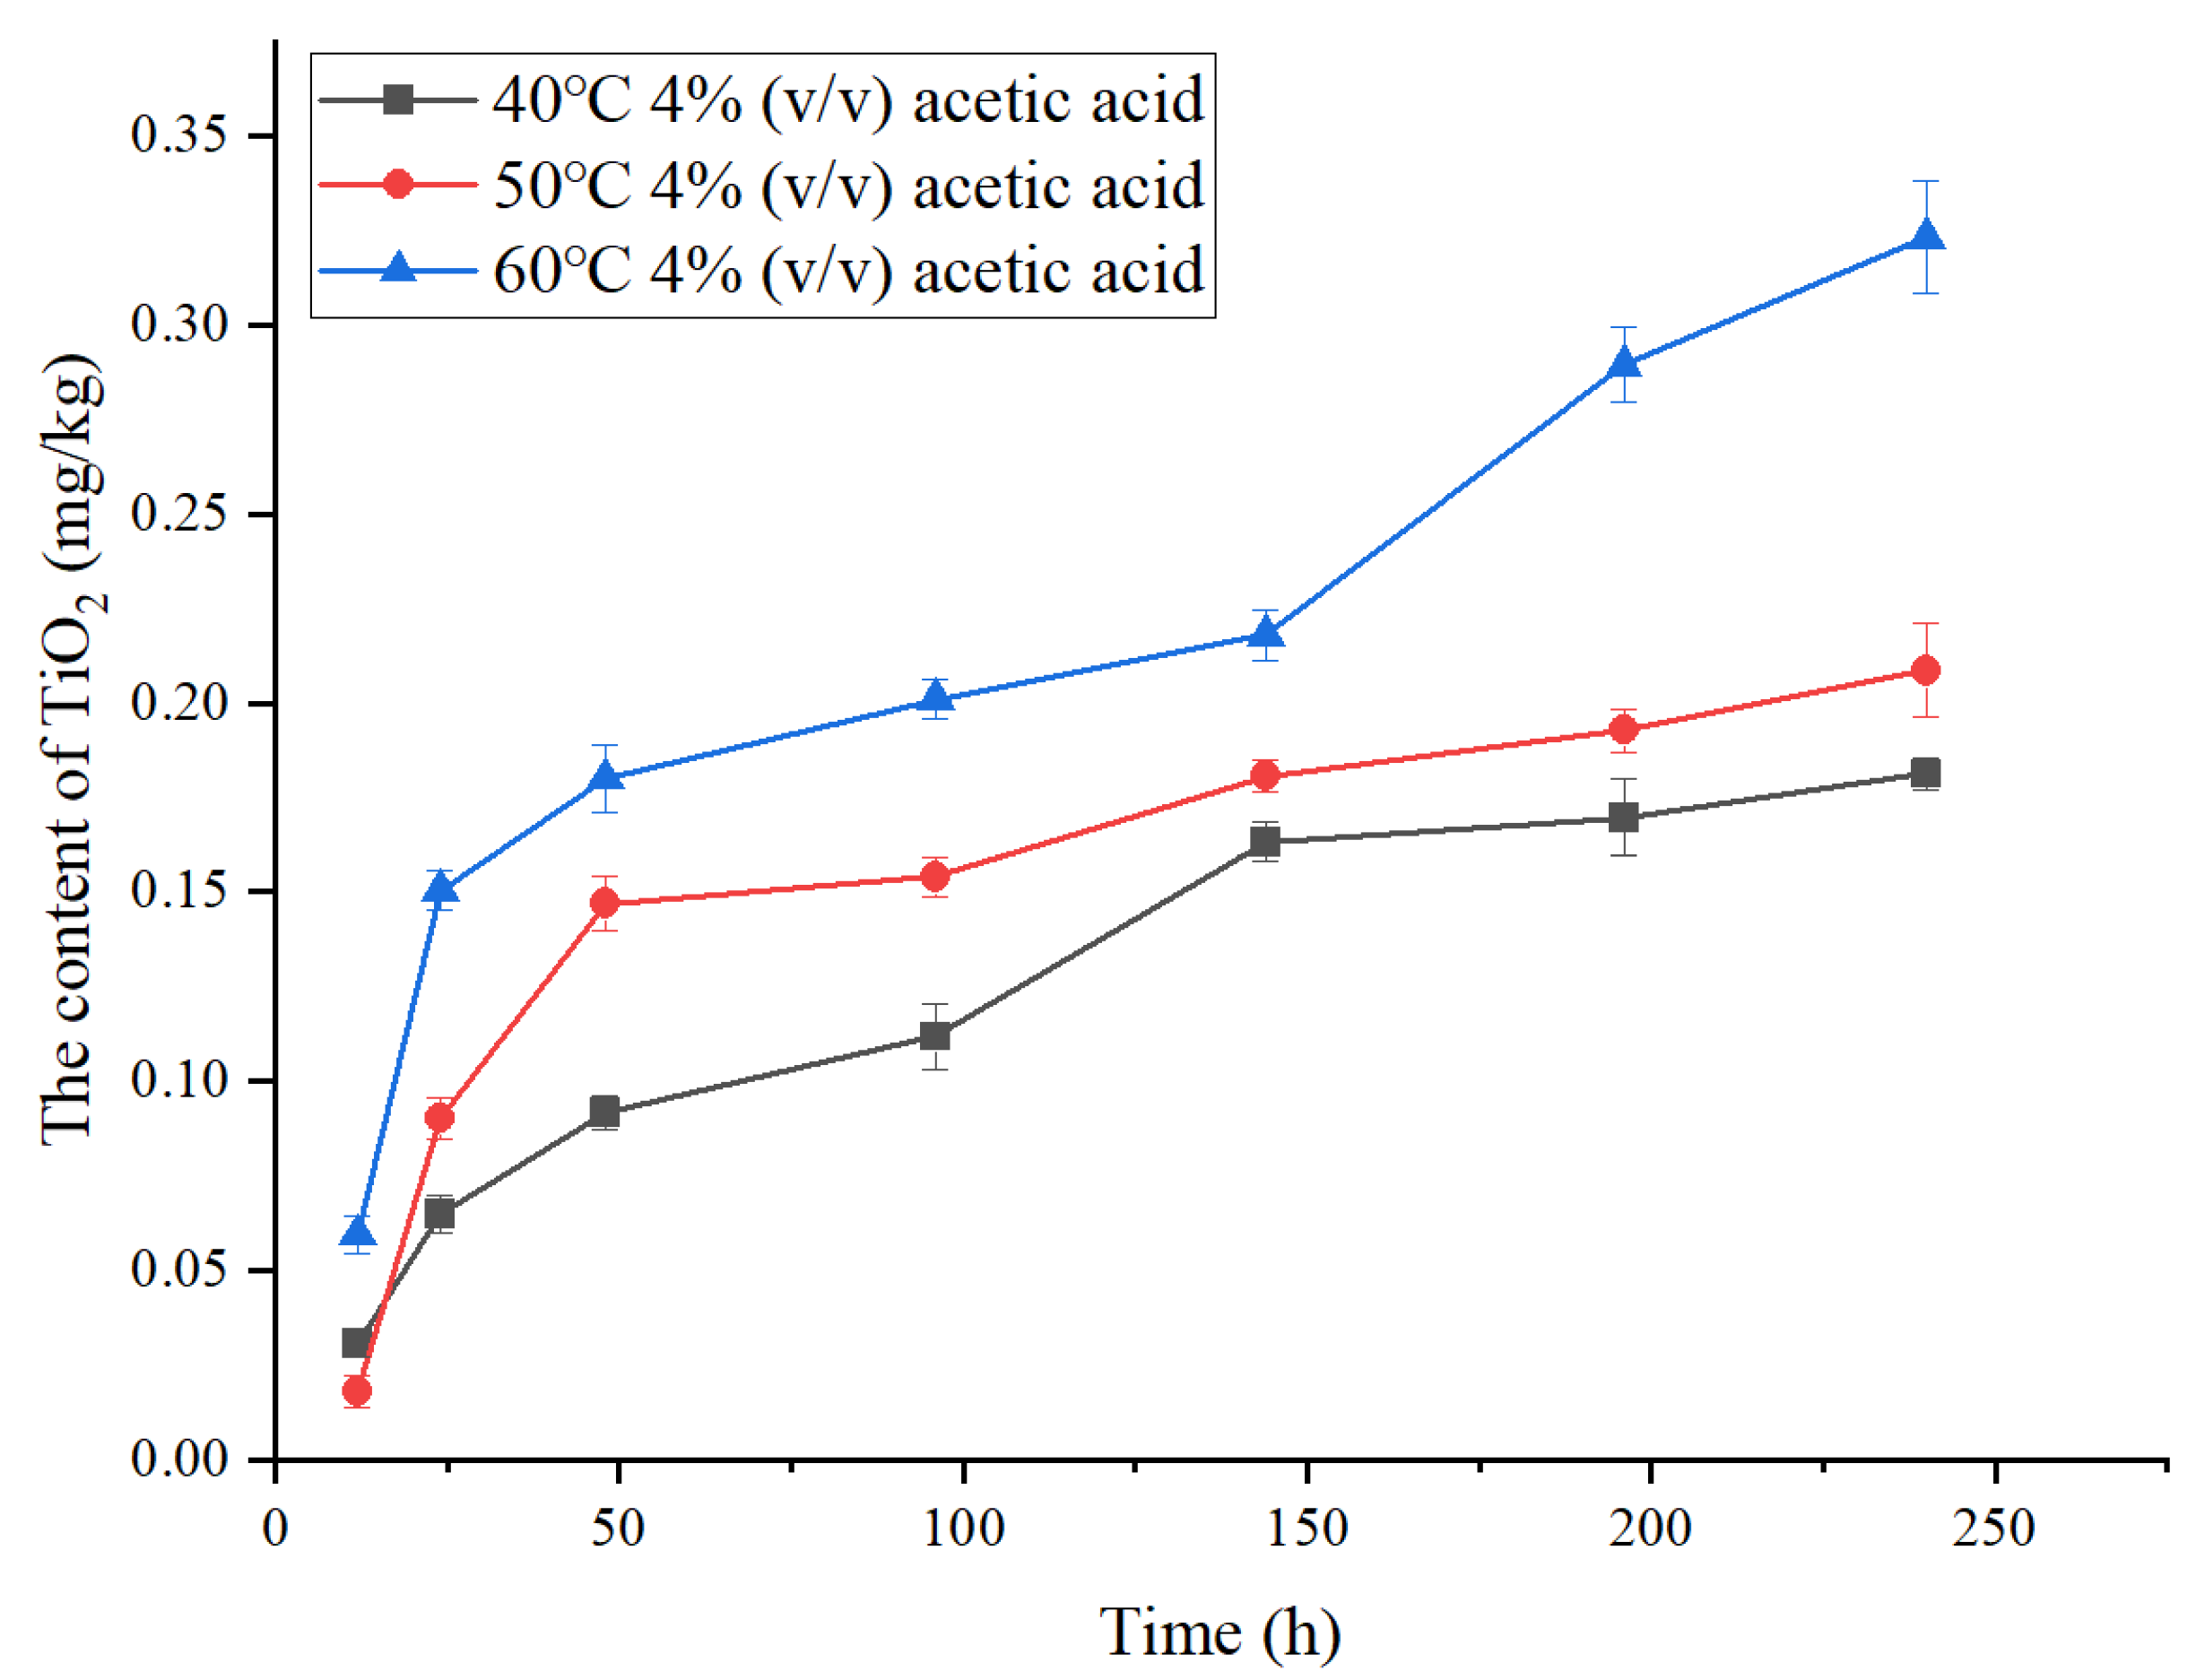
3.2. The Migration in 4% (v/v) Acetic Acid

The initial concentration of TiO2 was 370.42 mg/kg in the film determined using the high-pressure microwave digestion method. Figure 1 presents the migration information of the TiO2 submerged in 4% (v/v) acetic acid at 40, 50, and 60 °C. The highest migration value of TiO2 was approximately 0.32 mg/kg and it was less than the standard limits (1 mg/kg) according to (EU) No. 10/2011 [17], which is within the safe range.
Figure 1 shows that the migration value increases with the extension of time and the increase in temperature, indicating that the influence of temperature and time on migration is relatively clear. The main reason for why time affects the migration activity of TiO2 is that, as the soaking time increases, the acidic environment of the composite membrane during the soaking process may damage the PET structure [19], causing the composite membrane to degrade in quality, thereby causing the embedded TiO2 to detach into the solution. Temperature level mainly affects the migration behavior of TiO2 in three ways. Firstly, it is related to the properties of acetic acid, which is a weak acid and can undergo ionization. The increase in temperature leads to an increase in the degree of ionization of acetic acid, a stronger conductivity of the solution, and an increase in the solubility of TiO2 [20]. Secondly, the increase in temperature increases the flexibility and flowability characteristics of PET molecular chains, resulting in an increase in the free volume and pore size between the PET interior and TiO2. These increased pore sizes provide favorable channels for the process of TiO2 migration [21,22]. Finally, higher temperatures are conducive to the migration of organic additives in the composite membrane. The diffusion and permeation of the additives loosen the polymer chain and also promote the migration of TiO2 [22,23,24,25,26].

3.3. Migration Model

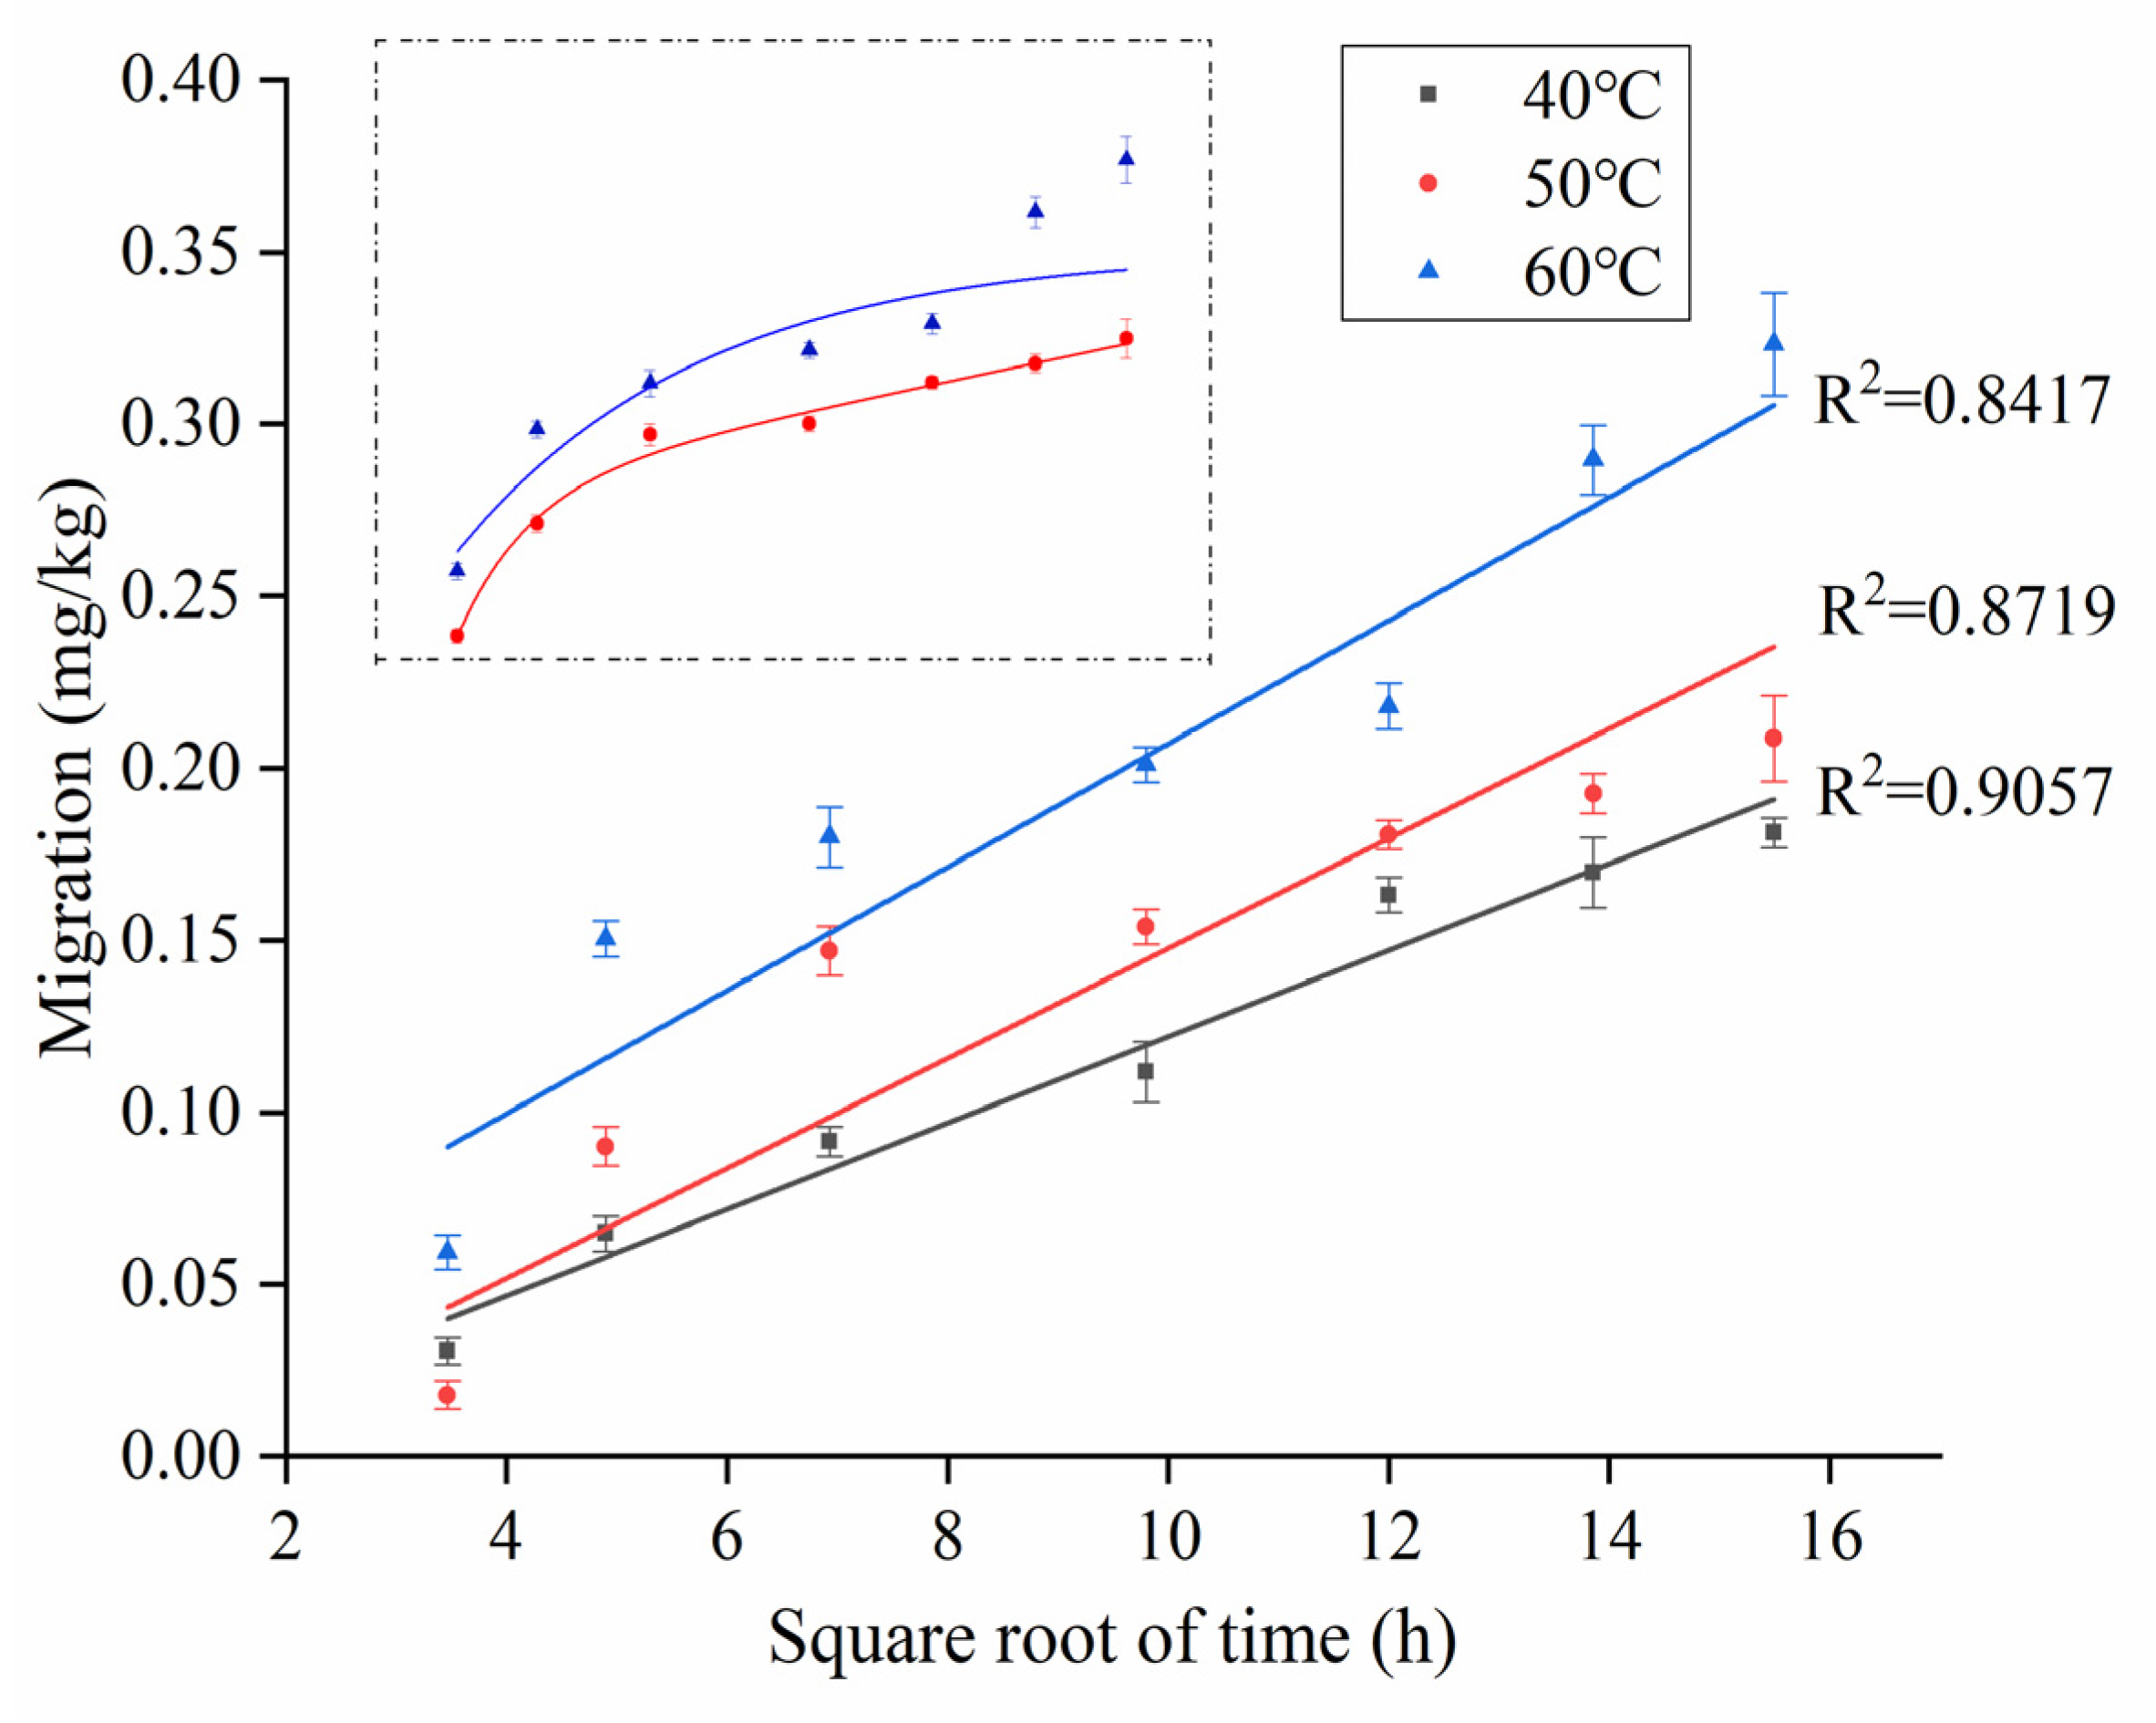
3.3.1. The Fick Law of Diffusion

The crank theory shows that the migration behavior of chemical substances in packaging materials is linear with the square root of the migration time; therefore, the migration behavior is in agreement with the Fick law of diffusion [27]. Based on the diffusion process, the migration data fitting of TiO2 in 4% (v/v) acetic acid is presented in Figure 2. The R2 value of migration kinetics occurring at 40 °C was 0.90571 and R2 values at 50 and 60 °C were less than 0.9, indicating that the migration of TiO2 was not suitable to the Fick law of diffusion.

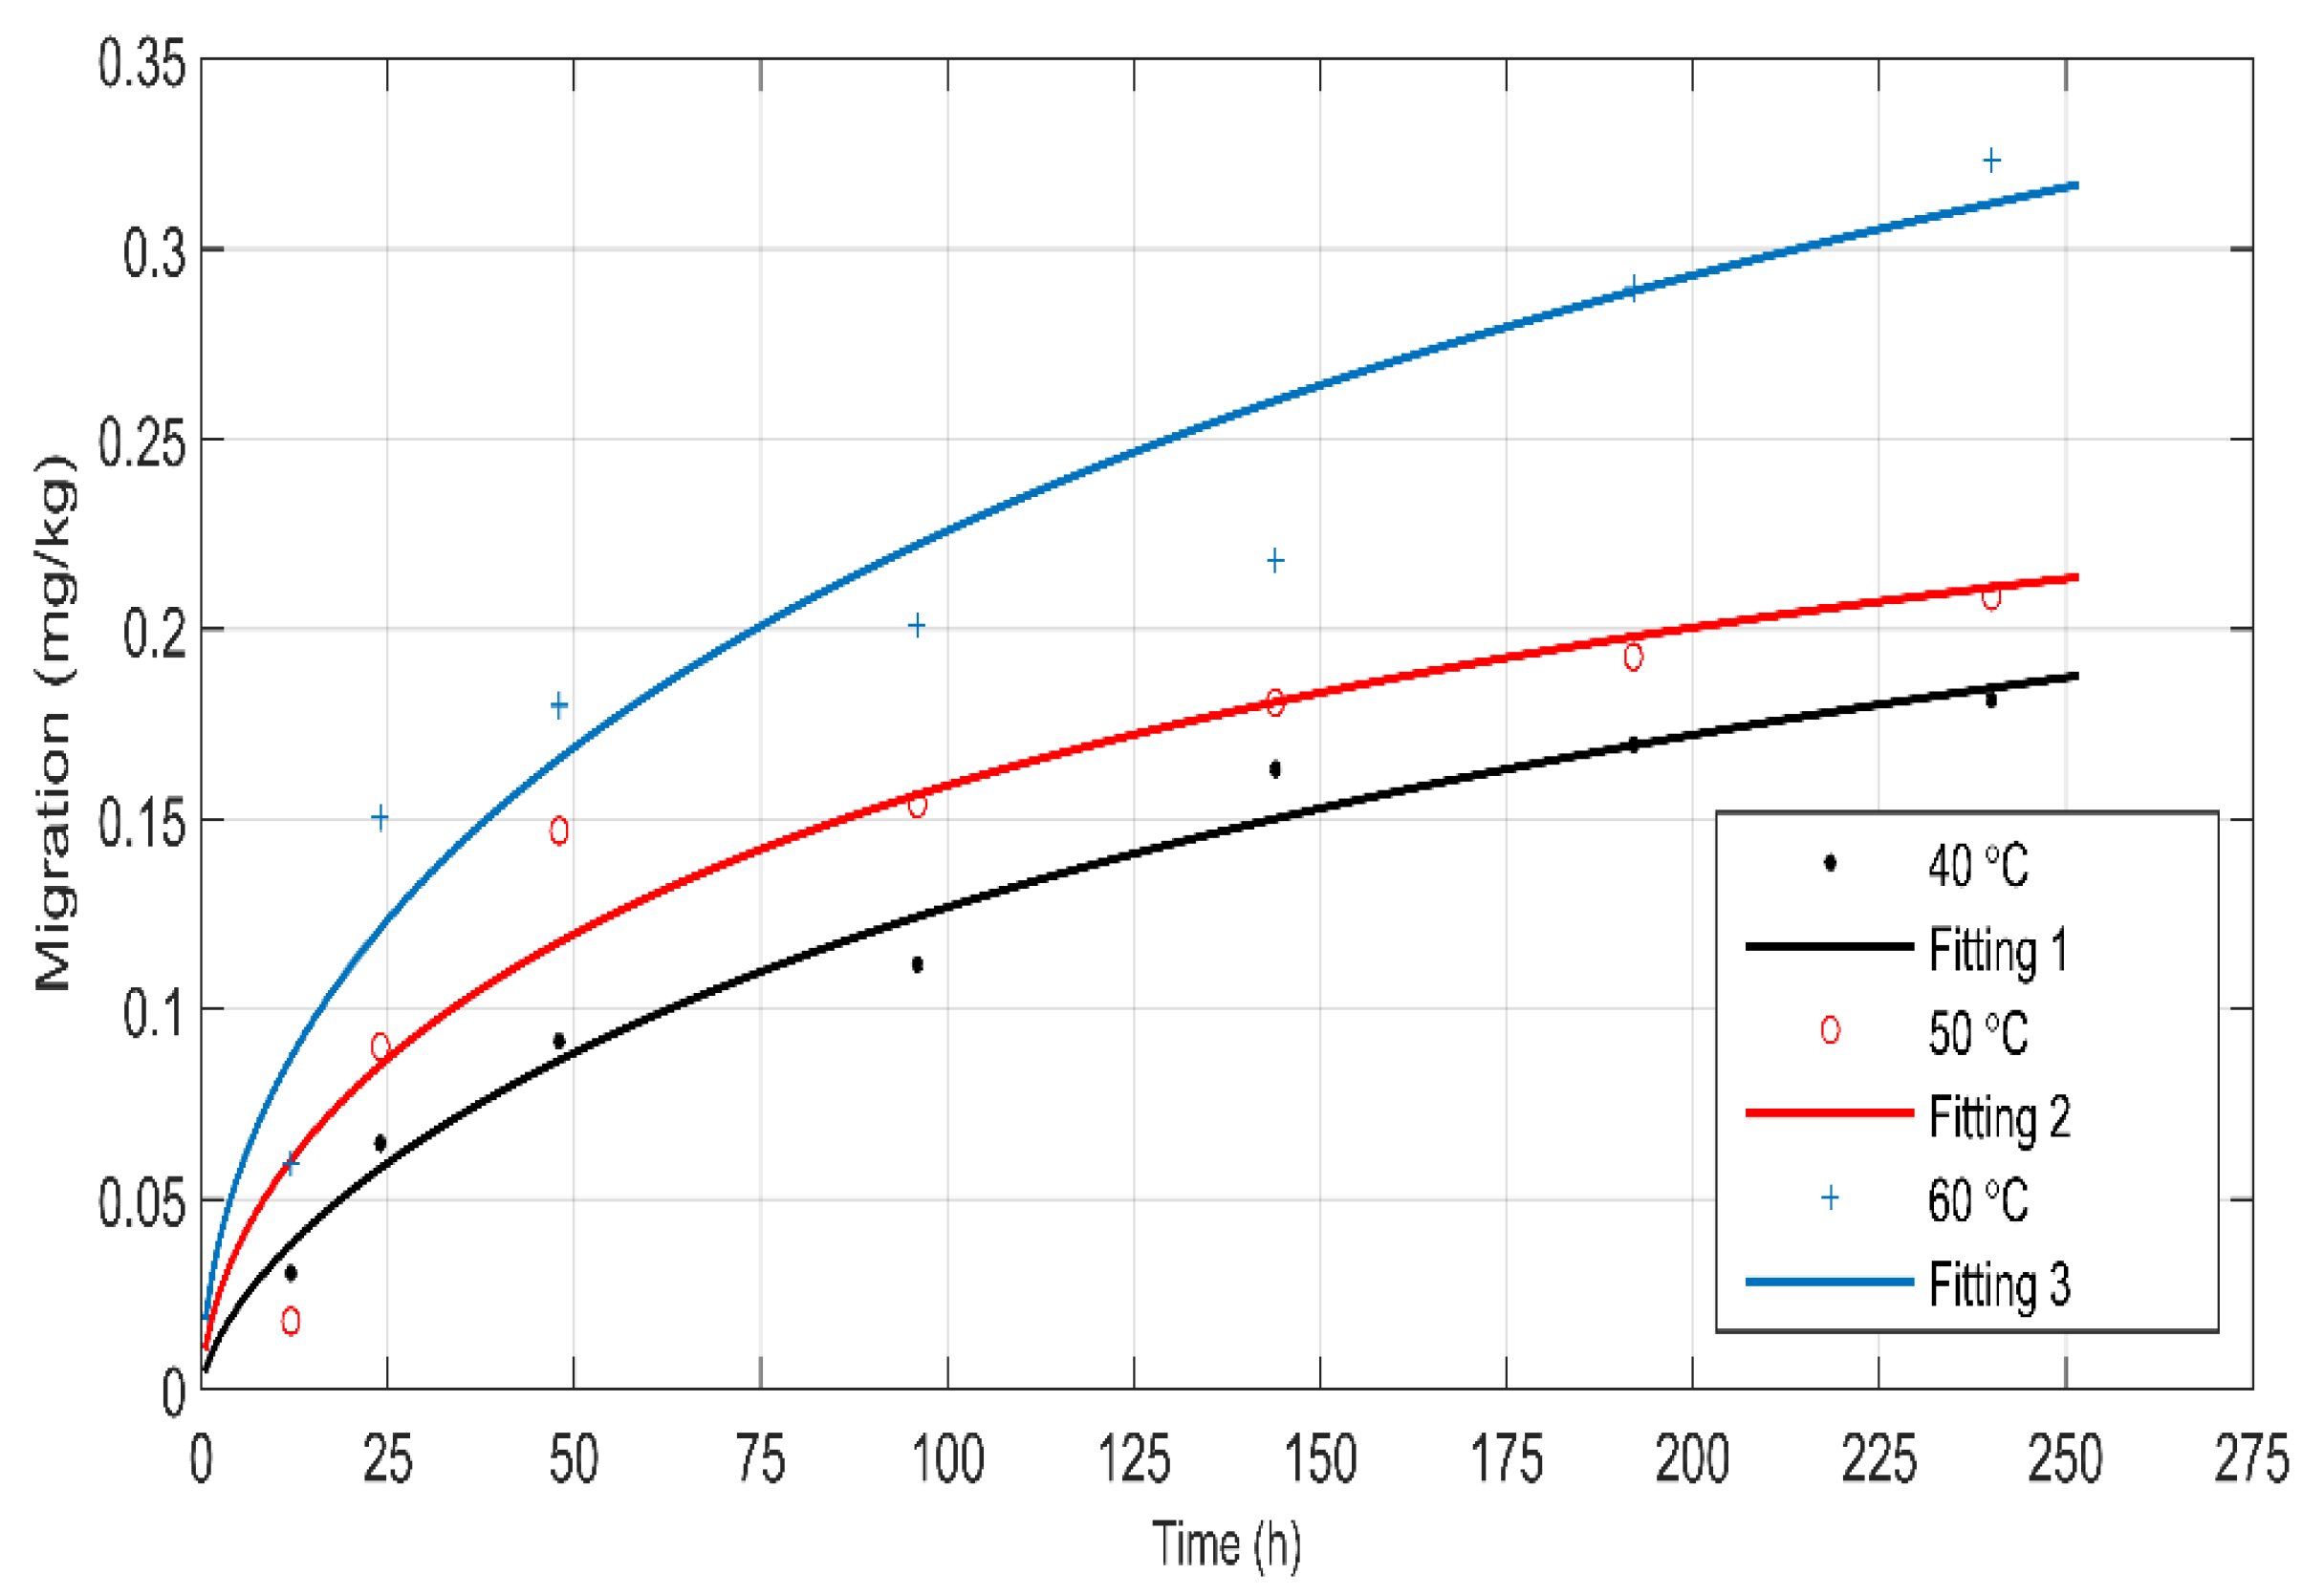
3.3.2. The Weibull Diffusion

The Weibull diffusion is fitted through the custom mode of MATLAB 8.5 (R2015a) software. The fitting results of each parameter are presented in Table 2 and the fitting curve is shown in Figure 3. From Table 2, we can observe that the Weibull diffusion fits are all greater than 0.9; therefore, the fitting effect is better than that achieved with the Fick law of diffusion model. This shows that the migration of TiO2 in the composite film follows the non-Fick law of diffusion effect. In addition, the predicted value produced by the Weibull model was slightly higher than the experimental data, indicating that the Weibull model can be considered as a method for predicting the migration behavior of TiO2 in the composite film submerged in an acidic solution.

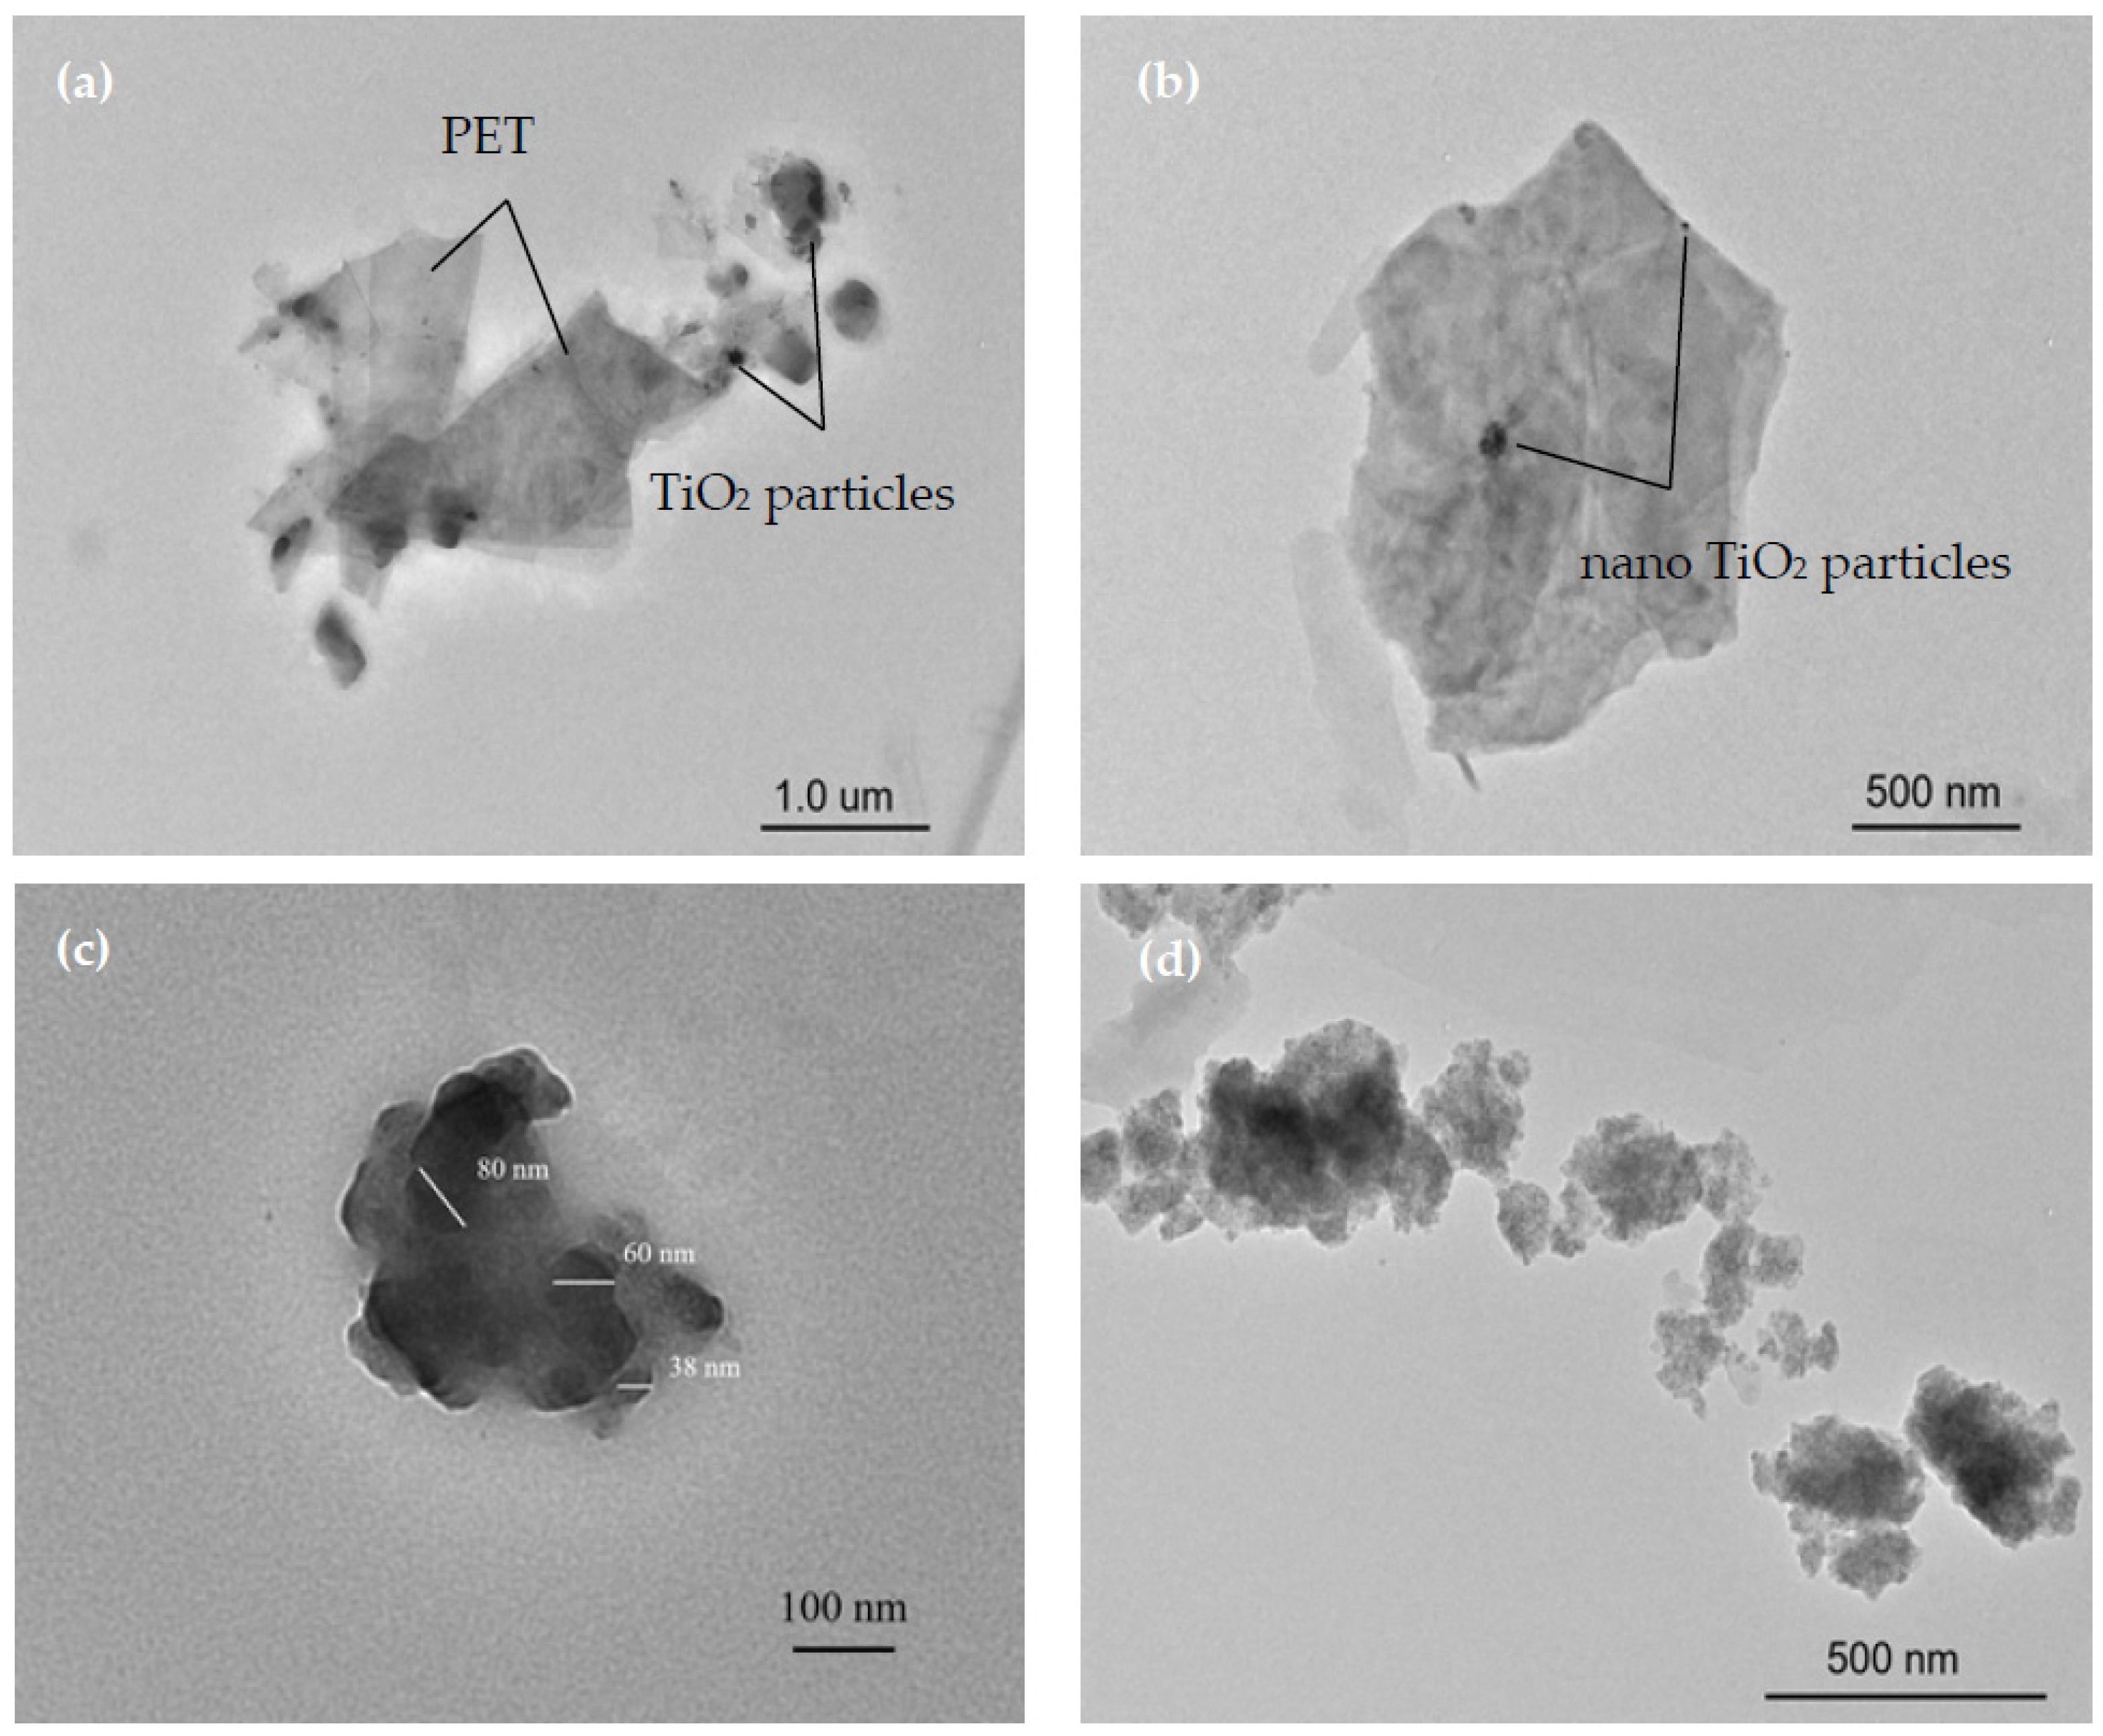
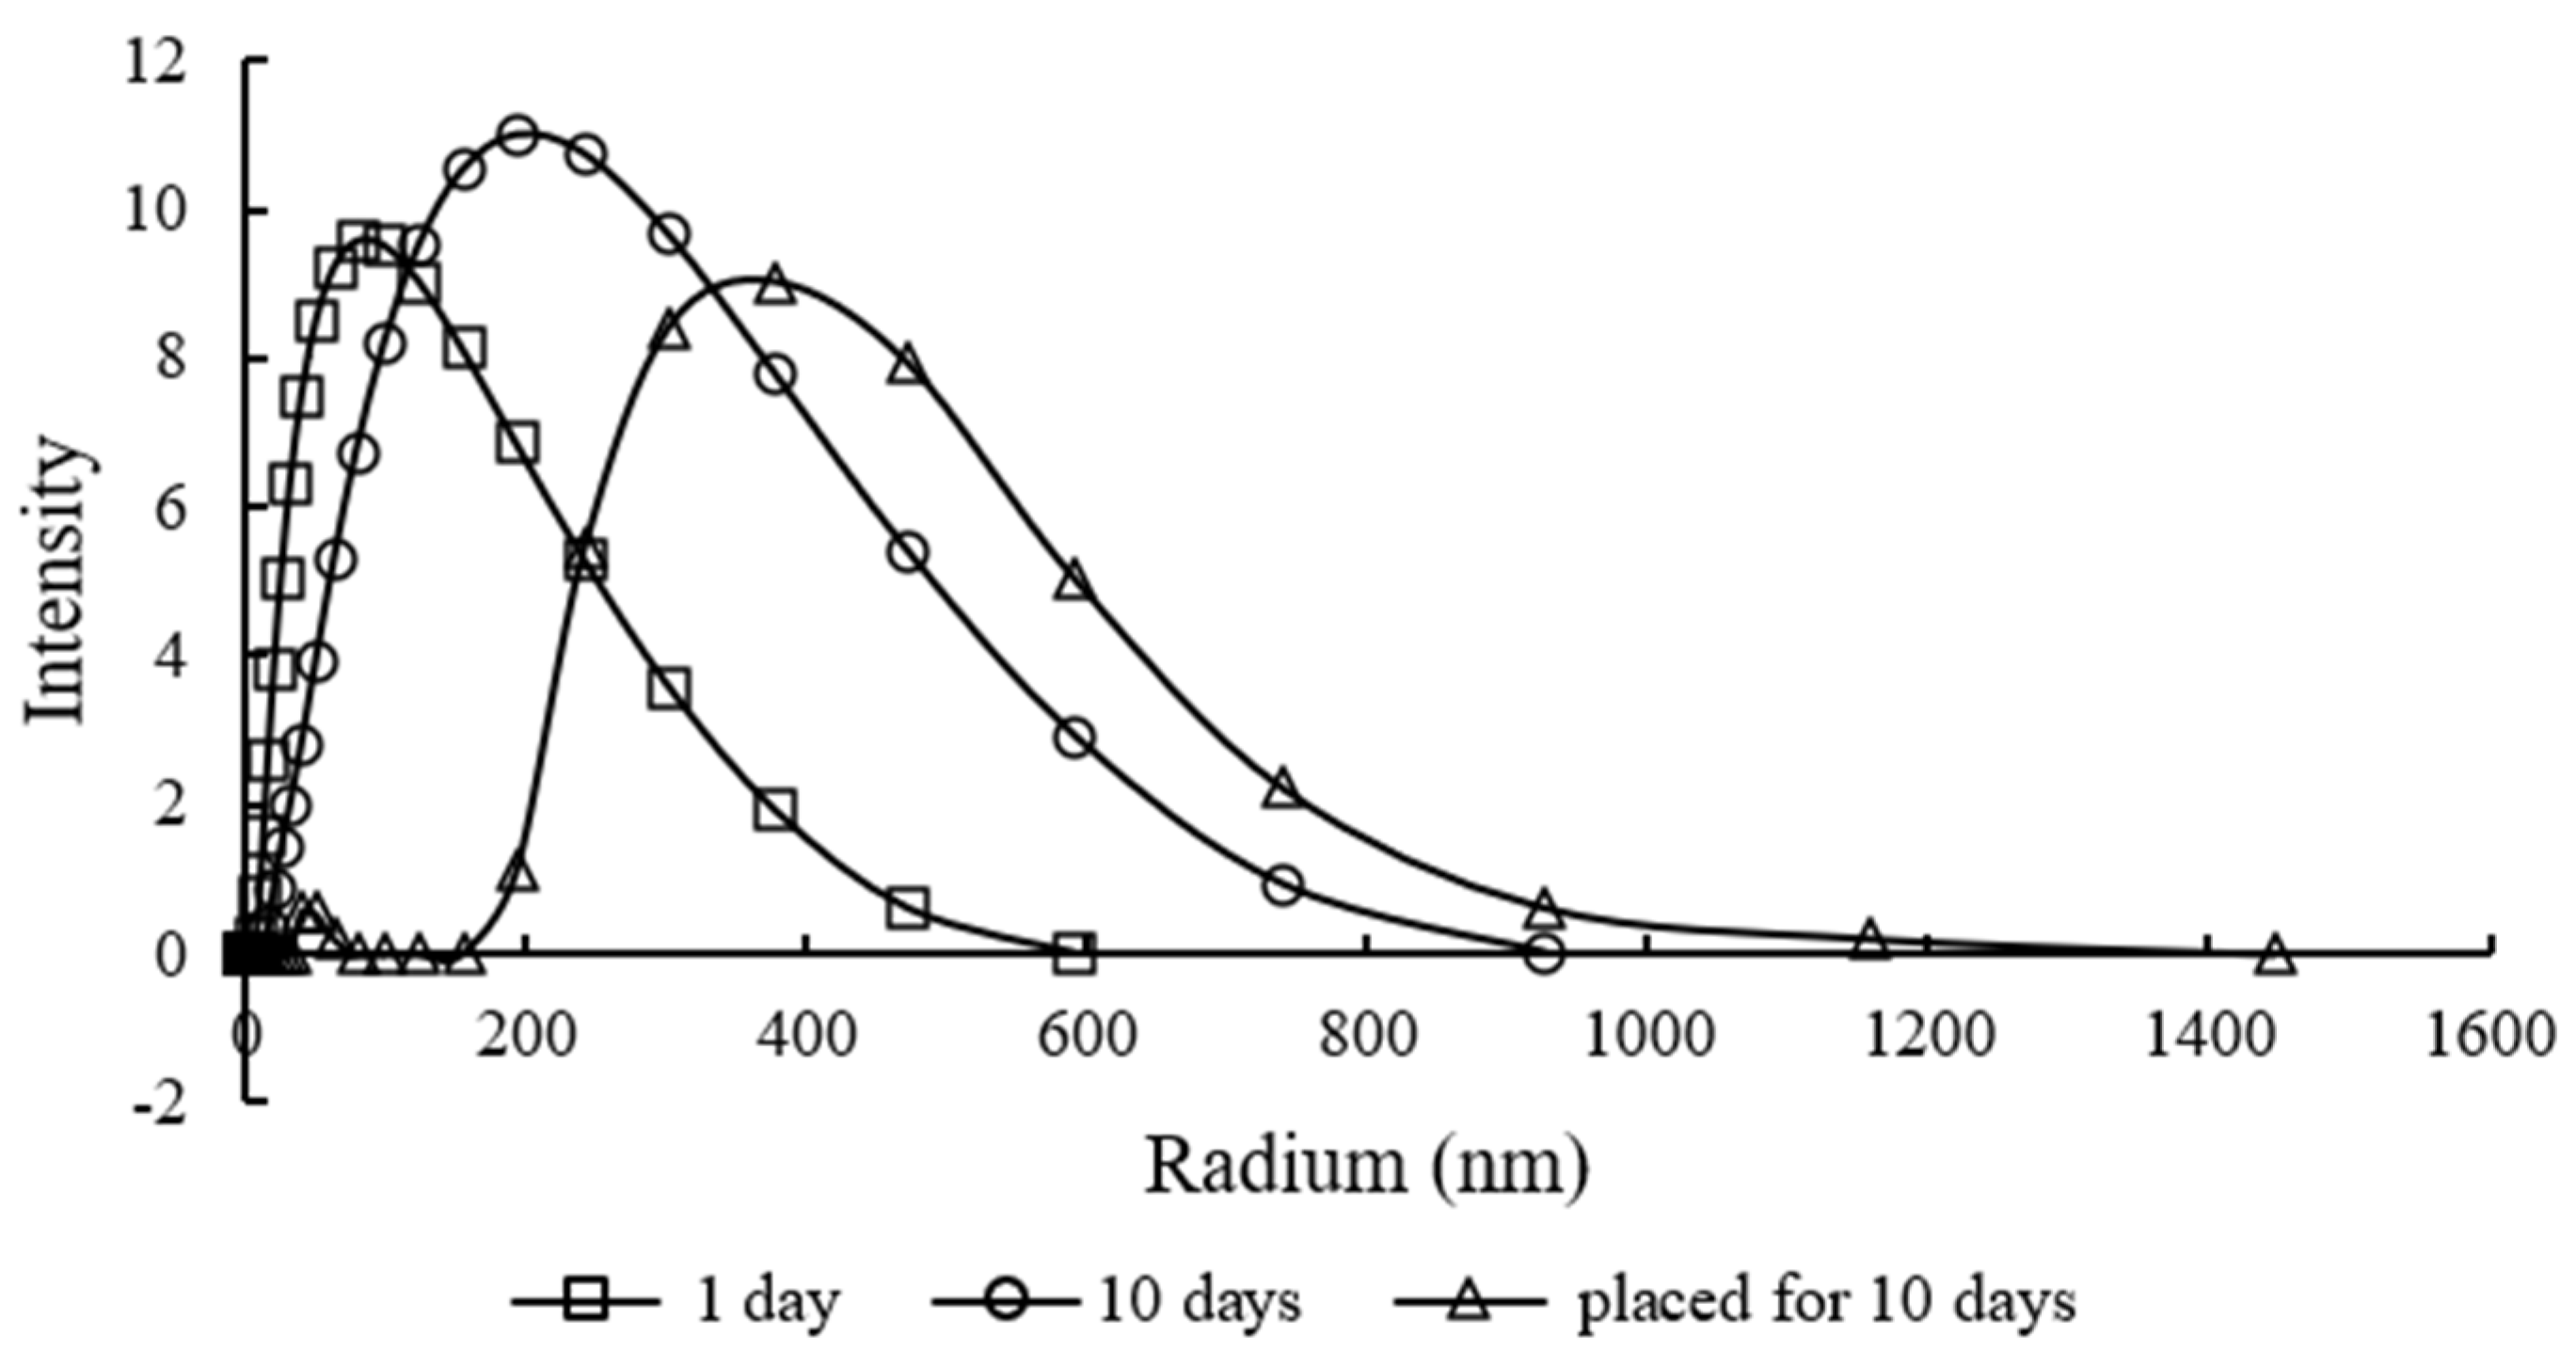
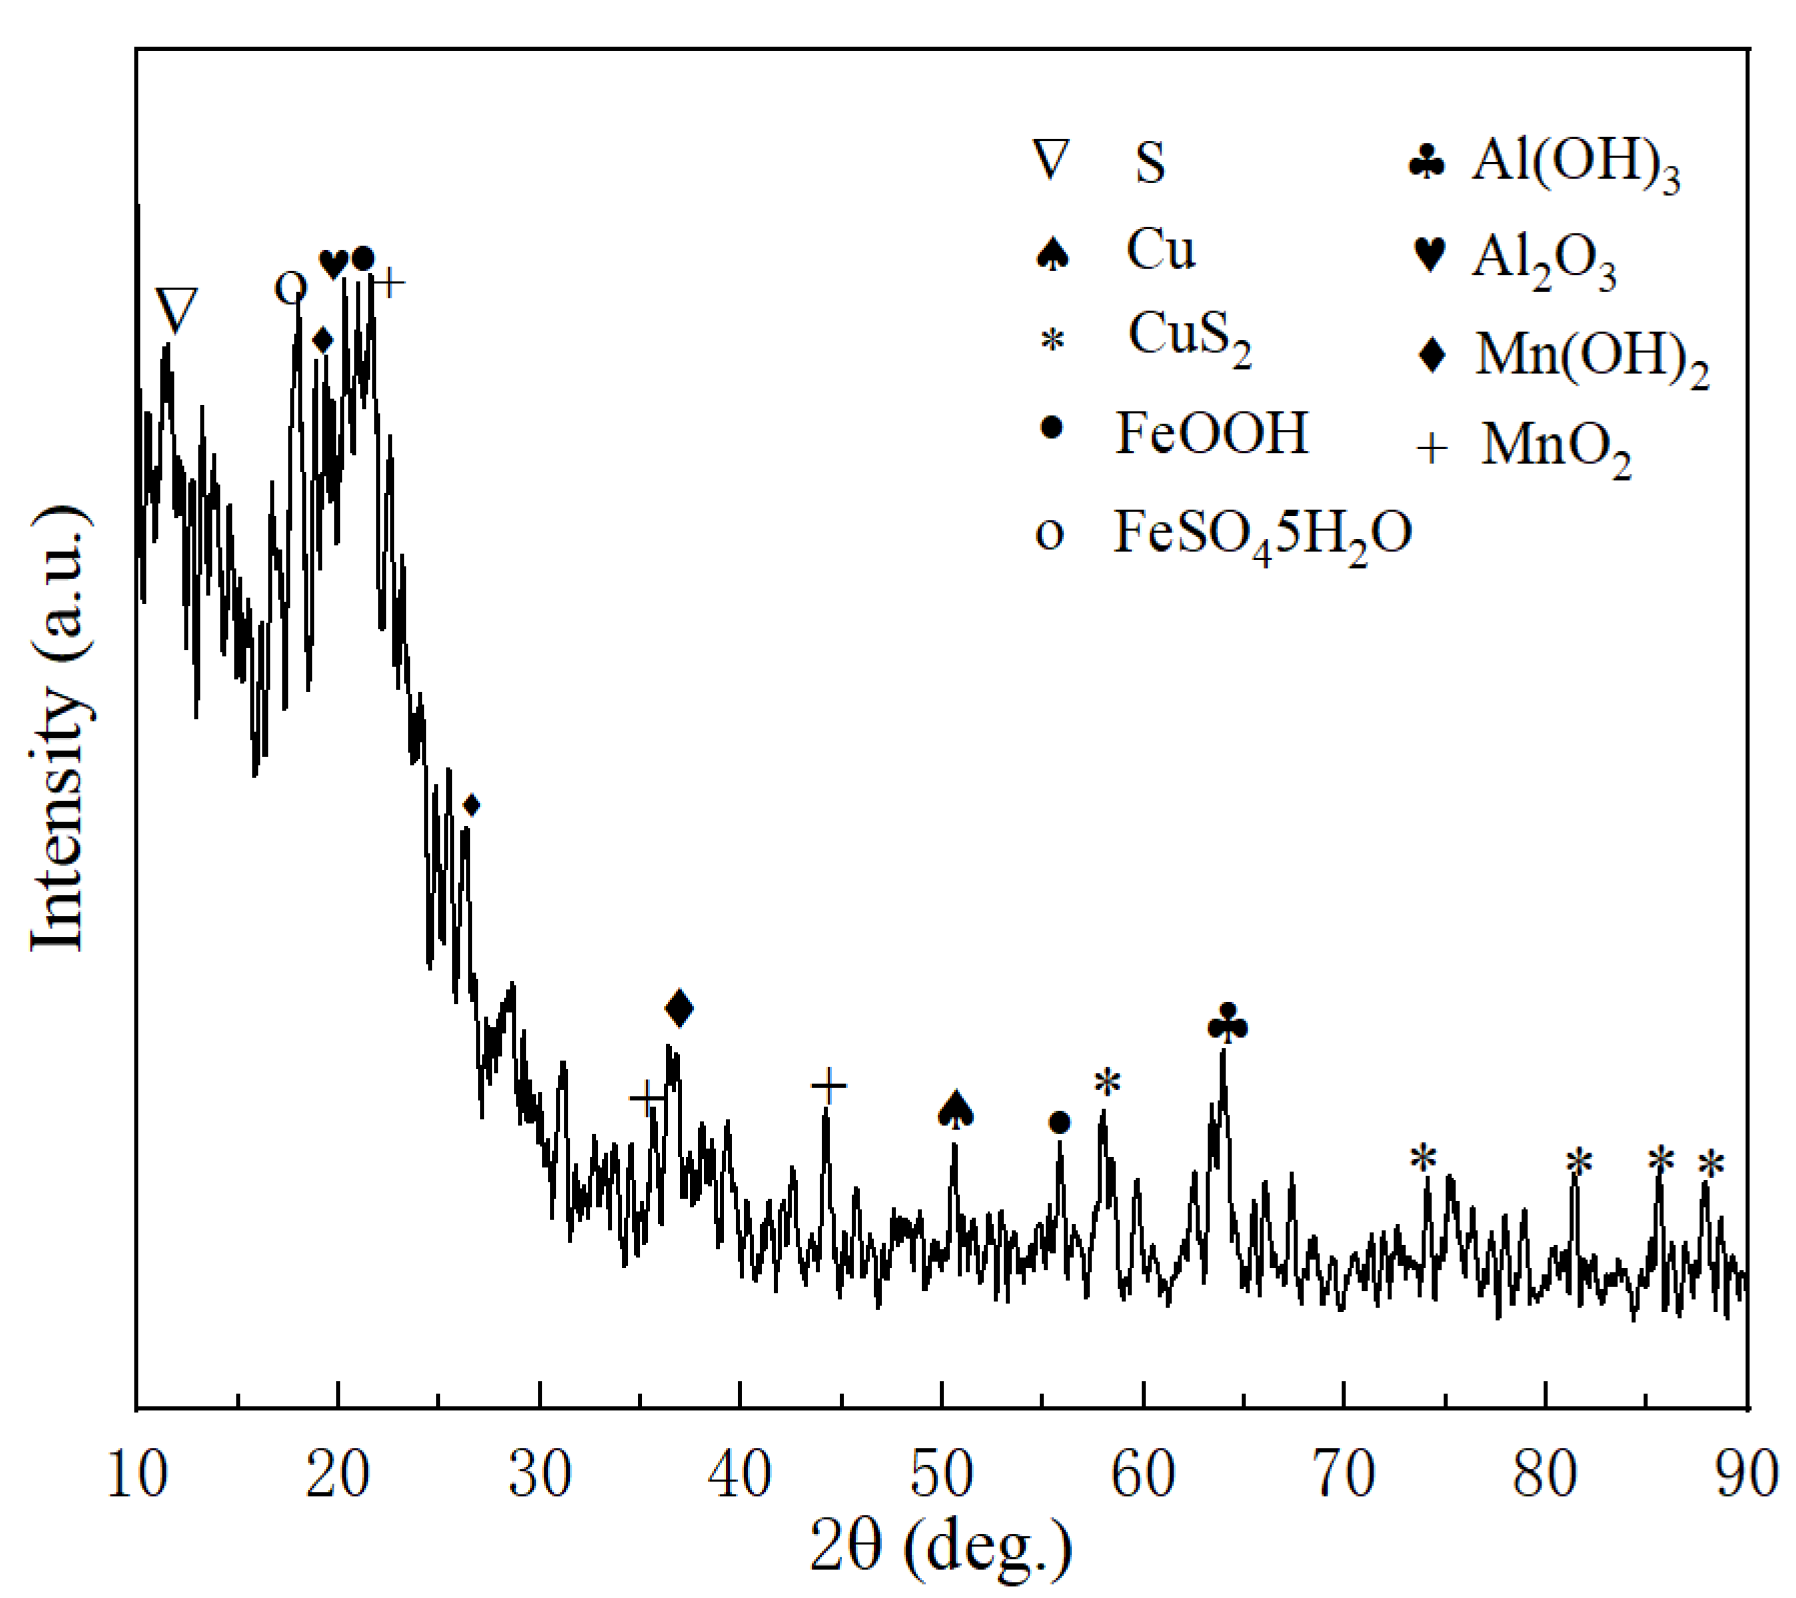
3.4. The Migration Mechanism of TiO2
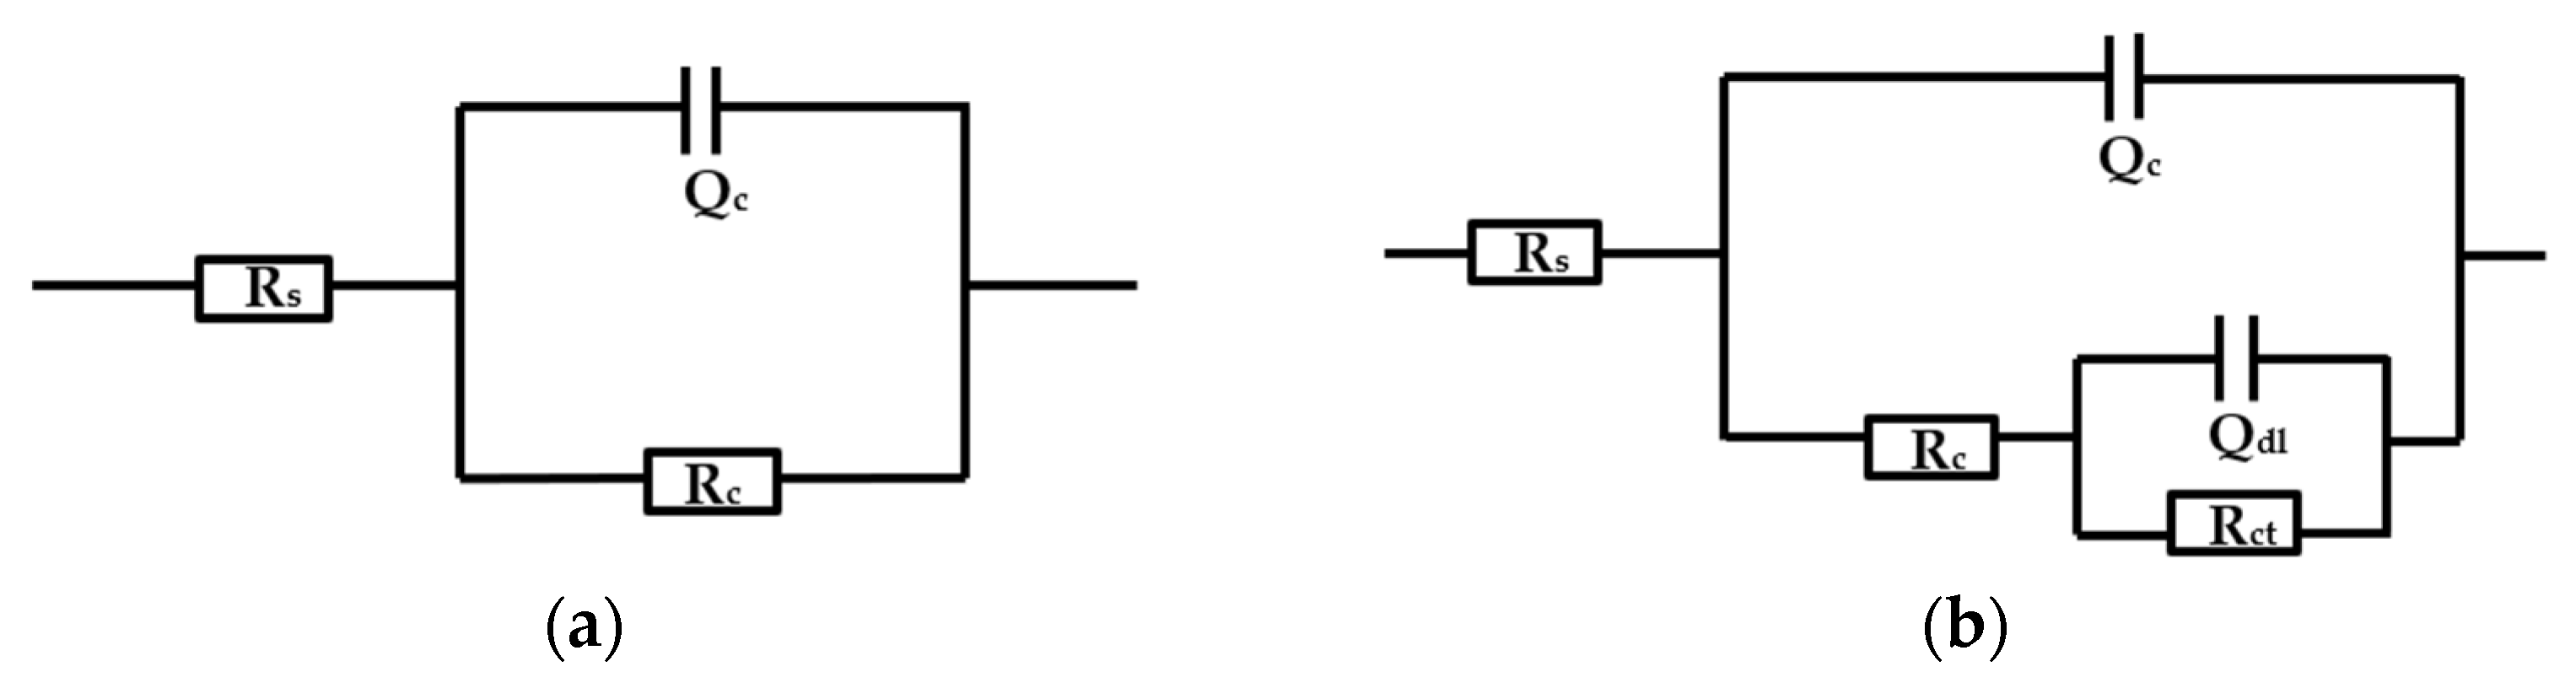
In a previous study, Noonan [15] determined that there were possibly four processes contributing to the migration of nanomaterials from composite membranes: (1) diffusion, where due to the concentration gradient, they migrate from the inside of the polymer with a higher-concentration gradient to the food simulant with a lower-concentration gradient; (2) the surface was desorbed and released from the polymer surface due to the reduced binding force of the polymer; (3) ions ere dissolved and migrated to the food simulant; and (4) the degradation of the matrix, where the migration of the degraded polymer matrix, along with the shedding of the polymer, occurred.
The results of the Fick law of diffusion show that the migration of TiO2 does not follow the diffusion; therefore, there may be other types of Ti. AFM images present the three-dimensional topography change in the film. As shown in Figure 4, the bright protruding parts are TiO2 particles present in the composite [23]. Prior to the migration (Figure 4a), TiO2 particles are uniformly distributed in the film. Following the migration (Figure 4b), the bright parts reduce and distribute unevenly. TiO2 particles evidently reduce in number at the vertical height. This suggests that TiO2 migration does not only occur on the surface of the film, but also migrates from inside the polymer matrix. At the same time, a reduction in the dark parts also illustrates the evidence of matrix degradation.
Surface morphology changes occurring in the film prior to and following migration were characterized by SEM to explore the degradation-controlled migration of TiO2 in the film. As shown in Figure 5a, the surface of the film is smooth and a small number of nano-TiO2 particles are present on the surface. By observing the appearance of the film following migration (Figure 5d), it is obvious that the surface is rough and many TiO2 particles are exposed on the surface. The result shows that the surface matrix degrades during the migration process.
At the same time, the presence of the degradation products (PET fragments containing TiO2 particles) was also observed in the TEM images we obtained (Figure 6a,b). The results further confirm that the degradation of the matrix occurred during the migration stage and the embedded TiO2 particles could migrate with the PET fragment (Figure 6b). Some of the particles aggregated into a cluster 250 nm in size or larger (Figure 6c,d).
As for the diffusion-controlled migration behavior, Bott suggested that only particles up to the size of approximately 3.5 nm in diameter may result in measurable migration [28]. Since many nano-TiO2 particles were added to the solution, they were prone to aggregate in the film. Larger particles were immobilized in the polymer matrix and did not have the potential to diffuse [29]. However, in cases where nano- or larger particles are not completely embedded but protrude from the polymer’s surface and release into the food under conditions of use is not impossible [29]. Thus, it is difficult to confirm whether the diffusion-controlled migration of nano-TiO2 particles definitely exists in the film. However, more TiO2 particles become exposed on the surface following migration, which may provide the possibility of desorption-controlled migration through a weak binding force.
In order to explore whether TiO2 present in the composite membrane migrated in the form of ion dissolution, the migration liquid, heated at a temperature of 60 °C for 10 days, was separated from the Ti ions and particles by an ultrafiltration process; the result is presented in Table 3. It is evident from the results that Ti ions and Ti-containing particles coexist in the 4% (v/v) acetic acid solution. The proportion of the Ti-containing particles to the total Ti concentration was greater than that of the Ti ions, which is consistent with the study conducted by Viviana [30]. This result differs from the other nanomaterials, such as nano-Zn [31] or -Ag [13], which mostly exist in the form of ions. This may be due to that fact that Zn and Ag are more active than Ti. The Ag0/Ag+ and Zn0/Zn2+ systems are very sensitive to the redox reaction and are easily affected by other active substances [13]. The presence of Ti ions demonstrates that part of the Ti is released into the simulant by the dissolution of the ions.
Therefore, the release of TiO2 in the film follows two mechanisms: (1) the dissolution from the film into the simulants in ions and (2) the migration into simulants in the form of polymer matrix degradation.
To accurately measure the stability of the TiO2 particles released into the simulant, the size distribution was characterized by DLS. The size distribution for the TiO2 that migrated into the simulants after 1, 10 days (60 °C) and 10 days storage is presented in Figure 7. The particle size distribution was approximately 5.0–533.0 and 18.6–834.0 nm after 1 and 10 days (60 °C), respectively. According to the results of our previous study, TiO2 was aggregated with a size of 100–200 nm in the initial film [16]. The size distributions at 1 and 10 days were much more extensive than that in the initial film. Thus, TiO2 may be released into the solution as nanoparticles or agglomerations during the migration stage, or agglomerate following this stage. If the released TiO2 particles aggregate following the migration stage, they would be presented as unstable when present in the solution.
To demonstrate the stability of TiO2 particles in 4% (v/v) acetic acid following migration, the simulant migrated for 10 days was used for 10 days and then measured. In comparison to the 10-day solution, the size distribution (9.5–1157 nm) became much more extensive and the proportion of nano-TiO2 (<100 nm) particles decreased. New aggregates appeared in the simulant. This shows that the TiO2 aggregate migrated into the simulant.
The stability of the dispersion also can be explained by the zeta potential. The zeta potential is one of the tests necessary to verify nanofluid stability through the study of nanofluid electrophoresis behavior [32]. When the electrostatic repulsion of nanoparticles increases in the dispersion, a high ζ can be generated. According to a study conducted by Lee [33], the dispersion was stable when the ζ was greater than 30 mV. The dispersion was unstable and easy to aggregate when the ζ was less than 15 mV. Additionally, the dispersion was considered to have little or no stability when ζ was approximately 0 mV.
As shown in Table 4, from 1 to 10 days, the ζ increases at a certain level. This may be due to the fact that the increased amount of TiO2 particles enhanced the dispersity of particles present in simulants. However, the measured ζ were less than 15 mV, illustrating that TiO2 is unstable and easy to aggregate in a 4% (v/v) acetic acid solution. These aggregates may be pure TiO2 aggregates or aggregates composed of PET fragments and TiO2 particles.
Therefore, the migration of Ti into the simulant is mainly presents in the form of particles, while a small amount of Ti is present in ions. The released TiO2 is unstable and prone to agglomeration, and thus the migration of TiO2 does not follow the traditional Fick law of diffusion, and is more in line with the Weibull model based on the non-Fick law of diffusion.

3.5. EIS Analysis

Since the amount of migrated titanium dioxide increased with the increase in temperature and time, the performance of the composite film also changed. Therefore, combined with the migration results, electrochemical impedance spectroscopy technology was used to observe the failure process of the anti-corrosion performance of the composite film immersed in a 4% (v/v) acetic acid solution treated at 60 ℃ for 240 h.
Figure 8 presents the impedance spectrum of food cans immersed in a 4% (v/v) acetic acid solution for 240 h. Within 12 h of the initial soaking period of the food cans, the Nyquist spectra presented a circular arc with a large curvature, the Bode spectra presented a straight line with a slope of −1, and the low-frequency impedance modulus |Z0.01 Hz| was 1.64 × 10¹⁰. With the prolongation of the immersion time, the corrosive medium penetrated the composite film layer through microporous defects present on the surface, resulting in a continuous decrease in the radius of the capacitive arc, a gradual decrease in the low-frequency impedance value, and a plateau in the low-frequency region of the Bode spectra. After soaking in the 4% (v/v) acetic acid solution for 96 h, the Nyquist spectra presented a second capacitive arc. During this stage, the acetic acid and water molecules passed through the film and entered the metal substrate [34], and surface electrochemical reactions occurred.
When the food cans were soaked for 240 h, the low-frequency impedance modulus |Z0.01 Hz| decreased to 1.44 × 10⁴, indicating that the composite film lost its protective effect, which made it easier for the titanium to migrate into the acetic acid solution, confirming that the level of migration of coated iron increased with time.
As shown in Figure 8, within 48 h of immersion, the Nyquist spectrum exhibited a single capacitive arc. The EIS spectrum of the food cans can be analyzed by the electrochemical equivalent circuit presented in Figure 9a. As the immersion time increases, the impedance spectrum exhibits two time-constant characteristics: the high-frequency capacitive impedance arc exhibits the properties of the composite film; the low-frequency capacitive impedance arc represents the iron corrosion reaction of the base metal [35], indicating that, after following the of the food can sample submerged in the 4% (v/v) acetic acid solution for 96 h, the corrosion medium reached the surface of the metal substrate through the coating defects. The EIS spectrum can be analyzed by the electrochemical equivalent circuit shown in Figure 9b [36].
According to the EIS spectrum and electrochemical equivalent circuit of the food cans soaked in the 4% (v/v) acetic acid solution, the variation in electrochemical parameters with immersion time could be accurately simulated in the experiment, such as coating resistance Rc, charge transfer resistance Rct, interfacial capacitance Qc of the film, and double-layer capacitance Qdl, as shown in Figure 10. The electrochemical parameters for different soaking times are presented in Table 5. As the immersion time increases, the electrolytes and water molecules continue to enter the micropores located on the surface of the food cans, resulting in a gradual increase in the porosity of the coating, resulting in the deterioration of the protective performance of the coating. The resistance Rc of the composite film continued to decline, while the interfacial capacitance Qc of the film continued to increase. The charge transfer resistance Rct presents a trend of increasing first and then decreasing. The increase during the early stage of the test was related to the formation of corrosion product films. The surface accumulation of corrosion products blocked the channel of the corrosion media to the substrate, while the decrease that occurred during the later stage of the experiment was due to the reaction between the corrosion solution and substrate following the infiltration stage, resulting in the rupture of the corrosion product’s film that exposed the substrate to the electrolyte solution and resulted in the further intensification of the corrosion effect. The electrical double-layer capacitance Qdl first decreased and then increased with the prolongation of the immersion time, indicating that the state of the corrosion products at this time was unstable.

3.6. Properties Analysis of the Composite Film

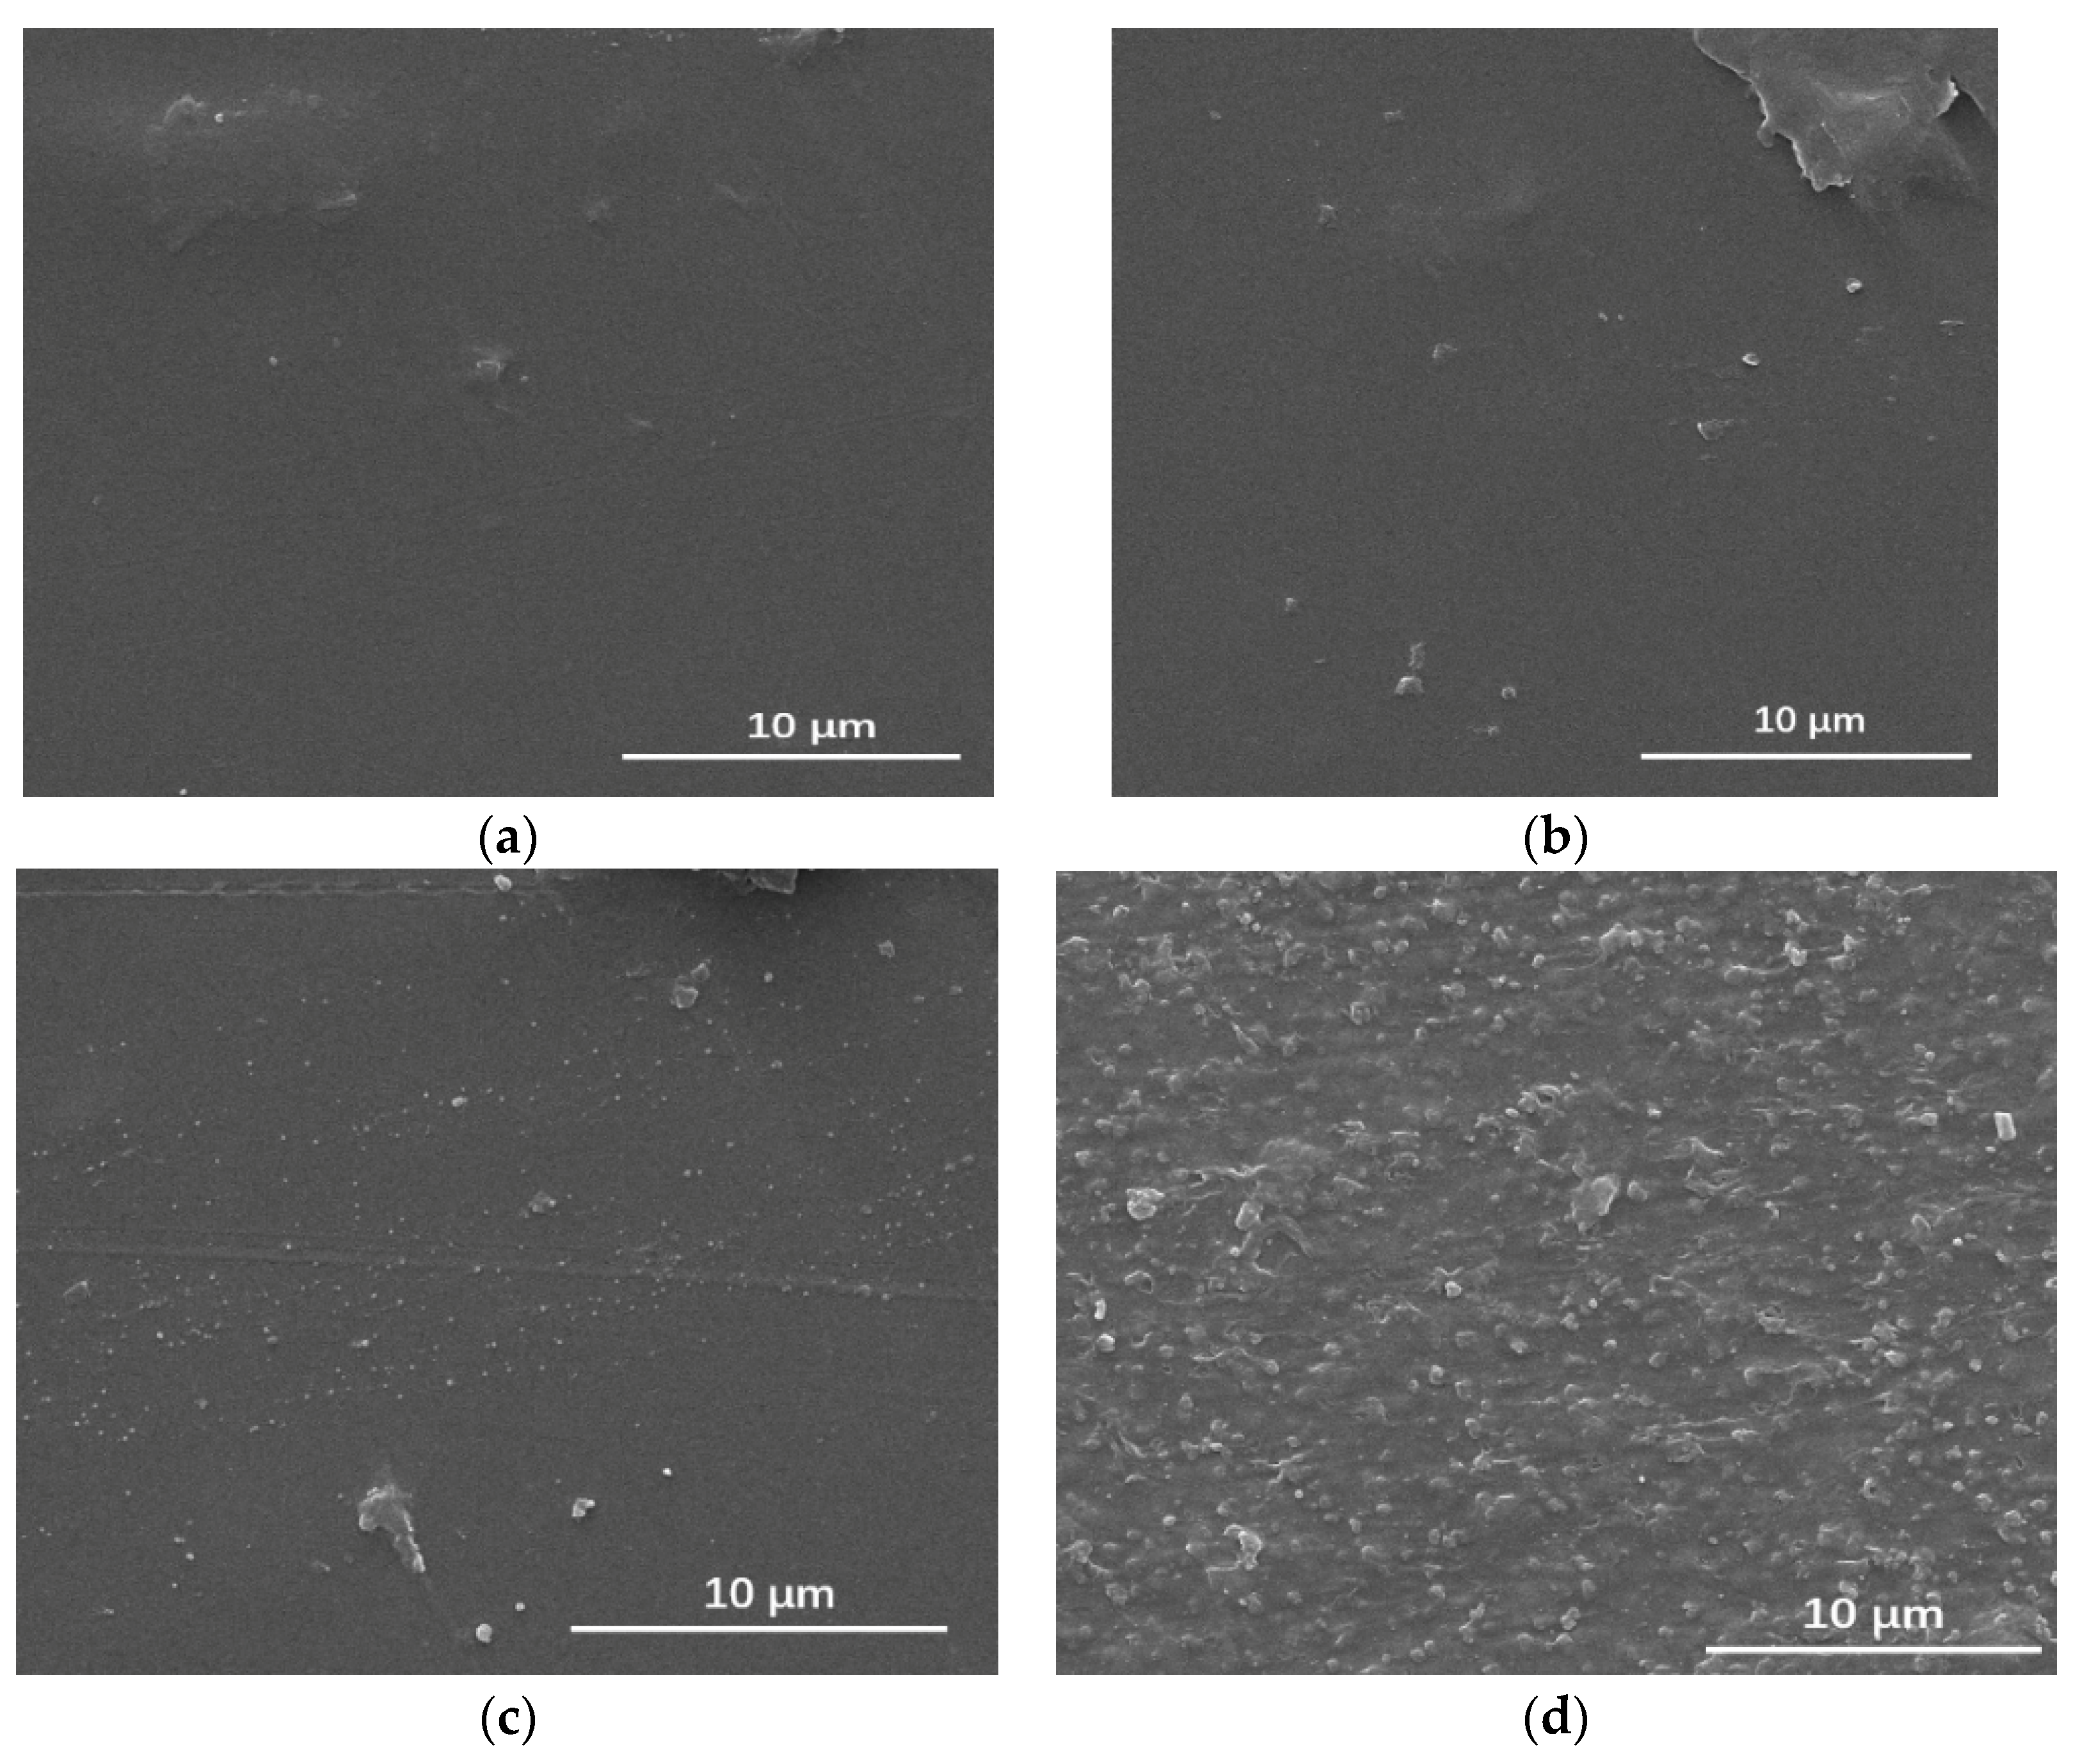
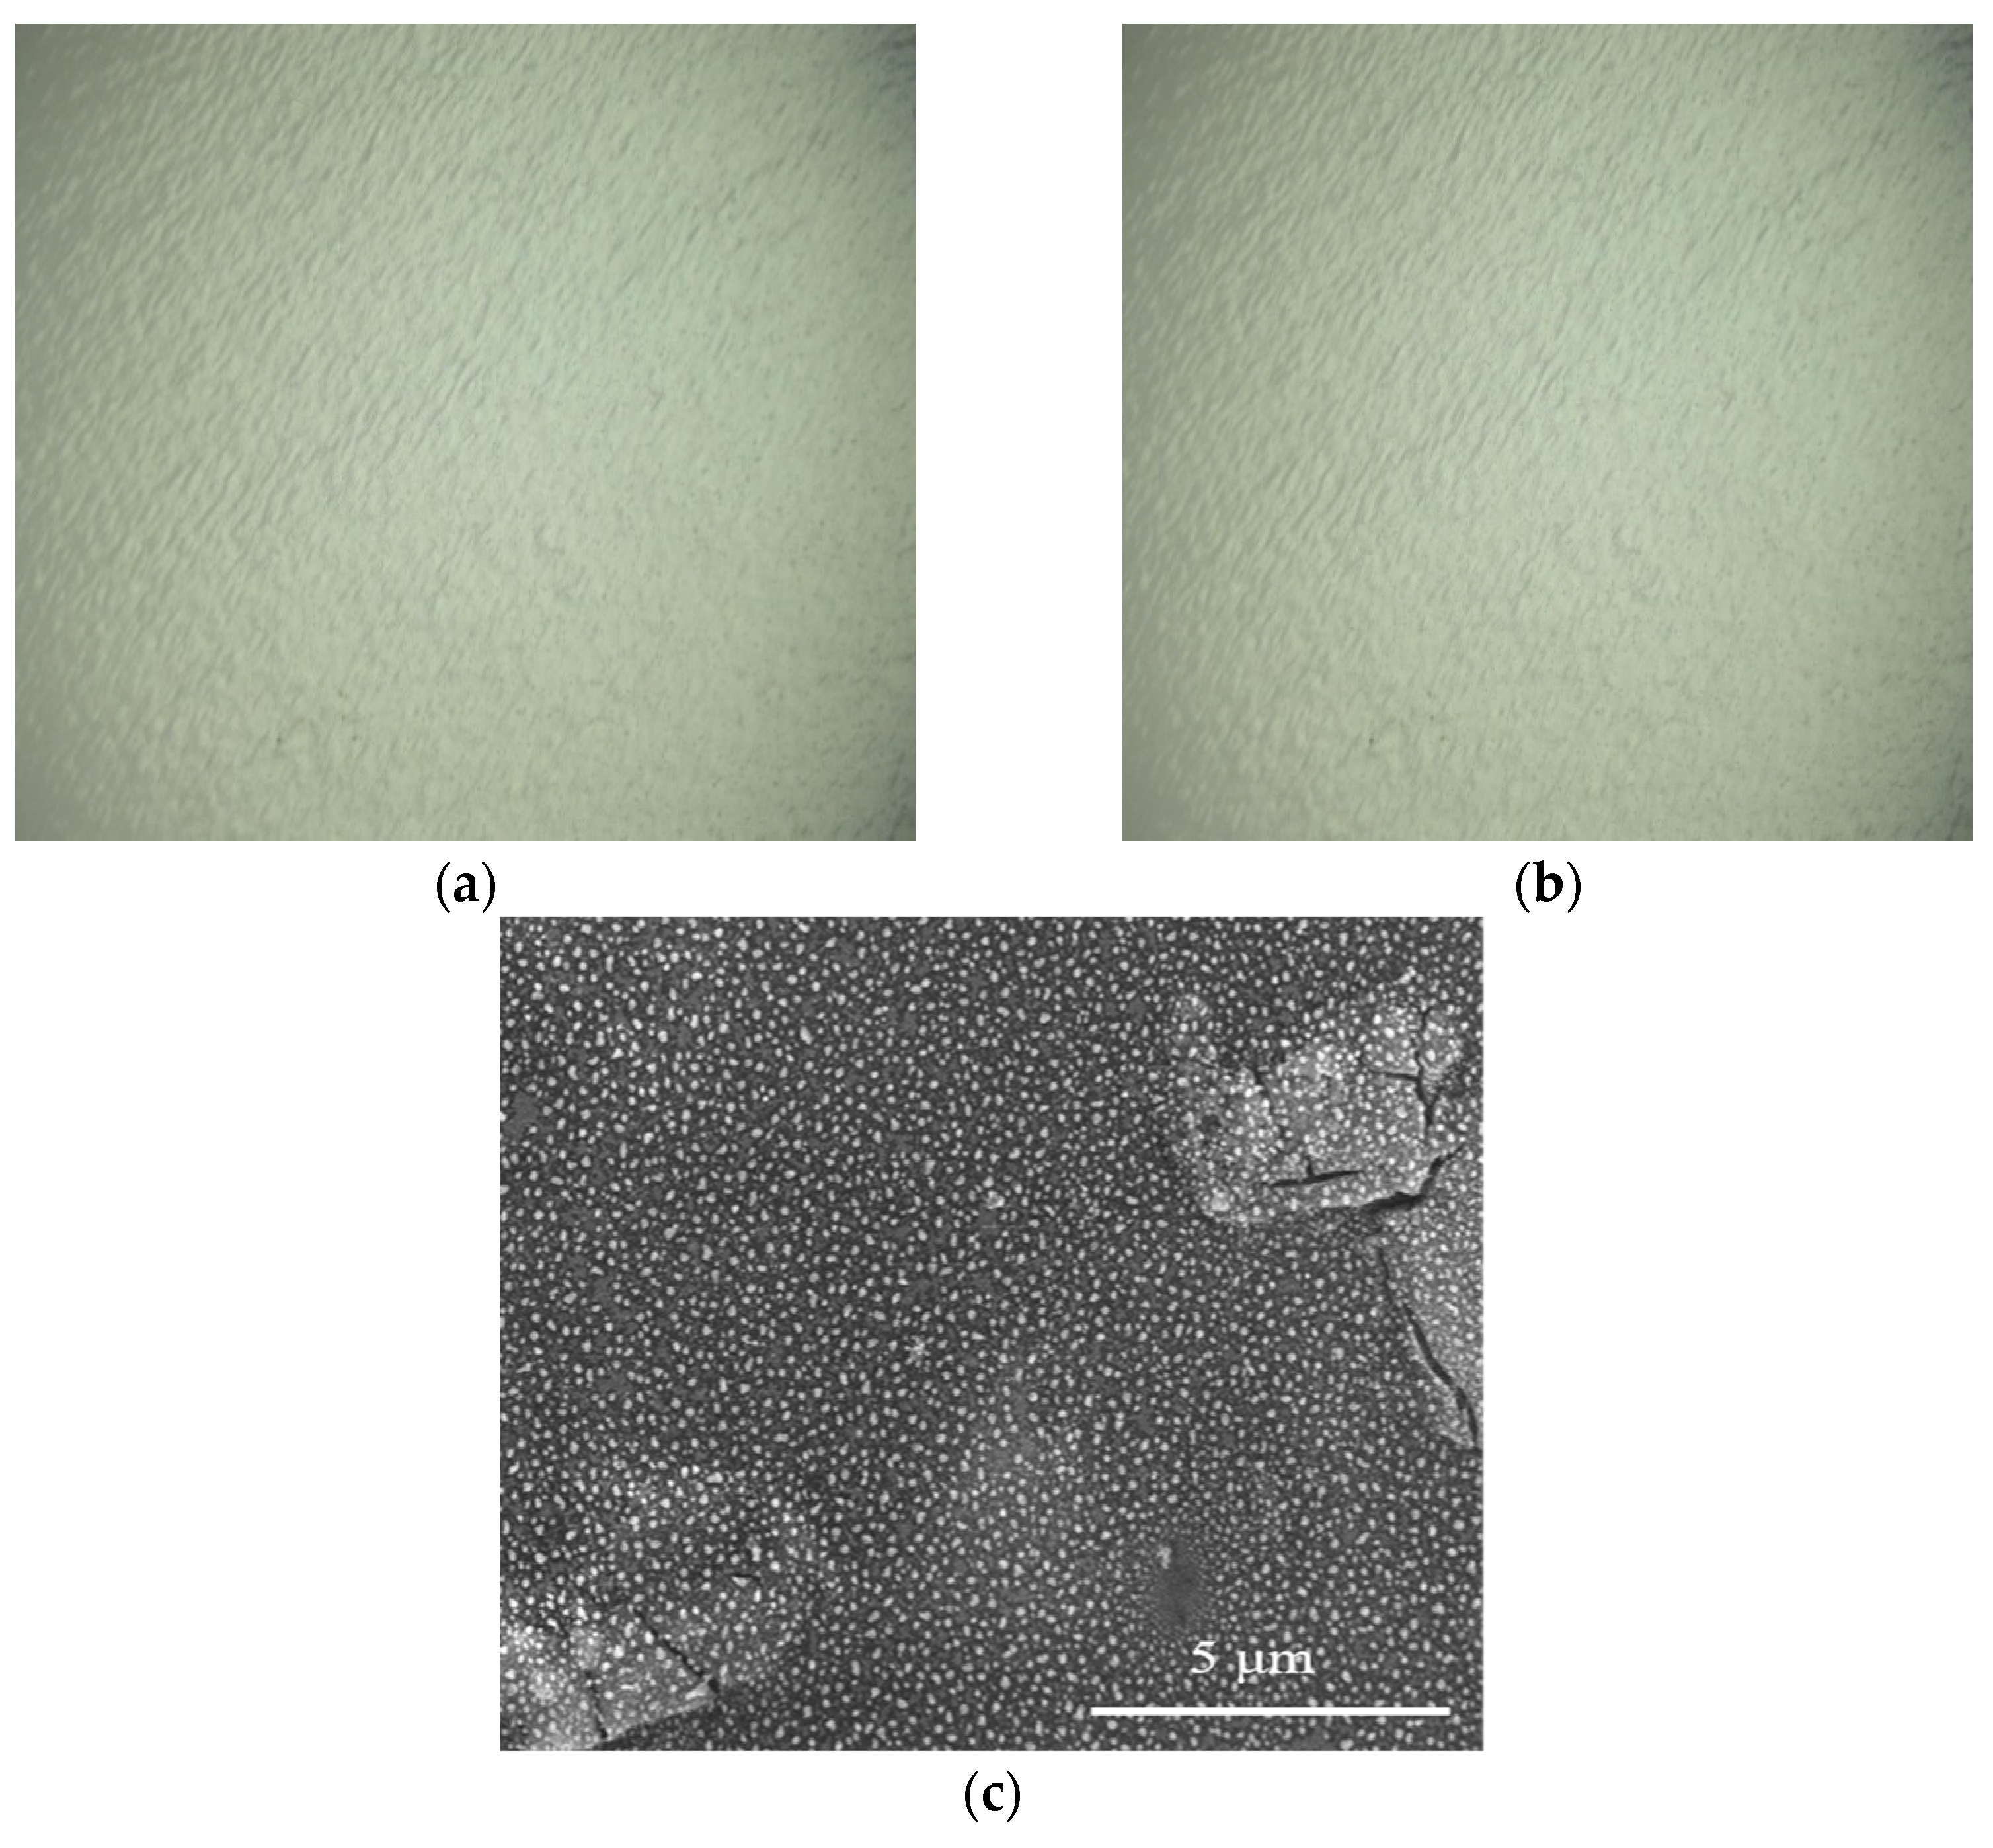
3.6.1. Surface Changes in the Composite Film

When analyzing the surface of the composite film prior to and after soaking it, we observed that its surface texture was uniform before soaking (Figure 11a), indicating the composite film has excellent corrosion resistance. When the food cans were soaked for a period of 240 h, the surface of the composite film bubbled and bulged, and the surface roughness significantly increased (Figure 11b), resulting in changes in the surface properties of the composite film. Through the SEM observation, we observed (Figure 11c) that a high number of voids and obvious corrosion holes appeared on the surface of the composite film.
In order to further analyze the performance changes in the composite film, the composite film that was soaked for 240 h was peeled off the substrate and analyzed by the XRD method. The obtained spectrum is present in Figure 12. It can be observed that the composite film contains various metal oxides, indicating that corrosion occurred under the film and the corrosion products migrated to the composite film. The corrosion that occurred under the membrane of the composite film explains the reason for the protrusion of the polyester layer and its separation from the substrate following its immersion in the acetic acid solution. This process is related to the acidic corrosion mechanism of metals. On the one hand, after acetic acid enters the metal substrate, the electrochemical corrosion of hydrogen evolution occurs, and the generation of hydrogen gas supports the composite film, thereby weakening the bonding strength between the substrate and composite film [37]. On the other hand, the generation of corrosion products continuously occupies the gap between the polymer film and substrate, thereby exacerbating the separation between the composite film and substrate. The blackening of the composite film may be related to the formation of black corrosion products CuS2, MnO2, and Fe2SO4.

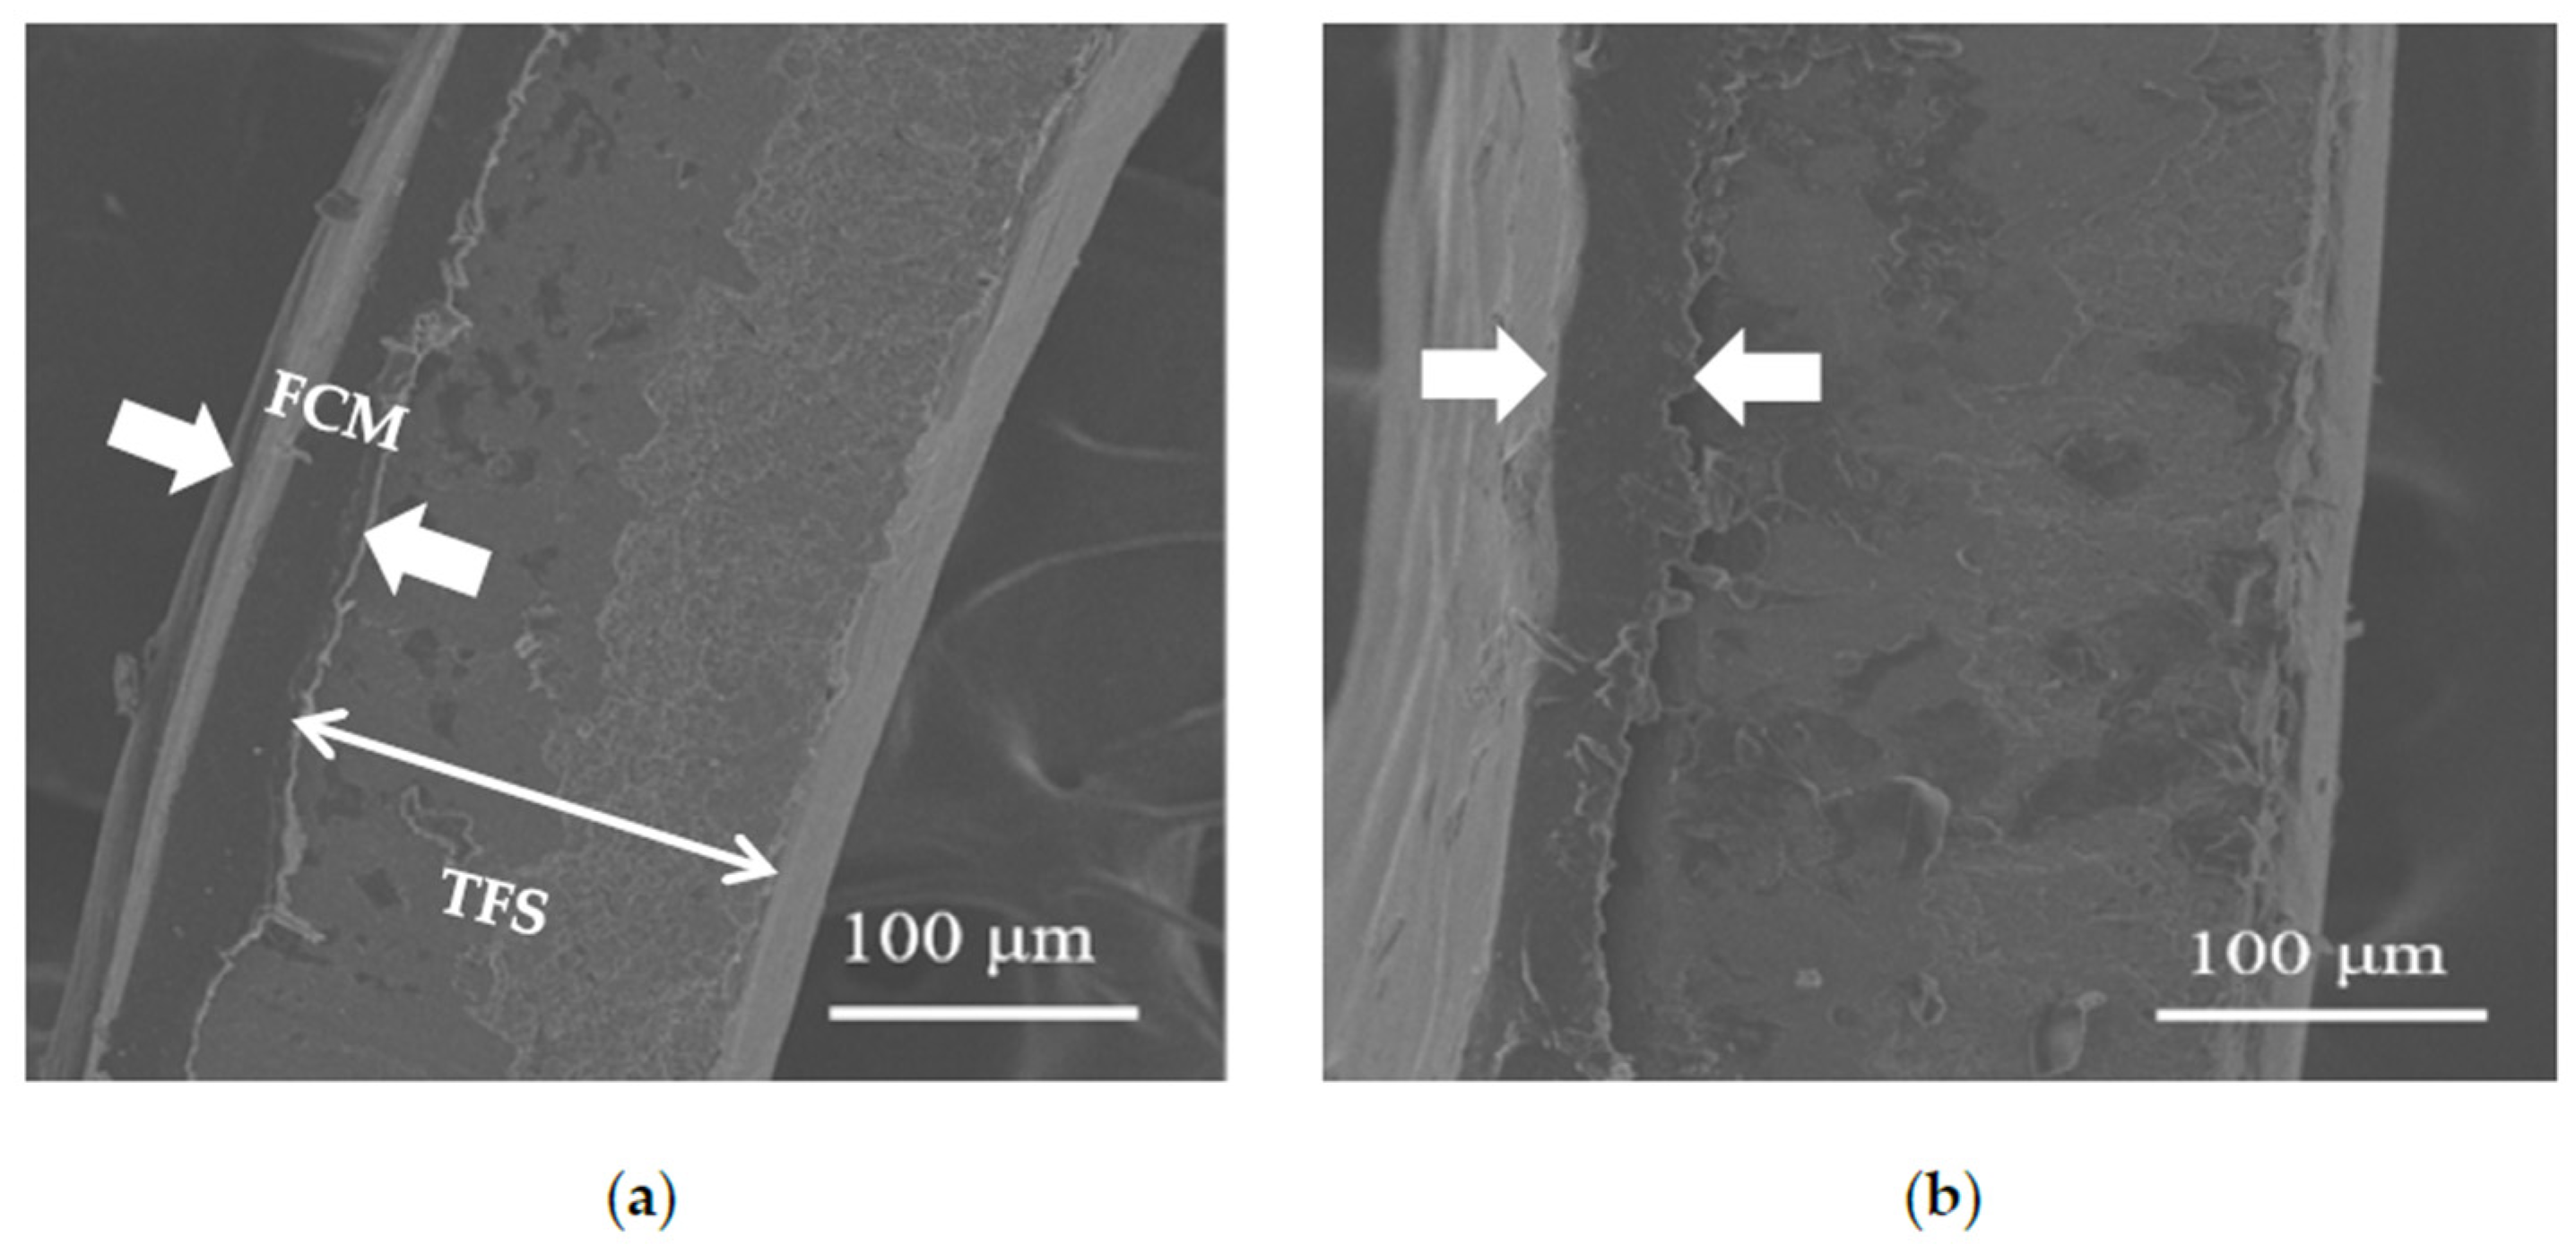
3.6.2. Cross-Sectional Structure of Polymer-Laminated Steel Cans

Through the SEM analysis of the cross-section structure of the food cans prior to and following the migration process, we observed that the total thickness of the cross-section prior to migration was approximately 200 μm. The FCM’s layer thickness was approximately 20 μm (FCM is the food contact layer inside the can) and the TFS’s layer thickness was approximately 160 μm. The outer film’s thickness was approximately 15 μm. The cross-section was smooth and the connection between the layers was strong (Figure 13a). Following the migration of the 4% (v/v) acetic acid solution, the presence of corroded products caused the separation of the FCM and TFS layers, and the cross-section became rough (Figure 13b). This result shows that acidic environments reduce the barrier’s ability to composite membranes, because acetic acid and water molecules pass through the composite film and enter the passivation layer (Cr2O3 layer). Under acidic conditions, the passivation layer gradually dissolves and generates H2, causing the composite film to bulge [38]. When the passivation layer is dissolved and perforated, both H2O and H+ chemically react with the substrate metal, accelerating the separation process of the composite film from the substrate, leading to the failure of the barrier’s performance in the composite film (as presented by the following formula):
CH 3 COOH CH 3 COO + H + ,
Cr 2 O 3 + H + Cr 3 + + H 2 O ,
Fe + H + Fe 2 + + H 2 ,
Fe 2 + + H 2 O Fe ( OH ) 2 + H + ,

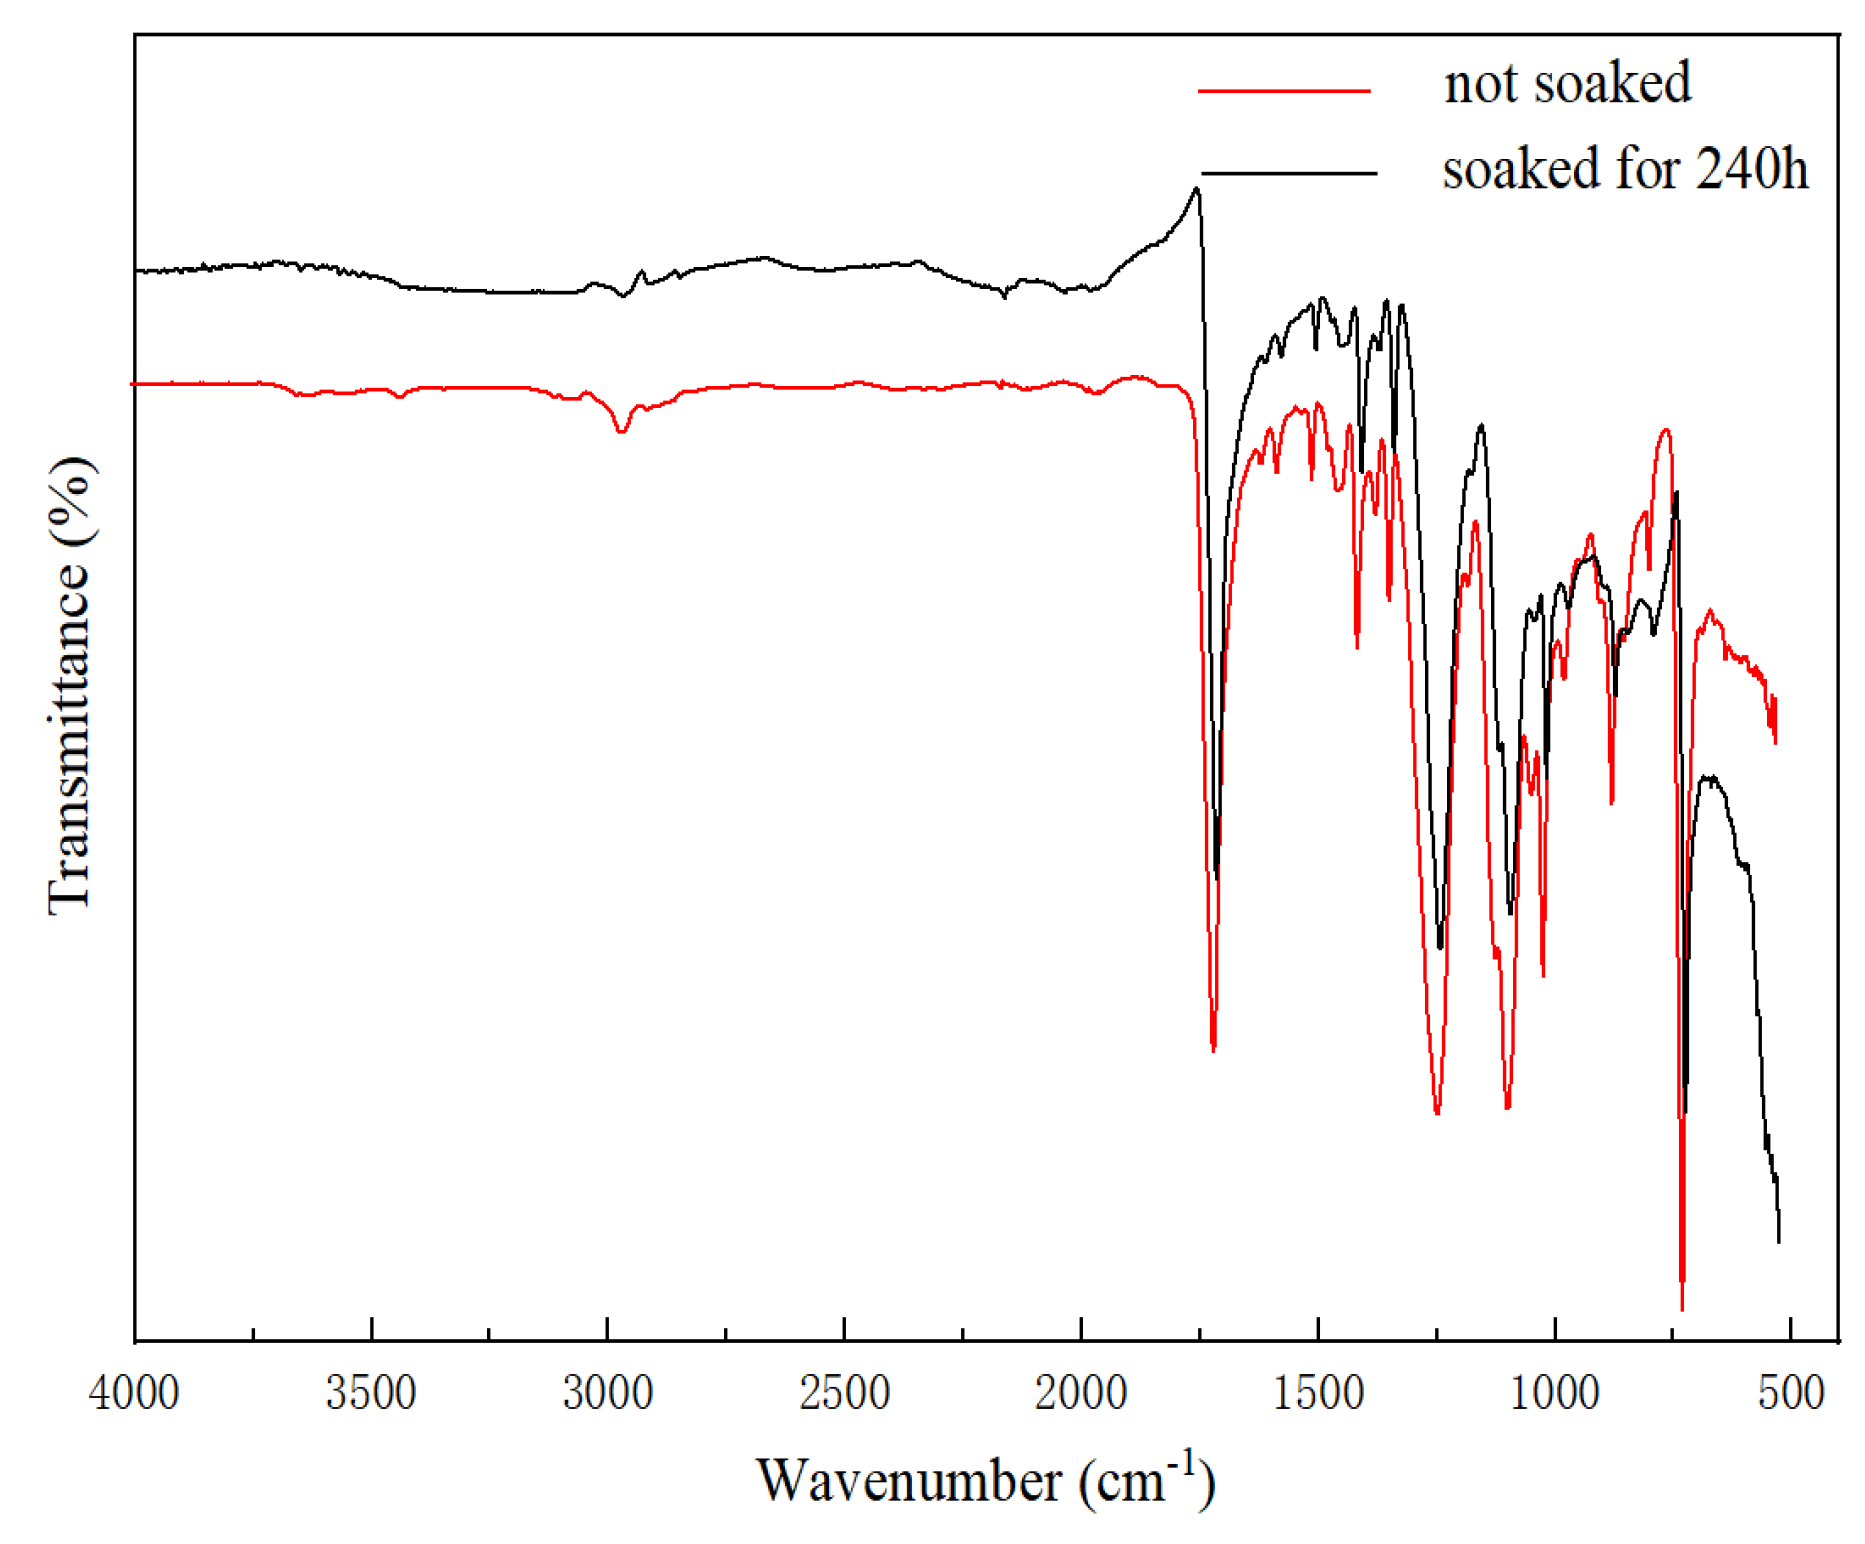
3.6.3. IR-ATR Results for the Composite Film

The structural changes occurring in the composite membrane prior to and after migration in the 4% acetic acid solution for polymer-laminated steel cans were studied by IR-ATR. The characteristic bands of chemical groups in the composite membrane can be clearly observed in Figure 14. The value of 2960 cm−1 is an asymmetric -CH3 stretching vibration peak, and 1712 cm−1 has a conjugated effect of the benzene ring, which is a C=O (C=O-OH) stretching vibration peak [39]. The C=C stretching vibration absorption peaks in the benzene ring are located at 1578, 1505, and 1449 cm−1. The C-O asymmetric stretching vibration absorption peak is located at 1239 cm−1 [40]. The C-H in-plane bending vibration absorption peak of the benzene ring is located at 1016 cm−1, the C-H in-plane bending vibration absorption peak of the benzene ring is located at 871 and 722 cm−1, and the bending vibration band of the Ti O-C bond is located in the 1242–1016 cm−1 region [41]. The characteristic bands of the TiO2 rutile group appeared to be approximately 640, 530, 400, and 340 cm−1. Since the ATR test wavelength started from a value of 520 cm−1, it could not be observed at a length shorter than 400 cm−1; however, the characteristic absorption peak of rutile TiO2 can be observed at 632 and 538 cm−1 of the composite membrane.
By comparing the two spectra produced prior to and after the migration process, it can be observed that the C-H out-of-plane bending vibration absorption peak intensity of the benzene ring at 871 cm−1 of the migrated composite film was significantly reduced, the C=C stretching vibration absorption peak in the 1578 cm−1 benzene ring was reduced, and the asymmetric -CH3 stretching vibration peak intensity at 2960 cm−1 was also reduced. This may have occurred due to the partial degradation of the PET structure caused by acetic acid immersion. The Ti-O-C bond bending vibration region at 1041−1 and the TiO2 absorption peak intensities at 632 and 538 cm−1 decreased. This result was obtained because the chemical bond strength exhibited between TiO2 and PET weakened due to TiO2 migration. The decrease in the absorption peak intensity values of the composite membrane indicated that the 4% acetic acid solution will cause damage to the structure of the composite membrane, causing it to age and degrade.

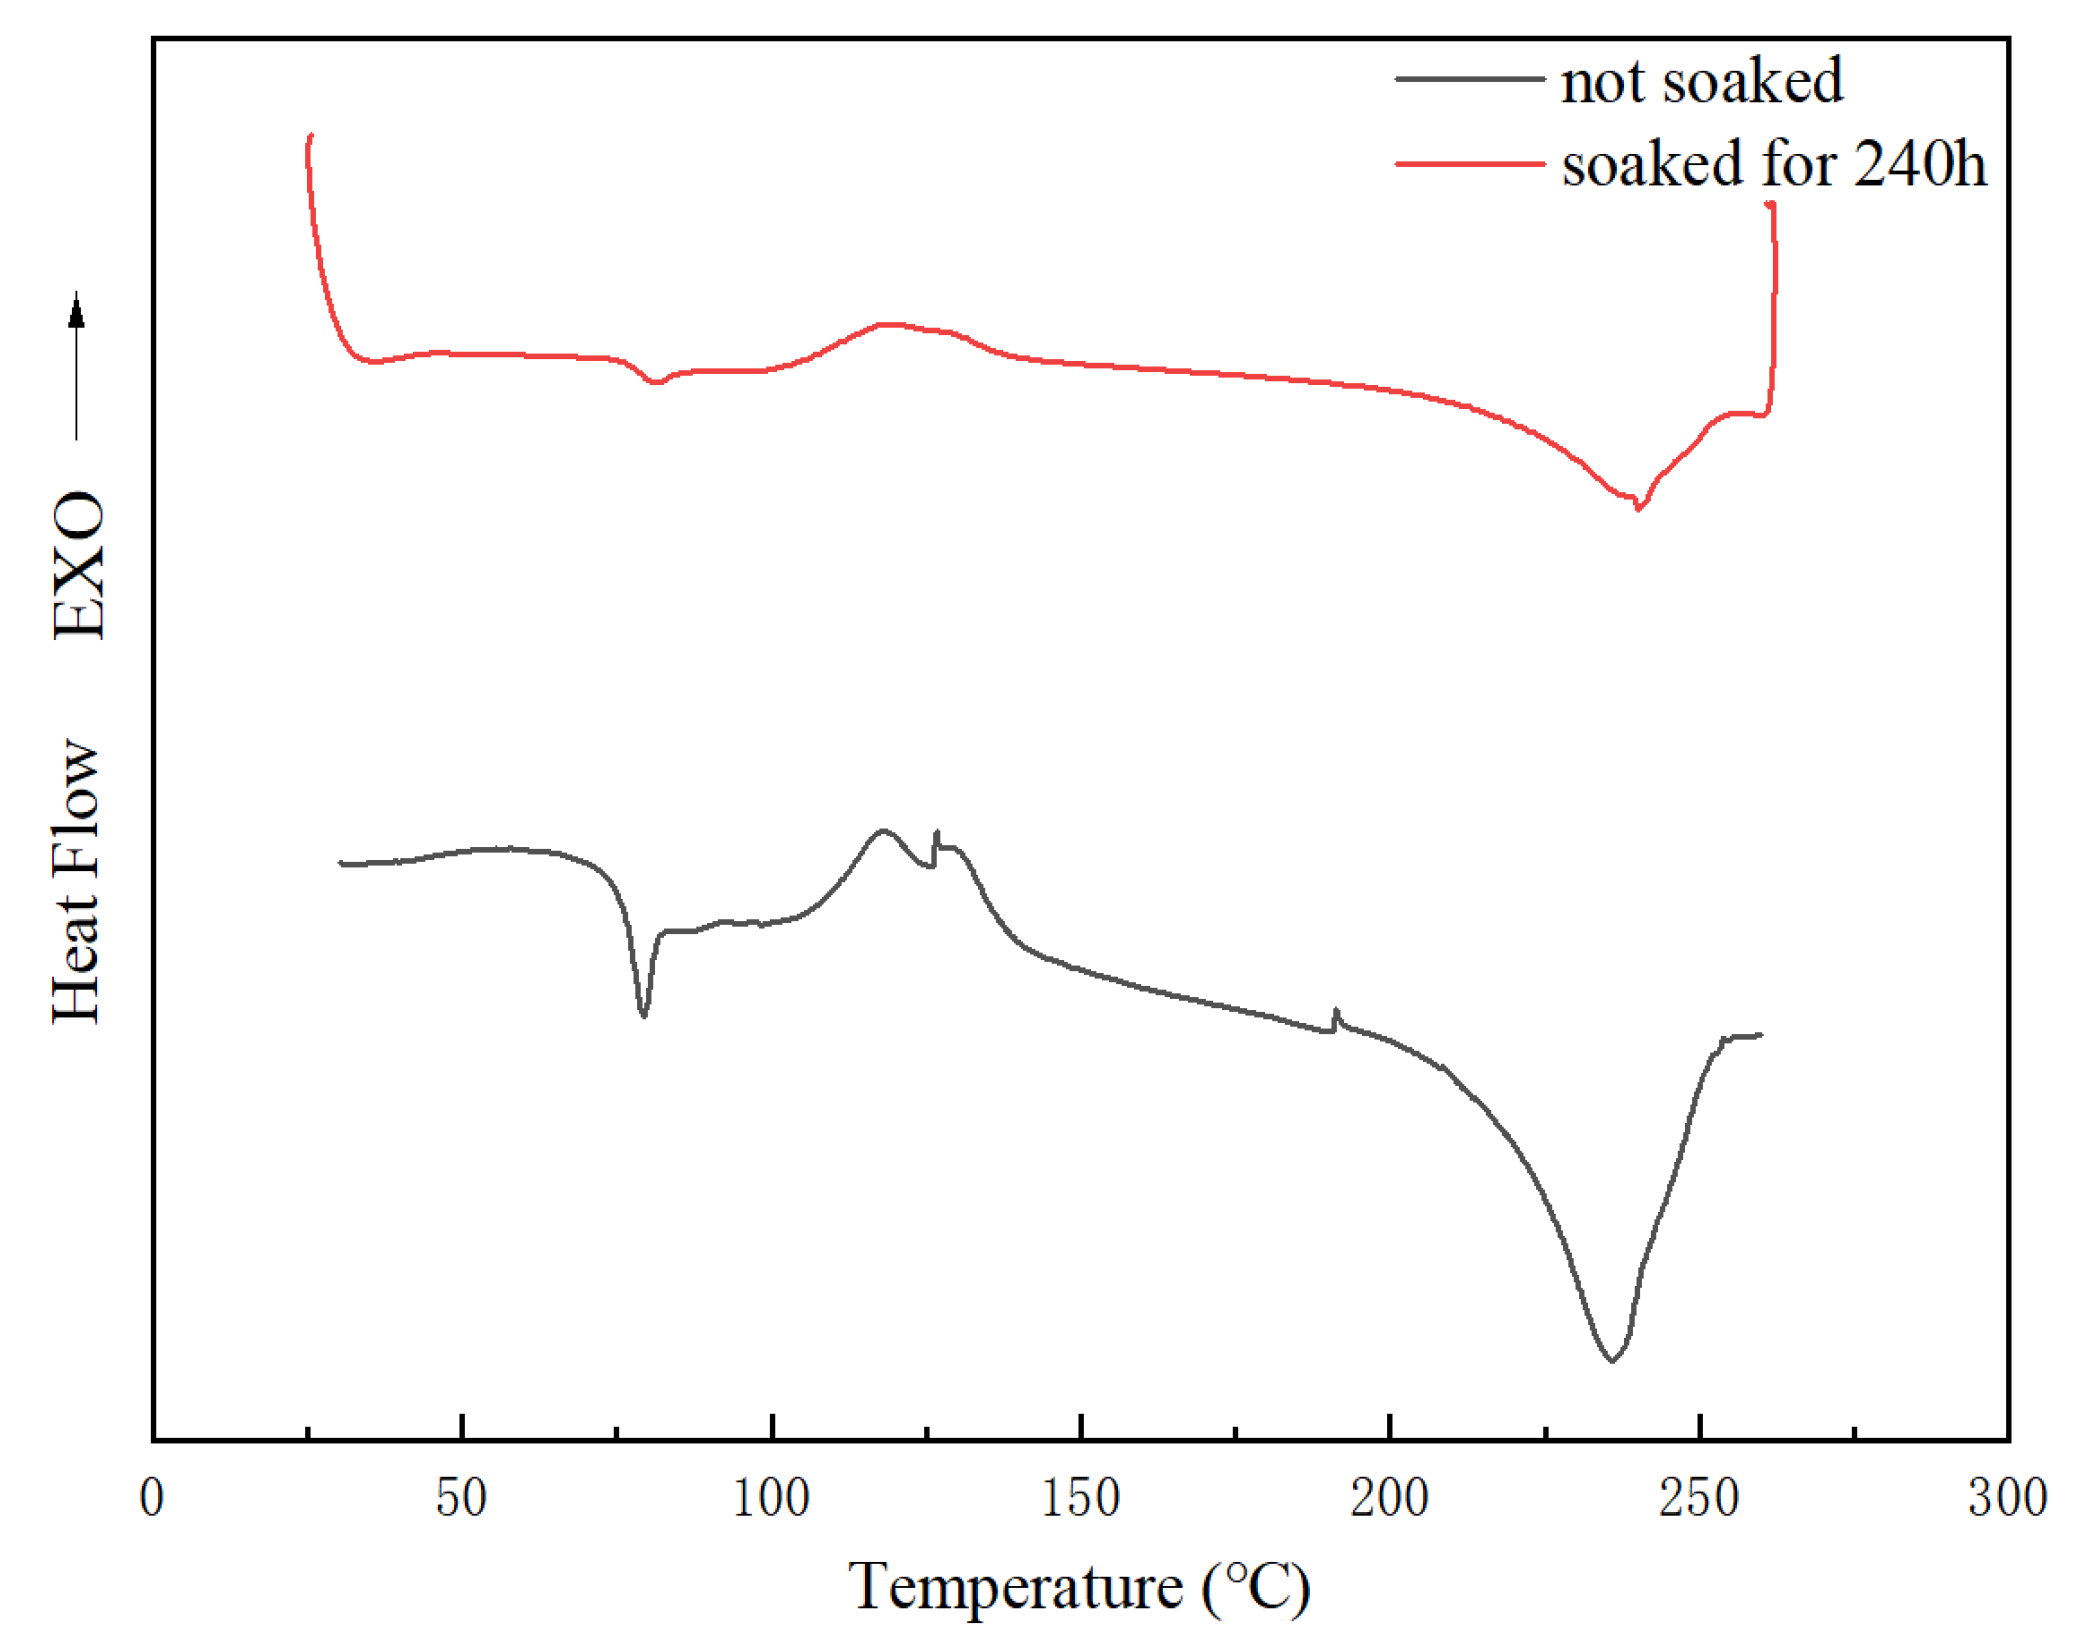
3.6.4. Thermal Properties of the PET/TiO2 Composite Film

Figure 15 presents the DSC heat-flow diagram of the composite film prior to and after the process of migration occurring in food cans, and the related thermodynamic parametric statistics are presented in Table 6. From the test results, it can be observed that, following the migration, the glass transition temperature (Tg) and crystallinity (Xc) of the composite film both decrease, while the melting temperature (Tm) increases. Xc is the crystallinity of the composite film, determined by the equation Xc = ΔHm/ΔHm°. ΔHm° is the melting enthalpy of the complete crystallization of PET, with a value of 140 J/g. This is mainly related to the performance changes occurring in the composite membrane in the acetic acid solution. Researchers have determined that NMs serve as additional nucleation sites for the heterogeneous nucleation of composite membranes. As the amount of nanomaterials added to the solution increases, there is no evidence of a significant change in the Tg of the composite membrane [42,43]; however, Xc increases correspondingly [44,45]. According to the migration results obtained for the coated iron cans submerged in the acetic acid solution, the migration of TiO2 leads to a decrease in the number of additional nucleation sites and an increase in the porosity of the composite membrane, resulting in a decrease in Xc [46]. However, prolonged solvation gradually softens and ages the composite membrane, enhancing the movement of molecules between PET chains, resulting in a decrease in Tg [47,48]. Therefore, the decrease in the Xc of the composite membrane is related to the migration of TiO2, while the decrease in Tg is related to the aging degradation process of the composite membrane. The phenomenon of increasing Tm is only related to the introduction of polar groups or intermolecular hydrogen bonds located on the main side chains of the polymers. From Figure 14, it can be observed that there is no significant enhancement of polar-group absorption peaks on the graph; therefore, this possibility can be eliminated. According to the XRD analysis, it can be determined that oxidation products migrate into the interior section of the composite membrane; therefore, the increase in Tm may be related to the residual metal oxides present in the composite membrane. Thus, as the crystallinity of the composite membrane decreases, the performance of the composite membrane changes, the structure becomes loose, and the migration activity of TiO2 into food simulants increases.

4. Conclusions

The migration of TiO2 from the PET/TiO2 composite film into a 4% (v/v) acetic acid solution shows that the migration process is affected dramatically by the factors of time and temperature. Ion dissolution and matrix degradation are the mechanisms that promote the release of TiO2 from composite films. Diffusion and surface desorption may also occur. Following the migration process, Ti ions and Ti-containing particles coexist in the 4% (v/v) acetic acid solution. The majority of the Ti is present in the form of particles, while a small amount of Ti is present in the form of ions, owing to the agglomeration of the released TiO2. The migration of TiO2 does not follow the traditional Fick law of diffusion, but is more in line with the Weibull model based on the non-Fick law of diffusion.
During the immersion process of polymer-laminated steel cans submerged in 4% acetic acid solution and used to pack food, acetic acid and water molecules enter the passivation layer (Cr2O3 layer) through the surface defects in the composite film and dissolve to produce H2, causing the composite film to bulge and weakening its barrier performance. The formation of corrosion products causes a separation between the FCM and TFS layers in the food cans.

Supplementary Materials

The following supporting information can be downloaded at: https://www.mdpi.com/article/10.3390/coatings13050887/s1, Figure S1: The standard curve of Ti measured by ICP-OES.

Author Contributions

Conceptualization, J.C. (Jingying Cui) and J.C. (Jinyang Chen); investigation and data collection, J.C. (Jingying Cui), X.H. and M.H.; writing—original draft preparation, J.C. (Jingying Cui); writing—review and editing, J.C. (Jinyang Chen); project administration and funding acquisition, J.G., Z.W. and Y.H. All authors have read and agreed to the published version of the manuscript.

Funding

The research was supported by the Program for Innovative Research Team in University (No. IRT13078).

Institutional Review Board Statement

Not applicable.

Informed Consent Statement

Not applicable.

Data Availability Statement

Not applicable.

Conflicts of Interest

The authors declare no conflict of interest.

References

  1. Garcia, C.V.; Shin, G.H.; Kim, J.T. Metal oxide-based nanocomposites in food packaging: Applications, migration, and regulations. Trends Food Sci. Technol. 2018, 82, 21–31. [Google Scholar] [CrossRef]
  2. Kickelbick, G. Concepts for the incorporation of inorganic building blocks into organic polymers on a nanoscale. Prog. Polym. Sci. 2003, 28, 83–114. [Google Scholar] [CrossRef]
  3. Li, D.D.; Ye, Q.Y.; Jiang, L.; Luo, Z.S. Effects of nano-TiO2-LDPE packaging on postharvest quality and antioxidant capacity of strawberry (Fragaria ananassa Duch.) stored at refrigeration temperature. J. Sci. Food Agric. 2017, 97, 1116–1123. [Google Scholar] [CrossRef] [PubMed]
  4. Kubacka, A.; Serrano, C.; Ferrer, M.; Lunsdorf, H.; Bielecki, P.; Cerrada, M.A.L.; Fernandez-Garcia, M.; Fernandez-Garcia, M. High-performance dual-action polymer-TiO2 nanocomposite films via melting processing. Nano Lett. 2007, 7, 2529–2534. [Google Scholar] [CrossRef] [PubMed]
  5. Li, W.; Li, L.; Zhang, H.; Yuan, M.; Qin, Y. Evaluation of PLA nanocomposite films on physicochemical and microbiological properties of refrigerated cottage cheese. J. Food Process. Preserv. 2018, 42, e13362. [Google Scholar] [CrossRef]
  6. Rim, K.-T.; Song, S.-W.; Kim, H.-Y. Oxidative DNA damage from nanoparticle exposure and its application to workers’ health: A literature review. Saf. Health Work 2013, 4, 177–186. [Google Scholar] [CrossRef]
  7. Acar, M.S.; Bulut, Z.B.; Ates, A.; Nami, B.; Kocak, N.; Yildiz, B. Titanium dioxide nanoparticles induce cytotoxicity and reduce mitotic index in human amniotic fluid-derived cells. Human Exp. Toxicol. 2015, 34, 74–82. [Google Scholar] [CrossRef]
  8. Radziwill-Bienkowska, J.M.; Talbot, P.; Kamphuis, J.B.J.; Robert, V.; Cartier, C.; Fourquaux, I.; Lentzen, E.; Audinot, J.N.; Jamme, F.; Réfrégiers, M.; et al. Toxicity of Food-Grade TiO2 to Commensal Intestinal and Transient Food-Borne Bacteria: New Insights Using Nano-SIMS and Synchrotron UV Fluorescence Imaging. Front. Microbiol. 2018, 9, 794. [Google Scholar] [CrossRef]
  9. Bradley, E.L.; Castle, L.; Chaudhry, Q. Applications of nanomaterials in food packaging with a consideration of opportunities for developing countries. Trends Food Sci. Technol. 2011, 22, 604–610. [Google Scholar] [CrossRef]
  10. Cushen, M.; Kerry, J.; Morris, M.; Cruz-Romero, M.; Cummins, E. Migration and exposure assessment of silver from a PVC nanocomposite. Food Chem. 2013, 139, 389–397. [Google Scholar] [CrossRef]
  11. Song, H.; Li, B.; Lin, Q.B.; Wu, H.J.; Chen, Y. Migration of silver from nanosilver-polyethylene composite packaging into food simulants. Food Addit. Contam. Part A-Chem. 2011, 28, 1758–1762. [Google Scholar] [CrossRef] [PubMed]
  12. Su, Q.Z.; Lin, Q.B.; Chen, C.F.; Wu, Y.M.; Wu, L.B.; Chen, X.Q.; Wang, Z.W. Effect of antioxidants and light stabilisers on silver migration from nanosilver-polyethylene composite packaging films into food simulants. Food Addit. Contam. Part A-Chem. 2015, 32, 1561–1566. [Google Scholar] [CrossRef] [PubMed]
  13. Ntim, S.A.; Thomas, T.A.; Begley, T.H.; Noonan, G.O. Characterisation and potential migration of silver nanoparticles from commercially available polymeric food contact materials. Food Addit. Contam. Part A-Chem. 2015, 32, 1003–1011. [Google Scholar] [CrossRef] [PubMed]
  14. Jovanovic, B. Critical Review of Public Health Regulations of Titanium Dioxide, a Human Food Additive. Integr. Environ. Assess. Manag. 2015, 11, 10–20. [Google Scholar] [CrossRef]
  15. Noonan, G.O.; Whelton, A.J.; Carlander, D.; Duncan, T.V. Measurement Methods to Evaluate Engineered Nanomaterial Release from Food Contact Materials. Compr. Rev. Food. Sci. Food Saf. 2014, 13, 679–692. [Google Scholar] [CrossRef]
  16. Chen, J.Y.; Dong, X.D.; Zhang, Q.; Ding, S.M. Migration of titanium dioxide from PET/TiO2 composite film for polymer-laminated steel. Food Addit. Contam. Part A-Chem. 2019, 36, 483–491. [Google Scholar] [CrossRef]
  17. European Commission. Commission Regulation (EU) No 10/2011 of 14 January 2011 on Plastic Materials and Articles Intended to Come into Contact with Food Text with EEA Relevance. 2011. p. 1–89. Available online: https://eur-lex.europa.eu/legal-content/EN/ALL/?uri=celex%3A32011R0010 (accessed on 1 January 2023).
  18. GB31604.1-2015; National Standards for Food Safety General Rules for Migration Testing of Food Contact Materials and Products. National Standards of China: Beijing, China, 2015; pp. 1–13.
  19. Yoshioka, T.; Motoki, T.; Okuwaki, A. Kinetics of hydrolysis of poly(ethylene terephthalate) powder in sulfuric acid by a modified shrinking-core model. Ind. Eng. Chem. Res. 2001, 40, 75–79. [Google Scholar] [CrossRef]
  20. Zhao, Y. Corrosion Behavior of Metal Materials in Acetic Acid. World Nonferrous Met. 2019, 532, 290–292. [Google Scholar]
  21. Lu, W.W.; Jiang, K.; Chu, Z.Z.; Yuan, M.L.; Tang, Z.Y.; Qin, Y.Y. Changes of thermal properties and microstructure of nano-ZnO/polylactic acid composite films during Zn migration. Packag. Technol. Sci. 2021, 34, 3–10. [Google Scholar] [CrossRef]
  22. Maiti, M.; Bhowmick, A.K. Effect of polymer-clay interaction on solvent transport behavior of fluoroelastomer-clay nanocomposites and prediction of aspect ratio of nanoclay. J. Appl. Polym. Sci. 2007, 105, 435–445. [Google Scholar] [CrossRef]
  23. Lin, Q.B.; Li, H.; Zhong, H.N.; Zhao, Q.; Xiao, D.H.; Wang, Z.W. Migration of Ti from nano-TiO2-polyethylene composite packaging into food simulants. Food Addit. Contam. Part A-Chem. 2014, 31, 1284–1290. [Google Scholar] [CrossRef] [PubMed]
  24. Galic, K.; Cikovic, N. Permeability characterisation of solvent treated polymer materials. Polym. Test. 2001, 20, 599–606. [Google Scholar] [CrossRef]
  25. Khajavi, M.Z.; Mohammadi, R.; Ahmadi, S.; Farhoodi, M.; Yousefi, M. Strategies for controlling release of plastic compounds into foodstuffs based on application of nanoparticles and its potential health issues. Trends Food Sci. Technol. 2019, 90, 1–12. [Google Scholar] [CrossRef]
  26. Piringer, O.G. Prediction of Diffusion Coefficients in Plastic Materials. Rev. De Chim. 2008, 59, 1186–1189. [Google Scholar] [CrossRef]
  27. Franz, R.; Gmeiner, M.; Gruner, A.; Kemmer, D.; Welle, F. Diffusion behaviour of the acetaldehyde scavenger 2-aminobenzamide in polyethylene terephthalate for beverage bottles. Food Addit. Contam. Part A-Chem. 2016, 33, 364–372. [Google Scholar] [CrossRef]
  28. Bott, J.; Störmer, A.; Franz, R. A model study into the migration potential of nanoparticles from plastics nanocomposites for food contact. Food Packag. Shelf Life 2014, 2, 73–80. [Google Scholar] [CrossRef]
  29. Franz, R.; Bott, J.; Stormer, A. Considerations for and Guidance to Testing and Evaluating Migration/Release of Nanoparticles from Polymer Based Nanocomposites. Nanomaterials 2020, 10, 1113. [Google Scholar] [CrossRef]
  30. Golja, V.; Drazic, G.; Lorenzetti, M.; Vidmar, J.; Scancar, J.; Zalaznik, M.; Kalin, M.; Novak, S. Characterisation of food contact non-stick coatings containing TiO2 nanoparticles and study of their possible release into food. Food Addit. Contam. Part A-Chem. 2017, 34, 421–433. [Google Scholar] [CrossRef]
  31. Bumbudsanpharoke, N.; Choi, J.; Park, H.J.; Ko, S. Zinc migration and its effect on the functionality of a low density polyethylene-ZnO nanocomposite film. Food Packag. Shelf Life 2019, 20, 100301. [Google Scholar] [CrossRef]
  32. Vadasz, P. Heat conduction in nanofluid suspensions. J. Heat Transf.-Trans. ASME 2006, 128, 465–477. [Google Scholar] [CrossRef]
  33. Lee, J.H.; Hwang, K.S.; Jang, S.P.; Lee, B.H.; Kim, J.H.; Choi, S.; Choi, C.J. Effective viscosities and thermal conductivities of aqueous nanofluids containing of Al2O3 low volume concentrations nanoparticles. Int. J. Heat Mass Transf. 2008, 51, 2651–2656. [Google Scholar] [CrossRef]
  34. Chu, Z.; Deng, W.; Zheng, X.; Zhou, Y.; Zhang, C.; Xu, J.; Gao, L. Corrosion Mechanism of Plasma-Sprayed Fe-Based Amorphous Coatings with High Corrosion Resistance. J. Therm. Spray Technol. 2020, 29, 1111–1118. [Google Scholar] [CrossRef]
  35. Huang, X.Q.; Li, N.; Wang, H.Y.; Sun, H.X.; Sun, S.S.; Zheng, H. Electrodeposited cerium film as chromate replacement for tinplate. Thin Solid Film. 2008, 516, 1037–1043. [Google Scholar] [CrossRef]
  36. Huang, X.Q.; Li, N. Structural characterization and properties of lanthanum film as chromate replacement for tinplate. Appl. Surf. Sci. 2007, 254, 1463–1470. [Google Scholar] [CrossRef]
  37. Hu, Q.; Zhang, G.A.; Qiu, Y.B.; Guo, X.P. The crevice corrosion behaviour of stainless steel in sodium chloride solution. Corros. Sci. 2011, 53, 4065–4072. [Google Scholar] [CrossRef]
  38. Lei, X.W.; Fu, A.Q.; Feng, Y.R.; Zhang, J.X.; Yin, C.X. Influence of HAc Concentration and Temperature on the Electrochemcial Corrosion Behavior Of Super 13Cr Stainless Steel. Corros. Prot. 2017, 38, 676–682. [Google Scholar]
  39. Mohan, V.L.; Nagendra, S.M.S.; Maiya, M.P. Photocatalytic degradation of gaseous toluene using self-assembled air filter based on chitosan/activated carbon/TiO2. J. Environ. Chem. Eng. 2019, 7, 103455. [Google Scholar] [CrossRef]
  40. Zhao, Q.; Meng, X.Y.; Hong, M.H.; Chen, J.Y. Migration characteristics of membrane components in coated iron materials for can making. Shanghai Packing 2019, 297, 51–53. [Google Scholar]
  41. Deivanayaki, S.; Ponnuswamy, V.; Ashokan, S.; Jayamurugan, P.; Mariappan, R. Synthesis and characterization of TiO2-doped Polyaniline nanocomposites by chemical oxidation method. Mater. Sci. Semicond. Process. 2013, 16, 554–559. [Google Scholar] [CrossRef]
  42. Zhang, C.J.; Cai, X.; Wang, F.M. Preparation and evaluation of the self-cleaning poly (lactic acid) (PLA) film blended with Titanium dioxide (TiO2) nano particles. Ind. Text. 2016, 67, 121–126. [Google Scholar]
  43. Luo, Y.B.; Li, W.D.; Wang, X.L.; Xu, D.Y.; Wang, Y.Z. Preparation and properties of nanocomposites based on poly(lactic acid) and functionalized TiO2. Acta Mater. 2009, 57, 3182–3191. [Google Scholar] [CrossRef]
  44. Doganay, D.; Coskun, S.; Kaynak, C.; Unalan, H.E. Electrical, mechanical and thermal properties of aligned silver nanowire/polylactide nanocomposite films. Compos. Part B-Eng. 2016, 99, 288–296. [Google Scholar] [CrossRef]
  45. Boiteux, G.; Boullanger, C.; Cassagnau, P.; Fulchiron, R.; Seytre, G. Influence of morphology on PTC in conducting polypropylene-silver composites. Macromol. Symp. 2006, 233, 246–253. [Google Scholar] [CrossRef]
  46. Li, J.P.; Li, Y.; Jiang, X.G.; Dai, J.M. Study on the Non isothermal Crystallization Performance of PET with Low TiO2 Content. China Synth. Fiber Ind. 2017, 40, 45–48. [Google Scholar]
  47. Wang, S.X.; Dai, J.M.; Si, H.; Wang, Y.H.; Wang, K. Study on the Effect of Stretch Setting Temperature on the Hygrothermal Degradation Performance of Polyester Film. Synth. Technol. Appl. 2018, 33, 6–11. [Google Scholar]
  48. Mao, X.G.; Wang, S.X.; Dai, J.M.; Li, J.P.; Si, H. The Effect of Titanium Dioxide on the Hygrothermal Aging Properties of Polyester Film. Synth. Technol. Appl. 2020, 35, 1–5. [Google Scholar]
Figure 1. The migration of TiO2 in 4% (v/v) acetic acid at 40, 50, and 60 °C.
Coatings 13 00887 g001
Figure 2. Results of the migration kinetics of TiO2 in 4% (v/v) acetic acid at different temperatures.
Coatings 13 00887 g002
Figure 3. Fitting curves of the Weibull model at different temperatures.
Coatings 13 00887 g003
Figure 4. AFM images of the film (a) prior to migration; (b) following migration in 4% (v/v) acetic acid (60 °C for 10 days).
Coatings 13 00887 g004
Figure 5. The SEM images of the PET-TiO2 composite film varies with the migration time: (a) 0, (b) 0.5, (c) 4, and (d) 10 d at 60 ℃.
Coatings 13 00887 g005
Figure 6. The TEM images of (a) a polymer fragment and TiO2 particles; (b) nano-TiO2 particles embedded in the fragment; (c,d) aggregation of TiO2 particles.
Coatings 13 00887 g006
Figure 7. Size distributions of the TiO2 that migrated from films into 4% (v/v) acetic acid at 60 °C.
Coatings 13 00887 g007
Figure 8. EIS plots of the polymer-laminated steel cans: (a) Nyquist plot; (b) Bode plot.
Coatings 13 00887 g008
Figure 9. Equivalent electrical circuits for the coatings at different stages of immersion: (a) Stage one; (b) Stage two.
Coatings 13 00887 g009
Figure 10. Variations in the fitting impedance parameters with immersion time: (a) coating resistance Rc; (b) interfacial capacitance Qc; (c) charge transfer resistance Rct; and (d) double-layer capacitance Qdl.
Coatings 13 00887 g010
Figure 11. Surface morphology of the composite film prior to (a) and after soaking (b) for 10 days; (c) SEM images of (b).
Coatings 13 00887 g011
Figure 12. XRD analysis diagram of the PET-TiO2 composite film after soaking for 240 h.
Coatings 13 00887 g012
Figure 13. Cross-section morphologies of polymer-laminated steel can prior to and after soaking: (a) prior to soaking and (b) after soaking for 10 days.
Coatings 13 00887 g013
Figure 14. The IR-ATR spectra of the PET-TiO2 composite film prior to and after the soaking stage.
Coatings 13 00887 g014
Figure 15. DSC heating curve of the PET-TiO2 composite film prior to and after the soaking stage.
Coatings 13 00887 g015
Table 1. Determination of recovery and RSD values by ICP-OES (n = 6) in 4% (v/v) acetic acid.
Spiked Concentration of TiO220 μg/L100 μg/L 500 μg/L
Recovery10398105
RSD (%)1.73.52.2
Table 2. Fitting parameters of the Weibull model.
Temperature
(°C)
τβC
(mg/kg)
Experimental Value (mg/kg)R2
40204.30.670.270.180.9571
50136.10.590.280.210.9069
60323.20.530.540.320.9303
Table 3. Concentrations of Ti ions and Ti-containing particles in simulants following migration for 10 days (n = 3).
Temperature
(°C)
ParallelTi Ions (mg/kg)Ti-Containing Particles (mg/kg)Total Ti
(mg/kg)
6010.110.210.32
20.070.200.27
30.070.180.25
Table 4. The zeta potential (absolute value (mV)) for simulants (n = 3).
Temperature
(°C)
Zeta Potential (Absolute Value (mV))
1 Day10 DaysPlaced for 10 Days
605.85.59.012.510.19.55.38.07.5
Table 5. Summary of the electrochemical parameters for different immersion times.
Time (h)12244896144192240
Rc (Ω·cm2)5.074 × 1093.225 × 1096.17 × 1082.472 × 1082.5078 × 1068.1361 × 1051.1056 × 104
Qc (μF·cm2)7.832 × 10−107.598 × 10−107.642 × 10−107.696 × 10−101.022 × 10−99.29 × 10−101.586 × 10⁻⁹
Rct (Ω·cm2)---1.2682 × 1071.3957 × 1072.9846 × 1054096
Qdl (μF·cm2)---3.0855 × 10−71.4903 × 10−83.0588 × 10−77.7898 × 10−5
Table 6. Thermodynamic parameters of the composite film prior to and after migration.
Composite FilmTg (°C)Tm (°C)ΔHm (J/g)Xc (%)
Prior to migration76.4236.226.2718.76
After migration74.9240.19.0626.47
Disclaimer/Publisher’s Note: The statements, opinions and data contained in all publications are solely those of the individual author(s) and contributor(s) and not of MDPI and/or the editor(s). MDPI and/or the editor(s) disclaim responsibility for any injury to people or property resulting from any ideas, methods, instructions or products referred to in the content.

