Article

Experimental Investigation of the Initial Stage of the Oxidation Mechanism of Co Coating for Solid Oxide Fuel Cell Interconnects at 650 °C

1
School of Mechanical Engineering, Beijing Institute of Technology, Beijing 100081, China
2
State Key Laboratory of Automotive Safety and Energy, Tsinghua University, Beijing 100084, China
3
Beijing Swift New Energy Technologies Co., Ltd., Beijing 100192, China
*
Author to whom correspondence should be addressed.
Coatings 2023, 13(7), 1144; https://doi.org/10.3390/coatings13071144
Submission received: 6 May 2023 / Revised: 22 June 2023 / Accepted: 23 June 2023 / Published: 24 June 2023

Abstract

:
The evolution of Co coating in solid oxide fuel cells (SOFCs) under low and medium temperatures (<700 °C) is different from that under high temperatures. In this context, the oxidation corrosion of 441 ferritic stainless steel (FSS) with a Co coating in air under 650 °C was investigated. The results indicated that the Co coating was oxidized rapidly and a Co3O4 spinel layer formed in the initial exposure of 5 min, which improved the oxidation resistance of 441 steel. After oxidation at 650 °C for 120 h, a Cr2O3 layer with a thickness of 0.2–0.4 μm was observed on the surface of bare 441 steel, while the surface oxide scale of Co-coated 441 steel samples was composed of an inner Cr2O3 and Fe2O3 solid solution (0.1–0.3 μm thick), an intermediate (Fe, Co)3O4 layer and an outer Co3O4 spinel layer, respectively. The Co-coated 441 steel sample exhibited better electrical properties. After oxidation at 650 °C for 120 h, the area-specific resistance (ASR) of the Co-coated steel was 3.73 mΩ·cm2, which was 25.4% lower than that of bare 441 steel as 5 mΩ·cm2. Furthermore, the thermal growth process and protection mechanism of Co coating at 650 °C were discussed.

1. Introduction

An interconnect is a key component of a solid oxide fuel cell (SOFC), connecting cells in series to form a stack and often accounting for 30%–45% of the total cost. With the development of low and medium temperature SOFC operating at a temperature less than 700 °C, ferritic stainless steels (FSSs) with a low cost and a high mechanical/thermal stability have been employed as interconnects and metal supports [1]. However, there are still some bottlenecks to be solved under SOFC operating temperature, such as air electrode poisoning due to Cr(VI) volatilization [2] and conductivity reduction owing to excessive growth of a Cr2O3 layer with low conductivity [3].
To achieve the requirement of a 40,000 h lifetime, it is necessary to apply an oxidation resistance coating to the metal surface on the oxygen electrode side. Cobalt is a coating material of interest. The conductivities of its oxides CoO, Co3O4 and CoCr2O4 at 800 °C were about 6–8 S·cm–1, two orders of magnitude higher than Cr2O3 [4]. The steel strip pre-coated with a Co layer can be compressed into the desired interconnect shape with a good inhibition of the evaporation of Cr(VI), which is adequate for the large-scale production of coated interconnects [5]. The Co-coated FSS usually experiences a rapid oxidation of Co at the early stage of exposure, and the oxidation rate of the steel decreases after the formation of a protective oxide layer on the surface. Co is a p-type dopant. Due to the diffusion of elements during high temperature oxidation, the oxide scale on the surface of Co-coated steel displays a structure comprising an inner Cr2O3 layer, followed by a layer of mixed spinel oxides including Cr, Fe and Mn, and an outer Co3O4 layer. On the one hand, the Co3O4 layer can act as a barrier for the inward diffusion of O, which reduces the oxidation of elements in the matrix. Therefore, ASR decreases with a thinner layer of Cr2O3, which dominates the interface resistance. For instance, after oxidation in air at 800 °C for 1008 h, SUS 444 coated with Co had an ASR as low as 15.2 mΩ·cm2 [6]. On the other hand, a dense layer of Co3O4 can be used as an effective barrier for Cr volatilization and can thus prevent the reaction of volatile Cr(VI) substances with materials in the oxygen electrode such as (La, Sr)(Co, Fe)O3, reducing the polarization resistance [7]. Liu et al. [8] used the pack cementation technique to prepare an Co coating in argon atmosphere, and obtained a coating with CoFe2O4 spinel as the main component after high-temperature oxidation at 800 °C. The formation of CoFe2O4 spinel layer acted as a barrier to prevent the outward diffusion of Cr3+ and the inward diffusion of O2–, thus improving the oxidation resistance and electrical properties of AISI 430. After isothermal oxidation at 800 °C for 675 h, the weight gain of the Co-coated sample was 0.415 mg·cm−2, and the ASR was 73.68 mΩ·cm2, which was much lower than that of the uncoated sample, the weight gain of which was 1.613 mg·cm−2 and the ASR was 236.88 mΩ·cm2. The Co-based coating on the surface of AISI 429 ferrite steel showed excellent resistance to cracking and spalling during a cyclic oxidation test up to 750 °C [9]. Sandvik Materials Technology used the roll-to-roll physical vapor deposition (PVD) process to prepare a nanocoating of Ce (10 nm)/Co (600 nm) on AISI 441 steel [10]. It was found that Ce/Co coating was more effective than a Ce/Cu coating in suppressing Cr(VI) volatilization after oxidation at 650 °C with 3% water vapor for 1000 h [11]. After 38,000 h of oxidation in air at 800 °C, AISI 441 steel with a Ce/Co coating remained stable, and had a lower average Cr evaporation rate (2.5 × 10⁻⁵ mg·cm–2·h–1) than uncoated steel, and the average ASR value was only 34 mΩ·cm2 [12].
The element diffusion between the metal substrate and coating and the corresponding oxidation kinetics during the long-term operation process are temperature-dependent, generally showing a positive correlation [13,14]. At 650 °C and 750 °C, the evaporation of Cr in AISI 441 steel is parabolic with time, based on the diffusion controlled kinetics. However, at 850 °C, the evaporation kinetics exhibited a linear trend, indicating that the evaporation of Cr switched to a surface-limiting process [15]. When the temperature is high, the Cr diffusion rate increases and the Cr2O3 oxide scale increases rapidly, which is the main contribution of ASR. The Co3O4 coating prepared on Crofer 22 APU FSS was oxidized at 800 °C for 500 h, and the Co3-xCrxO4 and CoCr2O4 oxides were formed on the surface, leading to an inevitable evaporation of Cr(VI) [16]. The oxides of Co exhibit semiconducting behavior. This conductivity can be explained by the small polaron conduction within the lattice, which increases evidently as the temperature is elevated [17]. After oxidation in hot air for 500 h, the electrical conductivity of Crofer 22 APU steel samples coated with Co (3–4 μm) was 44–50 S·cm–1 and 54.64 S·cm–1 when measured at 650 °C and 800 °C, respectively [18].
The Cr diffusion rate decreases and the Cr2O3 scale becomes thinner as the operation temperature drops. The oxide scale may have a different structure from that operating under high-temperature conditions. Therefore, the contribution of each oxide layer of a coating to ASR and the effect on Cr(VI) volatilization need to be reconsidered [19]. Falk-Windisch et al. [20] studied the influence of the thickness of Co coating on the oxide scale resistance in air under 650 °C. The results showed that the thickness of (Cr, Fe)2O3 scale on the surface increased with the thicker 1.5 μm Co layer. With the prolongation of oxidation time from 168 h to 500 h, (Cr, Fe)2O3 was transformed into a porous non-protective oxide scale due to the outward diffusion of Fe into the Co layer, which becomes the main contributor to ASR. Pre-oxidation can alter the corrosion further. Sanergy HT alloy samples were pre-oxidized at 900 °C for 3 min in air to form a protective (Cr, Fe)2O3 scale with a thickness of 40 nm. Then, it was coated with 640 nm Co and 10 nm Ce/640 nm Co, respectively. After 500 h of isothermal exposure at 650 °C and 750 °C, the ASR values were below 10 mΩ·cm2 [21]. However, the ability of self-healing and formation of protective oxide scale of FSS were weakened at 650 °C. The self-healing ability of the coating could be restored in combination with pre-oxidation treatment (5 h in air at 900 °C). Cracks in the coating caused by the stamping/forming process might be repaired by the oxidation of Co, Mn, and Cr spinel under moderate temperatures [22].
Most investigations about Co coatings were concentrated on high-temperature oxidation such as 800 °C. However, for metal-supported SOFC, the operation temperature is generally below 700 °C. Therefore, it is imperative to further estimate the oxidation resistance under low-temperature conditions. Meanwhile, the oxidation kinetics of Co coatings is closely related the composition of the metal substrate. In metal-supported SOFC, 441 steel is widely employed. Although some investigations studied the oxidation resistance of a Co coating on Sanergy HT with a Cr content of 22.4 wt.%, few estimated the feasibility on 441 steel with a Cr content of only 17.9 wt.%. In this study, the interaction between the Co coating and 441 steel at the initial oxidation stage (5 min, 15 min, 30 min, 1 h, 4 h, 24 h, 48 h, 84 h, 120 h) is investigated experimentally in air at 650 °C. The characteristics of the Co coating on FSS 441 are revealed. The element diffusion mechanism between the Co coating and the steel matrix during the oxidation process is discussed. The results provide a reference for the development of high-performance and low-cost Co coating for low- and medium-temperature SOFCs.

2. Materials and Methods

The FSS 441 sample was employed for the oxidation corrosion test, and the steel composition is listed in Table 1. The chemical composition of stainless steel was obtained via the heat analysis method and was provided by the manufacturer. In comparison, the 441 steel samples coated with a 1.5 μm Co layer using the roll-to-roll PVD process (from Sandvik Materials Technology, Stockholm, Sweden [23]) were used for the investigation of the thermal growth and protection mechanism of the Co coating.
The steel sample with a thickness of 0.5 mm was cut into dimensions of 2 cm × 2 cm by means of the laser cutting process. The samples were placed in ethanol for ultrasonic cleaning to remove oil and other impurities from the surface. After being dried, the samples were heated to 650 °C in air, and the heating rate was 5 °C·min–1 in a muffle furnace. The discontinuous weighing method was employed, and the samples were taken out after different time intervals (5 min, 15 min, 30 min, 1 h, 4 h, 24 h, 48 h, 84 h, 120 h) to measure the weight gains of oxidation. Samples were weighed at least twice, and the average weight variations were obtained. Two identical samples were used each time to ensure repeatability.
A scanning electron microscope (SEM, Zeiss Merlin, Carl Zeiss AG, Oberkochen, Germany) was employed to characterize the surface morphology of the sample and the cross-sectional structure of the oxide layer. The energy dispersive spectrometer (EDS) was used to measure the distribution of elements. The probe mode was set to secondary electron (SE) with an acceleration voltage of 15 kV. The phase composition of the oxide scale was analyzed using a X-ray diffractometer (XRD) using Cu Kα radiation.
The area-specific resistance (ASR) of the sample was measured in direct current (DC) mode with a four-point probe. The electrochemical workstation was Type CS310M made by Wuhan Corrtest Instruments Corp., Ltd. (Wuhan, China) with a precision of 0.1%. Both sides of the sample were coated with silver paste, and one silver mesh 1 cm × 1 cm in size was placed on the silver paste. The silver wires were fixed on the silver mesh and lead out through the ceramic tube. The ASR test was performed in a tube furnace where the sample was heated to 650 °C in air at a heating rate of 5 °C·min–1. A current of 100 mA·cm–2 was applied using the electrochemical workstation and the voltage drop at the ends of the silver wires was measured. ASR is defined as the product of the resistance and the nominal contact surface area between the oxide layer and the metal substrate. Due to the high conductivity of the metal material, the resistance of the FSS matrix can be ignored compared with the oxide scale. Considering the symmetry, the ASR is expressed as [24]
A S R = 1 2 ( V I × S )
where V is the measured voltage (V), I is the applied current (mA), and S is the effective contact area (cm2).

3. Results

3.1. Oxidation Mass Gain

Figure 1a shows the macroscopic morphology of 441 steel samples with and without a Co coating at different stages of the oxidation test. For the bare 441 steel, the surface appears blue at first and then changes to slightly gold after oxidation, indicating that the metal surface has been covered with a nano-scale oxide layer that is partially transparent to light. Thus, visible interference colors are observed under white light. This is similar to the macroscopic morphology of the samples obtained by Piccardo et al. [25], in which K44M was oxidized in air below 600 °C. The surface color of the Co-coated 441 steel samples does not change much during the whole oxidation process, which reflects the protective effect of the Co coating.
The oxidation mass gain per unit area characterizes the growth rate of the oxide scale and can be used as an indicator of the oxidation resistance of the sample. The lower the oxidation mass gain, the smaller the oxidation rate, and the better the oxidation resistance. In Figure 1b, the mass gains of both bare 441 steel and that with a Co coating increase gradually. The uncertainty is determined using a method similar to that in [26]. The corresponding value of the parabolic rate constant ( k p ) is determined using the Wagner equation [27].
m S 2 = k p t + C
where m S is the oxidized weight gain per unit area (mg·cm−2), k p is the parabolic rate constant (mg2·cm−4·s−1), t is the reaction time (s), and C is the integral constant defining the start of the parabolic kinetics. The oxidation weight gain of bare 441 steel is 0.029 mg·cm−2 after 120 h oxidation at 650 °C. However, for the 441 steel sample with a Co coating, a very high oxidation weight gain is obtained at the initial oxidation stage due to the in situ thermal growth of the Co layer to form the Co3O4 spinel layer. After oxidation at 650 °C for 120 h, the oxidation weight gain of 441 steel with a Co coating is 0.21 mg·cm−2. Once the Co3O4 spinel layer is formed, the oxidation rate maintains to a low level, which is 9.46 × 10⁻¹⁰ mg2·cm−4·s−1 calculated from 5 min to 120 h, significantly lower than that of bare 441 steel as 1.89 × 10⁻⁹ mg2·cm−4·s−1. Therefore, the Co coating improves the oxidation resistance of 441 steel effectively under low-temperature conditions.

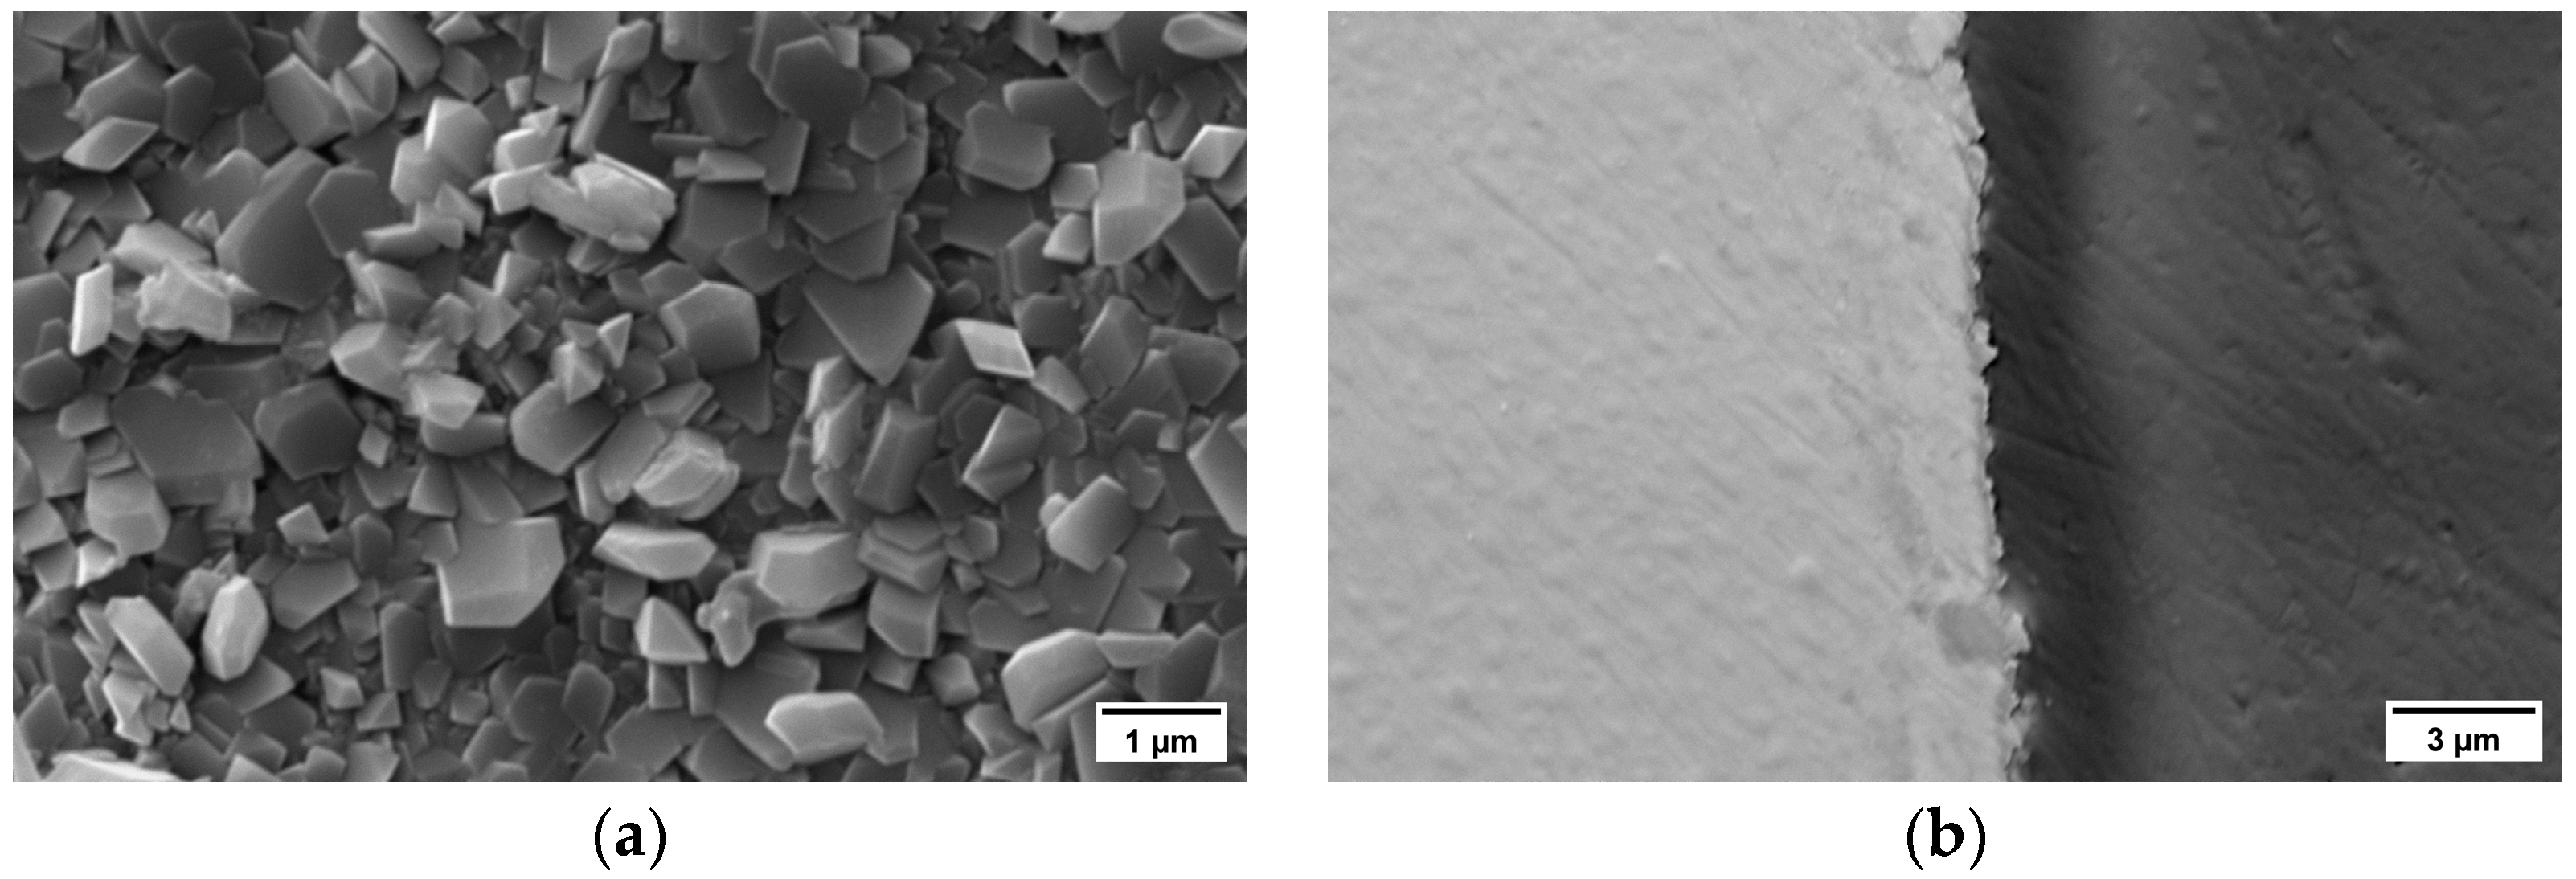
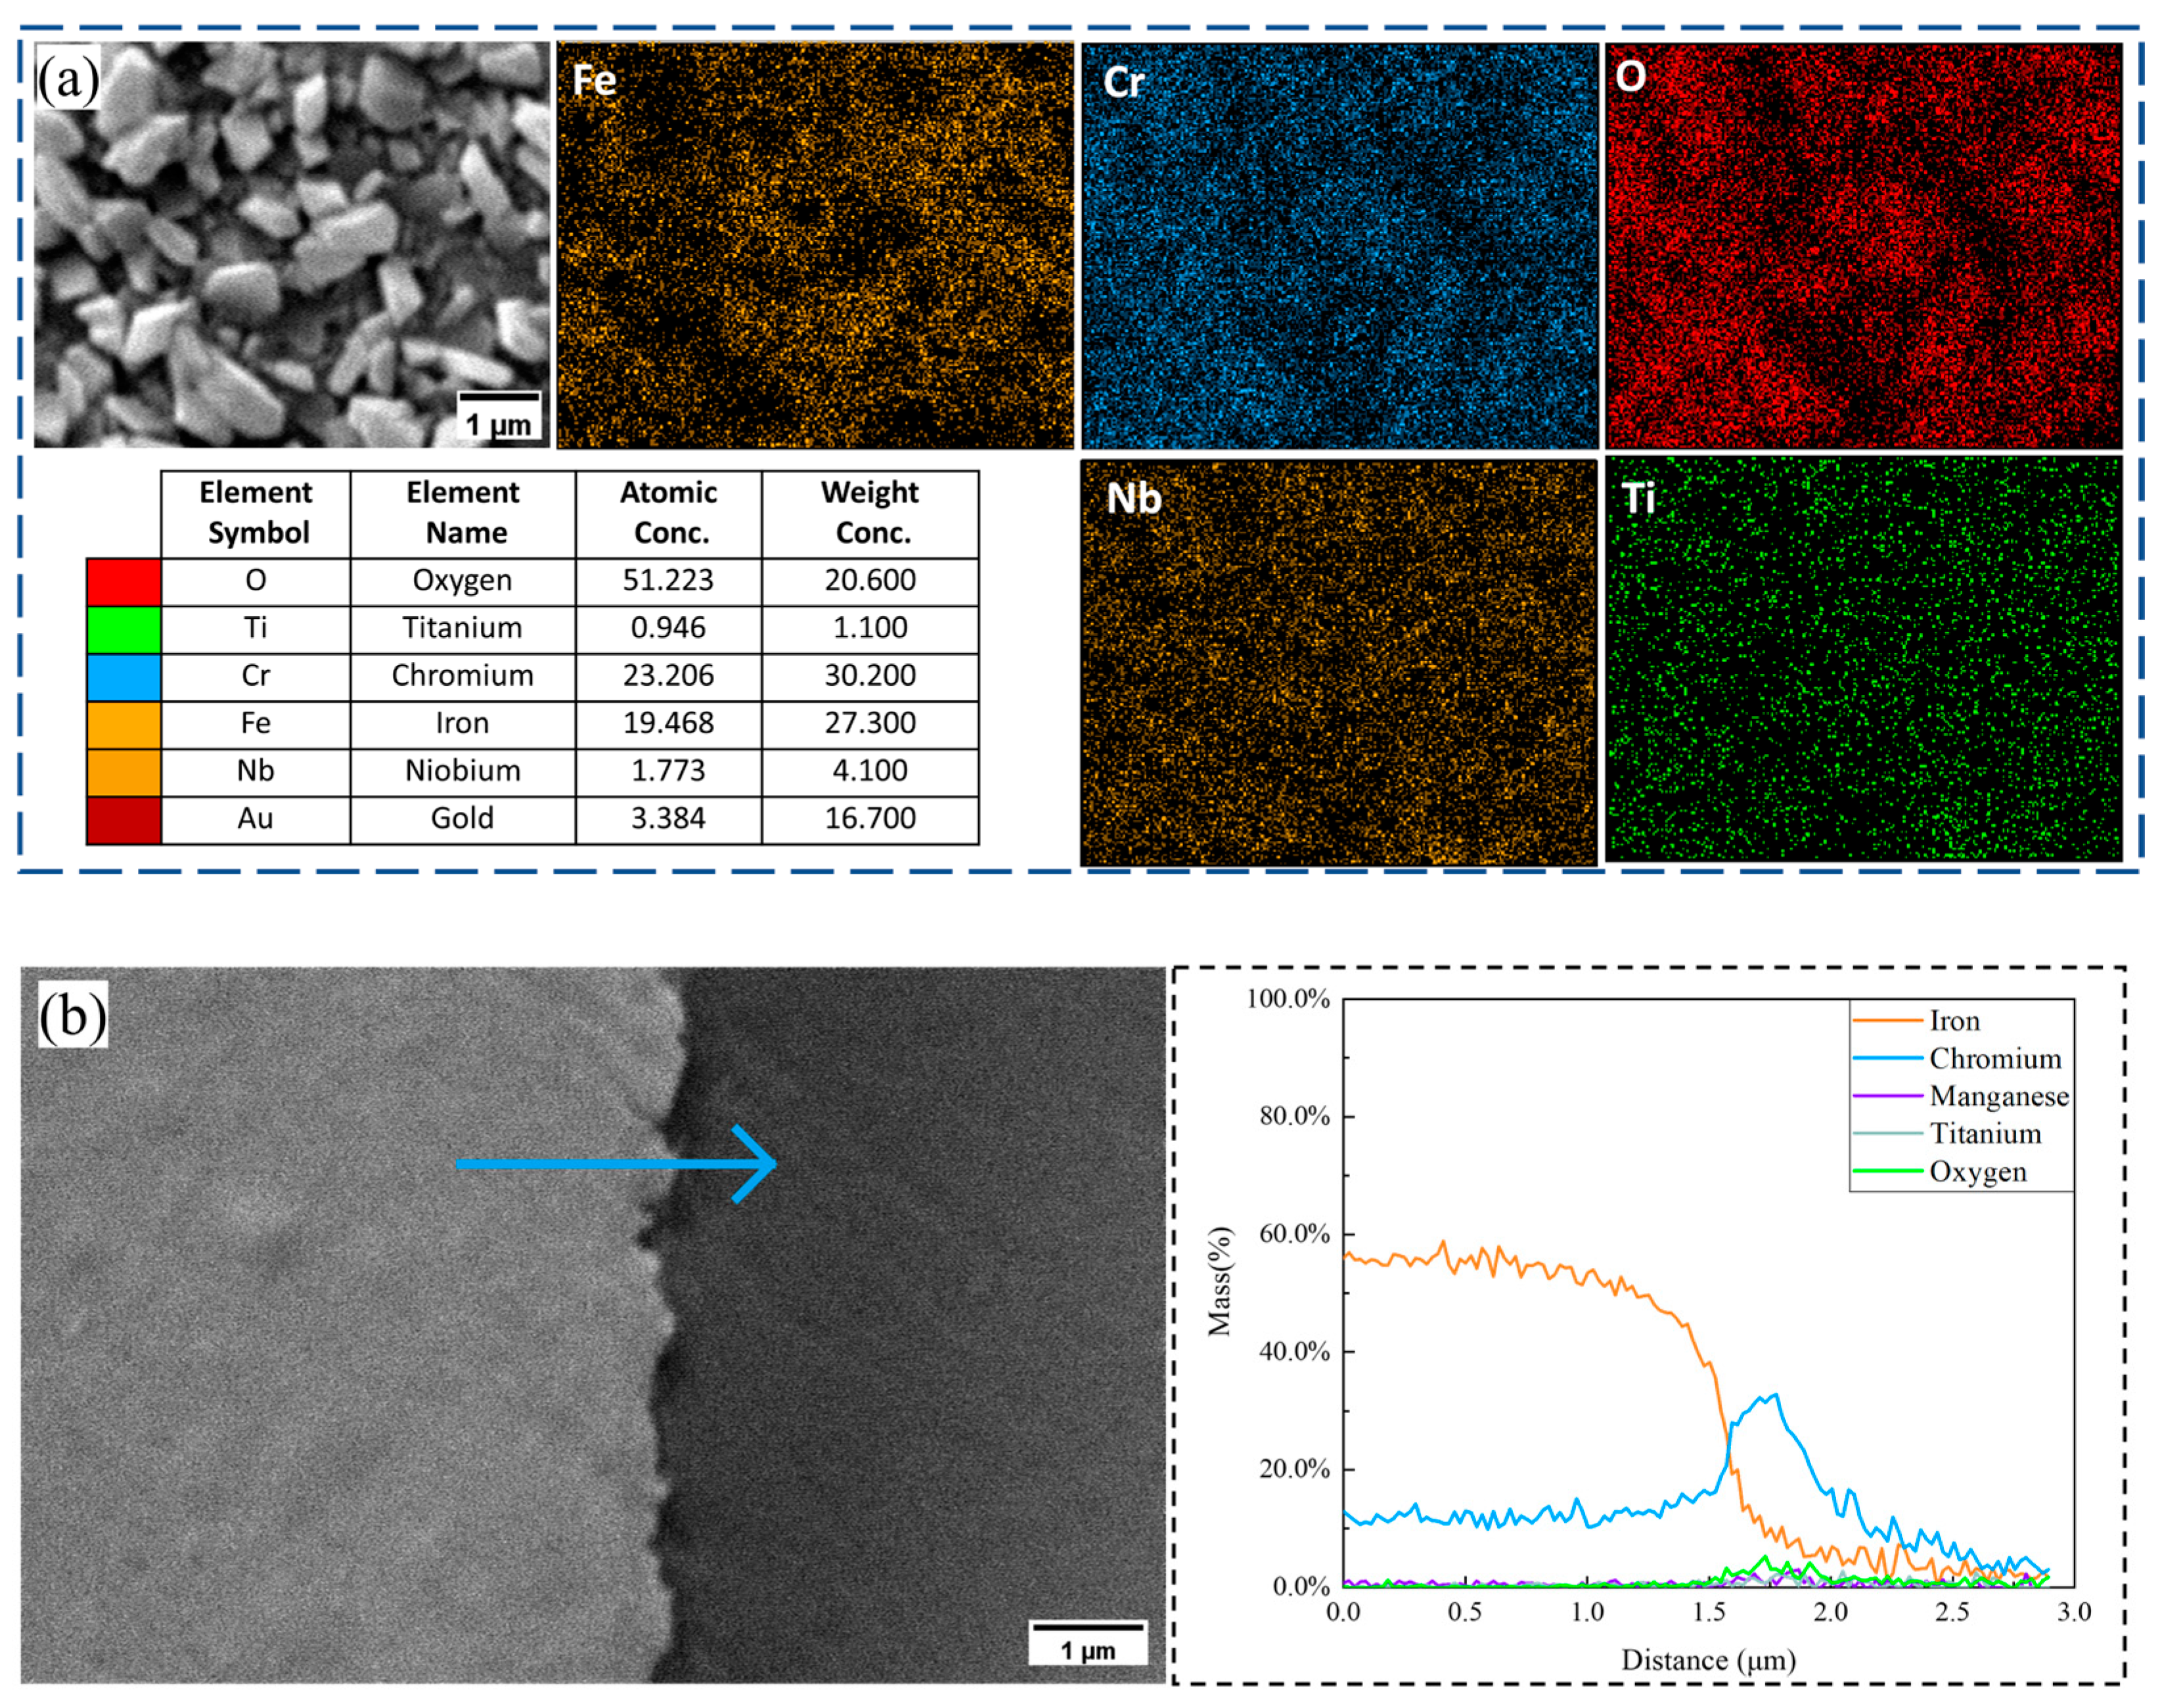
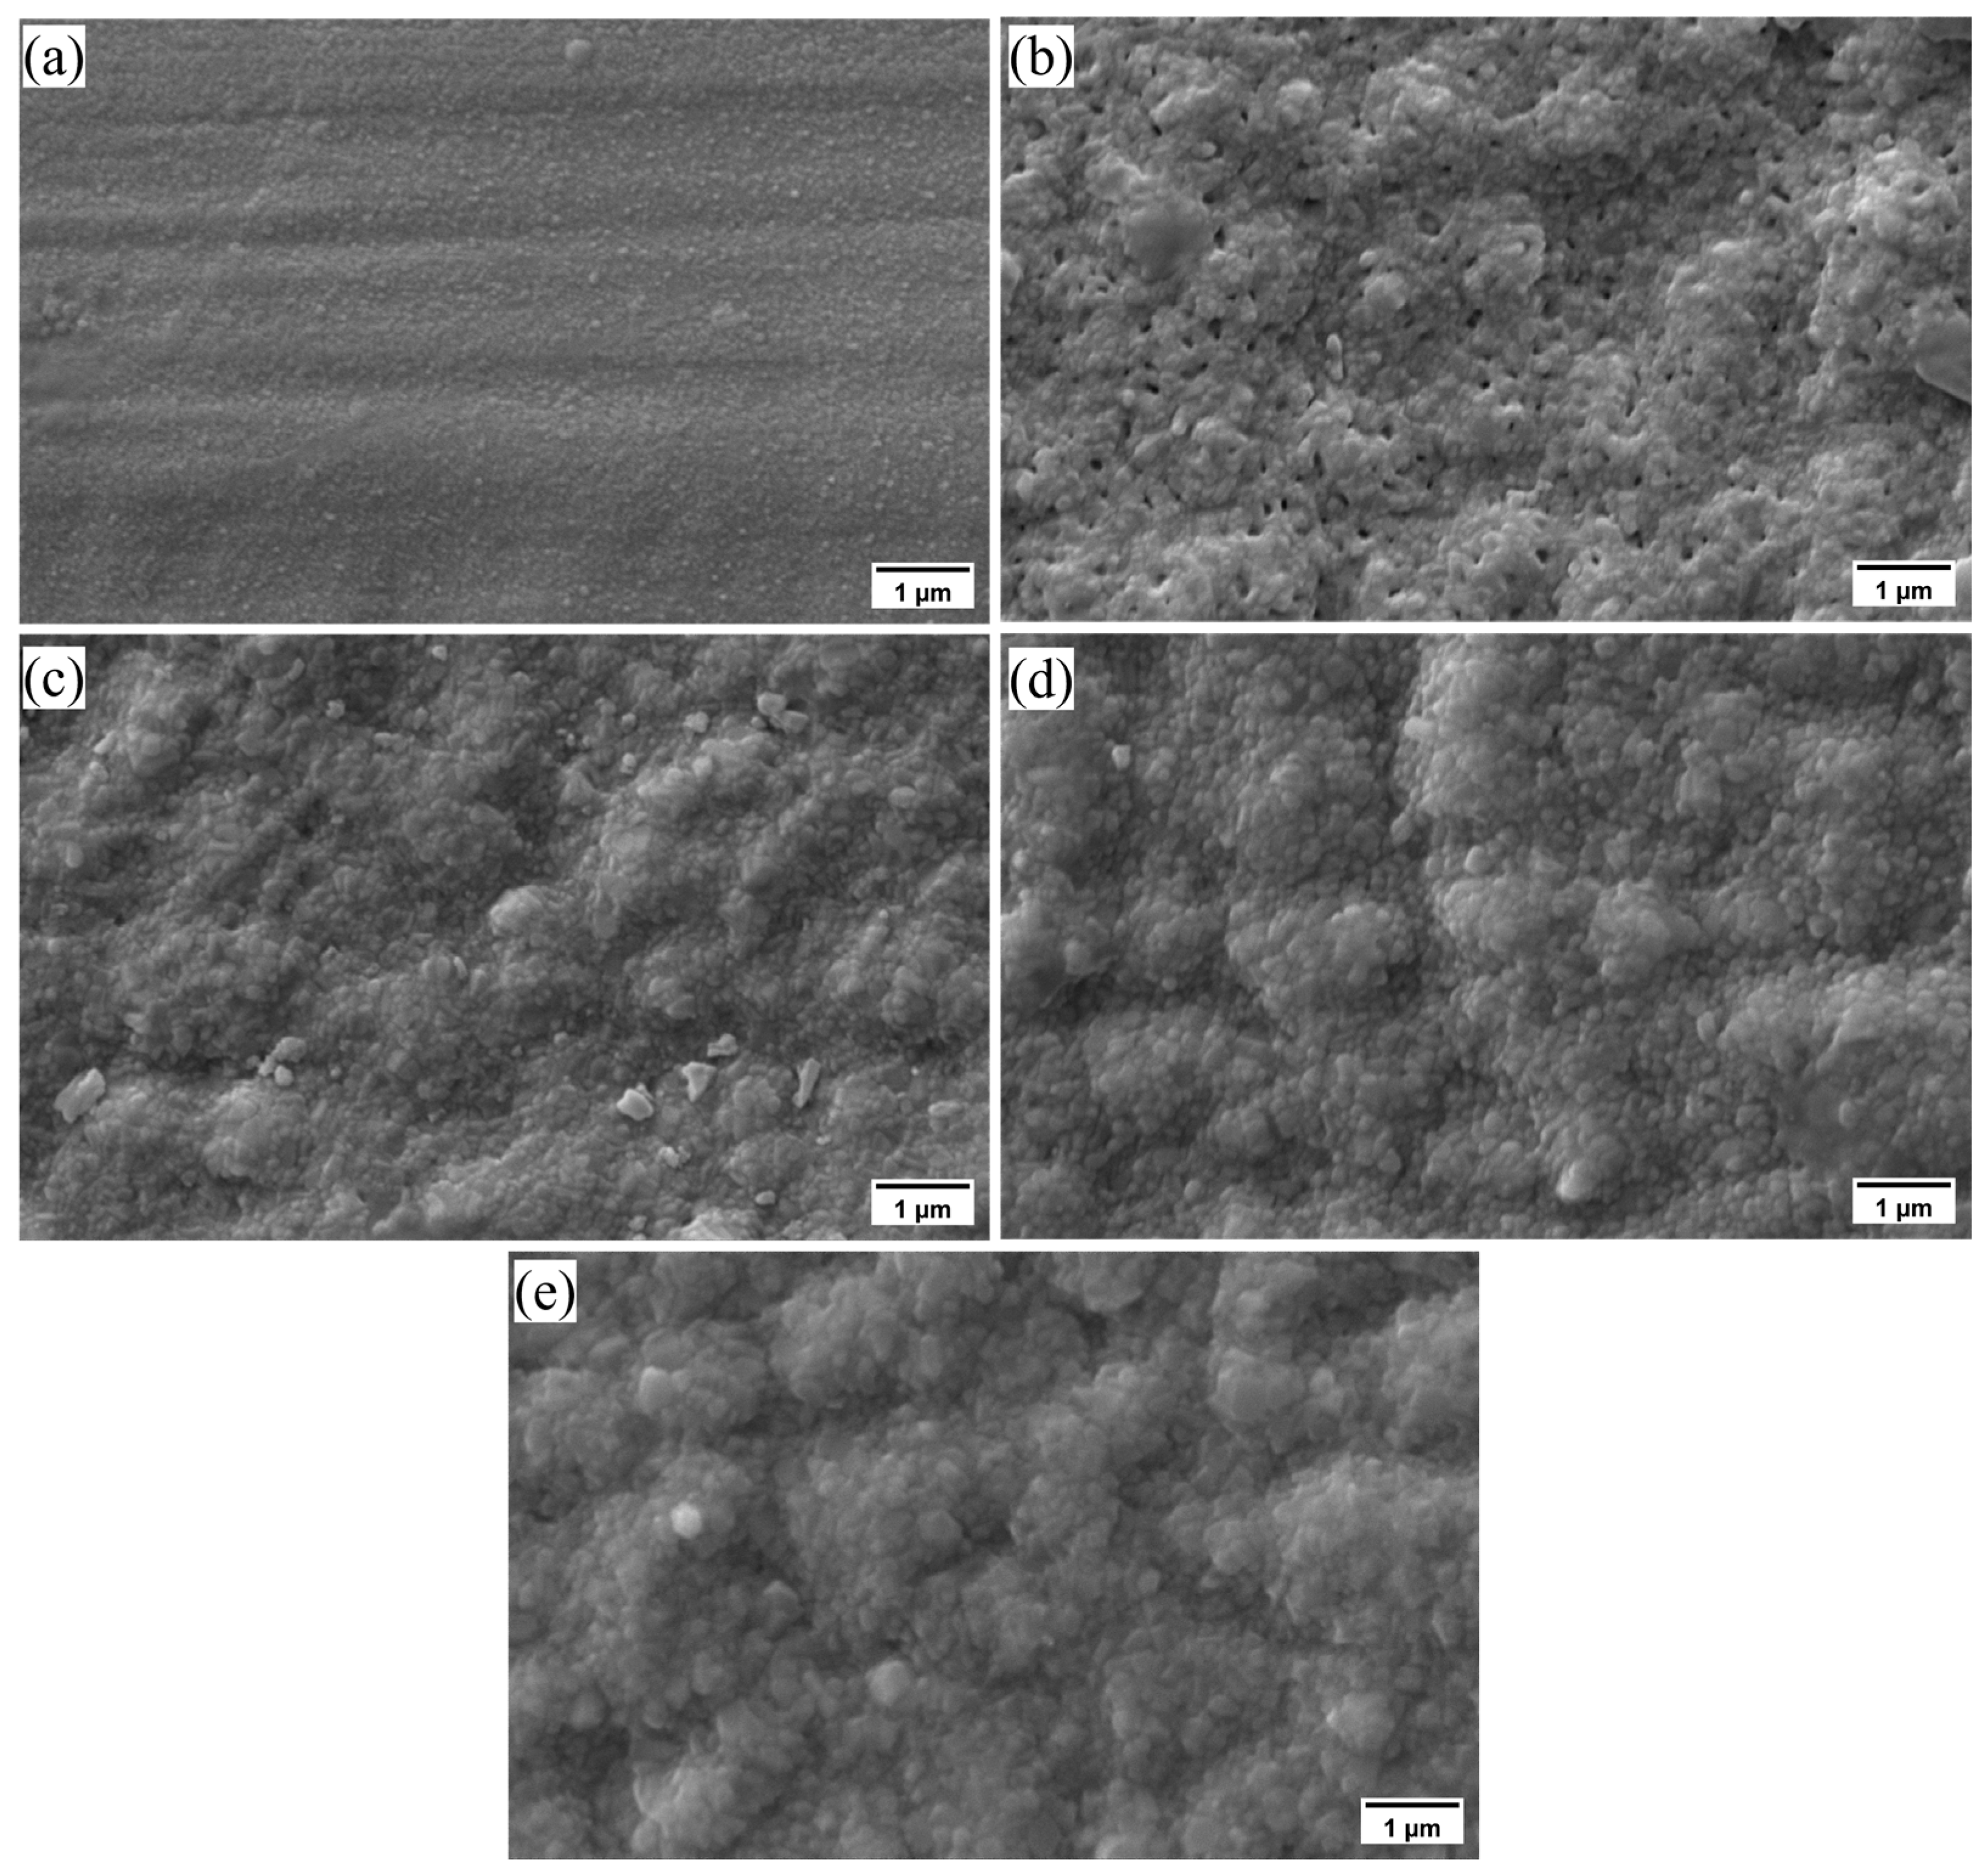
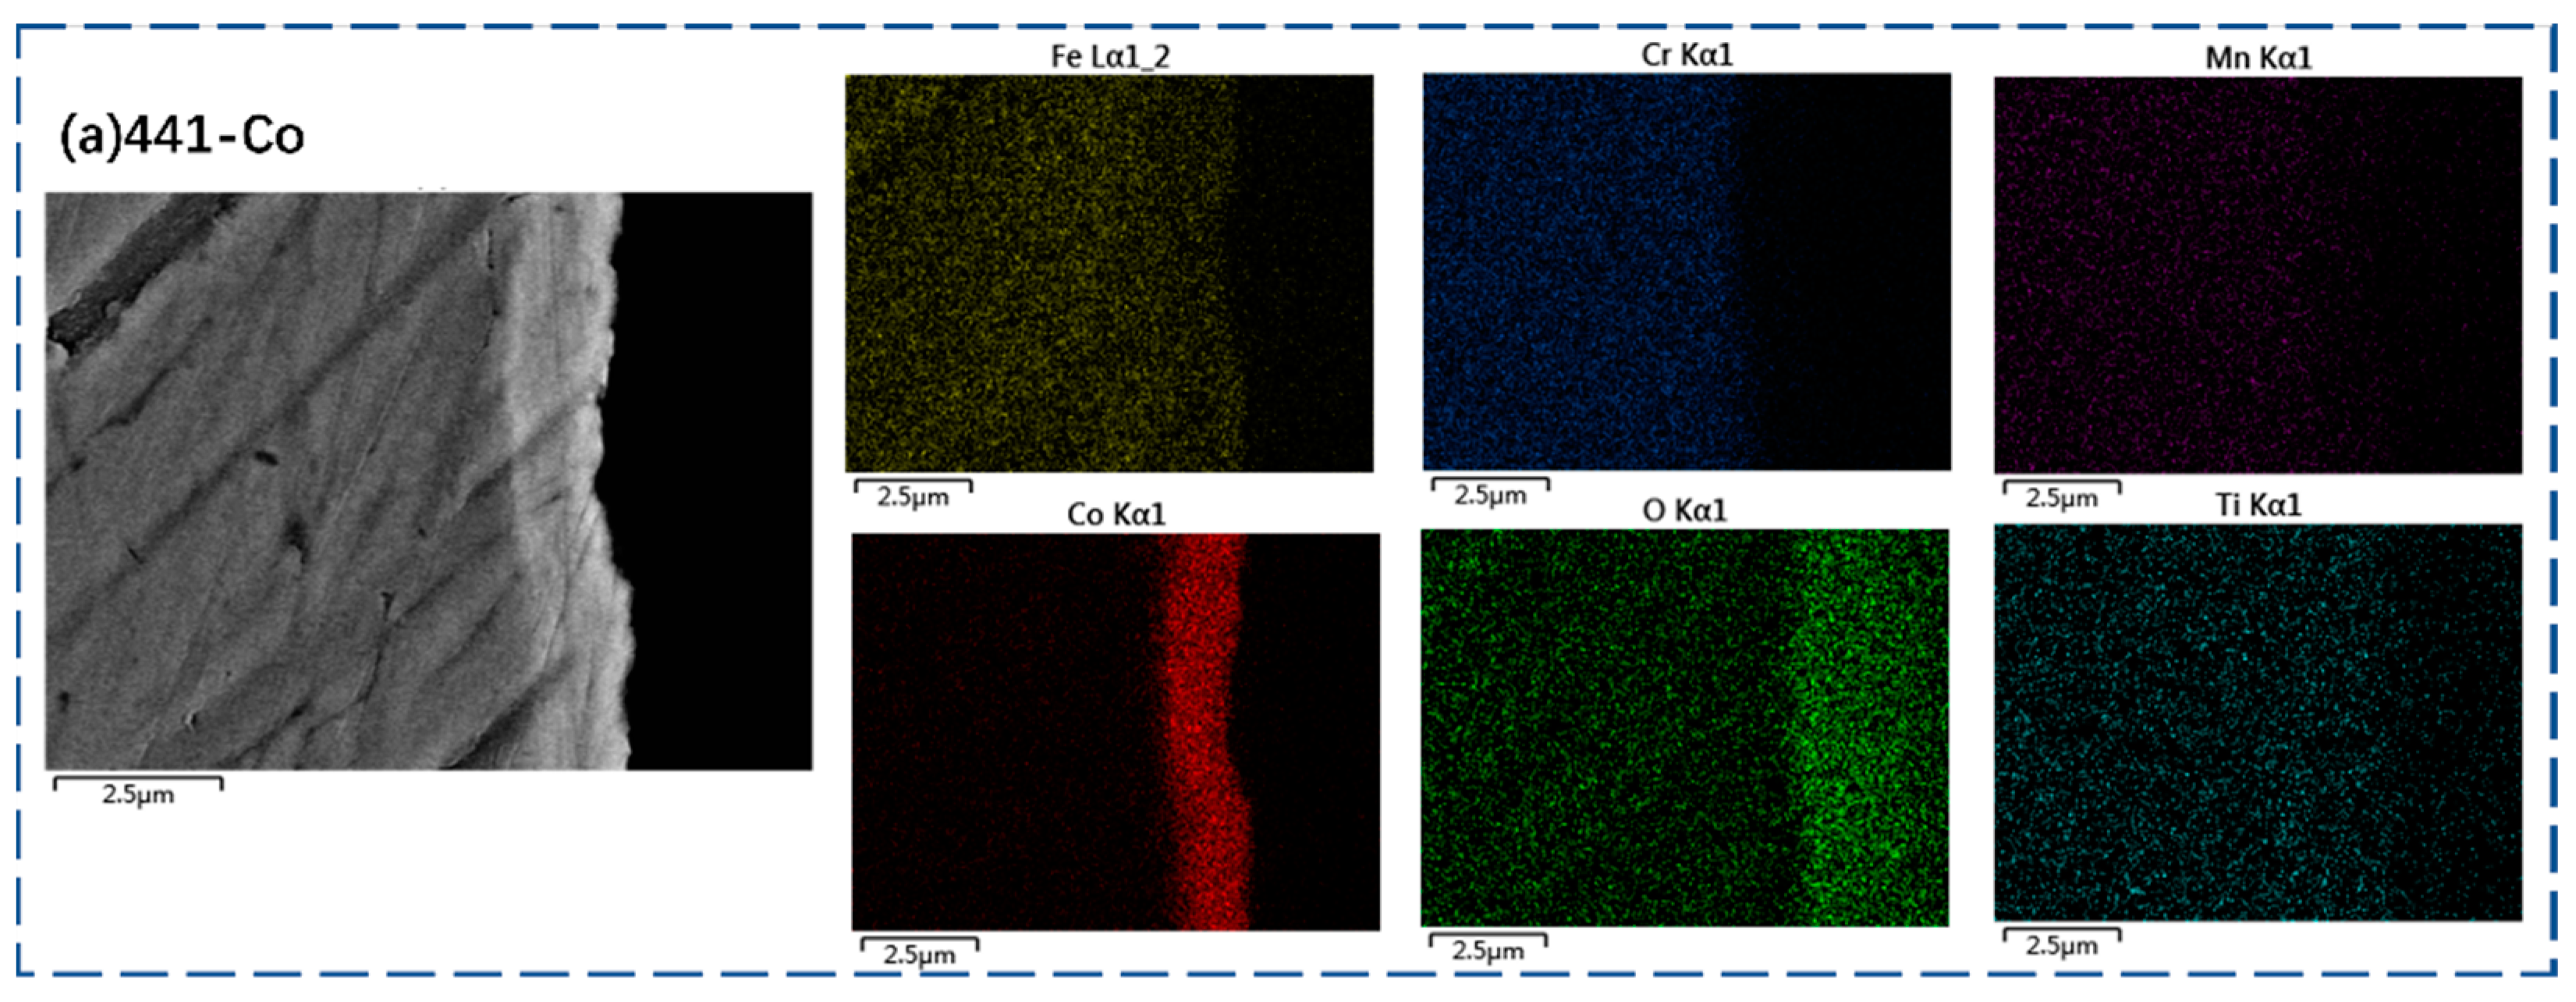
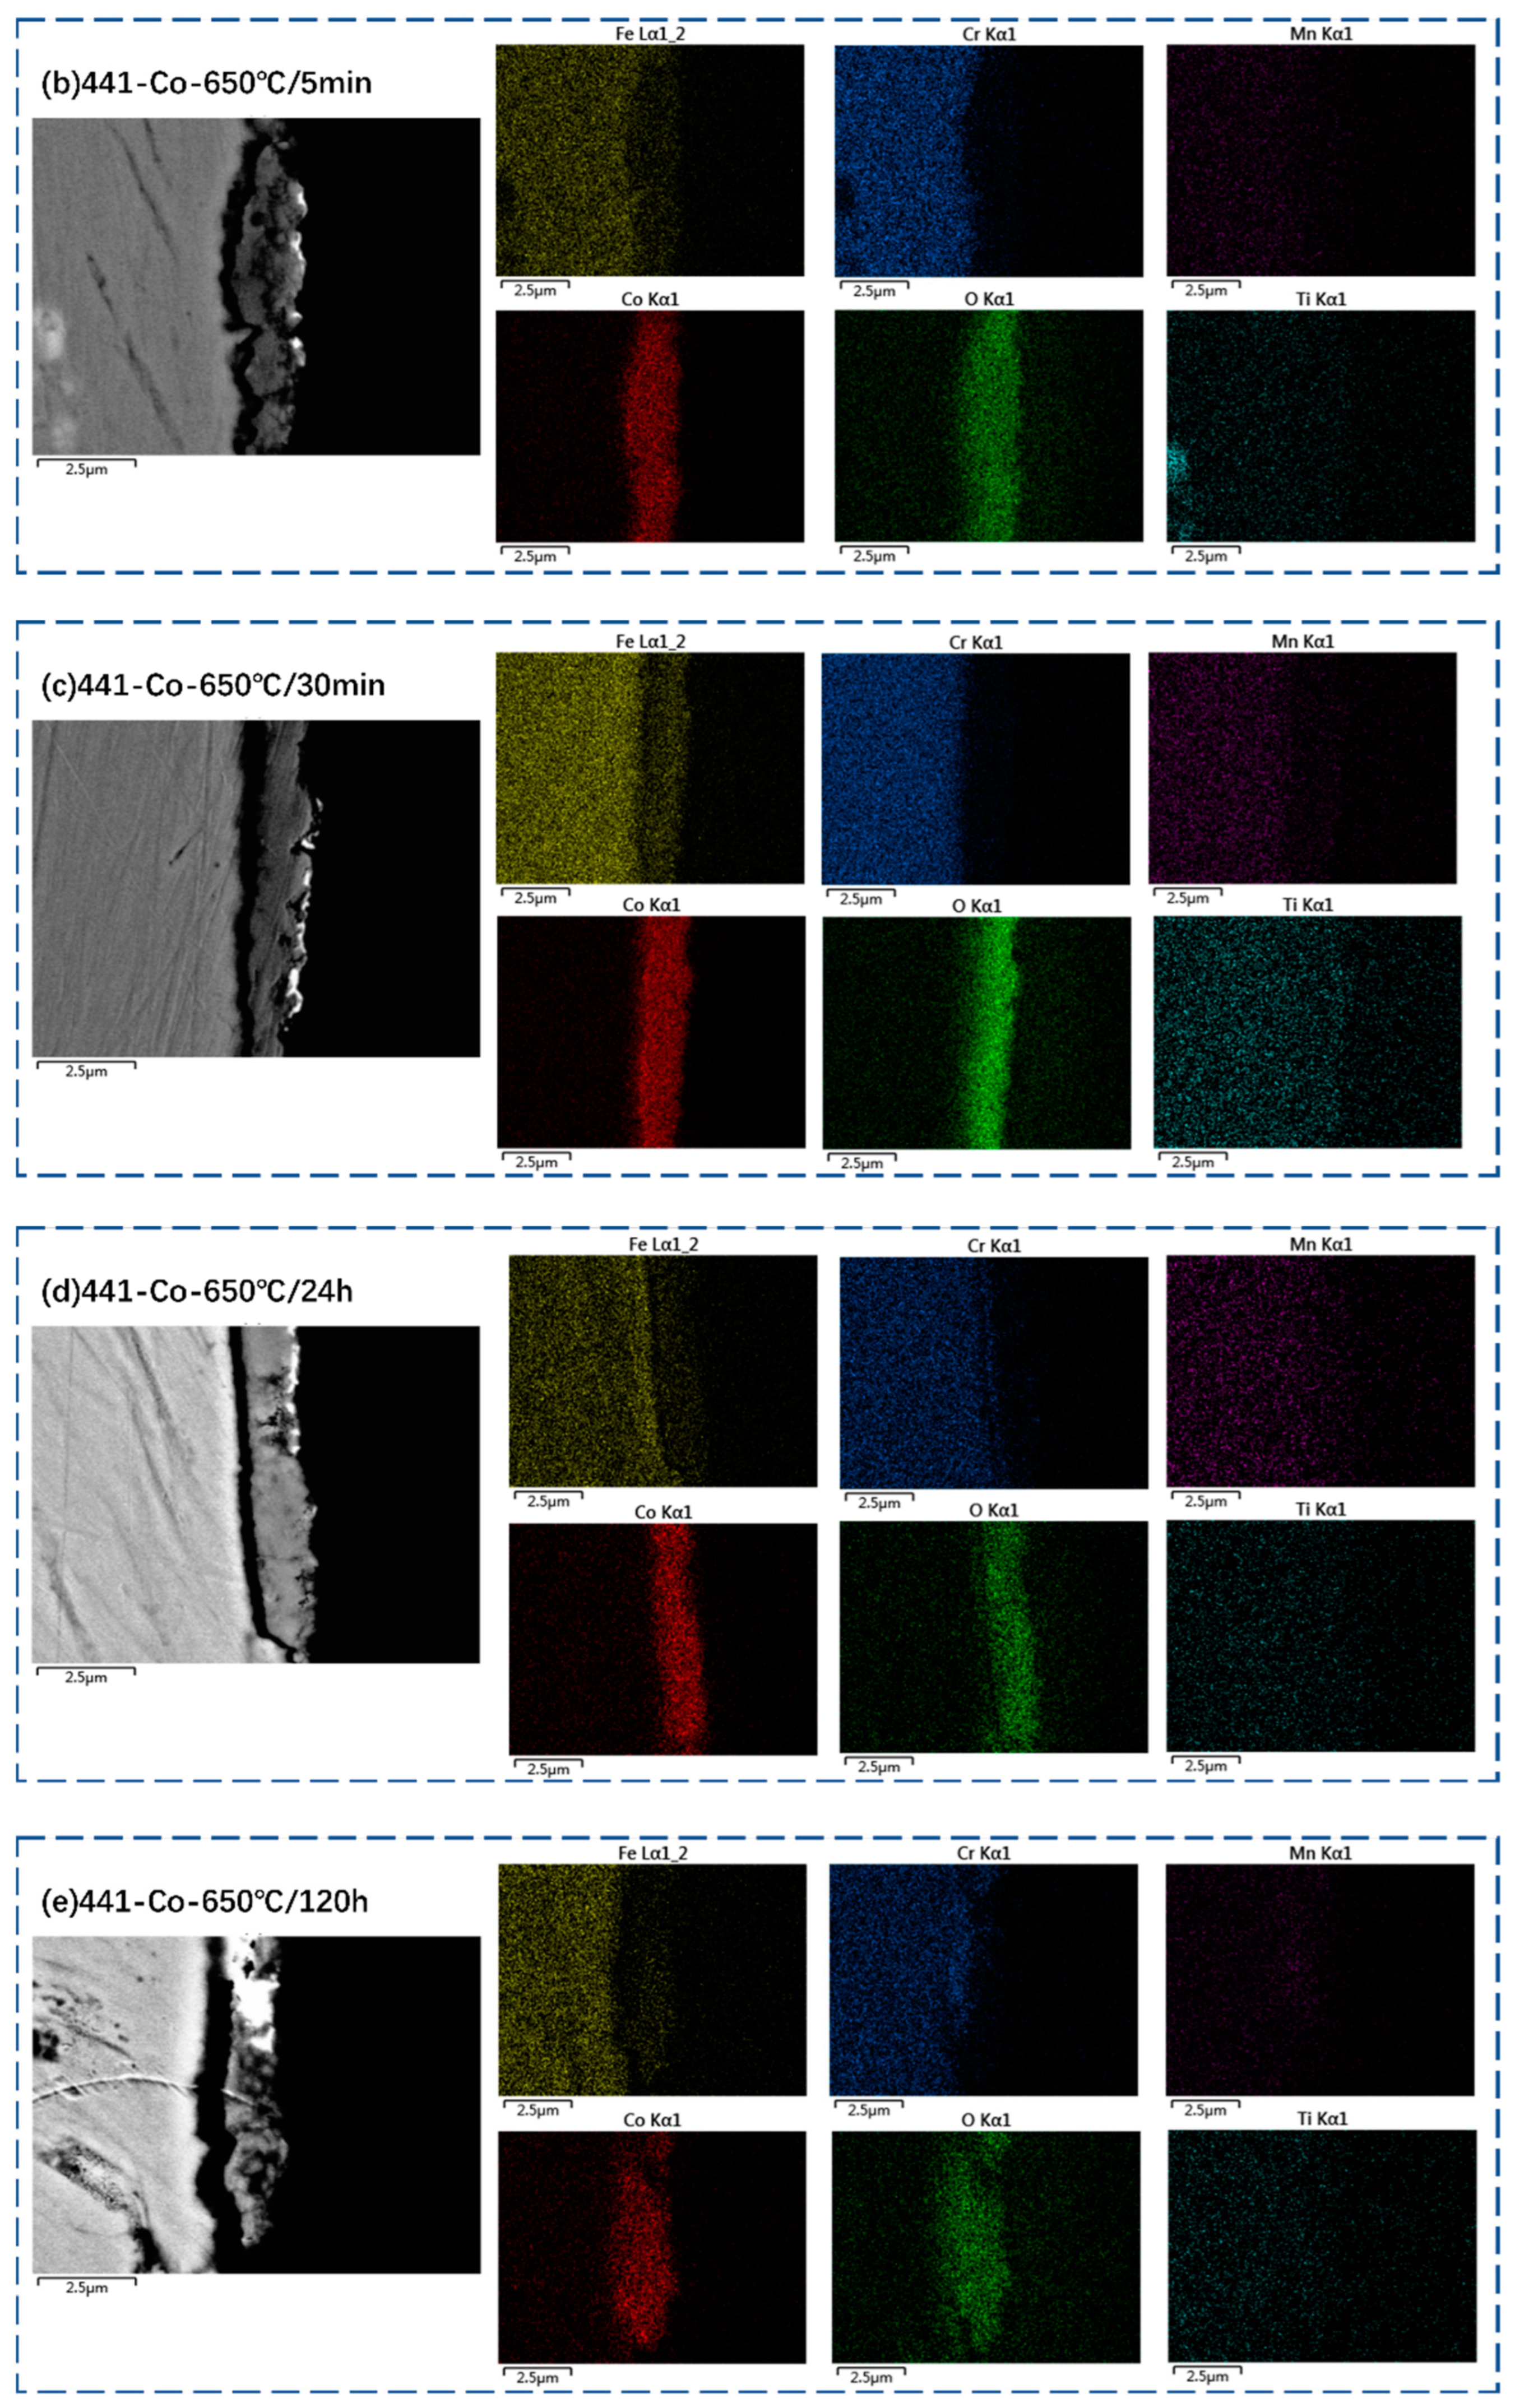
3.2. Oxide Scale Characterization

Figure 2 shows the surface morphology and cross-sectional view of the 441 steel sample after 120 h oxidation at 650 °C in air. Figure 3a displays the results of XRD and Figure 4 exhibits the element distribution via EDS elemental analysis. The surface scale of the oxidized 441 sample is dominated by flaky Cr2O3 with a size of about 1 μm. According to the surface EDS results, small amounts of Nb and Ti are detected in the 441 sample. In the cross-sectional diagram of Figure 2b, the left side is 441 steel and the right side is epoxy resin. It can be seen that the thickness of the Cr2O3 oxide layer is 0.2–0.4 μm, which is also verified by the EDS results of Figure 4b. The thin oxide layer is principally because of the low temperature and short duration of the oxidation process. In addition, the interface between the oxide layer and the steel matrix is not very clear, which is owing to the element diffusion and defect structure that occurred during the growth of Cr2O3. It should be noted that the steel sample is treated with gold spray during SEM characterization. The Au-M and Nb-L lines might overlap, resulting in misjudgment of Nb. Therefore, the Nb is removed from the EDS line scan in Figure 4b.
The surface morphology of the Co-coated 441 steel samples at different oxidation stages is characterized and shown in Figure 5. Figure 5a shows the original Co coating sample. A uniform and dense strip structure can be observed, which is the typical trace of the roll-to-roll PVD process [28]. After oxidation at 650 °C for 5 min, nano-scale holes and micron-scale clusters occur on the surface of 441 samples with a Co coating. The formation of holes might be attributed to the chemical reaction of Co with O and the following volume expansion. With the prolongation of oxidation time, the size of surface oxide particles increases visibly, which can be observed from the results after 30 min, 24 h, and 120 h. The XRD result of the 441 sample with a Co coating is displayed in Figure 3b. After 120 h of oxidation, the main phase on the surface of the sample is Co3O4 spinel, and no Cr2O3 and (Mn, Cr)3O4 are detected. The EDS results are exhibited in Figure 6. After 120 h of oxidation, the surface scale of the sample is dominated by Co and O, and Fe and Cr with low mass fractions are also detected, indicating that the Co oxide layer effectively prevents the outward diffusion of Fe, Cr, and other elements. This is consistent with the results of Bi et al. [29]. In that study, a 5 μm Co layer was electroplated and oxidized in air at 800 °C for 100 h. It was found that a formed Co3O4 layer could effectively prevent the outward diffusion of Cr. It should be noted that the porous structure of the scale at the initial oxidation stage might make the Co coating invalid if the coating thickness is too small.
In order to further explore the oxide growth process of Co coating under low-temperature conditions, SEM characterization and EDS elemental analysis of the cross section for 441 samples with a Co coating are conducted and the results at different oxidation stages are shown in Figure 7. First, the steel samples are cut and placed in epoxy resin and polished. In Figure 7a, the initial thickness of the pristine Co coating is 1.5 μm. The abnormal distribution of Fe and O in the cobalt layer may be generated by EDS signal overlap. After oxidation for 5 min, as shown in Figure 7b, the overall thickness of the oxide scale is about 2.2 μm, indicating that most of the Co layer has been oxidized and transformed into Co3O4 spinel, resulting in an apparent volume expansion of Co layer and the diffusion of Co into the steel matrix. Moreover, the diffusion front of O exceeds that of Co by about 0.2 μm, indicating that a thin Cr2O3 layer is formed underneath the Co oxides. This is consistent with the rapid increment in the oxidation mass gain. The metal Co is able to be rapidly oxidized in the initial oxidation stage (within 5 min) at 650 °C. Oxides such as CoO and cubic Co3O4 spinel are generated successively. In addition, nanoscale pores are also observed in the cross-sectional view due to the rapid inward diffusion of O and the subsequent chemical reaction with Co. However, after 30 min of oxidation, as shown in Figure 7c, the inward diffusion rate of O slows down apparently, and the detected overall thickness of Co is about 2.3 μm. The Co oxide layer appears dense, and no pores are observed. In addition, Fe diffuses to the top layer of Co, and a similar gradient with the O occurs.
After 24 h of oxidation, as shown in Figure 7d, Co is oxidized completely, and the thickness of the Co oxide layer is maintained at 2–2.3 μm. Meanwhile, a Cr oxide layer with a 0.1–0.3 μm thickness is observed, and cracks are developed along the Cr2O3 layer. The formation of the internal Cr2O3 layer is attributed to the inward diffusion of O, primarily at the initial stage of oxidation. Fe is distributed evenly in the Co oxide layer, and the Fe content in Cr2O3 is relatively high as well. In fact, the inner oxide layer is a solid solution of Cr2O3 and Fe2O3. For the sample oxidized for 120 h, the thickness of the Co oxide layer is 1.5–2.4 μm. Although a low distribution of Fe in the Co oxide layer is found in the cross-sectional view of EDS, the results of XRD in Figure 3b showed that the main phase is the spinel Co3O4. Meanwhile, (Co, Fe)3O4 exists in the intermediate layer. A crack of about 0.5 μm appears along the Cr2O3 oxide layer that might be caused by the polishing process. In addition, it is found from the EDS results that Cr diffuses into the Co layer with a thickness of 0.3–0.7 μm.
In the process of oxidation, mutual diffusion of elements often occurs between the coating and the metal substrate. The diffusion process is affected by the operation temperature, oxygen concentration gradient, element concentration, and structural defects. It is worth noting that the diffusion of Mn into the Co coating is not observed at different stages of oxidation at 650 °C. Thus, no (Mn, Co)3O4 spinel phase is found in the Co coating. The content of Mn in 441 steel is relatively low. Meanwhile, the diffusion rate of Mn into the Cr2O3 layer is temperature-dependent, and reduces with decreasing temperature. In comparison, Mn in the metal substrate diffused outward evidently through the Cr2O3 layer and formed spinel phases such as (Mn, Cr)3O4 and (Mn, Co)3O4 when the temperature was higher than 750 °C [30]. At 650 °C, the diffusion rate of Mn is lower than that of Fe. Therefore, the structure of the oxide scale is composed of an inner layer of a Cr2O3 and Fe2O3 solid solution, an intermediate layer mainly containing (Co, Fe)3O4, and an outer layer comprising Co3O4 spinel. This is similar to the results of Falk-Windisch et al. [20]. The conductivity of (Mn, Co)3O4 spinel is generally greater than that of Co3O4. For example, at 800 °C, the conductivity of MnCo2O4 is 60 S·cm–1, while it is 6.7 S·cm–1 for Co3O4 and 0.93 S·cm–1 for CoFe2O4 [31]. However, the main contribution of ASR in the oxide scale is the Cr2O3 layer. Therefore, although the MnCo spinel cannot be formed in situ for the Co-coated 441 steel under the low-temperature operation conditions, the Co coating is still promising with acceptable conductivity.

3.3. Electrical Property

The ASR results for the 441 samples with and without a Co coating were measured. Figure 8a displays the ASR values measured under different temperatures for the samples oxidized for 120 h. The standard deviations are plotted as well. Generally, the oxide scale formed on the surface of the 441 sample at 650 °C exhibits semiconductor behavior. The conductivity gradually increases with the increase in the temperature, and the ASR decreases significantly. In the temperature range of 600–650 °C, the ASR of the 441 samples declines to 5–7 mΩ·cm2, and the ASR of the Co-coated 441 samples even drops to the range of 3–4 mΩ·cm2. Therefore, a Co coating improves the conductivity of 441 steel obviously under low-temperature conditions, primarily because of the high conductivity of Co3O4 compared with Cr2O3, and the barrier effect of Co coating to reduce the oxidation of 441 steel.
The ASR values were measured at 650 °C for the samples with and without a Co coating oxidized for different times and are shown in Figure 8b. The discontinuous oxidation method was employed. Therefore, there are fluctuations in ASR profiles between different samples. For example, the ASR value of the 441 sample oxidized for 24 h increased abruptly. The ASR value of the sample is principally influenced by the compositions and conductivities of oxides in the surface scale. Primarily, a high ASR is obtained for 441 samples in the early oxidation stage (0–30 min), mainly because the surface oxide layer is unstable at this stage and is greatly affected by temperature and atmosphere. After 1 h of oxidation, a thin and protective Cr2O3 layer is formed initially, and the ASR value is low at this time. During the subsequent oxidation process, the ASR of 441 samples increases with the growth of the Cr2O3 layer. Cr2O3 has a low conductivity and is the major contributor of the ASR. For the Co-coated 441 samples, the rapid oxidation of metal Co, the growth of Co-based oxide grains, and the transformation of the oxide layer from porous to dense are experienced within 1 h at 650 °C. The Co layer grows from 1.5 μm to 2.3 μm during this period and the ASR is relatively high. After oxidation for 1 h, the ASR of the Co-coated sample increases slowly, mainly due to the formation of Co spinel. Co is a p-type doper, and the addition of Co can effectively improve the electrical conductivity of spinel compounds compared with Cr2O3 and (Mn, Cr)3O4 oxides grown on the surface of FSSs. For example, the conductivities of MnCo2O4, CoCr2O4, and CoFe2O4 at 800 °C are 60 S·cm−1, 7.4 S·cm−1, and 0.93 S·cm−1, respectively [31].
When the temperature is lower than 700 °C, the conductivity of Co3O4 spinel is still one order of magnitude higher than that of Cr2O3. If the dense spinel layer has a higher-conductivity and the growth of Cr2O3 is suppressed, the ASR of the 441 sample with a Co coating will be smaller than bare 441 steel, just as the results after 84 h show. After oxidation at 650 °C for 120 h, the structure of the surface oxide scale becomes stable, and the surface Co-based spinel layer effectively slows down the growth of the internal Cr2O3 layer. Meanwhile, it seems that a much longer time is required for the Co coating to form a dense and high-conductivity Co3O4 layer compared with the previous SEM results. On the other hand, FSS 441 contains a relatively high content of Cr, which is sufficient to form a continuous Cr2O3 passivated layer during the initial oxidation stage. Thus, the ASR of a bare 441 sample is even lower than that of the sample with a Co coating before 84 h. However, with the extension of oxidation time, the Cr2O3 layer with a low conductivity gradually thickens, and its negative effect on the electrical performance becomes more prominent.

4. Discussion

Good adhesion and a high conductivity are critical for the protective coating during long-term oxidation. However, during the operation of the SOFC stack, the element diffusion mechanism may vary with the changing of the operation temperature and atmosphere, resulting in a different structure of the oxide scale. The evolution mechanism of the Co coating during high-temperature operation has been clarified. Froitzheim et al. [32] studied the oxidation process of ferritic steel Sanergy HT with a 640 nm Co coating at 850 °C during the long-term period of 3000 h. Rapid oxidation occurred in the initial stage (t < 30 s), and the Co layer was oxidized first to CoO and then to Co3O4. Meanwhile, Fe diffused into metal Co, and Fe in the Co layer promoted the phase transition from hexagonal Co to cubic Co. In the second stage (about 1 h), the Cr2O3 layer began to form between the metal and the coating, which was covered by an inner layer (Co, Fe)3O4 and an outer layer of Co3O4. After one week of oxidation (168 h), the (Co, Fe, Mn)3O4 surface layer was formed due to the diffusion of Fe and Mn into the coating. Meanwhile, a thin Cr2MnO4 layer occurred below the Cr2O3 layer. After 3000 h of oxidation, the Cr2O3 layer thickened and the inner Cr2MnO4 spinel layer was dissolved, while the surface layer of (Co, Fe, Mn)3O4 remained stable. Poitel et al. [33] confirmed the diffusion behavior of Fe and Mn from the metal substrate to the Co coating at high temperature via an in situ observation with a modified environmental scanning electron microscope (ESEM). Karlsson et al. [34,35] characterized the microstructure variations of 800 nm-thick Ce-Co/Mn coatings with time using scanning transmission electron microscopy (STEM) and electron energy loss spectroscopy (EELS). After 4 min of oxidation at 800 °C, the diffusion front of O arrived at the surface of the steel matrix and formed Cr2O3 at the interface.
In this study, the inward diffusion of O and Co and the outward diffusion of Fe and Cr are observed in the oxidation process of the 441 sample with a 1.5 μm-thick Co coating at 650 °C. The Co coating is rapidly oxidized and a 2.2 μm-thick Co3O4 layer forms in the initial oxidation stage. During the initial stage of oxidation, O diffuses inward, rapidly driven by the gradient of oxygen concentration. Hence, nano-scale voids occur in the Co coating, and the thickness of the porous layer accounts for about 1 μm. In addition, the diffusion rate of O is greater than that of Co, and there is still a risk of Fe and Cr being oxidized on the surface of the 441 steel, although the oxidation rate is apparently lower than that under the high-temperature conditions. After 30 min of oxidation, no pores are observed on the surface of the oxide scale due to the growth of Co3O4 grains, and the thickness of the Co oxide layer is maintained at 2–2.3 μm. In addition, it is observed that the diffusion front of O has arrived at the surface of the metal substrate. After 24 h of oxidation, an oxide layer containing Fe and Cr was observed to be 0.1–0.3 μm thick, which is a solid solution of Cr2O3 and Fe2O3. After 120 h, the Co oxide layer thickens slightly to 2.4 μm, and the growth of Co3O4 grains is the main driving force of this.
No Cr element is detected in the oxide scale, indicating that the Co3O4 layer has blocked the Cr volatilization effectively at 650 °C. In fact, the mutual diffusion of Fe and Cr elements with Co and O elements occurs mainly under the Co3O4 spinel layer, forming the inner solid solution of Cr2O3 and Fe2O3 and the intermediate layer of (Fe, Co)3O4. No obvious diffusion of Mn into the Co coating is found because of the low oxidation temperature. In order to construct a MnCo spinel coating with a higher conductivity under an operation temperature less than 700 °C, co-deposition of Mn and Co should be employed and further investigations are required. A short-term oxidation above 750 °C might be used to form a (Mn, Co)3O4 spinel layer. However, the outward diffusion of Fe is unavoidable. Many studies have studied the pre-oxidation treatment of a metal substrate before coating with a Co layer to avoid the outward diffusion of Fe and Cr elements during the later oxidation process [36,37], whereas the Cr content of the metal substrate must be high enough to form the dense Cr2O3 protective layer.
The measured ASR of the 441 sample with a Co coating is less than that without a Co coating after 120 h of oxidation at 650 °C, reflecting the favorable effect of a Co coating on the oxidation resistance and electrical conductivity. The advantages of the Co coating would be more prominent during the long-term oxidation process, and more experiments are needed. In addition, cracks in the Cr2O3 layer are found for the 441 samples with a Co coating after 120 h. Although this is mainly caused by external stress during the polishing step, the mismatch of the thermal expansion coefficient of the Co3O4 layer with the metal substrate might lead to internal thermal stress at the interface, resulting in cracks in the Cr2O3 layer and accelerating the oxidation corrosion.

5. Conclusions

In this study, oxidation experiments of 441 steel samples with and without a 1.5 μm-thick Co coating were performed at 650 °C for 120 h in air. The oxidation mass gain and the structure of the oxide scale as well as the electrical properties were investigated. The main conclusions are as follows.
(1) The Co coating undergoes a rapid oxidation within the first 5 min and forms the Co3O4 spinel layer, although the time taken for the Co coating to form a protective oxide layer is prolonged under low-temperature conditions. Thus, the oxidation resistance of 441 steel is improved later. The oxidation rate constant of Co-coated 441 steel estimated from 5 min to 120 h is 9.46 × 10⁻¹⁰ g2·cm–4·s–1, which is significantly lower than that of bare 441 steel samples (1.89 × 10⁻⁹ g2·cm–4 ·s–1).
(2) After oxidation at 650 °C for 120 h, the inner layer of Cr2O3 and Fe2O3 in Co-coated 441 steel samples is 0.1–0.3 μm thick, which is lower than the thickness of the Cr2O3 layer (0.2–0.4 μm) on the surface of 441 steel. The ASR of the Co-coated 441 steel is 3.73 mΩ·cm2, while that of the bare 441 steel is 5 mΩ·cm2. The superior electrical conductivity of the Co-coated 441 steel is attributed to a thinner inner layer of (Cr, Fe)2O3 and the higher conductivity of the Co3O4 spinel layer.
(3) The thermal growth process and the protection mechanism of the Co coating at 650 °C are further analyzed. Due to the gradient of oxygen concentration and the diffusion of Co, Fe and Cr, the Co coating underwent rapid oxidation at the initial stage and grain growth at the later stage. The co coating also experienced a process from porous (<5 min) to dense (>30 min). After oxidation at 650 °C for 120 h, the oxide layer structure composed of an inner solid solution of Cr2O3 and Fe2O3, a middle layer of (Fe, Co)3O4 and an outer layer of Co3O4 spinel is formed. Therefore, the 1.5 μm-thick Co coating exhibits a good oxidation resistance and electric property at 650 °C, which is an acceptable technique for low- and medium-temperature SOFC. In addition, no significant Mn diffusion into the Co layer is observed at 650 °C. Alternative method needs to be developed to obtain the (Mn, Co)3O4 spinel coating.
The initial oxidation process of a Co coating is characterized in this study. To provide a comprehensive estimation, a longer period of measurement of more than 1000 h is required, and the practical operation atmosphere of SOFC should be applied. The effects of different gas concentrations and operating temperatures also need to be estimated in the future.

Author Contributions

Conceptualization, E.W., H.W., M.O., H.H. and L.L.; methodology, E.W., H.W., M.O. and D.R.; validation, E.W., H.H. and Y.L.; formal analysis, J.M. and Y.L.; investigation, J.M.; resources, E.W., H.W., M.O., H.H. and L.L.; data curation, J.M.; writing—original draft preparation, J.M.; writing—review and editing, E.W.; visualization, E.W. and J.M.; supervision, E.W., H.W., M.O., H.H. and L.L. All authors have read and agreed to the published version of the manuscript.

Funding

This research was supported by the National Key Research and Development Program of China (Grant No. 2021YFB2500400).

Institutional Review Board Statement

Not applicable.

Informed Consent Statement

Not applicable.

Data Availability Statement

Data is contained within the article.

Conflicts of Interest

The authors declare no conflict of interest.

References

  1. Zhang, M.; Wang, E.; Mao, J.; Wang, H.; Ouyang, M.; Hu, H. Performance analysis of a metal-supported intermediate-temperature solid oxide electrolysis cell. Front. Energy Res. 2022, 10, 3389. [Google Scholar] [CrossRef]
  2. Hilpert, K.; Das, D.; Miller, M.; Peck, D.H.; Weiß, R. Chromium Vapor Species Over Solid Oxide Fuel Cell Interconnect Materials and Their Potential for Degradation Processes. J. Electrochem. Soc. 1996, 143, 3642–3647. [Google Scholar] [CrossRef]
  3. Zarabi Golkhatmi, S.; Asghar, M.I.; Lund, P.D. A review on solid oxide fuel cell durability: Latest progress, mechanisms, and study tools. Renew. Sustain. Energ. Rev. 2022, 161, 112339. [Google Scholar] [CrossRef]
  4. Mizusaki, J.; Singhal, S.C. Solid Oxide Fuel Cells IX: (SOFC-IX): Proceedings of the International Symposium; Pennington, N.J., Ed.; Electrochemical Society: Philadelphia, PA, USA, 2005; pp. 1866–1873. [Google Scholar]
  5. Whittemore, A.S.; Harris, R.; Itnyre, J.; Halpern, J. Recent development in precoating of stainless steel strips for interconnects at Sandvik materials technology. In Proceedings of the 10th European SOFC Forum, Lucerne, Switzerland, 26–29 June 2012; Volume 10, pp. 6–11. [Google Scholar]
  6. Hong, J.E.; Lim, T.H.; Lee, S.B.; Shin, D.R.; Song, R.H. Characteristics of a Protective Coating on Metal Interconnect for SOFCs. ECS Trans. 2009, 25, 1393–1396. [Google Scholar] [CrossRef]
  7. Garcia, E.M. The electrochemical behavior of cobalt electrodeposits on 430 stainless steel as solid oxide fuel cell interconnect. Surf. Coat. Technol. 2013, 235, 10–14. [Google Scholar] [CrossRef] [Green Version]
  8. Liu, K.; Xu, S.; Shi, J.; Teng, F.; Yu, X.; Sun, J. Impact of Different Atmospheres on Oxidation and Electrical Performance of a Solid Oxide Fuel Cell Interconnect with Co-Containing Protective Coating. Energy Fuels 2020, 34, 8864–8871. [Google Scholar] [CrossRef]
  9. Ebrahimifar, H. Microstructure and Oxidation Behavior of Cobalt Diffusional Coating Fabricated on AISI 429 Stainless Steel. Oxid. Met. 2019, 91, 417–435. [Google Scholar] [CrossRef]
  10. Robert, B.; Lundberg, M.W.; Westlinder, J.; Holmberg, H. Self Healing of Precoated AISI 441 for Solid Oxide Fuel Cell Interconnects. ECS Trans. 2015, 68, 1649–1655. [Google Scholar]
  11. Tomas, M.; Asokan, V.; Puranen, J.; Svensson, J.E.; Froitzheim, J. Efficiencies of cobalt- and copper-based coatings applied by different deposition processes for applications in intermediate-temperature solid oxide fuel cells. Int. J. Hydrogen Energy 2022, 47, 32628–32640. [Google Scholar] [CrossRef]
  12. Goebel, C.; Berger, R.; Bernuy-López, C.; Westlinder, J.; Svensson, J.E.; Froitzheim, J. Long-term (4 year) degradation behavior of coated stainless steel 441 used for solid oxide fuel cell interconnect applications. J. Power. Sources 2020, 449, 227480. [Google Scholar] [CrossRef]
  13. Young, D.J.; Zurek, J.; Singheiser, L.; Quadakkers, W.J. Temperature dependence of oxide scale formation on high Cr ferritic steels in Ar-H2-H2O. Corros. Sci. 2011, 53, 2131–2141. [Google Scholar] [CrossRef]
  14. Alnegren, P.; Sattari, M.; Svensson, J.E.; Froitzheim, J. Temperature dependence of corrosion of ferritic stainless steel in dual atmosphere at 600–800 °C. J. Power. Sources 2018, 392, 129–138. [Google Scholar] [CrossRef]
  15. Spotorno, R.; Paravidino, D.; Delsante, S.; Piccardo, P. Volatilization of chromium from AISI 441 stainless steel: Time and temperature dependence. Surf. Coat. Technol. 2022, 433, 128125. [Google Scholar] [CrossRef]
  16. Velraj, S.; Zhu, J.H.; Painter, A.S.; Du, S.W.; Li, Y.T. Impedance spectroscopy of the oxide films formed during high temperature oxidation of a cobalt-plated ferritic alloy. J. Power. Sources 2014, 247, 314–321. [Google Scholar] [CrossRef]
  17. Saeidpour, F.; Zandrahimi, M.; Ebrahimifar, H. Evaluation of pulse electroplated cobalt/yttrium oxide composite coating on the Crofer 22 APU stainless steel interconnect. Int. J. Hydrogen Energy 2019, 44, 3157–3169. [Google Scholar] [CrossRef]
  18. Saeidpour, F.; Zandrahimi, M.; Ebrahimifar, H. Oxidation and electrical behaviour of direct and pulse current electroplated cobalt coatings on Crofer22APU stainless steel interconnect. Mater. High. Temp. 2020, 37, 89–100. [Google Scholar] [CrossRef]
  19. Sachitanand, R.; Sattari, M.; Svensson, J.-E.; Froitzheim, J. Evaluation of the oxidation and Cr evaporation properties of selected FeCr alloys used as SOFC interconnects. Int. J. Hydrogen Energy 2013, 38, 15328–15334. [Google Scholar] [CrossRef] [Green Version]
  20. Falk-Windisch, H.; Claquesin, J.; Svensson, J.E.; Froitzheim, J. The effect of metallic Co-coating thickness on ferritic stainless steels intended for use as interconnect material in intermediate temperature solid oxide fuel cells. Oxid. Met. 2018, 89, 233–250. [Google Scholar] [CrossRef] [Green Version]
  21. Falk-Windisch, H.; Claquesin, J.; Sattari, M.; Svensson, J.E.; Froitzheim, J. Co- and Ce/Co-coated ferritic stainless steel as interconnect material for intermediate temperature solid oxide fuel cells. J. Power. Sources 2017, 343, 1–10. [Google Scholar] [CrossRef]
  22. Berger, R.; Lundberg, M.W.; Westlinder, J. Self-Healing of Precoated AISI 441 for Solid Oxide Fuel Cell Interconnects at Intermediate Temperatures. ECS Trans. 2017, 78, 1599–1605. [Google Scholar] [CrossRef]
  23. Bernuy-Lopez, C.; Bexell, U.; Stenstrom, M.; Norrby, N.; Westlinder, J. The Time for Industrialization Has Come: A Pre-Coated Solution for the GW Scale. ECS Trans. 2021, 103, 1803–1808. [Google Scholar] [CrossRef]
  24. Zhang, Y.; Javed, A.; Zhou, M.; Liang, S.; Xiao, P. Fabrication of Mn–Co Spinel Coatings on Crofer 22 APU Stainless Steel by Electrophoretic Deposition for Interconnect Applications in Solid Oxide Fuel Cells. Int. J. Appl. Ceram. Technol. 2014, 11, 332–341. [Google Scholar] [CrossRef]
  25. Piccardo, P.; Anelli, S.; Bongiorno, V.; Spotorno, R.; Repetto, L.; Girardon, P. K44M ferritic stainless steel as possible interconnect material for SOFC stack operating at 600 °C: Characterization of the oxidation behaviour at early working stages. Int. J. Hydrogen Energy 2015, 40, 3726–3738. [Google Scholar] [CrossRef]
  26. Zhang, M.; An, L.; Wang, E.; Wang, H.; Ouyang, M.; Hu, H. Effects of Sintering Parameters on the Low-Temperature Densification of GDC Electrolyte Based on an Orthogonal Experiment. Catalysts 2022, 12, 831. [Google Scholar] [CrossRef]
  27. Wagner, C. Theoretical analysis of the diffusion processes determining the oxidation rate of alloys. J. Electrochem. Soc. 1952, 99, 369–380. [Google Scholar] [CrossRef]
  28. Bexell, U.; Mikael, O.; Lundberg, M.W. High Temperature Oxidation of Plastically Deformed Ferritic Interconnect Steel. ECS Trans. 2011, 35, 2463–2470. [Google Scholar] [CrossRef]
  29. Bi, Z.H.; Zhu, J.H.; Du, S.W.; Li, Y.T. Effect of alloy composition on the oxide scale formation and electrical conductivity behavior of Co-plated ferritic alloys. Surf. Coat. Technol. 2013, 228, 124–131. [Google Scholar] [CrossRef]
  30. Kruk, A.; Adamczyk, A.; Gil, A.; Kąc, S.; Dąbek, J.; Ziąbka, M.; Brylewski, T. Effect of Co deposition on oxidation behavior and electrical properties of ferritic steel for solid oxide fuel cell interconnects. Thin Solid Films 2015, 590, 184–192. [Google Scholar] [CrossRef]
  31. Petric, A.; Ling, H. Electrical Conductivity and Thermal Expansion of Spinels at Elevated Temperatures. J. Am. Ceram. Soc. 2007, 90, 1515–1520. [Google Scholar] [CrossRef]
  32. Froitzheim, J.; Canovic, S.; Nikumaa, M.; Sachitanand, R.; Johansson, L.G.; Svensson, J.E. Long term study of Cr evaporation and high temperature corrosion behaviour of Co coated ferritic steel for solid oxide fuel cell interconnects. J. Power. Sources 2012, 220, 217–227. [Google Scholar] [CrossRef]
  33. Poitel, S.; Wang, Z.; Willinger, M.; Van Herle, J.; Hébert, C. In-Situ Observation of Co-Ce Coated Metallic Interconnect Oxidation Combined with High-Resolution Post Exposure Analysis. ECS Trans. 2017, 78, 1615. [Google Scholar] [CrossRef] [Green Version]
  34. Karlsson, L.S.; Lundberg, M.W.; Berger, R.; Westlinder, J. A Time Resolved Study of Precoated AISI 441 for SOFC Interconnects Using STEM-EELS-Part I. ECS Meet. Abstr. 2015, 68, 1657. [Google Scholar]
  35. Karlsson, L.S.; Lundberg, M.W.; Berger, R.; Westlinder, J. A Time Resolved Study of Precoated AISI 441 for SOFC Interconnects Using STEM-EELS-Part II. ECS Trans. 2015, 68, 1667–1679. [Google Scholar] [CrossRef]
  36. Macauley, C.; Gannon, P.; Deibert, M.; White, P. The influence of pre-treatment on the oxidation behavior of Co coated SOFC interconnects. Int. J. Hydrogen Energy 2011, 36, 4540–4548. [Google Scholar] [CrossRef]
  37. Setiawan, A.R.; Ramelan, A.; Suratman, R.; Qizwini, A.M. The influence of Titanium alloying and Co3O4 coating on the oxidation behavior of Fe-20Cr ferritic stainless steels for SOFC interconnects. IOP Conf. Ser. Earth Environ. Sci. 2018, 105, 012115. [Google Scholar] [CrossRef]
Figure 1. (a) Macroscopic morphology of steel samples after oxidation in air at 650 °C; (b) profiles of oxidation mass gain of steel samples as a function of exposure time at 650 °C.
Coatings 13 01144 g001
Figure 2. SEM images of 441 samples after 120 h of oxidation in air at 650 °C: (a) Surface view; (b) cross-sectional view.
Coatings 13 01144 g002
Figure 3. XRD images of (a) 441 samples after 120 h of oxidation in air at 650 °C; (b) Co-coated 441 samples after 120 h of oxidation in air at 650 °C. (The asterisk corresponds to the diffraction peak of the stainless steel matrix represented by Fe-Cr.)
Coatings 13 01144 g003
Figure 4. EDS elemental analysis results of: (a) the surface of 441 samples after 120 h of oxidation in air at 650 °C; (b) the cross section of a 441 sample after 120 h oxidation in air at 650 °C.
Coatings 13 01144 g004
Figure 5. Surface SEM images of 441 samples with a Co coating at different oxidation stages in air at 650 °C: (a) 0 min; (b) 5 min; (c) 30 min; (d) 24 h; (e) 120 h.
Coatings 13 01144 g005
Figure 6. EDS elemental analysis results of 441 samples with a Co coating after 120 h of oxidation in air at 650 °C.
Coatings 13 01144 g006
Figure 7. SEM images and EDS results of 441 samples with a Co coating: (a) original unoxidized sample; (b) samples oxidized in air at 650 °C for 5 min; (c) samples oxidized for 30 min; (d) samples oxidized for 24 h; (e) samples oxidized for 120 h.
Coatings 13 01144 g007aCoatings 13 01144 g007b
Figure 8. (a) ASR results measured at different temperatures for steel samples oxidized in air at 650 °C for 120 h; (b) ASR results of 441 samples with and without a Co coating measured at different oxidation times under 650 °C.
Coatings 13 01144 g008
Table 1. Chemical composition of the FSS (in wt.%).
FSSFeCrMnSiCPSNbTi
441Bal.17.90.100.270.010.0210.0010.430.18
Disclaimer/Publisher’s Note: The statements, opinions and data contained in all publications are solely those of the individual author(s) and contributor(s) and not of MDPI and/or the editor(s). MDPI and/or the editor(s) disclaim responsibility for any injury to people or property resulting from any ideas, methods, instructions or products referred to in the content.

