Article

A Facile Preparation Method for Corrosion-Resistant Copper Superhydrophobic Surfaces with Ordered Microstructures by Etching

1
School of Electronic Information and Automation, Guilin University of Aerospace Technology, Guilin 541004, China
2
College of Mechanical and Control Engineering, Guilin University of Technology, Guilin 541004, China
*
Authors to whom correspondence should be addressed.
Coatings 2023, 13(7), 1151; https://doi.org/10.3390/coatings13071151
Submission received: 20 April 2023 / Revised: 21 June 2023 / Accepted: 22 June 2023 / Published: 25 June 2023

Abstract

:
Superhydrophobic surfaces wit ordered hierarchical microstructures were prepared on copper substrates by combining thermal transfer and etching. The surface morphology, wettability, chemical composition and corrosion resistance were, respectively, characterized via scanning electron microscopy, a three-dimensional confocal microscope, contact angle measurement, X-ray diffraction, X-ray photoelectron spectroscopy, electrokinetic polarization and electrochemical impedance spectroscopy techniques. The contact angle of the obtained superhydrophobic surface is up to 153.3° with a reduction in the corrosion current density from 3.9105 × 10⁻⁵ A/cm2 to 3.5421 × 10⁻⁶ A/cm2 via the electrokinetic polarization curve test, and the maximum capacitive arc radius of the superhydrophobic surface is about 2.5 × 10⁴ Ω cm2 via the electrochemical impedance spectroscopy test, which is two orders of magnitude higher than that of bare copper substrate, and the maximum modulus value |Z| is also two orders of magnitude higher than that of bare copper substrate, indicating that the superhydrophobic surface has better corrosion resistance. This method provides an effective etching approach toward preparing superhydrophobic surfaces with ordered microstructures.

1. Introduction

With excellent electrical and thermal conductivity and great mechanical properties, copper and its alloys are used frequently in fields like aerospace, power electronics, marine, transportation and the energy industry [1,2]. However, due to their high surface energy, copper and its alloys can be easily corroded in the air, which greatly limits their service lives and practical applications. Therefore, the inhibition of copper corrosion has become an important research direction. In recent years, superhydrophobic surfaces fabricated via different surface modification techniques have been applied as a solution to the problem of metal surface corrosion, receiving extensive research attention [3,4,5]. Inspired by the “lotus leaf effect” [6,7,8], superhydrophobic surfaces refer to solid surfaces with a high water contact angle (CA), particularly larger than 150°, and a rolling angle (SA) lower than 10°. Superhydrophobic surfaces have applications in corrosion resistance [9,10,11,12], self-cleaning [13,14], anti-icing [15,16], anti-bacterial uses [17,18] and oil–water separation [19,20] due to their unique wetting properties. The preparation methods of superhydrophobic surfaces generally involve two steps: surface roughening and physical deposition or chemical grafting of low-surface-energy substances on the rough surface [21,22]. Superhydrophobic copper surfaces have been successfully obtained via different methods, including etching [22,23], electrochemical deposition [24,25,26], the template method [27] and the mechanical approach [28,29]. After etching, Xia et al. [30] modified the ammonia alkaline etching solution using low-surface-energy substances and produced a superhydrophobic surface with a grass-like structure and a maximum CA of 163.7°. Its corrosion current density was reduced by two orders of magnitude from 5.212 × 10⁻³ A/cm2 for bare copper to 5.101 × 10⁻⁵ A/cm2 for the superhydrophobic surface. Liu et al. [31] obtained a rough surface with a hierarchical structure after etching copper using hydrochloric acid and hydrogen peroxide. Followed by the modification of stearic acid, the surface had a CA of 170°. The corrosion current density of the superhydrophobic copper foil (2.9072 × 10⁻⁶ A/cm2) was substantially lower than that of the untreated copper foil (1.081 × 10⁻⁴ A/cm2), and the corrosion potential shifted from −0.311 V for the bare Cu foil to −0.311 V to −0.232 V for the superhydrophobic foil, indicating that the corrosion resistance had improved. Wan et al. [32] combined chemical etching in ammonium solution with hydrothermal treatment to prepare a copper superhydrophobic surface, which had excellent corrosion resistance and a CA up to 157.7°, and the corrosion current density was reduced from 4.318 × 10⁻⁶ A/cm2 for bare copper to 8.018 × 10⁻⁹ A/cm2. Through etching and electrochemical deposition, Yu et al. [33] obtained a superhydrophobic surface with a maximum CA of 159.5°, whose corrosion current density was reduced from 29.55 μA/cm2 of bare copper to 3.072 μA/cm2, and the corrosion inhibition rate reached 89.6%, which improved the corrosion resistance. Due to the advantages of low cost, simple process and no need for any complex instruments, chemical etching has been widely studied to prepare superhydrophobic surfaces and improve the corrosion performance of copper substrates. However, there are few reports on the preparation of controllable ordered microstructure superhydrophobic surfaces using the conventional chemical etching approach.
At present, ordered microstructure superhydrophobic surfaces are mostly obtained through mechanical processing or laser engraving methods, but these methods require specialized equipment and high costs. In this paper, a method combining thermal transfer and chemical etching is proposed to prepare ordered hierarchical bilayer microstructure superhydrophobic surfaces with excellent corrosion resistance and self-cleaning capabilities on copper substrates. The shape, size and spacing of ordered microstructures can be controlled by changing parameters such as the shape, size and spacing of the transfer protection patterns during the preparation process, which can provide a reference for the preparation and engineering application of the ordered microstructure superhydrophobic surfaces of other metals.

2. Materials and Methods

2.1. Materials

The H65 brass plates used were purchased from Dongguan Guangfeng Metal Materials Co., Ltd. (Dongguan, China), and the chemical composition of H65 brass is shown in Table 1. The brass was cut into 30 mm × 20 mm × 1.5 mm sheets via laser processing. The samples were cut into sheets of 30 mm × 20 mm × 1.5 mm via laser processing. Anhydrous ferric chloride (FeCl3, AR) and stearic acid (C18H36O2, AR) were obtained from Xilong Science Co., Ltd. (Shantou, China). Concentrated hydrochloric acid (hydrochloric acid, 36%) was supplied by Changzhou Xuhong Chemical Co Ltd. (Changzhou, China). Anhydrous ethanol was purchased from Fuyu Fine Chemical Company Limited (Tianjin, China).

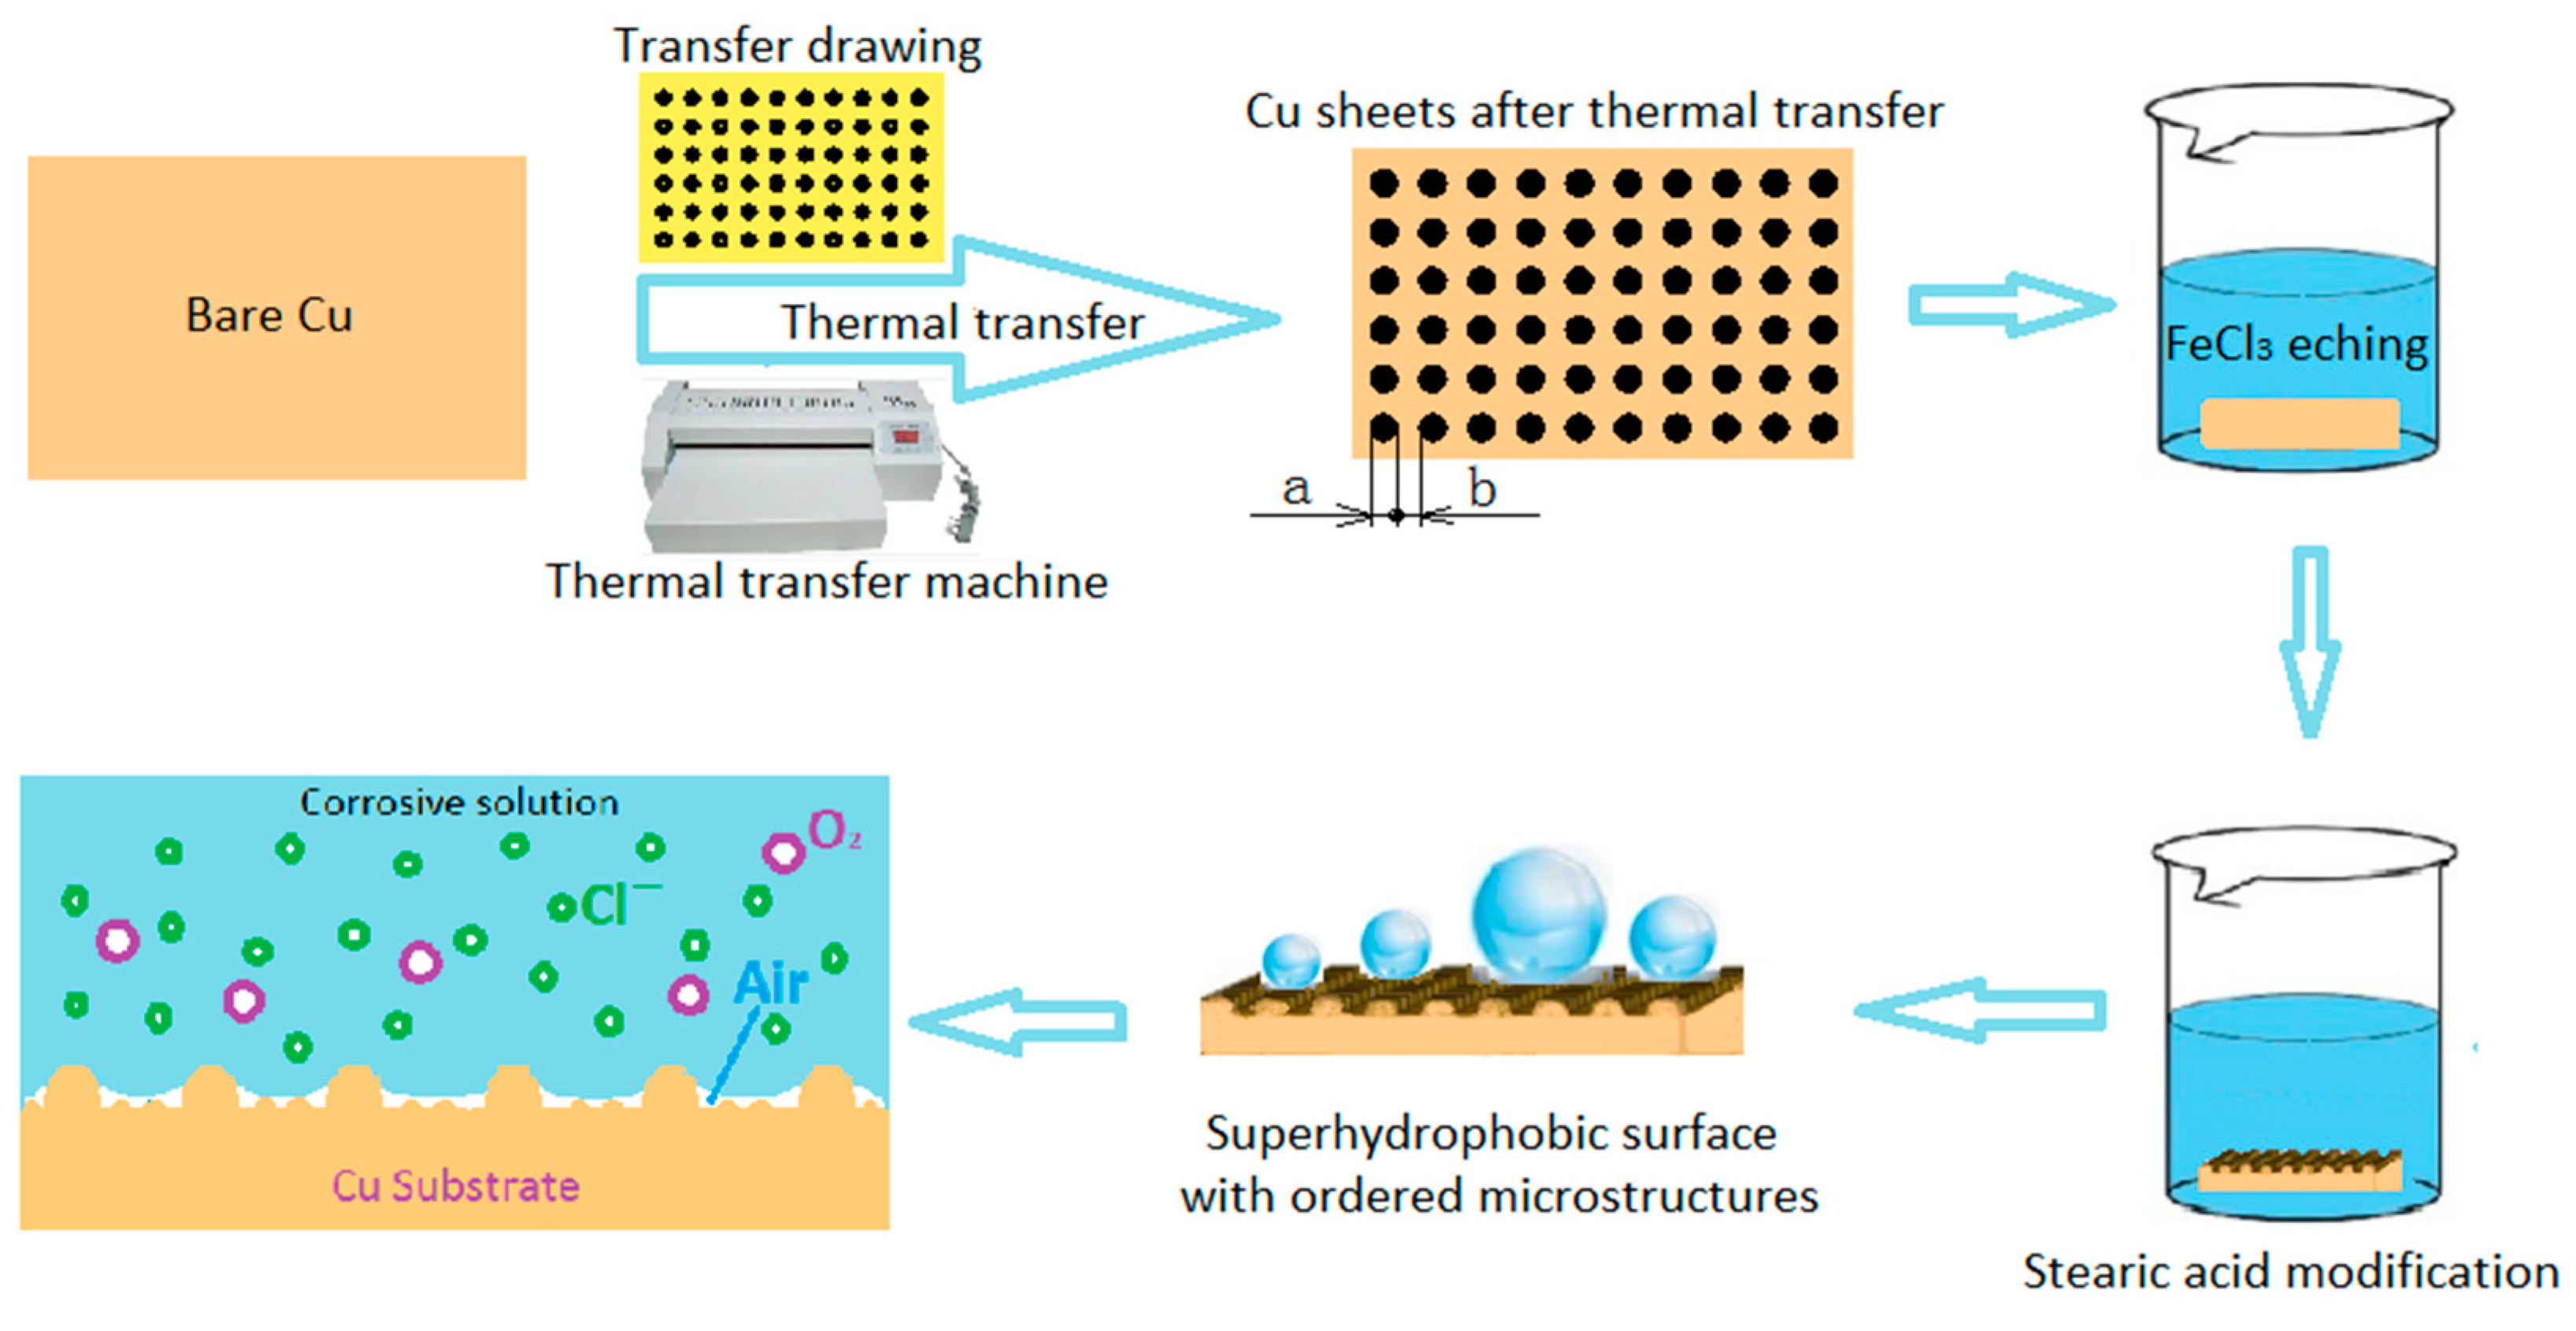
2.2. Preparation Method

2.2.1. Thermal Transfer

The H65 copper sheets were polished with 400, 800, 1500 and 2000 grit sandpaper to remove oxides and dirt from the surface, and an H65 brass bare sample was obtained. Altium Designer (20.0.1) software was applied for the design of drawings of four different dimensions. The drawings were printed on PCB transfer paper using a laser printer (Laser Jet MFP M226dw, Shanghai, China), and then transferred onto the polished copper sheets using a thermal transfer machine (DM2100B, Zhengzhou, China) at 150 °C. Figure 1 shows the flow chart of the preparation process. The diameter ‘a’ of the black dots on the copper substrate was 150 μm, the spacing ‘b’ was 150 μm, 200 μm, 250 μm, and 300 μm, respectively, and the samples obtained via subsequent chemical treatment of the above four sizes of copper sheets with good thermal transfer were defined as ES150, ES200, ES250, and ES300, respectively.

2.2.2. Chemical Treatment

(1) Preparation of chemical etching solution: To prevent the hydrolysis of ferric chloride, first put an appropriate amount of hydrochloric acid (5 mL/L) into water and stir well to make the solution PH less than 2. Weigh an appropriate amount of anhydrous ferric chloride powder according to the proportion of 200 g/L, and pour it into the above solution, stirring continuously until all of the ferric chloride has been dissolved.
(2) Place the heat-transferred copper sheet face-up into the ferric chloride solution and etch it for 45 min, stirring the etching solution continuously and slowly during the etching process. After etching, remove and rinse it with anhydrous ethanol, and then perform ultrasonic cleaning in anhydrous ethanol for 5 min to remove the ink on the surface.
(3) Soak the cleaned sample in 0.1 mol/L stearic acid solution for 5 h and then remove it, rinse it with plenty of anhydrous ethanol and air dry it for use.

2.3. Sample Characterization

Water contact angle testing was carried out using a contact angle measuring instrument (SDC-200, Xin Ding Precision Instrument Co., Ltd., Dongguan, China). The sample morphology was examined using a field emission scanning electron microscope (SEM, KYKY-EM6900, CSCI, Beijing, China) and a three-dimensional confocal microscope (microXAM-3D, Milpitas, CA, USA). The phase structure was determined using the X-ray diffraction method (XRD, Smartlab9, Tokyo, Japan). X-ray photoelectron spectroscopy (XPS, Escalab 250Xi, Waltham, MA, USA) was also used for the analysis of the elements, valence states and functional groups of the samples. Corrosion testing was performed using a standard three-electrode system via an electrochemical workstation (CS2350H, Wuhan CorrTest Instruments Ltd., Wuhan, China). The test was carried out at room temperature using a 3.5 wt.% NaCl solution as the electrolyte with an exposed area of 1 cm2. The corrosion potential (Ecorr) and corrosion current density (Icorr) were obtained using the Tafel extrapolation method with the aid of CView software. The polarization resistance (Rp, Ω cm2) was calculated with an initial potential of −0.5 V and a terminal potential of 1 V. The potential interval for data collection was 0.5 mV. Electrochemical impedance spectroscopy (EIS) tests were performed at the open circuit potential (OCP) with a sinusoidal voltage amplitude of 5 mV and a frequency range of 100 kHz to 0.01 Hz.

3. Results and Discussion
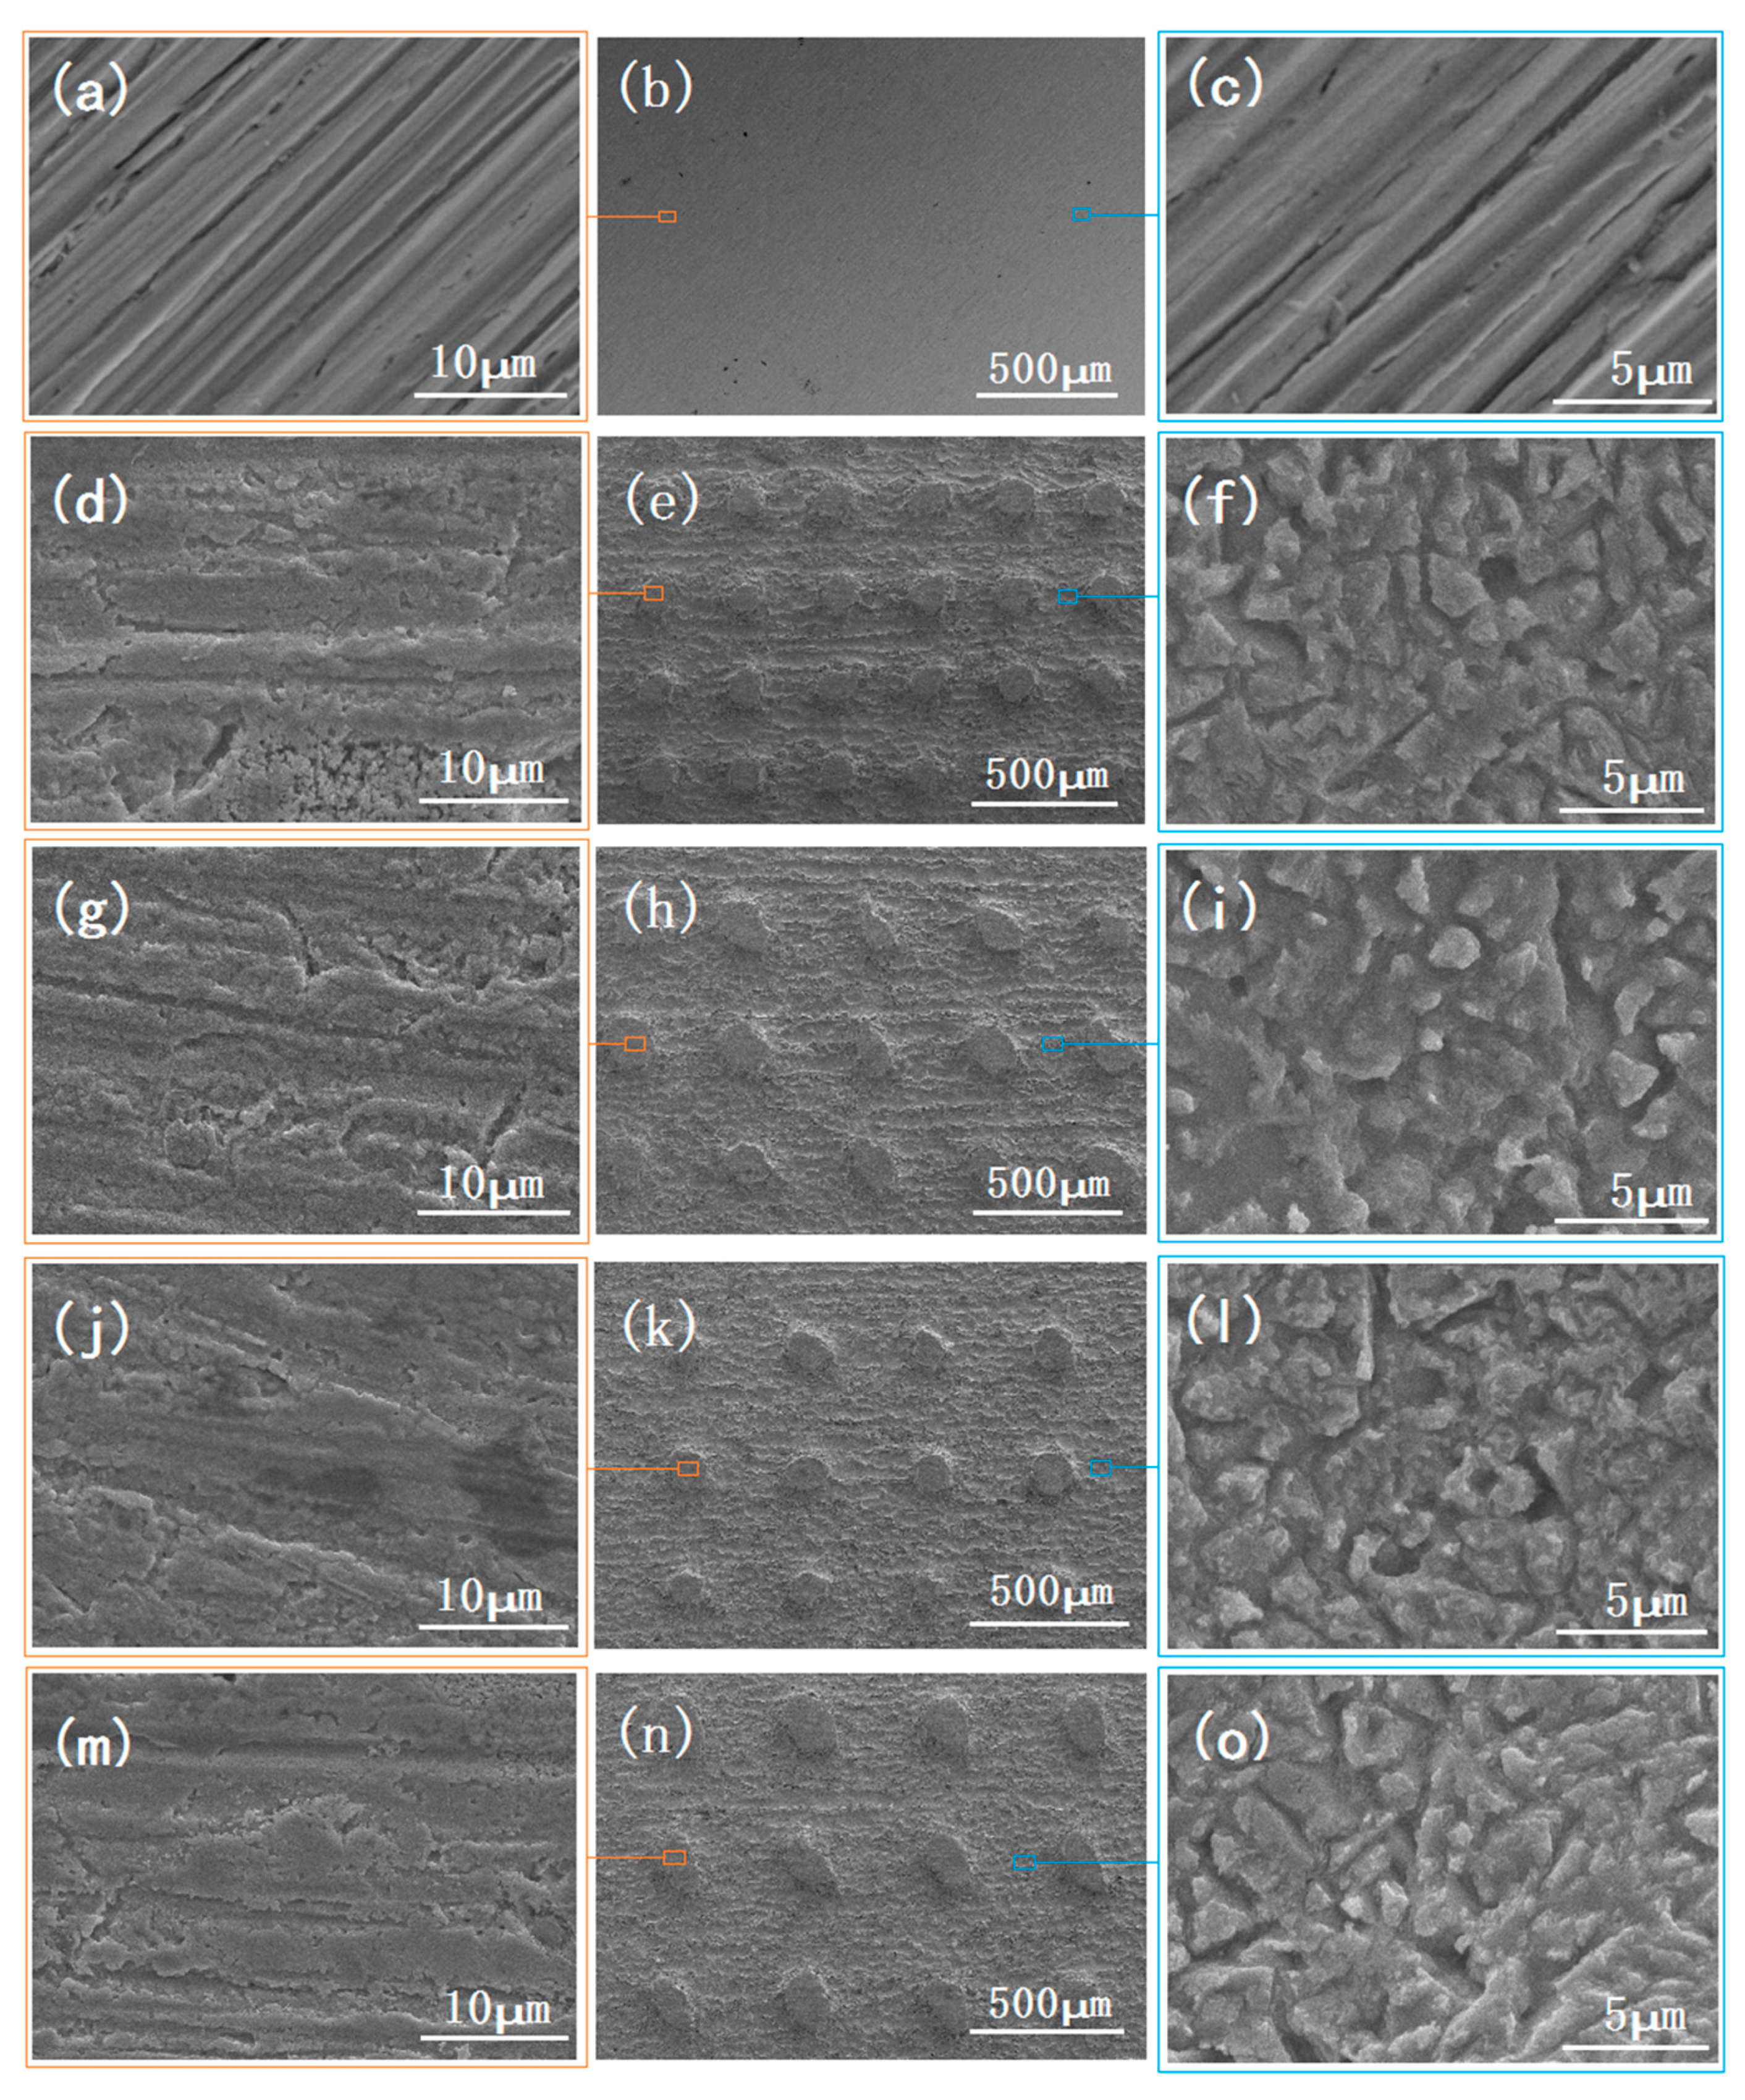
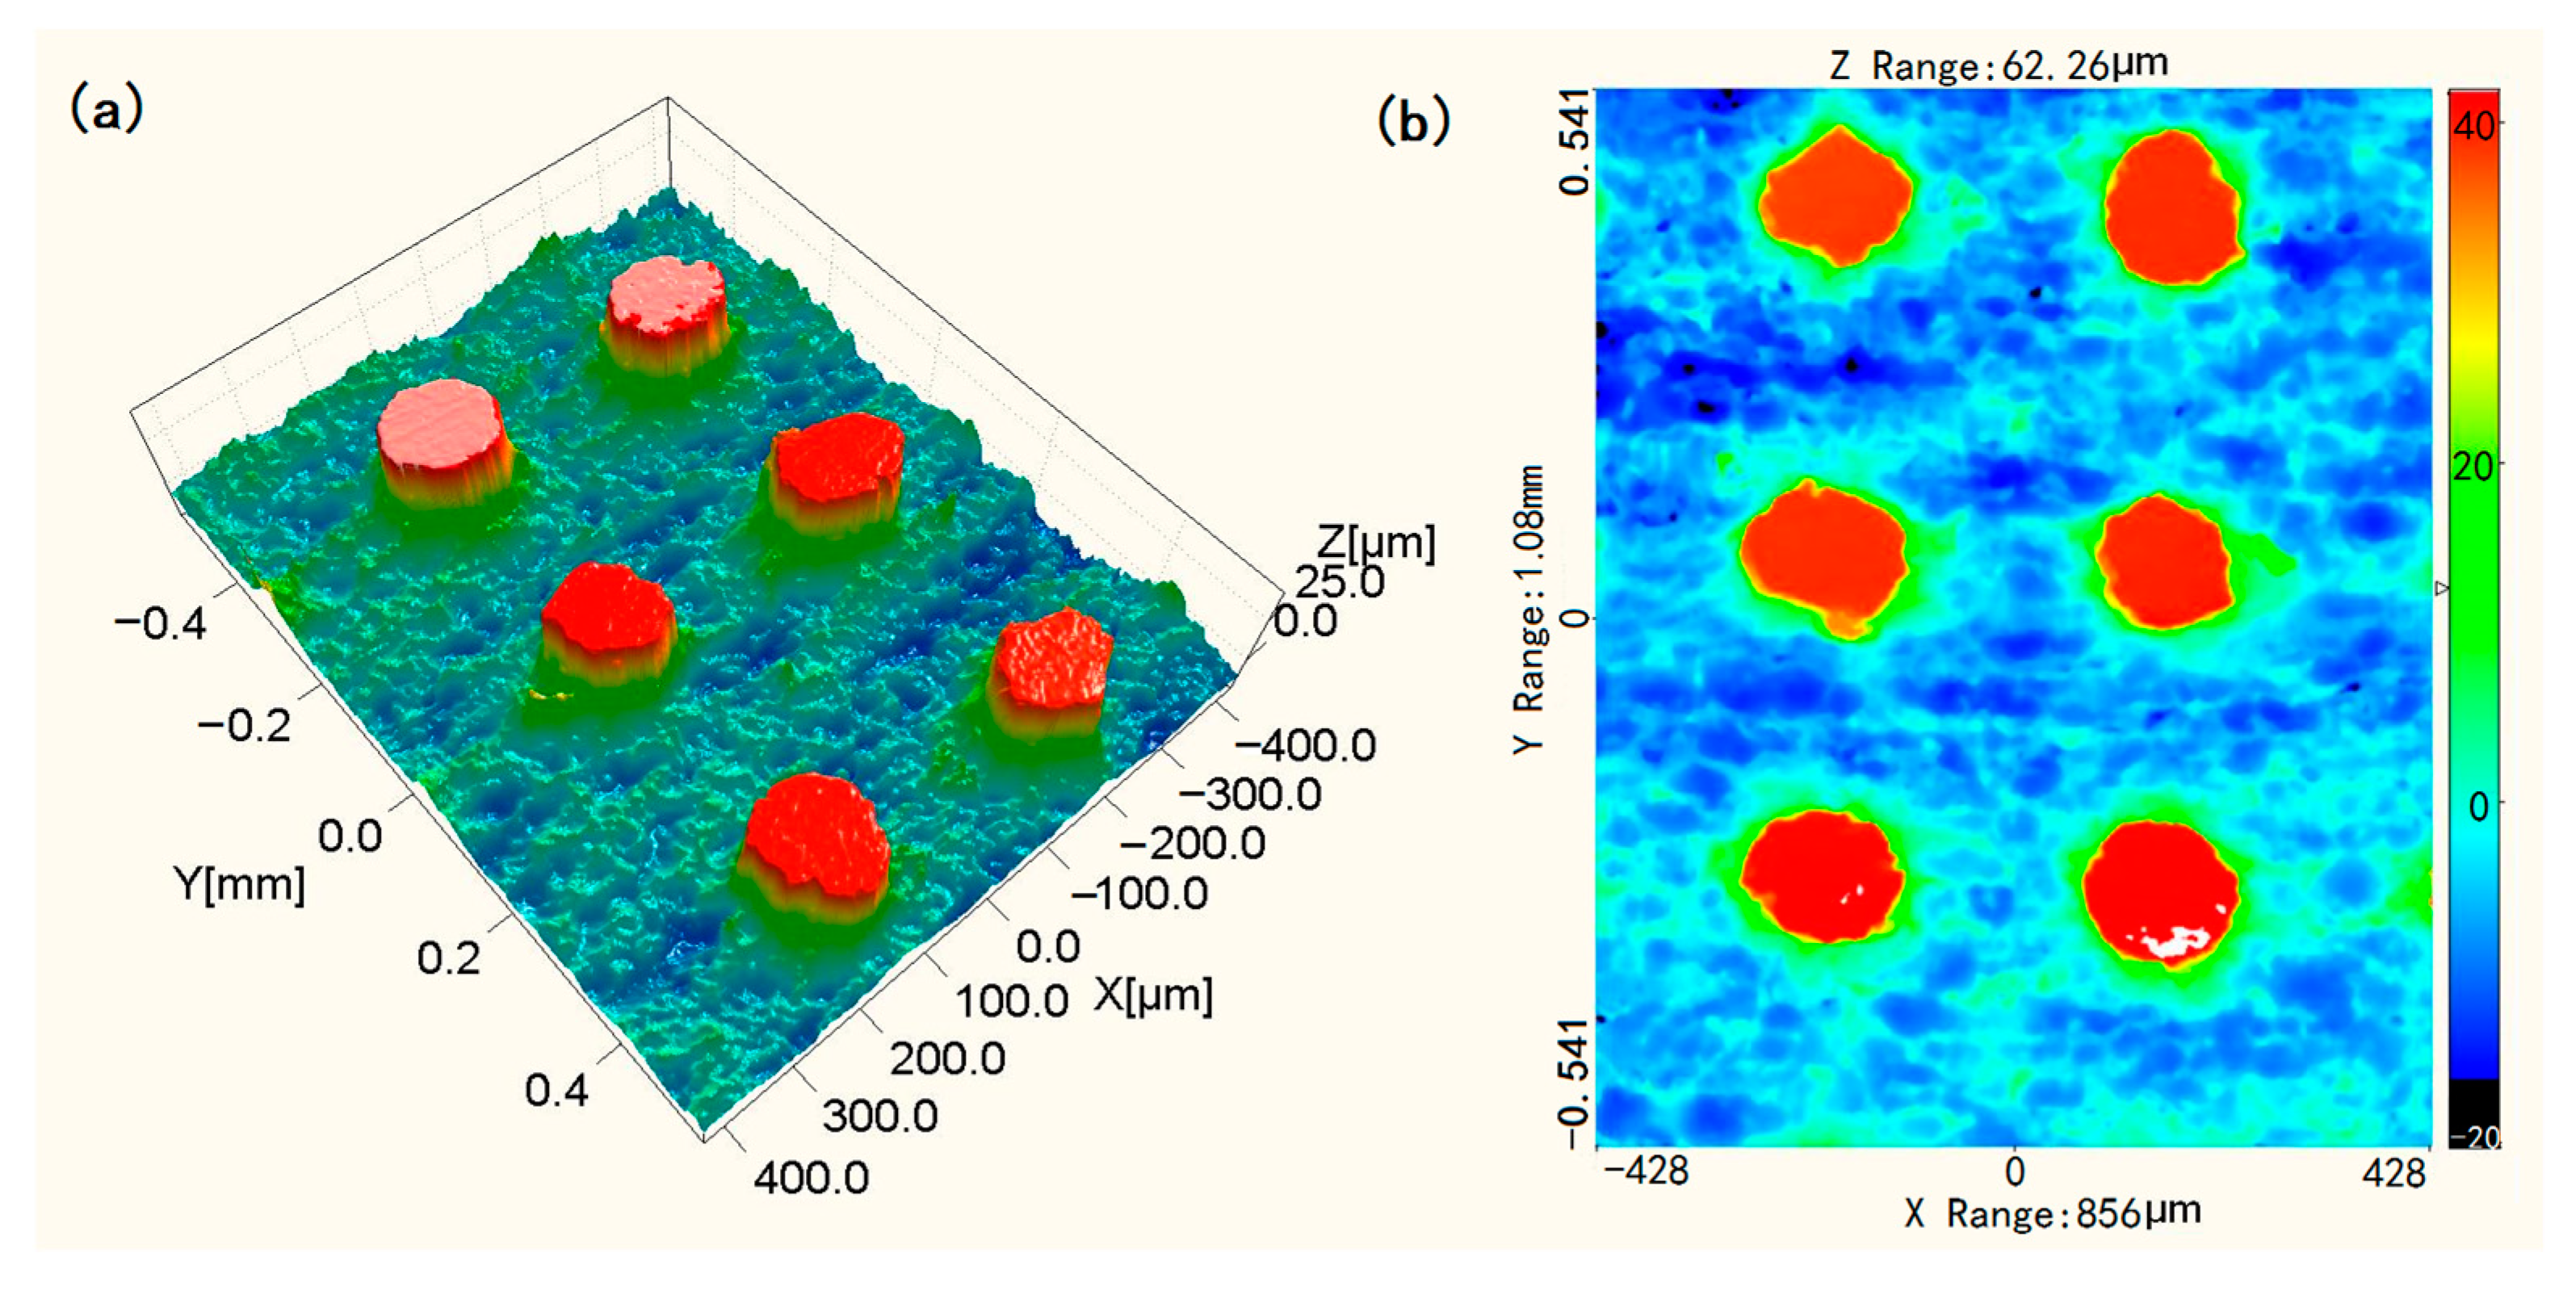
3.1. SEM Images

Figure 2 shows the SEM images of the surfaces of bare H65 copper samples and samples ES150, ES200, ES250 and ES300, which are the H65 copper samples of different dimensional parameters etched by FeCl3 solution after thermal transfer. It can be observed that the surface of the bare copper sample after fine polishing is relatively flat at low magnification (Figure 2b), but tiny pits can be observed in some places, while obvious stripe scratches can be observed on the surface at high magnification (Figure 2a,c), which were caused by sandpaper polishing. The surfaces of samples ES150, ES200, ES250 and ES300 showed an orderly distribution of columnar microstructures (Figure 2e,h,k,n). These columnar protrusions can vary in shape depending on the printing accuracy of the drawings, transfer quality and etching, but the overall distribution is neat and orderly and the size of the center distance of the protrusions can be controlled. Figure 2d,g,j,m show the high-magnification SEM images of the columnar protrusion surface. It can be observed that there are irregular microstructures distributed on the stripe scratches on the surface of the protrusions, and etching marks appear on the local positions of the protective layer, which are related to the graphic printing accuracy and thermal transfer printing quality of the protective layer during the preparation process. In the high-magnification SEM images (Figure 2f,i,l,o), many irregular sand-like microstructures can be seen on the surface of the etched part, not protected by the layer of carbon powder. At the same time, the morphology of the sandy microstructures on the etched part of the samples with different transfer sizes is similar, indicating that different transfer sizes have little effect on the morphology of the surface microstructures. The three-dimensional profile of the surface structure was tested using a three-dimensional confocal microscope (Figure 3a). It can also be observed that ordered microstructures appeared on the surface of the etched sample, and the height of these ordered microstructures was about 60 μm (Figure 3b). The two tests show that the ordered columnar protrusions, the microstructure of the protrusion surface and the sandy microstructures, produced simultaneously via the thermal transfer treatment and etching with FeCl3 etching solution, together form a bilayer microstructure surface.

3.2. Surface Wetting Performance

Figure 4 shows the contact angles (CAs) and sliding angles (SAs) of samples ES150, ES200, ES250, and ES300 with different etching spacing modified with 0.1 mol/L stearic acid. To ensure the accuracy of the test, each sample was tested at five different positions and the average of five sets of data was taken. The CA of the untreated bare H65 copper surface was 98.1°. The contact angle of the bare H65 copper after stearic acid modification (the sample H65-SA) was 108.2°, which is about 10° higher due to the reduction in surface energy of the brass surface by stearic acid. It can be observed that the contact angle of the surface of the sample after thermal transfer treatment and etching with FeCl3 etching solution, as well as modification using stearic acid, is substantially increased, with a maximum contact angle of 153.3° and a rolling angle of 4.9°, and the modified sample has good hydrophobicity and low adhesion, which is in line with the Cassie model [34]. According to Equation (1) proposed by Cassie et al. [31,33], to obtain the CA of the droplet for the liquid–solid three-phase composite interface,
cosθr = f1cosθ − f2
where f1 is the ratio of the liquid–solid contact area to total area, f2 is the ratio of liquid–gas contact area to total area, f1 + f2 = 1 and θr and θ are the CAs of the hydrophobic copper surface and the bare H65 copper substrate, respectively. If one substitutes θ = 98.1° and θr = 153.3° for the CA of sample ES200 into Equation (1), then f1 = 0.1241 and f2 = 0.8759. The contact area between the liquid droplets and solid surfaces is about 12%, while the remaining 88% is the contact area between the liquid droplets and air. This result further confirms that the superhydrophobicity of the surface is caused by its unique microstructure.

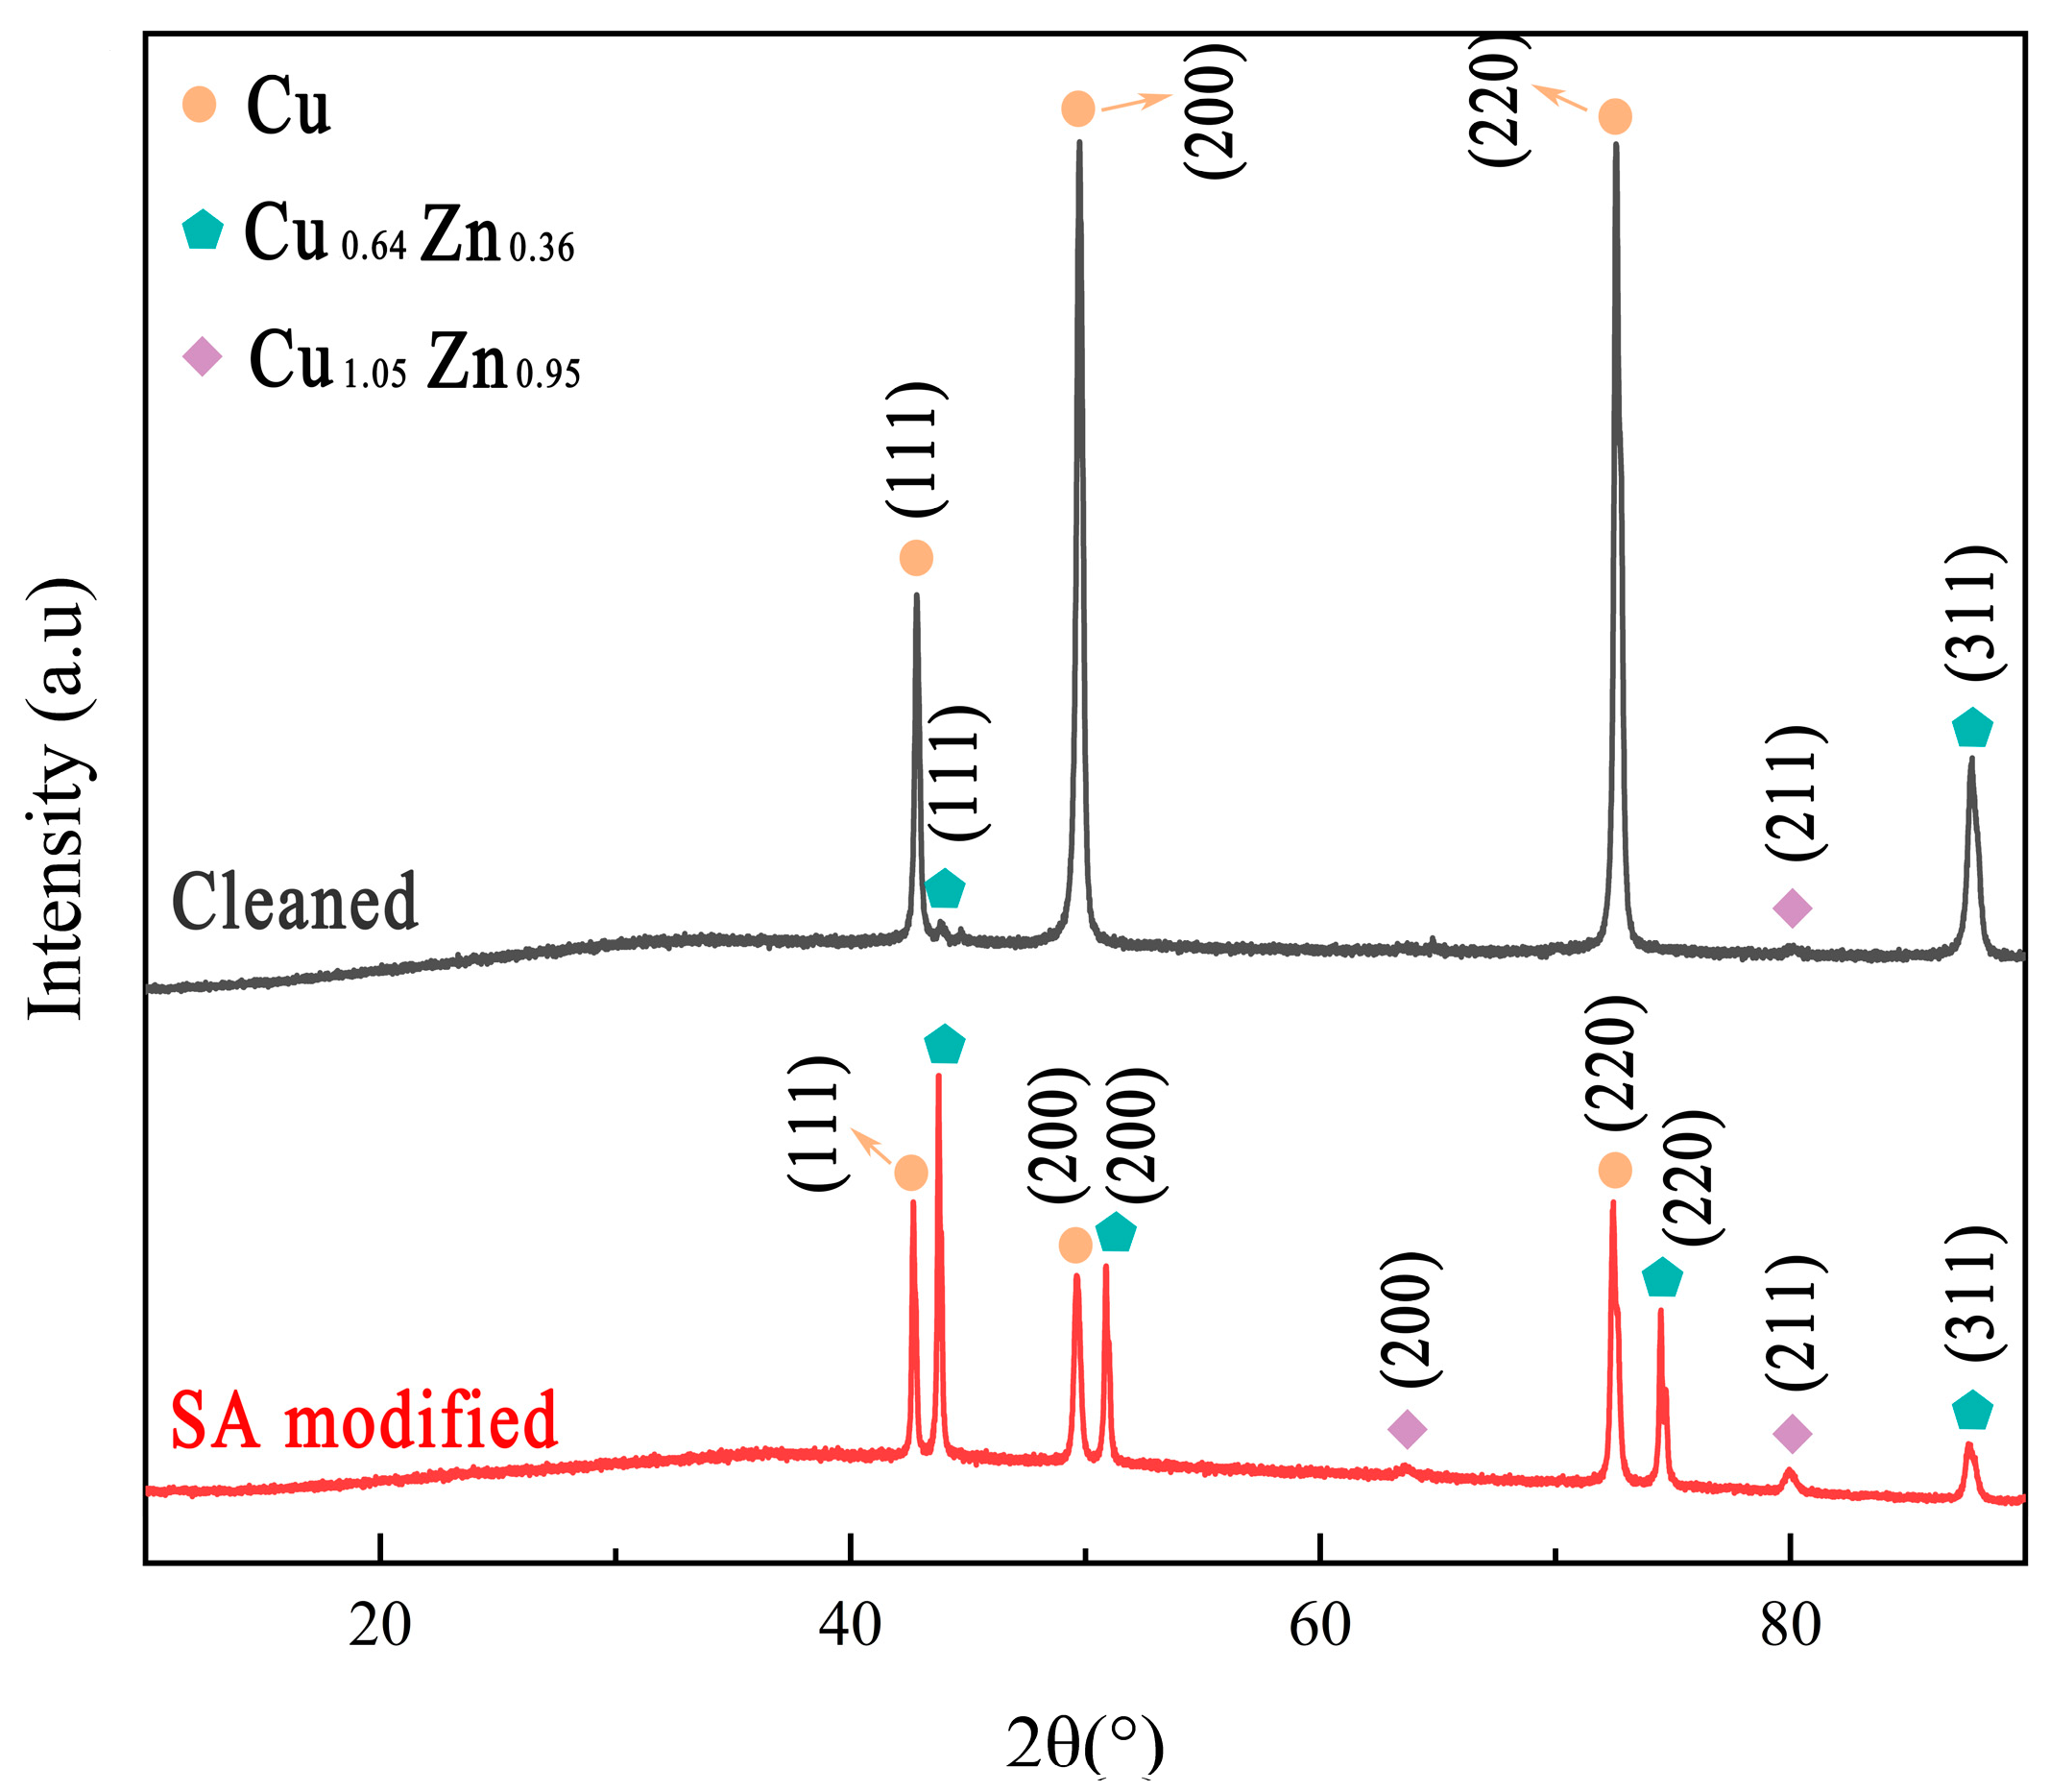
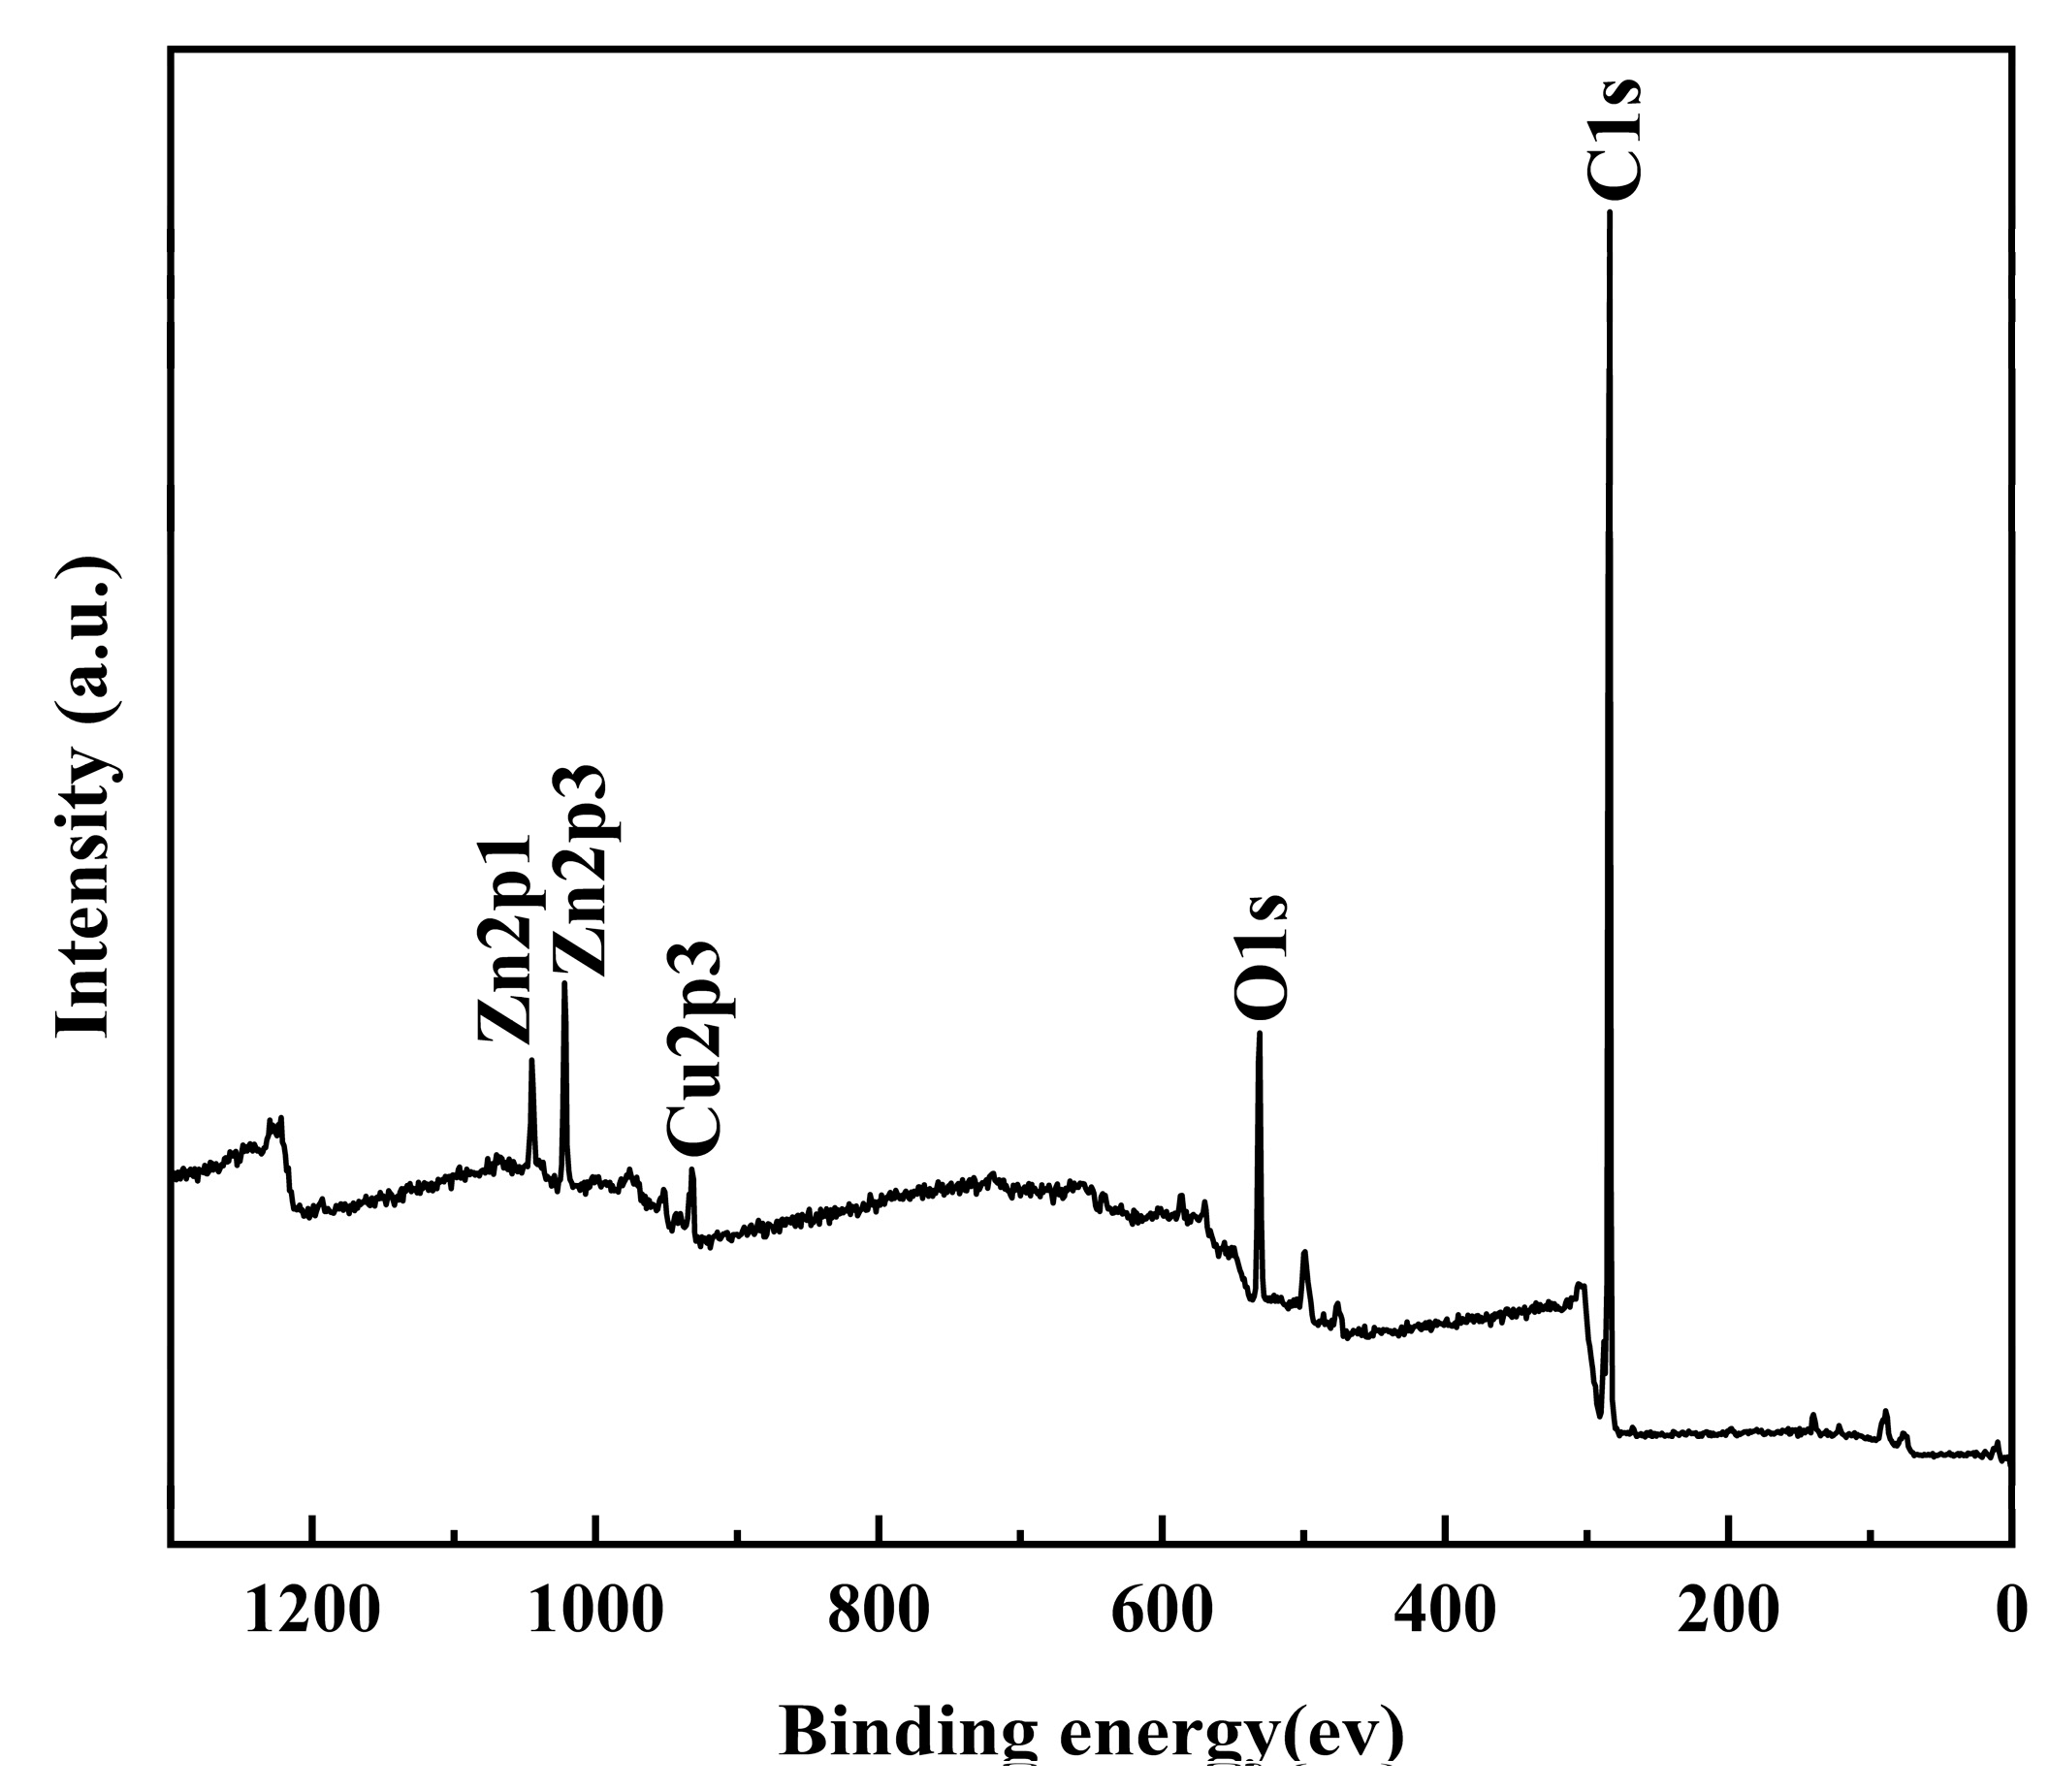
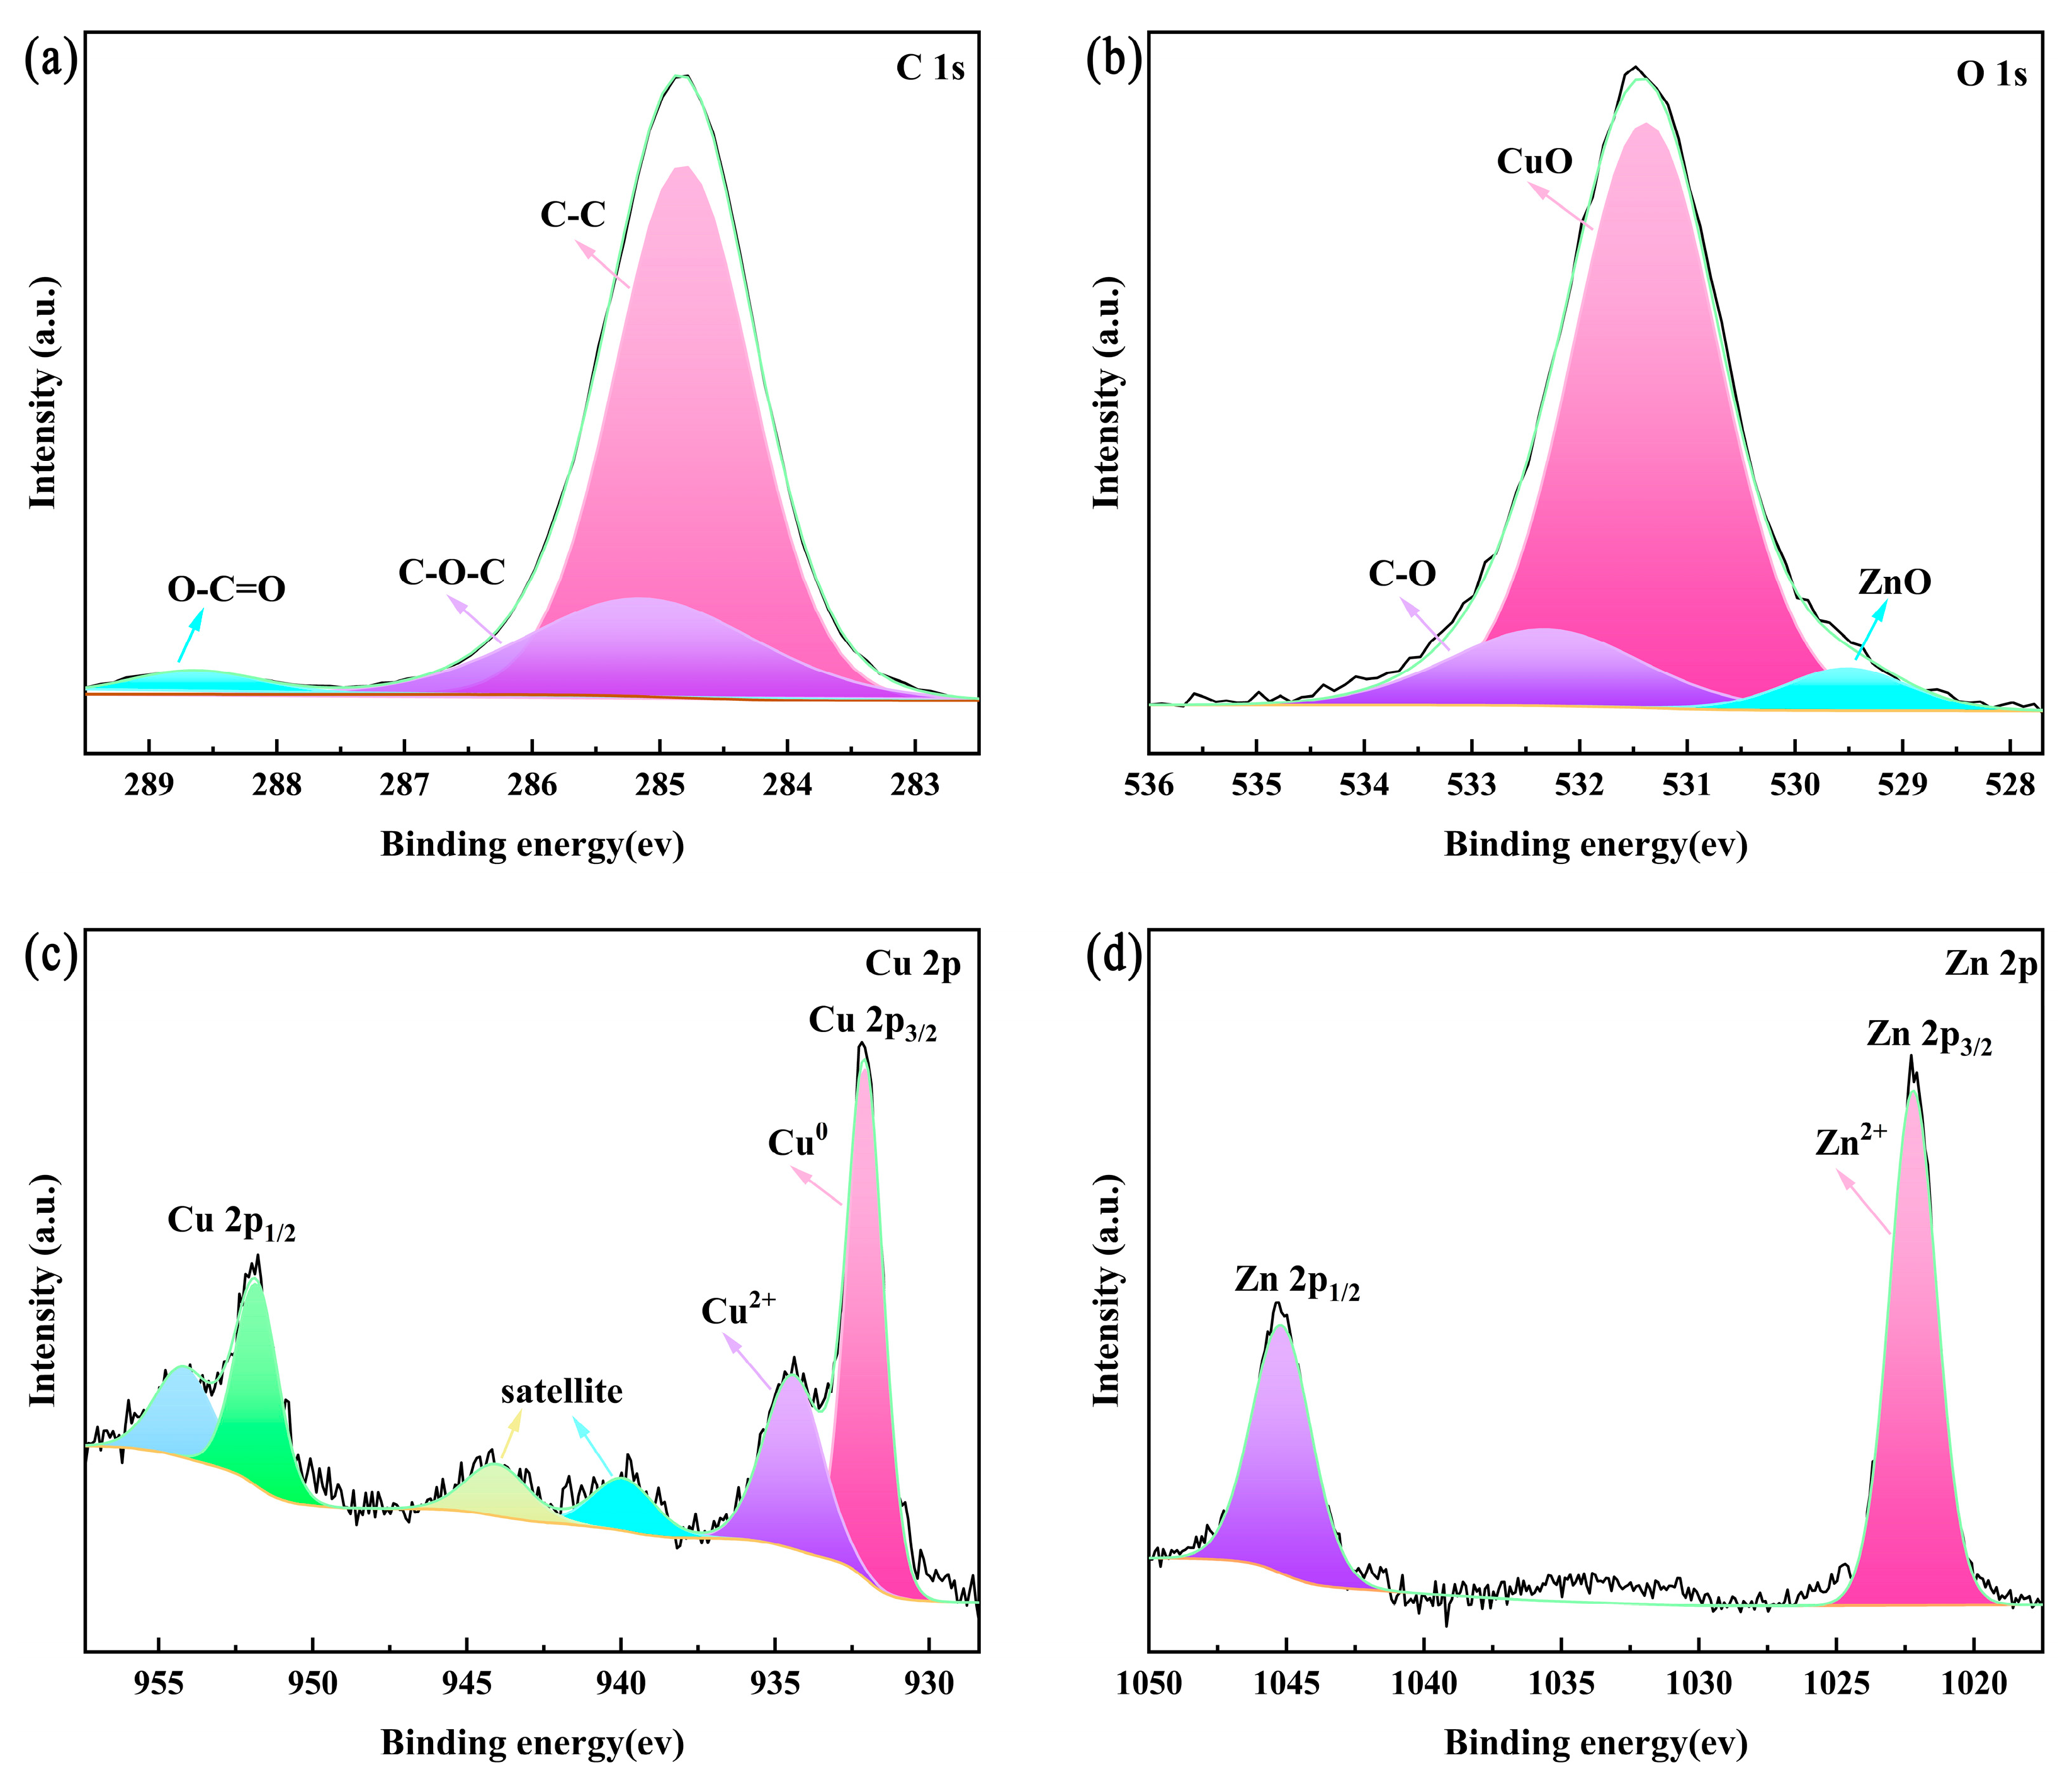
3.3. Surface Composition

The chemical composition of the bare (cleaned) and stearic acid (SA)-modified samples was analyzed via X-ray diffraction. Figure 5 shows the XRD patterns of copper in the cleaned and SA-modified samples. Both samples show distinct diffraction peaks at 42.82°, 49.75°and 72.59°, consistent with the standard Cu diffraction spectra (PDF#65-9026), corresponding to copper crystallographic indices of (111), (200) and (220). The diffraction peaks at 43.76° and 87.57° of the H65 bare sample are consistent with the diffraction spectra of Cu0.64Zn0.36 (PDF#50-1333), corresponding to the crystallographic indices of (111) and (311), respectively, and the diffraction peaks at 79.98° originate from Cu1.05Zn0.95, corresponding to the crystallographic index of (211), indicating that H65 brass Zn is mainly present in the form of Cu0.64Zn0.36 and Cu1.05Zn0.95 alloy phases. Compared to the cleaned bare sample, the SA-modified sample has an enhanced peak at 43.76°. Two additional peaks appear at 50.87°and 74.49°, and a diffraction peak weakens at 87.57°. All are from Cu0.64Zn0.36 (PDF#50-1333), and the corresponding crystallographic indices are (111), (200), (220), and (311), respectively. By comparing these two samples, diffraction peaks at 63.61°and 79.98° are both enhanced. Both are from Cu1.05Zn0.95, with crystallographic indices of (200) and (211), respectively. The XRD patterns of the SA-modified samples and the bare brass samples show that the samples modified with stearic acid after the thermal transfer and etching treatment do not introduce new metal elements, which is consistent with the principle of etching preparation. The diffraction peaks of Cu0.64Zn0.36 and Cu1.05Zn0.95 do not intensify because the surface of the bare H65 copper sample is not completely exposed due to the presence of the oxide layer. However, after etching, the brass surface is completely exposed, which enhances the diffraction peaks of Cu0.64Zn0.36 and Cu1.05Zn0.95.
XPS analysis was carried out to further examine the chemical composition of the treated sample. The full scan spectra are displayed in Figure 6 and various elements like C, O, Cu and Zn are detected. The fine scan spectra are shown in Figure 7a–d, where C1s, O1s, Cu2p and Zn2p are present. The C1s include three characteristic peaks, as seen in Figure 7a. The first has a binding energy of 284.8 ev, corresponding to a carbon–carbon (C-C) single bond, the second is a carbon–oxygen (C-O-C) single bond at 285.2 ev and the third is a characteristic peak of the carboxyl group (O-C=O) at 288.8 ev. The existence of the carboxyl group can be associated with the presence of stearic acid, which may be due to stearic acid (C18H36O2) or stearate (CH3(CH2)16COO), and the weak intensity of its peak indicates that the content is not high. Figure 7b shows three characteristic peaks for O1s, with 529.5 ev for the oxide of Zn, 531.4 ev for the oxide of Cu and 532.4 ev for the C-O single bond. Figure 7c shows the fine spectrum of element Cu2p, where the binding energy of the Cu2p3/2 peak and Cu2p1/2 peak is, respectively, 932.1 ev and 951.8 ev, in the oxidation state of copper. In the Zn2p fine spectrum, as shown in Figure 7d, the Zn2p3/2 peak and Zn2p1/2 peak appear at 1022.1 ev and 1045.4 ev, respectively, exhibiting the oxidation state of zinc. Cu2+ and Zn2+ appear not only because of their oxides, but also because of copper stearate (CH3(CH2)16COO2Cu) and zinc stearate (CH3(CH2)16COO2Zn) compounds, which, due to their low content, are not observed as significant diffraction peaks in XRD analysis due to the penetration of X-rays in XRD tests.
Based on the above analysis, it is known that because FeCl3 has strong oxidation, the following chemical reactions occur during etching to obtain the bilayer micro–nanostructure shown in Figure 2 in Section 3.1, and the presence of copper stearate and zinc stearate also reduce the surface energy to obtain superhydrophobicity.
Cu + 2FeCl3 = 2FeCl2 + CuCl2
Zn + 2FeCl3 = 2FeCl2 + ZnCl2

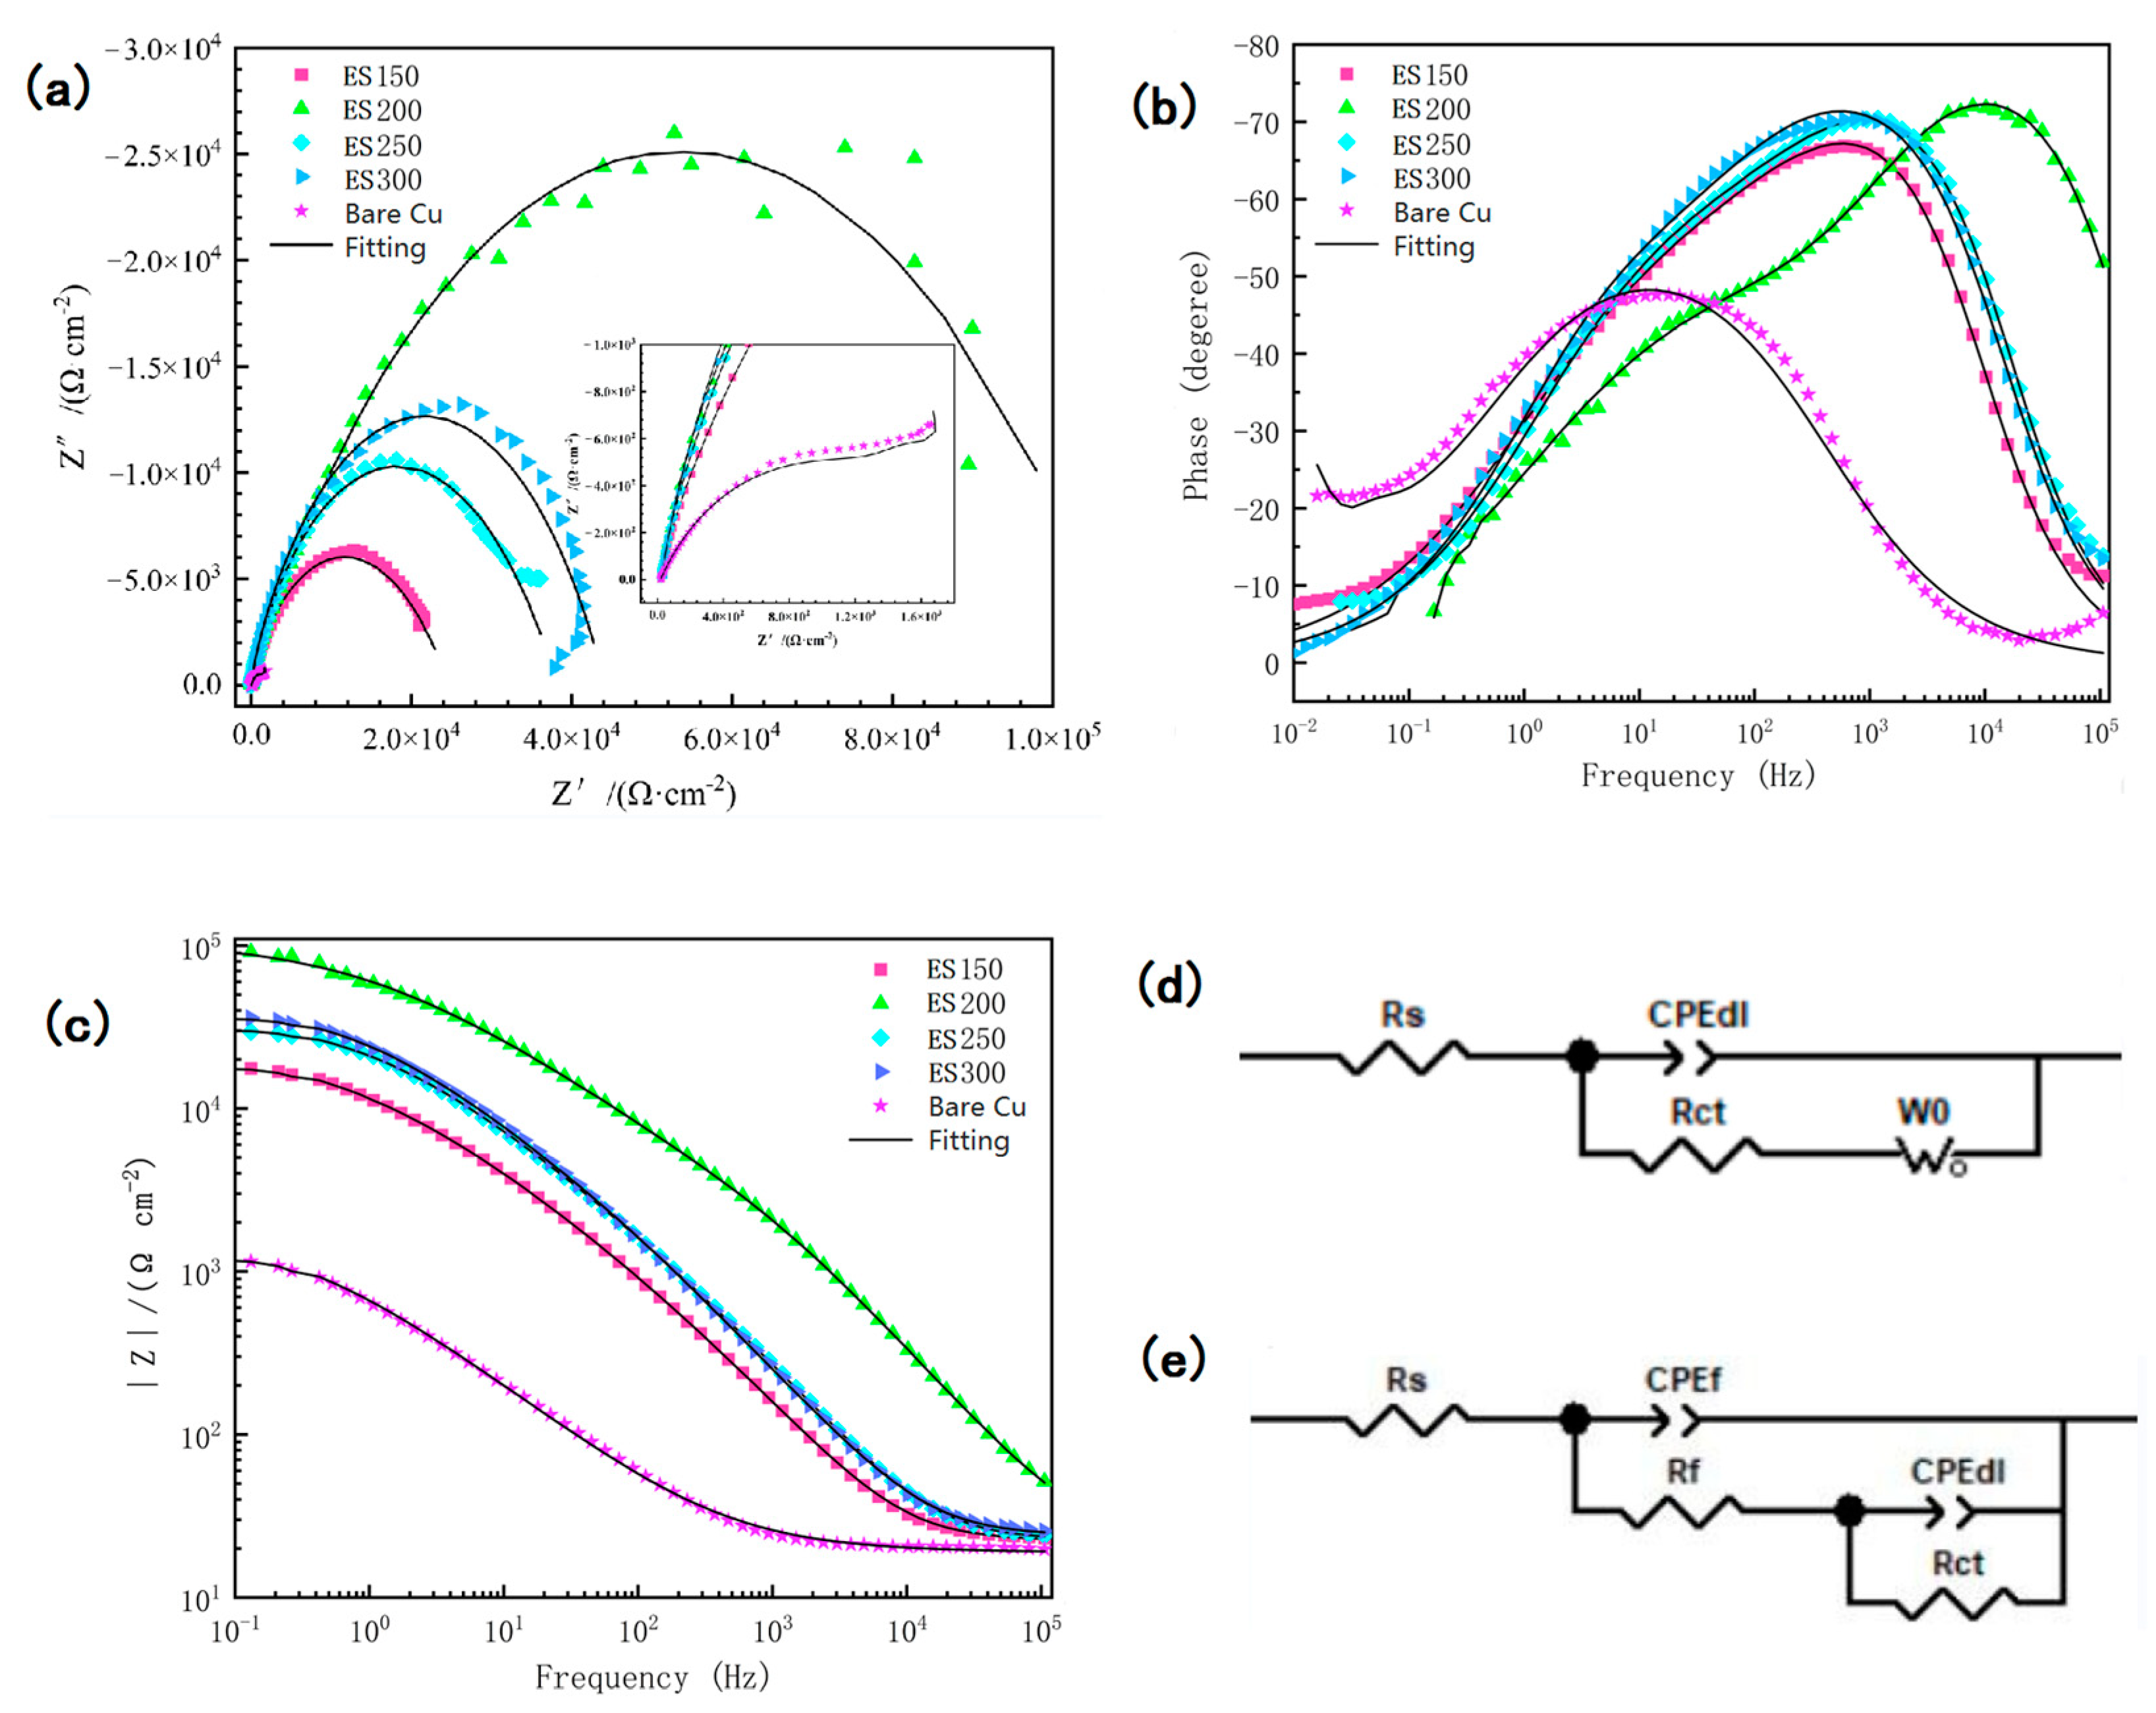
3.4. Surface Anti-Corrosion Performance

Figure 8 shows the dynamic potential polarization curves of bare copper sample and ES150, ES200, ES250, and ES300 samples modified with stearic acid in 3.5 wt.% NaCl solution. The detailed data of corrosion potential (Ecorr), corrosion current density (Icorr), anode slope (ba) and cathode slope (bc) obtained via the Tafel extrapolation method are shown in Table 2. The corrosion inhibition efficiency η is calculated by Equation (2) [35,36,37], where I0corr is the corrosion current of the Cu substrate and Icorr is the corrosion current of the superhydrophobic Cu sample.
η = (I0corr − Icorr)/I0corr × 100%
According to electrochemical theory, materials with lower positive values of Icorr and Ecorr have better corrosion resistance [35]. The test data in Table 2 show that the corrosion performance of the surface-modified samples ES150, ES200, ES250 and ES300 is greatly improved, which is the reason for the shift toward more positive values of Ecorr for the modified samples. When the etching spacing is 200 μm, the ES200 superhydrophobic copper sample has the lowest Icorr, which is about one order of magnitude lower than that of the bare copper substrate, with corrosion resistance of 90.94% and the best corrosion performance, which is mainly attributed to the larger water contact angle of the ES200 superhydrophobic sample, as described in the previous Section 3.2. The larger the contact angle, the smaller the solid–liquid contact area, i.e., the contact area between the corrosive medium and the bare copper decreases, so that its corrosion current density becomes smaller and the corrosion resistance is the best.
Electrochemical impedance spectroscopy (EIS) is also an effective method for conducting anti-corrosion study and prediction. Figure 9a–c show the Nyquist plots, phase angle plots and impedance modulus curves for bare copper and the SA-modified copper sample after thermal transfer and etching in 3.5 wt.% NaCl solution, respectively. Fitted data are shown as solid lines in the plots and scattering points are shown as measured data points. The Nyquist plot for bare copper includes a capacitive loop in the high-frequency range and a straight line (Warburg impedance) in the low-frequency range, corresponding to the single charge transfer reaction of the Cu substrate and the diffusion behavior in the corrosion interface, respectively [10,36,38]. The radius of capacitance in the high-frequency range is associated with the charge transfer resistance. Generally, a larger radius indicates better corrosion resistance [32,36,39]. As can be seen from the plots, the capacitive radii of the experimental samples are all larger than the capacitive radius of the samples (approximately 500 Ω cm2), and sample ES200 has the largest radius of approximately 2.5 × 10⁴ Ω cm2, which is two orders of magnitude larger than that of the substrate (Figure 9a). The high phase angle in the high-frequency domain of the phase angle plot and impedance modulus curve indicates good repulsive properties. A large modulus in the low frequency range shows that the corrosion resistance has been enhanced [9,32]. As can be observed in Figure 9b, the phase angles of all four experimental samples are much higher than those of the copper substrate, especially in the high-frequency region. The |Z| values of all four experimental samples are higher than those of the copper substrate in both the high and low frequencies, as seen in Figure 9c. Here, the equivalent circuit for the bare copper substrate (Figure 9d) includes parallel resistors and capacitors, as well as Warburg impedance. In this circuit, Rs and Rct represent the solution resistance and charge transfer resistance, respectively, and CPEdl is a constant phase element that simulates a double-layer capacitor. The equivalent circuit for the experimental sample, as seen in Figure 9e, is used to analyze the corrosion behavior of the SA-modified copper surface after thermal transfer and etching. In this circuit, the superhydrophobic film on the SA-modified copper surface after thermal transfer and etching is characterized by a parallel combination of the film constant phase element CPEf and the film resistance Rf, while the corrosion interface is a parallel combination of the bilayer constant phase element CPEdl and the charge transfer resistance Rct. The detailed fitted data parameters are shown in Table 3. The experimental data show that the Rct of the copper substrate is 1647 Ω and the values of all four experimental samples are higher than it. The sample ES200 has the largest value of 112,420 Ω, which is two orders of magnitude higher than the substrate.
Based on the analysis of the above data, it can be concluded that the modified brass surface has better corrosion resistance than the bare copper substrate. Among them, sample ES200 has the best corrosion resistance, as seen via the polarization curve and the data regarding corrosion current, corrosion voltage, capacitive arc radius and impedance modulus obtained from the EIS test. From the above surface wetting performance analysis in Section 3.2, it can be obtained that due to the impact of the microstructure and the low-surface-energy substances, sample ES200 has the largest water contact angle, which is up to 153.3°. From the Cassie equation, it can be deduced that sample ES200 has the smallest liquid–solid contact area, that is, the contact area of the corrosive liquid and the copper substrate in the corrosive medium is the smallest. So, the sample shows the best corrosion resistance.

3.5. Self-Cleaning Effect

In order to test the anti-fouling properties of the surface-modified samples, the anti-fouling properties of the ES200 superhydrophobic brass samples were tested with 370 mesh silica powder. The silica powder was first sprinkled on the surface of the superhydrophobic brass sample, and then the superhydrophobic copper sample was placed diagonally in a Petri dish, as shown in Figure 10a. Figure 10b–e show the self-cleaning process by rolling water droplets from the surface of the superhydrophobic brass. It can be seen that as the water droplets rolled, the silica powder was adsorbed off the sample surface by the water droplets as they rolled. As the number of water droplets increases, the silica powder can be easily removed (Figure 10f). The results of this simple test show that the prepared superhydrophobic brass sample has a good self-cleaning effect.

4. Conclusions

This paper proposes a method of combining thermal transfer printing and etching to prepare ordered hierarchical bilayer microstructures. Modified with stearic acid, a superhydrophobic surface was fabricated on the copper substrate. The shape, size, spacing and other parameters of the ordered microstructure can be adjusted by the size parameters of the transfer image. The contact angle of the copper superhydrophobic surface can reach up to 153.3°. The results show that the prepared superhydrophobic surface has good anti-corrosion performance. The prepared superhydrophobic surface has good corrosion resistance. The corrosion current density in the electrokinetic polarization curve test was reduced from 3.9105 × 10⁻⁵ A/cm2 for bare copper to 3.5421 × 10⁻⁶ A/cm2, which is one order of magnitude lower; the maximum radius of the capacitive arc resistance of the superhydrophobic surface in the Nyquist plot was about 2.5 × 10⁴ Ω cm2, which is two orders of magnitude higher than that of the bare copper substrate, while the maximum modulus value |Z| in the impedance diagram is also two orders of magnitude higher than that of the bare copper substrate. In addition, the surface-modified brass surface exhibits an excellent self-cleaning capability. As the preparation method is simple, economical and environmentally friendly, it provides an effective way for using the chemical etching method to prepare superhydrophobic surfaces with ordered microstructures, thus providing reference for the engineering applications of other metals.

Author Contributions

Conceptualization, Z.B. and J.Z.; methodology, Z.B. and J.Z.; software, Z.B.; validation, Z.B. and J.Z.; formal analysis, Z.B. and J.Z.; investigation, Z.B.; resources, J.Z.; data curation, J.Z.; writing—original draft preparation, Z.B.; writing—review and editing, Z.B.; visualization, Z.B.; supervision, J.Z.; project administration, Z.B. and J.Z.; funding acquisition, J.Z. All authors have read and agreed to the published version of the manuscript.

Funding

This research was funded by the Natural Science Foundation of Guangxi (grant 2023GXNSFAA026371).

Institutional Review Board Statement

Not applicable.

Informed Consent Statement

Not applicable.

Data Availability Statement

Not applicable.

Conflicts of Interest

The authors declare no conflict of interest.

References

  1. Wang, P.; Zhang, D.; Qiu, R.; Wan, Y.; Wu, J. Green approach to fabrication of a super-hydrophobic film on copper and the consequent corrosion resistance. Corros. Sci. 2014, 80, 366–373. [Google Scholar] [CrossRef]
  2. Almomani, M.A.; Tyfour, W.R.; Nemrat, M.H. Effect of silicon carbide Addition on the corrosion behavior of powder metallurgy Cu-30Zn brass in a 3.5 wt.% NaCl solution. J. Alloys Compd. 2016, 679, 104–114. [Google Scholar] [CrossRef]
  3. Xu, W.; Hu, Y.; Bao, W.; Xie, X.; Liu, Y.; Song, A.; Hao, J. Superhydrophobic copper surfaces fabricated by fatty acid soaps in aqueous solution for excellent corrosion resistance. Appl. Surf. Sci. 2016, 399, 491–498. [Google Scholar] [CrossRef]
  4. Feng, L.; Zhang, H.; Wang, Z.; Liu, Y. Superhydrophobic aluminum alloy surface: Fabrication, structure, and corrosion resistance. Colloid Surf. A-Physicochem. Eng. Asp. 2014, 441, 319–325. [Google Scholar] [CrossRef]
  5. Su, F.; Yao, K. Facile fabrication of superhydrophobic surface with excellent mechanical abrasion and corrosion resistance on copper substrate by a novel method. ACS Appl. Mater. Interfaces 2014, 6, 8762–8770. [Google Scholar] [CrossRef]
  6. Barthlott, W.; Neinhuis, C. Purity of the sacred lotus, or escape from contamination in biological surfaces. Planta 1997, 202, 1–8. [Google Scholar] [CrossRef]
  7. Neinghuis, C.; Barthlott, W. Characterization and distribution of water-repellent, self-cleaning plant surfaces. Ann. Bot. 1997, 79, 667–677. [Google Scholar] [CrossRef] [Green Version]
  8. Xu, S.; Wang, Q.; Wang, N. Chemical fabrication strategies for achieving bioinspired superhydrophobic surfaces with micro and nanostructures: A review. Adv. Eng. Mater. 2021, 23, 2001083. [Google Scholar] [CrossRef]
  9. Ding, C.; Tai, Y.; Wang, D.; Tan, L.; Fu, J. Superhydrophobic composite coating with active corrosion resistance for AZ31B magnesium alloy protection. Chem. Eng. J. 2019, 357, 518–532. [Google Scholar] [CrossRef]
  10. Wang, P.; Zhang, D.; Qiu, R.; Wu, J. Super-hydrophobic metal-complex film fabricated electrochemically on copper as a barrier to corrosive medium. Corros. Sci. 2014, 83, 317–326. [Google Scholar] [CrossRef]
  11. Ouyang, Y.; Qiu, R.; Xiao, Y.; Shi, Z.; Hu, S.; Zhang, Y.; Chen, M.; Wang, P. Magnetic fluid based on mussel inspired chemistry as corrosion-resistant coating of NdFeB magnetic material. Chem. Eng. J. 2019, 368, 331–339. [Google Scholar] [CrossRef]
  12. Dominic, J.; Perumal, G.; Grewal, H.S.; Arora, H.S. Facile fabrication of superhydrophobic brass surface for excellent corrosion resistance. Surf. Eng. 2020, 36, 660–664. [Google Scholar] [CrossRef]
  13. Dalawai, S.P.; Aly, M.A.S.; Latthe, S.S.; Xing, R.; Sutar, R.S.; Nagappan, S.; Ha, C.S.; Sadasivuni, K.K.; Liu, S. Recent advances in durability of superhydrophobic self-cleaning technology: A critical review. Prog. Org. Coat. 2020, 138, 105381. [Google Scholar] [CrossRef]
  14. Lu, Y.; Sathasivam, S.; Song, J.; Crick, C.R.; Carmalt, C.J.; Parkin, I.P. Robust self-cleaning surfaces that function when exposed to either air or oil. Science 2015, 347, 1132–1135. [Google Scholar] [CrossRef]
  15. Wang, L.; Gong, Q.; Zhan, S.; Jiang, L.; Zheng, Y. Robust anti-icing performance of a flexible superhydrophobic surface. Adv. Mater. 2016, 28, 7729–7735. [Google Scholar] [CrossRef]
  16. Song, J.; Li, Y.; Xu, W.; Liu, H.; Lu, Y. Inexpensive and non-fluorinated superhydrophobic concrete coating for anti-icing and anti-corrosion. J. Colloid. Interface. Sci. 2019, 541, 86–92. [Google Scholar] [CrossRef]
  17. Kefallinou, D.; Ellinas, K.; Speliotis, T.; Stamatakis, K.; Gogolides, E.; Tserepi, A. Optimization of antibacterial properties of “hybrid” metal-sputtered superhydrophobic surfaces. Coatings 2020, 10, 25. [Google Scholar] [CrossRef] [Green Version]
  18. Durdu, S. Characterization, bioactivity and antibacterial properties of copper-based TiO2 bioceramic coatings fabricated on titanium. Coatings 2019, 9, 1. [Google Scholar] [CrossRef] [Green Version]
  19. Latthe, S.S.; Sutar, R.; Shinde, T.; Pawar, S.; Khot, T.; Bhosale, A.; Sadasivuni, K.K.; Xing, R.; Mao, L.; Liu, S. Superhydrophobic leaf mesh decorated with SiO2 nanoparticle-polystyrene nanocomposite for oil-water separation. ACS Appl. Nano Mater. 2019, 2, 799–805. [Google Scholar] [CrossRef]
  20. Zhang, W.; Wu, Y.; Li, J.; Zou, M.; Zheng, H. UV laser-produced copper micro-mesh with superhydrophobic-oleophilic surface for oil-water Separation. JMR&T 2021, 15, 5733–5745. [Google Scholar]
  21. Ma, L.; Wang, L.; Li, C.; Guo, J.; Shrotriya, P.; Deng, C.; Zhao, J. Hybrid nanosecond laser processing and heat treatment for rapid preparation of super-hydrophobic copper surface. Metals 2019, 9, 668. [Google Scholar] [CrossRef] [Green Version]
  22. Liu, W.; Xu, Q.; Han, J.; Chen, X.; Min, Y. A novel combination approach for the preparation of superhydrophobic surface on copper and the consequent corrosion resistance. Corros. Sci. 2016, 110, 105–113. [Google Scholar] [CrossRef]
  23. Li, H.; Wei, H.; Zou, X.; Wang, C.; Gao, Q.; Li, Q.; Liu, Q.; Zhang, J. Copper-based nanoribbons fabricated on a copper substrate by a liquid-solid reaction and their corrosion performance. Mater. Chem. Phys. 2020, 246, 122839. [Google Scholar] [CrossRef]
  24. Mousavi, S.M.A.; Pitchumani, R. A study of corrosion on electrodeposited superhydrophobic copper surfaces. Corros. Sci. 2021, 186, 109420. [Google Scholar] [CrossRef]
  25. Chen, Z.; Li, F.; Hao, L.; Chen, A.; Kong, Y. One-step electrodeposition process to fabricate cathodic superhydrophobic Surface. Appl. Surf. Sci. 2011, 258, 1395–1398. [Google Scholar] [CrossRef]
  26. Chaitanya, B.; Gunjan, M.R.; Sarangi, R.; Raj, R.; Thakur, A.D. Per-fluorinated chemical free robust superhydrophobic copper surface using a scalable technique. Mater. Chem. Phys. 2022, 278, 125667. [Google Scholar] [CrossRef]
  27. Yuan, Z.; Wang, X.; Bing, J.; Peng, C.; Xing, S.; Wang, M.; Xiao, J.; Zeng, J.; Xie, Y.; Xiao, X.; et al. A novel fabrication of a superhydrophobic surface with highly similar hierarchical structure of the lotus leaf on a copper sheet. Appl. Surf. Sci. 2013, 285, 205–210. [Google Scholar] [CrossRef]
  28. Ta, D.V.; Dunn, A.; Wasley, T.J.; Kay, R.W.; Stringer, J.; Smith, P.J.; Connaughton, C.; Shephard, J.D. Nanosecond laser textured superhydrophobic metallic surfaces and their chemical sensing applications. Appl. Surf. Sci. 2015, 357, 248–254. [Google Scholar] [CrossRef] [Green Version]
  29. He, A.; Liu, W.; Xue, W.; Yang, H.; Cao, Y. Nanosecond laser ablated copper superhydrophobic surface with tunable ultrahigh adhesion and its renewability with low temperature Annealing. Appl. Surf. Sci. 2018, 434, 120–125. [Google Scholar] [CrossRef]
  30. Xia, Y.; Fan, G.; Chen, K.; Chen, Y.; He, Z.; Ou, J. Preparation and anti-corrosion performances of grass-like microstructured superhydrophobic surface on copper via solution-immersion. Mater. Lett. 2022, 323, 132482. [Google Scholar] [CrossRef]
  31. Liu, L.; Xu, F.; Ma, L. Facile fabrication of a superhydrophobic Cu Surface via a selective etching of high-energy facets. J. Phys. Chem. C. 2012, 116, 18722–18727. [Google Scholar] [CrossRef]
  32. Wan, Y.; Chen, M.; Liu, W.; Shen, X.; Min, Y.; Xu, Q. The research on preparation of superhydrophobic surfaces of pure copper by hydrothermal method and its corrosion Resistance. Electrochim. Acta 2018, 270, 310–318. [Google Scholar] [CrossRef]
  33. Yu, Z.; Zhou, C.; Liu, R.; Zhang, Q.; Gong, J.; Tao, D.; Ji, Z. Fabrication of superhydrophobic surface with enhanced corrosion resistance on H62 brass substrate. Colloid. Surf. A 2020, 589, 124475. [Google Scholar] [CrossRef]
  34. Feng, X.; Jiang, L. Design and creation of superwetting/antiwetting surfaces. Adv. Mater. 2006, 18, 3063–3078. [Google Scholar] [CrossRef]
  35. Elia, A.; Wael, K.D.; Dowsett, M.; Adriaens, A. Electrochemical deposition of a copper carboxylate layer on copper as potential corrosion inhibitor. J. Solid State Electron. 2012, 16, 143–148. [Google Scholar] [CrossRef] [Green Version]
  36. Yuan, S.; Pehkonen, S.O.; Liang, B.; Ting, Y.P.; Neoh, K.G.; Kang, E.T. Superhydrophobic fluoropolymer-modifified copper surface via surface graft polymerisation for corrosion protection. Corros. Sci. 2011, 53, 2738–2747. [Google Scholar] [CrossRef]
  37. Shinato, K.W.; Zewde, A.A.; Jin, Y. Corrosion protection of copper and copper alloys in different corrosive medium using envionmentally friendly corrosion inhibitors. Corros. Rev. 2020, 38, 101–109. [Google Scholar] [CrossRef]
  38. Zhao, L.; Liu, Q.; Gao, R.; Wang, J.; Yang, W.; Liu, L. One-step method for the fabrication of superhydrophobic surface on magnesium alloy and its corrosion protection, antifouling performance. Corros. Sci. 2014, 80, 177–183. [Google Scholar] [CrossRef]
  39. Rao, B.V.A.; Reddy, M.N. Formation, characterization and corrosion protection effificiency of self-assembled 1-octadecyl-1Himidazole fifilms on copper for corrosion protection. Arab. J. Chem. 2017, 10, S3270–S3283. [Google Scholar]
Figure 1. Flow chart of H65 copper surface modification process.
Coatings 13 01151 g001
Figure 2. SEM: (ac) bare H65 copper sample, (df) sample ES150, (gi) sample ES200, (jl) sample ES250, (mo) sample ES300.
Coatings 13 01151 g002
Figure 3. Three-dimensional profile: (a) three-dimensional diagram, (b) two-dimensional planar graph.
Coatings 13 01151 g003
Figure 4. Contact angles and sliding angles of samples with different etching spacing.
Coatings 13 01151 g004
Figure 5. XRD patterns of bare copper samples and samples after surface modification.
Coatings 13 01151 g005
Figure 6. XPS full scan spectrum of the modified surface.
Coatings 13 01151 g006
Figure 7. XPS fine spectra of modified surface samples: (a) C1s, (b) O1s, (c) Cu2p and (d) Zn2p.
Coatings 13 01151 g007
Figure 8. Polarization curves of bare copper sample and samples after surface modification in 3.5 wt.% NaCl solution.
Coatings 13 01151 g008
Figure 9. EIS results for bare copper samples (Bare Cu) and surface-modified samples (ES150, ES200, ES250 and ES300) in 3.5 wt.% NaCl solution: (a) Nyquist plot, (b) Bode angle vs. frequency plot and (c) Bode|Z| vs. frequency plot. (d) Equivalent circuit of bare copper substrate. (e) Equivalent circuit of surface-modified sample.
Coatings 13 01151 g009
Figure 10. Self-cleaning process of the surface-modified sample: (a) initial state (be), self-cleaning process and (f) cleaning completed.
Coatings 13 01151 g010
Table 1. Chemical composition of H65 brass (China GB/T 5231-2012).
CuFePbTotal Impurity Zn
63.0~68.5≤0.07≤0.09≤0.45residuals
Table 2. Electrochemical data of polarization curves of bare copper samples and samples after surface modification in 3.5 wt.% NaCl solution.
SampleEcorr (V vs. Ag/AgCl)Icorr (A/cm2 )ba (mV dec.−1)bc (mV dec.−1)η (%)
Bare Cu−0.31733.9105 × 10−5425.26−526.27
ES150−0.30608.2692 × 10−6160−115.1978.85
ES200−0.29233.5421 × 10−6205.66−110.3690.94
ES250−0.28456.266 × 10−6155.21−133.8283.98
ES300−0.31366.8877 × 10−6136.52−76.6982.39
Table 3. Fitting parameters of EIS results for bare copper samples and surface-modified samples in 3.5 wt.% NaCl solution.
SampleRs (Ω cm2)Rf (Ω cm2) CPEdl (μF/cm2) CPEf (μF/cm2) Rct (Ω cm2)Zw (S cm–2 s0.5)
Bare Cu18.92----0.64363----16470.61571
ES15022.2710490.516190.8816823,919----
ES20025.3829460.526770.90579112,420----
ES25022.5520910.563710.88935,756----
ES30024.3219050.516050.8903147,976----
Disclaimer/Publisher’s Note: The statements, opinions and data contained in all publications are solely those of the individual author(s) and contributor(s) and not of MDPI and/or the editor(s). MDPI and/or the editor(s) disclaim responsibility for any injury to people or property resulting from any ideas, methods, instructions or products referred to in the content.

